Embed Size (px)
Citation preview

Western Kentucky UniversityTopSCHOLAR®
Dissertations Graduate School
Spring 2017
The Effect of a Growth Mindset on StudentAchievement Among Students with a DisabilityKristin Line FroedgeWestern Kentucky University, [email protected]
Follow this and additional works at: http://digitalcommons.wku.edu/diss
Part of the Disability and Equity in Education Commons, and the Elementary EducationCommons
This Dissertation is brought to you for free and open access by TopSCHOLAR®. It has been accepted for inclusion in Dissertations by an authorizedadministrator of TopSCHOLAR®. For more information, please contact [email protected].
Recommended CitationFroedge, Kristin Line, "The Effect of a Growth Mindset on Student Achievement Among Students with a Disability" (2017).Dissertations. Paper 118.http://digitalcommons.wku.edu/diss/118

THE EFFECT OF A GROWTH MINDSET ON STUDENT ACHIEVEMENT AMONG
STUDENTS WITH A DISABILITY
A Dissertation Presented to
The Faculty of the Educational Leadership Doctoral Program
Western Kentucky University
Bowling Green, Kentucky
In Partial Fulfillment
Of the Requirements for the Degree
Doctor of Education
By
Kristin Line Froedge
May 2017


I dedicate this dissertation to my husband, Clint, and son, Walker. Thank you both for
the sacrifices made so that I could achieve this dream. Your love and encouragement
every step of the way has meant the world to me and so now it is my turn to support both
of you in fulfilling your dreams!

iv
ACKNOWLEDGEMENTS
God set this dream in motion several years ago. Because of His providence,
guidance, and unconditional love I stepped out in faith to pursue this goal. I am confident
that this is part of His plan and “He who began a good work in me will bring it to
completion at the day of Jesus Christ” (Philippians 1:6).
A heartfelt thank you goes out to my dissertation committee members, Dr. Gary
Houchens, Dr. Marguerita Desander, and Dr. Kelly Davis, and especially my chair, Dr.
Tony Norman. You have been so very patient with me, allowing me a lot of freedom in
terms of my approach to this dissertation. Your guidance and expertise have challenged
me in many ways throughout this process. It was such a pleasure to work with each of
you. Thank you to Dr. Kimberlee Everson and Mr. Bob Cobb for assisting me with the
statistical analysis of my data
I would like to also thank each district that participated and the wonderful district
contact people that I worked closely with to gather my data: Rhonda Simpson, Donna
Patterson, Vanessa Devers, Leanne Pinson, Kristina Sidebottom, Wyn Caudill, and
Lesley London. Your help with this project was invaluable! Thank you to Priscilla
Meador, my administrative assistant, for all of your help and for always keeping me
calm. Thank you to the many other colleagues and educators that have played a role in
my professional growth, especially Cortni Crews, Debbie Fowler, Carole Brown, Gary
French, Jon Ballard, Kelli Bush, Shellee Godfrey, and Racquel Strickland. Thank you to
my past students at Barren County Middle School and all those students I’ve had the
privilege of working with here in Elizabethtown Independent Schools. You have
provided great inspiration.

v
During this journey, there have been many family, friends, and colleagues who
have cheered me on. Your confidence in my abilities and continuous encouragement has
made even the toughest days seem not so bad. You are a part of my success, and I am
forever grateful. A special thanks to my parents, Ricky and Brenda Line, and in-laws,
Dean and Diane Froedge, for their unwavering support. For the many meals you cooked
so that I could write, watching my son while I was in class, proofreading drafts, and
talking through my ideas—I could not have done this without you. Thank you to my
sister, Kasey, who has always been my biggest cheerleader and my baby brother, Justin,
whom I look up to and respect in so many ways.
Finally, I would like to thank members of Cohort XIII. The lessons learned from
our many conversations and deep discussions have enriched my life and advanced my
leadership capacity. Your friendships will never be forgotten.

vi
CONTENTS
LIST OF TABLES ........................................................................................................... ix
LIST OF FIGURES ......................................................................................................... xi
ABSTRACT ..................................................................................................................... xii
CHAPTER I: INTRODUCTION ....................................................................................1
The Problem Defined .....................................................................................................3
Purpose of Study and Central Research Questions ........................................................5
Conceptual Framework ..................................................................................................7
Significance of the Study ...............................................................................................8
Operational Definitions ..................................................................................................8
Assumptions and Limitations ......................................................................................11
Conclusion ...................................................................................................................12
CHAPTER II: LITERATURE REVIEW ....................................................................13
A Historical Context ....................................................................................................13
Legislation and Reform..........................................................................................14
Students with Disabilities ............................................................................................18
Disabilities and Eligibility Criteria ........................................................................20
Student Achievement ...................................................................................................22
High Stakes Testing in Kentucky ..........................................................................23
Achievement Gap...................................................................................................26
Access to Curriculum .............................................................................................28
Mindset ........................................................................................................................31
Growth and Fixed Mindset ....................................................................................32

vii
Self-Efficacy and Attribution Theories ..................................................................33
Expectations and Motivation .................................................................................35
Psychological Interventions ...................................................................................36
Conclusion ...................................................................................................................38
CHAPTER III: METHODOLOGY .............................................................................40
Research Questions and Design ...................................................................................41
Participants ...................................................................................................................41
Instruments ...................................................................................................................42
Survey Validation ..................................................................................................43
Independent and Dependent Variables ........................................................................45
Procedures and Data Collection ...................................................................................47
Data Analysis ...............................................................................................................48
Ethical Considerations .................................................................................................48
CHAPTER IV: RESULTS .............................................................................................50
Scale Reliability ...........................................................................................................50
Descriptive Statistics ....................................................................................................51
Research Question One ................................................................................................55
Research Question Two ...............................................................................................58
Research Question Three .............................................................................................61
Conclusion. ..................................................................................................................62
CHAPTER V: CONCLUSIONS ...................................................................................64
Results of Findings Related to Question One ..............................................................64
Results of Findings Related to Question Two .............................................................65

viii
Results of Findings Related to Question Three ...........................................................66
Implications for Practice ..............................................................................................66
Delimitations and Limitations of Study .......................................................................67
Delimitations ..........................................................................................................67
Limitations .............................................................................................................68
Recommendations for Future Research .......................................................................69
Conclusion ...................................................................................................................71
REFERENCES .................................................................................................................72
APPENDIX A: Content Validity Index Evaluation .......................................................82
APPENDIX B: Student Survey .......................................................................................83
APPENDIX C: Teacher Survey ......................................................................................84
APPENDIX D: IRB Approval Letter ..............................................................................85
APPENDIX E: Informed Consent Forms ........................................................................86

ix
LIST OF TABLES
Table 1. Percentage of Kentucky Special Education Students Ages 6-12 by Disability
Category ..............................................................................................................22
Table 2. Unbridled Learning Overview of Accountability Model ...................................24
Table 3. Performance Measures for Next-Generation Learners .......................................26
Table 4. Achievement in 2014-2015: Percent Proficient and/or Distinguished by Grade
Range and Student Category ...............................................................................27
Table 5. Ratings on 8-Item Scale by 8 Experts; Items Rated 3 or 4 on 4-Point Clarity
Scale for Original Survey....................................................................................44
Table 6. Ratings on 8-Item Scale by 8 Experts; Items Rated 3 or 4 on 4-Point Clarity
Scale for Modified Final Survey .........................................................................45
Table 7. Reliability Statistics ............................................................................................51
Table 8. Descriptive Statistics of Socio-demographic Variables for Teacher Participants
.............................................................................................................................52
Table 9. Descriptive Statistics of Socio-demographic Variables for Student Participants
.............................................................................................................................53
Table 10. Descriptive Statistics for KPREP SGP in Reading and Math for Student
Participants ........................................................................................................55
Table 11. Frequency of SGP Categories in Reading and Math (N = 145) ........................55
Table 12. Model Summary for Reading SGP ....................................................................56
Table 13. Regression Analysis Coefficients (Reading SGP) .............................................56
Table 14. Model Summary for Math SGP .........................................................................59
Table 15. Regression Analysis Coefficients (Math SGP) ..................................................59

x
Table 16. Mean Score for Participants Mindset by Role ...................................................62
Table 17. Simple Statistics .................................................................................................62
Table 18. Pearson Correlation............................................................................................62

xi
LIST OF FIGURES
Figure 1. Student participant’s mindset bar graph ............................................................54
Figure 2. Teacher participant’s mindset bar graph ...........................................................54
Figure 3. Histogram of residuals for reading SGP model .................................................57
Figure 4. Normal P-plot of regression standardized residuals for reading SGP model ....58
Figure 5. Histogram of residuals for math SGP model .....................................................60
Figure 6. Normal P-plot of regression standardized residuals for math SGP model ........61

xii
THE EFFECT OF A GROWTH MINDSET ON STUDENT ACHIEVEMENT AMONG
STUDENTS WITH DISABILITIES
Kristin Line Froedge May 2017 92 Pages
Directed by: Antony D. Norman, Kelly Davis, Marguerita DeSander, and Gary Houchens
Educational Leadership Doctoral Program Western Kentucky University
The purpose of this study was to investigate to what extent the mindset of students
with disabilities relates to their Student Growth Percentile (SGP) on the K-PREP in both
reading and math. In addition to exploring the influence of student mindset on academic
growth, the study also examined if a correlation exists between teacher mindsets and
mindsets of their students. This quantitative study utilized 2015 K-PREP assessment data
from the Kentucky Department of Education and a mindset survey developed by the
researcher. Participants for this study included 145 middle school students with
disabilities and 46 middle school teachers from six districts within the Green River
Regional Educational Cooperative.
Results from this study indicate that a student’s mindset scale score does have a
small predictive value on both reading and math SGPs. Those having a growth mindset
are predicted to have a significantly higher SGP. Results indicated an inverse
relationship between teachers’ mindset and students’ mindset at the school level. This
study suggests that one way in which to close the achievement gap for students with
disabilities is addressing psychological barriers and promoting a growth mindset.

1
CHAPTER I: INTRODUCTION
One of the greatest challenges for educators today is improving educational
outcomes for students with disabilities. In a time when “student performance and
achievement are often seen as the only indicators of school success,” (Carter, 2012, p.
177), school leaders are charged with closing the achievement gap between students with
disabilities and their non-disabled peers. Amongst a long lasting educational reform
movement, many changes to bridge the gap of educational opportunities for these
students have surfaced. Yet not one of them has demonstrated significant progress in
closing the achievement gap.
When it comes to achievement, most people tend to think of intelligence.
Although the disabilities of some students are indicative of an intellectual gap, other
students with disabilities display similar intellectual ability as their non-disabled peers.
Educators often debate the modifiability of intelligence, but regardless of personal stance,
complacency about poor academic achievement is not acceptable. Just as Protzko,
Aronson, and Blair (2013) assert, intelligence is an important factor in terms of success in
life. These students’ lives matter and the willingness of educators to go the extra mile to
ensure that they have adequate opportunities once they leave their care is critical.
A lack of academic self-efficacy often compounds the challenge of low academic
and intellectual achievement for students with disabilities. Self-efficacy is belief in one’s
ability to achieve success (Bong & Skaalvik, 2003); while mindset is more about the
attitudes one has about his or her intelligence (Dweck, 2000). Both self-efficacy and
mindset influence the academic trajectory students tend to take and affects the effort they

2
exert, their motivation, perseverance, and resiliency, as well as their postsecondary
outcomes (Carroll et al., 2009).
The U.S. Department of Education (2013) acknowledges the impact of these non-
cognitive factors and predictors on student. Emerging trends in educational and brain-
based research explore and expose the critical need for educators to consider these
variables in student learning and performance. One of the questions still unanswered is
how we can measure in a meaningful way these non-cognitive factors and what role they
should play in any future accountability model.
Regardless of the intellectual capacity of individual students with disabilities,
their mindset pertaining to their intelligence is a highly influential factor (Dweck, 2000;
Jensen, 2005). Understanding the relationship between mindset and intelligence can
unlock a host of potential new ways to meet the needs of students. The U.S. Department
of Education (2013) published a brief, Promoting Grit, Tenacity, and Perseverance:
Critical Factors for Success in the 21st Century, that urges schools to consider how they
are addressing non-cognitive aspects of student learning:
A growing corpus of research evidence suggests that these factors can be just as
important as intellectual abilities for success, and new research programs are
exploring ways to promote these factors. Several private foundations have
recently initiated programs to push the frontiers of theory, measurement, and
practices around these and related factors, particularly for at-risk and vulnerable
students. (p. v)

3
The Problem Defined
Students with disabilities exceed 12% of all students attending public schools in
Kentucky (KDE, 2013). All students with disabilities are guaranteed a Free Appropriate
Public Education (FAPE) under Section 504 of the Rehabilitation Act of 1973. From
1973 to the present, the U.S. Congress has enacted a host of legislative measures to
provide opportunities that are more equitable for students with disabilities. From the
Rehabilitation Act (1973) to reauthorization of the Individuals with Disabilities
Education Act (2004), policy makers have attempted to improve education for this
population. However, the issue of educational equity has long been a concern of
legislators and has led to new systems of accountability. Kentucky has initiated multiple
assessment and accountability systems over the past few decades to comply with federal
mandates for delivering a high-quality education for students with disabilities.
Kentucky’s student testing system, known as the Kentucky Performance Rating for
Educational Progress (K-PREP), consists of a series of assessments reporting
achievement and growth in reading and math of students in grades 3-8 and grades 10-11
as well as achievement data on subpopulations as required by the 2002 No Child Left
Behind Act (NCLB). High stakes testing has become the norm for states to hold
educators accountable for student performance. However, these tests in isolation are not
strong enough to eradicate the achievement gap (Miller & Moore, 2006). More research
is needed on the effects of reform and accountability for students with disabilities.
The sizeable achievement gap that exists between students with disabilities and
their non-disabled peers is a common trend among schools across the country. The U.S.
Department of Education’s effort to address this gap is evident in NCLB (2002) and in

4
the recent reauthorization of the Act now known as the Every Student Succeeds Act
(2015). One of the primary purposes of this Act is, “closing the achievement gap between
high and low performing children, especially the achievement gaps between minority and
nonminority students, and disadvantaged children and their more advantaged peers”
(NCLB, §1001). The Kentucky School Report Card for 2014-2015 denotes a difference
of 24% of students with disabilities in elementary school meeting math proficiency
standards in comparison to their non-disabled peers. That percentage rose to 27.3% at the
middle school level and 24.5% for high school. Even larger gaps were recorded for
reading achievement. A 22.1% gap exists across the state between students with
disabilities and their non-disabled peers meeting proficiency standards in reading for
elementary students. That gap rose to 32.7% for students with disabilities in middle
school and 40.7% once those students reached high school.
Research suggests a connection between a students’ mindset and their
achievement. Social cognitive theory and attribution theory both contend that belief
about one’s own ability is directly associated with behavior and achievement (Wolters,
Fan, & Daughtery, 2013). Dweck (2006) asserts that adolescents with growth mindsets
reach higher levels of achievement than those with fixed mindsets. A growth mindset is
the belief that a person’s intelligence can increase with effort while a fixed mindset is the
belief that a person’s intelligence is predetermined and limited. However, existing
research poses a threat to external validity in that the characteristics of its subjects may
not offer the same results for this particular subgroup. In other words, because of the
stark achievement gap between students with disabilities and their non-disabled peers,
among other differences, the same results may not hold up.

5
Teachers’ mindsets also play a role in the learning climate of a classroom
(Gutshall, 2013). If a teacher’s growth mindset can be linked to higher student
achievement for students with disabilities, then dialogue about the implications of
psychological interventions should follow. Psychological interventions are simply
strategies used to enhance students’ subjective school experiences (Spitzer & Aronson,
2015). Current research supports the use of psychological interventions to raise student
performance levels; however, caution in using these types of interventions in isolation is
imperative (Yeager, Walton, & Cohen, 2013). Including psychological interventions
within a student’s individual education plan may help bridge the achievement gap
between students with disabilities and their non-disabled peers (Spitzer & Aronson,
2015). However, research has not yet substantiated the actual significance of mindset on
achievement and growth for students with disabilities.
Purpose of Study and Central Research Questions
To provide a fundamental context for readers, this study reviews the implications
of reform efforts through federal and state legislation for students with disabilities. With a
focus on Kentucky public schools, namely those within the Green River Regional
Educational Cooperative, the researcher further investigates the relationship between the
previous years’ achievement growth for students with disabilities and their mindset.
Statistical analysis of the gathered data helped to gain a better understanding of how state
educational reforms may need to incorporate a psychological component to make needed
progress in closing the achievement gap for these students. This study sought to answer
the question: To what extent does a growth mindset relate to their Student Growth
Percentile (SGP) on the K-PREP among students with disabilities? The following

6
empirical research questions were used to determine the relationship between disabilities,
mindset, and achievement growth:
1. For students with disabilities, to what extent does their mindset predict their
reading SGP, controlling for socio-demographic variables?
2. For students with disabilities, to what extent does their mindset predict their math
SGP, controlling for socio-demographic variables?
3. For students with disabilities, to what extent do their teachers’ mindsets predict
their own personal mindset?
Participants in this study were 6th
-8th
graders from six districts in the GRREC
region who have one of the following disabilities: Mild Mental Disability (MMD),
Emotional or Behavioral Disability (EBD), Other Health Impaired (OHI), or Specific
Learning Disability (SLD). These disability categories were selected for the study due to
their diverse scope of needed supports and cognitive ability. MMD is the only cognitive
disability among the four considered for this study. The Kentucky Department of
Education provides annual individual student reports that convey student achievement
and growth scores on the end of year assessments, the Kentucky Performance Rating for
Educational Progress (K-PREP). The individual student reports for reading and math on
the Spring 2015 test were used for this study. The K-PREP is a blend of norm-referenced
and criterion-referenced elements. The researcher also gave a researcher-developed
eight-question mindset survey to all participants to determine if they had a growth, fixed,
or neutral mindset in regards to their academic performance and intelligence. Reading,
math, and special education teachers of the student participants also completed the survey
to compare the mindset of students and their teachers. The survey was modeled after
7
Dweck’s online mindset survey (Dweck, 2006) and validated through psychometric
evaluation and content validity index prior to use for this study. Other data, including
socio-demographic data and special education data used in this study, were extracted
from Infinite Campus, the Kentucky’s School Information System (KSIS).
Conceptual Framework
While the intent of the study is to examine the relationship between mindset and
student’s academic growth, additional factors were considered. These include the
student’s personal factors such as gender, ethnicity, and socio-economic status as well as
educational factors such as the student’s disability and least restrictive environment. For
this study, socio-economic status was determined by qualification for free and/or reduced
price meals by being members of households receiving assistance under the Assistance
Programs (SNAP, KTAP, Medicaid, Foster) or of household with incomes within the
limits on the Federal Income Eligibility Guidelines. However, due to the classified
nature of this information at the district level, not all district contacts could provide such
data to the researcher. Participating district assigned district contacts to collect and report
data to the researcher. Each student’s disability category in based on Kentucky’s
regulations and each district’s policy and procedures for determining eligibility. The
Admission and Release Committee determines for each student and reports in the
Individual Education Plan least restrictive environment as more than 80% in the regular
education setting, 40-80% in the regular education setting, or less than 40% in the regular
education setting. Results of the study accounted for and controlled for the socio-
demographic variables to get a more accurate correlation between mindset and student
growth.

8
Significance for the Study
Best practices for students with disabilities continue to evolve as new research
becomes available. There has been no study conducted to determine whether, and to what
extent, a relationship exists between mindsets and student growth for students with
disabilities. This study is particularly important because the knowledge gained may lead
to improvements in current programming for students with disabilities. Individual
districts may utilize data to inform decisions regarding the instructional practices as they
relate to mindsets. The long-term benefits could include changes in service models that
include psychological interventions for students with disabilities or specific training for
teachers in regards to mindset. The ultimate goal is to increase student learning and see
growth in every student, regardless of disability. Another important benefit of this study
will be the contribution to the literature on growth mindsets.
Operational Definitions
Important terms are defined below to provide consistency and understanding for readers
of this study.
● Accountability – Kentucky’s Unbridled Learning assessment and accountability
system that is designed to provide in-depth information about the performance of
students, schools, districts and the state (KDE, 2014).
● Co-teaching – The shared responsibility of teaching among the regular and
special education teachers who serve students with disabilities and their non-
disabled peers (Eaton, Salmon, & Wischnowski, 2004).
● Emotional Behavioral Disability (EBD) – A child, when provided with
interventions to meet instructional and social-emotional needs, continues to

9
exhibit one (1) or more of the following, when compared to the child’s peer and
cultural reference groups, across settings, over a long period of time and to a
marked degree: (1) severe deficits in social competence or appropriate behavior
which cause an inability to build or maintain satisfactory interpersonal
relationships with adults or peers, (2) severe deficits in academic performance
which are not commensurate with the student’s ability level and are not solely a
result of intellectual, sensory, or other health factors but are related to the child’s
social-emotional problem; (3) a general pervasive mood of unhappiness or
depression; or (4) a tendency to develop a physical symptoms of fear associated
with personal or school problems. This term does not apply to children who
display isolated inappropriate behaviors that are the result of willful, intentional,
or wanton actions unless it is determined through the evaluation process that the
child does have an emotional-behavioral disability (707 KAR 1:002).
● Fixed Mindset – A fixed mindset represents the belief that one’s intelligence is set
in stone, unable to be changed (Dweck, 2006).
● Growth Mindset – A growth mindset represents the belief that one’s intelligence
is something that can be cultivated through effort (Dweck, 2006).
● Inclusion – A practice of serving students with disabilities in the general
education classroom with appropriate supplementary aides and services (Roach,
1995).
● Individualized Education Plan (IEP) – A written statement for a child with a
disability that is developed, reviewed, and revised in accordance with 707 KAR
1:320 (707 KAR 1:002).

10
● Least Restrictive Environment (LRE) – To the maximum extent appropriate,
children with disabilities are educated with children who are not disabled; and
special classes, separate schooling, or other removal of children with disabilities
from the regular educational environment occurs only when the nature or severity
of the disability of a child is such that education in regular classes with the use of
supplementary aids and services cannot be achieved satisfactorily (Title I, B, 612,
a, 5).
● Mild Mental Disability (MMD) – A child with cognitive functioning that is
between two and three standard deviations below the mean, adaptive behavior
deficit that is between two and three standard deviations below the mean, a severe
deficit exists in overall academic performance including acquisition, retention
(707 KAR 1:002).
● Other Health Impairment (OHI) – Limited strength, vitality, or alertness,
including a heightened alertness to environmental stimuli, that results in limited
alertness with respect to the educational environment that is due to chronic or
acute health problem, such as acquired immune deficiency syndrome, asthma,
attention deficit disorder, attention deficit hyperactivity disorder, diabetes,
epilepsy, a heart condition, hemophilia, lead poisoning, leukemia, nephritis,
rheumatic fever, sickle cell anemia, Tourette’s syndrome, or tuberculosis; and
adversely affects a child’s educational performance (707 KAR 1:002).
● Special Education – Specially designed instruction, at no cost to parents, to meet
the unique needs of the child with a disability including instruction in the

11
classroom, in the home, in hospitals and institutions, and in other settings (707
KAR 1:002).
● Specific Learning Disability (SLD) – A disorder that adversely affects the ability
to acquire, comprehend, or apply reading, mathematical, writing, reasoning,
listening, or speaking skills to the extent that specially designed instruction is
required to benefit from education (707 KAR 1:002).
● Students with Disabilities (SWD) – Students who have been evaluated in
accordance with Kentucky regulations, as meeting the criteria for autism, deaf-
blindness, developmental delay, emotional-behavior disability, hearing
impairment, mental disability, multiple disabilities, orthopedic impairment, other
health impairment, specific learning disability, speech or language impairment,
traumatic brain injury, or visual impairment which has an adverse effect on the
child’s educational performance and who, as a result, needs special education and
related services (707 KAR 1:002).
Assumptions and Limitations
The researcher held the following assumptions regarding this study. The first
assumption was that the K-PREP scores from the Kentucky Department of Education
were valid and reliable. Another assumption was that the results of the student and
teacher surveys were also valid and reliable. The surveys were validated using an expert
panel to determine the content validity index. The final assumption was that the
information pulled from Infinite Campus (KSIS) was accurate.
This study had several delimitations that bound the study in a way to make it
more manageable for the researcher. Within the scope of this quantitative study, the

12
population is from a restrictive geographical location and identified using a cluster
sampling method. In regards to the ecological validity, limitations based on context, a
potential threat would be the novelty or disruption effect, where a change in routine or
being asked to do something new or different may influence student response (McMillan
& Schumacher, 2005). District Contacts were responsible for collecting the data and
administering the surveys, which may be someone with whom the students were not
familiar with nor part of their normal day. Another limitation was that the sample came
from six districts within the Green River Regional Educational Cooperative (GRREC) in
Kentucky. Students sampled from other districts outside of the GRREC region may have
different results.
Conclusion
Chapter I is an overview of the systemic problem facing public education today, a
significant achievement gap between students with disabilities and their non-disabled
peers. Setting up the study, the introduction will appraise the effect of mindset on
students with disabilities to make a case for psychological interventions with this
population. The following chapter presents an extensive review of the literature about
students with disabilities, their academic growth and achievement, and mindset relating
to their intelligence.

13
CHAPTER II: LITERATURE REVIEW
The intent of this study is to determine the relationship between student academic
growth and mindset for students with disabilities. An extensive review of the literature is
a necessary first step in the process. Although there is a host of information on special
education, the field of research on mindset has just emerged in the past two decades.
Practical implications of the research have yet to be established for this population.
Starting with national legislation and reform efforts related to special education,
this literature review will trace the history of education for students with disabilities. An
examination of student achievement and accountability in the state of Kentucky will
communicate the gap between students with disabilities and their non-disabled peers,
with careful attention brought to the access of curriculum for these students. The
researcher will also provide a review of current literature on mindsets, including self-
efficacy and attribution theories. This literature review will conclude with a generalized
look at psychological interventions that can potentially modify behavior and outcomes.
A Historical Context
“A high level of shared education is essential to a free, democratic society and to
the fostering of a common culture, especially in a country that prides itself on pluralism
and individual freedom” (National Center on Excellence in Education [NCEE], 1983, p.
7). Education has a profound impact on our global economy, yet the federal report, A
Nation at Risk: The Imperative for Educational Reform (NCEE, 1983), outlines many
shortcomings of the American education system. While more Americans are being
educated, the outcomes are not promising.

14
Horace Mann once said, “Good education is the great equalizer of American
society” (as cited in Growe & Montgomery, 2003, p. 23). Education in general adds
value to individual’s quality of life (NCEE, 1983; Protzko et al., 2013). These truths
have spurred on the efforts of lawmakers to reform education and encourage more
suitable and sustainable outcomes for all students, including those with disabilities. The
debate continues to intensify regarding the proper role and best practices for educating
this special population (Sherman, Fuchs, & Fuchs, 1996).
Legislation and Reform
Prior to the Rehabilitation Act of 1973, many students who had a disability did
not have access to appropriate educational opportunities. They were explicitly excluded
from public schools and general population. Many students with disabilities were
removed from their communities and confined to residential placements that provided
limited educational opportunities (Simpson, 2012). The Civil Rights movement spurred
on advocates to fight for rights of the disabled. A groundbreaking court case, Brown v.
Board of Education in Topeka (1954), began to change the landscape of education for
future generations. While the case challenged the common practice of ‘separate but
equal,’ for African-American children, it benefited all minority students (Simpson, 2012).
Litigation for students with disabilities soon followed, adding additional protections and
rights for these students.
The Rehabilitation Act was the first of its kind. The Act declared it
discriminatory to exclude or segregate individuals that had a disability. The law entitles
children to a public education comparable to that provided to children who do not have
disabilities, with disability broadly defined to include any person who has a physical or

15
mental impairment that substantially limits one or more major life activities, has a record
of such impairment, or is regarded as having such an impairment. (Aron & Loprest, 2012,
p. 99)
Shortly after, another attempt to bolster the disparity for students with disabilities
came in the form of the Education for All Handicapped Children Act, also known as
Public Law 94-142. This Act was passed in 1975 as a response to the financial burden
that educating students with disabilities was placing on schools. Federal financial
assistance could be provided to districts that provided students with disabilities free
appropriate public education (Bateman, Bright, O’Shea, O’Shea, & Algozzine, 2007).
Two fundamental changes this law brought about were the implementation of Individual
Education Plans (IEPs) and training at the collegiate level that specialized in working
with students with disabilities (Keogh, 2007).
Following this new standard for educational practices, he U.S. Department of
Education in 1979 commissioned the Office of Special Education Programs (OSEP) to
provide leadership and support for people with disabilities in regards to inclusion, equity
and opportunity (C. Stein, personal communications, August 24, 2016). As these laws
were enacted, support was provided, and more attention was given to these children,
services began to improve.
In 1990, the reauthorization of the Education for All Handicapped Children Act
overhauled current legislation and the future for students with disabilities. This
reauthorization came with a new name, Individuals with Disabilities Education Act
(IDEA). Among some of the changes were an acknowledgement of parental rights,
defined terms, and provision for related and transition services, and additional required

16
personnel training (Simpson, 2012). The cornerstone to this reauthorization was that any
school receiving federal funds must provide Free Appropriate Public Education (FAPE)
to all students with disabilities (Zirkel, 2013). This regulation incited further legal action
as districts struggled to meet the extensive requirements of this law. IDEA was again
reauthorized in 1997 (Wright, 2004).
In 2001, President George Bush endorsed and signed into law NCLB. This act
guaranteed access to high-quality education to all children (Lewis, 2003). The means to
do this is through high standards and a goal of proficiency of those standards by all
students. The focus was on closing the achievement gap for underperforming students.
NCLB heightened pressure on schools to demonstrate adequate yearly progress to escape
escalating consequences (Hout, Elliot, & Frueh, 2012). This level of federal
accountability for teachers and administrators was unprecedented.
The reauthorization of IDEA in 2004, called the Individuals with Disabilities
Education Improvement Act, continued this mantra of access to the general curriculum
and rigorous standards for students with disabilities (Teal, 2013). With both laws, more
and more special needs students began spending more time in the general education
classroom to comply with least restrictive environment (LRE) mandates. Another part of
IDEA (2004) was the requirement for special education teachers to be highly qualified.
Other changes made included additional due process requirements, disciplinary
procedures for students with disabilities, flexibility in SLD eligibility, and funding
(Smith, 2005).
In December 2015, the Every Student Succeeds Act was signed into law. In
response to the waivers that states requested to opt out of NCLB requirements, this bill

17
attempts to guarantee opportunities for all students. Giving some decision-making power
back to states and local education agencies allowed them to implement solutions that
work rather than a one-size-fits-all federal response is one of several improvements (The
White House, 2015). One of the implications of the change in law is the number of
students eligible to take the alternate assessment. Darrow (2016) explains that only 1%
of all students will be eligible for this assessment. This cap means more students will be
required to take the general state assessment and therefore held to much higher academic
standards, which will ultimately influence where they are served to ensure access to the
full curriculum. Access must go beyond exposure and further promote progress
(National Down Syndrome Congress, 2016).
Another significant change is that the language of ESSA encourages an approach
to education that places a high value on music and the arts. Often students with
disabilities have limited opportunity to engage in classes outside of the core content due
to their academic deficits and need for supplemental services. However, Darrow (2016)
expects their opportunity to broaden as the focus of a well-rounded education program
continues to grow.
A third result of NCLB and ESSA for students with disabilities comes in the form
of identification practices. Because of the growing number of students identified with a
Specific Learning Disability (SLD), Response to Intervention (RTI) was a sensible
response that also met the demand of NCLB. Although RTI is a general education
initiative, it became seen as an appropriate tool to identify students with a learning
disability instead of the original discrepancy model. Johnston (2011) identifies
assumptions surrounding the implementation of RTI in regards to its effectiveness.

18
ESSA will continue to allow the use of RTI as an appropriate model for determining SLD
eligibility.
With these changes, and even with some of the enduring components, students
with disabilities are spending more time served in inclusive settings. Some of the
benefits of inclusion encompass social justice, equal opportunity, and higher expectations
(Obiakor, Harris, Mutua, Rotatori, & Algozzine, 2012). There is delineation however
between policy and practice. Effective implementation of an inclusive model of services
require general education acceptance of responsibility for all students, professional
development among educators in appropriate differentiation strategies, and a
collaborative environment that is supported from the top down.
In summary, ESSA will continue to promote high standards of education for all
students, including those with special needs. The progress made in terms of
identification and service delivery will be maintained. The accountability for students
with disabilities however, will likely be more substantial as the spotlight on outcomes for
this population has widened. The nuances between NCLB and ESSA will continue to
develop as states begin to work through the details.
Students with Disabilities
Today, students with disabilities receive more wide-ranging services and supports
than ever before. The progress they have made has far surpassed the imagination and
expectation of educators’ nation-wide. However, there continues to remain an
achievement gap between them and their non-disabled peers. The U.S. Department of
Education (2010) documents the national impact of IDEA in a report entitled Thirty-Five
Years of Progress in Educating Children with Disabilities Through IDEA:

19
● There are more children receiving early interventions. A longitudinal study that
tracked 3,000 preschool students receiving services in the early 2000s indicated
that close to 16% stopped receiving those services annually over the course of two
years because they no longer needed specially designed instruction.
● More students with disabilities are accessing the general education curriculum in
neighborhood schools as opposed to separate schools. In 2008, neighborhood
schools served 95% of all students with disabilities, and most of these students
were taught in the general education classroom for at least a portion of their day.
● More students with disabilities are receiving services under IDEA, both in Part B
and Part C. From 1995 to 2007, nearly 23% more students, ages 3-5, were found
eligible to receive special education services under Part B and those under the age
of 3 receiving services has more than doubled.
● More students with disabilities are graduating high school. From 1997 to 2008,
there have been over 16% more students with disabilities graduating with a
regular diploma and a 21% decrease in special education dropouts in that same
time frame.
● Post-secondary outcomes have improved for students with disabilities. There has
been a 17% increase in students with disabilities enrolling in some form of post-
secondary education from 1987 to 2005 and a 15% increase in employment of
those students.
Outcomes for students with disabilities have certainly improved, primarily due to
the implementation of IDEA. Other legislative efforts have also contributed to the
positive outcomes for these students. These students make up nearly 14% of all students

20
nationally, totaling over 6.7 million children nation-wide (Aron & Loprest, 2012). Aron
and Loprest acknowledge the accomplishments yet suggest that students with disabilities
still face disparity in regards to achievement, expectations, and opportunities.
Disabilities and Eligibility Criteria
In the commonwealth of Kentucky, for a student to qualify for special education
services, they must have a disability; the disability must adversely affect their educational
performance and they must demonstrate a need for specially designed instruction. IDEA
(1997) recognizes the following fourteen primary disabilities (divided into high,
moderate and low incidence categories): functional mental disability, mild mental
disability, autism, specific learning disability, orthopedic impairment, other health
impairment, emotional behavioral disability, deaf, blind, deaf/blind, multiple disability,
traumatic brain injury, speech impairment, and developmental delay.
In 2011, 13.6% of Kentucky’s students were identified as a student with a
disability compared to 12.9% nation-wide (“Data Display: Kentucky,” 2013). While
each district must follow Kentucky Administrative Regulations in regards to their
identification practices, there is variability in district policies and procedures related to
the process due to broad interpretation of the law. This variation may threaten reliability
of data collected on these populations.
The Legislative Research Commission (2011) suggests great differences among
Kentucky districts and among states in the prevalence of students with disabilities overall
and in particular categories. Data also indicate dramatic fluctuations over time in the
percentages of students with disabilities and among disability categories. There is little
evidence, however, that differences in identification rates among states or districts are

21
explained primarily by differences in student populations. This raises questions about the
criteria used to identify students for special education in different states and districts
(Legislative Research Commission, 2011).
Other than speech or language impairment, Other Health Impairment (OHI) is the
largest represented disability category for students with disabilities in Kentucky in 2011,
closely followed by Specific Learning Disability. “Other health impairment is a catchall
category for students whose health and conditions reduce their abilities to perform in the
educational setting” (Aron & Loprest, p. 2012). Table 1 outlines the breakdown of
special education students by disability.
Specific Learning Disability (SLD) is one category that has evolved in terms of
eligibility criteria for identification. While the definition of SLD has remained constant,
the method of evaluating and determining eligibility has broadened. The Education for
all Handicapped Children Act required institutions to use a severe discrepancy model that
compared a student’s intellectual ability and academic achievement or performance in
one or more areas: oral expression, listening comprehension, written expression, basic
reading, reading comprehension, mathematics calculation, or mathematics reasoning
(Coomer, 2015). However, with the reauthorization of IDEA in 2004, states could not
require the use of the severe discrepancy model for identification purposes. All states
have now permit the use of response to intervention (RTI) as a viable method of
identifying SLD (Coomer, 2015). Kentucky allows districts to use either the severe
discrepancy model or response to intervention method for declaring eligibility.

22
Table 1
Percentage of KY Special Education Students Ages 6-12 by Disability Category in 2011
Disability Category Percent
High Incidence
Speech or Language Impairment 23.65%
Moderate Incidence
Other Health Impairment 17.34%
Specific Learning Disability 16.62%
Mild Mental Disability 14.62%
Developmental Delay 8.43%
Orthopedic Impairment 0.54%
Low Incidence
Emotional-Behavioral Disability 6.02%
Autism 4.15%
Functional Mental Disability 3.66%
Multiple Disabilities 3.38%
Hearing Impairment 0.74%
Visual Impairment 0.57%
Traumatic Brain Injury 0.27%
Deaf/Blindness 0.02%
Note. Adapted from “Appropriate Identification and Service of Students with Disabilities:
Special Education Eligibility, Funding and Personnel Training,” Legislative Research
Commission, 2013, p. 10.
Student Achievement
Student achievement is the ultimate goal of education. Student achievement is
typically measured in terms of outcomes on a set of performance expectations. However,
“as a result of the pressures of educational reform and high-stakes assessment, some
schools run the risk of foregoing active, student-centered learning activities for building
test-taking skills and memorization of discrete facts” (Faulkner & Cook, 2006, p. 1). The
complexity of high-stakes testing as it seeks to gauge where students are in their learning
as well as hold educators accountable has been scrutinized for many years.

23
High Stakes Testing in Kentucky
In 1990, the Kentucky Education Reform Act (KERA) became the first real
legislation that led to high-stakes assessment and accountability within the state
(Simpson, 2012). With this came a change in instructional practices as pressure
increased for both teacher and student (Faulkner & Cook, 2006; Lile, 2012). There is
now a moral dilemma that many leaders and educators face in terms of making decisions
regarding what is best for the school versus what is best for the student (Willis, 2011).
Since the inception of NCLB, state assessments and accountability systems have
informed and directed classroom practices across the country. Schools and districts are
assessed to determine if they met Adequate Yearly Progress in both reading and math
(Simpson, 2012). The questions of reliability and validity are always scrutinized when it
comes to state accountability assessments. In 2007, a quantitative study was carried out
that compared Kentucky’s state math assessment to respective National Assessment of
Educational Progress (NAEP). This study looked at results of fourth and eighth grade
students from both assessments in years 1996 and 2003 and indicated a strong positive
correlation between the two tests. “NAEP has become the de facto measure of accuracy
for all state assessments as defined by No Child Left Behind” (Lile, 2012, p. 24).
After House Bill 53 was passed in 1998, the Kentucky Board of Education was
charged with revising the accountability system and therefore adopted an interim system
known as the Commonwealth Accountability Testing System or “CATS” to meet the
demands of NCLB (Hatchett, 2010; Simpson, 2012). The CATS test encompassed both
nationally normed and standards-based components (VanMeter, 2005). Seven content
areas were tested with financial rewards for districts meeting state goals (Traylor, 2013).

24
The current assessment system for Kentucky, Unbridled Learning’s Next
Generation Accountability System, first implemented in 2011-2012, was a much more
comprehensive model that consisted of multiple measures, including a college and career
readiness component as a result of Senate Bill 1 in 2009 (Traylor, 2013). The first
implementation year, schools were assessed solely on the learners in areas of
achievement, gap, growth, college and career readiness, and graduation rates. Since then
program reviews in Arts and Humanities, Practical Living, and Writing were added, as
well as measures from the Professional Growth and Effectiveness System for teachers
and leaders (KDE, 2014b). Table 2 is an overview of the accountability model.
Table 2
Unbridled Learning Overview of Accountability Model
Next-Generation
Learners
Next-Generation
Instructional Programs
and Support
Next-Generation
Professionals
Next-Generation
Schools/Districts
Achievement
Gap
Growth
College/Career
Readiness
Graduation Rate
Program Reviews Percent Effective
Teachers
Percent Effective
Leaders
Overall
Accountability
Score
Source: KDE (2012)
Achievement is determined by individual student performance on given
assessments. Performance is reported as a raw score as well as translated into
classifications of Distinguished, Proficient, Apprentice, or Novice. The gap group
referred to in this model includes students who fall into any of the following non-
duplicated categories; African-American, Hispanic, Native American, Students with
Disability, Free/Reduced, and Limited English Proficiency. These groups have been

25
identified as typically under-performing (Traylor, 2013). NCLB requires reporting on
these sub-populations.
Part of the accountability for Kentucky schools is the individual student growth
component. The Student Growth Percentile (SGP) “focuses on the relative standing of a
student from year to year compared to the student’s academic peers” (Allred, Draut, Ellis,
& Liguori, 2014). Points are awarded to schools and districts based on number of
students demonstrating at least typical growth from the previous year, indicated by a SGP
of 40 or higher (Traylor, 2008).
The college/career readiness component is determined by students’ successful
completion of academic and/or technical indicators of attainment (KDE, 2012). Lastly,
the graduation rate is based on the Average Freshman Graduation Rate (AFGR), a cohort
model (Traylor, 2013). Table 3 summarizes the performance measures at each grade
range.
Participation in statewide testing is expected of all students, regardless of
disability. “Debate continues on the appropriateness of using the same tests and
standards for assessing students with and without disabilities and on the use of
accommodations in test taking” (Aron & Loprest, 2012, p. 112). There is an Alternate
Assessment that is an option for students with more severe disabilities as determined by
the Admission and Release Committee (ARC). In 2011-2012, 8% of students with
disabilities in 4th
grade participated in the alternate assessment and 11% of students with
disabilities in 8th
grade participated in the alternate assessment (“Data Display:
Kentucky,” 2013).

26
Table 3
Performance Measures for Next-Generation Learners
Grade
Range Achievement Gap Growth College/Career
Readiness Graduation
Rate
Elementary K-PREP Test in:
reading, math,
science, social
studies and writing
K-PREP Test in:
reading, math,
science, social
studies and
writing
Reading
and Math NA NA
Middle K-PREP Test in:
reading, math,
science, social
studies and writing
K-PREP Test in:
reading, math,
science, social
studies and
writing
Reading
and Math EXPLORE NA
High End-of-Course
Test in: Algebra II,
Biology, US
History, and
English II
K-PREP Test in:
on-demand writing
End-of-Course
Test in: Algebra
II, Biology, US
History, and
English II
K-PREP Test in:
on-demand
writing
PLAN to
ACT College/ Career
Readiness Rate
AFGR*/ Cohort
Model
*AFGR is Averaged Freshman Graduation Rate.
Source: KDE (2012)
Achievement Gap
There is no question that an inequality in achievement exists across the nation, as
well as internationally, in the educational systems, yet the extent of that inequality
creating significant performance gaps is worth exploring (Montt, 2011). Montt conducted
a cross-national study to investigate factors that appear to influence achievement
inequality. He found that certain systems and practices “amplify the effect of
socioeconomic background on achievement” (p. 63). Tracking is a common practice
with regards to special education services as well due to the lack of full funding and
limited amount of resources available to schools. Other factors that influenced

27
achievement inequality were teacher quality, opportunities to learn, intensity of
schooling, and allocation of resources (Montt, 2011).
The purpose of NCLB’s Adequate Yearly Progress (AYP) requirements is to
expose the academic disparity among groups of learners, compelling schools to address
the issue of achievement gaps (Anderson, Medrich, & Fowler, 2007). Miller and Moore
(2006) claim that “in spite of these reforms, the performance gap has been highly
resistant to educators’ best efforts to reduce it” (p. 3).
The Kentucky School Report Card for 2014-2015 indicates a gap between
students with disabilities and their non-disabled peers larger than any other categorical
group other than students with Limited English Proficiency. Table 4 displays the
percentage of students scoring proficient or distinguished by students across the state of
Kentucky. In most areas, the total number of students scoring proficient or distinguished
was over double that of those in special education.
Table 4
Achievement in 2014-2015: Percent Proficient and/or Distinguished by Grade Range and
Student Category
Student Category Reading
Elementary Reading
Middle Reading
High Math
Elementary Math
Middle Math
High
All Students 54.2 53.8 56.8 48.8 42.8 38.2
African Americans 32.7 31.4 34.2 30.5 21.0 22.8
Limited English Proficiency 23.3 11.4 5.6 24.2 12.2 19.8
Free/Reduce 44.1 42.9 44.3 38.6 31.2 27.4
Students with Disabilities 32.1 21.1 16.1 24.8 15.5 13.7 Source: KDE State School Report Card 2014-2015
In a longitudinal study conducted to examine the proficiency rates in reading on
high stakes testing in North Carolina over a span of 5 years, results indicated an initial

28
gap of 42% difference between students with a learning disability meeting proficiency
rate compared to their non-disabled peers. At the end of the 5-year study, the gap had
decreased to 27% difference between those same populations. Another note to consider
is that over those five years, there was an 11% increase in those identified LD by the
district, which may impact those overall numbers (Schulte, Villwock, Whichard, &
Stallings, 2001).
Hansford and Hattie (1982) found a correlation between intelligence and
achievement of r = 0.51 and an effect size of d = 1.19. “This high relationship accounts
for what many researchers call the “Matthew effect,” which is based on the biblical
notion that the rich get richer and the poorer get poorer or do not gain as much” (Hattie,
2009, p. 41). Walberg and Tsai (1983) have also conducted a study to determine if the
degree of achievement is proportional to “initial endowment (p. 360).” They found that
the advantages of prior educational background are both collinear and cumulative, which
may prove to be a barrier in closing the achievement gap for years to come.
Access to Curriculum
Darling-Hammond (2010) acknowledges the opportunity gap that is based on
access to resources and its play on the achievement gap of minority groups including
students with disabilities. Special education is far from a one-size-fits all model. Aron
and Loprest (2012) note that the variability of services hinges on the severity of the
disability. The Admission and Release Committees (ARC) have been given the authority
to determine the least restrictive environment, prioritize goals, and establish appropriate
accommodations and modifications needed to access the curriculum.
Kauffman, McGee, and Brigham (2004) state,

29
We sell them short when we pretend that they have competencies that they do not
have or pretend that the competencies we expect of most students are not
important for them. Like general education, special education must push students
to become all they can be. Special education must countenance neither the
pretense of learning nor the avoidance of reasonable demands. (p. 620)
Zigmond, Kloo, and Volonino (2009) declare that special education has always
centered around three primary questions: what, where and how. In the past, special
education primarily provided students with different standards and skills than what was
provided to non-disabled peers, such as social skills, speech, adaptive skills, etc., yet now
holds those students accountable to the same academic and performance standards as all
students. With that change, a movement towards inclusion of special education
populations into the general education classroom followed.
There are two common extreme suppositions that can lead to the maltreatment of
students with disabilities: denying their disability, therefore not providing
accommodations, modifications, or specially designed instruction; or the opposite,
accommodating them to the point that the work is no longer an accurate portrayal of their
actual ability (Kauffman et al., 2004, p.613). Both scenarios are problematic in that they
fail to assist students with disabilities in reaching their highest potential.
The placement of students with disabilities directly affects their access to grade
level curriculum. Darling-Hammond (2010) references the finding of multiple studies
that claim “students placed in the lowest tracks or in remedial programs tend to
experience instruction geared only to rote skills, working at a low cognitive level on fill-
in-the-blank worksheets and test-oriented tasks that are profoundly disconnected from the

30
skills they need to learn” (p. 55). IDEA (2004) requires schools to serve students in the
least restrictive environment. Placement decisions should begin with considering the
general education setting and moving along the continuum of placement options until the
LRE is agreed upon by the ARC (Marx et al., 2014). LRE is a decision made on an
individual basis for each child receiving special education services.
In 2011, 77.3% of students with disabilities were served at least 80% of their day
in the regular education classroom, 18.3% were served 40-79% of their day in the regular
education classroom, and 9.6% were served less than 40% of their day in the regular
education classroom (“Data Display: Kentucky,” 2013). As one might expect, those
identified with a low-incidence disability are significantly more likely to be placed in
more restrictive settings including separate schools, residential or home/hospital
placements. The National Center for Educational Statistics (NCES) reports that .5% of
students identified with a speech/language impairment compared to 24.4% of multiple
disabilities and 31.3% of deaf/blind students were served in restrictive placements in
2009 (Kurth, Morningstar, & Kozleski, 2014).
Dessemontet, Bless, and Morin (2012) conducted a study that compared the
effects of placement, separate schools versus being fully included into general education
classrooms, for 76 students with cognitive disabilities. Their results indicated a
significant positive difference in literacy skills for those students included in the general
population. While there was not a significant difference in math skills and adaptive
behavior, researchers indicated the both groups made adequate progress in those areas.
This study provided empirical support of inclusive practices for students with cognitive
disabilities.

31
In addition to placement, consideration is the access to high-level courses and
college or career preparatory pathways. Based on the Kentucky School Report Card for
2014-2015, 66.9% of all students in the state met college or career ready benchmarks,
whereas only 25.8% of students with disabilities met those benchmarks. Grubb and
Lazerson (2007) note that “individuals are more likely to find their skills becoming
obsolete because of the pace of technological change” (p. 2). Oftentimes students with
disabilities spend the majority of their time in remedial classes, which do not prepare
them for the workforce in which they will enter once they graduate high school.
Mindset
The emerging research on brain development has set the stage to change the
course of education for the future. “The view of a ‘static’ brain is decidedly out of date.
Yet the most amazing new discovery about the brain might be that human beings have
the capacity and the choice to be able to change our own brains” (Jensen, 2005, p. 10).
This idea is in stark contrast to the longstanding view that the brain remained reasonably
constant over time. Alfred Binet, the developer of first test to measure intelligence, also
believed that intelligence was malleable and that it can be altered by educational practices
(Dweck, 2006).
Evidence suggests that the way in which educators use information about
intelligence may directly affect the achievement of students with disabilities in their
classroom. In an analysis of studies related to the labeling of special education students,
Osterholm, Nash, and Kritsonis (2007) agree that these labels generate stereotypes.
Educators often lower their expectations for these students, which can directly affect their
effort and achievement. However, through their understanding the malleability of an

32
individual’s cognition and intellectual ability (Buschkuehl & Jaeggi, 2010; Schwartz &
Begley, 2002), teachers can profoundly affect student’s achievement by providing
constructive learning opportunities in the classroom (Jensen, 2013).
Most educators lack strong background knowledge in cognitive science (Ricci,
2013) which can cause them to struggle in their understanding of such concepts.
Educators need more literature and professional development to help them grasp the
concept of the impact of a students’ mindset in regards to their achievement in school.
Growth and Fixed Mindset
Carol Dweck is one of the leading researchers today of mindset theories. She
outlines two different theories of intelligence and their corresponding mindset. An entity
theory is one that perceives the intelligence to be static or constant. Those holding this
view are considered to have a fixed mindset (Dweck, 2000). The entity theory comes
from the belief that some innate ability is what determines their success (Gregory &
Kaufeldt, 2015). On the other hand, the incremental theory, or growth mindset, stems
from the belief that “talents and abilities can be developed through effort, good teaching
and persistence” (Gregory & Kaufeldt, 2015, p. 92).
Middle school is associated with great transition. Blackwell, Trzesniewski, and
Dweck (2007) assert that middle school “emphasizes competition, social comparison, and
ability self-assessment at a time of heightened self-focus” (p. 246). Dweck and Leggett
(1988) examined two different studies Bandura conducted related to theories of
intelligence of middle grades students. These students could choose a task that varied in
difficulty. The first two options indicated a performance goal; the first task being very
easy, the second being harder, yet still something they knew how to do. The last option

33
represented a learning goal, and was something new for students. “We found a clear and
significant relationship between students’ theories of intelligence and their goal choices:
The more students held an entity theory of intelligence, the more likely they were to
choose a performance goal, whereas the more they held an incremental theory, the more
likely they were to choose the learning goal” (Dweck, 2000, pp. 20-21).
The biggest difference between the behaviors of students sharing different
mindsets is the effort they expend towards learning new things. Those holding to the
entity theory feel that the more effort they must put in, the less smart they are (Dweck,
2000). Cain and Dweck (1995) described these students as ones who often demonstrate
helplessness in the classroom and give up easily when they fear failure. Those with
incremental views, or a growth mindset, are willing to put forth effort to learn new things
no matter how difficult it may be. Miller (2013) claimed that promoting a growth
mindset encourages students to set goals, persevere when faced with a difficult task, and
value effort. The distinction between these two views contributes to the differences in
academic outcomes (Dweck, 2000). Fostering a growth mindset among students must
first come from a professional growth mindset of the teacher. They must internally
believe that all students can learn and grow in their intellectual capacity.
Self-Efficacy and Attribution Theories
Shavelson, Hubner, and Stanton (as cited in Bong & Skaalvik, 2003) define self-
concept as an individual’s perception of himself. They also describe self-efficacy as
“beliefs in one’s capabilities to organize and execute the courses of action required to
produce given attainments” (p. 5). Most often these measures are determined by self-
reports which consist of an evaluative element, requiring a high level of cognition (Bong

34
& Skaalvik, 2003). There is a parallel between self-efficacy and a growth mindset. A
growth mindset improves student’s self-efficacy (Baldridge, 2010). Educational
implications of self-efficacy are directed at student outcomes such as performance and
academic achievement.
“Students arrive at school with an already well-developed self-image of
competence or incompetence resulting from messages they have received at home since
birth” (Gregory & Kaufeldt, 2015, p. 10). Dweck (2008) also confirms that peoples’
beliefs are developed from infancy and play a role in personality. Early environmental
factors are critical components in the brain and overall development of children.
In Hattie’s (2009) research he finds that self-concept has an effect size of d = 0.43
and motivation has an effect size of d = 0.48. “A sense of confidence is a most powerful
precursor and outcome of schooling. It is particularly powerful in the face of adversity”
(pp. 46-47). Ackerman and Brown (as cited in Jensen, 2013) claim that when students
have experienced a lot of adversity growing up, they generally feel less in control of their
lives than those who have not, which may negatively influence their self-efficacy.
Bandura (1986), another well-known researcher of the self-efficacy theory, brings
to light another consideration of motivation. “His basic premise is that people will engage
in activities if they believe that they are competent in them” (Gregory & Kaufeldt, 2015,
p. 22). This notion is really the antecedent to further assumptions related to end results.
Bong and Skaalvik (2003) indicate that academic self-efficacy correlates with student
outcomes, including but not limited to task choice, persistence and performance, career
selection, and academic aspirations.

35
In a study of over 500 seventh grade students that compared the achievement,
effort, and self-perceptions of students with learning disabilities to their non-disabled
peers, Lackaye and Margalit (2006) found that students with learning disabilities had a
mean score of 55.38 on the Academic Self-Efficacy Scale compared to a 64.07 mean for
those students without a learning disability. When comparing those means to school
grades, students with learning disabilities had a mean score of 66.35 and those without a
learning disability had a mean score of 73.42. This study concluded that students with
learning disabilities need help to boost their self-efficacy, to develop personal goals, and
to build skills related to solving difficult problems to increase their overall effort and
achievement.
“Attribution theory also deals with how people make sense of their world,
particularly with how they explain the things that they observe and experience” (Dweck,
2000, pp. 139-140). Weiner (1972) acknowledges in his review of multiple empirical
studies on attribution theory and achievement that there are considerable implications for
student achievement and the educational process. He claims that causal attributions
influence motivation and persistence. “These behaviors manifestly will influence the
degree of learning in academic settings” (Weiner, 1972, p. 213).
Expectations and Motivation
Teachers play a commanding role in the lives of children. Their instruction and
disposition influence students in many ways. Jensen (2013) references a study conducted
by Coe (2002) that found a significant correlation between teacher’s expectation and
student success. The study indicated that teachers’ expectations had an effect size of d =
1.03 on student achievement. Hattie’s (2009) meta-analysis of teacher expectation

36
indicated a smaller, yet still significant effect size of d = .43. The power of expectations
can stimulate an environment where students can flourish or remain idle.
Kentucky schools began using The Kentucky Framework for Teaching
(Danielson, 2011) also known as the Professional Growth and Effectiveness System
(PGES) after Senate Bill 1 was passed in 2009 (KDE, 2017). PGES clearly indicates in
Domain 2 that exemplary teachers have high expectations for all students in the
classroom (Danielson, 2011). With teacher effectiveness being a fundamental component
leading to student achievement, it is critical that teachers have the knowledge and skills
necessary to assimilate subject matter, and pedagogical and didactic competencies with
corresponding mind frames (Zierer, 2015). Dweck (2000) realized that once they
understood more about student’s beliefs and mindsets “that created the continual need to
validate versus the desire to learn, we could then begin to think about enhancing students’
motivation to learn by changing their beliefs about their intelligence” (pp. 20-21).
Multiple studies have attempted to analyze the impact different psychological
interventions designed to improve students’ effort and motivation in the classroom.
Psychological Interventions
Interventions that demonstrate the power of neuroplasticity of the brain, such as
those used to assist students with dyslexia process sounds accurately, or those
interventions used with stroke patients to re-gain skills, are evidence that with specific
training or interventions the brain can and does change (Baldridge, 2010). Similar
interventions specifically related to student’s mindset have been shown to impact
individuals’ effort, motivation and self-efficacy, ultimately leading to higher student
achievement.

37
A collection of studies (Yeager et al., 2014) conducted in California investigated
the effects of both entity and incremental theories on multiple student variables such as
academic performance, health, stress level, etc., as well as the effects of brief social-
psychological interventions on student outcomes over time. Results indicated that
students who held to the entity theory experienced a host of negative effects, while those
who were participated in the intervention, and were taught the incremental theory,
experienced more positive student outcomes. This study implied that additional benefits,
aside from improved academic performance, were also realized.
Blackwell et al. (2007) tested the effects of psychological interventions
specifically on mathematics grades in middle school and found that they could increase
motivation in math class simply by teaching students about the malleability of
intelligence. Results spanning the two-year study indicated a significant increase in
grades post-intervention as compared to those in the control group, not receiving
instruction regarding intelligence theories.
A third study (Wehmeyer et al., 2002) that looked closely at a psychological
intervention for students with intellectual and learning disabilities also supported the idea
that these interventions do lead to improved student outcomes. This study analyzed the
effects of the Self-Determined Learning Model of Instruction (SDLMI), which is another
strategy or intervention used to help students meet academic goals. Results did in fact
show a significant improvement goal-attainment and access to general curriculum over
the year when provided the SDLMI intervention compared to those who did not receive
the intervention.

38
These interventions take valuable time, which is often the reason teachers do not
utilize them. Time is a limited resource in which teachers feel they are bound to content.
The research regarding psychological interventions supports the use of these strategies to
support student achievement. Yeager and Walton (2011) discuss the benefits of utilizing
brief psychological interventions with students but caution educators in expectations of
those interventions. “Social-psychological interventions are not magic. They are not
inputs that go into a black box and automatically yield positive results. Instead, they are
tools to target important psychological processes in schools” (p. 293).
Conclusion
The historical context of education reform with regards to students with
disabilities continues to unfold in our nation as lawmakers persist in trying to bridge the
achievement gap between these students and their non-disabled peers. Whether that gap
ever closes or not, improved outcomes for this population is at the heart of this challenge.
Perhaps an even greater challenge to assessing student outcomes likes in the
separating the effects of attributable to specific educational practices form other
intervening and coexisting factors such as socioeconomic circumstances and need
for supportive services. For this and other reasons, relatively little research has
been conducted on the effectiveness of specific special education practices or
programs. In addition, the impact of special education for the most students with
disabilities is intertwined with their general education experiences and
opportunities, including whether they have access to the full range of general
education options. (Aron & Loprest, 2012, p. 111)

39
Research continues to grow in terms of how best to serve students with special
needs. Decisions concerning least restrictive environment, appropriate accommodations,
modifications to the curriculum, related and transition services and others are determined
by the ARC but are ultimately influenced by current best practices. The goal of special
education is to provide specially designed instruction and other services to students with
disabilities in efforts to afford them an appropriate education and enhance student
outcomes.
New research has suggested that student achievement is correlated with their
mindset. If this is true of general education students, it is necessary to determine the
effects of mindset for students with disabilities on academic achievement. Current
research is limited in that it has not yet explored the effects on this population of students.
This study seeks to determine the effects of a growth mindset on student achievement for
students with disabilities.
If a correlation can be determined, further research could provide guidance as to
how educators may intervene to help students change their mindset to improve outcomes
in the classroom and on state assessments. Psychological interventions could be
integrated into current programming for these students to boost student performance.

40
CHAPTER III: METHODOLOGY
This study investigated the relationship between student achievement and growth
of students with disabilities and their mindset. With a focus on Kentucky public schools,
statistical analysis of the data gathered was used to gain a better understanding of how
state educational reforms may need to incorporate a psychological component to make
needed progress in closing the achievement gap for these students.
Research has been conducted to assess the effect of self-efficacy and beliefs on
student achievement. Social Cognitive Theory and Attribution Theory both contend that
belief about one’s own ability is directly associated with behavior and achievement
(Wolter et al., 2013). Dweck (2006) asserts that adolescents with growth mindsets reach
higher levels of achievement than those with fixed mindsets. Dweck outlines the
difference between a growth mindset and a fixed mindset. A growth mindset is the belief
that a person’s intelligence can increase with effort while a fixed mindset is the belief that
a person’s intelligence is predetermined and limited. Additional research exists to guide
parents and educators in how to use this information to help adolescents shift their
mindset. Ricci (2013) connects this idea with the concept of neuroplasticity and
introducing stimuli to promote change within the brain. However, there is a lack of
research on the actual influence of mindset on students with disabilities. Existing
research pose a threat to external validity in terms of the characteristics of its subjects
may not offer the same results of this subgroup. This chapter describes the research
questions, methodology, and general information regarding the analysis of data.

41
Research Questions and Design
Based on the literature review, there are additional questions surrounding the
ability to generalize previous findings in regards to mindset and academic growth to
students with disabilities. This study sought to fill in the gaps by answering the following
research question: To what extent does a student’s mindset relate to their Student Growth
Percentile (SGP) on the K-PREP assessment among students with disabilities? The
following empirical research questions were used to determine the relationship between
disabilities, mindset, and achievement growth:
1. For students with disabilities, to what extent does their mindset predict their
reading SGP, controlling for socio-demographic variables?
2. For students with disabilities, to what extent does their mindset predict their math
SGP, controlling for socio-demographic variables?
3. For students with disabilities, to what extent do their teachers’ mindsets predict
their own personal mindset?
A quantitative study was conducted to gather data from multiple sources. A multiple
linear regression design was selected to facilitate the statistical analysis of the results and
carried out using SPSS. The study used deductive reasoning to examine the relationship
between the mindset of students with disabilities and their actual student growth.
Participants
This study was conducted in Kentucky, a generally rural state. Six districts from
the Green River Regional Educational Cooperative were selected for convenience
purposes, both in proximity and familiarity with administration: Edmonson County,
Elizabethtown Independent, Green County, Hart County, LaRue County, and Metcalfe

42
County. Participants for this study include students in sixth, seventh, and eighth grades
with a primary disability category of Specific Learning Disability (SLD), Other Health
Impairment (OHI), Emotional Behavioral Disability (EBD), or Mild Mental Disability
(MMD). These disability categories were selected for the study due to their diverse
scope of needed supports and cognitive ability. MMD is the only cognitive disability
among the four considered for this study.
Middle school was the target population because assessment results provide a
student growth percentile for each of these grades in both reading and math. High school
students are not tested consistently in these areas and therefore do not provide sufficient
data to determine if a correlation exists between student growth and mindset. Although
grades 4-5 do provide a student growth percentile, the concern of student understanding
of survey questions caused the researcher to focus the investigation on middle grades.
A selected group of teachers within each district also participated in the study.
Any reading, math, or special education teacher of student participants was asked to take
the same survey to assess their mindset in regards to their students’ learning. The desired
sample size was 200 student participants and 30 teacher participants; however, the actual
sample size was 145 students and 46 teachers.
Instruments
This study relied on two instruments. One instrument is the Kentucky
Performance Rating of Educational Performance (K-PREP). This reading and math
assessment, along with a few other core areas, is given to students in grades 3 through 8,
10 and 11 in the spring of each year. K-PREP has been utilized since 2011-2012 and
assesses proficiency on common core standards in reading and math (Simpson, 2012).

43
K-PREP also assesses other content areas, but that data was not used for this
investigation. Data used for this study will be from the 2014-2015 school year, released
to districts in October of 2015.
The other instrument used for this study is a survey designed by the researcher to
assess students’ and teachers’ mindset with regards to their learning in school. The
survey was adapted from Dweck’s online mindset survey (Dweck, 2006). Modifications
were made to the original survey to ensure valid results for the given population. The
scale was altered from a six-point Likert scale to a three-point Likert scale. Students in
middle school may struggle with deciphering between strongly agree and agree as well as
strongly disagree and disagree. Students selected agree, neutral, or disagree. The
number of questions was reduced to eliminate redundancy that may confuse the student
as well as to narrow the focus to reflect their beliefs about their personal learning in
school. The wording of the survey was also modified. Selected vocabulary better
reflects the developmental appropriateness based on the given sample.
Survey Validation
Prior to using the survey for this study, it was validated through a psychometric
evaluation process. A panel of eight experts from the field were given the survey and
asked to assess the relevance, appropriateness, and clarity of each item on the survey
using a Content Validity Index (CVI) method (see Appendices A and B). For each item,
they selected a response from a four-point Likert scale: (1) Not Relevant/Appropriate/
Clear, (2) Somewhat Relevant/Appropriate/Clear, (3) Quite Relevant/Appropriate/Clear,
or (4) Very Relevant/Appropriate/Clear. The CVI then describes the proportion of
experts in agreement (giving a rating of either 3 or 4), for each item. The items had an

44
average I-CVI = 1.00 for relevance, I-CVI = 0.99 for appropriateness, and I-CVI = 0.86
for clarity, which are all well above the suggested I-CVI = 0.78, which “could be
considered evidence of good content validity” (Polit, Beck, & Owen, 2007, p. 459);
however, the researcher revised the survey using the suggestions the experts provided to
increase clarity in conveying the intent of each question. After additional survey
modifications, a panel of eight experts again assessed the relevance, appropriateness and
clarity of each item. Three experts from the first round were among the eight experts that
assessed the modified survey to provide inter-rater reliability. After final modifications,
the items indicated an average I-CVI = 1.00 for relevance, appropriateness, and clarity.
Table 5 and Table 6 show the results of the survey evaluation related to clarity of the
items, which was the primary reason for the initial lower I-CVI and led to the final
changes in the survey (see Appendix C).
Table 5
Ratings on 8-Item Scale by 8 Experts; Items Rated 3 or 4 on 4-Point Clarity Scale for
Original Survey
Item TK* CB* BT* BH LW JP RS JB Experts in
Agreement Item
CVI 1 - 7 0.88 2 - - - - 4 1.00 3 - - 6 0.75 4 - - 6 0.75 5 - 7 0.88 6 - 7 0.88 7 - 7 0.88 8 - 7 0.88
Proportion
Relevant 0.75 1.00 0.88 0.00 0.88 1.00 1.00 0.88 Average CVI =
0.86

45
Table 6
Ratings on 8-Item Scale by 8 Experts; Items Rated 3 or 4 on 4-Point Clarity Scale for
Modified Final Survey
Item TK* CB* BT* KW KP BW RW KB Experts in
Agreement Item
CVI 1 8 1.00 2 8 1.00 3 8 1.00 4 8 1.00 5 8 1.00 6 8 1.00 7 8 1.00 8 8 1.00
Proportion
Relevant 1.00 1.00 1.00 1.00 1.00 1.00 1.00 1.00 Average CVI =
1.00
The final scale used for this study included eight items. Of the items, four were
positive statements and four were negatively worded, with their scores reversed to
provide a scaled mindset score.
Independent and Dependent Variables
There are several independent variables considered in this study. The control
variables are divided into personal and educational. The personal control variables
include gender, ethnicity, and socioeconomic status. Literature has established the fact
that student achievement is impacted by demographic factors. The two leading facets of
family influence that characterize American society include social class and race (Miller
& Moore, 2006). In this study, the researcher considered these variables due to their
evident contribution to student performance on high-stakes testing.
The educational control variables are grade level, disability, and least restrictive
environment. These factors also affect student performance on assessments and may
affect results of this study. Not all disabilities are equal in terms of needs and ability.

46
Some disability categories are strictly related to the cognitive capacity of students while
others are related to other causes not contingent upon cognition. Least restrictive
environment must be considered and determined by the ARC. The severity of the
disability and need for supports governs the student’s access to the general education
curriculum and to what extent they are educated with same age non-disabled peers.
Students with disabilities are also allowed reasonable accommodations according to their
IEP, provided the accommodations are used regularly in their instructional program
(Yell, Katsiyannis, Collins, & Losinski, 2012).
The other independent variable used in this study is students’ and teachers’
psychological orientation: their mindset. Much of Dweck’s research centers on the idea
that a student’s mindset is a primary factor in effort and persistence, and ultimately
achievement (Dweck, 2006). Along with students’ personal mindset, teachers’ mindset
also plays a role in student success. “Teachers’ expectations of students had a staggering
1.03 effect size on student achievement” (Jensen, 2013, p. 37).
The dependent variable examined in this study is the Student Growth Percentile
(SGP), measured by the Kentucky Performance Rating for Education Progress (K-PREP)
assessment. The SGP takes into consideration a student’s change in performance over
time compared to their academic peers. “The academic peers are students who perform
very similarly to the student on the test. The student is only compared to students who
start at the same place,” (KDE, 2014, slide 10). Students with a SGP of below 30 are
considered to have shown low growth. For those with a SGP of 30 to 65 are considered
to have shown expected growth, while those with a SGP above 65 is considered to have
shown high growth (KDE, 2016).

47
Procedures and Data Collection
The researcher requested the participation of eight districts within the Green River
Regional Educational Cooperative (GRREC) region. Upon initial consent from
superintendents from six of those districts, a full Institutional Review Board review was
approved. Each district selected a district contact person who would collect the necessary
data from students in their district to maintain confidentiality between districts and the
researcher.
Once the district contact person was selected, the researcher trained them using a
prepared training manual. The district contact then identified students and teachers who
were eligible to participate in the study and sought written parental consent and student
assent (see Appendices D). For those willing to participate, an identification number was
given to protect further personally identifiable information. The identification number
included the district’s three-digit number given by the state, followed by the school’s
three-digit number, then a 1 for students or a 2 for teachers, and finally a random three-
digit number selected by the district contact person. The identification numbers allowed
the researcher to disaggregate data by district, school, or student/teacher as needed. The
district contact then gathered socio-demographic data from the Kentucky School
Information System (KSIS), Infinite Campus, both raw score, performance rating and
growth percentile in reading and math, were also recorded in the spreadsheet.
After preliminary information was recorded, the district contact administered
mindset surveys to participants. Any accommodation indicated on a student’s Individual
Education Plan (IEP) was also provided for the completion of the survey. Surveys were

48
also administered to any reading, math, or special education teacher of any participating
student.
Data Analysis
All data collected by the district contact person were then returned to the
researcher for data analysis. Multiple linear regression is the most suitable method for
analyzing the given data to determine how growth or fixed mindsets predict and increase
or decrease on both reading and math SGP, controlling for socio-demographic variables.
An exploratory descriptive analysis provided means and standard deviations of each
variable. The researcher tested for multi-collinearity. The researcher initially used the
following regression model: (student growth) = β0 + β(fixed) + β(growth) +β(ethnicity) +
β(socio-economic) + β(gender) + β(grade) + β(LRE) + β(disability). Statistical
significance of each variable, as well as interactions among variables, was determined.
The p value of each variable was examined to determine whether a variable makes a
statistically significant contribution to the model. Residuals were studied to ensure
regression assumptions are met and to make sure p-values are accurate. A Pearson
Correlation was conducted to determine the relationship between student’s mindset and
the mindset of their teachers. This was conducted at the school level as opposed to an
individual level. All variables were coded, and dummy variables were applied to non-
dichotomous variables prior to running analyses.
Ethical Considerations
Due to the age of the participants, extra care was given to protect the students and
their personal data. A full board review was approved by Western Kentucky University’s
Institutional Review Board. Safeguards were in place to obtain appropriate both parental

49
consent and student assent, as well as to conceal student’s identity. A district contact
person from each participating district collected the data and assigned identification
numbers that corresponded between surveys and other student information. All those
involved in the data collection process signed a confidentiality agreement that declared
their guarantee to protect the confidentiality of all information including verbal
communication, written record or observations regarding any student or teacher
participating in the study.
The only known risk that this study posed was loss of instruction or activity for
the 5-15 minutes that the student was removed from class to take the survey. The district
contact, however, was trained and asked to administer the student during non-
instructional time if possible. There may also have been some psychological discomfort
in answering the survey questions.

50
CHAPTER IV: RESULTS
Both federal and state mandates support high quality education for students with
disabilities, urging districts to assist these students in meeting proficiency standards.
Many schools across the nation, despite efforts, have only seen modest growth in
achievement for this population. The increase in accountability for educators for this
sub-population has led to the implementation of a variety of strategies and the grasping of
any theory that claims to increase academic achievement for this group.
This study seeks to answer the question: To what extent does a growth mindset
relate to student growth among students with disabilities? Three empirical research
questions were analyzed to determine the relationship between disabilities, mindset, and
achievement.
1. For students with disabilities, to what extent does their mindset predict their
reading student growth percentile (SGP), controlling for socio-demographic
factors?
2. For students with disabilities, to what extent does their mindset predict their math
SGP, controlling for socio-demographic factors?
3. For students with disabilities, to what extent does their teacher’s mindset correlate
to their own mindset?
Scale Reliability
Prior to the study, the researcher addressed validity of the scale through a
psychometric evaluation process where a panel of experts reviewed and rated the scale,
which produced a Content Validity Index of 1.00 for relevance, appropriateness, and
clarity. A pilot study was not conducted to test for reliability due to time constraints.

51
However, the researcher used the responses of the 145 student participants to see if
similar scores across indicators by different people produced reliable results. The 3-point
Likert survey consisted of eight questions related to a single construct, mindset. Answers
for questions 2, 4, 6 and 8 were reversed prior to recording scores. Table 7 includes
reliability statistics for the survey used in this study. The Cronbach’s Alpha was 0.713,
which indicates an adequate correlation between survey items. Question 6 had the lowest
item mean at 1.87, but would not significantly change the Cronbach’s Alpha if deleted.
Table 7
Reliability Statistics
Cronbach's Alpha
Cronbach's Alpha Based on
Standardized Items N of items
0.713 0.71 8
Descriptive Statistics
There were 46 teacher participants involved in this study. Table 8 describes the
teacher participants according to socio-demographic variables. All teacher participants
teach grades 6th
-8th
. Teachers were selected to participate if they were a reading, math, or
special education teacher of any student participant. Teachers were not directly
associated with a particular student in the study because many of them taught several
student participants and student participants might have had more than one of the
surveyed teachers in a particular district.
There were 145 student participants. Any student in the six participating districts
that were eligible for special education services under the MMD, EBD, OHI, or SLD
categories in grades 6th
-8th
were asked to participate. Only those who had returned
parental consent and student assent were included in this study. Table 9 describes the

52
student participants in terms of socio-demographic factors. Due to confidentiality and
district policies, some districts were unable to obtain socio-economic status, which is why
data on only 65 students are reported for this variable.
Table 8
Descriptive Statistics of Socio-Demographic Variables for Teacher Participants
N Frequency (%)
District 46
District A
5 (10.9)
District B
5 (10.9)
District C
3 (6.5)
District D
18 (39.1)
District E
6 (13.0)
District F
9 (19.6)
Gender 46
Male
15 (32.6)
Female
31 (67.4)
Role 46
Regular Education Teacher
31 (67.4)
Special Education Teacher
15 (32.6)
Ethnicity 46
White 46 (100.0)
The survey produced scale scores from 8 to 24. Those scoring 20 or above were
considered to have a growth mindset. Those scoring in the range of 13-19 did not
demonstrate a clear mindset and were recorded as having a neutral mindset. Those
scoring 12 or below were considered to have a fixed mindset. Figure 1 shows the
variance in mindset among the student participants. Figure 2 shows the variance in
mindset among the teacher participants. There were 58 students and 34 teachers whose
survey indicated a growth mindset. There were 80 students and 12 teachers whose

53
survey indicated a neutral mindset. Only seven students and no teachers had a fixed
mindset based on the survey.
Table 9
Descriptive Statistics of Socio-Demographic Variables for Student Participants
N Frequency (%)
District 145
District A
16 (11.0)
District B
21 (14.5)
District C
25 (17.2)
District D
50 (34.5)
District E
14 (9.7)
District F
19 (13.1)
Gender 145
Male
90 (62.1)
Female
55 (37.9)
Grade 145
6th
54 (37.2)
7th
49 (33.8)
8th
42 (29.0)
Disability 145
MMD
42 (29.0)
EBD
11 (7.6)
OHI
37 (25.5)
SLD
55 (37.9)
Ethnicity 145
White
124 (85.5)
Black or African American
6 (4.1)
Hispanic/Latino
3 (2.1)
Two or more races
7 (4.8)
Native Hawaiian/Other Pacific Islander
5 (3.4)
Socioeconomic Status 65
Free/Reduced Lunch status
55 (86.2)
Paid Lunch status
9 (13.8)
LRE 145
>80% of day in general education programs
114 (78.6)
40-80% of day in general education programs
30 (20.7)
<40% of day in general education programs 1 (0.7)

54
Figure 1. Student participant’s mindset bar graph.
Figure 2. Teacher participant’s mindset bar graph.

55
Student growth percentile (SGP) is determined by the Kentucky Department of
Education Office of Assessment and Accountability based on students’ change in
performance and achievement in reading and in math over time compared to their
academic peers (KDE, 2014, slide 10). Those students with an SGP below 30 are
considered to have shown low growth. Students with an SGP of 30-65 are considered to
have shown expected growth, while those scoring above 65 showing high growth (KDE,
2016). Table 10 includes descriptive statistics about the student participants SGP in both
reading and math, reported by KDE with results from their 2015 spring testing scores.
Table 11 breaks down growth into three categories: low, expected and high.
Table 10
Descriptive Statistics for KPREP SGP in Reading and Math for Student Participants
N Minimum Maximum Mean Std Dev
Reading SGP 145 1 99 37.82 33.056
Math SGP 145 1 99 42.87 34.089
Table 11
Frequency of SGP Categories in Reading and Math (N = 145)
Reading Math
Student Growth Category Frequency Percent Frequency Percent
Low Growth 75 51.72 65 44.83
Expected Growth 30 20.69 30 20.69
High Growth 40 27.59 50 34.48
Research Question One
The first research question examined how the K-PREP Reading Student Growth
Percentile (SGP) of students with disabilities may be predicted by their mindset,
controlling for any significant socio-demographic factors. Due to a significant

56
correlation between disability and Least Restrictive Environment (LRE), the researcher
removed LRE prior to running the regression. Socio-economic status was also removed
due to the number of participants with missing data for this variable.
The first model, (Reading SGP) = β0 + β(mindset score) + β(gender) +
β(disability) + β(grade), resulted in an F statistic of 6.47, p < .001. The adjusted R
squared is .186, which signifies that the independent variables combined account for
18.6% variability in the student’s reading SGP. None of the socio-demographic variables
displayed statistical significance. When taking out the socio-demographic variables, the
equation then simply becomes (Reading SGP) = β0 + β(mindset score), with an F statistic
of 36.82, p < .001. The adjusted R squared is .199, which indicates 19.9% of the
variability in reading SGP is due to student mindset. Table 12 reports model summary
and Table 13 reports the coefficient values for this model.
Table 12
Model Summary for Reading SGP
Model R R Squared Adjusted R Squared
Std Error of the
Estimate
1 0.453a 0.205 0.199 29.581
a. Predictors: (Constant), Survey Score; b. Dependent Variable: SGPreading
Table 13
Regression Analysis Coefficients (Reading SGP)
B SE t p
95% Confidence
Interval VIF
(Constant) -47.52 14.28 -3.33 0.001 -75.72 -19.30
Survey
Score 4.62 0.76 6.07 0.000 3.13 6.15 1.00
a. Dependent Variable: SGPreading

57
Using this model, the residuals suggest slight non-normality, which may impact
the accuracy of the confidence intervals and p values. As Figures 3 and 4 indicate,
random error is not normally distributed, therefore possibly violating the underlying
assumptions. Efforts were made to transform the data, but non-normality still existed.
After running the regression and examining the residuals, the final model that best
predicts a student with disabilities’ reading SGP is represented by the equation (Reading
SGP) = -47.52 + 4.62 (mindset score). This equation predicts that for every 1 unit the
student’s mindset score increases, their Reading SGP increases by 4.62.
Figure 3. Histogram of residuals for reading SGP model.

58
Figure 4. Normal P-plot of regression standardized residuals for reading SGP model.
Research Question Two
The second research question examined how the K-PREP Math Student Growth
Percentile (SGP) of students with disabilities may be predicted by their mindset,
controlling for any significant socio-demographic factors. As with research question one,
due to a significant correlation between disability and Least Restrictive Environment
(LRE), the researcher removed LRE prior to running the regression. Socio-economic
status was also removed due to the number of participants with missing data for this
variable.
The second model, (Math SGP) = β0 + β(mindset score) + β(gender) +
β(disability) + β(grade), resulted in an F statistic of 8.39, p < .001. The adjusted R

59
squared is .235, which signifies that the independent variables combined account for
23.5% of the variability in the student’s math SGP. Again, none of the socio-
demographic variables displayed statistical significance and therefore were removed from
the equation. The equation then became (Math SGP) = β0 + β(mindset score), with an F
statistic of 41.5, p < .001. The adjusted R squared is .220, indicating 22% variability in
math SGP based on mindset score. Table 14 reports model summary and Table 15
reports the coefficient values for this model.
Table 14
Model Summary for Math SGP
Model R R Squared Adjusted R Squared
Std Error of the
Estimate
1 0.474a 0.225 0.22 30.114
a. Predictors: (Constant), Survey Score; b. Dependent Variable: SGPmath
Table 15
Regression Analysis Coefficients (Math SGP)
B SE t p
95% Confidence
Interval VIF
(Constant) -49.4 14.53 -3.4 0.001 -78.12 -20.67
Survey
Score 5.01 0.078 6.45 0.000 3.48 6.55 1.00
a. Dependent Variable: SGPmath
Using this model the residuals suggest slight non-normality, which may impact
the accuracy of the confidence intervals and p values. As Figures 5 and 6 indicate,
random error is not normally distributed, therefore possibly violating the underlying
assumptions. Efforts were made to transform the data, but non-normality still existed.

60
Figure 5. Histogram of residuals for math SGP model.
After running the regression and examining the residuals, the final model that best
predicts a student with disabilities’ math SGP is represented by the equation (Math SGP)
= -49.40 + 5.01 (mindset score). This equation predicts that for every 1 unit the student’s
mindset score increases, their Math SGP increases by 5.01.

61
Figure 6. Normal P-plot of regression standardized residuals for math SGP.
Research Question Three
The final research question seeks to determine if there is a correlation between
student’s mindset and that of their teachers. To determine if a correlation exists, a mean
score for each district per role was found, as seen in Table 16. Table 17 includes the
combined simple statistics.

62
Table 16
Mean Score for Participant’s Mindset by Role
District Student Mindset Mean Score Teacher Mindset Mean Score
A 19.375 19.600
B 17.667 21.600
C 18.800 21.000
D 18.620 21.111
E 18.214 21.000
F 17.474 21.667
Table 17
Simple Statistics
Variable N Mean Std Dev Sum Minimum Maximum
Student Mindset 6 18.358 0.718 110.150 17.474 19.375
Teacher Mindset 6 20.996 0.745 125.978 19.600 21.667
Correlational analyses were used to examine the relationship between student’s
mindset and the mindset of their teachers. Results indicated an inverse relationship
between the two variables of -0.897, as seen in Table 18.
Table 18
Pearson Correlation
Pearson Correlation Coefficients N = 6
Student Mindset Teacher Mindset
Student Mindset 1.000 -0.897
Teacher Mindset -0.897 1.000
Conclusion
The results of this study should be considered with caution based on the sample
size and the reliability of the scale used. Research question one indicated a small
predictive value of mindset score on students with disabilities SGP in reading. Research

63
question two also indicated a small predictive value of mindset score on students with
disabilities SGP in math. The third research question indicated a correlation of -0.897
between students’ mindset in relation to their teacher’s mindsets based on school level
analysis. Chapter 5 will further discuss these results along with implications, limitations
and recommendations for future studies.

64
CHAPTER V: CONCLUSIONS
The purpose of this research project was to determine if there was a relationship
between students’ with disabilities mindset and their academic growth from the previous
year. Much research exists to support that having a growth mindset positively affects
achievement (Dweck, 2006; Gregory & Kaufeldt, 2015; Jenson, 20015; Ricci, 2013).
The researcher wanted to determine if those claims were applicable to students with
disabilities as well. An eight-question survey sought to determine the mindset of both
students with specific disabilities in middle school and their teachers. The study was
conducted in six districts within the Green River Regional Educational Cooperative in
rural central Kentucky. Mindset scaled scores were then compared to student’s Student
Growth Percentile (SGP) in reading and math on the spring 2015 K-PREP assessment.
Results of Findings Related to Question One
For students with disabilities, to what extent does their mindset predict their reading
student growth percentile (SGP), controlling for socio-demographic factors?
The mean reading SGP for students was 37.82. Over 50% of students
demonstrated low growth, which is considered a SGP of 30 or below. A little over 27%
demonstrated high growth, a SGP of 65 or higher. A linear regression was performed to
determine the predictive value of a student’s mindset on their reading SGP. The final
model that best predicts a student with disabilities’ reading SGP is (Reading SGP) = -
47.52 + 4.62 (mindset score). This equation predicts that for every 1 unit the student’s
mindset score increases, their reading SGP increases by 4.62%. None of the
demographic variables indicated any significant effect on mindset score and therefore
they were not included in the final model.

65
These results are important because findings support the notion that if students
were to move from a fixed mindset (a score between 8 and 12) to a growth mindset (a
score between 20 and 24), they could theoretically expect to see an increase in reading
SGP between 37-74%, which automatically pushes them over into the expected growth
range.
Results of Findings Related to Question Two
For students with disabilities, to what extent does their mindset predict their math student
growth percentile (SGP), controlling for socio-demographic factors?
The mean math SGP for students was 42.87. Under 45% of students fell in the
low growth category in math, while 34% met high growth benchmarks in math. A linear
regression was performed to determine the predictive value of student’s mindset on their
math SGP. A final model that best predicts a student with disabilities’ math SGP is
(Math SGP) = -49.40 + 5.01 (mindset). This equation predicts that for every 1 unit the
student’s mindset score increases, their Math SGP increases by 5.01%. None of the
demographic variables indicated any significant effect on mindset score and therefore
they were not included in the final model.
These results are important because findings support the notion that if students
were to move from a fixed mindset (a score between 8 and 12) to a growth mindset (a
score between 20 and 24), they could theoretically expect to see an increase in math SGP
between 40-80%, which automatically pushes them over into the expected growth range.

66
Results of Findings Related to Question Three
For students with disabilities, to what extent does their teacher’s mindset correlate to
their own mindset?
Correlational analyses were used to examine the relationship between student’s
mindset and the mindset of their teachers. Results indicated an inverse relationship
between the two variables of -0.897. Due to the small sample size, it was not possible to
determine a student level correlation, and therefore a school level correlation was the best
attempt to answer this question. This finding would suggest that the teachers’ mindset in
a district does not directly correlate with the mindset of their students: however, findings
are inconclusive.
The validity of the teacher survey poses some concern. There were no teacher
surveys that indicated a fixed mindset among the 46 participants, which is highly
unlikely. When teachers are asked to self-report, they often have a tendency to determine
if there is a desired response and respond accordingly. This is one of the limitations of
this study.
Implications for Practice
Although findings found that student’s mindset indicated a small predictive value
in both their reading and math SGP, it is important to note that any growth can be
significant for students with disabilities. Any efforts that lead to academic growth and
achievement must be considered. Other research supports the notion that psychological
barriers exists and should be addressed in efforts to close achievement gaps (Sptizer &
Aronson, 2015).

67
Regional educational cooperatives and Districts could use the findings of this
study to support the need for additional professional development opportunities for
teachers regarding the use of psychological interventions to promote a growth mindset for
students with disabilities. Supports in how to imbed these interventions within the general
education curriculum will also need to be explored, but will not require as much time as
separate or stand-alone curricula.
Delimitations and Limitations of Study
Delimitations
Several delimitations and limitations of this exploratory study may have had an
effect its findings and the ability to generalize results to the larger population. The
delimitations of the study include the geographical representation of the participants,
sample method and procedures as well as the grade level. The context of the study was
bound within a small rural geographical region of Kentucky to make data collection
manageable for the researcher. Students sampled from other districts outside of the
GRREC region may have different results. A cluster sampling method was also used
with the participating districts.
In regards to the ecological validity, limitations based on context, a potential
threat would be the novelty or disruption effect, where a change in routine or being asked
to do something new or different may affect student response (McMillan & Schumacher,
2005). The surveys were conducted by each District Contact person that was responsible
for collecting the data and administering the surveys, which may be someone with whom
the students were not familiar with, nor part of their normal day.

68
The final delimitation was the grade levels used in the study. The researcher was
limited to grades four through eight because they were the only grades that had K-PREP
Student Growth Percentile data provided by the Kentucky Department of Education. Due
to the language of the survey, the researcher only included those in grades six through
eight. Considering their disabilities, some of these students may not have fully
understood the wording or intent of the questions asked in the survey and therefore their
answers may not reflect their actual mindset.
Limitations
The limitations of this study include the reliability of the survey results, the small
sample size, the lack of ethnic diversity in participants, and the inability to get student
level data to answer research question three. The reliability statistics for the survey used
indicated a Cronbach’s Alpha of .713, which denotes an adequate correlation between
survey items. Less than 7% of student participants had a fixed mindset and 0% of teacher
participants had a fixed mindset, which is not consistent with current research. Over half
of the student participants did not have a clear mindset. While the instrument was
determined valid in terms of content, clarity, and relevance, the reliability of the survey
poses a threat to the findings.
The researcher sought to include 200 student participants in this study, yet only
145 students were eligible to participate within the six participating districts. Parental
consent was required for students to participate. Letters were mailed home to students
that qualified based on grade and disability specifications. Response rates significantly
limited the number of actual participants compared to the number of those that qualified
to participate.

69
The ethnic diversity of participants was also limited. Almost 90% of the student
participants were white, and 100% of teacher participants were white. These statistics
made it difficult to include ethnicity in the regression since there were so few students
representing other ethnic groups. These numbers are not representative of the diversity
among students with disabilities in Kentucky schools. A larger sample size may have
provided more ethnic diversity, allowing the researcher to determine the predictive value
of ethnicity on mindset and SGPs.
As mentioned earlier in this chapter, the intent of research question three was to
determine the effect of teacher’s mindset on the mindset of the students with disabilities.
The results were limited to school level data rather than individual level data. The data
collection process provided data for 46 teachers within the six districts. Because of
district practices, some schools had teachers that only taught one grade level and one
subject, where other districts had teachers who taught multiple grade levels or multiple
subjects. This limited the researcher’s ability to correlate teacher’s mindset with student’s
mindset.
Recommendations for Future Research
Several recommendations for future research can be established from the results
of this study. This study focused on determining if a relationship between mindset and
student growth could be found. A future study could use a different instrument to
determine mindset to see if a different instrument provides more reliability and different
results. Future research should also consider the reliability of the student growth
percentiles that are determined by Kentucky Department of Education’s Office of
Assessment and Accountability.

70
Additional research should replicate this study with a larger sample size
throughout the state of Kentucky and even possibly on a national level. This would likely
provide a more diverse sample, allowing for a closer look at how the socio-demographic
variables affect the final regression models this study presented. While this study was
unable to associate any significance of gender, ethnicity, grade, socio-economic status on
either mindset or SGP, a larger sample may provide a more accurate regression model.
It would also be advantageous to consider a similar study using students at other
grade ranges, to include those in elementary and high school. The results could then be
studied to determine if contextual variables, such as the delivery type of instruction,
impacts mindset as well. The instruments used for this study may not be appropriate for
these other grade ranges, yet other instruments, which would likely have to be created,
could assess mindset and academic growth over time.
A qualitative study of phenomenological design could explore student perception
of mindset considering their disability. Through use of student interviews, data could be
collected to describe students’ with disabilities experiences and beliefs about their own
ability to achieve. This study would seek to better understand the personal connection
between students in special education, identify why they have a certain mindset, and how
that mindset affects their performance. A qualitative study would also seek to build
rapport with teacher participants in a way that encourages open and honest conversations
about beliefs and practices. This quantitative study indicated that zero teacher
participants had a fixed mindset, while that is likely not the case. Conversations need to
take place in order for teachers to understand the value in their beliefs and practices in the
classroom. While still looking to determine the effects of mindset on student growth, this

71
type of follow-up may provide more insightful analysis and an opportunity to address
some of the nuances of this quantitative study via the ability to talk to students as oppose
to a simple survey.
An additional qualitative study that may provide valuable information to the field
would be an observational study of successful teachers and what they are doing to move
students forward. Observational data could determine mindset based on practices and
how those practices either push students forward or hold them back.
Conclusion
Over the years, significant efforts have been made to close the achievement gap
for students with disabilities and their non-disabled peers. A host of legislation has
changed the landscape of education for these students attending public schools across the
nation. This study supports the premise that a student’s mindset does affect their
academic achievement and student growth over time. Districts would benefit from
implementing psychological interventions to help promote growth mindsets.
The Every Student Succeeds Act (2015) will continue to press towards a
commitment to provide students with disabilities a quality education and hold schools
accountable for student outcomes. It would be advantageous of districts to make every
effort to support these students and their individual academic growth. Psychological
interventions may prove to be an effective way to help break down the barriers that are
often overlooked. An intentional attempt to move students with disabilities forward will
not only benefit our schools, but also benefit our nation.

72
REFERENCES
Allred, S., Draut, K., Ellis, A., & Liguori, B. (2014). Student Growth and the
Professional Growth and Effectiveness System [PowerPoint slides]. Kentucky
Department of Education. Retrieved from http://education.ky.gov/
AA/Assessments/Pages/K-PREP.aspx.
Anderson, S., Medrich, E., & Fowler, D. (2007). Which achievement gaps? Phi Delta
Kappan, 88(7), 547-550.
Aron, L., & Loprest, P. (2012). Disability and the education system. The Future of
Children, 22(1), 97-122.
Baldridge, M. C. (2010). The effects of a growth mindset intervention on the beliefs about
intelligence, effort beliefs, achievement goal orientations, and academic self-
efficacy of LD students with reading difficulties (Doctoral dissertation). Retrieved
from ProQuest. (UMI 3446399)
Bandura, A. (1986). Social foundations of thought and action: A social cognitive theory.
Englewood Cliffs, NJ: Prentice-Hall.
Bateman, D., Bright, K., O’Shea, D., O'Shea, L., & Algozzine, B. (2007). The special
education program administrator’s handbook. Boston, MA: Pearson Education.
Bong, M., & Skaalvik, E. (2003). Academic self-concept and self-efficacy: How different
are they really? Educational Psychology Review, 15(1), 1-40.
Blackwell, L., Trzesniewski, K., & Dweck, C. (2007). Implicit theories of intelligence
predict achievement across adolescent transition: A longitudinal study and an
intervention. Child Development, 78(1), 246-263.
Brown v. Board of Education of Topeka, Kansas, 347 U.S. 483 (1954).

73
Buschkuehl, M., & Jaeggi, S. (2010). Improving intelligence: A literature review. Swiss
Med Wkly, 140, 266-272.
Cain, K., & Dweck, C. (1995). The relation between motivational patterns and
achievement cognitions through the elementary school years. Merrill-Palmer
Quarterly, 41(1), 25-52.
Carroll, A., Houghton, S., Wood, R., Unsworth, K., Hattie, J., Gordon, L., & Bower, J.
(2009). Self-efficacy and academic achievement in Australian high school
students: The mediating effects of academic aspirations and delinquency. Journal
of Adolescence, 32, 797-817.
Carter, H. (2012). Institutionalization of caring in an era of accountability: Creating a
supportive environment for at-risk students’ retention in high school and access to
college. The New Educator, 8(2), 177-193. doi:10.1080/1547688X.2012.670568
Coomer, L. F. (2015). Definitions and criteria used by state education departments for
identifying specific learning disabilities (Master’s Thesis). Retrieved from
http://digitalcommons.wku.edu/theses/1515
Danielson, C. (2011). Framework for teaching. Retrieved from
http://education.ky.gov/teachers/PGES/TPGES/Documents/Kentucky%20Framew
ork%20for%20Teaching.pdf.
Darling-Hammond, L. (2010). The flat world and education: How America’s commitment
to equity will determine our future. New York, NY: Teachers College Press.
Darrow, A. A. (2016). The Every Student Succeeds Act (ESSA). General Music Today,
30(1), 41-44.

74
“Data Display: Kentucky.” (2013). Retrieved from http://www2.ed.gov/fund/data/report/
idea/partbspap /2013/ky-acc-stateprofile-11-12.pdf
Dessemontet, R., Bless, G., & Morin, D. (2012). Effects of inclusion on the academic
achievement and adaptive behavior of children with intellectual disabilities.
Journal of Intellectual Disability Research, 56(6), 579-587.
Dweck, C., & Leggett, E., (1988). A social-cognitive approach to motivation and
personality. Psychological Review, 95(2), 256-273.
Dweck, C. S. (2000). Self-theories: Their role in motivation, personality, and
development. New York, NY: Routledge.
Dweck, C. S. (2006). Mindset: The new psychology of success. New York, NY: Random
House.
Dweck, C. (2008). Can personality be changed?: The role of beliefs in personality and
change. Current Directions in Psychological Science, 17(6), 391-394.
Eaton, K., Salmon, S., & Wischnowski, M. (2004). Evaluating co-teaching as a means for
successful inclusion of students with disabilities in a rural district. Rural Special
Education Quarterly, 23(3), 3-23.
Every Student Succeeds Act, PL 114-95 (2015).
Faulkner, S. A., & Cook, C. M. (2006). Testing vs. teaching: The perceived impact of
assessment demands on middle grades instructional practices. Research in Middle
Level Education Online, 29(7), 1-13.
Gregory, G., & Kaufeldt, M. (2015). The motivated brain: Improving student attention,
engagement, and perseverance. Alexandria, VA: ASCD.

75
Growe, R., & Montgomery, P. S., (2003). Education equity in America: Is education the
great equalizer? The Professional Educator, 15(2), 23-29.
Grubb, W. N., & Lazerson, M. (2007). The education gospel: The economic power of
schooling. Cambridge, MA: Harvard University Press.
Gutshall, C. A. (2013). Teachers’ mindsets for students with and without disabilities.
Psychology in the Schools, 50(10), 1073-1083.
Hansford, B. C., & Hattie, J. A. (1982). The relationship between self and
achievement/performance measures. Review of Educational Research, 52(1), 123-
142.
Hatchett, D. Y. (2010). The impact of school culture, teacher job satisfaction, and student
attendance rates on academic achievement of middle school students (Doctoral
dissertation). Retrieved from TopScholar. Western Kentucky University. Bowling
Green, KY.
Hattie, J. (2009). Visible learning: A synthesis of over 800 meta-analyses relating to
achievement. Thousand Oaks, CA: Corwin.
Hout, M., Elliot, S., & Frueh, S. (2012). Do high-stakes tests improve learning? Issues in
Science & Technology, 29(1), 33-38.
Individuals with Disabilities Education Act Amendments of 1997, PL 105-117.
Individuals with Disabilities Education Act Amendments of 2004, PL 108-446.
Jensen, E. (2005). Teaching with the brain in mind. Alexandria, VA: ASCD.
Jensen, E. (2013). Engaging students with poverty in mind: Practical strategies for
raising achievement. Alexandria, VA: ASCD.

76
Johnston, P. H. (2011). Response to intervention in literacy: Problems and possibilities.
The Elementary School Journal, 111(4), 511-534.
Kauffman, J., McGee, K., & Brigham, M. (2004). Enabling or disabling? Observations
on changes in special education. Phi Delta Kappan, 85(8), 613-620.
Kentucky Administrative Regulation. (2007). 707 KAR 1:002.
Kentucky Department of Education. (n.d.). Kentucky School Report Card [Data File].
Retrieved from http://applications.education.ky.gov/src/
AccountabilityByDistrict.aspx
Kentucky Department of Education. (2012). Unbridled Learning Accountability Model.
Office of Assessment and Accountability.
Kentucky Department of Education. (2013). Kentucky education facts. Retrieved from
http://education.ky.gov/comm/edfacts/Pages/default.aspx
Kentucky Department of Education. (2014). Assessment/Accountability. Retrieved from
http://education.ky.gov/AA/Acct/Pages/default.aspx on October 10, 2016
Kentucky Department of Education. (2016). Median Student Growth Percentiles
(MSGP): The state’s contribution to student growth. Retrieved from
http://education.ky.gov/teachers/PGES/TPGES/Pages/TPGES-Student-Growth-
Percentile-Medians.aspx.
Kentucky Department of Education (2017). Professional Growth and Effectiveness
System (PGES). Retrieved from
http://education.ky.gov/teachers/PGES/Pages/PGES.aspx.
Keogh, B. K. (2007). Celebrating PL 94-142: The education of all handicapped children
act of 1975. Issues in Teacher Education, 16(2), 65-69.

77
Kurth, J., Morningstar, M., & Kozleski, E. (2014). The persistence of highly restrictive
special education placements for students with low-incidence disabilities.
Research and Practice for Persons with Severe Disabilities, 39(3), 227-239.
Lackaye, T., & Margalit, M. (2006). Comparisons of achievement, effort, and self-
perceptions among students with learning disabilities and their peers from
different achievement groups. Journal of Learning Disabilities, 39(5), 432-446.
Legislative Research Commission. (2011). Appropriate identification and service of
students with disabilities: Special education eligibility, funding, and personnel
training (Research Report No. 393). Frankfort, KY: Office of Education
Accountability.
Lewis, L. (2003). Will education reform create more opportunity? Society, 40(5), 57-61.
Lile, B. (2012). Perceptions of Kentucky educators concerning the Kentucky state
assessment system as an accurate reflection of student learning (Doctoral
dissertation). Retrieved from TopScholar. Western Kentucky University. Bowling
Green, KY.
Marx, T. A., Hart, J. L., Nelson, L., Love, J., Baxter, C. M., Gartin, B., Whitby, P. J.
(2014). Guiding IEP teams on meeting the least restrictive environment mandate.
Intervention in School and Clinic, 50(1), 45-50.
McMillan, J. H., & Schumacher, S. (2005). Research in education: Evidence based
inquiry (6th
ed.). Boston: MA: Allyn & Bacon.
Miller, G. (2013). Understanding John Hattie’s visible learning research in the context of
Carol Dweck’s growth mindset (Training notes). Retrieved from
http://growthmindseteza.org/ files/hattie_Dweck_2012.doc

78
Miller, S., & Moore, B. (2006). Whither race? Demographic and grade level influences
on reading assessment in a desegregated metropolitan district. Unpublished
manuscript.
Montt, G. (2011). Cross-national differences in educational achievement inequality.
Sociology of Education, 84(1), 49-68. doi:10.1177/0038040710392717
National Center on Excellence in Education. (1983). A nation at risk: The Imperative for
educational reform. Washington, DC: Government Printing Office.
National Down Syndrome Congress. (2016). Every Student Succeeds Act: Frequently
asked questions and IEP tips. Roswell, GA: Author.
No Child Left Behind Act of 2002, PL 107-110, 115 Stat. 1425.
Obiakor, F. E., Harris, M., Mutua, K., Rotatori, A, & Algozzine, B. (2012). Making
inclusion work in the general education classroom. Education & Treatment of
Children, 35(3), 477-490.
Osterholm, K., Nash, W., & Kritsonis, W. (2007). Effects of labeling students “learning
disabled”: Emergent themes in the research literature 1970 through 2000. Focus
on Colleges, Universities, and Schools, 1(1), 1-11.
Polit, D., Beck, C., & Owen, S. (2007). Is the CVI an acceptable indicator of content
validity? Appraisal and recommendations. Research in Nursing & Health, 30,
459-467.
Protzko, J., Aronson, J., & Blair, C. (2013). How to make a younger child smarter:
Evidence from the database of raising intelligence. Perspectives on Psychological
Science, 8(1), 25-40.
Rehabilitation Act of 1973, PL 93-112.

79
Ricci, M. C. (2013). Mindsets in the classroom; Building a culture of success and student
achievement in schools. Waco, TX: Prufrock Press.
Roach, V. (1995). Supporting inclusion: Beyond the rhetoric. Phi Delta Kappan, 77(4),
295-299.
Schulte, A. C., Villwock, D. N., Whichard, S. M., & Stallings, C. F. (2001). High stakes
testing and expected progress standards for students with learning disabilities: A
five-year study of one district. School of Psychology Review, 30, 487-506.
Schwartz, J. M., & Begley, S. (2002). The mind & the brain: Neuroplasticity and the
power of mental force. New York, NY: Harper Perennial.
Sherman, D., Fuchs, D., & Fuchs, L. (1996). A historical perspective on special education
reform. Theory Into Practice, 35(1), 12-19.
Simpson, R. (2012). The relationship between reading and mathematics achievement of
students with disabilities and least restrictive environment practices in Kentucky
(Doctoral dissertation). Retrieved from TopScholar. Western Kentucky
University. Bowling Green, KY.
Smith, T. (2005). IDEA 2004: Another round in the reauthorization process. Remedial &
Special Education, 26(6), 314-319.
Spitzer, B., & Aronson, J. (2015). Minding and mending the gap: Social psychological
interventions to reduce educational disparities. British Journal of Educational
Psychology, 85, 1-18.
Teal, C. (2013). Individuals with Disabilities Education Act: Public school application of
providing FAPE in the least restrictive environment (Doctoral dissertation).
Retrieved from ProQuest.

80
The White House. (2015). Fact sheet: Congress acts to fix No Child Left Behind. The
Office of the Press Secretary.
Traylor, N. R. (2013). The implications of accountability models weighing the same
student data differently (Doctoral Dissertation). Eastern Kentucky University.
U.S. Department of Education. (2010). Thirty-five years of progress in educating
children with disabilities through IDEA.
U.S. Department of Education. (2013). Promoting grit, tenacity, and perseverance:
Critical factors for success in the 21st century.
VanMeter, B. M. (2005). Reading achievement: The impact of America’s choice in
Kentucky schools (Doctoral Dissertation). University of Louisville.
Walberg, H. J., & Tsai, S. L. (1983). ‘Matthew’ effects in education. American
Educational Research Journal, 20(3), 359-373.
Wehmeyer, M. L., Shogren, K. A., Palmer, S. B., Williams-Diehm, K. L., Little, T. D.,
Boulton, A. (2012). The impact of the self-determined learning model of
instruction on student self-determination. Exceptional Children, 78(2), 135-153.
Weiner, B. (1972). Attribution theory, achievement motivation, and the educational
process. Review of Educational Research, 42(2), 203-215.
Wright, P. (2004). Overview, explanation and comparison; IDEA 2004 v. IDEA 97.
Retrieved from http://www.wrightslaw.com/idea/idea.2004.all.pdf
Willis, C. (2011). High-stakes testing and the moral decisions of leaders. Journal of
Cases in Educational Leadership, 14(4), 47-53.

81
Wolters, C. A., Fan, W., & Daugherty, S. G. (2013). Examining achievement goals and
causal attributions together as predictors of academic functioning. Journal of
Experimental Education, 81, 295-321.
Yeager, D., Johnson, R., Spitzer, B., Trzesniewski, K., Powers, J., & Dweck, C. (2014).
The far-reaching effects of believing people can change: Implicit theories of
personality shape stress, health, and achievement during adolescence. Journal of
Personality and Social Psychology, 106(6), 867-884.
Yeager, D., & Walton, G. (2011). Social-psychological interventions in education:
They’re not magic. Review of Educational Research, 81(2), 267-301.
Yeager, D., Walton, G., & Cohen, G. (2013). Addressing achievement gaps with
psychological interventions. The Phi Delta Kappan, 94(5), 62-65.
Yell, M., Katsiyannis, A., Collins, J., & Losinski, M. (2012). Exit exams, high-stakes
testing, and students with disabilities: A persistent challenge. Hammill Institute on
Disabilities, 48(1), 60-64.
Zierer, K. (2015). Educational expertise: the concept of ‘mind frames’ as an integrative
model for professionalization in teaching. Oxford Review of Education, 41(6),
782-798.
Zigmond, N., Kloo, A., & Volonino, V., (2009). What, where, and how? Special
education in the climate of full inclusion. Exceptionality, 17(4), 189-204.
Zirkel, P. A. (2013). Is it time for elevating the standard for FAPE under IDEA?
Exceptional Children, 79(4), 497-508.

82
Appendix A: Content Validity Index Evaluation for Student & Teacher Mindset Surveys
Your Name (Please Print) Your Signature Today’s Date
Part 1 Instructions: Please read the items below and separately rate each across the following dimensions: ● Relevance: The degree to which a particular item is relevant as a description of the content domain
of mindset. ● Appropriateness: The degree to which a particular item at the appropriate reading or comprehension
level for a 6th
-8th
grade student with a mild mental disability, emotional behavior disability, other health impairment, or specific learning disability. (Note: Items will be read to students requiring reading accommodations).
● Clarity: The degree to which a particular item is clear in its message (i.e., the reader would understand how to respond to the item).
RELEVANCE APPROPRIATENESS CLARITY
Instrument Items
Please rate each instrument item on the following scale:
1 = Not Relevant 2 = Somewhat
Relevant 3 = Quite Relevant 4 = Very Relevant
Please rate each instrument item on the following scale:
1 = Not Appropriate 2 = Somewhat Appropriate
3 = Quite Appropriate 4 = Very Appropriate
Please rate each instrument item on the following scale:
1 = Not Clear 2 = Somewhat
Clear 3 = Quite Clear 4 = Very Clear
1. I believe that I am capable of learning. 1 2 3 4 1 2 3 4 1 2 3 4
2. I believe that no matter how hard I try, I just can’t achieve mastery.
1 2 3 4 1 2 3 4 1 2 3 4
3. I believe that I can change how smart I am.
1 2 3 4 1 2 3 4 1 2 3 4
4. I believe I can learn new things, but I cannot really change how smart I am.
1 2 3 4 1 2 3 4 1 2 3 4
5. I believe that mistakes are an important part of my learning.
1 2 3 4 1 2 3 4 1 2 3 4
6. I believe that if I am really good at something, it must be a natural talent.
1 2 3 4 1 2 3 4 1 2 3 4
7. I believe that with practice and effort I can change my basic level of talent.
1 2 3 4 1 2 3 4 1 2 3 4
8. I believe that I have a certain amount of intelligence, and there isn’t much I can do to change that.
1 2 3 4 1 2 3 4 1 2 3 4
Part 2 Instructions: In the space below, for any item that you rated low (1 or 2) in appropriateness or clarity, please suggest wording changes that might improve the quality of the item. (If you have differing wording suggestion for students or teachers, please so indicate.)

83
Appendix B: Student Survey
Student ID Number:______________________________ Date: ___________________
The following questions relate to your thinking regarding your learning in school. Please respond by marking ‘1’ for Disagree, ‘2’ for Neutral (I don’t have an opinion one way or another), or ‘3’ for Agree. There is no right or wrong answer – your first reaction will be the most accurate.
Rating D N A
1. I believe that I am capable of learning. 1 2 3
2. I believe that no matter how hard I try, I just can’t achieve mastery.
1 2 3
3. I believe that I can change how smart I am. 1 2 3
4. I believe I can learn new things, but I cannot really change how smart I am.
1 2 3
5. I believe that mistakes are an important part of my learning.
1 2 3
6. I believe that if I am really good at something, it must be a natural talent.
1 2 3
7. I believe that with practice and effort I can change my basic level of talent.
1 2 3
8. I believe that I have a certain amount of intelligence, and there isn’t much I can do to change that.
1 2 3

84
Appendix C: Teacher Survey
Teacher ID Number:______________________________ Date: ___________________ The following questions relate to your thinking regarding your student’s learning in school. Please respond by marking ‘1’ for Disagree, ‘2’ for Neutral, or ‘3’ for Agree. There is no right or wrong answer – your first reaction will be the most accurate.
Rating D N A
1. I believe that my students are capable of learning. 1 2 3
2. I believe that no matter how hard my students try, some just cannot achieve mastery.
1 2 3
3. I believe that my students can change how smart they are.
1 2 3
4. I believe my students can learn new things, but they cannot really change how smart they are.
1 2 3
5. I believe that mistakes are an important part of my student’s learning.
1 2 3
6. I believe that if my students are really good at something, it must be a natural talent.
1 2 3
7. I believe that with practice and effort my students can change their basic level of talent.
1 2 3
8. I believe that my students have a certain amount of intelligence, and there isn’t much they can do to change that.
1 2 3

85
Appendix D: IRB Approval Letter

86
Appendix E: Informed Consent Forms
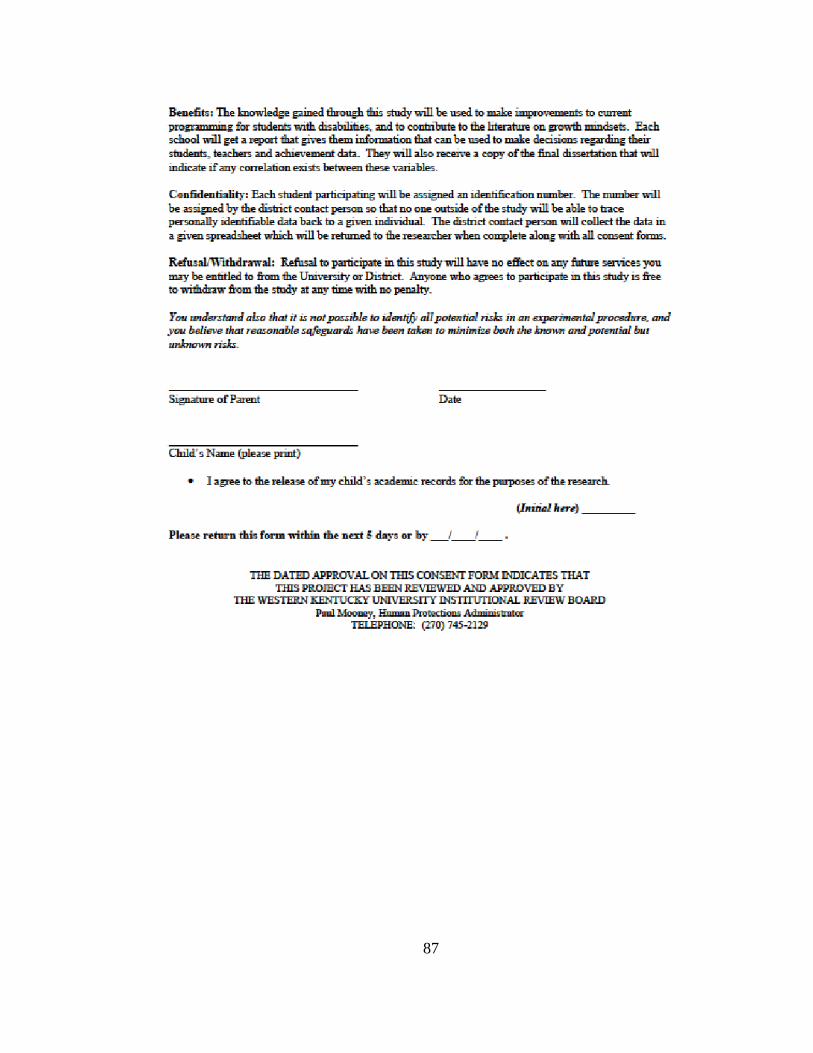
87

88

89

90

91

92