Embed Size (px)
Citation preview

RESEARCH BRIEF JUNE 2016
The Educational Attainment of Chicago Public Schools Students2015: A Focus on Four-Year College Degrees
Jenny Nagaoka and Kaleen Healey

This report was produced by UChicago Consortium’s publications and communications staff: Bronwyn McDaniel, Director for Outreach and Communication; and Jessica Puller, Communications Specialist.
Graphic Design: Jeff Hall Design Photography: Lloyd DeGraneEditing: Jessica Puller
06.2016/pdf/[email protected]
ACKNOWLEDGEMENTS
The authors gratefully acknowledge the many people who contributed to this brief. The content of this brief was shaped by valuable feedback provided by Forefront’s College and Career Access, Persistence, and Success Group and the To&Through advisory board. UChicago Consortium Steering Committee members Catherine Deutsch, Eric Skalinder, Brian Spittle, and Amy Treadwell offered very thoughtful reviews as we finalized the narrative. We are grateful for the technical support and data expertise provided by Thomas Kelley-Kemple and Valerie Michelman. We thank the members of UChicago Consortium’s research review group and Holly Hart, David Johnson, and Alex Seeskin for their helpful feedback. UChicago Consortium’s communications team, including Bronwyn McDaniel and Jessica Puller, were instrumental in the production of this brief. We also thank Melissa Roderick and UChicago Consortium’s post-secondary research team for providing the research base that guides this brief.
This work was supported by the Crown Family Philanthropies and the Bill and Melinda Gates Foundation. We thank them for their support and collaboration with this project. We are also grateful for the operating grants from the Spencer Foundation and the Lewis-Sebring Family Foundation that support the work of UChicago Consortium.
To&Through Project aims to provide educators, families, and policymakers with the actionable research, data, and training they need to increase the number of students who make it to and through college. The project seeks to make Chicago the Attainment City—a place where every ninth-grader who wants to goes on to earn a college degree. More information is available at toandthrough.uchicago.edu
Cite as: Nagaoka, J., & Healey, K. (2016). The educational attainment of Chicago Public Schools students: 2015: A focus on four-year college degrees. Chicago, IL: University of Chicago Consortium on School Research.

UCHICAGO Consortium Research Brief | The Educational Attainment of Chicago Public Schools Students
1
The Educational Attainment of Chicago Public Schools Students
IntroductionThe Chicago Public Schools’ (CPS) vision is that every
student graduates from high school prepared for success
in college, career, and life.1 To help the city reach that
goal, the To&Through Project is providing data that
track the progress of students in Chicago and identify
where students are falling off the path to college degree
attainment. This report provides a summary of the
current state of the educational attainment of CPS stu-
dents, updating the numbers released in the 2014 brief,
The Educational Attainment of Chicago Public School
Students.2 It provides the big picture of what is happen-
ing in the district as context for a series of reports that
provide information on individual high schools. The
school-level reports—one summarizing attainment rates
and preparation levels3 and the other on college enroll-
ment4—will be released later in 2016.5
2015 Bachelor’s Degree Attainment IndexAs of 2015, we estimate that 18 percent of CPS ninth-
graders will obtain a four-year-college degree within
10 years of starting high school (the Bachelor’s Degree
Attainment Index or Bachelor’s DAI; see Table 1), com-
pared to an estimate of 17 percent in the 2014 brief. We
estimate 16 percent of students will take the straight-
forward path of graduating high school in four years,
enrolling immediately in a four-year college, and earning
a four-year college degree within six years of starting
college (the Direct Bachelor’s Degree Attainment Index
or Direct Bachelor’s DAI). The University of Chicago
Consortium on School Research (UChicago Consortium)
developed these two metrics to estimate students’ pro-
gression to and through college. The Bachelor’s DAI is
a better estimate of the total proportion of CPS ninth-
graders who will earn a four-year degree within 10 years
of beginning high school because it accounts for students
who first enroll in a community college or delay entry
into college before earning a four-year degree.6
The Bachelor’s DAI is not substantially higher than
the Direct Bachelor’s DAI because few CPS graduates
who delay college entry or first enroll in a two-year col-
lege go on to earn a four-year degree. When we examine
CPS students’ outcomes six years after graduating high
school, just 8 percent of students who immediately en-
rolled in a two-year college and just 4 percent of students
who did not immediately enroll in college have earned
a four-year college degree, compared to 50 percent of
students who enrolled in a four-year college immediately
after high school graduation.7 The National Student
Clearinghouse (NSC) found that, nationally, 9 percent
of students who begin at a public two-year college before
age 20 attain a four-year degree within six years, slightly
higher than the rate for CPS graduates.8 There are likely
many differences between students with these different
college enrollment patterns, and not all students may
have intended to earn a four-year degree. However, given
that 76 percent of CPS seniors plan to attain a four-year
college degree, many students are taking a path with a
low probability of reaching their aspirations.
1 Chicago Public Schools 2013-18 Action Plan (2013).2 Healey, Nagaoka, & Michelman (2014).3 UChicago Consortium (2016).4 Kelley-Kemple & Moeller (2016). 5 The school-level reports will be available at toandthrough.
uchicago.edu. 6 Details on how the Bachelor’s DAI is calculated are provided
in the online appendix at: http://consortium.uchicago.edu/publications/educational-attainment-chicago-public-schools-students-2015-focus-four-year-college.
7 In this report, we allow students six years from high school graduation to earn a bachelor’s degree. This allows us to make comparisons to national college graduation rates, which are typically six-year rates. If we allowed students a longer time period to earn a degree, the graduation rates would increase. In 2015, the Current Population Survey estimated that 36 percent of 25- to 29-year-olds had a four-year degree or higher (National Center for Education Statistics, 2015b).
8 Shapiro, Dundar, Wakhungu, Yuan, Nathan, & Hwang (2016).

UCHICAGO Consortium Research Brief | The Educational Attainment of Chicago Public Schools Students
2
Nationally, the most comparable data available
suggest that the Direct Bachelor’s DAI increased from
18 percent in 2013 to 22 percent in 2015 for public high
school students across the country. We are unable to
calculate a national Bachelor’s DAI because comparable
data on bachelor’s degree completion rates for students
who delay college entry are not available.
The 2015 CPS Direct Bachelor’s DAI is 6 percentage
points behind the nation, but the district serves a much
more disadvantaged population. The gap in the Direct
Bachelor’s DAI occurs primarily because of differences
between CPS and national high school and college gradu-
ation rates. Specifically, the CPS high school graduation
rate is 8 percentage points lower than the national rate
(74 percent for CPS versus 82 percent for the nation), and
the four-year college graduation rate for CPS graduates
who enroll in a four-year college is 10 percentage points
lower than the national rate (50 percent for CPS versus 60
percent for the nation). The four-year college enrollment
rate among CPS graduates (42 percent) is only 2 percent-
age points lower than the national rate (44 percent).
Key MilestonesImprovements in the proportion of ninth-graders who
are estimated to earn a four-year college degree could
occur because of improvements in any of the three key
milestones along the way: High school graduation,
four-year college enrollment, and college graduation.
High School Graduation. It is rare for students who do
not complete high school to eventually obtain a four-year
college degree; improving high school graduation rates
is the first step toward improving college degree attain-
ment rates. High school graduation rates have improved
considerably in Chicago, and this is one reason the Direct
Bachelor’s DAI has improved. The 2015 CPS four-year
high school graduation rate is 74 percent.10 This repre-
sents an increase of 17 percentage points since 2006 (see
Figure 1).11 Nationally, the public high school graduation
rate increased from 73 percent in 2006 to 82 percent in
2014.12 For low-income students nationally, the 2014
high school graduation rate was 75 percent.13 So while
high school graduation rates have been increasing across
9 The numbers provided in this brief may differ from other publicly available sources; an explanation of the rates used in this brief is available online at: http://consortium.uchicago.edu/publications/educational-attainment-chicago-public-schools-students-2015-focus-four-year-college.
10 The high school graduation rate calculated by UChicago Consortium differs from that produced by CPS. For an explanation of the reasons for the differences see: http://consortium.uchicago.edu/publications/educational-attain-ment-chicago-public-schools-students-2015-focus-four-year-college.
11 See Allensworth, Healey, Gwynne, & Crespin (2016) for an analysis of the factors that account for the increases in high school graduation rates.
12 The methodology changes between 2010 and 2011 (previously averaged freshman graduation rate, now adjusted cohort graduation rate). Both rates are available for 2011-2013; the cohort rate is 1 percentage point lower than the averaged freshman graduation rate in those years. National Center for Education Statistics (2016a); National Center for Education Statistics (2016b).
13 National Center for Education Statistics (2016a).
TABLE 1
Educational Attainment Milestones in Chicago with National Comparisons9
High School Graduation Rate
Four-Year College Enrollment Rate
Four-Year College Graduation Rate (six- year rate)
Direct Bachelor’s
Degree Attainment
Index
Bachelor’s Degree
Attainment Index
2015 CPS
Index
74% (2015 HS graduates)
X
42% (2014 HS graduates)
X
50% (2008 college
enrollees)
=
16% (2015)
18% (2015)
2015 U.S.
Index
82% (2014 HS graduates)
X
44% (2014 HS graduates)
X
60% (2008 college
enrollees)
=
22% (2015)
Not Available
Note: The most recent data available for each rate is shown.

UCHICAGO Consortium Research Brief | The Educational Attainment of Chicago Public Schools Students
3
the country, CPS has been outpacing the improvements
observed nationally and its current rate is similar to the
national rate for low-income students.
It is likely that CPS graduation rates will continue to im-
prove for the next several years. The CPS freshman on-track
rate provides a good estimate of the graduation rate three
years later,14 and rising high school graduation rates have
been keeping pace with increases in freshman on-track. The
2015 freshman on-track rate is 85 percent, therefore, we
anticipate the high school graduation rate will continue to
rise in the coming years.
The increases in high school graduation rates have
not come at the expense of academic achievement; CPS
graduates in recent years have higher achievement
than graduates in prior years. The average ACT score
increased from 17.6 for the class of 2006 to 18.5 for the
class of 2014. This increase occurred while nearly 5,800
additional students were taking the ACT because more
students stayed in school until the spring of their junior
year. The proportion of graduates scoring at least a 21
on the ACT also increased from 23 percent in 2006 to 30
percent in 2014. There has also been an increase in the
proportion of graduates earning a 3.0 GPA or better, from
21 percent in 2006 to 29 percent in 2014. However, the
changes in GPA should be interpreted with some caution,
as course grades are not available for students enrolled
in charter schools, who now constitute 17 percent of CPS
graduates. The ACT scores, however, are available for all
students, including charter school students.
College Enrollment. The 2014 four-year college enroll-
ment rate among CPS high school graduates is 42 per-
cent. As shown in Figure 2, this is up from 33 percent
in 2006. In addition, 20 percent of 2014 CPS gradu-
ates enrolled in a two-year college, bringing the 2014
combined college enrollment rate to 62 percent. The
national college enrollment rate has remained relative-
ly constant during this time period, and was 44 per-
cent for four-year colleges and 68 percent for two- and
four-year colleges combined in 2014.15 For low-income
students, the national two-year and four-year combined
college enrollment rate increased by seven percentage
Year of High School Graduation
57%
Fo
ur-
Yea
r H
igh
Sch
oo
l Gra
du
atio
n R
ate
90
100
80
70
40
20
0
60
30
10
50
2006 201520142007 2008 2009 2010 2011 2012 2013
FIGURE 1
The 2015 Four-Year High School Graduation Rate for CPS is 74 Percent—an Increase of 17 Percentage Points Since 2006
59% 59% 61% 61% 65% 67%70% 73%
73% 74% 75% 76% 78% 79% 80% 81% 82%
74%
CPS Nation
High School Graduation Rates, for CPS and the Nation
14 Allensworth & Easton (2005). 15 The national college enrollment rates include GED recipients in
the denominator (the CPS rates only include graduates of regular high schools). National Center for Education Statistics (2015d).
Year of High School Graduation
33%
Fo
ur-
Yea
r C
olle
ge
En
rollm
ent
Rat
e 90
100
80
70
40
20
0
60
30
10
50
2006 20142007 2008 2009 2010 2011 2012 2013
FIGURE 2
The 2014 Four-Year College Enrollment Rate for CPS is Slightly Lower Than the National Rate
36% 36% 37% 38% 41%
39%
38%
42%41% 43% 41% 42% 41% 42% 44%
40% 42%
CPS Nation
Enrollment Rates at Four-Year Colleges Among High School Graduates, CPS and the Nation
UCHICAGO Consortium Research Brief | The Educational Attainment of Chicago Public Schools Students
4
points between 2006 and 2014 (from 51 percent to 58
percent).16 The 2014 CPS four-year college enrollment
rate is 2 percentage points lower than the 2014 national
rate and its two- and four-year college enrollment rate
is 4 percentage points higher than the national rate
for low-income students. Because the CPS high school
graduation rate has also increased during this time, the
increase in the four-year college enrollment rate trans-
lates into nearly 3,500 more CPS graduates enrolling in
2014, compared to 2006.
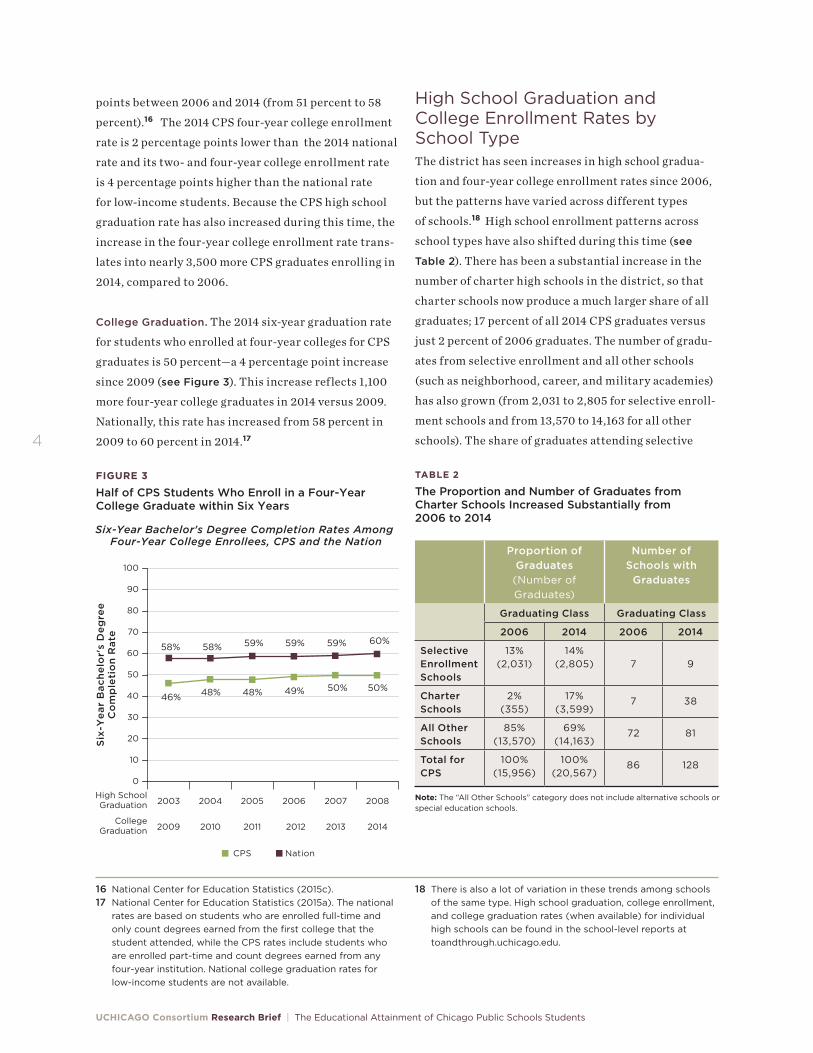
College Graduation. The 2014 six-year graduation rate
for students who enrolled at four-year colleges for CPS
graduates is 50 percent—a 4 percentage point increase
since 2009 (see Figure 3). This increase reflects 1,100
more four-year college graduates in 2014 versus 2009.
Nationally, this rate has increased from 58 percent in
2009 to 60 percent in 2014.17
46%
Six
-Yea
r B
ach
elo
r's
Deg
ree
Co
mp
leti
on
Rat
e
90
100
80
70
40
20
0
60
30
10
50
2003 20082004 2005 2006 2007
FIGURE 3
Half of CPS Students Who Enroll in a Four-Year College Graduate within Six Years
48% 48% 49% 50% 50%
58% 58% 59% 59% 59% 60%
CPS Nation
Six-Year Bachelor's Degree Completion Rates Among Four-Year College Enrollees, CPS and the Nation
High SchoolGraduation
2009 20142010 2011 2012 2013College
Graduation
High School Graduation and College Enrollment Rates by School TypeThe district has seen increases in high school gradua-
tion and four-year college enrollment rates since 2006,
but the patterns have varied across different types
of schools.18 High school enrollment patterns across
school types have also shifted during this time (see
Table 2). There has been a substantial increase in the
number of charter high schools in the district, so that
charter schools now produce a much larger share of all
graduates; 17 percent of all 2014 CPS graduates versus
just 2 percent of 2006 graduates. The number of gradu-
ates from selective enrollment and all other schools
(such as neighborhood, career, and military academies)
has also grown (from 2,031 to 2,805 for selective enroll-
ment schools and from 13,570 to 14,163 for all other
schools). The share of graduates attending selective
16 National Center for Education Statistics (2015c).17 National Center for Education Statistics (2015a). The national
rates are based on students who are enrolled full-time and only count degrees earned from the first college that the student attended, while the CPS rates include students who are enrolled part-time and count degrees earned from any four-year institution. National college graduation rates for low-income students are not available.
18 There is also a lot of variation in these trends among schools of the same type. High school graduation, college enrollment, and college graduation rates (when available) for individual high schools can be found in the school-level reports at toandthrough.uchicago.edu.
TABLE 2
The Proportion and Number of Graduates from Charter Schools Increased Substantially from 2006 to 2014
Proportion of Graduates (Number of Graduates)
Number of Schools with
Graduates
Graduating Class Graduating Class
2006 2014 2006 2014
Selective Enrollment Schools
13% (2,031)
14% (2,805)
7
9
Charter Schools
2% (355)
17% (3,599)
7 38
All Other Schools
85% (13,570)
69% (14,163)
72 81
Total for CPS
100% (15,956)
100% (20,567)
86 128
Note: The “All Other Schools” category does not include alternative schools or special education schools.

UCHICAGO Consortium Research Brief | The Educational Attainment of Chicago Public Schools Students
5
enrollment schools is about the same because these
increases have kept pace with the increase in the overall
number of graduates. Because the size of graduating
classes in charter schools has increased so much, non-
charter, non-selective enrollment high school graduates
now constitute a much smaller share of CPS graduates
(from 85 percent in 2006 to 69 percent in 2014) even
though there were nearly 600 more graduates of these
schools in 2014 than in 2006.19
The largest increase in high school graduation rates
has been among non-charter, non-selective enrollment
schools (such as neighborhood, career, and military
academies). Selective enrollment and charter schools
have seen modest increases in their high school gradua-
tion rates (see Figure 4). For a number of years, charter
high schools had higher graduation rates than other
non-selective enrollment schools, but that gap has closed
over time. In 2014, the graduation rates at non-charter,
19 The characteristics, especially prior achievement, of CPS students who attend selective enrollment schools (which require students to meet test score cut offs to be eligible to apply) differ from students who attend charter schools (which are open enrollment and must use a lottery if they
are over-subscribed) and non-selective, non-charter schools (some of which have selection criteria but many of which accept all students who apply). Two forthcoming Consortium reports examine these differences.
Year of High School Graduation
53%
Fo
ur-
Yea
r H
igh
Sch
oo
l Gra
du
atio
n R
ate
90
100
80
70
40
20
0
60
30
10
50
2006 201520142007 2008 2009 2010 2011 2012 2013
FIGURE 4
The High School Graduation Rates at Non-Charter, Non-Selective Enrollment Schools Have Caught up to Charter Schools
55% 56% 57% 58% 60%64%
67%71%
90% 89%92% 92% 91% 90% 92% 92% 93% 94%
71%64% 65% 63%
71%66%
72%68% 70% 71% 71%
Selective Enrollment Charter All Other Schools
Consortium Four-Year High School Graduation Rates Among First-Time Ninth-Graders, by School Type
Note: The “All Other Schools” category does not include alternative schools or special education schools.
non-selective enrollment schools caught up to charter
schools so that both have high school graduation rates
of 71 percent.
The pattern in four-year college enrollment is dif-
ferent; selective enrollment and charter schools have
seen larger increases than other schools. The four-year
college enrollment rate for selective enrollment gradu-
ates increased from 68 percent in 2006 to 78 percent in
2014 (see Figure 5). Among charter school graduates,
the rate increased from a low of 43 percent in 2009 to 57
percent in 2014. The four-year college enrollment rates
of all other schools have hovered around 31 percent for
a number of years. However, with the increases in high
school graduation rate in these schools, the relatively
flat college enrollment rate represents an increase of
750 additional graduates of non-selective enrollment,
non-charter schools enrolling in four-year colleges in
2014, compared to 2006.
Year of High School Graduation
28%
Fo
ur-
Yea
r C
olle
ge
En
rollm
ent
Rat
e 90
100
80
70
40
20
0
60
30
10
50
2006 20142007 2008 2009 2010 2011 2012 2013
FIGURE 5
The Four-Year College Enrollment Rate of Charter School Graduates Continues to Exceed That of Non-Charter, Non-Selective Enrollment School Graduates
29% 30% 31% 31% 33% 31% 31%
68% 68%72% 71%
74% 74% 75%77% 78%
32%
50% 50%43%
48%43%
52% 54% 55% 57%
Selective Enrollment Charter All Other Schools
Enrollment Rates at Four-Year Colleges Among High School Graduates, by School Type
Note: The “All Other Schools” category does not include alternative schools or special education schools.

UCHICAGO Consortium Research Brief | The Educational Attainment of Chicago Public Schools Students
6
The number of charter school graduates who have
had the time to graduate from a four-year college is
small since many charter schools did not open until the
late 2000s and it takes four years to have a graduating
class and an additional six years to have college gradu-
ation outcomes for that class. Therefore, we do not dis-
play four-year college graduation rates by school type.
ConclusionThe improvements in the key milestones in educational
attainment by CPS students are encouraging and repre-
sent real progress in the life outcomes of thousands of
young people in Chicago. The trends across school types
suggest that creating a dialogue among selective enroll-
ment, charter, and other high schools may be productive
for increasing the educational attainment of students
at all types of schools. However, in CPS and across the
country, the percentage of ninth-graders that are esti-
mated to attain a four-year college degree remains low.
The efforts to improve educational attainment cannot
be accomplished by K-12 systems alone; community
partners and higher education also have a critical role
to play in seeing real changes in educational attainment
in Chicago.

UCHICAGO Consortium Research Brief | The Educational Attainment of Chicago Public Schools Students
7
References
Allensworth, E., & Easton, J.Q. (2005). The on-track indicator as a predictor of high school gradu-ation. Chicago, IL: University of Chicago Consortium on Chicago School Research.
Allensworth, E.M., Healey, K., Gwynne, J.A., & Crespin, R. (2016)High school graduation rates through two decades of district change: The influence of policies, data records, and demographic shifts. Chicago, IL: University of Chicago Consortium on School Research.
Chicago Public Schools. (2013). The next generation: Chicago’s children. Chicago, IL: Chicago Public Schools. Retrieved from: http://cps.edu/pages/actionplan.aspx
Healey, K., Nagaoka, J., & Michelman, V. (2014). The educational attainment of Chicago Public Schools stu-dents. Chicago, IL: University of Chicago Consortium on Chicago School Research.
Kelley-Kemple, T., & Moeller, E. (2016). Enrolling in college. Chicago, IL: University of Chicago Consortium on School Research.
National Center for Education Statistics. (2015a).Graduation rate from first institution attended for first-time, full-time bachelor’s degree-seeking students at 4-year postsecondary institutions, by race/ethnicity, time to completion, sex, control of institution, and acceptance rate: Selected cohort entry years, 1996 through 2008 [data file]. U.S. Department of Education. Washington, DC: National Center for Education Statistics. Retrieved from https://nces.ed.gov/programs/digest/d15/tables/dt15_326.10.asp
National Center for Education Statistics. (2015b). Percentage of persons 25 through 29 years old with se-lected levels of educational attainment, by race/ethnicity and sex: Selected years, 1920 through 2015 [data file]. U.S. Department of Education. Washington, DC: National Center for Education Statistics. Retrieved from http://nces.ed.gov/programs/digest/d15/tables/dt15_104.20.asp
National Center for Education Statistics. (2015c). Percentage of recent high school completers enrolled in 2-year and 4-year colleges, by income level: 1975 through 2014 [data file]. U.S. Department of Education. Washington, DC: National Center for Education Statistics. Retrieved from http://nces.ed.gov/programs/digest/d15/tables/dt15_302.30.asp
National Center for Education Statistics. (2015d). Recent high school completers and their enrollment in 2-year and 4-year colleges, by sex: 1960 through 2014 [data file]. U.S. Department of Education. Washington, DC: National Center for Education Statistics. Retrieved from http://nces.ed.gov/programs/digest/d15/tables/dt15_302.10.asp
National Center for Education Statistics. (2016a). Public high school 4-year adjusted cohort graduation rate (ACGR), by selected student characteristics and state: 2010-11 through 2013-14 [data file]. U.S. Department of Education. Washington, DC: National Center for Education Statistics. Retrieved from http://nces.ed.gov/programs/digest/d15/tables/dt15_219.46.asp
National Center for Education Statistics. (2016b). Public high school averaged freshman graduation rate (AFGR), by state or jurisdiction: Selected years, 1990-91 through 2012-13 [data file]. U.S. Department of Education. Washington, DC: National Center for Education Statistics. Retrieved from http://nces.ed.gov/programs/digest/d15/tables/dt15_219.35.asp
Shapiro, D., Dundar, A., Wakhungu, P., Yuan, X., Nathan, A. & Hwang, Y.A. (2016). Completing college: A state-level view of student attainment rates (Signature Report No. 10a). Herndon, VA: National Student Clearinghouse Research Center.
University of Chicago Consortium on School Research. (2016). The educational attainment of [School] students. Chicago, IL: University of Chicago Consortium on School Research.

8
JENNY NAGAOKA is the Deputy Director of UChicago Consortium, where she has conducted research for the past 15 years. Her research interests focus on urban edu-cation reform, particularly using data to connect research and practice and examining the school environments and instructional practices that promote college readiness and success. She has co-authored numerous journal articles and reports, including studies of college readiness, noncognitive factors, the transition from high school to post-secondary education, authentic intellectual instruction, and Chicago’s initiative to end social promotion. Nagaoka received her BA
from Macalester College and her master’s of public policy degree from the Irving B. Harris School of Public Policy at the University of Chicago.
KALEEN HEALEY is a Research Scientist at UChicago Consortium. Her projects span teacher effectiveness, pre-school attendance, and a series of school- and district-level data reports on student outcomes. Her research interests include instructional improvement and the use of data in elementary schools. She holds a PhD in human develop ment and social policy from Northwestern University.
This report reflects the interpretation of the authors. Although UChicago Consortium’s Steering Committee provided technical advice, no formal endorsement by these individuals, organizations, or the full Consortium should be assumed.
ABOUT THE AUTHORS

BRIAN SPITTLECo-Chair DePaul University
KIM ZALENTCo-Chair Business and Professional People for the Public Interest
Ex-Officio Members
SARA RAY STOELINGAUrban Education Institute
Institutional Members
ELIZABETH KIRBYChicago Public Schools
KAREN G.J. LEWISChicago Teachers Union
ALAN MATHERChicago Public Schools
STACY NORRISChicago Public Schools
Individual Members
VERONICA ANDERSON Penultimate Group
SUSAN ADLER YANUNLogan Square Neighborhood Association
CATHERINE DEUTSCHIllinois Network of Charter Schools
RAQUEL FARMER-HINTONUniversity of Wisconsin, Milwaukee
KIRABO JACKSONNorthwestern University
CHRIS JONESStephen T. Mather High School
DENNIS LACEWELLUrban Prep Charter Academy for Young Men
LILA LEFFUmoja Student Development Corporation
LUISIANA MELÉNDEZErikson Institute
CRISTINA PACIONE-ZAYASErikson Institute
BEATRIZ PONCE DE LEÓNGeneration All
PAIGE PONDEROne Million Degrees
ERIC SKALINDERThomas Kelly High School
TONY SMITHIllinois State Board of Education
LUIS R. SORIAChicago Public Schools
KATHLEEN ST. LOUIS CALIENTOSpark, Chicago
MATTHEW STAGNERMathematica Policy Research
AMY TREADWELLChicago New Teacher Center
DirectorsELAINE M. ALLENSWORTHLewis-Sebring Director
STACY B. EHRLICHManaging Director
JULIA A. GWYNNEManaging Director
HOLLY HARTSurvey Director
KYLIE KLEINDirector of Research Operations
BRONWYN MCDANIELDirector for Outreach and Communication
JENNY NAGAOKADeputy Director
MELISSA RODERICKSenior DirectorHermon Dunlap Smith ProfessorSchool of Social Service Administration
PENNY BENDER SEBRINGCo-Founder
MARISA DE LA TORREDirector for Internal Research Capacity
Steering Committee
1313 East 60th Street
Chicago, Illinois 60637
@UChiConsortiumconsortium.uchicago.edu
T 773-702-3364
F 773-702-2010
OUR MISSION The University of Chicago Consortium on School Research (UChicago Consortium) conducts research of high technical quality that can inform and assess policy and practice in the Chicago Public Schools. We seek to expand communication among researchers, policymakers, and practitioners as we support the search for solutions to the problems of school reform. The UChicago Consortium encourages the use of research in policy action and improvement of practice, but does not argue for particular policies or programs. Rather, we help to build capacity for school reform by identifying what matters for student success and school improvement, creating critical indicators to chart progress, and conducting theory-driven evaluation to identify how programs and policies are working.