Embed Size (px)
Citation preview

The Education of Children in California who Live in Group
Homes : Just How Bad is it and What Should be Done?
Nina Van Dyke, Ph.D.

● Julie
● Jessica

● Number of youth in foster care in U.S.: >500,000 (Weinberg et al. 2001)
● Number of youth in foster care in California: >100,000 (Morena 2001)
● Number of youth in California who live in group homes: 18,500
● Number of group homes in California: 1,634

Group Homes
● Also called Licensed Childrens Institutions (LCIs)
● Residential facilities● Licensed by the State● Six or more youth● Mostly dependents or wards● Mostly higher level of care

How Youth End up in Group Homes
● Placed by Child Welfare Services (abuse or neglect) -- “dependents”
● Placed by probation (violated a law); alternative to juvenile hall -- “wards”
● Placed by an expanded IEP team (severely emotionally disturbed)

Outcomes for Foster Youth
● 37% had not finished high school● 39% were unemployed● 27% males, 10% females incarcerated 1+
times● 39% receiving public assistance● (study of former foster youth 12-18 months
after emancipation; Courtney & Piliavin, 1998)

This Study (March, 2003)
● 15 months; $1(U.S.) million● Goal: provide a detailed road map for
improving educational services AND address issues of finance
● Report:– 1. Fiscal analysis– 2. Existing system– 3. Implementation of this system– 4. Data analysis– 5. Recommendations

Methodology
● Fiscal arrangements– finance committee
● Policies and procedures -- State– interviews– document reviews– stakeholder committee
● Policies and procedures -- Counties– interviews– document reviews– focus groups– youth placement profiles

Problem Areas
● 1. Fiscal arrangement● 2. Capacity● 3. Accountability and responsibility● 4. Records and information transfer● 5. Interagency relationships● 6. Advocacy

100% NPS Reimbursement Formula
● School districts reimbursed 100% for extra costs of special ed services if:– (a) served in an NPS, AND
● (1) placed in LCI or FFH● (2) by a non-education agency● (3) parents ed rights removed, OR
– (b) placement outside school district in which parents live; NOT
– (c) if placed out of state

Youth Placement Profiles
● Track educational and residential history back one year
● Sample: 308 youth ages 12-18; eight counties
● Three field workers● 2-5 youth per home, randomly selected● Information from caseworkers/probation
officers, schools, residences, youth● About 45 minutes/youth/source

Authority
● Educational records: Agent of the State● Residential records and youth interviews:
standing court orders from youth's county of adjudication

Obstacles
● Judges delayed/refused to issue order● Group homes still wouldn't let us in● Social workers/probation officers would not
return repeated phone calls● Mental health placements: parental consent
and lawyer's consent● Missing data● Interviewee couldn't provide information

Data Collection Indicators
Type of Data Collection Instrument Number of YouthYouth Interview 51Current group home personnel interview 169
Current school personnel interview 185Current caseworkerPO interview 142
CWS-CMS/Probation database 137
120Total respondent sample 191Total initial sample 308
Current group home personnel, school personnel, and caseworker/PO personnel interviews

Age of Youth in Sample
12 13 14 15 16 17 18 19 20 21 22 230
5
10
15
20
25
30
35
Source: YouthSource: Caseworker/PO

Gender of Youth in Sample(Source: Caseworker/PO interviews)
75%
24%
1%
MaleFemaleDon't know/Missing

Race/Ethnicity of Youth in Sample
(Sources: Caseworker/PO interviews; 2000 Census, based on 1999-00 K-12 enrolment)
Whit
e (n
ot L
atino
)
Black (
not L
atino
)
Latin
o
Asian/
Pacific
Islan
der
Amer
ican
India
n/ A
laska
n Nat
iveOth
er
Blank
0
5
10
15
20
25
30
35
40
45
% Youth in Sample% CA K-12 Pop

Agency Responsible for Youth in Sample
Source: Caseworkers/POs Source: Group HomesAgency No. of youth % of youth No. of youth % of youthSocial Services 78 54% 91 55%Probation 55 39% 65 38%Mental Health 3 2% 2 1%COE/MH 0 0% 0 0%Private 1 1% 6 4%DDS 4 3% 4 2%Other 0 0% 1 0%Missing 1 1% 0 0%Total 142 100% 169 100%

Do Parents Maintain Educational Rights?
(Source: Caseworkers/POs)
No. of Youth % of YouthYes 84 59%No 37 26%Don't Know 21 15%Total 142 100%

Demographics of Youth in Sample
● About 16 years old● Mostly boys● Overrepresentation of Blacks;
underrepresentation of Latinos● Placed by Social Services or Probation● For 15% of the youth, caseworker/PO
doesn't know if parents maintain ed rights

Frequencies and Annual Costs of Services for Youth in
Sample (based on current residential and education placements)
(Source: current group homes and schools)
Are Youth in Sample Receiving Service?
Category of Service Yes % Yes No DK/Missing Data Avg. Annual CostGroup Home 169 100% 0 0 $61,216NPS Tuition 67 36% 118 0 $23,630Public School - Reg Ed 18 10% 167 0 $6,473Public School - Spcl Ed 13 7% 172 0 $24,390Intensive Day Tx Services 17 10% 120 32 $24,000Day Rehab Services 7 4% 131 31 $35,640Mental Health Services 45 27% 94 30 $10,639Medication Support 31 18% 102 36 $1,489Crisis Intervention 7 4% 128 34 $61,927TBSs 6 4% 129 34 $2,042Other 52 (didn't ask)

Numbers of Youth in Sample Who Receive Mental Health Services
(Source: Group Homes)
Number of Services Received No. of Youth % of Youth0 49 29%1 59 34%2 21 12%3 13 8%4 6 4%5 or more 1 1%Don't Know 20 12%Total 169 100%

Spending on Youth: Examples
● Levon– lives in a group home– attends an NPS– receives the following services: intensive day Tx,
med support, crisis intervention, TBS– avg annual cost: $152,704
● Jose– lives in a group home– attends regular ed classes in a regular pub
school– receives mental health services– avg annual cost: $78,328

How Academic Progress Previous Semester Documented
(Source: Schools)
No. of Youth % of YouthLetter Grade 150 81%Pass/Fail 1 1%Check/Check+ 0 0%Written Evaluation 5 3%Other 6 3%Don't Know 23 12%Total 185 100%

Grade Point Average (GPA)(Source: Schools)
No. of Youth Mean GPAGPA listed in records 54 2.4GPA calculated from individ grades 71 2.73Don't Know 25Total 150 2.59

Enroled Credits Earned (Prior Semester)Source: Schools Source: Youth
% Credits Earned No. of youth % of youth No. of youth % of youth0% 4 5% 2 13%1%-20% 0 0% 2 13%21%-40% 5 6% 0 0%41%-60% 7 8% 0 0%61%-80% 2 2% 3 20%81%-99% 5 6% 8 54%100% 60 73% 0 0%Total 83 100% 15 100%

Educational Outcomes
● No one has any idea how a lot of these youth are doing
● Most of the youth who did not receive letter grades are in special ed
● The youth for whom we do have educational information are falling behind

Number of Days Missed Between Educational Placements
(over prior 12 months)(Source: Schools)
0 Days 1-5 Days 6-10 Days 11-15 Days 16-30 Days 31-60 Days 61-371 Days
0 - Never Changed Schools
0
20
40
60
80
100
120
Number of Days Missed
Nu
mb
er
of Y
ou
th

Number of Days Youth Resided at Current Group Home Before Enroled in School
0 Days 1-5 Days 6-10 Days
11-15 Days
16-30 Days
31-60 Days
61+ Days Still not enroled
Summer when
placed
DK/Dates Missing
0
20
40
60
80
100
120
140
Group Home
Youth
Number of Days Missed
Nu
mb
er
of Y
ou
th

Reasons Youth Missed School(Source: Current Group Homes)
Reason No. of Youth % YouthHealth 2 11%Expelled/Suspended 3 16%Unable to Enrol 13 68%Other 1 5%Total 19 100%

Amount of School Missed
● Significant numbers of youth have missed several days or more of school over the past year when they changed schools/homes
● Youth say they missed more● Regular public schools put up roadblocks to
enroling these youth

Number of Educational Placements Over Past 12 Months
(Source: Schools)
1 2 3 4 5 6 7 80
20
40
60
80
100
120
Number of Placements
Nu
mb
er
of Y
ou
th

Number of Educational Placements Over Past 12 Months According to Youth
1 2 3 4 5 or More Don't Know0
2
4
6
8
10
12
14
16
18
20
Number of Placements
Nu
mb
er
of Y
ou
th

Length of Time Spent at Any Given School(Source: Schools)
Less than 2 months 2-4 months 4-6 months More than 6 months0
5
10
15
20
25
30
35
Duration
Nu
mb
er
of S
tays

Educational Itinerancy
● Youth frequently change schools● Youth report more changes than do schools● Schools report only 56% attended same
school over past 12 months; youth report only 37%
● Twenty per cent of schools and 41% of youth report attending three or more schools over past year
● Youth rarely stay at one school for long

Changed School Mid-Semester Because of Residential Change
(Over Youth's Time in Foster Care)(Source: Youth)
69%
31%
YesNo

Number of Mid-Semester Moves(Over Youth's Time in Foster Care)
(Source: Youth)
0 1 2-4 5-10 More than 10 Don't Know0
2
4
6
8
10
12
14
16
18
Number of Moves
Nu
mb
er
of Y
ou
th

Number of Residential Placements Over Past 12 Months
1 2 3 4 5 or more Don't Know0
0.1
0.2
0.3
0.4
0.5
0.6
0.7
Source: Gp HomeSource: Youth
Number of Placements
Pe
rce
nt o
f Yo
uth
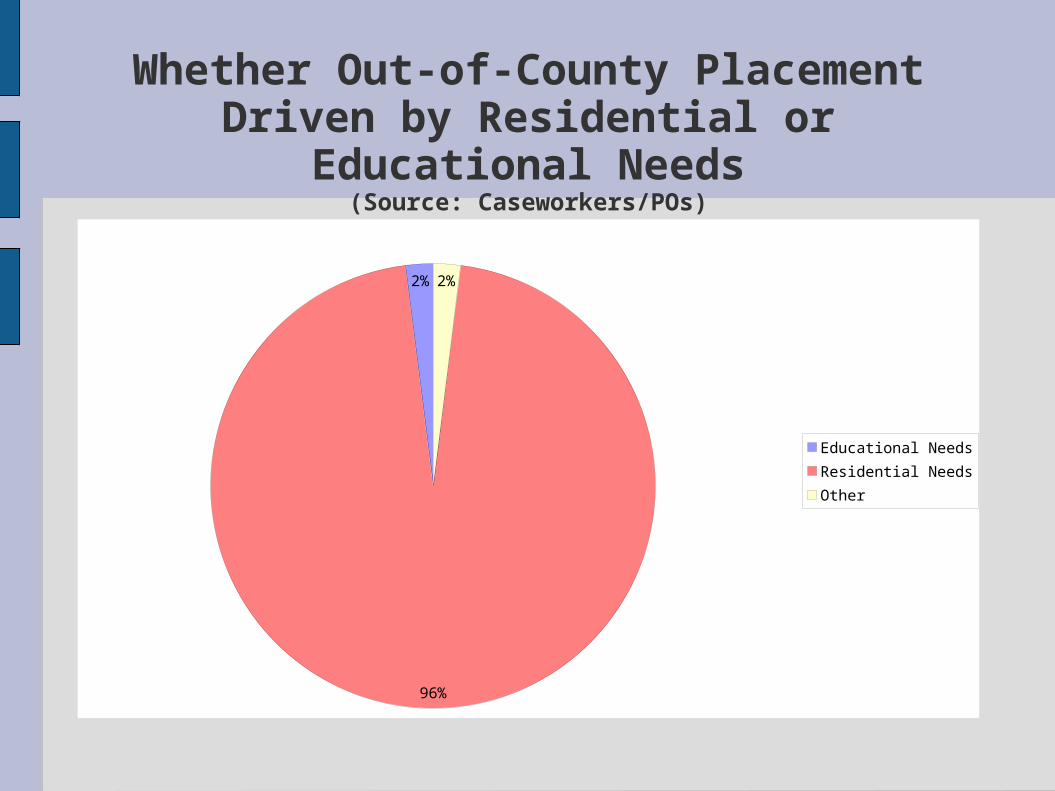
Whether Out-of-County Placement Driven by Residential or Educational Needs
(Source: Caseworkers/POs)
2%
96%
2%
Educational NeedsResidential NeedsOther

Reason for Termination of Educational Placement
(Source: Caseworkers/POs)
Reason for Termination No. of Terminations % of TerminationsExpelled 2 2%Suspended 3 3%Change in residential placement 87 80%Entered junior highschool 1 1%Entered high school 1 1%Graduated 1 1%School requested change in placement 0 0%
1 1%
0 0%IEP status change 1 1%Don't know 3 3%Other 8 7%Total 108 100%
School placement deemed inappropriate by legan guardian/atty/courtDuring IEP update, services ordered resulted in change

Residential Itinerancy
● Overwhelmingly, youth change schools because they change residential placements
● Youth change homes frequently● More than 2/3rds of youth say they have
changed schools mid-semester● Average of four such moves over a youth's
life

Recommendations:Overarching Principals
● Child-centered system● Education agencies (State and local)
primarily responsible● Foster youth recognised by State as special
group● Education recognised as primary service● Voice for foster youth● All needs considered together as a whole● Educational success dependent on stability
of residential and educational placements● All professionals involved act as advocates

Recommendations for Change
● 1. Alternative to 100% NPS reimbusement formula
● 2. Strengthen accountability and monitoring of public and nonpublic education received
● 3. Develop independent state and local oversight boards
● 4. Change/expand Ombudsman Office– independent– education
● 5. Establish interagency working goups (State and county levels)

Recommendations for Change (cont.)
● 6. Education agencies responsible for education of foster youth; clear roles for others
● 7. Ensure continuous enrolment in same school
● 8. Single, statewide, web-based data system accessible to all agencies
● 9. Acceptance and awarding of partial credit● 10. Interagency training● 11. Improvement and increased monitoring of
court and community schools