Embed Size (px)
Citation preview

3 ME E T I N G T H E C H A L L E N G E : P R I O R I T I S I N GT H E M O S T E F F E C T I V E P O L I C I E S
TH E ED D I N GT O N TR A N S P O RT ST U DY: MA I N RE P O RT: VO LU M E 3
INTRODUCTION
1 Volume 2 set out the extent and performance of the UK transport system now and in 2025,under a range of scenarios. Particular focus was given to those journeys that support anddrive economic growth. The volume made clear that there are several areas of the networkwhere poor performance threatens to damage the long-term growth of the UK economy. Thestrategic priorities for transport policy identified were:
• growing and congested urban areas and their catchments;
• key international gateways; and
• key inter-urban corridors.
2 Volume 3 takes these strategic priorities and adopts an evidence-based approach toidentifying the transport policies that are most likely to offer a cost-effective response to thechallenges facing the UK and to contribute to GDP.1 It considers a wide range of transportpolicies including mechanisms to make better use of infrastructure, such as pricing;investment in ‘variable capacity’ – those short- and medium-life assets such as buses orlonger trains that provide additional transport capacity without the need for more fixedinfrastructure on the ground; and investment in fixed infrastructure – long-life transportcapital assets such as roads or rail track.
3 Returns on investments are explored and compared by considering both the broadestpossible range of impacts on which Ministerial decisions are made, including social,environmental and economic impacts; and a narrower GDP-only perspective. There is noattempt to make any conclusions or recommendations about specific schemes, but rather toinform a strategic view of the policy options most likely to deliver strong benefits for the UK
Identifying thebest policy
options
119
1 Gross Domestic Product, as described in Volume 1, is currently the best measure of the size of the economy as itmeasures the total value of goods and services produced.
Volume 1Understanding the relationship: how
transport can contribute to
economic success
Does transport matter for the performance of the economy?
How does transport contribute to the
performance of the economy?
Lessons for future transport strategy
How we travel: the pressures on the UK transport network
Overview of key policy messages
Engaging with the private sector
Annex: Planning proposals
Reducing the complexity and
uncertainty of the planning system
Opening up the fullrange of policy options
Making better use of current networks
Enhancing current networks
Evidence and methodology
Future scenarios
The economic priorities for future transport strategy
The connectivity and performance of the
UK’s transport network
Volume 2Defining the challenge:
identifying strategic economic priorities for
the UK transportsystem
Volume 3Meeting the challenge:prioritising the most
effective policies
Volume 4Taking action:
enabling the systemto deliver
National decision making
Using buses in urban areas
Sub-national decision making
ME E T I N G T H E C H A L L E N G E : P R I O R I T I S I N G T H E M O S T E F F E C T I V E P O L I C I E S3economy cost-effectively, and under what circumstances they would do so. The starting pointhas been that any transport intervention should offer benefits that exceed its costs, and thatin a world of limited public resources, government will need to prioritise spending on thosepolicies or investment options that offer the best value for money in meeting its social,environmental and economic objectives.
4 The volume is split into six chapters:
• Chapter 3.1: provides an overview of the key policy messages, conclusionsand recommendations of this volume;
• Chapter 3.2: introduces the full range of policy options;
• Chapter 3.3: focuses on options that allow better use of the current networks;
• Chapter 3.4: discusses infrastructure options, both variable capacity and fixedinfrastructure for enhancing those networks; and
• Chapter 3.5: discusses the evidence used for demonstrating and comparingthe returns from each of the policy options; and describes how those returnshave been assessed.
Structureof Volume 3
120 ED D I N GT O N ST U DY: VO LU M E 3
3.1 OV E R V I E W O F K E Y P O L I C Y M E S S A G E S
TH E ED D I N GT O N TR A N S P O RT ST U DY: MA I N RE P O RT: VO LU M E 3 121
Headlines
The case for targeted transport intervention is compelling, even after takingaccount of environmental effects. Some transport interventions offer veryhigh overall returns on government spending.
• Transport schemes can deliver overall benefits averaging £4 per £1 of governmentexpenditure.
• These figures have added in estimates of the missing GDP impacts identified inVolume 1 that are not captured in recent appraisals. Such impacts can be verysignificant, adding up to 50 per cent to the benefits in some cases.
• Environmental effects often reduce the returns available, but overall returnsremain remarkably high in most cases once they have been factored in; and sucheffects increase the benefits of some urban public transport proposals.
A sophisticated policy mix of better use, carbon and congestion pricing andtargeted infrastructure offers strong benefits.
• There is a strong economic and environmental case for ensuring users across allmodes face the true costs associated with their journeys, be they environmentalor congestion-related, in line with the Stern Review of the economics of climatechange.
• Better use options – especially better pricing on the roads – have veryconsiderable potential; infrastructure options are not always the most costeffective solution.
• But some infrastructure schemes do offer very high returns:
• Interventions targeted on the worst problems and bottlenecks caused bycompeting demands on the transport system, such as surface access links andcorridors close to major urban areas, are likely to offer some of the highestreturns;
• Small can be beautiful: small-scale interventions such as walking and cyclingschemes, and junction improvements, are often the most cost-effectivesolutions. Although on their own they may not always be able to tackle thetrue scale of the problem faced; and
• GDP returns from the interventions in urban areas on which evidence isavailable are surprisingly low, leading to concerns that high-return options maynot be being generated.
• Even in a world with carbon pricing and widespread congestion-targeted roadpricing there seems to be a good case for more transport infrastructure. Beyond2015, without road pricing there would be an economic case for a rate of strategicroad capacity enhancement over 50 per cent higher than the baseline rate; withroad pricing, there would still be a case for additional investment but significantlybelow current rates of build.
• Step-change measures intended to provide a transformation to the transportsystem are unlikely, in a world of constrained resources, to be a priority especiallywhen they use new and untested technologies.
But it is not only through government funding that transport delivers strongwelfare and GDP benefits: private sector investment has a key role to play.

OV E R V I E W O F K E Y P O L I C Y M E S S A G E S3.1INTRODUCTION
1.1 As a whole, Volume 3 seeks to identify the transport policies that are most likely tooffer a cost-effective response to the challenges facing the UK transport system. In doing so,the volume sets out the available evidence in real detail. This overview sets out the keyoverarching messages from that evidence. In part, this chapter therefore acts as a summaryfor the detailed chapters that follow. However, it also combines the evidence in this volumewith the discussion in earlier volumes, because only by taking a considered view of all theevidence can conclusions be drawn with real confidence.
1.2 The chapter:
• provides a brief introduction to the evidence, and what it can and cannotshow;
• reports the headline analysis of the returns available from transport schemes;
• provides a series of headline conclusions that can be drawn from the data andevidence summarised here (and which is set out more fully in subsequentchapters);
• takes a look beneath the headlines to explain some of the cross-cuttingfindings in more detail; and
• summarises the conclusions and recommendations of this volume.
INTRODUCTION TO THE EVIDENCE
1.3 This volume presents available evidence on the costs and benefits of a wide range oftransport interventions, incorporating the best available estimates of the economic,environmental and social impacts. The range of interventions considered can be broadlydefined as:
• better use: interventions that lead to more efficient use of the existingtransport system;
• variable capacity: investment in relatively short- and medium-life assets thatincreases the effective capacity of the available fixed infrastructure, forexample additional bus services or longer trains and platforms; and
• fixed infrastructure: investment in additional, very long-life capital assets suchas roads, rail lines, and ports etc.
1.4 The evidence presented is based on information on over 170 business cases andappraisals of real schemes across the UK,1 with a combined cost to government of well over£100 billion. To complement this information, modelling has been undertaken to explore thereturns of some illustrative interventions both at the national level and in some local case-study areas; and the study has also drawn on modelling which estimates the overall benefitsprovided by private sector developments in the port and airport sectors.
A database ofschemes has
been developed
The evidencepaints a broad
picture
122 TH E ED D I N GT O N TR A N S P O RT ST U DY: MA I N RE P O RT: VO LU M E 3
1 There is a mixture of schemes which have been implemented, or which have been recently proposed.
OV E R V I E W O F K E Y P O L I C Y M E S S A G E S 3.11.5 In doing so, the aim is not to create a wish list of specific schemes that should be funded;that is not the purpose of a strategic study of this kind. Instead the available evidence has beenused to help identify the types of interventions that are most likely to offer a high value for moneycontribution to GDP and wider welfare.2 Existing interventions have been categorised to thestrategic economic priority (as identified in Volume 2) they most closely match, though it is likelythat some urban interventions in the database are not, in reality, in areas that are growing andcongested.
1.6 There is a long history of using cost-benefit analysis to guide decision makingtowards the highest value for money projects. Indeed, the UK is seen as a world-leader in thedevelopment and use of these techniques. This history shows that as valuation techniquesbecome more sophisticated, so the range of impacts measured and valued by cost-benefitanalysis can expand, leading to better-informed and more transparent decision making.
1.7 This study has made an important first attempt to estimate some of the ‘missing’ GDPimpacts identified in Volume 1, using recent new evidence.3 Similarly, emerging evidence onthe values that can be ascribed to important environmental impacts (carbon emissions, noise,air quality and landscape impacts) have also been used to enrich the analysis in many areas.It is likely that some environmental effects would be highly scheme specific, as would theirtrue valuations. Available evidence does however allow an aggregate approach to be taken toprovide an indicative estimate of their order of magnitude. For example, by relying on genericvalues for different landscape types, an estimate can be made of the potential scale of thiseffect to be incorporated into the assessment of welfare in a consistent way across schemes.
1.8 The different measures which are used to capture these valuations, and to report theevidence on costs and benefits are summarised in Figure 1.1, while Chapter 3.5 provides afuller explanation of cost-benefit analysis, including the new GDP and environmentalestimates that have been added into the value for money assessments.
1.9 It is important to interpret the results carefully as the assessment of the widereconomic benefits and reliability effects has for the most part been undertaken at anaggregate and indicative level. While the effect is likely to be representative of different typesof policies, it may lead to over- or under-estimation on particular schemes. Impacts on trade,globally mobile investment and several dynamic effects have not been possible to estimategiven the current state of knowledge on these impacts.
1.10 As always, developing ‘state of the art’ estimates is challenging and innovative. Thesenew estimates are presented to provide high-level insights into transport’s effect on oureconomy and quality of life, not to inform decision making and appraisal on individualschemes. They are presented as ‘order of magnitude’ estimates for different types of scheme,in order to guide policy makers towards those policies that are likely to offer good returns.They are no substitute for the full-blown, location-specific appraisals of the most promisingoptions, which are needed when making funding decisions.
For the first timeestimates of
‘missing’ GDPimpacts and
environmentaleffects have both
beenincorporated
The purpose is toidentify the types
of interventionsthat offer good
returns
123TH E ED D I N GT O N TR A N S P O RT ST U DY: MA I N RE P O RT: VO LU M E 3
2 The notion of welfare is used throughout this volume to encompass the overall net benefits to society includingeconomic, environmental and social impacts.3 Transport, wider economic benefits and impacts on GDP, DfT, July 2005. This is used to provide an estimate of the GDPeffects, which is a new and emerging field. This methodology is currently being applied in the context of schemes comingforward for the Transport Innovation Fund.

OV E R V I E W O F K E Y P O L I C Y M E S S A G E S3.11.11 When interpreting the analysis in this volume it also important to recognise that, insome areas, only a small sample size is available so care must be taken not to over-extend theconclusions that can be reached. Similarly, existing schemes were developed without a fullunderstanding of some of transport’s impacts on the economy (e.g. agglomeration impacts);if that knowledge had been available different schemes may have emerged. Nonetheless, evenwhere the sample size of evidence is relatively small, the potential offered by someinterventions is evident, so areas for further investigation are identified.
1.12 In short, the results presented from the database and strategic modelling arerepresentative of the ‘average’ impacts of different types of schemes for which evidence isavailable, and cannot be interpreted as providing precise answers on the impacts ofindividual schemes. There may also be ‘better’ schemes on which the study does not haveinformation, either because they have not been developed or because the information wasnot known to be available. Nonetheless, the evidence provides important new insights intotransport’s contribution to the UK’s economy and quality of life, and has some importantimplications for future policy.
124 TH E ED D I N GT O N TR A N S P O RT ST U DY: MA I N RE P O RT: VO LU M E 3

OV E R V I E W O F K E Y P O L I C Y M E S S A G E S 3.1
1.13 The metrics as described in Figure 1.1 are demonstrated in a range of charts in thisand subsequent chapters. Figure 1.2 provides a guide to interpreting one particular form ofchart used.
125TH E ED D I N GT O N TR A N S P O RT ST U DY: MA I N RE P O RT: VO LU M E 3
Figure 1.1: Measuring costs and benefits of government expenditure –the metrics used
To reflect the evolving nature of transport appraisal, four cost-benefit measures arereferred to throughout this study, all of which express estimated benefits of a proposal perpound of government expenditure.
The main difference between the metrics set out below is the extent to which benefits arecounted and given monetary valuations (monetised). The view taken in this study is thatthe conventional Benefit:Cost ratio (BCR) as generated from the NATA process (New
Approach to Appraisala) is the most certain measure, but that it is incomplete. The valuefor money assessment is the most complete ‘single measure’ of transport’s impact on theUK, as it incorporates the fullest possible estimate of a proposal’s economic, social andenvironmental impacts. However, those estimates are more uncertain than theconventional BCR because the evidence base is relatively new, and some of the effects areinherently hard to monetise. Metrics used are as follows:
• Conventional benefit:cost ratio (NATA BCR): the benefit:cost ratio set outin DfT’s appraisal guidance. Captured and monetised within this BCR are: changesto the overall costs of travel, the value of changes to travel times, safety benefits,and the financial costs of doing the project including impacts on taxation revenues.This does not yet include a number of GDP impacts, and here does not put amonetary valuation on environmental benefits.b Instead, the BCR sits within abroader assessment framework that uses qualitative estimates of environmentaland social impacts.
• GDP per pound: the contribution to GDP that can be achieved per pound ofgovernment money spent on the intervention. It is a narrower metric than welfarebecause it only focuses on the impacts on the economy. It does not thereforeinclude benefits for non-work/leisure travel, for example. In addition to the GDPimpacts already captured in appraisals, such as changes in the costs of travel tobusiness and freight, this assessment also includes impacts on the wider economythat are not currently estimated as part of conventional appraisals, such asagglomeration, labour market effects, competition impacts and reliability. Sucheffects have been indicatively estimated for this study based on developing ‘stateof the art’ guidance on how to assess these impacts from DfT.
• Wider benefit:cost ratio (BCR): this adds the ‘missing’ GDP effects into theconventional NATA BCR.
• Value for money (VfM) BCR: the most complete metric used in this analysis.For decision making, all impacts on society should be considered but only some canbe presented in money terms. The value for money assessment goes broader thanthe three previous metrics by incorporating most significant environmental effectsinto the monetised assessment by relying on recent valuation evidence.Environmental effects estimated in this way are carbon (using current Defraguidance), air quality, noise and landscape (all from published academic andgovernment research).
a The DfT guidance, New Approach to Appraisal, can be seen at www.webtag.org.uk.b Though recent developments in appraisal guidance will lead to future appraisals capturing the value of the change incarbon emissions and noise.

OV E R V I E W O F K E Y P O L I C Y M E S S A G E S3.1
126 TH E ED D I N GT O N TR A N S P O RT ST U DY: MA I N RE P O RT: VO LU M E 3
Figure 1.2: Understanding the distribution data
The box and whisker charts in this and later chapters demonstrate the range anddistribution of returns to allow a comparison across different interventions in differentareas.
In the type of chart shown below (known as a ‘box and whisker’ chart), the full range ofreturns from the available evidence is reflected by the length of the vertical line. The toppoint of the vertical line marks the return offered by the best scheme; the bottom pointmarks the return of the lowest-performing. In some cases, the extreme values at the topand bottom will be outliers so must be interpreted with caution.
The ‘box’ in the centre of the line is in many ways more informative as its vertical lengthmarks out the range of returns from the middle-performing 50 per cent of schemes. So,for example, if the top line of the box is at wider BCR 4 and the bottom line of the box isat wider BCR of 2, the middle 50 per cent of the schemes offers wider BCRs in the range2 to 4. The line across the middle of that box shows the ‘median’ average return.
Schemes whose returns lie on the vertical line above the ‘box’ are the top-performing25 per cent schemes in terms of their returns; likewise, those below the ‘box’ are thelower-performing 25 per cent of schemes.
The figure at the top of the line is the sample size (in this case 59)
Understanding the data
50% ofschemes fallwithin thisbox
Bottom 25% ofschemes are inthis range
Top 25% ofschemes arein this range
Lowest value
Highest value
Median
Source: Eddington Study.
59

OV E R V I E W O F K E Y P O L I C Y M E S S A G E S 3.1HEADLINE ANALYSIS
1.14 On the basis of these metrics, there are some overall messages that can be drawn fromthe evidence.
1.15 Figure 1.3 shows that there are very good returns across the strategic priorities withsome very high returns offered in each. More detailed analysis suggests that the very highestreturns are from those interventions that are well targeted on particular pinch points on thenetwork and that serve all of the strategic priorities. In addition, although not shown in thischart, walking and cycling schemes can offer some very strong welfare returns with widerBCRs well in excess of 10.
1.16 When considering the possible returns by policy type, as in Figure 1.4, it is evidentthat the returns from fixed-infrastructure options are much more varied than for other policytypes. In part, this will reflect the number of schemes on which evidence is available to thisstudy, but it does highlight the need to ensure interventions are well targeted because somevery low returns are possible.
And acrossdifferent types
of policyoption
127TH E ED D I N GT O N TR A N S P O RT ST U DY: MA I N RE P O RT: VO LU M E 3
Figure 1.3: Distribution of economic returns from government expenditure by strategic priority: wider benefit:cost ratio
0
5
10
15
20
25
3059 24 93
Urban networks International gatewayswith surface access
Inter-urban corridors
1.3
Wid
er B
CR
Source: DfT.
Good returnsacross the
strategicpriorities
OV E R V I E W O F K E Y P O L I C Y M E S S A G E S3.1
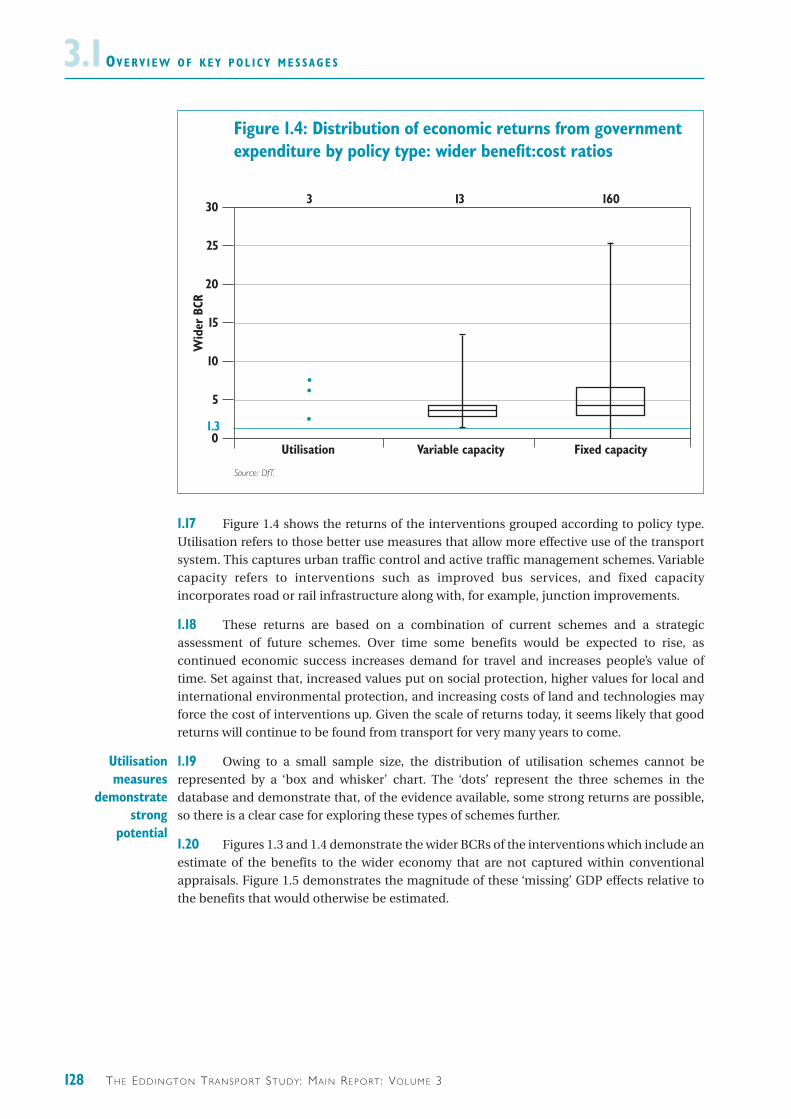
1.17 Figure 1.4 shows the returns of the interventions grouped according to policy type.Utilisation refers to those better use measures that allow more effective use of the transportsystem. This captures urban traffic control and active traffic management schemes. Variablecapacity refers to interventions such as improved bus services, and fixed capacityincorporates road or rail infrastructure along with, for example, junction improvements.
1.18 These returns are based on a combination of current schemes and a strategicassessment of future schemes. Over time some benefits would be expected to rise, ascontinued economic success increases demand for travel and increases people’s value oftime. Set against that, increased values put on social protection, higher values for local andinternational environmental protection, and increasing costs of land and technologies mayforce the cost of interventions up. Given the scale of returns today, it seems likely that goodreturns will continue to be found from transport for very many years to come.
1.19 Owing to a small sample size, the distribution of utilisation schemes cannot berepresented by a ‘box and whisker’ chart. The ‘dots’ represent the three schemes in thedatabase and demonstrate that, of the evidence available, some strong returns are possible,so there is a clear case for exploring these types of schemes further.
1.20 Figures 1.3 and 1.4 demonstrate the wider BCRs of the interventions which include anestimate of the benefits to the wider economy that are not captured within conventionalappraisals. Figure 1.5 demonstrates the magnitude of these ‘missing’ GDP effects relative tothe benefits that would otherwise be estimated.
Utilisationmeasures
demonstratestrong
potential
128 TH E ED D I N GT O N TR A N S P O RT ST U DY: MA I N RE P O RT: VO LU M E 3
Figure 1.4: Distribution of economic returns from government expenditure by policy type: wider benefit:cost ratios
0
5
10
15
20
25
303 13 160
Utilisation Variable capacity Fixed capacity
1.3
Wid
er B
CR
Source: DfT.

OV E R V I E W O F K E Y P O L I C Y M E S S A G E S 3.1
1.21 The average of the wider BCRs is strong for each strategic priority, and the ‘new’ GDPbenefits add considerably to the estimated returns, particularly for urban networks. This islargely driven by the agglomeration and labour market benefits to which interventions inthese areas give rise.
1.22 The wider BCRs shown in Figure 1.5 are averages of the schemes on which evidencewas available. These averages are therefore distorted by the returns from some of the verylarge schemes. For example, removing all large rail schemes for illustration would increase theaverage return from inter-urban corridor schemes from a wider BCR of 1.8 to just under 5.
1.23 However, the true returns are lower for most interventions after environmental costsare factored in, i.e. in moving from a wider BCR to a VfM BCR. The analysis in Figure 1.6 isbased on those schemes for which monetised environmental impacts can be estimated –around a third of the schemes in the database. For the types of schemes represented,predominantly road and bus, these results are likely to be representative of the impact acrossall such schemes in the database, i.e. there is no reason to expect systematic biases in thetypes of schemes on which we have full environmental monetisation.
‘Missing’ GDPeffects are more
significant inurban areas
129TH E ED D I N GT O N TR A N S P O RT ST U DY: MA I N RE P O RT: VO LU M E 3
Source: DfT.
Figure 1.5: Average economic returns from government expenditure with GDP impacts added in: wider BCRs
0
1
2
3
4
5
6
7
Wid
er B
CR
Urban networks
Monetised welfare benefits Previously ‘missing’ GDP benefits
International gatewayswith surface access
Inter-urban corridors

OV E R V I E W O F K E Y P O L I C Y M E S S A G E S3.1
1.24 In addition, although not demonstrated in the charts, well-targeted small-scalewalking and cycling schemes can have a beneficial impact on the environment owing to themode shift from car to these non-polluting modes, but overall impacts would depend on theinfrastructure requirements.
1.25 Figure 1.6 shows that starting from a narrow perspective of GDP only, as additionalwelfare effects are incorporated – i.e. looking at the wider BCR – there is a significant shift upin the average returns of public transport interventions, more so than the relative shift forroad schemes. This is because the wider BCR incorporates impacts on non-work/leisure trips.
1.26 Taking the analysis further to include environmental impacts – i.e. looking at the VfMBCR – the average returns of the interventions are again affected. For roads there is a shiftdown, driven by landscape impacts, carbon emissions and local air pollutants. For publictransport interventions, the impact is minimal but slightly positive. These positive effects area result of the beneficial impacts on journey ambience from improved interchange facilities;and mode shift to public transport services allowing lower levels of congestion and henceemissions.
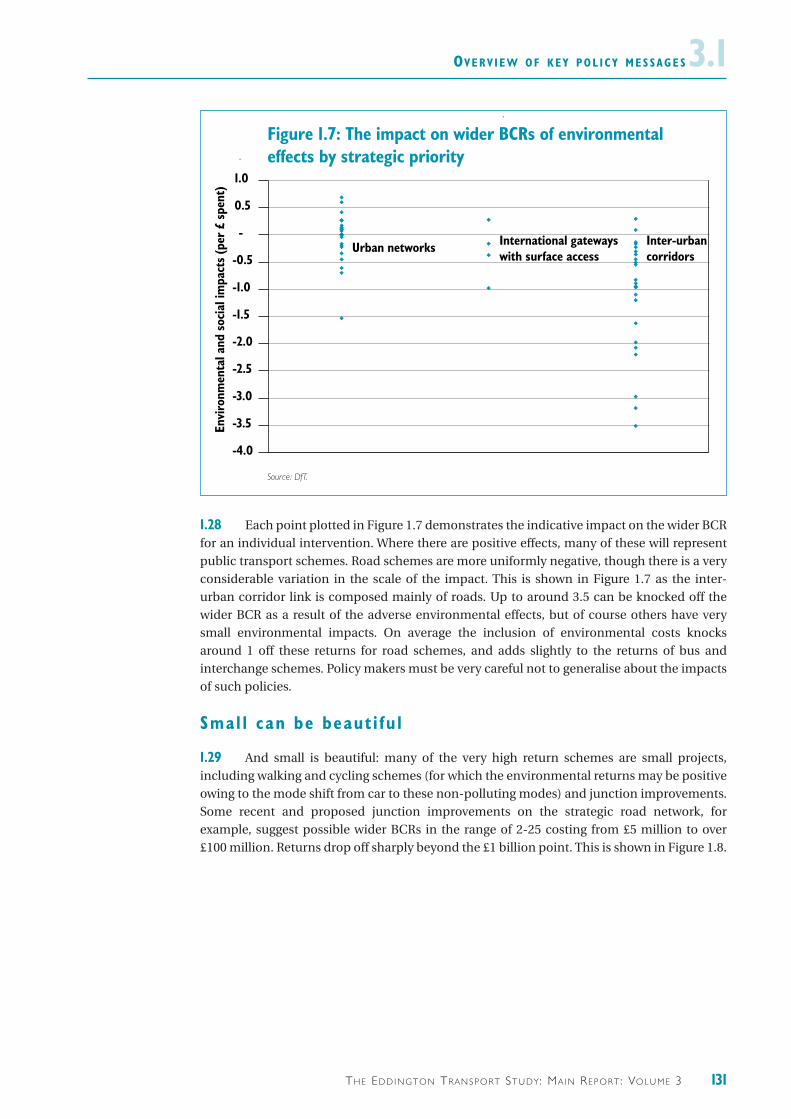
1.27 Looking in further detail at the environmental effects by strategic prioritydemonstrates the broad range of impacts. Figure 1.7 plots the estimated impact on thereturns of interventions of such environmental effects for a sample of schemes for which thisis possible.
130 TH E ED D I N GT O N TR A N S P O RT ST U DY: MA I N RE P O RT: VO LU M E 3
Figure 1.6: The impacts of moving towards a more complete VfM assessment
0
1
2
3
4
5
6
GDP/£ Wider BCR VfM BCR including environmental, social
and ‘missing’ GDP effects
Road Bus and interchange schemes
Bene
fits
per
£ sp
ent
Source: DfT.
OV E R V I E W O F K E Y P O L I C Y M E S S A G E S 3.1
1.28 Each point plotted in Figure 1.7 demonstrates the indicative impact on the wider BCRfor an individual intervention. Where there are positive effects, many of these will representpublic transport schemes. Road schemes are more uniformly negative, though there is a veryconsiderable variation in the scale of the impact. This is shown in Figure 1.7 as the inter-urban corridor link is composed mainly of roads. Up to around 3.5 can be knocked off thewider BCR as a result of the adverse environmental effects, but of course others have verysmall environmental impacts. On average the inclusion of environmental costs knocksaround 1 off these returns for road schemes, and adds slightly to the returns of bus andinterchange schemes. Policy makers must be very careful not to generalise about the impactsof such policies.
Smal l can be beaut i fu l
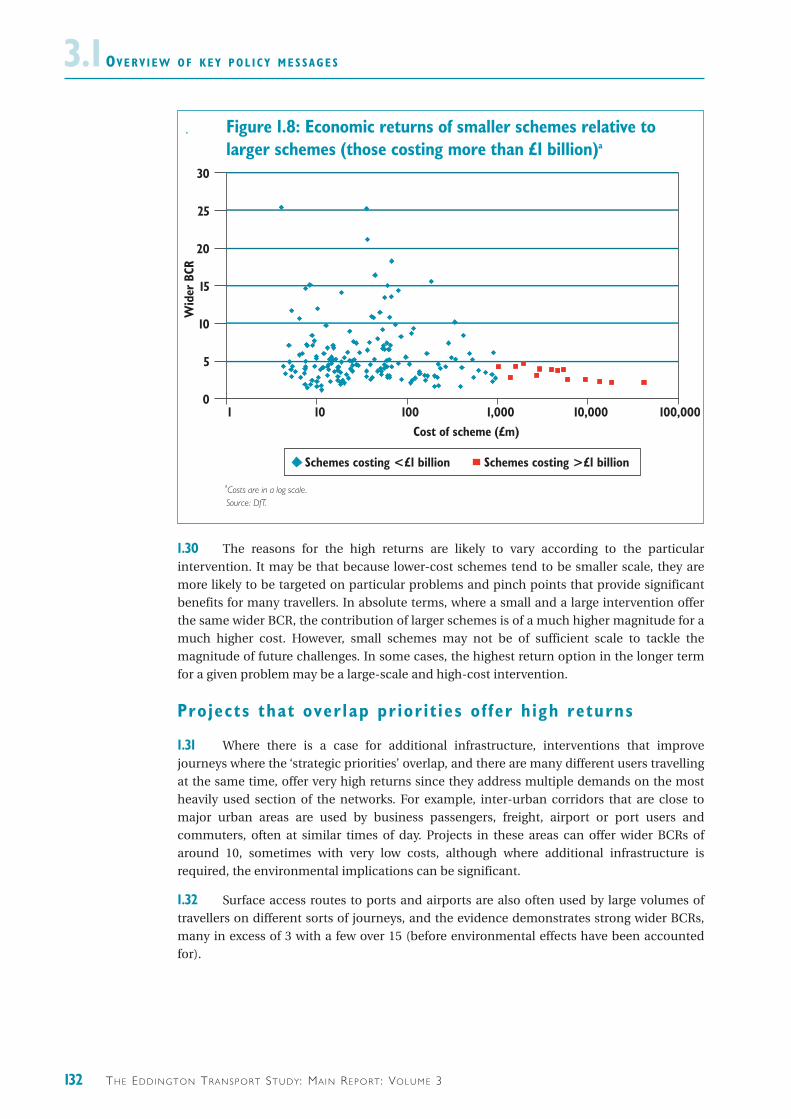
1.29 And small is beautiful: many of the very high return schemes are small projects,including walking and cycling schemes (for which the environmental returns may be positiveowing to the mode shift from car to these non-polluting modes) and junction improvements.Some recent and proposed junction improvements on the strategic road network, forexample, suggest possible wider BCRs in the range of 2-25 costing from £5 million to over£100 million. Returns drop off sharply beyond the £1 billion point. This is shown in Figure 1.8.
131TH E ED D I N GT O N TR A N S P O RT ST U DY: MA I N RE P O RT: VO LU M E 3
Source: DfT.
Figure 1.7: The impact on wider BCRs of environmentaleffects by strategic priority
-4.0
-3.5
-3.0
-2.5
-2.0
-1.5
-1.0
-0.5
-
0.5
1.0
Envi
ronm
enta
l and
soc
ial i
mpa
cts
(per
£ s
pent
)
Urban networks International gatewayswith surface access
Inter-urbancorridors
OV E R V I E W O F K E Y P O L I C Y M E S S A G E S3.1
1.30 The reasons for the high returns are likely to vary according to the particularintervention. It may be that because lower-cost schemes tend to be smaller scale, they aremore likely to be targeted on particular problems and pinch points that provide significantbenefits for many travellers. In absolute terms, where a small and a large intervention offerthe same wider BCR, the contribution of larger schemes is of a much higher magnitude for amuch higher cost. However, small schemes may not be of sufficient scale to tackle themagnitude of future challenges. In some cases, the highest return option in the longer termfor a given problem may be a large-scale and high-cost intervention.
Projects that over lap pr ior i t ies o f fer h igh returns
1.31 Where there is a case for additional infrastructure, interventions that improvejourneys where the ‘strategic priorities’ overlap, and there are many different users travellingat the same time, offer very high returns since they address multiple demands on the mostheavily used section of the networks. For example, inter-urban corridors that are close tomajor urban areas are used by business passengers, freight, airport or port users andcommuters, often at similar times of day. Projects in these areas can offer wider BCRs ofaround 10, sometimes with very low costs, although where additional infrastructure isrequired, the environmental implications can be significant.
1.32 Surface access routes to ports and airports are also often used by large volumes oftravellers on different sorts of journeys, and the evidence demonstrates strong wider BCRs,many in excess of 3 with a few over 15 (before environmental effects have been accountedfor).
132 TH E ED D I N GT O N TR A N S P O RT ST U DY: MA I N RE P O RT: VO LU M E 3
Figure 1.8: Economic returns of smaller schemes relative to larger schemes (those costing more than £1 billion)a
Source: DfT.
1 10 100 1,000 10,000 100,0000
5
10
15
20
25
30
Cost of scheme (£m)
Schemes costing <£1 billion Schemes costing >£1 billion
Wid
er B
CR
Costs are in a log scale.a

OV E R V I E W O F K E Y P O L I C Y M E S S A G E S 3.11.33 Step-change measures intended to transform the economy are not, in a world ofconstrained resources, likely to be a priority. The available evidence for step-change projectsin the UK, such as a new high-speed North-South rail line, shows wider BCRs at the lower endof the distribution before accounting for landscape and carbon effects. Furthermore, BCRs ofalternative options to solve these problems are not available. However, it is often argued thatsuch measures miss transformational economic impacts, such as a radical shift in theeconomic geography of the UK brought about by new levels of connectivity. The evidence fortransformational benefits is at best unproven, and Volume 2 has demonstrated that the UK’surban areas and regions are already well connected. Another potential benefit (which shouldbe included in the wider BCR) is that of freeing up capacity on existing rail lines. Whilst this istrue, it is not at all clear that creating new networks is the most appropriate or cost-effectivemethod to achieve increased capacity: high speed options should be assessed coldlyalongside other polices for achieving the same objective. Other transport investments arevery likely to offer superior returns compared to where projects rely on new and largelyuntested technologies.
1.34 Where new and untested technologies are relied on, or where demand for the newlink is only speculative, expensive step-change transport measures are unlikely to offer thebest value for money in delivering economic or environmental objectives.
Benef i ts o f road pr ic ing
1.35 The Stern Review argued that prices should be used to reflect the externalitiesassociated with climate change. The same is true for congestion: users should pay the fullcosts of their journey, including a carbon price and a congestion price. The study hasexamined a number of pricing schemes and modelled a national distance-based scheme thatprices both congestion and environmental externalities. Road pricing is certainly the mosteffective way of pricing for congestion. It is also one possible instrument for carbon pricingroad users. However, this modelling should not be taken to suggest this study has taken a viewof the best instrument for carbon pricing, only that the impact of carbon pricing on thedemand for surface transport has been taken into account.
1.36 In the Road Pricing Feasibility Study (RPFS)4, the DfT explored the potential benefitsof a national road pricing scheme implemented in 2010 using the DfT’s National TransportModel (NTM). This study has explored the impacts of that scheme in the longer term, namely2025, again relying on the NTM.
1.37 The illustrative national scheme modelled for both the RPFS and therefore this studyis a relatively sophisticated, distance-based scheme where prices are based on the marginalsocial costs of the journeys that take into account costs of congestion and environmentaldamage, including a carbon cost of £95 per tonne in 20255. Charges are capped at 80p/km6
with 75 different levels of charges, varying by time of day, by area and road type.
1.38 Clearly, this is only one of many options, and has been chosen only to makecomparisons with the present day more straightforward. The evidence suggests that beforeconsidering the costs of setting up and running such a scheme, total benefits estimated ataround £28 billion7 a year in 2025, including GDP benefits of £15 billion a year. The costs ofsuch a scheme are not known at this stage, and pilots should be used to provide a betterassessment. Clearly, costs would have to be extremely high to outweigh the benefits of £28
Strong economic andenvironmental
case for prices toreflect external
costs
Step-changemeasures
133TH E ED D I N GT O N TR A N S P O RT ST U DY: MA I N RE P O RT: VO LU M E 3
4 Feasibility study of road pricing in the UK, DfT, 2004 and Transport demand to 2025 and the economic case for road pricingand investment, DfT, 2006.5 Defra guidance.6 1998 prices, in line with the Feasibility study of road pricing in the UK, DfT, 2004.7 2002 prices.
OV E R V I E W O F K E Y P O L I C Y M E S S A G E S3.1billion a year, and in that scenario it would not be cost effective to implement a scheme. Theanalysis of this particular scheme and other road pricing schemes are described in moredetail in Chapter 3.3.
1.39 If widespread pricing were introduced, the nature and location of challenges on theroads would be altered. This has implications for the economic case for additionalinfrastructure across modes. A national scheme is estimated to reduce the case for inter-urban road build beyond 2015 by some 80 per cent. The reduced case for additionalinfrastructure and the accompanying environmental damage means proper pricing cantherefore have significant environmental benefits when compared with other options.Without road pricing, beyond 2015 there would be an economic case for a rate of strategicroad capacity enhancement over 50 per cent higher than the baseline rate.
1.40 Applying the principles of pricing to all modes, including roads, rail and aviation,offers significant potential to deliver welfare and GDP benefits, although the evidence is notavailable to quantify those benefits.
Private sector investment
1.41 This study has not sought to repeat the analysis of the Air Transport White Paper8
(ATWP) which suggests there are significant economic benefits from increasing runwaycapacity at Heathrow and other airports in the South East. Above a baseline of maximum useof existing runways, direct economic benefits of additional capacity at Stansted (2012) andHeathrow (2020) are estimated at some £24 billion. It is estimated that of this figure, some £6billion9 accrue direct to business travellers, and these benefits would be higher still ifreliability were accounted for. Other benefits not captured within this figure include the tradebenefits of international connectivity and the benefits from increasing the attractiveness ofthe UK for foreign investors. Plus, there can be economies of scale from hub airports, throughenabling a greater variety and frequency of onward connections, and from greater efficienciesin the provision of support services and fixed costs.
1.42 However, the gross benefits must be adjusted to reflect the impacts on theenvironment from additional runway capacity. The main environmental impacts of aviationthat can be quantified are noise from aircraft and the effects of aircraft emissions. AirTransport White Paper analysis estimated that the cost of increased carbon emissions overand above a baseline of making maximum use of existing runways could be in the region ofsome £3-5 billion.10 In addition, there are likely to be impacts of increased noise and healthimpacts from reduced air quality but these are likely to be an order of magnitude lower thanthese carbon impacts, leaving very substantial net benefits.
1.43 The ATWP also assessed the benefits of additional fixed runway infrastructure atother airports and suggested that an additional runway at two other UK airports could eachprovide overall benefits that are much lower than for expanding major airport in the SouthEast, with the highest benefits at some £1.6 billion over the period to 2060. The benefits ofcapacity enhancement at other regional airports are therefore likely to be of a much smallermagnitude than for other major airports, given the lesser magnitude of pressures faced.
134 TH E ED D I N GT O N TR A N S P O RT ST U DY: MA I N RE P O RT: VO LU M E 3
8 The Future of Air Transport, DfT, 2003.9 Present value benefit over the period to 2060.10 Present value over the period to 2060.

OV E R V I E W O F K E Y P O L I C Y M E S S A G E S 3.11.44 This study identifies international gateways as a key strategic priority for the future,and the vital role of aviation in supporting the international competitiveness of the UK’s high-tech manufacturing and financial services sectors. This is in line with the analysis from theATWP set out above, which demonstrated that the potential economic benefits from furtherexpansion of aviation capacity are significant, running to tens of billions of pounds. However,any growth in aviation needs to be sustainable, and must take full account of itsenvironmental costs. One of the most effective mechanisms for achieving this is by ensuringthat air travellers pay the full environmental costs of their journey, including their climatechange costs. The principle of ensuring users pay their full external costs was supported bythe Government in the Air Transport White Paper and was strongly supported by the SternReview of the economics of climate change.
1.45 The ATWP passenger demand forecasts assumed the introduction of some form ofpricing mechanism to ensure air travellers faced the full external costs of their climate changeimpacts. This was based on the Defra central cost of carbon estimate of £70 per tonne ofcarbon (in 2000 prices). With this pricing mechanism in place, the analysis demonstrated thatdemand would continue to grow, and that there would be significant economic benefits fromsome additional runway expansion. It is important to understand the impact of a range ofcarbon pricing scenarios on the case for aviation expansion, and the forthcoming ATWPProgress Report will test a wider range of carbon price scenarios.
1.46 Provided economic analysis shows that there is a net benefit from increased airportcapacity, even after users pay the full environmental costs of their journeys, there will remaina strong economic case for additional runway capacity.
1.47 The evidence also suggests that the expansion of ports capacity in response tocapacity constraints, subject to environmental considerations, can deliver benefits. Fullassessments of costs and benefits were not available to this study. However, the availableevidence suggests that under a scenario of full construction of Felixstowe South, Bathside Bayand London Gateway deep-sea container ports, shipping costs could be reduced by around£200 million per annum or up to 10 per cent by 2025. These gains arise because the extra UKcapacity reduces the need for a good deal of transhipment which adds to delivery costs.Without further expansion in capacity, it is also likely that capacity constraints will start tobite sometime between 2020 and 2030. In this scenario, additional capacity expansion couldreduce costs by a further £140 million per year. These estimates do not account for widerbenefits such as impacts on trade, globally mobile investment and reliability.
1.48 If additional ports infrastructure is added, there are likely to be adverseenvironmental impacts. Ports are mainly located in estuaries where they compete with birdsfor sheltered locations and coastal habitat such as mudflat and saltmarsh; there are knock-oneffects on surface modes (road and rail); and air quality and carbon emissions.
1.49 While this study does not have detailed evidence on these impacts, recent portcapacity planning approvals demonstrate that in some circumstances there remains a casefor additional capacity, once environmental impacts have been factored in.
1.50 The implication for government of the gains to the economy from such private sectorinvestment is that providing a clear policy framework, which prices environmentalexternalities, will incentivise the private sector to bring forward appropriate infrastructureproposals which deliver economic and welfare benefits while meeting environmentalobjectives.
135TH E ED D I N GT O N TR A N S P O RT ST U DY: MA I N RE P O RT: VO LU M E 3
OV E R V I E W O F K E Y P O L I C Y M E S S A G E S3.1GETTING BENEATH THE HEADLINE NUMBERS
1.51 This section looks beneath these headlines, to explore where the highest returns canbe found, including by location and by mode. Using current standard appraisal methods toassess welfare, high returns are evident across all priority links and all demonstrate averagereturns in excess of the minimum rate of return for government investment of 1.3,11 asillustrated in figure 1.3.
Where are the h ighest returns to be found?
1.52 The evidence in Figure 1.5 suggested that targeted improvements to surface accesslinks are able to offer the highest average welfare return on investment. This includes accessto ports and airports, both of which support the UK’s international competitiveness byimproving travel conditions for freight and international business travellers. Although thisarea of investment has not been specifically targeted in the recent past, if chosen well, suchinterventions are able to make a significant contribution to GDP and welfare.
1.53 Taking all interventions on which evidence is available suggests the average BCR ofinterventions in growing and congested urban areas exceeds that for inter-urban corridors.This finding should be interpreted with caution, however, because the inter-urban averageincludes some very expensive and relatively low performing interventions, such as some railschemes. These act to constrain the average return on inter-urban routes. Looking at Figures1.3 and 1.4, it is clear that there are both very high-performing and very low-performing inter-urban schemes.
1.54 For illustration, if the expensive low-performing interventions are removed, theaverage BCR in Figure 1.5 for inter-urban corridors increases from 1.8 to 4.9; for growing andcongested urban areas it changes from 3.2 to 4.2; and with international gateways it increasesfrom 6.7 to 7.2. Hence inter-urban corridors are actually likely to offer some schemes withhigher returns than in growing urban areas. Further issues around the returns frominterventions in urban areas are explored in Figure 1.9.
Location ofhighest returns
136 TH E ED D I N GT O N TR A N S P O RT ST U DY: MA I N RE P O RT: VO LU M E 3
11 For more detail see Transport demand to 2025 and the economic case for road pricing and investment, DfT, 2006.
OV E R V I E W O F K E Y P O L I C Y M E S S A G E S 3.1
Modes
1.55 Underlying Figure 1.6, the evidence suggested that, using current appraisal values,public transport performs relatively less well on average than roads. However, there are somegood value schemes offering over £3 of welfare for every £1 of government spend, such assome bus service enhancements in large urban areas. Careful targeting and scheme design iscritical to the success of public transport interventions.
1.56 In addition, as will be further highlighted in Chapter 3.4, even after accounting forenvironmental effects, road investment is able to offer among the highest returns if it is welltargeted on the key inter-urban corridors (especially near major urban areas) or surfaceaccess links to ports and airports where traffic volumes are very high and congestion is apersistent problem. Chapter 3.4 discusses the case for additional strategic road capacity inmore detail, including the impacts that road pricing can have on the returns from investingin infrastructure.
Not a l l schemes improve economic per formance
1.57 Some interventions offer relatively poor returns in terms of GDP per pound. Forvariable capacity this mainly reflects those public transport schemes that have low businessuse and no freight use, although decongestion benefits will indirectly affect all road users.This may also reflect that many public transport schemes for which the evidence is availableare designed to focus on leisure travellers or social and accessibility outcomes, rather thaneconomic outcomes. Clearly, it is right and proper that government makes transportinvestments aimed at social and environmental goals – the data simply highlight that theeconomic gain in some projects can be very low.
137TH E ED D I N GT O N TR A N S P O RT ST U DY: MA I N RE P O RT: VO LU M E 3
Figure 1.9: The conundrum of transport projects in urban areas
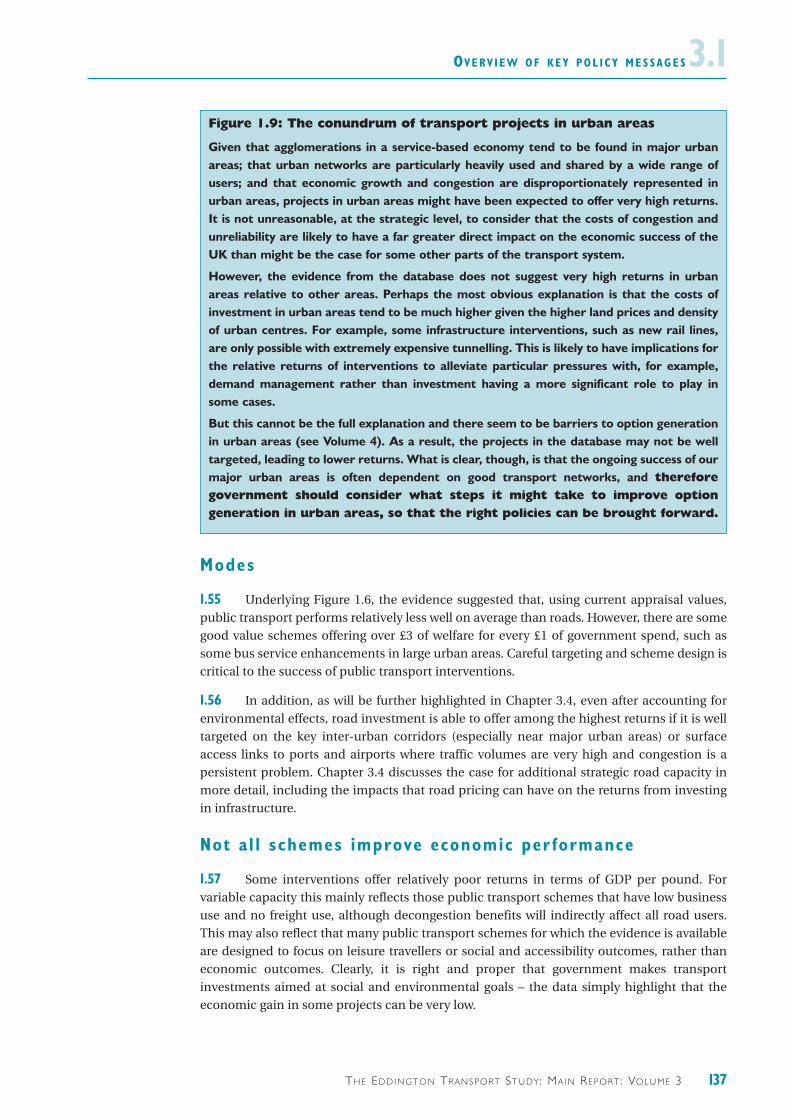
Given that agglomerations in a service-based economy tend to be found in major urbanareas; that urban networks are particularly heavily used and shared by a wide range ofusers; and that economic growth and congestion are disproportionately represented inurban areas, projects in urban areas might have been expected to offer very high returns.It is not unreasonable, at the strategic level, to consider that the costs of congestion andunreliability are likely to have a far greater direct impact on the economic success of theUK than might be the case for some other parts of the transport system.
However, the evidence from the database does not suggest very high returns in urbanareas relative to other areas. Perhaps the most obvious explanation is that the costs ofinvestment in urban areas tend to be much higher given the higher land prices and densityof urban centres. For example, some infrastructure interventions, such as new rail lines,are only possible with extremely expensive tunnelling. This is likely to have implications forthe relative returns of interventions to alleviate particular pressures with, for example,demand management rather than investment having a more significant role to play insome cases.
But this cannot be the full explanation and there seem to be barriers to option generationin urban areas (see Volume 4). As a result, the projects in the database may not be welltargeted, leading to lower returns. What is clear, though, is that the ongoing success of ourmajor urban areas is often dependent on good transport networks, and thereforegovernment should consider what steps it might take to improve optiongeneration in urban areas, so that the right policies can be brought forward.

OV E R V I E W O F K E Y P O L I C Y M E S S A G E S3.1What d i f ference do the miss ing GDP impacts make?
1.58 Although current appraisal methodologies capture a significant proportion of aproject’s economic impact, some effects are not captured at all. These missing elements havebeen estimated for the purposes of this study, using the developing DfT guidance on theassessment of wider economic benefits, and appear in the figures above.12 These may be asmall proportion of the total benefits but the magnitude varies significantly by scheme andlocation and in some cases can be substantial in absolute terms. They can be particularlyimportant for some schemes and areas with this analysis suggesting some 30-40 per cent, andpotentially up to 50 per cent could be added to the benefits. In effect, this means thattraditional appraisal has been significantly understating the benefits of some interventions.As noted above, the benefits to trade and globally mobile investment are still unmeasured butwould provide additional uplift, where they are demonstrated.
1.59 Figure 1.5 demonstrated the relative contribution of the GDP impacts that arecurrently ‘missing’ from standard appraisals and business cases. Given the potentialsignificance of these missing impacts, it is important that formal appraisal methodologiesshould evolve to incorporate these impacts as the evidence around them firms up.
1.60 The inclusion of these impacts will have implications for relative priorities. Forexample, for growing and congested urban areas, the average addition to the BCR is thehighest, at 0.7. The addition is lower for other priority links at around 0.4 for internationalgateways and 0.1 for inter-urban corridors. Again, these are averages for all evidence availableso must be interpreted in that context; there are likely to be significant variations at theindividual scheme level.
1.61 However, this is only one new addition to conventional cost-benefit analysis. Theother important development is on environmental and social valuations.
Account ing for env ironmenta l impacts and access ib i l i tywhen assess ing va lue for money
1.62 As outlined in Figure 1, some of the impacts of transport improvements are inherentlydifficult to monetise. Such impacts – notably environmental impacts – play a fundamentalrole in broader welfare and sustainable development priorities. Such impacts affectgovernment’s broader objectives and issues that the public value and, as the Stern Review hasconvincingly demonstrated, they can also affect economic growth.
1.63 In order to assess how emerging evidence on the monetary valuation of these impactswould alter priorities, roughly a third of the schemes discussed in this chapter were reviewedand best judgements made of the value of many of the currently non-monetised impacts thatare not included in the wider BCRs using available valuation evidence, for example usingDefra values for carbon13 and air quality impacts. This analysis can only be carried out in anaggregate way so the figures need to be interpreted with care and are to be regarded asindicative (the value for money assessment is not normally intended to be so precise). Theestimated impacts were illustrated in Figure 1.6.
1.64 Despite some transport interventions having adverse implications for theenvironment, such as road widening and airport expansion, many still offer very goodreturns. This is particularly likely to be the case where the most severe of transport problemsare being addressed.
Returns remainhigh
Environmentaland other
impacts must beaccounted for
A significantproportion of
the benefits has previously been missing
138 TH E ED D I N GT O N TR A N S P O RT ST U DY: MA I N RE P O RT: VO LU M E 3
12 See www.dft.gov.uk: Transport, wider economic benefits and impacts on GDP, DfT, 2005.13 In October 2006, DfT issued new guidance on how the value of greenhouse gas emissions should be monetised andincorporated in the appraisal. See www.webtag.org.uk.
OV E R V I E W O F K E Y P O L I C Y M E S S A G E S 3.11.65 Accounting for social and environmental effects tends to increase the relative returnsof public transport interventions, as might be expected. Indeed, in value for money terms theaverage public transport scheme is broadly equivalent to roads, though there is a muchgreater spread of returns on roads (with some very high and some very low returns).
1.66 Environmental impacts are highly location specific so it is difficult to generalise ontheir magnitude for any given type of intervention. For example, the same scale of road in onearea could be broadly neutral in terms of environmental effects, but in a different locationcould be severely adverse to the extent that the overall value for money is poor.
1.67 In the majority of cases, the impacts of public transport interventions are less adverseand in some cases will be beneficial. Often, this stems from the higher incentive for modeshift from cars and the fact that they tend to have lower impacts on the ‘footprint’ of fixedinfrastructure. However, large new public transport fixed infrastructure, such as new rail lines,would be expected to have an adverse impact on landscape and possibly on emissions(depending on mode shift).
1.68 Some types of schemes that show good welfare returns, such as public transport,utilisation, walking and cycling, will also have environmental benefits due to their lowrequirements for land and infrastructure, and their impacts on congestion reduction. Pricingalso has the potential to have positive air quality benefits by providing for freer-flowing trafficand it reduces the need for new infrastructure build, as will be discussed in Chapters 3.3 and 3.4.
SUMMARY OF CONCLUSIONS
1.69 The key conclusions from this overview, and from the following chapters, are asfollows.
1. The case for targeted transport interventions is compelling: very highreturns are achievable even after environmental costs are factored in.
• Some very high returns on government spending are possible from welltargeted transport policies with welfare returns often offering more than£5 of welfare for every £1 invested and sometimes over £10.
• Returns are likely to be particularly high when targeted at relieving pinchpoints and bottlenecks arising where there are competing demands fromlarge volumes of different users.
• Whilst well-targeted, small-scale interventions can often deliver thehighest returns, they may not be sufficient to tackle the full scale of theproblems facing the UK.
2. Policies that raise the performance of the current transport networks standout above other interventions in offering the potential to deliver for GDP andminimise environmental and social impacts; but the challenges and risksmust be well managed.
• There are strong economic and environmental arguments for ensuringusers across all modes face the full external costs of their journeys, bethey environmental or congestion related. This could be done throughappropriate fiscal, regulatory, pricing or trading instruments.
Multiple goals
Public transportmeasures show
increased relativereturns
139TH E ED D I N GT O N TR A N S P O RT ST U DY: MA I N RE P O RT: VO LU M E 3

OV E R V I E W O F K E Y P O L I C Y M E S S A G E S3.1• Introducing well-targeted pricing on the UK transport system, and in
particular road pricing, offers enormous potential for improvingnetwork performance by spreading demand, lowering congestion andovercrowding, improving reliability and delivering GDP benefits.
• Making road pricing happen has risks that are real and there issignificant uncertainty over costs, behavioural responses and long termimpacts that will all need to be carefully managed.
• Better use measures could significantly reduce the economic case foradditional road capacity – and hence avoiding associated environmentaldamage – and strengthen the case for improved public transport;complementary policies are likely to be worth considering.
3. The economic case for targeted new transport infrastructure and variablecapacity is strong and offers high returns.
• Small-scale interventions such as walking and cycling schemes candeliver some very good returns and, in some cases, variable capacitysuch as bus services can potentially offer a higher return than high-costnew fixed infrastructure solutions.
• Private sector investment in container, feeder and ro-ro ports capacity,and in airports, is very important for the UK economy and, subject to fullconsideration of all environmental costs, prevents capacity constraintsdampening trade and growth; very high returns from targeted surfaceaccess schemes are possible.
• Targeted investment in strategic roads is able to offer among the highestoverall welfare returns, even after accounting for the environmentaleffects. Additional urban road capacity could, in some circumstances, bethe highest-return solution to urban transport problems.
• Even with widespread road pricing, there is likely to be a case foradditional strategic road capacity, given the magnitude of pressuresfacing the UK.
• Step-change measures intended to transform the economy are not, in aworld of constrained resources, likely to be a priority. The UK is alreadywell connected and the demands for new links are uncertain.
• Where new and untested technologies are relied on, or where demandfor the new link is only speculative, expensive step-change transportpolicies are unlikely to offer the best value for money in meetingeconomic or environmental objectives.
140 TH E ED D I N GT O N TR A N S P O RT ST U DY: MA I N RE P O RT: VO LU M E 3
OV E R V I E W O F K E Y P O L I C Y M E S S A G E S 3.1
141TH E ED D I N GT O N TR A N S P O RT ST U DY: MA I N RE P O RT: VO LU M E 3
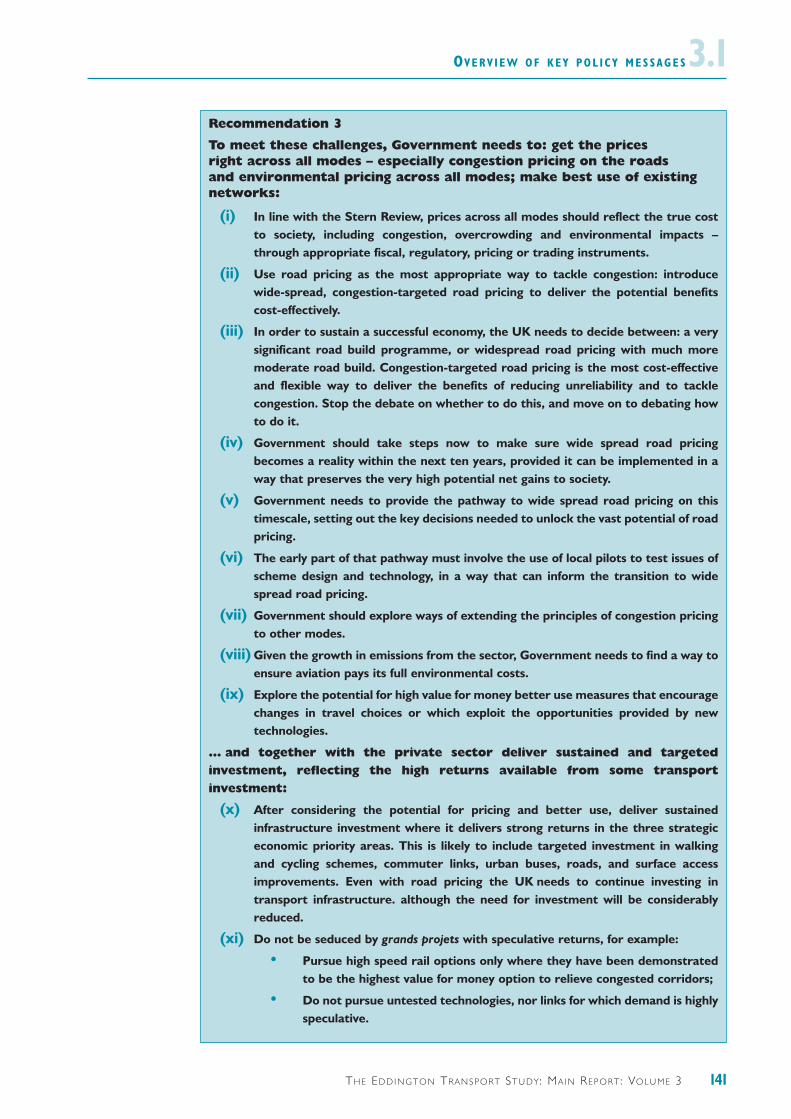
Recommendation 3
To meet these challenges, Government needs to: get the prices right across all modes – especially congestion pricing on the roads and environmental pricing across all modes; make best use of existingnetworks:
(i) In line with the Stern Review, prices across all modes should reflect the true costto society, including congestion, overcrowding and environmental impacts –through appropriate fiscal, regulatory, pricing or trading instruments.
(ii) Use road pricing as the most appropriate way to tackle congestion: introducewide-spread, congestion-targeted road pricing to deliver the potential benefitscost-effectively.
(iii) In order to sustain a successful economy, the UK needs to decide between: a verysignificant road build programme, or widespread road pricing with much moremoderate road build. Congestion-targeted road pricing is the most cost-effectiveand flexible way to deliver the benefits of reducing unreliability and to tacklecongestion. Stop the debate on whether to do this, and move on to debating howto do it.
(iv) Government should take steps now to make sure wide spread road pricingbecomes a reality within the next ten years, provided it can be implemented in away that preserves the very high potential net gains to society.
(v) Government needs to provide the pathway to wide spread road pricing on thistimescale, setting out the key decisions needed to unlock the vast potential of roadpricing.
(vi) The early part of that pathway must involve the use of local pilots to test issues ofscheme design and technology, in a way that can inform the transition to widespread road pricing.
(vii) Government should explore ways of extending the principles of congestion pricingto other modes.
(viii) Given the growth in emissions from the sector, Government needs to find a way toensure aviation pays its full environmental costs.
(ix) Explore the potential for high value for money better use measures that encouragechanges in travel choices or which exploit the opportunities provided by newtechnologies.
… and together with the private sector deliver sustained and targetedinvestment, reflecting the high returns available from some transportinvestment:
(x) After considering the potential for pricing and better use, deliver sustainedinfrastructure investment where it delivers strong returns in the three strategiceconomic priority areas. This is likely to include targeted investment in walkingand cycling schemes, commuter links, urban buses, roads, and surface accessimprovements. Even with road pricing the UK needs to continue investing intransport infrastructure. although the need for investment will be considerablyreduced.
(xi) Do not be seduced by grands projets with speculative returns, for example:
• Pursue high speed rail options only where they have been demonstratedto be the highest value for money option to relieve congested corridors;
• Do not pursue untested technologies, nor links for which demand is highlyspeculative.
OV E R V I E W O F K E Y P O L I C Y M E S S A G E S3.1
142 TH E ED D I N GT O N TR A N S P O RT ST U DY: MA I N RE P O RT: VO LU M E 3
(xii) Government should provide the policy framework to ensure that the privatesector can bring forward proposals to expand capacity at key ports and airports,where it is sustainable to do so:
• Implement proposals for additional runway capacity where the case isrobust, having accounted for the environmental costs of emissions.
• Provide clear statements of strategic objectives to enable the privatesector to continue to bring forward appropriate additional capacity atports that are important for the UK economy.

3.2 OP E N I N G U P T H E F U L L R A N G E O F P O L I C YO P T I O N S
TH E ED D I N GT O N TR A N S P O RT ST U DY: MA I N RE P O RT: VO LU M E 3
INTRODUCTION
2.1 The impacts of transport interventions can vary significantly. Their location-specificnature means that it is not possible to identify a policy option that is effective in one area andassume that, if implemented elsewhere, it would have the same impacts and cost the same todeliver.
2.2 The choice of intervention to implement is, therefore, very complex and requiresconsideration of a wide range of factors if particular problems are to be tackled effectively andthe highest levels of welfare return are to be achieved.
2.3 In order to build an understanding of the interventions that are able to contributeeffectively to welfare, it is first necessary to identify the range of possible policy options thatcould deliver on the strategic priorities identified in Volume 2. This chapter first sets out someoverarching issues for consideration before going on to identify a menu of policy options.
THE RANGE OF POLICY OPTIONS
2.4 Volumes 1 and 2 have shown that in the long term, the characteristics of the transportsystem that business, freight and commuters value are speed and reliability of journey times,cost, connectivity and comfort. These transport outcomes directly support economic activity,so options that deliver on these counts are likely to deliver GDP benefits.
2.5 It may not be possible, or necessary, for a policy option to deliver all these transportoutcomes at once. Some transport policy options may not deliver any of these outcomes, butmay be considered good value for money because they contribute to other governmentobjectives such as safety, accessibility or environmental protection – all of which are assessedas part of transport appraisal. In designing policies targeted at a particular objective, such asGDP, policy makers should recognise that there are likely to be implications for otherobjectives, such as social inclusion or environmental protection. More fundamentally, policymakers need to be aware that some options help to meet multiple goals.
143
Headlines
• A good option generation process is crucial to ensure that the transportinterventions that offer the highest returns can be found.
• This means starting with a good understanding of the strategic priorities and thechallenges that need to be addressed, before considering potential solutions.
• At present some propositions start by suggesting a ‘single solution’ rather thandefining the problem.
• Unless a wide range of appropriate options is considered, there is a risk that thebest options are overlooked and money could be wasted.
• The full range of options should look across all modes and include: making betteruse of the existing transport system, including better pricing; investing in assetsthat increase capacity without the need for additional fixed infrastructure;investment in long-life fixed infrastructure; and combinations of these options.
OP E N I N G U P T H E F U L L R A N G E O F P O L I C Y O P T I O N S3.22.6 In undertaking this study, it has become clear that some schemes are promoted assolutions without having defined the problem, and without having considered a range ofoptions. Often, interventions are promoted as catch-all schemes without being closelytargeted to deliver specific outcomes as identified above. So, the first step towards transportpolicy that supports sustainable growth better is to understand which links are under-performing and on what counts. Only then can options be generated that will best tacklethose problems and deliver the best returns for the economy and to society more widely.
2.7 There will be more than one way to meet most transport challenges, and not all willbe equally cost-effective. In a resource-constrained world, with many competing demands ongovernment funds, it will never be possible for government to fund all good schemes.Prioritisation must be carried out, and carried out well. Government can do most for GDP,and for social and environmental objectives, by backing those policies and schemes that offerthe highest returns across these objectives.
2.8 To be confident of finding the best returns, the option generation process is crucial:the right problems need to be tackled, and a sufficient range of alternatives considered fromthe option menu (though the extent of an appraisal needs to be proportionate to the size andscale of the problem).
2.9 Interventions across modes, across the country, and from the very large to the verysmall have been examined in this volume. A spectrum of different types of intervention hasemerged, which can be broadly described as:
• better use: interventions that lead to more efficient use of the existingtransport system;
• variable capacity: investment in shorter- and medium-life assets that increasethe capacity of the transport system without the need for additional fixedinfrastructure, for example additional bus services or longer trains andplatforms; and
• fixed infrastructure: investment in additional very long-life capital assets onthe ground, such as roads, rail lines, ports etc.
2.10 In very general terms, scale, cost, delivery time and complexity will tend to increasegoing down the list. There are exceptions to this rule: while many better use schemes aresmall, cheap and relatively quick to implement, some are not. For example, depending on thetechnology chosen, implementing widespread road pricing could be very complicated.Likewise, some options that increase variable capacity could be very expensive. In addition,infrastructure options may still present challenges in terms of the cost and complexity oftaking them through the planning process and mitigating potential social and environmentalimpacts.
2.11 This spectrum of options is explored more fully below. All of the options on the menuimprove effective performance of the network by focusing on the key characteristics of speedand variability of journey times, cost, connectivity and comfort.
BETTER USE
2.12 The UK transport network is a vast asset that, as Volume 2 demonstrated, has the rightconnections in place and is able to support a high volume of movements. However, as wasalso shown, the performance of the network in some places and at certain times of day isrelatively poor with significant scope for taking action to make better use of the assets.
The full policyrange is
important
Prioritiseinvestment on
the basis of thebest overall
returns
144 TH E ED D I N GT O N TR A N S P O RT ST U DY: MA I N RE P O RT: VO LU M E 3
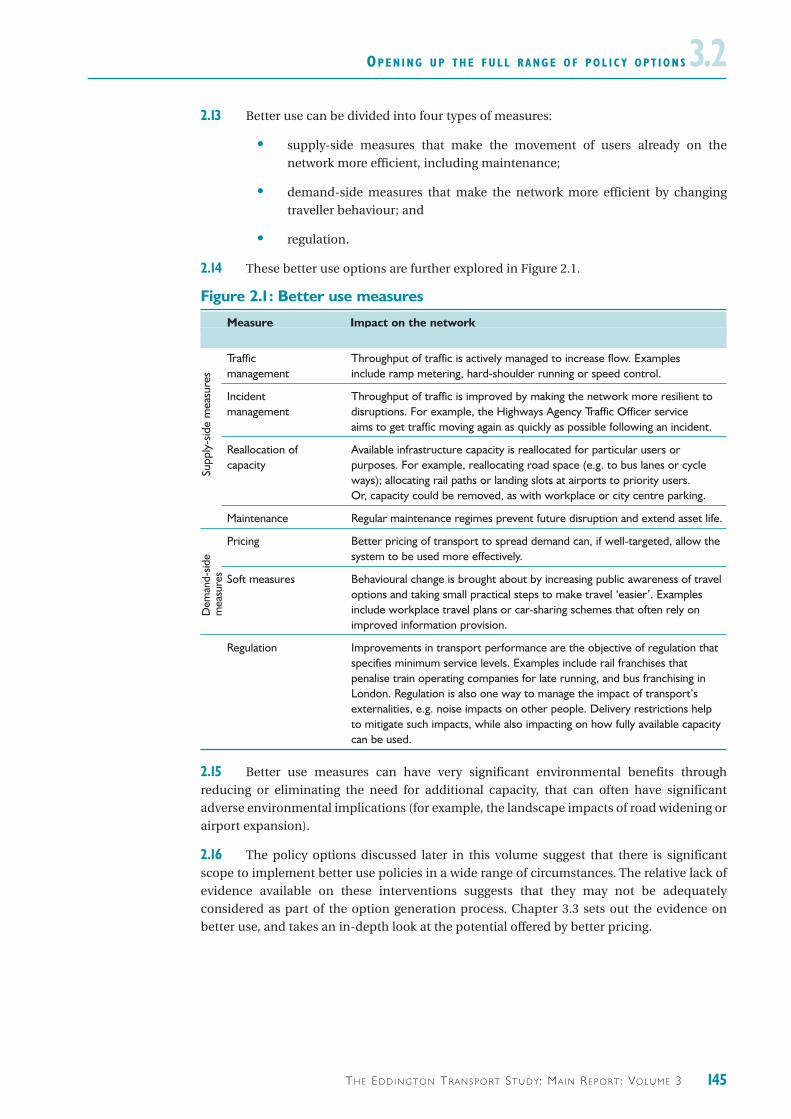
2.13 Better use can be divided into four types of measures:
• supply-side measures that make the movement of users already on thenetwork more efficient, including maintenance;
• demand-side measures that make the network more efficient by changingtraveller behaviour; and
• regulation.
2.14 These better use options are further explored in Figure 2.1.
Figure 2.1: Better use measures
Measure Impact on the network
Traffic Throughput of traffic is actively managed to increase flow. Examplesmanagement include ramp metering, hard-shoulder running or speed control.
Incident Throughput of traffic is improved by making the network more resilient to management disruptions. For example, the Highways Agency Traffic Officer service
aims to get traffic moving again as quickly as possible following an incident.
Reallocation of Available infrastructure capacity is reallocated for particular users or capacity purposes. For example, reallocating road space (e.g. to bus lanes or cycle
ways); allocating rail paths or landing slots at airports to priority users. Or, capacity could be removed, as with workplace or city centre parking.
Maintenance Regular maintenance regimes prevent future disruption and extend asset life.
Pricing Better pricing of transport to spread demand can, if well-targeted, allow the system to be used more effectively.
Soft measures Behavioural change is brought about by increasing public awareness of travel options and taking small practical steps to make travel ‘easier’. Examples include workplace travel plans or car-sharing schemes that often rely on improved information provision.
Regulation Improvements in transport performance are the objective of regulation that specifies minimum service levels. Examples include rail franchises that penalise train operating companies for late running, and bus franchising in London. Regulation is also one way to manage the impact of transport’s externalities, e.g. noise impacts on other people. Delivery restrictions help to mitigate such impacts, while also impacting on how fully available capacity can be used.
2.15 Better use measures can have very significant environmental benefits throughreducing or eliminating the need for additional capacity, that can often have significantadverse environmental implications (for example, the landscape impacts of road widening orairport expansion).
2.16 The policy options discussed later in this volume suggest that there is significantscope to implement better use policies in a wide range of circumstances. The relative lack ofevidence available on these interventions suggests that they may not be adequatelyconsidered as part of the option generation process. Chapter 3.3 sets out the evidence onbetter use, and takes an in-depth look at the potential offered by better pricing.
Dem
and-
side
mea
sure
sSu
pply
-sid
e m
easu
res
OP E N I N G U P T H E F U L L R A N G E O F P O L I C Y O P T I O N S 3.2
145TH E ED D I N GT O N TR A N S P O RT ST U DY: MA I N RE P O RT: VO LU M E 3

OP E N I N G U P T H E F U L L R A N G E O F P O L I C Y O P T I O N S3.2VARIABLE CAPACITY
2.17 Better use options are concerned with taking the transport system as it is and using itmore effectively to improve its performance. But in some cases, there may be an economiccase for adding capacity to the transport system. Additional variable capacity involvesinvesting in those assets that deliver an increase in effective capacity of the transport networkwithout the need for significant additional fixed infrastructure. Examples of additionalvariable capacity are set out below:
• Bus services: this captures a range of options including new routes, higherservice frequency, investment in new vehicles to increase onboard capacity, orbetter signage.
• Train capacity: this could involve investment in new rolling stock to increaseonboard capacity, and longer trains to increase the capacity available on eachtrain service. In some cases the distinction between variable and fixedinfrastructure as discussed next, may be somewhat blurred e.g. when longertrains mean longer platforms.
• Signalling: upgrading rail signalling can allow a reduction in the gap betweentrains that increases the effective capacity of a given rail line. This may requiresignificant investment but would have the potential to improve journey timesand reliability.
2.18 Chapter 5 sets out the evidence on variable capacity options.
FIXED INFRASTRUCTURE
2.19 Investment in fixed infrastructure refers to investment in long-life capital assets thatincrease the geographical scope of the transport network and create a larger ‘footprint’ on theground. It is costly and generally non-reversible, so is only likely to be an option where asufficiently high level of demand can be guaranteed over the long term. Additional fixedinfrastructure can, if delivered well, improve journey time and reliability, and new links mayimprove connectivity. Examples of fixed infrastructure options are set out below:
• walking and cycling infrastructure: providing dedicated walkways and cycle-ways to improve journeys by these modes;
• additional rail capacity: new or longer platforms, new or enhanced stations,line extensions, dual tracking, rail gauge enhancement, bridges and tunnelscan all be implemented to significantly increase capacity;
• additional road capacity: new roads, upgrades to trunk road or motorwaystandard, on-line or off-line widening, bridges and tunnels;
• junction improvements: junctions that are the cause of many congestionproblems can be upgraded to improve traffic flows thereby improving journeytime and reliability;
• additional port and airport capacity: additional runways, quayside capacity,and airport facilities; and
• public transport interchange facilities: where travellers need to change fromone mode to another such as from bus to rail or rail to the undergroundnetwork, interchanges impact on the overall journey time and reliability.
146 TH E ED D I N GT O N TR A N S P O RT ST U DY: MA I N RE P O RT: VO LU M E 3

OP E N I N G U P T H E F U L L R A N G E O F P O L I C Y O P T I O N S 3.22.20 The majority of these fixed infrastructure options are likely to have long lead deliverytimes and require significant investment so it is even more important to make sure the rightoption is pursued. Such options are also most likely to have negative environmental or socialconsequences so, as always, a full value for money assessment needs to be carried out toestablish the case for investment.
2.21 Alongside the evidence on variable capacity, Chapter 5 also sets out the evidence onfixed infrastructure options for each of the strategic priorities identified in Volume 2, namelycongested and growing cities, key inter-urban links and key international gateways.
WHICH OPTIONS TO PURSUE, AND WHEN
2.22 Choosing the highest return combination of better use, additional variable capacityor new fixed infrastructure solutions first requires a full understanding and definition of theproblem to be addressed. The options from the policy menu that are most likely to be costeffective will, of course, vary according to the particular circumstances in which they areimplemented. Good quality appraisal is, therefore, needed so that options can be comparedand the most effective options identified.
2.23 In many cases packages of better use and variable or fixed infrastructure optionscould be most effective. The potential for synergies and complementarities between policyoptions should be considered as they may be able to deliver benefits that exceed the returnsoffered if implemented separately. In some circumstances, it may make sense to implementbetter use options while, at the same time, work on delivering a major fixed infrastructureenhancement. It is of course possible that some policy options would not work well together.One of the most important interactions in this regard is the impact of better pricing inreducing the need for more road infrastructure, which is explored in Chapter 5.
2.24 In looking at the policy options, the Study’s starting points have been as follows:
• where congestion and overcrowding problems are significant, there is a strongpresumption that better use and better pricing options, and their impact oninvestment needs, should be considered;
• enhancing variable infrastructure can in some cases be more flexible thanproviding fixed infrastructure;
• better use and variable capacity options have a smaller ‘footprint’ so may havelower landscape and biodiversity costs than fixed infrastructure projects; and
• packages of options offer important choices in their own right.
2.25 The next chapters set out the evidence available to this study on the returns from awide range of interventions across the policy options, and identify the conditions underwhich a high contribution to welfare and GDP is likely.
Packages ofinterventions canin some cases be
worthwhileconsidering
147TH E ED D I N GT O N TR A N S P O RT ST U DY: MA I N RE P O RT: VO LU M E 3

148 TH E ED D I N GT O N TR A N S P O RT ST U DY: MA I N RE P O RT: VO LU M E 3
INTRODUCTION
3.1 The options menu identified a wide range of policy interventions that can beimplemented to solve transport problems cost-effectively and deliver strong welfare and GDPreturns. This chapter focuses on the options for making better use of the transport system.
3.2 This chapter is structured by the type of intervention with the implications for thestrategic priorities highlighted throughout. There are two main parts to the chapter. First, therelevance of better use options to the UK is set out. The available evidence on the following isthen discussed:
• supply-side measures such as traffic management and maintenance;
• demand-side measures that provide incentives to change travel behaviour;and
• regulatory policy and the role it has in improving the operation of thetransport system.
3.3 Second, given the wide range and potential impacts of pricing options, a closer look atthese measures is provided in the later part of this chapter.
Headlines
• Better use options – including pricing – offer very significant potential to improvethe performance of the transport network.
• By releasing effective capacity without the need to add significant infrastructure,better use options are often lower cost and in most cases likely to be deliveredrelatively swiftly, with minimal or even beneficial impacts on the environment.
• Well-designed pricing stands out above all other interventions given its substantialpotential to contribute to welfare and GDP, particularly if roads are better priced.a
• Better use options are likely to reduce the economic case for additionalinfrastructure, such as roads; the impact on the case for public transportinfrastructure is less well understood but could increase in some places;
• Smart measures have the potential to provide benefits for the economy and theenvironment, plus offer health benefits, but there is a need to understand the costsof these interventions better.
• Maintenance plays a role in influencing the lifetime cost of providing an operationaland reliable transport system, but the returns on this spending are currently notwell understood.
a See the headlines to the second part of this chapter.
3.3 MA K I N G B E T T E R U S E O F C U R R E N TN E T W O R K S
ED D I N GT O N ST U DY: VO LU M E 3 149
MA K I N G B E T T E R U S E O F C U R R E N T N E T W O R K S3.3CONTEXT: WHY IS BETTER USE RELEVANT TO THE UK
3.4 The UK possesses an extensive transport system that represents an extremely valuablenational asset. Adding to this network is expensive and the UK is already relatively wellconnected, as the analysis in Volume 2 revealed. One of the key strategic challenges fortransport policy, is therefore, to improve the performance of the existing network; better usemeasures will be a key component of this.
3.5 The transport network is often characterised by periods of peaky demand, outside ofwhich there is often spare capacity. One of the advantages of better use measures is theirability to relieve capacity constraints when it would be particularly beneficial around the peakperiods. This may be through spreading demand to less congested periods or switchingdemand to alternative networks. Many better use measures rely less on new fixedinfrastructure so can often be implemented more quickly, and with more flexibility, thanother measures. For example where additional and better information is provided totravellers by making use of existing communication systems.
3.6 As will be demonstrated in the rest of this chapter, evidence on better use measures inthe UK is an emerging field. This chapter presents the quantitative evidence on benefit:costratios (BCRs) that is available and supplements this with more indicative qualitative evidence(typically providing estimated impacts without reference to costs) where appropriate. Ofcourse, only measures with wider BCRs appear in the full database of schemes available tothis study. That there is relatively limited evidence is unsurprising, given that many better usemeasures are associated with new technological opportunities, or are relatively recentattempts to change behaviours.
3.7 In some cases, there is little quantitative evidence on the returns achievable from betteruse options because they are often introduced in packages, alongside infrastructureimprovements, or implemented in small, potentially private sector, initiatives. This makes itdifficult to identify the contribution of each element. The qualitative nature of the availableevidence is only able to provide indications of the potential for such schemes to achievewelfare benefits.
3.8 While significant gaps remain, the quantitative evidence suggests very considerablepromise for these measures, and the findings should be interpreted in this light. Nonetheless,to play their full role in the policy menu, much remains to be done to improve the collectiveunderstanding of the costs and benefits of many better use measures.
SUPPLY-SIDE MEASURES: ROAD TRAFFIC MANAGEMENT
3.9 Traffic-management and capacity-use measures in dense urban networks in the UKhave the potential to reduce congestion and increase the reliability of journey times.1 AsVolume 2 set out, these have already been implemented in some form in various urbancentres across the UK. Evidence available to this study on two traffic-management systems inlarge urban areas in the UK suggests strong potential for welfare benefits with wider BCRs inthe range 6.3-7.6 and GDP per £1 spent of £3.80-£4.40. Over half of the GDP impacts arederived from the value of time saved to business travellers who are able to travel more quicklyon a less congested network. Although the evidence sample size is obviously small, thereturns look promising and merit further investigation.
The potentialreturns fromurban traffic
controlmeasures are
promising
Better use canincrease effectivecapacity
without theneed for new
infrastructure
150 ED D I N GT O N ST U DY: VO LU M E 3
1 These systems utilise detectors embedded in the road to monitor traffic flows, responding to fluctuations byautomatically changing signal timings to allocate more junction capacity to traffic concentrated in particular directions, or, ifthe road is congested, to balance queue lengths.
MA K I N G B E T T E R U S E O F C U R R E N T N E T W O R K S 3.33.10 The environmental implications of traffic-management measures are likely to bebeneficial, given their objective of more efficient use of road space and lower congestion. Onthe basis that traffic should be able to travel in less congested conditions, harmful emissionsof carbon and air pollutants are likely to be lower. However, if there is more traffic overall thenthis would at least partially offset these benefits.
3.11 Traffic-control measures can also play an important role in improving the utilisation ofcongested inter-urban corridors. Few traffic management schemes currently exist in the UKbut there is evidence they can have a substantial effect on improving journey times andreliability. For example, the introduction of a peak time Higher Occupancy Vehicle (HOV) laneon the busy A4174 Avon ring road reduced the proportion of single occupancy cars during thepeaks from 80 per cent to 69 per cent, achieving a 70 per cent reduction in journey times forHOVs and bus traffic, and over 40 per cent reduction along the rest of the road. It is likely thatthere were knock-on effects on surrounding roads however, as traffic was redistributed.Owing to smoothed traffic flows, these savings occurred alongside a 10 per cent increase intraffic levels on that route, as vehicles rerouted onto the road. The exact costs of such schemeshave not been available to this study but there is a need in future to compare the costs of HOVlanes with their demonstrated benefits.
3.12 Traffic-management and capacity-use schemes on inter-urban corridors need to becarefully targeted otherwise they may produce distributional effects that limit their impacts.An HOV lane on the radial A647 road into Leeds, for example, successfully reduced journeytimes and the number of single occupancy vehicles on that link but this was achieved bysimply ‘exchanging’ traffic with alternative routes.
3.13 These inter-urban schemes may also have substantial one-off implementation costsowing to the need for complex signalling and roadside enhancements. Strategic modelling ofan illustrative active traffic-management scheme adopting hard shoulder running during thepeaks on a major strategic motorway in the West Midlands,2 suggested estimated costs of over£900 million. The returns were therefore lower than other traffic management schemes withan estimated wider BCR of 2 and GDP per £1 of £1.80. If the costs of technology fall over time,the relative returns will be correspondingly higher.
3.14 For both urban and inter-urban roads, local enforcement is likely to be necessary forthe majority of traffic management interventions to be most effective, as violation rates canbe high. For example, the A4174 HOV lane had violation rates of 7-11 per cent and relied onenforcement through local police monitoring because it was considered that technologicalenforcement measures would have been too costly.
3.15 It is important to recognise that making better use of existing infrastructure throughtraffic management, for example, does not mean using the infrastructure to its maximumpotential at all times, as this may in some circumstances lead to adverse reliability impactsoutweighing decongestion effects. Lack of understanding over the potential for adversereliability impacts, for example how one accident would have impacts on a larger volume ofroad users if the link were being more intensively used, means that this effect is difficult tocapture when assessing the benefits of an intervention. Figure 3.1 discusses this further.
Interventionsmust be targeted
151ED D I N GT O N ST U DY: VO LU M E 3
2 For more detail see the separate paper on this case study, M6 Hard Shoulder Running: Impact on the Economy, MottMacDonald, 2006.
MA K I N G B E T T E R U S E O F C U R R E N T N E T W O R K S3.3
CAPACITY USE ON OTHER MODES
3.16 The option of making better use of existing capacity is not restricted to the UK’s roadnetwork. Measures can be applied, and should be considered, across all transport modes.Employing measures of capacity management, for instance, can increase the efficiency of theUK’s international gateways.
3.17 In 2005, Southampton Container Terminal reorganised its yard, upgraded IT systemsand introduced a mandatory Vehicle Booking System (VBS). This system divided the port’svehicle-handling capacity into a series of hourly time slots, each of which couldaccommodate a maximum of 120 bookings. Lorries bringing or collecting containers nowhave to pre-book into a specific and available slot, rather than bunching during peak periods.
3.18 By rationing the terminal’s capacity use, the VBS has helped to reduce congestion andimprove reliability; average vehicle turnaround times have been reduced to under 30minutes, even during peak periods, when they were previously running at an average of 114minutes. This has improved productivity at the terminal, allowing it to reduce yard occupancywhile increasing volumes, and provided wider benefits to freight hauliers, who benefit frommore certain and efficient operations.
3.19 The Air Transport White Paper makes clear that airports should seek to make best useof their existing capacity. One way of doing this is for airports with more than one runway tomake the most of their runway capacity by operating it in ‘mixed mode’, with flights taking offand landing on all runways.
3.20 Work is currently underway to understand whether, how and when mixed-modeoperation could be delivered at Heathrow airport. Other airports using two runways couldalso explore this method of operation to allow them to realise the capacity and resiliencebenefits that mixed mode would deliver.
Mixed mode use could
release extrarunway
capacity
Better use canreduce
congestion atports
152 ED D I N GT O N ST U DY: VO LU M E 3
Figure 3.1: The relationship between capacity and reliability
Many better use measures are designed to release extra capacity from existinginfrastructure, reducing congestion on that link and thereby facilitating quicker and morereliable journeys. Indeed, recent better use measures such as Highways Agency TrafficOfficers aim to minimise the impact of accidents on road users, and therefore improvereliability. However, it is unlikely to be possible or desirable to make complete use of anasset’s capacity.
Most assets will possess a particular capacity usage beyond which further capacity releasecould start to have negative reliability impacts: lack of flexibility would mean any shocks tothe network, such as mechanical faults or accidents, would cause disproportionatedisruptions and temporary closures of the affected link.
The private sector view of deep-sea container terminals in the UK, for example, is thatideally, they operate at around 65 per cent of their potential capacity. When use exceedsthis level, congestion and delays can occur at an exponential rate, imposing extra costs onshipping companies, hauliers and port operators. A container terminal having to operatefor an extended period at around 75 per cent berth utilisation, could decrease itsprocessing abilities by 25 per cent. Resulting delays would damage the competitiveness ofthe port and disrupt domestic freight supply chains.
In examining the case for better use in particular areas and on particular modes, theoffsetting reliability impacts need to be taken into account.

MA K I N G B E T T E R U S E O F C U R R E N T N E T W O R K S 3.33.21 Importantly, plans to develop mixed mode at airports with more than one runway needto be carefully prepared to ensure that their consequences for safety, noise and emissions arefully understood and can be properly addressed. Leading issues include the need to ensure anadequate separation of craft in the air and on the ground, and changes to local noise contourscoming from the introduction of mixed mode. But even after accounting for these, the largeeconomic returns from the efficient use of existing capacity would allow a good overall netreturn. For instance analysis carried out for DfT suggested that employing mixed mode use atHeathrow could generate net benefits of £1.7 billion3 over the period to 2060.
MAINTENANCE
3.22 Transport infrastructure is capital intensive and has a long life. Many local roads arehundreds of years old and heavily used; and railways often date from the nineteenth century.To ensure their continued operation, all such assets need maintaining and periodicallyrenewing, for example rail lines are typically renewed every 30 years or so. The extent to whichthese assets are well maintained can influence the performance of the network and impact onthe reliability and safety of journeys. For example, poorly maintained roads could constrainspeeds and contribute to congestion problems.
3.23 There are many factors that influence the degree and level of maintenance spendingthat is appropriate for any transport asset. These include the use of the asset and how this islikely to change over time; climate conditions; the particular design and materials used; plus,accompanying policies. This range of factors introduces uncertainty over the long-term costsof sustaining the operational capacity of the asset. In order to understand maintenancerequirements, a comprehensive understanding of the UK’s full asset base is required,including its condition and the economic outcomes to which it contributes.
3.24 The evidence on the returns to maintenance expenditure is light, so it is possible tomake only some generic statements based on the available information and experiences.Where maintenance is concerned, it is especially important to understand the impacts andcosts of not taking action that in some cases could be particularly high. It would be expectedthat unless transport assets are maintained, there would be implications for the following:
• Asset life: at the most basic level, regular maintenance helps to ensure assetscontinue to function efficiently and have a suitable life span. For example,lack of maintenance could reduce the life of a rail line between 10 and 20years. It is usually more cost-effective to maintain assets at a certain level,rather than wait until significant degradation sets in which risks prematurerenewal or replacement. There are also likely to be wider costs in terms of lossof connectivity if a link no longer exists or if it falls into disrepair. This wouldbe particularly problematic for growth where few alternatives are in operationand the link is heavily used.
• Journey speeds and reliability: delays caused by poorly maintained assetscould be significant, with direct costs to the economy, especially if corridorsare heavily used by business, commuters and freight.
• Safety: adequate maintenance is necessary to meet obligatory safetystandards. Accidents caused as a result of safety failures have knock-on effectsin terms of disruption of journeys to users; and may have longer-term impactsfrom prolonged closure of links; and wider costs associated with addressingthe damage caused.
Economicbenefits frommaintenance
are littleunderstood
Maintenance is akey part ofbetter use
153ED D I N GT O N ST U DY: VO LU M E 3
3 South East and East of England Regional Air Services Study Stage 2: Appraisal Findings Report – Supporting Documentation,Economic Appraisal, DTLR 2002, Table 5.3.

MA K I N G B E T T E R U S E O F C U R R E N T N E T W O R K S3.33.25 However, it is important to have a sensible approach to maintenance. There is abalance to be struck between ensuring the asset is able to operate effectively and the costs ofmaintenance, including both the financial investment and the disruption from carrying outworks. There is limited evidence available to this study on that balance.
3.26 To allow asset management and maintenance policy to contribute effectively to betteruse of the system, it is likely that it should:
• take a whole-life cost minimisation approach to the maintenance of assets;
• include an economic assessment of the impact on different users of thenetwork, including disruption disbenefits when prioritising maintenanceinterventions;
• maintain strict safety standards; and
• be supported by up-to-date information on the condition of the relevant linksof the transport system, and therefore the maintenance requirements andoptions.
3.27 Given the lack of information on the impacts on GDP and welfare of maintenancespending, and on how much should be spent to reduce the life cost of the assets, thereremains an overarching need for government to build a stronger understanding of theseissues. Only then can appropriate decisions be made and priorities properly assessed.
DEMAND -SIDE MEASURES: INFLUENCING TRAVEL CHOICEAND BEHAVIOUR
3.28 Transport interventions, such as pricing, improved interchange facilities, smartcards,and a wide range of smart measures, designed to influence choice and behaviour, canproduce a wide range of effects on travel decisions. These are often concerned with improvingthe performance of existing networks or promoting mode shift by:
• allowing prices to reflect the level of demand, congestion and overcrowding;
• improving inter-network connectivity and supporting multi-modal journeys,for example by providing a smooth connection between intercity trainservices and those serving an urban catchment area or moving betweenmodes; and
• changing attitudes and behaviours, for example by increasing the quality andattractiveness of modes such as walking or public transport.
Pric ing to re f lect demand
3.29 A greater degree of demand-related pricing has the potential to deliver substantialwelfare and GDP returns. This way of allocating limited resources is seen in many sectors:mobile phone tariffs, concert tickets etc. Prices rise when there are greater demands for agood or service than is actually available, such as for peak-time telephone calls, andconversely fall when demands are lower such as post-season sales or pre-theatre dinnerbookings. Prices also vary according to the quality of the good or service on offer: luxurygoods are more expensive than basic standard goods, for example. However, these principlesof pricing are often not currently applied widely to transport infrastructure and services.
Influencingbehaviour can
significantlyimprove theperformance
of the network
Maintenanceneeds to bemanaged to
avoid disruption
154 ED D I N GT O N ST U DY: VO LU M E 3

MA K I N G B E T T E R U S E O F C U R R E N T N E T W O R K S 3.33.30 As pricing is a fundamental part of any efficient market, it follows that better transportpricing would allow the networks to be used much more efficiently.
3.31 Travellers are then able to make choices depending on the value they place on a tripcompared to the price being charged. Provided the pricing regime is well designed and pricesare well targeted to reflect pressures on the network and the true costs of travel, there is thepotential for significant benefits. Implementing better pricing in this way allows externalitiesto be priced in, with the real benefit of providing capacity for those travellers that value itmost. The value a particular traveller places on a journey will depend on their reason fortravelling, which will change regularly. For example, the same person would place a differentvalue on their trip to get to a hospital appointment on time, than on their trip to thesupermarket, and a different value again on a journey to get to a meeting when they are atwork. Travel decisions will therefore be different in each case. Being able to make the journeysthat are really valued in less congested and more reliable conditions, is a real benefit.
3.32 There would be distribution effects to consider with pricing, given the variation in theextent to which travellers have the flexibility to respond to the implementation of betterpricing. Given the scale of benefits, the pricing issue is discussed in more detail in the secondpart of this chapter.
Improv ing inter-network connect iv i ty and support ingmult i -modal journeys : interchanges
3.33 By improving the convenience and accessibility of public transport networks,interchanges can support labour markets and agglomeration effects. Providing a greaterchoice of onward journeys, interchanges can encourage and enable users, notablycommuters, to travel further and widen catchment areas. The schemes on which this studyhas evidence, however, show low GDP returns per £1 spent in the range £0.2-£1.4, with themajority being less than £1. It is possible, though, that the full GDP benefits of interchangesare not being captured because, although such benefits are captured in the assessment ofwelfare, how they feed through into a GDP effect is not currently understood.
3.34 However, wider BCRs from the evidence are in the range 1 to 6. Quality factors form animportant component of the welfare returns from improved interchange facilities. By way ofillustration, Figure 3.2 sets out the value travellers place on various facilities at bus stops.Good interchange facilities are therefore able to contribute to quality of life, if not to GDPdirectly.
Figure 3.2: Value of bus stop facilities (pence per trip 1995 prices)
Shelter with roof and end panel 5.6
Basic shelter with roof 4.5
Moulded seats at bus stop 3.4
Lighting at bus stop 3.1
Flip seats at bus stop 2.2
Bench seats at bus stop 0.9
Clean bus stop (compared with dirty) 11.8
Countdown (Real Time Information) 9.0
Payphones at bus stop 3.8
Source: DfT, Public Transport Quality Literature Review, 2003.
And havewider quality
benefits
Interchangescan support
labourmarkets and
agglomeration
Pricing has thepotential
to be highlyeffective
155ED D I N GT O N ST U DY: VO LU M E 3

MA K I N G B E T T E R U S E O F C U R R E N T N E T W O R K S3.3Changing att i tudes and behav iours : smartcards andsmart measures
3.35 Intelligent smartcard systems are a technological solution that can help contribute tobetter use of the transport system by facilitating the implementation of other policies, such asdifferent pricing schedules, and reducing many of the time costs associated with publictransport travel, such as buying tickets. Combined, these can reduce the overall cost ofmaking certain trips and encourage some travel to be made by public transport that mightnot otherwise have been made, or by changing the time of travel to less congested times.
3.36 The ability of smartcards to collect data on travel patterns across the various parts ofthe network and at various times of day, makes it easier for operators to provide a flexibleservice and match supply to demand. As London’s Oyster card has demonstrated, smartcardtechnology also has the potential to enable the introduction of flexible pricing policies onpublic transport networks.
3.37 In order to exploit economies of scale and the benefits to public transport users whoare interchanging between modes, smart cards are more likely to be cost-effective overrelatively wide areas where public transport demand is high. And on a national level, theremay be wider network benefits from ‘inter-operable’ systems that are compatible acrossdifferent locations.
3.38 Smart measures tend to be primarily targeted at problems during the commuter peakson congested urban and inter-urban roads with the aim of facilitating better and moreefficient use of cars; by promoting car pools or car sharing for example, or providing theincentive to travel using alternative modes of transport by highlighting the benefits ofalternative means of travel. School buses can also play a role in this regard, and have beenintroduced in some areas, with the aim of easing pressure on the road system caused by theschool run.
3.39 Such measures are usually designed to provide greater transport choice, knowledgeand accessibility. By attracting people away from private car use and onto alternative modes,smart measures may help reduce congestion, as shown in the example in Figure 3.3.
3.40 Many smart measures rely heavily on various forms of information provision such asreal time information on public transport; publicising services on the internet; and raisingawareness of travel options to broaden the choices available for travellers and make journeysmore efficient.
Smartmeasures offer
potential forreduced
congestion
Smartcardscan provide a
range of benefits
156 ED D I N GT O N ST U DY: VO LU M E 3

MA K I N G B E T T E R U S E O F C U R R E N T N E T W O R K S 3.3
3.41 Measures that influence behaviour and choice will primarily be employed in majorurban areas and their catchments, where peak-time congestion often considerably lengthenscommuter journey times. There is also scope for their use on certain inter-urban routes. Thenew South Western train franchise, for instance, will test the extension of smartcards on certaininter-urban rail corridors and examine how these can be integrated with urban networks.
3.42 While there are indications that some measures might achieve good welfare benefitsand that others have the potential to generate economic returns by releasing extra capacity,the lack of evidence to date on their likely impacts makes it difficult to estimate the potentialof these schemes to have a large-scale effect on UK travel problems. But the evidenceavailable suggests merit in exploring their potential further.
3.43 The efficacy of smart measures depends on the intervention, the type of changesought, and the particular circumstances. Analysis for DfT4 provides some generalassessments based on experience to date. It suggests the potential exists for good returns, butwill depend on where and how a scheme is implemented. That report explicitly states that itis an assessment of the potential that may exist for such measures, rather than a forecast.
3.44 Encouraging cycling, walking and smarter choices has the potential to provide benefitsto the economy and welfare through both reduced congestion and the associated likelyreduction in greenhouse gas emissions and other pollutants, and improved health. Littleevidence exists on benefit:cost ratios for such interventions, largely owing to the significantuncertainties around the costs. But the DfT analysis suggests that with high intensity uptakeof smart measures, some 21 percent reduction in urban traffic could be achieved. Thispromise must be weighed against other factors, including the following:
Largeuncertainties
over theirimpacts and
costs
Better usemeasures offer
potential oninter-urban
corridors as wellas in major
urban areas
157ED D I N GT O N ST U DY: VO LU M E 3
Figure 3.3: Individualised Travel Marketinga
Individualised Travel Marketing (ITM) schemes are one example of where some researchhas been carried out to look at the potential impact on urban car use of greaterinformation provision. This research reflects a trial programme, so there remainsuncertainty over the extent to which these impacts could be sustained over the longerterm. In addition, the extent to which they can be implemented on a wider scale orreplicated in other areas is also uncertain. Results from this trial should therefore beinterpreted in this light.
Sponsored by the DfT and trialled in Worcester and Peterborough by Sustrans and partnerSocialdata, ITM schemes involve making direct contact with households to offer peoplepersonalised travel planning and advice on the alternatives to car use. This can involveanything from bespoke bus timetables to information on where to obtain discounts oncycles.
The first stage of the ITM trials, reaching around 6,500 households in each city, achieved areported 12-13 per cent reduction in car driver trips, concentrated during congested peaktimes. At the same time, public transport usage increased by between 13-22 per cent,whilst walking and cycling rates increased between 17-36 per cent. This represents theswitching of around 60 car trips per person, per year to other forms of transport.
There was also an approximately 18 per cent increase in daily time spent using physicallyactive forms of travel for the households involved, which will help to realise wider healthbenefits to both individuals and business. An ITM scheme is also being trialled in Darlingtonand Sustrans is working on a programme targeting 50,000 homes in Lancashire.a For more information see www.sustrans.org.uk.
4 Smarter Choices: Changing the Way We Travel, DfT, 2004.

MA K I N G B E T T E R U S E O F C U R R E N T N E T W O R K S3.3• the studies cover the initial impacts and have not fully assessed the
permanence of the behavioural change. Without continuous reinforcement,promotion and investment, it is possible that utilisation of such measurescould decrease by 40 per cent per year, after the first year;5
• Whether these schemes can be implemented on a widescale is not fullyunderstood: costs of these schemes and their nationwide implementationhave not been accurately assessed. Many smart measures may require newtechnologies for which costs can be unpredictable and the risks may besignificant. This is discussed further in Figure 3.4; and
• Even if these measures are sustainable and cost-effective in themselves, theyare likely to require a package of complementary measures. For example,supporting traffic-limiting or calming interventions may often be needed toincrease their effectiveness e.g. many businesses have set up workplace travelplans to reduce the amount of parking available to employees.
3.45 These uncertainties mean it is important to build an understanding of the conditionsunder which smart measures are able to offer welfare and GDP returns and, in particular,more evidence is needed to confirm the circumstances in which they are able to offer a highreturn solution to the transport problems in urban areas. The evidence that is available doeshowever suggest good potential that merits exploring further.
3.46 These schemes may have a role as complementary measures, reinforcing othermethods of better utilisation and capacity addition. London’s Oyster card is a good exampleof a smart measure complementing other interventions such as increased public transportservices, dedicated public transport infrastructure and congestion charging to enable highpublic transport patronage and help reduce congestion and its problems.
May complement
other policieseffectively
Uncertaintiesmust be
recognised
158 ED D I N GT O N ST U DY: VO LU M E 3
5 Smarter Choices: Changing the Way We Travel, DfT, 2004.

MA K I N G B E T T E R U S E O F C U R R E N T N E T W O R K S 3.3
REGUL ATORY POLICY
3.47 Where there are market failures in the operation or provision of transport services,regulatory policy may be the appropriate intervention to prevent wasteful use of resources,or to support the delivery of other measures for which the economic case has been proven.
3.48 It should of course be recognised that, if imposed ineffectively, regulation can haveadverse effects on travellers, freight and the economy. This points to the need to build a betterunderstanding of the costs and benefits of different regulatory options and to compare themwith other solutions to find the most cost-effective policy to tackle a particular challenge.There are several examples in the transport sector where regulation plays a strong role in themarket including road freight delivery restrictions, night time slots at airports and busregulation. The latter will be discussed in more detail in Volume 4.
Road fre ight de l ivery restr ict ions
3.49 Road freight traffic plays an important role in allowing economic activity to take placein dense urban areas by ensuring that goods are delivered to outlets and production units ontime and with controlled costs. Roads are by far the dominant mode used for such deliveriesdue to the need for flexibility of route, size of delivery and time of delivery.
3.50 Freight traffic competes for scarce road capacity with other network users. Variousregulations exist to coordinate multiple transport demands in major cities and othercatchments, some of which impose restrictions on freight traffic and deliveries. These areoften driven by concerns over the contribution of freight to harmful carbon dioxide and
Targetedrelaxation of
urban freightregulations
could cutcongestion
159ED D I N GT O N ST U DY: VO LU M E 3
Figure 3.4: The role of technology and information provision infacilitating better use
New and existing transport and communications technologies are important enablers ofbetter use measures. Technology has a broad role to play in transport provision but it isparticularly integral to better use measures by facilitating the generation, collation andprovision of information. The effectiveness of traffic-control systems, for example, isdependent on instant and accurate traffic information to allow traffic signals to make theright response. Many smart measures also rely on technology to provide up-to-date travelinformation to users, such as through the internet, satellite navigation systems or real timepublic transport information, which enable the most efficient travel planning and choices.
New technologies can allow better use measures to continuously improve the performanceof the network. In the long term, technologies such as automated highways where vehiclesare controlled by artificial intelligence or ‘moving block’ signalling on railways could havethe potential to increase the capacity of networks significantly. There are, of course, manydevelopment and implementation steps to achieve before such interventions might bepossible but government and business should be aware of the possibilities thattechnologies can offer and the potential risks associated with using untested newtechnologies.
In many circumstances there will be a market incentive for these technologies but, becauseof the higher risks involved, there may also be a role for government in facilitating theiruptake by reducing barriers to development and implementation.
New technologies do and will play a much broader role in transport policy and deliverythan just supporting better use measures. They can also play an important role inmitigating the environmental impacts of traffic and additional capacity provision.
MA K I N G B E T T E R U S E O F C U R R E N T N E T W O R K S3.3particulate emissions or noise. Such restrictions, however, impose costs on retailers andfreight operators, especially when there are no alternatives available. This is likely to feedthrough into economic efficiency because it adds to the cost of getting the goods andproducts to where they need to be. Conversely, in the absence of such restrictions, there arecosts imposed on other road users, including business travellers and commuters, from thenoise disruption and increased congestion caused by freight deliveries.
Night-t ime s lots at a irports
3.51 Another example is the regulation of night-time slots at airports. The movement offreight by air often involves transportation of goods at night. Night slots are particularlyimportant to the express delivery and just-in-time freight sectors, which, as discussed inVolume 2, support high-value business. Freight aircraft currently use night slots at Gatwickand Stansted where controls are rightly imposed by the Government with a view to balancingeconomic interests with the interests of local residents. Other airports with significant use ofnight slots, such as Manchester and East Midlands, operate them under their own controls,liaising with, among others, local authorities and residents. Finding the balance betweenlimiting night slots owing to noise impacts, and releasing some to support valuable economicactivity means building an understanding of the full costs and benefits involved. This coversthe economic, environmental and social impacts, particularly greenhouse gas emissions andnoise. On that basis, appropriate regulatory decisions can then be made about the use ofnight slots.
3.52 For regulation in general, building a full understanding of the wider impacts involvedand assessing and comparing the impacts may allow the relevant authorities to make betterinformed decisions as to which restrictions are welfare enhancing, and which are actuallydamaging in the wider sense. It is not only the new regulations that might be introduced thatshould be assessed in this way. For some, a review of existing regulations could provebeneficial. Targeted relaxation and better coordination of regulatory restrictions may have thepotential to release scarce capacity for other users, while also improving freight supply chainsand logistics.
3.53 Regulatory policy will be more effectively decided if all costs and benefits have beenappropriately assessed. Full cost-benefit analyses (CBAs) of regulatory interventions,including the wider impacts on the economy, environment and noise do not currently exist.Such analysis is needed if policies are to be appropriately and consistently compared.
Full CBA isneeded
160 ED D I N GT O N ST U DY: VO LU M E 3
MA K I N G B E T T E R U S E O F C U R R E N T N E T W O R K S 3.3A CLOSER LOOK AT PRICING
3.54 The first half of this chapter set out the options for making better use of the existingtransport infrastructure. Among the options was better pricing and how, by changing therelative prices faced by transport users, it provides the incentive for them to changebehaviour and use available capacity more efficiently. This chapter takes a more detailed lookat transport pricing. It explores:
• the context for implementing better pricing;
• how pricing is currently used in transport and other sectors;
• the potential benefits of a relatively sophisticated illustrative national roadpricing scheme;
• the potential benefits of local road pricing schemes;
• factors that affect the effectiveness of road pricing and distributional impacts;
• implications of better pricing on the case for additional capacity acrossmodes; and
• pricing on other modes.
There are strong economic
arguments forbetter pricing
161ED D I N GT O N ST U DY: VO LU M E 3
Headlines on pricing
• There are strong economic and environmental arguments for ensuring usersacross all modes face the full external costs of their journeys, be theyenvironmental or congestion related. This could be done through appropriatefiscal, regulatory, pricing or trading instruments.
• Well-designed pricing stands out above all other interventions, given its substantialpotential to contribute to welfare and GDP, particularly if roads are better priced.
• The risks of road pricing implementation are real and need managing, includingthrough pilots.
• Ill-targeted pricing could impose costs on the economy so developing a well-designed scheme is crucial.
• Environmental effects such as carbon emissions from congestion pricing schemeswould depend on the specific scheme design and pricing system used.
• Given the serious implications that aviation emissions have for climate change,there is a need to identify and implement an effective mechanism for ensuring thatair travellers pay the full cost of their climate change impact.
• Better pricing will significantly impact on the economic case for additionaltransport capacity: most notably, road pricing would be expected to reduce thecase for additional road infrastructure significantly; the impact on urbaninfrastructure needs further assessment.
• Distributional concerns may point to the need to consider complementary policiessuch as improved public transport to minimise the adverse impacts on sometravellers; but there may also be ways to meet these concerns through othermechanisms or government policies.

MA K I N G B E T T E R U S E O F C U R R E N T N E T W O R K S3.3The context for better pr ic ing
3.55 One of the most important policy levers for making more efficient use of existingcapacity is to introduce better pricing across the transport system, particularly if prices are setso that travellers face the true costs of making a journey, including congestion and carbonimpacts. These costs are higher when there are more travellers wanting to make a journey atthe same time of day and on the same link.
3.56 By sending better price signals about the impact of each journey on other travellersand on the environment, often referred to by economists as the ‘marginal social cost’, it ispossible to spread demand away from the peaks and increase the effective capacity andperformance of the network. Travellers who value their particular journey most will generallybe prepared to pay a higher price and will benefit from improved reliability and travel times.The value an individual places on a journey will vary throughout the day as they make tripsfor different reasons. For example, the value they place on improved travel conditions whenthey are late for a hospital appointment will be different to the value they place on improvedconditions when travelling to the supermarket.
3.57 The Stern Review argued that prices should be used to reflect the costs associated withclimate change. The same is true for congestion: users should pay the full costs of theirjourney, including a carbon price and a congestion price. Road pricing is certainly the mosteffective way of pricing for congestion. It is also one possible instrument for pricing thecarbon effects of road use. However, the analysis in this chapter should not be taken tosuggest this study has taken a view of the best instrument for carbon pricing, only thatanalysis commissioned by this study to explore road pricing takes account of the impact ofcarbon pricing on the demand for surface transport.
3.58 The benefits of better pricing are therefore:
• it leads to a more efficient allocation of transport capacity to those who valueit most; and
• it allows ‘external’ costs to be priced in to reflect the true costs of making ajourney, including congestion and carbon impacts.
3.59 A well-targeted pricing scheme can lead to direct and immediate benefits to businessand freight travellers in particular because, given the nature of their travel, they are generallymore likely to be willing to pay a higher price to travel where and when they most prefer. Forthem, the value placed on reduced congestion and more reliable trips will be worth more thanthe price paid for the journey. In addition, the benefits in terms of lower congestion,overcrowding and improved reliability will improve the productivity of firms, if the resourcessaved from the lower overall cost of the journey (as less time is wasted travelling in congestionfor example) are used to increase operational efficiencies. When the value placed on makinga trip at a particular time of day is lower than the price being charged, there is the incentivefor travellers to look for lower-cost alternatives. For example, in the short term this willinclude exploring travel at a different time of day, or on a different mode, getting a lift withsomeone else, or even not making particular trips. In the long term, more dynamic effects arepossible such as a shift in employment or household location.
3.60 Relying on congestion to affect behaviour and allocate road space is not efficient; yetthis is currently the only mechanism. Pricing would be much more effective in providing theincentive for people to change their travel behaviour as they face the true costs of the journey.
3.61 This chapter discusses two key impacts of pricing transport differently. First, there aresignificant economic benefits from improvements to the performance of the road network.Second, by improving the performance of the network, the economic case for additionalcapacity is significantly altered, and for roads is substantially reduced.
Current rationingof road space
through queuingin traffic is highly
inefficient
162 ED D I N GT O N ST U DY: VO LU M E 3

Figure 3.5: Yield management in the aviation sector
Airlines are already using pricing very successfully through yield management, whichinvolves a sophisticated and flexible approach to pricing. Using historical sales informationto allocate some seats to price-sensitive, low-paying non-work/leisure travellers, whileholding others for time-sensitive, high-paying business travellers, airlines aim continually tofind the best product mix of differently priced seats, to gain the highest possible revenuefrom the fixed capacity of each airline flight.
Widespread use of yield management techniques allowed dramatic efficiencies to beachieved in the airline industry throughout the 1980s and 1990s. In 1984, UK airlinessold only 66 per cent of seats on each flight on average. By 2005, this figure had risen to76 per cent.
In recent years, technological improvements have enabled airlines to continue improvingtheir yield management.
Load factors for scheduled UK airlines, 1984-2005 (percentage of seats used)a
58
60
62
64
66
68
70
72
74
76
78
2005
2004
2003
2002
2001
2000
1999
1998
1997
1996
1995
1994
1993
1992
1991
1990
1989
1988
1987
1986
1985
1984
Per
cent
Source: Eddington Study analysis of UK airline statistics, 2005, Civil Aviation Authority.
a Chart produced from data published by the Civil Aviation Authority UK Airline Statistics 2005: 12 Table 2.2
MA K I N G B E T T E R U S E O F C U R R E N T N E T W O R K S 3.3Exist ing use o f pr ic ing
3.62 Markets exist for buying goods and services in a wide range of other sectors. Consumersare therefore used to paying the prices as determined by those markets. Prices are set on thebasis of balancing the quantity of goods or services available against demand, with pricesbeing higher when demands are greater. Consumers then make choices about the goods andservices they are prepared to pay for. It is commonly understood that it costs more to use amobile phone during peak hours, that cinema tickets are cheaper in the afternoon than in theevening, and that restaurants often offer cheaper set menus before 7pm or after 10pm.
3.63 Price signals, however, are already being used to a greater or lesser extent on manyparts of the transport network, including in aviation, rail, public transport and centralLondon roads.
3.64 Over the last two decades, the aviation industry has used yield management to greateffect, utilising sophisticated software and internet sales to increase the load factor of planes.Figure 3.5 provides more detail.
It is alreadybeing used
successfully onmany parts ofthe transport
network
Pricing is afamiliar part of
everyday life
163ED D I N GT O N ST U DY: VO LU M E 3
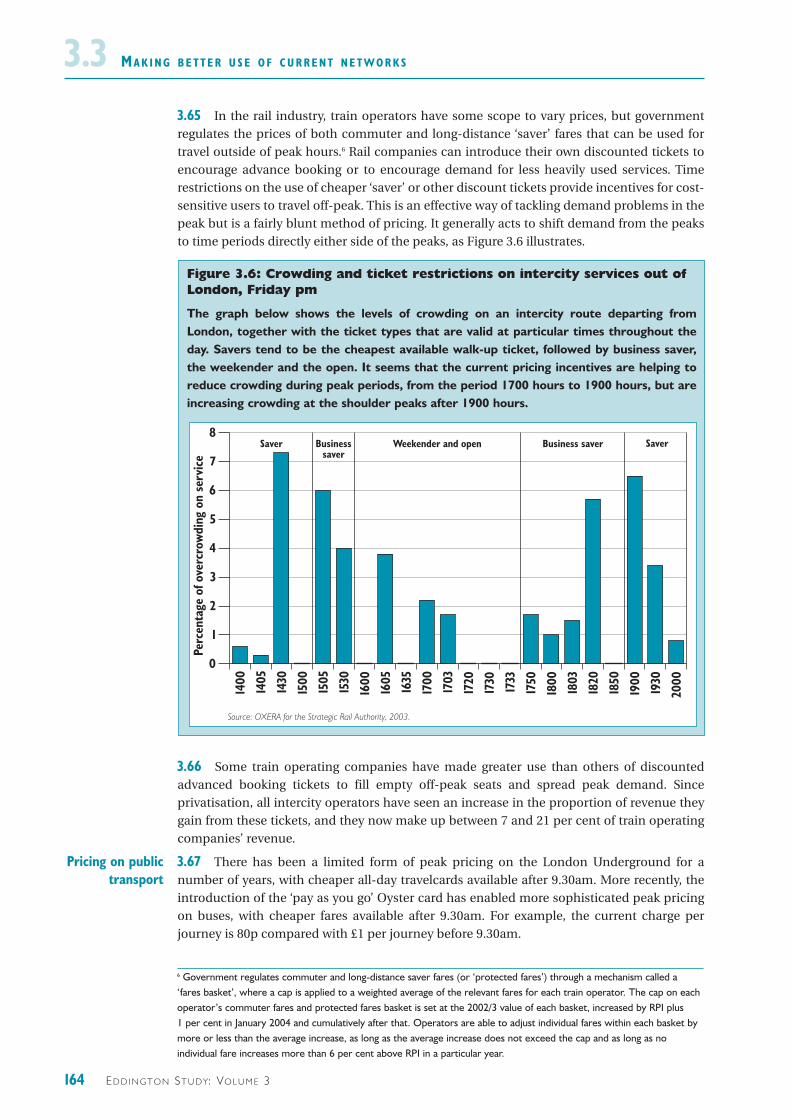
6 Government regulates commuter and long-distance saver fares (or ‘protected fares’) through a mechanism called a ‘fares basket’, where a cap is applied to a weighted average of the relevant fares for each train operator. The cap on eachoperator’s commuter fares and protected fares basket is set at the 2002/3 value of each basket, increased by RPI plus 1 per cent in January 2004 and cumulatively after that. Operators are able to adjust individual fares within each basket bymore or less than the average increase, as long as the average increase does not exceed the cap and as long as noindividual fare increases more than 6 per cent above RPI in a particular year.
MA K I N G B E T T E R U S E O F C U R R E N T N E T W O R K S3.33.65 In the rail industry, train operators have some scope to vary prices, but governmentregulates the prices of both commuter and long-distance ‘saver’ fares that can be used fortravel outside of peak hours.6 Rail companies can introduce their own discounted tickets toencourage advance booking or to encourage demand for less heavily used services. Timerestrictions on the use of cheaper ‘saver’ or other discount tickets provide incentives for cost-sensitive users to travel off-peak. This is an effective way of tackling demand problems in thepeak but is a fairly blunt method of pricing. It generally acts to shift demand from the peaksto time periods directly either side of the peaks, as Figure 3.6 illustrates.
3.66 Some train operating companies have made greater use than others of discountedadvanced booking tickets to fill empty off-peak seats and spread peak demand. Sinceprivatisation, all intercity operators have seen an increase in the proportion of revenue theygain from these tickets, and they now make up between 7 and 21 per cent of train operatingcompanies’ revenue.
3.67 There has been a limited form of peak pricing on the London Underground for anumber of years, with cheaper all-day travelcards available after 9.30am. More recently, theintroduction of the ‘pay as you go’ Oyster card has enabled more sophisticated peak pricingon buses, with cheaper fares available after 9.30am. For example, the current charge perjourney is 80p compared with £1 per journey before 9.30am.
Pricing on publictransport
164 ED D I N GT O N ST U DY: VO LU M E 3
Figure 3.6: Crowding and ticket restrictions on intercity services out ofLondon, Friday pm
The graph below shows the levels of crowding on an intercity route departing fromLondon, together with the ticket types that are valid at particular times throughout theday. Savers tend to be the cheapest available walk-up ticket, followed by business saver,the weekender and the open. It seems that the current pricing incentives are helping toreduce crowding during peak periods, from the period 1700 hours to 1900 hours, but areincreasing crowding at the shoulder peaks after 1900 hours.
0
1
2
3
4
5
6
7
8
2000
1930
1900
1850
1820
1803
1800
1750
1733
1730
1720
1703
1700
1635
1605
1600
1530
1505
1500
1430
1405
1400
Perc
enta
ge o
f ove
rcro
wdi
ng o
n se
rvic
e
SaverSaver Business saver
Weekender and open Business saver
Source: OXERA for the Strategic Rail Authority, 2003.
7 Central London Congestion Charging: Fourth Annual Report, Transport for London, 2006.
MA K I N G B E T T E R U S E O F C U R R E N T N E T W O R K S 3.3
165ED D I N GT O N ST U DY: VO LU M E 3
3.68 On the roads, motorists pay duty on fuel use. This is an effective way of pricing forcarbon dioxide emissions, that are directly related to the amount of fuel consumed, but doesnot directly vary to reflect the full costs imposed on society such as congestion, noise and airpollutants that are more closely related to location and time of day. There are a number ofways in which a road pricing scheme could be introduced and the total amount thatmotorists pay will depend on the design of the scheme and future decisions on the taxsystem. The illustrative, national road pricing scenario modelled for this study was a systemof marginal social cost pricing in which the cost of motoring for some motorists would be lessthan it currently is today, namely when they are travelling on less busy roads or at quiet timesof day. Higher road prices would be faced by those wanting to travel when demands are highfor road space because that is when the costs and impacts of congestion are greatest. Thevariation in prices faced will of course depend on the particular scheme introduced.
3.69 In February 2003, Transport for London (TfL) introduced an area-based congestioncharging scheme in central London, described in more detail in Figure 3.7. TfL estimates thatafter four years, the scheme has been successful in reducing overall traffic levels within thecharging zone by 15 per cent (including a 30 per cent reduction in car, van and lorry traffic),and in reducing congestion levels by 26 per cent. Average traffic speeds inside the zone areestimated to have increased by 2 km/hour since the introduction of the charge.7
3.70 The scheme has delivered notable benefits in terms of reduced congestion andimproved traffic speeds. Although scheme-operating costs have been published, the set upcosts have not, so it is difficult to form a view on overall cost-effectiveness; but this schemehas demonstrated the potential for pricing to manage demand effectively in areas of highcongestion.
Local roadpricing can be
effective
Pricing on roads

MA K I N G B E T T E R U S E O F C U R R E N T N E T W O R K S3.3
166 ED D I N GT O N ST U DY: VO LU M E 3
The potent ia l benef i ts o f a nat ional road pr ic ing scheme
3.71 There are many different ways in which roads could be better priced in the UK, rangingfrom a full national distance-based scheme covering every road, to relatively simple localschemes. Evidence from a variety of modelling sources has been used in this chapter to assessthe potential benefits of both national and local schemes.
Figure 3.7: London Congestion Charging Scheme
The London Congestion Charge, introduced in February 2003, is a relatively simple area-based scheme that charges a fixed rate of £8 for travelling in a 22km2 zone in centralLondon in the daytime for weekdays only. The scheme does not charge motorists accordingto distance travelled nor is the charge varied with differing levels of congestion.
The charging scheme was introduced alongside a large programme of bus improvements.This provided a significant alternative to paying the congestion charge with 6,000 morepeople using the bus network in the peak hour alone in 2003. The roll out of the Oystercard, improvements to the Docklands Light Railway (DLR) and the Underground allcontributed to a more effective performing public transport network. TfL estimates thatsome 50-60 per cent of the reduced car movements represent transfers to publictransport, 15-25 per cent shifting to car sharing and other modes (motorcycle and cycling).
TfL estimates that the congestion charge has been effective in reducing levels of traffic andcongestion inside the zone, and in increasing traffic speeds (see below).
Congestion by time period within the charging zonea
Source: Central London Congestion Charging : Fourth annual report, 2006, TfL.
Congestion by time period within the congestion charging zone, 2002-2005
0.0
0.5
1.0
1.5
2.0
2.5
3.0
3.5
JanNovSepJulMayMarJanNovSepJulMayMarJanNovSepJulMayMarJanNovSepJulMayMarJanFebDecOctAugJunAprFebDecOctAugJunAprFebDecOctAugJunAprFebDecOctAugJunAprFeb
am shoulder am peak am off-peak
pm off-peak pm peak pm shoulder
charging hoursCharging starts
2002 2003 2004 2005
Exce
ss d
elay
(min
/km
)
Notes: The January-February 2003 survey was undertaken wholly before the introduction of charging on 17 February 2003. Excess delay is measured relative to the night-time travel rate. The night-time travel rate is 1.9 min/km.a Central London Congestion Charging: Fourth Annual Report, Transport for London. June 2006.

8 Feasibility Study of Road Pricing in the UK, DfT, 20049 Defra guidance in line with GES Working paper 140, GES, 2002.10 1998 prices, in line with the Feasibility Study of Road Pricing in the UK, DfT, July 2004.11 Feasibility Study of Road Pricing, Annex J: Costs,DfT, July 2004.12 As defined in Volume 2.
MA K I N G B E T T E R U S E O F C U R R E N T N E T W O R K S 3.33.72 Experience of how road pricing works in practice is limited, and it is largely necessaryto depend on estimates and modelling to understand the benefits, costs and risks. However,the size of the potential benefits is so striking that it has to be taken seriously as a policymeasure to support economic growth.
3.73 In the UK, the Government is actively engaged in exploring the potential of roadpricing to address congestion through the promotion of demonstration projects and localpricing schemes. The idea is that local pricing schemes will be part of a wider package oftransport improvements that the Government would support through its TransportInnovation Fund. The pilots and demonstration projects will allow different technologies,systems and scheme designs to be explored to inform longer-term policy.
3.74 In the Road Pricing Feasibility Study (RPFS)8, the DfT explored the potential benefitsof a national road pricing scheme implemented in 2010 using the DfT’s National TransportModel (NTM). This study has explored the impacts of that scheme in the longer term, namely2025, again relying on the NTM.
3.75 The illustrative national scheme modelled for both the RPFS and therefore this studyis a relatively sophisticated, distance-based scheme where prices are based on the marginalsocial costs of the journeys that takes into account costs of congestion and environmentaldamage, including a carbon cost of £95 per tonne in 20259. Charges are capped at 80p/km10
with 75 different levels of charges, varying by time by day, by area and road type.
3.76 Clearly, this is only one of many options, and has been chosen only to makecomparisons with the present day more straightforward. The evidence suggests that beforeconsidering the costs of setting up and running such a scheme, total benefits have beenestimated at around £28 billion a year in 2025, including GDP benefits of £15 billion a year.The costs of such a scheme are not known at this stage in development, and pilots should beused to provide a better assessment. Clearly, costs would have to be extremely high tooutweigh the benefits of £28 billion a year, and in that scenario it would not be cost effectiveto implement a scheme. One available source that is able to offer some indicative costestimates is the RPFS that suggested a full national, distance-based road pricing schemecould cost between £10 and £62 billion to set up, plus running costs of between £2 and £5billion a year, with the upper end of these estimates including optimism bias of around 100per cent11. Compliance costs would also need to be factored in. Nonetheless, this implies thatthere is clearly potential to develop a scheme with very significant net benefits, possibly up to£20 billion a year and the challenge is to ensure a scheme with costs at the low end of therange.
3.77 Such a scheme could reduce the level of congestion on the road network by 50 per centcompared to the baseline without pricing in 2025.12 Figures 3.8 and 3.9 compare congestion onthe road network with and without road pricing. They show the dramatic potential impactbetter pricing has in reducing congestion and therefore improving reliability.
Up to £20 billionnet benefits per
year could beachieved fromnational road
pricing in 2025
167ED D I N GT O N ST U DY: VO LU M E 3

MA K I N G B E T T E R U S E O F C U R R E N T N E T W O R K S3.3
168 ED D I N GT O N ST U DY: VO LU M E 3
Key2025 baseline – total lost hours per year
139,350 or more (1,750)
28,000 to 139,350 (3,881)
6,520 to 28,000 (5,557)
0 to 6,520 (6,465)
Source: DfT.© Crown copyright. All rights reserved Department for
Transport 100020237 2009 gisu0607j052Map11.1
Figure 3 .8 : Congest ion patterns on the Great Br i ta in roadnetwork in 2025 with no road pr ic ing

MA K I N G B E T T E R U S E O F C U R R E N T N E T W O R K S 3.3
169ED D I N GT O N ST U DY: VO LU M E 3
Key
2025 baseline with national road pricing
– total lost hours per year
139,350 or more (186)
28,000 to 139,350 (2,582)
6,520 to 28,000 (8,366)
0 to 6,520 (6,519)
© Crown copyright. All rights reserved Department for
Transport 100020237 2009 gisu0607j052Map11.2Source: DfT.
Figure 3 .9 : Congest ion patterns on the Great Br i ta in roadnetwork in 2025 with nat ional road pr ic ing
MA K I N G B E T T E R U S E O F C U R R E N T N E T W O R K S3.33.78 The main benefits of the scheme come from: the value of reduced delay andimproved reliability for road users; revenues; wider economic benefits such as agglomeration,competition and labour market efficiencies; and other benefits for society such as reducedaccidents, lower carbon emissions and noise, and improved air quality.
3.79 Motorists currently pay fuel duty which implies a cost of some 4 pence to travel akilometre, depending on the fuel efficiency of their vehicle. Under the road pricing scenariomodelled where prices reflect impacts on society, around 33 per cent of distance travelledwould cost the same or less than the current cost of fuel duty. The rest would, overall, costmore than today, with less than 10 per cent costing in total more than 20p/km. Balancedagainst this and outweighing it, of course, are the benefits of reduced travel delays and morereliable journey times.
3.80 For those who place a high value on being able to make trips by road on particularroutes or at particular times of day, the benefits could be substantial. For example, inaggregate, business travellers might see benefits in the region of £4.6 billion and freightaround £1 billion a year respectively. The indirect economic benefits to the wider economyfrom impacts to these users might net to some £2.2 billion a year in total.13
3.81 Although the aggregate picture is one of significant overall benefits from road pricing,not all groups would benefit. Those who place a lower value on the ability to make a particulartrip at a certain time of day may not find it worthwhile to pay the relevant price because,overall, the benefit to them of improved travel conditions would not be worth it. They wouldinstead seek alternative routes or means of travel. For example, the analysis suggests thiswould be the case for the majority of individuals making their commuting trips by roadbecause, when faced with the price of travel, the value they place on making that particulartrip at their preferred time of day by car is less than the price being charged, so they changetheir behaviour. This effect implies an aggregate direct welfare cost of some £1.2 billion plusestimated costs to the labour market of around £370 million per year. The actual magnitudeof these types of effects would of course depend on the availability and quality of alternativeways to make a trip and accompanying policies, plus how the revenues from such pricing areused. These same travellers would however expect to benefit when travelling for otherreasons, e.g. non-work/leisure.
3.82 Despite this, within the benefits is a GDP benefit of around £15 billion a year, drivenby the efficiency savings to business and freight. Again, this is before the costs ofimplementation, operation and enforcement have been taken into account.
3.83 The impacts of road pricing are subject to the availability of travel alternatives suchas the ability to work flexible hours, and the availability and cost of public transport. If, forexample, public transport improvements meant this were an attractive alternative for thecommuter then the adverse impacts would be expected to be much lower.
3.84 There is also the potential for significant environmental and safety benefits from awell-targeted national road pricing scheme. Such a scheme might generate safety benefits ofaround £1.2 billion a year owing to the impacts on traffic, and reductions in greenhouse gasemissions, air quality problems and noise pollution might be worth over £500 million a yearin total. The extent to which road pricing offers benefits in terms of reduced carbon orgreenhouse gas emissions will be heavily dependent on the design of the scheme, the level ofthe charges, and the extent to which fuel duty changes.
Environmentalbenefits can also
be achieved
Not all roadusers would gain
on every tripfrom better
pricing
Pricing coulddeliver improvedjourney time andreliabiity benefits
170 ED D I N GT O N ST U DY: VO LU M E 3
13 These include impacts such as agglomeration, labour market effects etc.

MA K I N G B E T T E R U S E O F C U R R E N T N E T W O R K S 3.33.85 This particular example of a relatively sophisticated scheme offers reduced carbonemissions but this depends on the fuel duty and pricing design chosen. The reason for this istwo-fold: firstly, variation in pricing affects the impact on traffic and congestion. Secondly,carbon emissions are directly related to the amount of fuel consumed. Fuel duties thereforeimpact on behaviour to the extent that they make explicit the link between fuel use anddistance travelled and so provide an incentive for people to purchase more fuel-efficient cars.
3.86 However, at a practical level, the introduction of pricing based on congestion impactswould facilitate the introduction of pricing to reflect all externalities. This includes theopportunity to price environmental externalities, one of the main recommendations of theStern Review.
3.87 Other forms of national-level road pricing have not been explored in this work, but itis possible that simpler forms of pricing would also provide substantial benefits if they arewell-targeted. The national scheme modelled and described here is relatively complex asprices closely reflect costs of road use on society. Other pricing regimes could be introducedranging from reducing the number of charge levels, charging at only certain times of day oron certain links. These could be cheaper and easier to introduce, and potentially offer lowerbut significant benefits from reduced congestion. Evidence from the RPFS for 2010demonstrated that if pricing were introduced in urban areas only, where congestion isgreatest, the benefits in terms of congestion reduction would only be slightly lower than forthe national scheme: an overall reduction of 43 per cent as opposed to 48 per cent but withmuch lower reductions in congestion on inter-urban roads than with a national scheme.14
3.88 Any scheme with less than full national coverage would, of course, need to becarefully designed to minimise negative impacts of diverting traffic onto non-priced routesbecause this could be significant and there is a need to understand the land use impacts.A more widespread scheme may be necessary to guard against such impacts.
Potent ia l benef i ts o f loca l road pr ic ing schemes
3.89 Over 80 per cent of congestion on the UK road network is in urban areas. Significantbenefits from well-designed local pricing schemes might therefore be expected. Evidencefrom local modelling suggests that well designed schemes can offer substantial welfare andGDP benefits. This Study commissioned a case study to explore illustrative interventions inthe South and West Yorkshire area to build an understanding of their potential welfare andGDP impacts.15 Among the interventions tested was an illustrative distance-based,congestion-targeted road pricing scheme. This suggested gross present value benefits16 ofover £40 billion over a 60-year period could be delivered, including GDP benefits of around£6-8 billion over the same period. The costs of implementing such a scheme are, of course, asyet unknown and could be substantial, given the reliance on technology to deliver a relativelysophisticated pricing regime.
3.90 As with other pricing schemes, it would be worthwhile only if the costs ofimplementation and enforcement could be managed such that significant welfare gains wereachievable.
Road pricingschemes that arenot national canalso deliver very
strong benefits
Environmentalimpacts dependon the design ofthe scheme and
the level ofcharges
171ED D I N GT O N ST U DY: VO LU M E 3
14 Feasibility study of road pricing in the UK, Chapter 4, DfT, 2004.15 For more detail see separate paper on the South and West Yorkshire Case Study Wider economic impacts of transportinterventions, MVA in association with David Simmonds Consultancy 2006.16 Defined to be the overall benefits accounting for revenues excluding environmental effects.
MA K I N G B E T T E R U S E O F C U R R E N T N E T W O R K S3.33.91 The environmental implications of this form of road pricing, could, to the extent thatthey are related to impacts on traffic congestion, deliver beneficial impacts on noise, airpollutants and carbon emissions. For example, reductions in traffic-related carbon emissionscould be in the order of 10-20 per cent in the peak periods, with much smaller reductions ormarginal increases in off-peak periods.
3.92 Local area road pricing is likely to be less cost-effective in towns and cities that are notcharacterised with high congestion, simply because the magnitude of the challenge to betackled is lower, so the potential benefits are also likely to be lower.
3.93 The same arguments that apply to a national scheme also apply to any sub-regionalor local scheme. That is, pricing must be transparent, practical and well targeted. There arestrong arguments on both practical and efficiency grounds for ensuring consistency andcomparability between local charging schemes. For example, where neighbouring areas havepricing in place, a traveller going from one to the other could make better travel decisions ifthe nature and scope of the pricing schemes were well understood. It would also minimisetransaction costs, for example for logistics firms who typically travel in many different areas.
Factors in f luenc ing the e f fect iveness o f road pr ic ing
3.94 The practicalities of designing a workable, intelligible scheme will have a veryconsiderable bearing on the most desirable road pricing scheme; so the analysis of a nationalscheme presented here should be seen as purely an illustration of the ‘top end’ of GDP andwelfare benefits that might be achieved, before consideration of set-up and operating costs.
3.95 The costs of such a scheme are not known at this stage in development, and pilotsshould be used to provide a better assessment. Clearly, costs would have to be extremely highto outweigh the benefits of £28 billion a year and, in that scenario, it would not be costeffective to implement a scheme.
3.96 As noted earlier, one estimate of the possible costs was provided in the Road PricingFeasibility Study (RPFS) where it was estimated that a full national, distance-based roadpricing scheme could cost around £10-£62 billion to set up, with the upper end reflectingoptimism bias, plus running costs. In reality, costs would vary based on the extent ofimplementation; the technological solution chosen; and how quickly the costs of technologyfall through time. Further work is needed to develop technologies that allow road pricing tobe delivered at the lower end of costs. Enforcement costs must also be considered andaccounted for because these could also be significant.
3.97 Given the potential expense of setting up and running a national scheme, beforetaking any decision to implement a national road pricing regime, government would want tobe confident that a scheme could be delivered to ensure the potential benefits are realised, ata cost, and with a manageable level of associated risk, that would not significantly erode andoutweigh the benefits. Any decision on choice of technology and design of scheme wouldneed to incorporate an assessment of the cost risk associated with commissioning whatmight be new and untested at a national level.
The benefits froma road pricing
scheme willdepend on a
number offactors
172 ED D I N GT O N ST U DY: VO LU M E 3

MA K I N G B E T T E R U S E O F C U R R E N T N E T W O R K S 3.33.98 In terms of the design of the better pricing system implemented, analysis from themodelling shows that well-designed and carefully targeted schemes can generate very highGDP and welfare benefits. But the same models also show that poorly designed schemescould result in large numbers of losers and very low benefits, or even net costs.17
3.99 The modelling evidence highlights several factors, in addition to cost, that influencethe effectiveness of pricing schemes, and should be fully recognised in working up schemes:
• the scope and quality of the transport system in the area targeted: it isimportant to understand the congestion challenge faced, availability andperformance of public transport options in the area, and the nature of travelpatterns;
• the prices implemented: prices should vary sufficiently to reflect congestionand other costs of road use and provide the incentive for a behaviouralresponse, but still be understandable and practical for the road user;
• the geographical coverage of the scheme: diversion of traffic and economicactivity to areas not charged could increase problems in those areas thatshould be netted off the estimated benefits;
• the level of the charges should be carefully assessed so as not to have counter-productive effects; and
• impacts on land use patterns such as business and household location shouldbe considered.
3.100 The London Congestion Charging scheme is designed to be relatively simple,transparent and practical. A more sophisticated, distance-based scheme that chargeddifferentiated prices by time of day and by area type may have had greater benefits in termsof reduced congestion, but could not realistically have been delivered at that time. TheLondon scheme may theoretically not be the best possible design, but it provides evidencethat road pricing can deliver benefits in terms of reduced congestion and improved trafficspeeds and reliability.
3.101 The introduction of a national road pricing scheme would be a significant policy thatwould have a big impact on most people’s everyday lives. A road pricing scheme on this levelhas not been tested in the UK or abroad, so it is not possible to build a detailed understandingof how people and firms would respond to changes in price signals. Responses of road usersin the modelling are based on evidence of how different users respond to changes in cost,often referred to by economists as ‘elasticities’. Of course, this is not an exact science becauseit is possible that people in the real world could respond more or less strongly than modelsanticipate. For example, the London Congestion Charge resulted in a greater reduction intraffic than TfL’s initial modelling had anticipated. However, given that the models used arebased on evidence of behavioural patterns and real travel information, in general there is afairly good understanding of these issues and the models are effective for this purpose.
3.102 The response of freight operators is particularly difficult to model, as it will depend ona number of factors, including the size of the logistics company. There are likely to beimplications for freight deliveries, as the cost of transporting goods to be delivered at aparticular time are likely to be different, which may feed through into consumer prices andlogistics efficiencies. Conversely, freight would benefit strongly from road pricing due to theimprovements in congestion, and in particular, reliability. However, larger operators are more
The response ofroad users in the
real world arealso important
Design is crucialfor the benefitsto be delivered
173ED D I N GT O N ST U DY: VO LU M E 3
17 For more detail see Wider economic impacts of transport interventions, MVA in association with David SimmondsConsultancy, 2006.

MA K I N G B E T T E R U S E O F C U R R E N T N E T W O R K S3.3likely to have the IT capability to better assess the costs and benefits of different options,while smaller companies may not.
3.103 Similarly, the response of private individuals may be influenced by personal factors,as much as by a highly rational economic assessment of the costs and benefits of differentoptions.
3.104 Recognising that there is a need to understand the behavioural responses to roadpricing better, and to manage the risks of technologies that would be needed to implementroad pricing, pilot schemes would help build an understanding of likely impacts and the mosteffective designs and technologies. Indeed, some pilot schemes are already being worked upin some areas. In addition, learning from the evidence from other countries where roadpricing has been introduced or is planned would be valuable.
Distr ibut ional impacts
3.105 As discussed earlier, although road pricing would be expected to have net benefits,there would be winners and losers from the point of view of those using the roads, and thesedistributional impacts could have implications for the level of economic benefits achievedand for social inclusion objectives and public acceptability. The design of the pricing schemeis of course very important in this regard, with particular implications for the distribution ofimpacts owing to the nature and location of travel being undertaken.
3.106 On the basis of the evidence of the national distance-based scheme, the extent towhich different road users are better or worse off when making particular trips would dependon the impacts and accompanying policies on the transport system as a whole. In the absenceof complementary policies on other parts of the transport system, in general, business, freightand most non-work/leisure travellers benefit from road pricing, given the balance betweenthe value they place on making the journey and the price they have to pay, although withinthese groups there would be some variation. Those making commuter journeys could bemade worse off as a group, especially if alternative journey options, such as a different timeof travel or public transport capacity, are not available. Policies on other modes and use ofrevenues are therefore important to consider when assessing overall impacts. However, it isimportant to remember that commuters, as individuals, would benefit from improvements totheir journeys as non-work/leisure travellers or while on business.
3.107 There may be economic costs associated with these distributional impacts if pricingresults in the suppression of economically important journeys, particularly where there arewider benefits to that journey that the user may not cost into their decision making, such aslabour market and agglomeration benefits. If there were evidence of significant wider benefitsfrom these journeys, there would be a case for reflecting these in the prices set. However, theextent of these external economic benefits is likely to be location-specific, so should beconsidered at the more detailed level where possible.
3.108 There would also be complicated, but often positive social inclusion impacts fromroad pricing at the local, regional or national level. A scheme that involved differentiatedpricing by area would tend to benefit motorists in rural areas as the cost of using these roadsfalls. Levels of car ownership are higher in rural areas than in urban areas, including for lowerincome households. Many socially excluded groups in rural areas have access to a car andwould be expected to benefit. However, those without a car might be adversely affected, asthe cost-effectiveness of providing rural public transport would be reduced as car travel ismade relatively cheaper which reduces public transport demand.
There may beimplications forsocial inclusion
and publicacceptability
There may bewider economiccosts associated
with thesedistributional
impacts
Although thereare large net
benefits, roadpricing would
have some losers
Smaller scale and pilot pricingschemes should
be consideredfirst
174 ED D I N GT O N ST U DY: VO LU M E 3
MA K I N G B E T T E R U S E O F C U R R E N T N E T W O R K S 3.33.109 The converse would be true in the most congested urban areas, where car ownerswould be paying more than they would do otherwise. Those who were dependent on car usewould incur higher costs. However, car ownership tends to be lower in urban areas,particularly amongst lower income households, so the social impacts would be mixed. Thosewithout access to a car would benefit from improved reliability, and speeds on publictransport, and a better local environment in terms of congestion and air quality.
Del iver ing road pr ic ing
3.111 National road pricing has the potential to deliver substantial benefits for road users,for the environment, for the economy and for taxpayers. However, pricing of this scale is notto be found anywhere else in the world. There are many technological, geographical anddesign options for implementing road pricing, and there is currently insufficient evidence tobe able to identify what the ‘right’ option should be. Before taking decisions on the precisedesign of a national scheme, better information is needed on how users will respond to roadpricing, what the most cost-effective technologies are, and what the indirect implicationsmight be for the environment, land-use, the economy, and for particular sections of society.
3.112 This uncertainty is not an excuse for doing nothing. Indeed, one of the most seriousrisks is that government and the private sector scale down their plans for investment on thebasis that pricing will reduce the need for additional capacity, but for road pricing not to bedelivered. This could result in a severe shortage of transport capacity, resulting in worseningcongestion for road users and billions of pounds of cost to the economy.
3.113 So, although the economic case is clear, as the potential welfare benefits aresubstantial, there are a several issues that would need to be addressed for road pricing tobecome a reality. These are described in Figure 3.10.
To make roadpricing a reality,a range of issues
need to beaddressed
Design andtechnology issuesmust be carefully
assessed first
175ED D I N GT O N ST U DY: VO LU M E 3

MA K I N G B E T T E R U S E O F C U R R E N T N E T W O R K S3.3
176 ED D I N GT O N ST U DY: VO LU M E 3
3.114 In addition, with the move to widespread road pricing, decisions will need to be takenon tax policy in order to ensure that it contributes to the overall aims of road pricing and doesnot impede its introduction. A future framework of taxes and charges will need to take intoaccount the imapct on the motorist, the requirement for a sound revenue base to fundessential public services and the need to protect the environment.
PRICE SIGNALS ON OTHER MODES
3.115 The arguments for making greater use of price signals on the road network applyequally to other modes too, particularly on the priority links characterised by high demandand congestion during peak hours and spare capacity off-peak.
3.116 Although the evidence base is weaker on targeted pricing on other modes, theprinciples and potential benefits of better pricing still apply. That is to say that, if prices wereto better reflect the true costs of making journeys, the incentive would be provided to makeimproved travel decisions and to make better use of transport infrastructure.
The principles ofbetter pricingapply to other
modes
Figure 3.10: Preparing the pathway to widespread congestion targetedroad-pricing within the next 10 years – articulating the decision points.
This requires early decisions on pilots:
• how the pilots should be framed to test different pricing structures andtechnologies, on both urban and strategic networks, to inform the transition towidespread pricing;
• how to balance the benefits of early inter-operability of technology, with thebenefits of testing different technologies; and
• to set up an independent, published evaluation of the findings from the pilots.
It requires early decisions on the approach to transport investment:
• to confirm near-term investment plans in a world pre-road pricing;
• to test the case for long-term investments in an environment where pricing –localised or widespread – is approaching; and
• to develop a framework for identifying and evaluating the case for complementaryinvestment and pricing on other modes and how that will change through time.
At the appropriate point along the pathway there will need to be decisionson:
• publication on the government’s strategy, informed by the pilots;
• overall vision for the long-term design and coverage of a widespread pricing systemin the UK: how far coverage of a widespread scheme needs to go to, and whichtechnologies should be used, to deliver its benefits cost-effectively;
• when and for whom will road charging apply;
• which bodies will hold powers to set charges and retain revenues;
• reviewing investment plans in the light of timing decisions on the move towidespread road pricing;
• legeslative requirements to deliver widespread road pricing; and
• delivery arrangements and accountability for delivering widespread, congestion-targeted road pricing.

MA K I N G B E T T E R U S E O F C U R R E N T N E T W O R K S 3.3
177ED D I N GT O N ST U DY: VO LU M E 3
3.117 As described above, train operators already make use of differential pricing to somedegree, to encourage peak spreading and to fill empty off-peak seats. Preliminary modellingsuggests there could be benefits from making better use of price signals on the rail network,both to manage peak demand, and to encourage better utilisation of off-peak services.Indeed, where overcrowding is extreme, such as on particular commuter corridors into somemajor urban areas, the potential for pricing to redistribute some peak demand into theshoulder peak could make a useful contribution.
3.118 Although there is no evidence available to this study on the most efficient prices forrail use, strategic modelling evidence suggests that, for illustration, if rail fares increased byRPI plus 2.5 per cent across the board out to 2026, growth in demand over the period wouldbe at least 12 per cent lower than under RPI plus 1 percent. If applied as a blanket change infares, however, this would be a very blunt and untargeted way of using price signals. Thepurpose is not, in any case, to price people off the railway, but rather to encourage greater useof the shoulder and off-peak services. There would be far greater potential in using pricesignals to redistribute demand by charging more for journeys with the highest cost, such as atpeak times, and less for those off-peak journeys with a low marginal cost. This would have theeffect of spreading demand for peak and shoulder-peak rail services and encourage betterutilisation of off-peak services. There would be distributional and economic considerationsfrom such an approach, given the variation across travellers in the extent to which they areflexible in their time of travel and their ability to pay.
3.119 However, as identified in the road pricing analysis above, it would be important toconsider the economic and welfare implications of changing travel behaviour in this way. Agreater understanding of the use of pricing mechanisms on specific routes would be neededto determine the costs and benefits of different options.
3.120 While airlines have been making increasingly sophisticated use of pricingmechanisms in determining the prices they charge consumers for flights, slots at the busiestand most congested UK airports are still allocated by administrative means determined bythe European Slots Regulation. Although a ‘grey market’ exists for slot trading betweenairlines, a revision of the Regulation is required for the market to become formalised andtransparent. A European Commission study indicates that such changes could increasepassenger throughput at Heathrow and Gatwick by up to 5 per cent.18 Although theintroduction of formal slot trading would be a useful tool for making better use of existingcapacity, it would not eliminate the need for additional capacity.
3.121 There may be further gains from using market mechanisms, for example auctions, toallocate significant numbers of new slots and provide more reliable signals about the need foradditional capacity in particular locations. Such mechanisms could also generate additionalrevenue for reinvestment in new capacity or in surface access improvements, althoughcomplex issues of slot ownership would need to be addressed first.
3.122 Within the European Union, a common aviation area is well developed, allowing EUairlines freedom to fly wherever they wish. However, outside the EU, air services remainlargely governed by bilateral agreements, many of which are highly restrictive. While someprogress has been made in negotiating more liberal agreements with third countries, the EUexperience suggests there would be strong competition and consumer benefits fromextending this approach.
Better pricing onaviation coulddeliver strong
benefits
Better pricing onrail could be
effective
18 Study to Assess the Effects of Different Slot Allocation Schemes, NERA for the European Commission, 2004.
MA K I N G B E T T E R U S E O F C U R R E N T N E T W O R K S3.33.123 Given the serious implications that aviation emissions could have for climate change,there is an urgent need to identify and implement an effective mechanism for ensuring thatair travellers pay the full cost of their climate change impacts. The implications that some sortof carbon pricing mechanism for aviation might have for the case for additional airportcapacity are explored in Chapter 3.4.
FROM PRICING TO INCREASING CAPACITY
3.124 As would be expected, road pricing has an impact on the economic case foradditional transport capacity and fixed infrastructure. Indeed, the impact on the case foradditional road infrastructure is one of its selling points, as discussed in more detail inChapter 3.4. Having explored the many options for pricing transport, the next chapterconsiders the case for additional infrastructure to contribute to welfare and GDP.
178 ED D I N GT O N ST U DY: VO LU M E 3

3.4 EN H A N C I N G C U R R E N T N E T W O R K S
TH E ED D I N GT O N TR A N S P O RT ST U DY: MA I N RE P O RT: VO LU M E 3 179
Headlines
• Even after accounting for environmental impacts, well-targeted infrastructureoptions are able to offer very high welfare and GDP returns per £1 of governmentexpenditure with big gains for businesses, freight and commuters.
Congested and growing urban areas
• A step-change in understanding of the best interventions in urban areas is needed.
• Walking and cycling options have the potential for very high welfare returnsrelative to their cost but may not be enough alone to tackle the true scale of thefurther challenges facing the UK.
• Improved bus services are sometimes able to offer a higher-return solution totransport problems than more costly fixed infrastructure options, such as light rail.
• Roads can, in some circumstances, offer a very high-return solution to transportproblems in major urban areas; they should not be ignored as an option to considerbut environmental impacts must, of course, be accounted for.
• Targeted additional capacity on key commuter corridors into major urban areascan offer very high returns owing to the competing demands for capacity of largevolumes of travellers. This offers substantial benefits not just to commuters butalso to freight, business and leisure travellers.
Key international gateways
• Private sector investment in additional capacity at ports and airports, wherecapacity constraints threaten rising costs to the UK economy and environmentaleffects are accounted for, would make a significant contribution to GDP andwelfare.
• Additional capacity on targeted surface access links offers among the highestreturns, even after accounting for environmental impacts.
Key inter-urban corridors
• Targeted inter-urban road capacity offers very high GDP and welfare returns, evenafter accounting for the environmental impacts; looking beyond 2015, in theabsence of road pricing and better use measures, there is an economic case for arate of road build enhancements that exceeds current rates.
• With national road pricing, there would be an economic case for additionalstrategic road capacity beyond 2015, particularly on the approaches to, andcorridors around, major urban areas but it would be significantly lower than thecurrent rate of road build.
• Additional infrastructure intended to transform the economy and relying onuntested technologies is unlikely to be a priority given the UK’s extensive networkand connectivity and the speculative demand benefits. Those step-changemeasures proposed as a solution to existing and likely future problems are morelikely to perform well, but must be assessed alongside other options for a giventransport challenge.

EN H A N C I N G C U R R E N T N E T W O R K S3.4INTRODUCTION
4.1 The previous chapter demonstrated that better use options have the potential tocontribute significantly to GDP and can have good environmental impacts. Therefore theseshould always be the first option considered. In some circumstances however, making betteruse can only go so far, prompting the need to consider the costs and benefits of additionalinfrastructure.
4.2 The case for additional infrastructure is dependent on the nature and scale of thechallenge faced; the economic, demographic and environmental implications of takingaction in a particular location; and the costs of alternative solutions. In this chapter, thecontext of infrastructure options will be set out followed by a description of the range ofinfrastructure options and their relative returns. Given the available evidence, returns willfirst be discussed in the absence of road pricing, then each section explores the key issuesaround the impacts on returns if roads were better priced.
4.3 Instead of taking a modal approach, this chapter adopts a structure based on thestrategic priorities identified in Volume 2, namely:
• growing and congested urban areas and their catchments – infrastructurerequirements in the UK’s often complex urban networks;
• key international gateways – the infrastructure interventions needed tosupport the UK's internationally competitive position in the increasinglyglobalised world; and
• key inter-urban corridors – the infrastructure needed to support connectionsbetween the UK’s major urban areas, and international gateways.
4.4 Before examining these groupings, some overview messages are identified.
INVESTING IN INFRASTRUCTURE: OVERVIEW
4.5 Infrastructure provision can take a range of forms, and may involve a combination ofmore than a single type. This chapter broadly distinguishes between variable capacityprovision, and fixed infrastructure:
• variable capacity: investment in assets that increase the effective capacity ofthe existing transport system without the need for significant additional fixedinfrastructure. For example, longer trains and platforms, additional buses; and
• fixed infrastructure: investment in long-life transport capital assets that oftencreate a larger ‘footprint’ in terms of land take, such as new and improvedroads, rail lines or ports capacity.
4.6 Most of the evidence available to this study on the GDP and welfare returns is fromthese two types of infrastructure options. As further described in Chapter 3.5, the evidencereflects real schemes implemented or proposed in the UK, plus modelling of some illustrativeinterventions. The availability of evidence has meant that the extent to which differentinterventions or areas are covered is sometimes limited with only a small sample size. Forsome interventions, there is no robust evidence on which this study has been able to draw, forexample on rail freight interventions. In addition, the study relies on evidence which is afunction of the existing options generation process. Such interventions have not beengenerated with growth as the key objective. If they were, different options may have comeforward.
180 TH E ED D I N GT O N TR A N S P O RT ST U DY: MA I N RE P O RT: VO LU M E 3
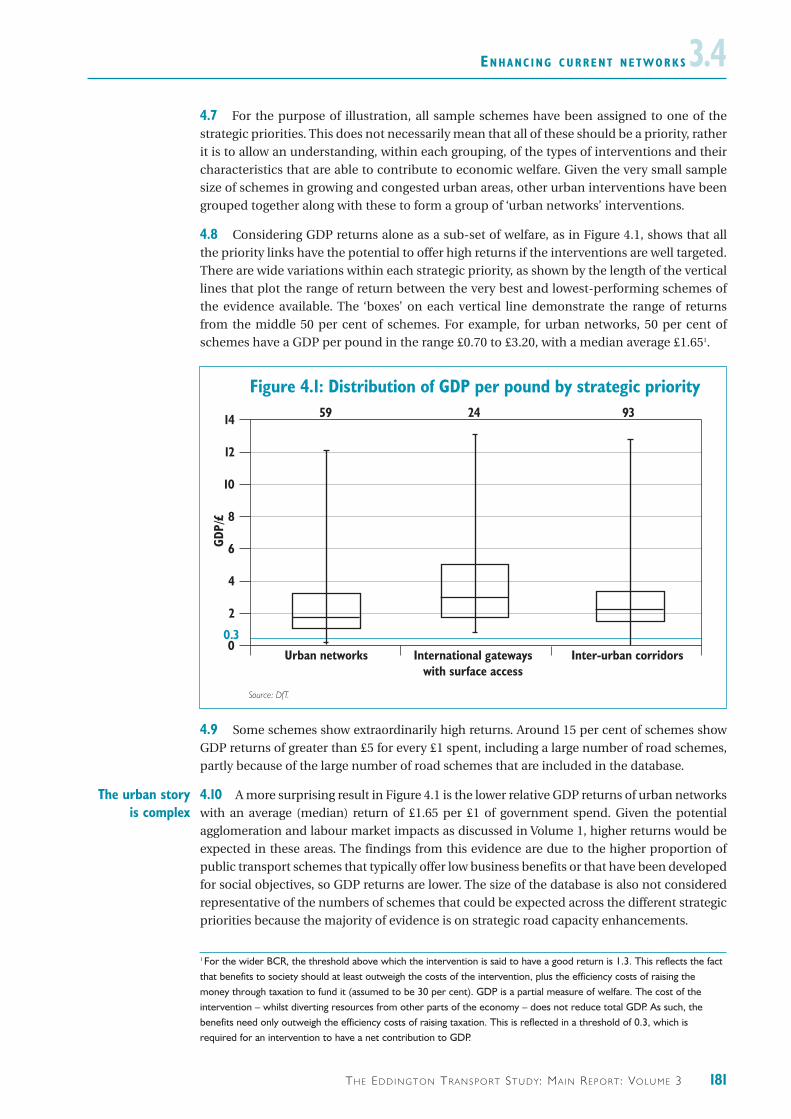
EN H A N C I N G C U R R E N T N E T W O R K S 3.44.7 For the purpose of illustration, all sample schemes have been assigned to one of thestrategic priorities. This does not necessarily mean that all of these should be a priority, ratherit is to allow an understanding, within each grouping, of the types of interventions and theircharacteristics that are able to contribute to economic welfare. Given the very small samplesize of schemes in growing and congested urban areas, other urban interventions have beengrouped together along with these to form a group of ‘urban networks’ interventions.
4.8 Considering GDP returns alone as a sub-set of welfare, as in Figure 4.1, shows that allthe priority links have the potential to offer high returns if the interventions are well targeted.There are wide variations within each strategic priority, as shown by the length of the verticallines that plot the range of return between the very best and lowest-performing schemes ofthe evidence available. The ‘boxes’ on each vertical line demonstrate the range of returnsfrom the middle 50 per cent of schemes. For example, for urban networks, 50 per cent ofschemes have a GDP per pound in the range £0.70 to £3.20, with a median average £1.651.
4.9 Some schemes show extraordinarily high returns. Around 15 per cent of schemes showGDP returns of greater than £5 for every £1 spent, including a large number of road schemes,partly because of the large number of road schemes that are included in the database.
4.10 A more surprising result in Figure 4.1 is the lower relative GDP returns of urban networkswith an average (median) return of £1.65 per £1 of government spend. Given the potentialagglomeration and labour market impacts as discussed in Volume 1, higher returns would beexpected in these areas. The findings from this evidence are due to the higher proportion ofpublic transport schemes that typically offer low business benefits or that have been developedfor social objectives, so GDP returns are lower. The size of the database is also not consideredrepresentative of the numbers of schemes that could be expected across the different strategicpriorities because the majority of evidence is on strategic road capacity enhancements.
The urban storyis complex
181TH E ED D I N GT O N TR A N S P O RT ST U DY: MA I N RE P O RT: VO LU M E 3
1 For the wider BCR, the threshold above which the intervention is said to have a good return is 1.3. This reflects the factthat benefits to society should at least outweigh the costs of the intervention, plus the efficiency costs of raising themoney through taxation to fund it (assumed to be 30 per cent). GDP is a partial measure of welfare. The cost of theintervention – whilst diverting resources from other parts of the economy – does not reduce total GDP. As such, thebenefits need only outweigh the efficiency costs of raising taxation. This is reflected in a threshold of 0.3, which isrequired for an intervention to have a net contribution to GDP.
Figure 4.1: Distribution of GDP per pound by strategic priority
0
2
4
6
8
10
12
14
0.3
59 24 93
Urban networks International gatewayswith surface access
Inter-urban corridors
GDP/
£
Source: DfT.

EN H A N C I N G C U R R E N T N E T W O R K S3.44.11 Even so, it is worth noting that even though the schemes considered are not designedexplicitly to target growth, the top 25 per cent of urban schemes offer returns at least as highas the average (median) of the better-performing interventions of around £3 of GDP per £1 ofgovernment spend (given the smaller sample size of interventions for which evidence isavailable).
4.12 Perhaps the most significant element of GDP that is missing from the current approachto appraisal is the agglomeration effect. But the options in major urban areas were notgenerated with an understanding of these effects. If option generation were to take accountof these new effects, higher GDP returns would be achievable.
4.13 When the broader perspective of welfare – the wider BCR – is considered, asdemonstrated in Figure 4.2, the disparity in returns between urban networks and the otherstrategic priorities reduces owing to the fact that direct benefits to commuters and non-work/leisure travellers are now included. They are important beneficiaries of urbaninterventions.
4.14 As with Figure 4.1, Figure 4.2 has the vertical line plotting the range of returns betweenthe best and lowest-performing interventions of the evidence available for each strategicpriority.2 The wider BCRs are higher than GDP per pound achieved owing to the inclusion ofa broader range of benefits. The median average return of urban areas is around 4, and thatof inter-urban corridors and international gateways is 4.5.
182 TH E ED D I N GT O N TR A N S P O RT ST U DY: MA I N RE P O RT: VO LU M E 3
2 The available evidence has, for the purposes of illustration, been allocated to one of each of the strategic priorities.
Figure 4.2: Distribution of economic returns from government expenditure by strategic priority: wider benefit:cost ratio
0
5
10
15
20
25
3059 24 93
Urban networks International gatewayswith surface access
Inter-urban corridors
1.3
Wid
er B
CR
Source: DfT.

EN H A N C I N G C U R R E N T N E T W O R K S 3.44.15 Another feature of the underlying data is that across each of the priority link groupings,the range of returns is significant. The highest welfare returns on roads appear to be wherecongestion problems are caused by the shared network nature of UK roads. For example,where a road enhancement is able to improve accessibility to a major airport, it is likely thata range of other non-airport travellers will use and benefit from the improved link.3
4.16 On the basis of the evidence available, fixed capacity enhancements other than roadsoften show relatively low returns. This in part reflects several low-returns public transportschemes such as some light rail options, but also reflects the very high-cost of railinfrastructure projects. Rail schemes can potentially generate significant absolute benefitsbut the high costs involved mean that the return per pound invested is often constrained,when compared with other interventions.
4.17 It is of course important to remember that the environmental implications ofadditional infrastructure can, in some cases, be substantial. Figure 4.3 attempts todemonstrate the illustrative estimated impact on the wider BCR of the most significant socialand environmental effects for which it is possible to estimate a monetary value. These are:carbon emissions, using Defra guidance; air quality, noise and landscape using publishedgovernment research.4 Figure 4.3 plots out the illustrative reduction or increase in the widerBCR that would be brought about by taking the environmental implications into account.Only those schemes for which this has been possible using available evidence are shown; thisis around one-third of the schemes in the database.
4.18 As Figure 4.3 shows, the variation in impacts is, wide as they are, highly dependent onlocation. Interventions in urban areas can have beneficial impacts, for example publictransport interventions can reduce congestion through providing incentives for modal shiftfrom cars. For fixed infrastructure options, as are captured in surface access and inter-urbanlinks, the adverse impacts on the environment can notably reduce the wider BCR. As Figure4.3 shows, for some interventions, the BCR can be reduced by more than 3 points, with manyreducing by more than 1, i.e. falling from, for example, a wider BCR of 6 to 3.
4.19 Therefore, although the wider BCRs of new inter-urban links are generally stronger, thismust be balanced against the environmental effects that are, on average, adverse.
Costs ofinterventions canconstrain relative
returns
Targeted roadinterventions
offer very highwelfare returns
183TH E ED D I N GT O N TR A N S P O RT ST U DY: MA I N RE P O RT: VO LU M E 3
3 Transport demand to 2025 and the economic case for road pricing and investment, DfT, 2006, Chapter 6.4 For more detail see, Transport demand to 2025 and the economic case for road pricing and investment, DfT, 2006.

EN H A N C I N G C U R R E N T N E T W O R K S3.4
4.20 The next section takes a more focused look at infrastructure options in major urbanareas and their catchments.
GROWING AND CONGESTED URBAN AREAS AND THEIRCATCHMENTS
4.21 The majority of congestion and overcrowding is to be found in growing and congestedurban areas and their catchments. This stems from the density of economic activity thatinvolves significant transport of goods and people in those areas. In a globalising world, suchurban areas are likely to be key to the UK’s economic performance as they provide theconditions for a successful and dynamic services sector, especially through their deep andspecialised labour markets. If no action is taken to alleviate the pressures, the costs to theeconomy are likely to be very large and national economic growth will be constrained.
4.22 Urban areas have very diverse economic, social, land use, and physical characteristics.Therefore it is not possible to conclude a single list of interventions that are likely to make themost cost effective contribution to GDP because one size does not fit all. The appropriateintervention will be determined by specific local circumstances, making option generationand prioritisation crucial.
4.23 The density of economic activity and transport networks in urban areas also meansthat interactions between interventions are very important. An intervention implemented inone area is likely to affect the effectiveness and outcomes of others, either positively ornegatively. While the evidence provides some limited insights, there remains scope tounderstand better the types of synergistic effects that may be possible. This was explored aspart of the case study work in the South and West Yorkshire area as described later in this chapter.
4.24 The scope for additional infrastructure in major urban areas and their catchment areascovers a wide range of potential options but land space and environmental constraints maymean that some are less likely to be pursued than others. Nonetheless the case for urbaninfrastructure should be considered because as will be shown in this section, the availableevidence suggests high returns are possible from targeted capacity if implemented under theright conditions.
One size does notfit all
184 TH E ED D I N GT O N TR A N S P O RT ST U DY: MA I N RE P O RT: VO LU M E 3
Figure 4.3: The impact on the wider BCR of environmental effects by strategic prioritya
-4.0
-3.5
-3.0
-2.5
-2.0
-1.5
-1.0
-0.5
0.0
0.5
1.0En
viro
nmen
tal a
nd s
ocia
l im
pact
s(p
er £
spe
nt)
Urban networks Inter-urbancorridors
International gatewayswith surface access
Source: DfT.
aSocial effects, such as journey ambience, are also illustratively included where possible.

EN H A N C I N G C U R R E N T N E T W O R K S 3.44.25 To reiterate, the evidence discussed here can only reflect what has been available tothis study. Very little, if any, evidence is available on some urban interventions and it ispossible that considering urban interventions in isolation misses some of the urban networkeffects that might be expected as schemes and policies interact. In short, the case for urbaninvestment can only be pieced together drawing from both the evidence in Volumes 1 and 2(a top down approach ) and Volume 3 (a bottom up approach).
Smal l -sca le in frastructure opt ions
4.26 Chapter 3.3 on better use showed that the severity of the congestion and overcrowdingproblems in many urban areas allows measures such as traffic management or urban trafficcontrol to be highly effective. To complement these, relatively small-scale investment ininterventions such as walking and cycling capacity can help provide the incentive for modeshift away from the car to reduce the costs of congestion.
4.27 Improving walking and cycling capacity by creating or upgrading routes that makethese more attractive modes of travel could provide good welfare and GDP returns, especiallyif utilising dedicated infrastructure targeted around key services or growing urban areas.
4.28 Evidence on a number of schemes suggests a very wide range of returns is possible andthat often they are very high, with wider BCRs ranging from 14.9-32.5.5 However, GDP perpound returns are often much lower, between £1-2.50, though schemes serving high-economic-growth areas can achieve around £5 per pound invested.
4.29 For most schemes, the majority of benefits, often over 85-90 per cent, accrue frombenefits to physical fitness, safety and security effects, which can usefully contribute togovernment’s objectives of promoting a safer and healthier society. Indeed, there are likely tobe direct GDP benefits from these health effects but how this feeds through is not yet possibleto quantify. Such interventions are also likely to produce a positive impact on theenvironment, due to the shift to quieter and non-polluting modes, but this may only be small.
4.30 Although these schemes are able to offer very good returns if well targeted, they tendto be relatively small in scale so, on their own, are likely to have only a relatively small directimpact on the overall performance of UK’s transport network. Especially, as many of theseschemes only impact on short-distance journeys and often have a limited scale of achievablebenefits. Although this is very beneficial, and such interventions could be valuablecomplementary measures in many circumstances, to tackle larger challenges, a greater scaleof action is needed.
4.31 Where larger scale cycling interventions are implemented, preliminary evidencesuggests that the returns may also be relatively high. Given the current use of cycling as amode of transport in the UK, which is among the lowest of EU countries, this may suggest thepotential for larger-scale uptake of cycling under the right conditions. A sharp increase incycling in London, for example, has recently been seen. The interventions required should ofcourse be assessed on the basis of their relative returns and be well targeted, and would needto be sufficient to achieve a sustained shift in travel behaviour.
4.32 The next section discusses the broader range of infrastructure options in urban areasalong with the potential returns.
On their own,they are unlikely
to tackle the truescale of the
problems
Walking andcycling schemescan deliver high
returns
185TH E ED D I N GT O N TR A N S P O RT ST U DY: MA I N RE P O RT: VO LU M E 3
5 Summary Note on the Economic Appraisal of Links to Schools, Sustrans 2006.
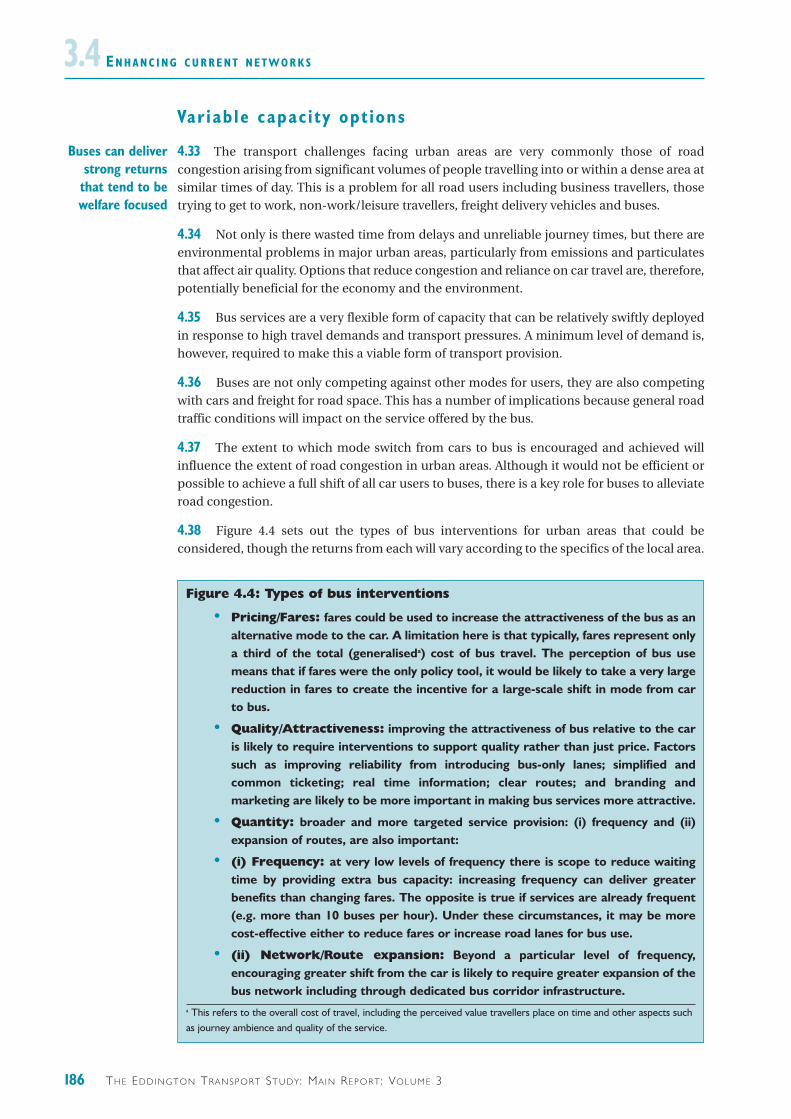
EN H A N C I N G C U R R E N T N E T W O R K S3.4Variable capac i ty opt ions
4.33 The transport challenges facing urban areas are very commonly those of roadcongestion arising from significant volumes of people travelling into or within a dense area atsimilar times of day. This is a problem for all road users including business travellers, thosetrying to get to work, non-work/leisure travellers, freight delivery vehicles and buses.
4.34 Not only is there wasted time from delays and unreliable journey times, but there areenvironmental problems in major urban areas, particularly from emissions and particulatesthat affect air quality. Options that reduce congestion and reliance on car travel are, therefore,potentially beneficial for the economy and the environment.
4.35 Bus services are a very flexible form of capacity that can be relatively swiftly deployedin response to high travel demands and transport pressures. A minimum level of demand is,however, required to make this a viable form of transport provision.
4.36 Buses are not only competing against other modes for users, they are also competingwith cars and freight for road space. This has a number of implications because general roadtraffic conditions will impact on the service offered by the bus.
4.37 The extent to which mode switch from cars to bus is encouraged and achieved willinfluence the extent of road congestion in urban areas. Although it would not be efficient orpossible to achieve a full shift of all car users to buses, there is a key role for buses to alleviateroad congestion.
4.38 Figure 4.4 sets out the types of bus interventions for urban areas that could beconsidered, though the returns from each will vary according to the specifics of the local area.
Buses can deliverstrong returns
that tend to bewelfare focused
186 TH E ED D I N GT O N TR A N S P O RT ST U DY: MA I N RE P O RT: VO LU M E 3
Figure 4.4: Types of bus interventions
• Pricing/Fares: fares could be used to increase the attractiveness of the bus as analternative mode to the car. A limitation here is that typically, fares represent onlya third of the total (generaliseda) cost of bus travel. The perception of bus usemeans that if fares were the only policy tool, it would be likely to take a very largereduction in fares to create the incentive for a large-scale shift in mode from carto bus.
• Quality/Attractiveness: improving the attractiveness of bus relative to the caris likely to require interventions to support quality rather than just price. Factorssuch as improving reliability from introducing bus-only lanes; simplified andcommon ticketing; real time information; clear routes; and branding andmarketing are likely to be more important in making bus services more attractive.
• Quantity: broader and more targeted service provision: (i) frequency and (ii)expansion of routes, are also important:
• (i) Frequency: at very low levels of frequency there is scope to reduce waitingtime by providing extra bus capacity: increasing frequency can deliver greaterbenefits than changing fares. The opposite is true if services are already frequent(e.g. more than 10 buses per hour). Under these circumstances, it may be morecost-effective either to reduce fares or increase road lanes for bus use.
• (ii) Network/Route expansion: Beyond a particular level of frequency,encouraging greater shift from the car is likely to require greater expansion of thebus network including through dedicated bus corridor infrastructure.
a This refers to the overall cost of travel, including the perceived value travellers place on time and other aspects suchas journey ambience and quality of the service.
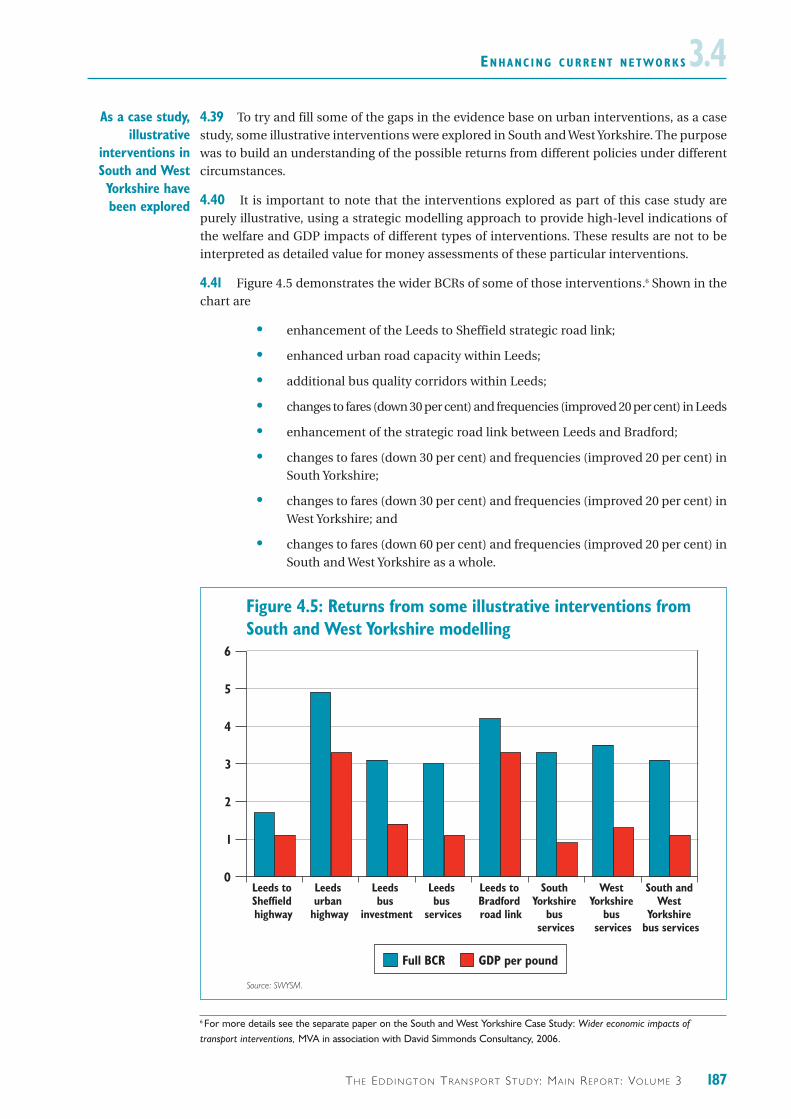
EN H A N C I N G C U R R E N T N E T W O R K S 3.44.39 To try and fill some of the gaps in the evidence base on urban interventions, as a casestudy, some illustrative interventions were explored in South and West Yorkshire. The purposewas to build an understanding of the possible returns from different policies under differentcircumstances.
4.40 It is important to note that the interventions explored as part of this case study arepurely illustrative, using a strategic modelling approach to provide high-level indications ofthe welfare and GDP impacts of different types of interventions. These results are not to beinterpreted as detailed value for money assessments of these particular interventions.
4.41 Figure 4.5 demonstrates the wider BCRs of some of those interventions.6 Shown in thechart are
• enhancement of the Leeds to Sheffield strategic road link;
• enhanced urban road capacity within Leeds;
• additional bus quality corridors within Leeds;
• changes to fares (down 30 per cent) and frequencies (improved 20 per cent) in Leeds
• enhancement of the strategic road link between Leeds and Bradford;
• changes to fares (down 30 per cent) and frequencies (improved 20 per cent) inSouth Yorkshire;
• changes to fares (down 30 per cent) and frequencies (improved 20 per cent) inWest Yorkshire; and
• changes to fares (down 60 per cent) and frequencies (improved 20 per cent) inSouth and West Yorkshire as a whole.
As a case study,illustrative
interventions inSouth and West
Yorkshire havebeen explored
187TH E ED D I N GT O N TR A N S P O RT ST U DY: MA I N RE P O RT: VO LU M E 3
Figure 4.5: Returns from some illustrative interventions from South and West Yorkshire modelling
0
1
2
3
4
5
6
GDP per poundFull BCR
South and West
Yorkshire bus services
West Yorkshire
bus services
South Yorkshire
bus services
Leeds to Bradford road link
Leeds bus
services
Leeds bus
investment
Leeds urban
highway
Leeds to Sheffield highway
Source: SWYSM.
6 For more details see the separate paper on the South and West Yorkshire Case Study: Wider economic impacts oftransport interventions, MVA in association with David Simmonds Consultancy, 2006.

EN H A N C I N G C U R R E N T N E T W O R K S3.44.42 This demonstrates that returns are similar across the bus interventions considered,with wider BCRs of around 3. These all represent very large-scale bus interventions coveringsome very large geographical areas in South and West Yorkshire. Conclusions on the extent towhich these returns would hold for smaller-scale interventions, or in other areas thatdemonstrate different transport systems and travel patterns, cannot be made.
4.43 Looking in more detail, despite similar overall welfare returns, there are differentwider economic effects. For example, improving bus fares and frequencies in South Yorkshireoffers a lower impact on GDP than in West Yorkshire for the same magnitude of intervention.This is due to the different nature of local demographics, economy and travel patterns. It isalso important to consider the existing level of bus service in the given area: where busservices already exist and provide a good service meeting all potential demand cost-effectively, the returns from adding more are likely to be lower. In West Yorkshire, accountingfor the wider economic effects added around 14 per cent to overall welfare. In South Yorkshirethis was just 5 per cent.
4.44 It also appears from this evidence that providing significant additional businfrastructure that does not take away road space from cars, provides similar welfare and GDPper pound spent, for the given generic cost assumptions, as improving fares and frequencies.The indicative wider BCR is around 3 for both interventions, but adding fixed infrastructureis much more expensive, and would be subject to environmental impacts owing to land take.In practice, many urban areas will not have the landspace available to make this arealistic option.
4.45 It is important to recognise that these wider BCRs are not value for moneyassessments. It has not been possible to include the environmental implications in thesewider BCRs but additional infrastructure in the form of new bus lanes, for example, wouldhave implications for townscape and landscape, depending on the specific location.The impacts are likely to be significant and adverse at some sites.
4.46 Conversely, the environmental impacts of improving bus services should be beneficial,to the extent that there is some mode shift away from cars towards public transport and roadcongestion is reduced, thus lowering levels of harmful emissions such as carbon andparticulates that reduce air quality. This work revealed that when fares and frequencies wereimproved, carbon emissions were marginally reduced.
4.47 The lower costs of variable bus capacity relative to fixed infrastructure implies a strongcase for considering this as one of the policy options for tackling urban congestion challengesbefore jumping to fixed investment in additional infrastructure.
4.48 However, depending on the nature and magnitude of the problem being faced inmajor urban areas, there may be a case for considering fixed infrastructure for a long-termsolution.
Fixed in frastructure opt ions
4.49 Trams and heavy rail should only be considered as an appropriate policy interventiononce an urban area reaches sufficient density: they are not likely to be the most cost-effectivesolution where transport corridors are more sparsely populated. The density and certainty offuture demand on particular corridors is an important factor in the viability of light and heavyrail. Figure 4.6 outlines the capacities of different public transport systems.
188 TH E ED D I N GT O N TR A N S P O RT ST U DY: MA I N RE P O RT: VO LU M E 3
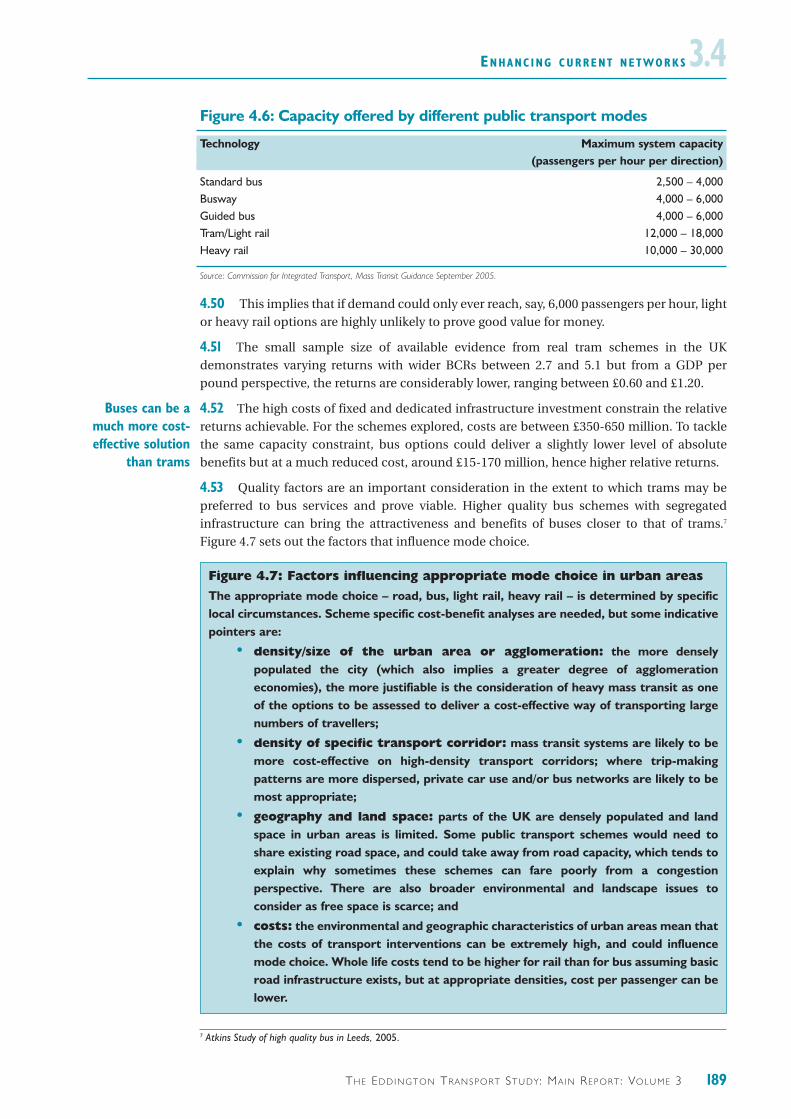
EN H A N C I N G C U R R E N T N E T W O R K S 3.4Figure 4.6: Capacity offered by different public transport modes
Technology Maximum system capacity(passengers per hour per direction)
Standard bus 2,500 – 4,000Busway 4,000 – 6,000Guided bus 4,000 – 6,000Tram/Light rail 12,000 – 18,000Heavy rail 10,000 – 30,000
Source: Commission for Integrated Transport, Mass Transit Guidance September 2005.
4.50 This implies that if demand could only ever reach, say, 6,000 passengers per hour, lightor heavy rail options are highly unlikely to prove good value for money.
4.51 The small sample size of available evidence from real tram schemes in the UKdemonstrates varying returns with wider BCRs between 2.7 and 5.1 but from a GDP perpound perspective, the returns are considerably lower, ranging between £0.60 and £1.20.
4.52 The high costs of fixed and dedicated infrastructure investment constrain the relativereturns achievable. For the schemes explored, costs are between £350-650 million. To tacklethe same capacity constraint, bus options could deliver a slightly lower level of absolutebenefits but at a much reduced cost, around £15-170 million, hence higher relative returns.
4.53 Quality factors are an important consideration in the extent to which trams may bepreferred to bus services and prove viable. Higher quality bus schemes with segregatedinfrastructure can bring the attractiveness and benefits of buses closer to that of trams.7
Figure 4.7 sets out the factors that influence mode choice.
Buses can be amuch more cost-effective solution
than trams
189TH E ED D I N GT O N TR A N S P O RT ST U DY: MA I N RE P O RT: VO LU M E 3
Figure 4.7: Factors influencing appropriate mode choice in urban areasThe appropriate mode choice – road, bus, light rail, heavy rail – is determined by specificlocal circumstances. Scheme specific cost-benefit analyses are needed, but some indicativepointers are:
• density/size of the urban area or agglomeration: the more denselypopulated the city (which also implies a greater degree of agglomerationeconomies), the more justifiable is the consideration of heavy mass transit as oneof the options to be assessed to deliver a cost-effective way of transporting largenumbers of travellers;
• density of specific transport corridor: mass transit systems are likely to bemore cost-effective on high-density transport corridors; where trip-makingpatterns are more dispersed, private car use and/or bus networks are likely to bemost appropriate;
• geography and land space: parts of the UK are densely populated and landspace in urban areas is limited. Some public transport schemes would need toshare existing road space, and could take away from road capacity, which tends toexplain why sometimes these schemes can fare poorly from a congestionperspective. There are also broader environmental and landscape issues toconsider as free space is scarce; and
• costs: the environmental and geographic characteristics of urban areas mean thatthe costs of transport interventions can be extremely high, and could influencemode choice. Whole life costs tend to be higher for rail than for bus assuming basicroad infrastructure exists, but at appropriate densities, cost per passenger can belower.
7 Atkins Study of high quality bus in Leeds, 2005.
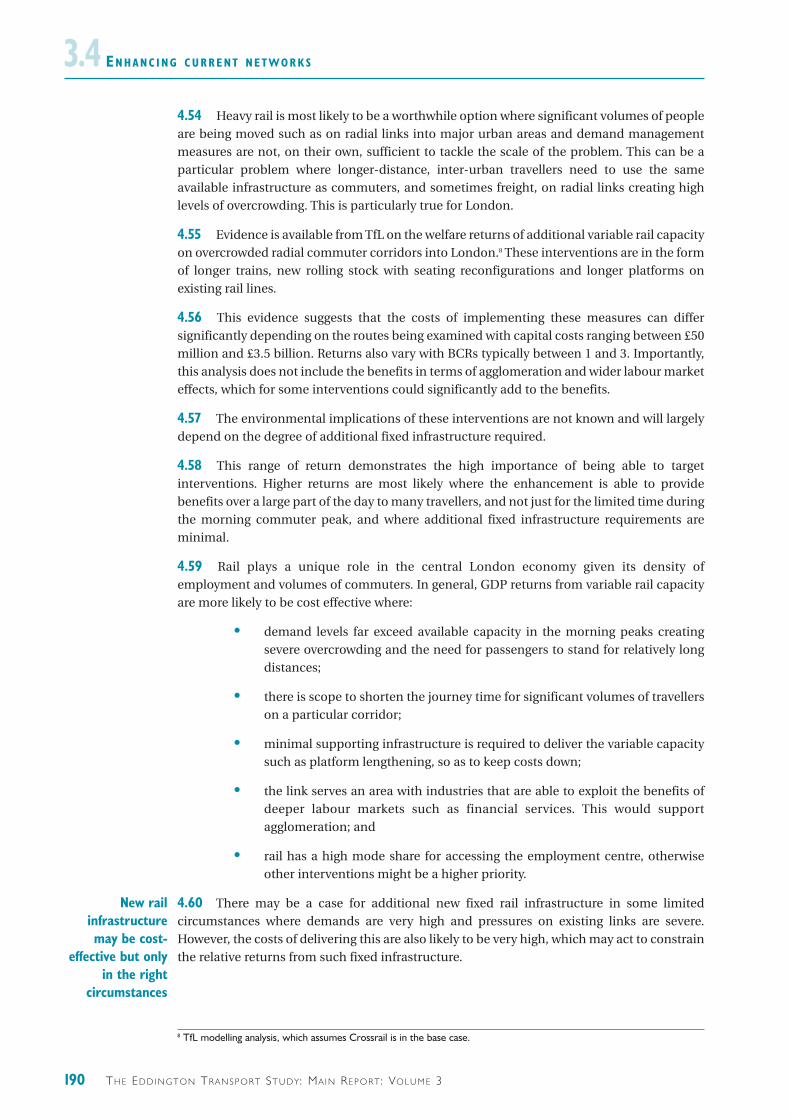
EN H A N C I N G C U R R E N T N E T W O R K S3.44.54 Heavy rail is most likely to be a worthwhile option where significant volumes of peopleare being moved such as on radial links into major urban areas and demand managementmeasures are not, on their own, sufficient to tackle the scale of the problem. This can be aparticular problem where longer-distance, inter-urban travellers need to use the sameavailable infrastructure as commuters, and sometimes freight, on radial links creating highlevels of overcrowding. This is particularly true for London.
4.55 Evidence is available from TfL on the welfare returns of additional variable rail capacityon overcrowded radial commuter corridors into London.8 These interventions are in the formof longer trains, new rolling stock with seating reconfigurations and longer platforms onexisting rail lines.
4.56 This evidence suggests that the costs of implementing these measures can differsignificantly depending on the routes being examined with capital costs ranging between £50million and £3.5 billion. Returns also vary with BCRs typically between 1 and 3. Importantly,this analysis does not include the benefits in terms of agglomeration and wider labour marketeffects, which for some interventions could significantly add to the benefits.
4.57 The environmental implications of these interventions are not known and will largelydepend on the degree of additional fixed infrastructure required.
4.58 This range of return demonstrates the high importance of being able to targetinterventions. Higher returns are most likely where the enhancement is able to providebenefits over a large part of the day to many travellers, and not just for the limited time duringthe morning commuter peak, and where additional fixed infrastructure requirements areminimal.
4.59 Rail plays a unique role in the central London economy given its density ofemployment and volumes of commuters. In general, GDP returns from variable rail capacityare more likely to be cost effective where:
• demand levels far exceed available capacity in the morning peaks creatingsevere overcrowding and the need for passengers to stand for relatively longdistances;
• there is scope to shorten the journey time for significant volumes of travellerson a particular corridor;
• minimal supporting infrastructure is required to deliver the variable capacitysuch as platform lengthening, so as to keep costs down;
• the link serves an area with industries that are able to exploit the benefits ofdeeper labour markets such as financial services. This would supportagglomeration; and
• rail has a high mode share for accessing the employment centre, otherwiseother interventions might be a higher priority.
4.60 There may be a case for additional new fixed rail infrastructure in some limitedcircumstances where demands are very high and pressures on existing links are severe.However, the costs of delivering this are also likely to be very high, which may act to constrainthe relative returns from such fixed infrastructure.
New railinfrastructuremay be cost-
effective but onlyin the right
circumstances
190 TH E ED D I N GT O N TR A N S P O RT ST U DY: MA I N RE P O RT: VO LU M E 3
8 TfL modelling analysis, which assumes Crossrail is in the base case.
EN H A N C I N G C U R R E N T N E T W O R K S 3.44.61 That said, it could be that even with additional variable capacity on existing lines, thismay not be sufficient in the longer term in the face of high projected demand growth. In suchcircumstances, options for additional capacity will need to be considered.
4.62 Recent evidence from large urban rail schemes in London aimed at alleviating extremecapacity pressures in the urban centres suggests wider BCRs between 2 and 3, and GDPreturns per pound also in the same range, but with costs running into several billions ofpounds. The magnitude of such interventions implies that in absolute terms, the level of GDPand welfare could be substantial.
4.63 But it is not just passenger movement that should be the focus. Many rail links areheavily used by both passenger and freight services. The sharing of those links can in somecases create significant pressures, for example, around London. Upgrading these links couldtherefore potentially be beneficial for welfare and GDP, subject to the costs. There is littleavailable evidence on returns from these types of intervention but they must of course beassessed on their own merits having considered an appropriate set of options.
4.64 Overcrowding is already a common problem at many key rail and tube stations.Evidence suggests that additional capacity at stations that are subject to overcrowding couldcontribute to welfare by relieving station congestion, speeding up journey times andimproving reliability of interchange facilities. Station congestion relief projects at twoproposed London Underground stations suggest BCRs (not including the impacts on thewider economy) between 4.5 and 8.0.9 Such complementary capacity enhancements play akey role in ensuring the full potential benefits of increased effective capacity on rail and Tubelines can be realised from the whole journey perspective.
4.65 This highlights the importance of recognising the requirements of the whole journey.For example, if heavy rail is used to reach the urban centre but then an onward journey isrequired to reach the final destination, such as the place of work, enhancing capacity on oneleg of the journey may increase pressures on another leg. This should be accounted for inassessing options to enhance corridors into major urban areas.
4.66 Therefore, the complexity of urban transport systems means the need to improvetransport connections into and within urban areas is likely to imply considering a mix ofmeasures and interventions, some of which may need to be implemented as a package.Additional capacity may be needed where better use options are either not sufficient, or arenot cost-effective.
4.67 Public transport options have been shown to offer good welfare returns under certainconditions, in others, urban road capacity should be considered.
Urban road capac i ty as a pol icy opt ion
4.68 Road congestion is a huge problem in urban areas and conurbations. A key benefit ofthe car is the flexibility it offers in terms of route choice and time of travel, that cannot alwaysbe matched by public transport. In addition, the nature of urban areas with the mismatchbetween employment and household location implies significantly dispersed journeypatterns, both for passengers and drivers, and freight vehicles to get goods to outlets.
Supportinginfrastructure
may also beneeded
191TH E ED D I N GT O N TR A N S P O RT ST U DY: MA I N RE P O RT: VO LU M E 3
9 TfL analysis. These BCRs include the value travellers place on a pleasant station ambience.
EN H A N C I N G C U R R E N T N E T W O R K S3.44.69 Although often not considered or explored, in some cases, additional road capacity islikely to be the most cost-effective option in congested and growing urban areas, especiallywhere origins and destinations of journeys are very diffuse. Urban roads are identified asthose found within or in very close proximity to dense urban areas where speed limits aregenerally less than 50 miles per hour.
4.70 As shown in Figure 4.5, illustrative urban road capacity options explored in South andWest Yorkshire suggested relatively strong returns with wider BCRs over 4 with GDP perpound of over £3. These results are for the given illustrative cost assumptions but aresuggestive of the potential for a higher return to be delivered than for public transport optionsin some cases.
4.71 The local environmental implications of urban road capacity will be highly locationspecific and may in some circumstances be prohibitive. If the road enhancement is able toreduce congestion and allow more economically important journeys to take place, this islikely to come with an environmental cost. If traffic increases, then noise and emissions ofcarbon and particulates will increase. Mitigation measures could however be implemented tolessen these effects. Perhaps of more significance is the impact on landscape and townscapein densely populated urban areas. As with additional public transport infrastructure, thisshould be assessed on an individual basis as the range of potential implications is large, sosome may only offer low returns.
4.72 Where high returns are possible, they are likely to be driven by congestion relief inthose areas that are particularly capacity-constrained for a wide range of users for prolongedperiods of the day. The gains from alleviating pressures and reducing the costs of accessingthe urban centre are likely to be higher where the urban centre is productive and has hightraffic flows. The density of retail activity in major urban areas also means that there areimportant benefits to freight from reducing urban congestion, both in terms of the directbenefits of reduced delays and unreliability, but also through the effect on freight logistics.
4.73 Real urban road capacity enhancement in other areas also appears to have deliveredstrong returns but the range is wide. For example, urban roads on which evidence is availableto this study suggests wider BCRs in excess of 3, with one with a BCR even in excess of 11. Theenvironmental implications would of course need to be accounted for to determine a view ofoverall returns.
4.74 From the evidence available, some key strategic roads around major urban areas andagglomerations, where congestion problems are very high and a wide mix of users travel onthe road, are able to offer wider BCRs of between 4 and 11 with GDP per pound returns veryhigh, at between £3 and £7. The cost of these interventions ranges between some £60 millionand £300 million. Indeed, these interventions offer some of the very highest returns of thedata available.
4.75 This evidence suggests that although there may be land-space constraints in somevery dense urban areas, there are circumstances where enhanced urban road capacity may bethe most cost-effective option and delivers relatively high returns. Where there are land spaceconstraints to road build, public transport options may be the only feasible policy solution.
In somecircumstances
additional urbanroad capacity willbe the high value
for moneysolution
192 TH E ED D I N GT O N TR A N S P O RT ST U DY: MA I N RE P O RT: VO LU M E 3

EN H A N C I N G C U R R E N T N E T W O R K S 3.4The l ink with hous ing
4.76 Over coming years this anticipated growth of the bigger urban areas is likely to be fedby increasing population and migration. Where additional housing is needed to support thecontinued success of a growing urban area, particularly to maintain and expand its labourmarket catchment, it is intuitive that in some circumstances, new or improved transportconnections will be needed to deliver potential agglomeration benefits. That is not to say thathousing policy should simply drive transport needs: the importance of cost-effective policymaking applies here as in any other area. The location of new housing, its transport and otherinfrastructure requirements all need to be planned together in order to maximise theavailable benefits. Again this is an area which needs a much improved evidence base in orderto support robust decision making.
The impact o f road pr ic ing on the case for addit ionalurban in frastructure
4.77 Road pricing, if targeted on congestion and environmental problems, is likely to havea significant impact on congestion in urban areas.
4.78 Road pricing is able to have a significant impact on congestion in most urban areas.Analysis carried out in the context of strategic roads implies that with road pricing the casefor additional road capacity in these areas is likely to fall but still remain. High prices signalthat congestion is a problem and hence additional capacity may be worth exploring. This isfurther discussed later in this chapter in the context of inter-urban strategic road investment.
4.79 Preliminary evidence on the returns from public transport interventions whenimplemented in combination with road pricing as described in the South and West Yorkshiremodelling case study suggests that greater welfare returns from the package are possible thanif considering them separately. This is largely driven by the beneficial impacts on commutersfrom improving public transport when road pricing raises the cost of road travel. However,this would benefit from further analysis to understand better the nature of the interaction andthe investments likely to offer greater returns.
4.80 The impacts that road pricing might have for the case for additional public transportcapacity is determined by a number of locally specific factors. These include:
• the availability of other travel options and whether they are able to absorbadditional demand;
• the price of public transport use relative to roads: this will depend onsubsidies and the prices set by operators; and
• the type of road pricing being introduced and behavioural responses: mode shiftis more likely when journeys are time critical and where public transport servicesallow the journey to be made at a given time; where road users have more timeflexibility, they may travel by car at a different time rather than shift mode.
4.81 In terms of its implications for public transport demand, road pricing is likely toimprove the relative attractiveness of public transport in areas where road prices are high. TfLestimates that the London congestion charge reduced car travel by 15 per cent within thecongestion charging zone, and that some 50-60 per cent of that traffic was displaced to publictransport. Conversely, in areas with little or no congestion, such as some rural areas, theprices could be lower than at present, potentially generating a mode shift away from publictransport onto road.
Road pricing andappropriate
public transportcan work well
together
193TH E ED D I N GT O N TR A N S P O RT ST U DY: MA I N RE P O RT: VO LU M E 3

EN H A N C I N G C U R R E N T N E T W O R K S3.44.82 Some users who place a lower value than others on making a particular trip by road,such as some commuters and non-work/leisure travellers, are likely to switch from car use topublic transport for journeys in areas where road prices are high; many business travellers,will be willing to pay higher prices to use faster and more reliable roads, generating a smallamount of mode shift towards road use for business users.
4.83 The car remains the dominant mode of travel in urban areas outside Central London,so even a small modal shift away from the car as a result of pricing could represent asubstantial increase in demand for public transport owing to the small initial base.
4.84 The introduction of road pricing could also affect the case for subsidising publictransport. On the one hand, the environmental and congestion case for subsiding othermodes will be reduced or removed if road users are paying the full external cost of theirjourneys and, in urban areas, as the increase in demand may increase the viability of publictransport. On the other, where there are external economic benefits from enabling people tomake economically important journeys, there may be a case for subsidy to reflect theseexternal benefits.
4.85 Evidence from the modelling case study in South and West Yorkshire suggests thatwhen improvements to bus services in the form of lower fares and improved frequencies areimplemented in the presence of a distance-based, congestion-targeted road pricing scheme,not only are the benefits of the package higher than the sum of the separate interventions, butroad prices can on average be set lower. The maximum charge paid when bus services areimproved is some 10 per cent lower. In addition, the adverse impacts on agglomeration ofroad pricing would be slightly reduced with improved bus services owing to the reduction inadverse impacts on commuters.
4.86 In summary, the implications of road pricing for the economic case for additionalpublic transport capacity will depend on a number of locally specific factors, and detailedappraisal work would be needed for specific areas.
4.87 Taken together, the evidence suggests that some guiding principles on where theremay be a case for additional urban infrastructure capacity, for road and public transport areas follows:
• The prices themselves: if targeted on the true costs of road use, high pricesreflect demand pressures and hence a greater case for considering morecapacity.
• Where there remains a capacity constraint: congestion maps show that evenwith pricing, travel demand remains high in large conurbations suggestingevidence of capacity constraints; and
• Where there are external costs from altering particular trips that are notreflected in an individual’s decision making; for example, in the absence ofviable alternatives to car use, some commuters may be priced off the roadsand may be forced out of the labour market or into less well paid jobs that arecheaper or easier to access.
4.88 The case study of South and West Yorkshire has been referred to in several placesthroughout this volume, so the next section provides a little more detail of the impacts ofillustrative interventions in this case study area.
Road prices areaffected by thelevel of public
transportprovision
194 TH E ED D I N GT O N TR A N S P O RT ST U DY: MA I N RE P O RT: VO LU M E 3
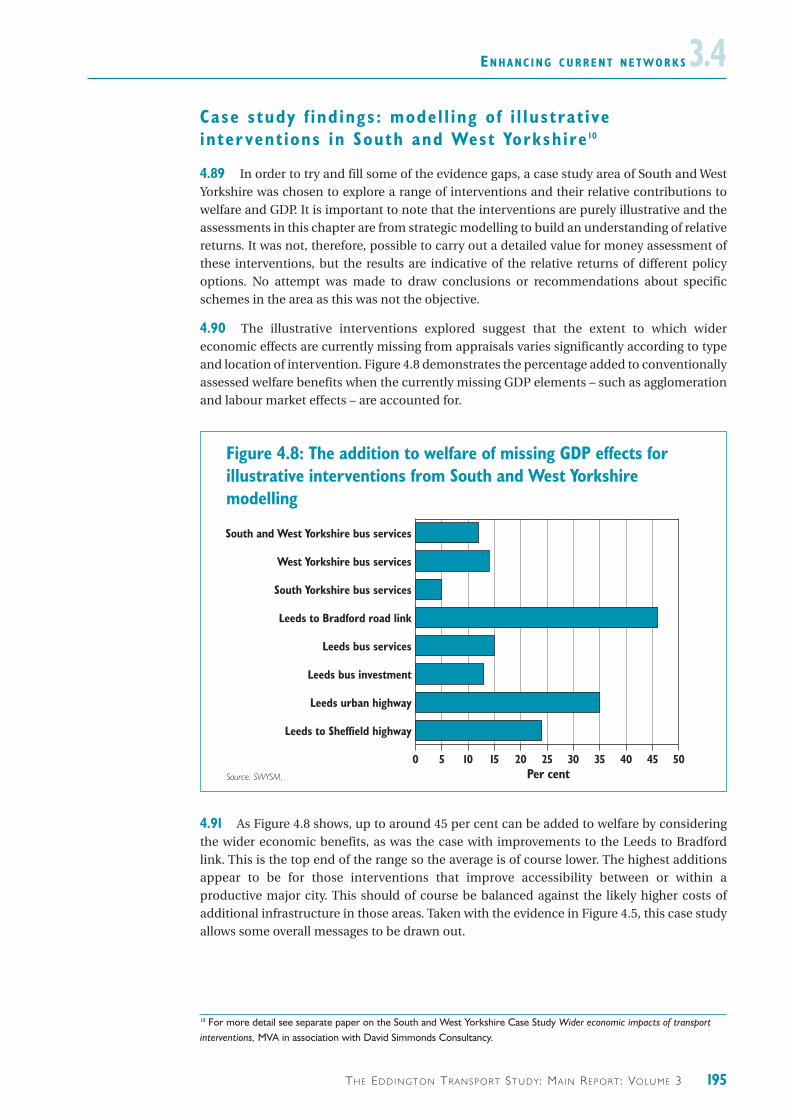
EN H A N C I N G C U R R E N T N E T W O R K S 3.4Case study f ind ings : model l ing o f i l lustrat iveinter vent ions in South and West Yorkshire 10
4.89 In order to try and fill some of the evidence gaps, a case study area of South and WestYorkshire was chosen to explore a range of interventions and their relative contributions towelfare and GDP. It is important to note that the interventions are purely illustrative and theassessments in this chapter are from strategic modelling to build an understanding of relativereturns. It was not, therefore, possible to carry out a detailed value for money assessment ofthese interventions, but the results are indicative of the relative returns of different policyoptions. No attempt was made to draw conclusions or recommendations about specificschemes in the area as this was not the objective.
4.90 The illustrative interventions explored suggest that the extent to which widereconomic effects are currently missing from appraisals varies significantly according to typeand location of intervention. Figure 4.8 demonstrates the percentage added to conventionallyassessed welfare benefits when the currently missing GDP elements – such as agglomerationand labour market effects – are accounted for.
4.91 As Figure 4.8 shows, up to around 45 per cent can be added to welfare by consideringthe wider economic benefits, as was the case with improvements to the Leeds to Bradfordlink. This is the top end of the range so the average is of course lower. The highest additionsappear to be for those interventions that improve accessibility between or within aproductive major city. This should of course be balanced against the likely higher costs ofadditional infrastructure in those areas. Taken with the evidence in Figure 4.5, this case studyallows some overall messages to be drawn out.
195TH E ED D I N GT O N TR A N S P O RT ST U DY: MA I N RE P O RT: VO LU M E 3
10 For more detail see separate paper on the South and West Yorkshire Case Study Wider economic impacts of transportinterventions, MVA in association with David Simmonds Consultancy.
Figure 4.8: The addition to welfare of missing GDP effects for illustrative interventions from South and West Yorkshire modelling
0 5 10 15 20 25 30 35 40 45 50
Leeds to Sheffield highway
Leeds urban highway
Leeds bus investment
Leeds bus services
Leeds to Bradford road link
South Yorkshire bus services
West Yorkshire bus services
South and West Yorkshire bus services
Per centSource: SWYSM.
EN H A N C I N G C U R R E N T N E T W O R K S3.44.92 Some more general conclusions from the work in South and West Yorkshire are asfollows.
• The nature and composition of the local economy and existing transportsystem have a significant effect on the potential for GDP gains. For example,the same bus improvements in South Yorkshire (with low GDP per head)contributed far less to GDP than the same magnitude of intervention in themore agglomerated and productive economy of West Yorkshire. This does ofcourse need to be considered in the context of overall welfare returns forprioritisation purposes.
• High GDP returns are likely from those interventions that increaseaccessibility within productive areas, or improve links between productiveareas. This result will of course be sensitive to the cost assumptions made.
• Agglomeration is generally the most substantial impact of transportinterventions currently missing from appraisals. In assessing this effect, awide geographical area must be considered because a shift in activity mayhave disagglomeration effects that should be netted off.
• Transport interventions that increase the labour market catchments ofproductive urban areas (eg Leeds) are likely to provide good GDP benefits,though of course overall returns are subject to costs.
• Both economic GDP and environmental objectives can be met with someinterventions. For example, improvements to bus services in West Yorkshireand in Leeds provide good GDP returns for the estimated cost and are alsoable to provide environmental and social benefits.
4.93 This section has shown the following for urban areas:
• Walking and cycling can deliver very high welfare returns, mainly throughhealth and safety benefits rather than GDP effects.
• Bus interventions can in some cases provide a higher value for money solutionthan costly light rail options but where demand pressures are particularlyhigh, there may be a case for fixed infrastructure options.
• Urban roads can, in the right conditions, be a very high value for moneysolution to urban congestion problems.
• Road pricing is likely to affect the demand for public transport and thereforethe economic case for additional capacity.
• Additional public transport capacity on key commuter corridors is likely to beeffective where large volumes are moving into the very densest urban areas.
196 TH E ED D I N GT O N TR A N S P O RT ST U DY: MA I N RE P O RT: VO LU M E 3

EN H A N C I N G C U R R E N T N E T W O R K S 3.4INTERNATIONAL GATEWAYS
4.94 The growing significance of globalisation means that the international connectivity ofthe UK has become more important, and is likely to be increasingly so over the next two tothree decades.
4.95 Trade in goods and services is set both to increase and to change in nature, leading torising and changing demands on international gateways. Strong growth is projected for thevolume of goods imported through UK ports, particularly from Asia. Given the UK deep-seaports capacity, this implies capacity constraints are likely to bite with consequent increases inthe cost of moving those goods. In addition, as the service economy grows, the need forpeople to travel internationally implies increasing strain on UK airports with consequentlyhigher costs of travel, unreliable journeys and a potential reduction in trading opportunities.
Addit ional ports capac i ty at deep-sea , feeder and ro -roports
4.96 UK ports are for the most part privately owned and operated as private businesses.11
Without adequate capacity there are implications for the wider economy. They are the keygateways for UK trade in goods, so if UK competitiveness is to be maintained and face thechallenges of increasing globalisation, ports must be among the priorities for transport policy.
4.97 Although the public sector is therefore not generally responsible for bringing forwardadditional port capacity in the UK, there is a role to play for government in ensuring there areno unnecessary barriers to development, for example through the planning system.
4.98 By looking at where the demand for ports traffic is likely to exceed available capacity,research commissioned by DfT for the Ports Policy Review12 was able to assess when capacityconstraints may bite over the next two to three decades by considering a range of scenarios.This work suggests constraints will be at:
• deep-sea container terminals in the South East: this is despite the assumedconstruction of two recently approved major new container terminaldevelopments, plus one development that currently has ‘minded approval’status, all in the greater South East.13 Capacity and efficiency improvements atexisting ports and changes in shipping-line behaviour could also affect whenand where capacity constraints will actually bite;
• feeder berth capacity around the country for container services via hub portselsewhere; and
• roll-on – roll-off (ro-ro) terminal capacity, particularly in the South East.
Government hasa keen interest inport development
owing to theimplications for
the UK economy
197TH E ED D I N GT O N TR A N S P O RT ST U DY: MA I N RE P O RT: VO LU M E 3
11 Notable exceptions being Dover and the Port of London (trust ports) and Portsmouth and Sullom Voe (municipal ports)12 Ports policy – Your views invited, May 2006.http://www.dft.gov.uk/stellent/groups/dft_shipping/documents/page/dft_shipping_611693.pdf.13 The Secretary of State for Transport gave final consent for development at Felixstowe South in February 2006, forBathside Bay in March 2006 and reconfirmed minded approval for London Gateway in August 2006.

EN H A N C I N G C U R R E N T N E T W O R K S3.44.99 If UK container ports are unable to handle forecast demand growth, this could be fortwo reasons: they are unable to accommodate the absolute increases in volume; and/or withloads being consolidated in ever larger container vessels, they are unable to berth the largestships. In this case, the UK will still import and export the additional goods, but they would betranshipped at a Continental port onto a smaller feeder vessel headed for the UK.Transhipment increases supply-chain costs by introducing two additional lifts and anadditional sea leg though inland distribution costs may be reduced. The DfT’s research foundthat a scenario that assumes full construction of Felixstowe South, Bathside Bay and LondonGateway, which will remove the need for a good deal of transhipment, delivery costs could bereduced by around £260 million a year or up to 10 per cent by 2025 when compared to ascenario where these three new terminals are not built.
4.100 Even if new container terminals are developed in the South East of England, there willstill be growth in demand for container feeder berth capacity in the South East and across thecountry. For example, by 2020, container feeder volumes are expected to triple at North Eastports and grow five-fold in volume at ports in the North West of England. Under this scenario,at least 1,800 quay metres of additional feeder berth capacity would be projected to meetdemands at ports in Great Britain by 2015.
4.101 With the three new terminals, UK container ports should on central forecasts becapable of accommodating rising demand to at least 2020. However, growth is forecast tocontinue up to 2030 and probably beyond, so capacity constraints will again begin to bite. Inthis scenario, the constraints imply delivery costs per TEU14 will rise again by some 5 per centbetween 2020 and 2030 amounting to some £140 million15 more each year by 2030, or onaverage about £9 per TEU.16 This includes some, but not all, elements of generalised cost,17
and the operating and capital costs of providing feeder quayside capacity, existing or new.18
These figures do not account for wider effects such as impacts on trade, globally mobileinvestment and reliability.
4.102 Given current market trends, private sector investment proposals for additional deep-sea container port capacity in the South East could be expected within the next two to threedecades and would create net economic benefits for the UK. However the same is unlikely tobe true for new deep-sea container capacity outside the greater South East. In a scenariowhere there is no remaining deep-sea capacity in the South East, deep-sea container vesselsare much more likely to tranship additional traffic at a Continental port, provided thatcapacity is available there.
4.103 Demand growth and increasing vessel size at ro-ro ports is also likely to exceedcurrent ro-ro port capacity over this period especially at the most heavily used ports such asDover. Greater use of spare capacity at other ports or on Channel Tunnel freight services maydelay the point at which the capacity constraint is reached by a few years but capacityconstraints are likely to bite by around 2015 at the latest. Therefore, ro-ro capacity is likely tobe under greater strain over this study’s timeframe than deep-sea container capacity.
198 TH E ED D I N GT O N TR A N S P O RT ST U DY: MA I N RE P O RT: VO LU M E 3
14 Twenty-foot Equivalent Unit – a measure of port capacity.15 This is the undiscounted nine pounds on 16 million TEU in the one-year, 2030.16 UK Container Transhipment Study, MDST for DfT, 2006.17 Includes a fixed rate per distance for road and rail surface transport costs (therefore takes into account the shorter haulof the increasing volume of goods arriving at northern ports closer to their destination) but does not take account ofchanges in road or rail congestion or reliability, differences in delivery time (on average rail boxes leave ports before roadboxes), potential impact of road pricing, or inland warehousing or labour costs (transhipment traffic might be able to takeadvantage of lower input costs outside the South East).18 If the cost of providing additional feeder quayside capacity increases significantly, perhaps because more berths are builton greenfield sites, then this may be an underestimate – but an estimate of this risk is unavailable.

EN H A N C I N G C U R R E N T N E T W O R K S 3.44.104 If additional ports infrastructure is added, there are, however, likely to be adverseenvironmental impacts. Ports are mainly located in estuaries where they compete forsheltered locations with birds and coastal habitat such as mudflat and saltmarsh. The threekey impacts on nature conservation of additional capacity are:
• direct and indirect nature conservation losses, direct loss of land, longer termchanges to inter-tidal and sub-tidal habitats resulting from hydrologicalchange, disturbance from recreational activities, pollution from anti-foulantsand spillages, erosion from shipwash;
• knock-on effects from port developments in terms of upgrades to road andrail links that have their own impacts; and
• impacts on air and water quality through emissions, including those fromships (SO2) and accidents.
4.105 Even if additional infrastructure is not needed, surface access and increased levels oftraffic between ports and inland destinations will also have an adverse effect on theenvironment. This is more likely to be significant if road is relied on as the main means ofinland movement of goods owing to the associated emissions and noise. This is likely to bethe case for transhipped short-sea traffic where rail may be less viable owing to the smallerconsolidated loads and shorter distances involved. The location of additional port capacity tocope with the forecast rise in demand for imports has implications for the environmentbecause impacts will be worse where the distance to final destination is longer and roadconditions are more congested.
4.106 The environmental impacts of additional port capacity need to be mitigated against,where possible, as part of the planning consent process, and balanced against the benefits towelfare and the UK economy of providing additional ports capacity. The recent port capacityplanning approvals demonstrate that in some cases the case stacks up even after accountingfor the environmental effects.
Addit ional a irports capac i ty
4.107 As with ports, high levels of current and projected demands are likely to put strain onUK airport capacity. Where capacity is insufficient to meet the demand, there will be adverseimplications for the economy: higher costs, both time and money, of international travel;reduced reliability of both air services and services within the airport; and potentially reducedtrading opportunities.
4.108 Air services are relied on for international business activity, as well as tourism andnon-work/leisure trips. Business and consumers place a high value on the range andfrequency of air links offered from different airports.
Environmentaleffects must be
accounted for
199TH E ED D I N GT O N TR A N S P O RT ST U DY: MA I N RE P O RT: VO LU M E 3

EN H A N C I N G C U R R E N T N E T W O R K S3.44.109 This study has not sought to repeat the analysis of the Air Transport White Paper19
(ATWP) which suggests there are significant economic benefits from increasing runwaycapacity at Heathrow and other airports in the South East. Above a baseline of maximum useof existing runways, direct economic benefits of additional capacity at Stansted (2012) andHeathrow (2020) are estimated at some £24 billion. It is estimated that of this figure, some £6billion20 accrue direct to business travellers, and these benefits would be higher still ifreliability were accounted for. Other benefits not captured within this figure include the tradebenefits of international connectivity and the benefits from increasing the attractiveness ofthe UK for foreign investors. Plus, there can be economies of scope from hub airports,through enabling a greater variety and frequency of onward connections, and from greaterefficiencies in the provision of support services and fixed costs.
4.110 However, the gross benefits must be adjusted to reflect the impacts on theenvironment from additional runway capacity. The main environmental impacts of aviationthat can be estimated quantitatively are noise from aircraft and the effects of aircraftemissions. Air Transport White Paper analysis estimated that the cost of increased carbonemissions over and above a baseline of making maximum use of existing runways could be inthe region of some £3-5 billion.21 In addition, there are likely to be impacts of increased noiseand health impacts from reduced air quality but these are likely to be an order of magnitudelower than these climate change impacts, leaving very substantial net benefits.
4.111 The ATWP also assessed the benefits of additional fixed runway infrastructure at otherairports and suggested that an additional runway at two other UK airports could each provideoverall benefits that are much lower than for expanding major airport in the South East, withthe highest benefits at some £1.6 billion over the period to 2060. The benefits of capacityenhancement at other regional airports are therefore likely to be of a much smallermagnitude than for other major airports, given the lesser magnitude of pressures faced.
4.112 This study identifies international gateways as a key strategic priority for the future,and the vital role of aviation in supporting the international competitiveness of the UK’s high-tech manufacturing and financial services sectors. This is in line with the analysis from theATWP set out above, which demonstrated that the potential economic benefits from furtherexpansion of aviation capacity are significant, running to tens of billions of pounds. However,any growth in aviation needs to be sustainable, and must take full account of itsenvironmental costs. One of the most effective mechanisms for achieving this is by ensuringthat air travellers pay the full environmental costs of their journey, including climate changeimpacts. The principle of ensuring users pay their full external costs was supported by theGovernment in the Air Transport White Paper and was strongly supported by the Stern Reviewof the economics of climate change.
4.113 The ATWP passenger demand forecasts assumed the introduction of some form ofpricing mechanism to ensure air travellers faced the full external costs of their climate changeimpacts. This was based on the Defra central cost of carbon estimate of £70 per tonne ofcarbon (in 2000 prices). With this pricing mechanism in place, the analysis demonstrated thatdemand would continue to grow, and that there would be significant economic benefits fromsome additional runway expansion. It is important to understand the impact of a range ofcarbon pricing scenarios on the case for aviation expansion, and the forthcoming ATWPProgress Report will test a wider range of carbon price scenarios.
200 TH E ED D I N GT O N TR A N S P O RT ST U DY: MA I N RE P O RT: VO LU M E 3
19 Air Transport White Paper, DfT, 2003.20 Present value benefit over the period to 2060.21 Present value over the period to 2060.

EN H A N C I N G C U R R E N T N E T W O R K S 3.44.114 Provided economic analysis shows that there is a net benefit from increasing airportcapacity, even after users pay the full environmental costs of their journeys, there will remaina strong economic case for additional runway capacity.
4.115 As with ports capacity, government has a role to play in forming policy to support theprivate sector development of airport capacity where there are likely to be significant gainsfor national welfare after taking account of the environmental implications.
The importance o f sur face access l inks
4.116 The realisation of these benefits resulting from the provision of additional fixedinfrastructure at ports and airports also depends on the extent to which there is adequatecapacity on surface access links.
4.117 Surface access links are often used not only by those accessing the port or airport, theyare also shared by travellers for a range of purposes, particularly around large urban areas. Forexample, links to major airports such as Heathrow or Birmingham are used by travellersundertaking inter-urban journeys for business, non-work/leisure, commuting and freight notlinked with the ports or airports. The shared nature of these links means that many are subjectto high levels of congestion.
4.118 Available evidence suggests that investment in additional fixed infrastructure in theseplaces can deliver strong returns for the economy and benefit a wide range of users. Theavailable evidence is mainly for road links, but sometimes, additional capacity on rail linkswill be the most cost-effective solution to the problem. For example, in some situations oneoption to consider may be enhancements to the gauge of rail links on some surface accesslinks to ports where larger containers are likely to be moved.
4.119 The case for additional surface access infrastructure should take into account the fullrange of possible options and impacts. Use of rail lines for freight surface access, for example,would need to be balanced against the competing need for use of the line by passenger trainsand of course the costs of enhancement. These uncertainties point to the need for a study ofsurface access needs in the UK.
4.120 The potential returns from road surface access to ports can be strong with wider BCRsoften in excess of 3 and some even around 15, in some circumstances, and GDP returns per£1 again often over £3 and up to around £11 in some circumstances. The cost of theseinterventions is relatively low, ranging from around £10 million up to £170 million.
4.121 The available evidence also demonstrates enhancing capacity on selected surfaceaccess links to airports is able to deliver strong GDP returns. The evidence suggests widerBCRs of additional fixed strategic road infrastructure in the range 2-15 with GDP returns per£1 of £1-9. The corresponding range of costs is from less than £10 million to just over £88million indicating that some very strong returns are possible from relatively low-costinterventions targeted at particular pinch points.
4.122 The environmental implications of additional strategic road capacity are likely to besignificant, particularly for carbon emissions, air quality, landscape and possibly biodiversity.Incorporating these effects, in many cases, reduces the wider BCRs presented above, possiblyby up to one point off the wider BCR, as shown in Figure 4.3. These effects must of course beaccounted for in the assessment of each intervention, as some are likely to be highly locationspecific. It could be possible to mitigate some of these effects on many links. On balance, evenafter accounting for these effects, in many instances the case for this additional surface accesscapacity would still be strong, as is also shown later in this chapter in the discussion of
Surface accessimprovements
can offer the bestwelfare and GDP
returns of alloptions
201TH E ED D I N GT O N TR A N S P O RT ST U DY: MA I N RE P O RT: VO LU M E 3
strategic road capacity investment.
EN H A N C I N G C U R R E N T N E T W O R K S3.4Impact o f road pr ic ing on the case for sur face access
4.123 In a world with road pricing, the case for additional fixed road infrastructure isgenerally likely to weaken. However even with road pricing, on very congested surface accesslinks where prices are consequently higher, the economic case for additional capacity is stilllikely to be good. The wider BCRs on some of these links are so high that a strong case is likelyto remain in a world of road pricing. This would of course need to be assessed in the light ofthe particular road pricing regime in place that would determine the impact on behaviour ofall travellers. On rail surface access, it is unlikely that the case for additional infrastructurewould be significantly affected by road pricing, though a slightly stronger case for passengerrail due to induced mode shift might be expected.
4.124 Where the impacts of road pricing might also be significant is around the long-termimplications for logistics. It may be that in response to road pricing and the changing balanceof costs for different aspects of goods movement, operators may locate warehouses anddistribution centres in more cost-effective locations, or they may change port for example.
Conclus ions on internat ional gateways
4.125 A number of conclusions emerge from the evidence on the returns from investing ininternational gateways infrastructure. Policy should support additional ports capacity where,given the changing scale and nature of international trade, capacity constraints are likely tobite. Environmental considerations should of course be accounted for in the overallassessment.
• Provided economic analysis shows that there is a net benefit from increasingairport capacity, after users pay the full environmental costs of their journeys,there will remain a strong economic case for additional runway capacity.
• The realisation of the benefits of additional port and airport capacity isdependent on the capacity and travel conditions on surface access links.
• Targeted additional capacity on surface access strategic roads can offer someof the highest returns.
INTER-URBAN CORRIDORS
4.126 Certain inter-urban corridors play a key role in the economy where they link majorurban areas, and where they allow large volumes of people and goods to move across thecountry to support economic activity, or support the economy directly or indirectly throughreducing costs, distributing goods and facilitating domestic trade.
4.127 Sections of the UK’s inter-urban corridors suffer from very high levels of congestion,overcrowding and unreliable journey times. The value of time wasted owing to travel delaysamounts to a multi-million pound cost to the UK economy every year and this is set to risesignificantly.
4.128 Particular problems on the inter-urban network exist where a mix of users wish to usethe transport system at a similar time of day.
4.129 The next sections discuss the options for enhancing inter-urban capacity anddescribe where the evidence points in order to deliver strong welfare returns.
202 TH E ED D I N GT O N TR A N S P O RT ST U DY: MA I N RE P O RT: VO LU M E 3

EN H A N C I N G C U R R E N T N E T W O R K S 3.4Strateg ic road in frastructure
4.130 As the car is the dominant mode of travel in the UK, the most significant problem forinter-urban travel is road congestion.
4.131 On some links, small improvements can deliver very strong returns for road users,including freight. Where roads are capacity constrained, relieving pressures through junctionimprovements, for a relatively low cost, offers some very significant returns with many widerBCRs in excess of 5.
4.132 Figure 4.9 below plots out the wider BCRs of a range of junction improvements alongwith their costs, on which evidence is available to this study.
4.133 In some cases, additional junction capacity enhancement may be sufficient alone totackle particular bottlenecks and therefore deliver high returns. In other cases it may be ableto complement larger-scale investment in fixed infrastructure.
4.134 In the absence of national road pricing, evidence of real schemes from the HighwaysAgency and strategic analysis using the National Transport Model (NTM)22 both indicate avery strong case for targeted additional road infrastructure in the UK.
4.135 Targeted strategic road infrastructure has been appraised for inclusion in theHighways Agency’s Targeted Programme of Improvements (TPI) that looks out to 2015. Muchof this investment delivers very strong returns with wider BCRs, often above 3 and up to 13.The highest returns are for additional capacity on those links around major urban areas andlarge agglomerations where there is a high demand for movement from a range of usersincluding business, commuters and freight; and where there are significant capacityconstraints.
Some strategicroad investments
offer very highwelfare returns
Infrastructure to relieve
bottlenecks offers high
returns
203TH E ED D I N GT O N TR A N S P O RT ST U DY: MA I N RE P O RT: VO LU M E 3
Figure 4.9: Returns from a range of junction improvements
0 20 40 60 80 100 1200
5
10
15
20
25
30
Cost (£ million)
Wid
er B
CR
Source: DfT.
22 For more detail, see separate paper Transport demand to 2025 and the economic case for road pricing and investment, DfT,2006.
EN H A N C I N G C U R R E N T N E T W O R K S3.44.136 There are substantial environmental implications from adding road space. Not onlydoes the footprint of existing roads increase with consequent landscape effects, but the likelyhigher volumes of road traffic generate higher levels of carbon emissions, lower air qualityand increased noise levels. Analysis of the available evidence of such effects, where they havebeen possible to estimate, suggests that BCRs can in some cases be significantly reduced,potentially reducing BCRs by over 3 points for some strategic road enhancements, as shownin Figure 4.3. These must clearly be balanced against the benefits of additional road capacity.
4.137 Even after accounting for environmental effects, there appears to be a good case foradding strategic road infrastructure over and above the schemes in the TPI. Strategic analysisthat uses best available evidence to estimate the benefits and costs suggests an economiccase23 for additional capacity of between 2,900 and 3,350 additional lane kilometres on thestrategic road network between 2015 and 2025.24 This analysis includes impacts on theeconomy, environment (such as the impacts on landscape, carbon emissions, noise and airquality) and construction costs. This would imply a rate of investment over 50 per cent higherthan that assumed under the baseline scenario over that period, and would cost some £29-33billion.
4.138 That is not to say that government would want to prioritise all of this capacity becausethere are diminishing returns as more investment is added. Therefore, the first chunks ofinvestment will offer far higher welfare and GDP returns than latter chunks. Where the latterare concerned, there are likely to be other transport options that offer higher relative returns.
4.139 For example, beginning with the assumed strategic road network in 2015, the widerBCR of an additional tranche of some 1,450 lane kilometres is estimated to be around 9; as afurther 800 lane kilometres are added, the wider BCR of this additional chunk of investmentfalls to around 3. The wider BCRs of subsequent additional investment then fall rapidly asmore capacity is added. The fact that returns fall as more and more additional capacity isadded has implications for the extent to which additional capacity enhancements areprioritised, given constrained resources.
4.140 Of course, financial constraints, public acceptability and non-monetisedenvironmental impacts will mean that investment on this scale is not desirable: the key pointis that this evidence highlights the strength of the returns of targeted strategic roadenhancement.
4.141 The values placed on environmental damage have been estimated using the bestavailable sources including Defra and DfT research on the external costs of transport.25
Impacts that have been estimated as part of this analysis are landscape, noise, carbonemissions and air quality. Past experience from the DfT methodology for assessing the valuefor money of transport interventions has been used to estimate the illustrative magnitude ofthese possible environmental effects. Even after accounting for these, the net benefits aresubstantial. Figure 4.2 set out their impacts on each of the strategic priorities.
4.142 The strong economic case for additional targeted strategic road capacity afteraccounting for the environmental effects is driven by the fact that the majority of theinvestment involves widening existing roads, rather than building new. The impacts of theadditional capacity are therefore lower than they would otherwise be in terms of landscape.Carbon emissions, air quality impacts and noise are likely to be worse as these are driven bythe volume and speed of traffic, but these are generally outweighed by the benefits totransport users in terms of reduced overall costs of travel and improved reliability.
High returnseven after
accounting forenvironmental
effects
204 TH E ED D I N GT O N TR A N S P O RT ST U DY: MA I N RE P O RT: VO LU M E 3
23 Defined to be where the benefits exceed the total costs, including the inefficiency costs of raising public funds.24 In addition to investment assumed under the baseline scenario up to 2015.25 The methodology and detailed analysis are set out in the separate paper Transport demand to 2025 and the economiccase for road pricing and investment, DfT, 2006.

EN H A N C I N G C U R R E N T N E T W O R K S 3.44.143 The fact that the benefits to wider society from an intervention exceed the costs interms of environmental effects like higher carbon emissions, implies that, if desired, thosebenefits could be used by society to invest in actions to reduce climate change in a cost-effective way. Figure 4.10 demonstrates the relative magnitude of impacts of the strategic roadinvestment discussed above. Clearly, public debate is necessary to consider the implicationsof these choices.
4.144 Figure 4.10 demonstrates the magnitude of benefits to society from investing in thosestrategic roads for which there is an economic case in 2025. The benefits vastly outweigh theestimated value of adverse impacts on the environment, such as landscape and carbonemissions. This is of course strategic analysis, so local effects cannot be accounted for but thisanalysis does make clear the balance of the effects.
4.145 Welfare benefits are estimated to be over £3 billion per year from this scale ofinvestment in infrastructure, after accounting for construction and environmental costs.These benefits are driven by the fact that inter-urban strategic roads are heavily used by awide mix of road users who are subject to significant levels of congestion and unreliability.Users such as business travellers and freight often place a high value on their time and,therefore, lower congestion. A key point to note about this strategic analysis is that it coversinter-urban links, as well as strategic road surface access links to ports and airports. Themultiple role of the UK inter-urban strategic road network bolsters its importance insupporting economic activity.
205TH E ED D I N GT O N TR A N S P O RT ST U DY: MA I N RE P O RT: VO LU M E 3
Figure 4.10: Composition of overall welfare benefits for strategic road build, 2025
–1
0
1
2
3
4
5
6
Previously missing GDP impacts
Reliability benefits (GDP)
Freight time and money savings
Business time and money savings
Welfare benefits (Non-GDP)
Environment (noise, carbon and air quality emissions)Landscape
Accident benefits
£ im
pact
per
£ c
ost
Source: DfT.
EN H A N C I N G C U R R E N T N E T W O R K S3.44.146 The gains are largely driven by the reduction in congestion. Inter-urban roads wouldbe expected to benefit from 12 per cent lower congestion with an average reduction over allroads of some 5 per cent. These gains are net of the impacts on urban areas that may seecongestion rise a little, by less than 0.5 per cent.
4.147 Road pricing would of course strongly impact on the case for additional strategic roadcapacity.
The impacts o f road pr ic ing on the case for addit ionalstrateg ic road capac i ty
4.148 If widespread road pricing were introduced, the nature and location of challenges onthe roads would be altered.
4.149 Analysis undertaken to understand what this means for the case for additionalinfrastructure in the UK in the longer-term suggests that road pricing would significantlyreduce, but not completely eliminate, the amount of additional road build for which therewould be an economic case.
4.150 By looking at the returns from additional fixed infrastructure, it is estimated thatinstead of 2,900 to 3,350 lane kilometres, if national road pricing were introduced, this wouldfall substantially to just an additional 500 to 850 lane kilometres on the strategic road networkbetween 2015 and 2025. This is a reduction of some 80 per cent.
4.151 Such a package might cost around £5-8 billion and would generate annual welfarebenefits in 2025 of some £30 billion. The vast majority of the benefits of this package of roadbuild and pricing derive from the pricing element with only around £600 million of benefitsgenerated by the road build.
4.152 An important variable here is the form of road pricing that is implemented. Thisanalysis assumes that national, distance-based marginal social cost pricing is in place. This islikely to be at the upper end of the possible benefits achievable, and in reality only a muchsimpler road pricing scheme could be introduced. The extent to which the need for additionalcapacity would change is likely to be lower under alternative road pricing regimes.
4.153 Another benefit of a combination of road pricing with additional infrastructureinvestment is that there are likely to be environmental benefits relative to the case where onlyinfrastructure was used to tackle the congestion bottlenecks. This is for two reasons. Firstly,road pricing itself has the objective of making better use of the road space, so the lowercongestion reduces the time vehicles spend idling in traffic queues emitting harmful gasesand particulates. Secondly, the ability of pricing to significantly reduce the case for additionalcapacity means less damaging implications for landscape and biodiversity etc.
4.154 The vast majority of this ‘with pricing’ road-build package would offer an economiccase for investment in a world with or without road pricing. For those links where this is true,these should be the priority for investment to support the economy and welfare and are to befound generally around and on the key corridors approaching the growing and congestedurban areas, and other key links where congestion problems are most severe.
4.155 This section has highlighted that, owing to the interaction of road pricing with thecase for additional road build, robust long-term decisions on strategic road capacity can bebetter made if the case for capacity enhancement has been tested in an environment wherepricing – localised or widespread – is approaching. Given the long lead times of suchtransport interventions, this will be particularly important when considering interventions totackle challenges beyond 2015.
Some strategicroad build would
be worthwhilewith or without
road pricing
Potentially bigenvironmentalbenefits from
combininginvestment with
road pricing
Even with roadpricing, there is
still an economiccase for
additional inter-urban
infrastructure
206 TH E ED D I N GT O N TR A N S P O RT ST U DY: MA I N RE P O RT: VO LU M E 3
EN H A N C I N G C U R R E N T N E T W O R K S 3.4Provid ing addit ional in frastructure when road pr ic ing i suncerta in
4.156 The nature of the congestion problem in urban areas and on the strategic roadnetwork, and the consequent need for high road prices, indicates that there is likely to be acase for additional road capacity, even if road pricing is introduced.
4.157 Given the uncertainty around road pricing in the long term, there would be merit intesting the case for long-term investments in an environment where pricing is approaching.Priority should be given to those investments for which the case stands up to this test.
4.158 Even with a firm timeframe for the introduction of road pricing, it is likely to takeseveral years. In the meantime there are costs to the economy from road congestion and otherpressures. This may therefore point to considering the case for implementing variablecapacity options that are cheaper and faster to deliver than fixed infrastructure, reducing therisk of unnecessary investment.
4.159 A framework for identifying and evaluating the case for complementary investmentand pricing on other modes and how it will change through time is therefore needed.
Inter-urban publ ic transport capac i ty
4.160 Inter-urban rail services are likely to experience significant growth over the next twodecades with consequent increases in crowding on some services at peak times. Theseproblems are likely to be concentrated on rail links into major urban areas including London.The major cause of pressure is due to the competing demands for rail services on the samelines from both longer distance inter-urban travellers and shorter distance commuters.26
4.161 To the extent that these high levels of overcrowding are perceived to increase the costsof commuting into the major urban areas, there are likely to be adverse labour market effectsfrom the impacts on employment choices and therefore costs on the economy.
4.162 When compared with the sample size of returns from inter-urban strategic roadinvestment, there is much less evidence on the returns from public transport interventionson key inter-urban corridors. The evidence available suggests that where volumes of travellersare high enough to cause capacity constraints, and the density of employment and activity atthe destination are also very high, there can be good returns from additional variable capacityon existing rail lines. In the UK this suggests that the case will be stronger on corridors intomajor urban areas.
4.163 Improved signalling has played an important role in delivering significant benefits onthe London Underground. For example, signalling and new rolling stock plus otherenhancements such as track and civil works and improved power, communications anddepot facilities delivered strong returns on the Central Line. The reappraisal of the scheme in1999 suggested the scheme was financially positive, such that the benefits to travellers plusincreased revenues from higher patronage were greater than the cost of the scheme.27
4.164 To increase the effective capacity of existing heavy rail lines, rail signalling could beadopted, such as ‘moving block’. This technology allows trains to travel at faster speeds and closertogether, potentially improving the effective capacity of existing rail lines by some 10-20 per centdepending on the type of traffic and mix of services. These technologies are already being usedsuccessfully on a number of light rail schemes, for example the Docklands Light Railway.
207TH E ED D I N GT O N TR A N S P O RT ST U DY: MA I N RE P O RT: VO LU M E 3
26 For more detail see Interurban rail forecasts, Atkins, commissioned for the DfT and Eddington Study, 2006.27 The Central Line: A Step Change, Report for the DETR September 2000.
EN H A N C I N G C U R R E N T N E T W O R K S3.44.165 Therefore, if and only if the costs, risks and challenges associated with this technologywere such that this could feasibly be considered on a larger scale for national rail, it couldpotentially deliver consequent benefits to the economy. It could also be considered as acomplement to new additional variable capacity on existing rail links where capacityconstraints bite.
4.166 Upgrading rolling stock and lengthening trains on congested rail links, combinedwith changes to timetables to increase frequency can significantly increase the effectivecapacity of existing rail lines. Evidence of illustrative interventions to increase variablecapacity on inter-urban links into London by investing in new rolling stock, for example,suggests strong returns are possible from well-targeted interventions, with wider BCRsranging between 1 and 13 and costs between £50 and £500 million but more typically between1 and 3.28 The higher returns are largely driven by the ability to add variable capacity withminimal infrastructure requirements.
4.167 Both variable capacity on rail and inter-urban strategic road capacity are thereforelikely to deliver high returns cost-effectively if targeted on the key pressures on the transportsystem.
DO STEP-CHANGE MEASURES DELIVER FOR GDP?
4.168 It has been argued that investment in new fixed infrastructure can, in somecircumstances, create a step-change in economic performance. For example, measures thatprovide a step-change in the speed or cost of connection may generate wider economicbenefits through increasing the catchment areas for labour markets or through enablingreturn business journeys in a day. Volume 1 showed that such effects are quite limited inmature economies with well-developed infrastructure.
4.169 To explore this further, a review of appraisal and evaluation evidence of step-changeinvestments in the UK and abroad29 revealed that schemes that tackle existing congestionproblems and bottlenecks are likely to offer larger economic benefits per £1 of cost than thosethat are primarily focused on opportunities or enhancements.
4.170 The literature and evidence used in this volume also suggested that the bulk of theeconomic benefits of transport schemes will come from the value of time saved and reliabilitybenefits captured by conventional appraisal, with a limited uplift from including widereconomic benefits.
4.171 High-speed rail is often considered as an example of a step-change measure. But, it isfirst important to note a distinction between possible high-speed rail options:
• those that offer the ability to run trains at high-speed using existing and testedtechnologies, as is the case on some inter-city lines for example; and
• those that allow trains to run at even higher speeds, relying on new,developing and often untested technologies.
4.172 For the latter option, the approach taken to the development of some very high-speedrail line options has been the opposite of the approach advocated in this study. That is, thechallenge to be tackled has not been fully understood before a solution has been generated.Alternative options do not, therefore, appear to have been fully explored so it is not clear whatthe highest return solution to a problem would be; nor indeed is the challenge clear.
208 TH E ED D I N GT O N TR A N S P O RT ST U DY: MA I N RE P O RT: VO LU M E 3
28 For more detail see Interurban rail forecasts, Atkins, commissioned for the DfT and Eddington Study, 2006.29 Step-change Transport Improvements, Mann, 2006. See Volume 1.
EN H A N C I N G C U R R E N T N E T W O R K S 3.44.173 Interventions to significantly increase rail journey times are sometimes claimed toprovide a step-change in economic performance. The literature suggests that in most cases, thereturns are likely to be modest relative to other smaller-scale options. For example, the evidenceon the costs and benefits of new North-South high speed rail lines available to this study suggestsreturns at the lower end of the distribution compared to the returns available from other policyoptions. These relatively modest returns are likely to be driven by several factors including thefollowing:
• the UK’s compact economic geography means that most major urban areasare already close together when compared to many European andinternational competitors;
• for those economically important connections that are more distant, such asLondon to Edinburgh and Glasgow, air services already provide fast, frequentconnections serving business needs and other markets at relatively low cost.The new rail link, therefore, would not be a step change as the link is alreadythere and there is very little evidence that high-speed rail links help regionalperformance;
• the benefits accruing to intercity business and non-work/leisure travellers inthe UK from this new link are likely to be subject to significant uncertainty andspeculation because the demand for the link has not been tested and proven;
• history has shown that for large-scale infrastructure projects that rely onemerging technological solutions, costs tend to increase by an order ofmagnitude against original estimates; and
• in addition, where new rail lines are added and speeds greatly increase, thereare likely to be very significant environmental implications from the need forland take, plus emissions and noise.
4.174 Given the distinction made above about the types of high-speed rail interventions, itis important to recognise that not all high-speed rail line options would be subject to thesame issues. For those that do not involve relying on untested technologies and are targetedat solving proven congestion and overcrowding problems, higher and more certain returnsare likely than for high-risk options on new links where demands are speculative. There areseveral areas of the network where congestion and overcrowding have already been identifiedand are projected to worsen over coming decades without appropriate policies or responses,for example on commuter links into London and perhaps other cities. New infrastructureoptions are one potential solution, but they should be assessed alongside other optionsdesigned to meet the same objective.
4.175 When considering significant improvements to inter-urban links betweenagglomerations, on any mode, it is useful to recognise that commuters are generally preparedto do a 40-50 minute commute, and measures to improve the speed of connection betweenneighbouring agglomerations bring more people within this threshold, therefore wideningthe labour market. Agglomeration benefits are likely to drop off over longer distances.
4.176 Step-change measures to deliver a transformation of the transport system aretherefore generally unlikely to be a priority, given fixed funding resources. The scale of widertransformational benefits is uncertain and is extremely unlikely to be enough on its own tojustify very large amounts of public spending involved. Those that are able to tackle aparticular and already demonstrated problem on the other hand, are generally more likely tobe cost-effective, but should of course be assessed on their own merits relative to otheroptions such as pricing, variable infrastructure options and line upgrades.
209TH E ED D I N GT O N TR A N S P O RT ST U DY: MA I N RE P O RT: VO LU M E 3

EN H A N C I N G C U R R E N T N E T W O R K S3.44.177 The case for investing in step-change projects must always be considered againstother options for solving the same problem, and against the returns offered by other transportschemes and policies.
4.178 In addition to their potential economic benefits, it has been argued that high-speedrail could deliver reduced carbon emissions from the transport sector by offering a moreenergy-efficient and lower-carbon alternative to air travel for long distance inter-urbanjourneys. As the Government has an objective to reduce carbon emissions, it is also importantto consider the strategic environmental case for high-speed rail links in the UK.
4.179 Our guiding principle in considering the most effective policy options in contributingto growth has been that government should prioritise limited public resources on thosepolicy options that offer the greatest returns to public spending, and which make the mosteffective contribution to meeting government objectives. This argument applies equally tomoney spent on achieving environmental objectives, and government should prioritise thosepolicies which achieve the greatest reduction in carbon emissions per pound spent, takinginto account other costs and benefits.
4.180 It is outside the scope of this study to assess the detailed costs and benefits of specifichigh-speed rail options. Rather, our approach has been to make a strategic assessment of thefactors influencing the likely effectiveness of high-speed rail as a policy option for reducingcarbon emissions and achieving other environmental objectives.
4.181 At average load factors, rail has an environmental advantage over air travel as itconsumes less energy, and therefore produces lower carbon emissions per passenger perkilometre. In theory this suggests that a modal shift from air to rail would offer reductions incarbon emissions. Figure 4.11 analyses the carbon benefits that could be achieved if all airtravellers between London and Scotland transferred to rail over a 60-year period, assumingaverage load factors and energy consumption for rail. The cost of these carbon savings wouldbe high relative to other carbon reduction policies identified in the Government’s ClimateChange Programme Review.
210 TH E ED D I N GT O N TR A N S P O RT ST U DY: MA I N RE P O RT: VO LU M E 3
EN H A N C I N G C U R R E N T N E T W O R K S 3.4
211TH E ED D I N GT O N TR A N S P O RT ST U DY: MA I N RE P O RT: VO LU M E 3
Figure 4.11 Potential carbon savings from a modal shift from air to high-speed rail
A high speed line from London to Scotland could attract modal shift from passengers whocurrently make this journey by air. To get a sense of the potential for high speed rail togenerate carbon saving from modal shift from air, it is useful to estimate the carbonbenefits of an extreme scenario in which all of the current air travellers between Londonto Scotland were attracted onto high speed rail.
In 2005 around 8 million passengers flew between Scotland and London one way. Thecarbon emissions per person from making this journey by air or train are roughly 25kg and10kg of carbon respectively, assuming average load factors for both modes. There wouldbe further climate change benefits on top of these carbon savings due to a reduction inother emissions from aviation. If it were possible to power a high speed rail service withentirely carbon-free electricity, the climate change benefit would be even greater.Factoring in all of these potential benefits, a generous estimate of the net benefit for everyperson who travels by high speed rail rather than air would be about 40kg carbon.
If a zero carbon high speed rail line were able to attract all of the existing air travellersbetween London and Scotland to rail, the approximate net annual benefit would be 0.33million tonnes of carbon equivalent (MtCe), including an assumption for the non-carbonimpacts of aviation. To get a sense of the size of this reduction, the carbon emissions fromthe UK domestic transport sector were 35 MtC in 2004, and 152 MtC from the UK in total.0.33 MtCe would represent a saving of 0.2 per cent of the UK’s annual carbon emissions.Taking account of the predicted growth in aviation demand over the period to 2060, thetotal carbon savings if all aviation passengers on this route were to switch to high speedrail over a 60 year appraisal period would be 31.4 MtCe, or 0.5 MtCe per year on average.In practice, the carbon savings that would be achievable are likely to be much smaller thanthis, for a number of reasons set out in paragraph 4.182 below. Even under such favourableand optimistic assumptions, this would not represent a major carbon saving measurecompared to, for example, the EU ETS (saving 8 MtC per year from 2010).
The cost of saving carbon in this way is also likely to be relatively high. A standard cost-effectiveness approach working out the cost of saving each tonne of carbon gives a highnumber (showing poor cost-effectiveness), but this is potentially misleading in thatcontrary to most climate change policies, the main benefit of the policy is not carbon savingbut the time-savings benefits to the users which are not captured in the cost-effectivenessnumber. A fairer approach might be to compare the benefit of the carbon saved with thetotal costs and benefits of the scheme. The value of the carbon saved would be around £3.2billion (31.4Mtc over 60 years) on the government’s central cost of carbon of £70/tC (and£2.1 billion to £5.4 billion using the sensitivity range of £35/tC to £140/tC, all 2000 prices).The High Speed Line Study by Atkins for the Strategic Rail Authority estimated theconstruction cost of a London to Scotland high speed line at £33 billion (excludingmaintenance and operating costs). On a project with costs of this size, carbon savingbenefits of £2.1-5.4 billion (undiscounted), under the most optimistic assumptions, arenever likely to play a major role in the business case.

EN H A N C I N G C U R R E N T N E T W O R K S3.44.182 This analysis represents the maximum carbon savings that could be achieved throughmodal shift from air to high-speed rail on this route. In practice, there are a number of reasonsto be more cautious about the likely cost-effectiveness of a North-South high-speed rail lineas a policy for reducing carbon emissions:
• it is highly unlikely that high-speed rail would achieve this level of modal shiftfrom aviation, even with carbon pricing;
• and relatedly, rail’s carbon benefit over aviation will depend upon the loadfactors achieved, and there is a significant risk that demand for high-speed rail would be low on some parts of the route, and at some times;
• rail’s energy consumption and therefore carbon emissions per kilometreincreases with speed meaning that, all other factors being the same, high-speed rail has higher carbon emissions per passenger kilometre thanconventional rail, and a smaller carbon advantage over air travel;
• there could be carbon costs from passengers switching from conventional tohigh-speed rail, both because of the energy consumption of the respectivemodes and because load factors could be reduced on existing rail services; and
• there would be significant carbon and other environmental costs in theconstruction of the line.
4.183 These issues are discussed in more detail below.
4.184 The impact of high speed rail on the air market depends upon how competitive it iscompared to flying, in terms of both cost and travel time. The Atkins High Speed Line studyanticipated a 9 per cent reduction in air demand for the London to Edinburgh journey in2016, rising to 24 per cent in 2031.30
4.185 Some commentators acknowledge the uncertainties around the demand forecasts,but argue that if air travellers were made to pay the full external environmental costs of theirjourney, this would increase the comparative price advantage of rail travel, leading to a modalshift from air to rail, increasing the commercial viability and environmental performance ofhigh-speed rail.
4.186 This study fully supports the principle of ensuring transport users face their fullexternal costs, including environmental and congestion costs. This volume earlier explainedthat the introduction of some form of carbon pricing for aviation would result in increased airfares for passengers. Such a pricing mechanism might increase the cost of a one-way air farefrom London to Scotland by around £6, including an assumption for climate change costs ofother non-carbon emissions from aviation.31 A price increase of this magnitude would not beexpected to have a significant impact on the competitive position of rail versus air on thisroute. Furthermore, it is expected that this increase in costs would be offset by cost savingsthrough increased efficiency and competition in the aviation sector over the medium term,meaning prices would not be expected to rise in real terms.
4.187 Rail’s environmental benefit compared to other modes will depend heavily on its loadfactors. A well-utilised rail service has relatively low carbon emissions per passenger perkilometre. But if services are running at low occupancies, the energy consumption andcarbon emissions per person could be high, potentially higher than those of alternativemodes for the same journey.
Importance ofachieving high
load factors
Potential formodal shift from
air to rail
212 TH E ED D I N GT O N TR A N S P O RT ST U DY: MA I N RE P O RT: VO LU M E 3
30 High Speed Line Study: summary report, Atkins for the Strategic Rail Authority, 2004, www.dft.gov.uk.31 DfT analysis.

EN H A N C I N G C U R R E N T N E T W O R K S 3.44.188 If a rail service was well utilised throughout the day and on all parts of the route, itwould most likely offer environmental benefits over other modes for making the samejourney. But as discussed previously, demand for high-speed rail in the UK would be expectedto be relatively low on those sections of the route where new capacity would be provided inthe hope of stimulating demand rather than relieving existing capacity constraints. The riskof low demand on some sections of the route would therefore have implications for theenvironmental benefits of the scheme as well as its commercial feasibility.
4.189 Rail’s comparable energy efficiency and carbon advantage over air travel decreases asthe speed of the train increases. This is because air resistance, or aerodynamic drag, increasesexponentially with speed, meaning more energy, and therefore carbon emissions, arerequired to overcome air resistance at higher speeds. In simple terms, all other factors beingequal, a high-speed train would have higher carbon emissions per passenger than aconventional speed train covering the same distance.
4.190 The availability of low-carbon sources of energy would have implications for thebalance of carbon emissions across modes, and it is likely that low-carbon rail will becomefeasible before low-carbon aviation. If a high-speed rail line could be constructed andpowered by entirely carbon-free energy sources, this would increase the potential carbonsaving (in the worked example above it would increase the potential carbon savings byaround 40 per cent). But the increased carbon savings would need to be viewed against theincreased costs, if any, of sourcing low-carbon sources of energy.
4.191 While there may be carbon benefits from passengers moving from air to rail, it is likelythat there would be carbon costs from passengers moving from conventional rail to high-speed rail, both because of higher energy consumption and carbon emissions per passengerkm from high-speed rail, and because of possibility of load factors being reduced onconventional rail services.
4.192 The calculation in Figure 4.11 does not take account of the carbon costs of building anew line, which could be considerable. Furthermore, wider environmental implications of anew high-speed rail line may not all be positive. There would be significant landscape costsfrom building new track, including implications for biodiversity, national parks and nationalheritage. The route of a high-speed train could potentially pass through the Chilterns and/orthe Peak District National Park. A feasibility study by Atkins for the Strategic Rail Authoritynoted that high-speed rail does not perform particularly strongly on wider environmentalimplications ‘since a scheme requiring such substantial new infrastructure would inevitablyhave significant negative landscape, biodiversity and heritage impacts, with relatively smallbenefits to air quality and noise levels’.32
4.193 High level analysis of the potential carbon benefits from modal shift from air to high-speed rail suggests that these benefits would be small relative to the very high cost ofconstructing and operating such a scheme, and that under current assumptions a high speedline connecting London to Scotland is unlikely to be a cost-effective policy for achievingreductions in carbon emissions compared to other policy measures.
4.194 High-speed rail is likely to make the most effective contribution to environmentalobjectives where the scheme is developed to address existing or projected capacityconstraints, increasing the probability of high demand and high load factors, and improvingthe economic and environmental returns.
Conclusions ofthe strategic
environmentalcase for a North
South high-speedrail line
Wider carbonand
environmentalcosts
Carbonperformance ofhigh-speed rail
compared toconventional rail
Carbonimplications ofhigher speeds
213TH E ED D I N GT O N TR A N S P O RT ST U DY: MA I N RE P O RT: VO LU M E 3
32 High Speed Line Study – Summary Report, Atkins for the Strategic Rail Authority, 2004. www.dft.gov.uk.
EN H A N C I N G C U R R E N T N E T W O R K S3.44.195 The energy consumption, and therefore carbon emissions, of very high speed rail islikely to be higher than that of conventional rail, all other factors being the same. Anyconsideration of the potential for high speed rail to deliver carbon benefits needs to be basedon detailed analysis of the costs and benefits, rather than on broad generalisations about theenvironmental benefits of different modes.
4.196 As argued previously in this chapter, decisions on specific schemes or policies wouldneed to be informed by detailed appraisals of specific high-speed rail proposals, and ofappraisals of other policy options for achieving the same objectives.
Conclus ions
4.197 This section has therefore shown the following:
• there is an economic case for a significant amount of targeted additionalinter-urban road capacity, even after environmental effects have beenaccounted for;
• the introduction of better road pricing would reduce the amount required.Even with road pricing, however, there is an economic case for additionalinter-urban road infrastructure, albeit at a much lower order of magnitudeand in fewer places;
• the case for targeted additional capacity on key commuter corridors intomajor urban areas is strong; and
• step-change measures intended to provide a transformation to the transportsystem and rely on untested technologies are not, in a world of constrainedresources, likely to be a priority. Those step-change measures proposed as asolution to existing and likely future problems are more likely to perform well,but must be assessed alongside other options for a given transport challenge.
214 TH E ED D I N GT O N TR A N S P O RT ST U DY: MA I N RE P O RT: VO LU M E 3
3.5 EV I D E N C E A N D M E T H O D O LO GY
TH E ED D I N GT O N TR A N S P O RT ST U DY: MA I N RE P O RT: VO LU M E 3
INTRODUCTION
5.1 The purpose of this chapter is to provide more detail on the significant quantity ofevidence that has been drawn on to reach the conclusions and recommendations in thisvolume. In addition, more detail is provided on the approach taken to the assessment andcomparison of interventions explored and how the various metrics can be interpreted. Thischapter:
• sets out the process of cost-benefit analysis and the role it plays in decisionmaking and prioritisation;
• outlines the range of evidence that has been drawn on and how the GDP andfull welfare impacts of different options in different places have beenestimated;
• offers some insight into how the evidence can be interpreted; and
• concludes with what this evidence can tell us, and what it cannot.
215
Headlines
• An evidence-based approach has been adopted to assess and compare transportpolicy options, drawing on evidence of real past and proposed future interventionsacross the UK, and modelling work using a range of analytical tools. A very widerange of costs and benefits have been taken into account.
• Understandably, evidence is not available for all interventions on the policy menu;nor does the evidence cover every circumstance in which an intervention could beimplemented. This is particularly true in growing and congested urban areas andtheir catchments; but the evidence is sufficient to draw some useful strategicconclusions.
• No assessment is able to capture all the costs and benefits of a transport policy andpresent them in monetary terms. Impacts on the environment, journey timereliability and some GDP effects are therefore not captured in the typically usedbenefit:cost ratios (BCRs) that result from the NATAa appraisal process, but areassessed qualitatively.
• For the purposes of this study, the best available evidence has been used toattempt to estimate the value of these previously uncaptured effects, and in somecases, a judgement on the magnitude of environmental effects has been madeusing evidence on environmental valuation. This has allowed the overall value formoney of interventions to be compared.
• Some impacts remain unquantified, such as trade and dynamic effects.
a See: www.webtag.org.uk
EV I D E N C E A N D M E T H O D O LO GY3.5COST-BENEFIT ANALYSIS AS A DECISION MAKING TOOL
5.2 By relying on evidence of the likely returns of transport spending, it is possible tobuild an understanding of:
• where and under what conditions different interventions are able to offerbenefits that exceed the costs; and
• which policy options are likely to be the best.
5.3 Cost-benefit analysis (CBA) has long been used by government and business as a wayof measuring the impact of taking action, relative to ‘doing nothing’, (see Figure 5.1).By assessing the costs and benefits in a consistent and transparent way, options canbe compared and government is able to allocate its funds to the projects that offer thebest returns.
5.4 The metrics used in this volume are set out in Figure 5.2.
216 TH E ED D I N GT O N TR A N S P O RT ST U DY: MA I N RE P O RT: VO LU M E 3
Figure 5.1: Cost-benefit analysis as a decision-making tool
In the transport context, cost-benefit analyses are carried out for all major transportprojects. The impacts of an intervention are assessed against a ‘do nothing’ reference caseto allow an assessment to be made of the benefits and costs of action relative to whatwould otherwise be likely to happen.
In 1998, the UK Government introduced its formal appraisal process, the New Approachto Appraisal (NATA). This sets out guidance on how a transport project requiringgovernment funding should be appraised against the five government objectives fortransport: environment, safety, economy, accessibility and integration. The purpose is toassess the overall value for money of the intervention after all impacts have beenaccounted for.
Impacts are assessed and presented in monetary terms where a robust valuation evidencebase exists, for example the value of time to a range of transport users and vehicleoperating costs. Where this is not possible, as for some environmental effects, impacts areassessed qualitatively by experts in the field. Overall impacts are summarised andpresented consistently in an appraisal summary table.
To reflect the evolving nature of transport appraisal, four cost-benefit measures arereferred to throughout this study, all of which express estimated benefits of a proposal perpound of government expenditure. If the ratio is, say, 2.5 then £2.50 of benefit is achievedper £1 of public funds invested. An intervention with ratio of 5:1 would offer double thiswelfare return.
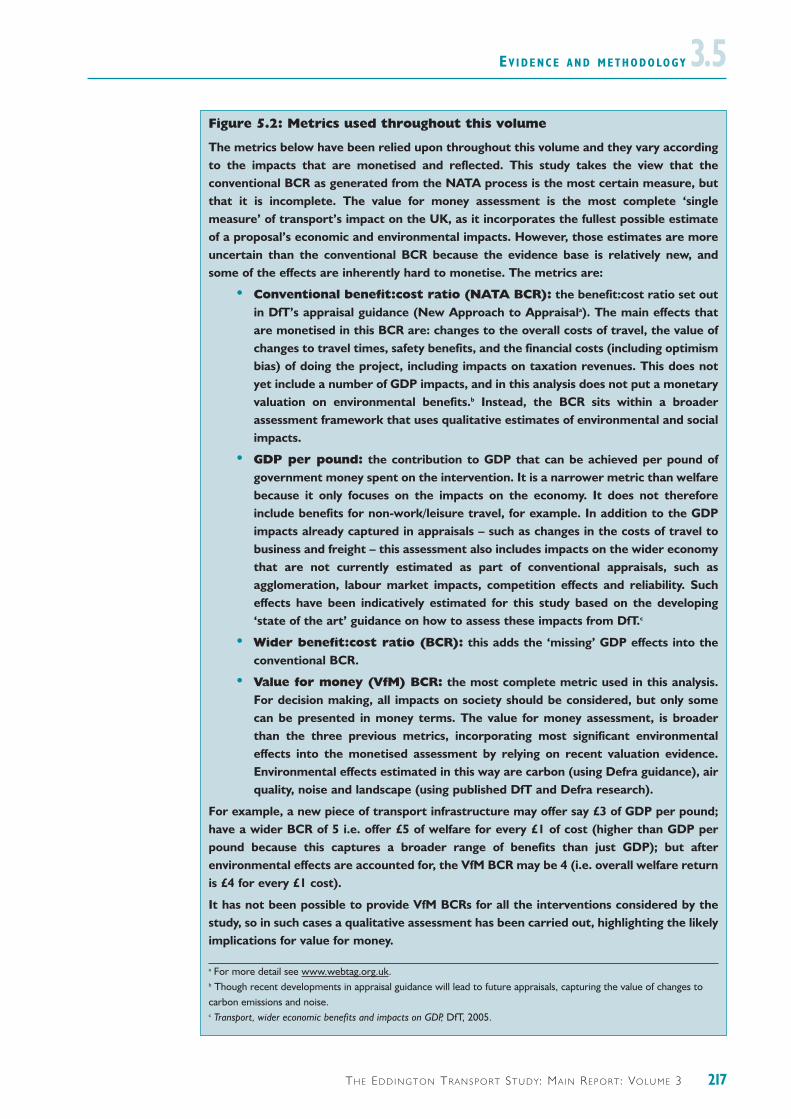
EV I D E N C E A N D M E T H O D O LO GY 3.5
217TH E ED D I N GT O N TR A N S P O RT ST U DY: MA I N RE P O RT: VO LU M E 3
Figure 5.2: Metrics used throughout this volume
The metrics below have been relied upon throughout this volume and they vary accordingto the impacts that are monetised and reflected. This study takes the view that theconventional BCR as generated from the NATA process is the most certain measure, butthat it is incomplete. The value for money assessment is the most complete ‘singlemeasure’ of transport’s impact on the UK, as it incorporates the fullest possible estimateof a proposal’s economic and environmental impacts. However, those estimates are moreuncertain than the conventional BCR because the evidence base is relatively new, andsome of the effects are inherently hard to monetise. The metrics are:
• Conventional benefit:cost ratio (NATA BCR): the benefit:cost ratio set outin DfT’s appraisal guidance (New Approach to Appraisala). The main effects thatare monetised in this BCR are: changes to the overall costs of travel, the value ofchanges to travel times, safety benefits, and the financial costs (including optimismbias) of doing the project, including impacts on taxation revenues. This does notyet include a number of GDP impacts, and in this analysis does not put a monetaryvaluation on environmental benefits.b Instead, the BCR sits within a broaderassessment framework that uses qualitative estimates of environmental and socialimpacts.
• GDP per pound: the contribution to GDP that can be achieved per pound ofgovernment money spent on the intervention. It is a narrower metric than welfarebecause it only focuses on the impacts on the economy. It does not thereforeinclude benefits for non-work/leisure travel, for example. In addition to the GDPimpacts already captured in appraisals – such as changes in the costs of travel tobusiness and freight – this assessment also includes impacts on the wider economythat are not currently estimated as part of conventional appraisals, such asagglomeration, labour market impacts, competition effects and reliability. Sucheffects have been indicatively estimated for this study based on the developing‘state of the art’ guidance on how to assess these impacts from DfT.c
• Wider benefit:cost ratio (BCR): this adds the ‘missing’ GDP effects into theconventional BCR.
• Value for money (VfM) BCR: the most complete metric used in this analysis.For decision making, all impacts on society should be considered, but only somecan be presented in money terms. The value for money assessment, is broaderthan the three previous metrics, incorporating most significant environmentaleffects into the monetised assessment by relying on recent valuation evidence.Environmental effects estimated in this way are carbon (using Defra guidance), airquality, noise and landscape (using published DfT and Defra research).
For example, a new piece of transport infrastructure may offer say £3 of GDP per pound;have a wider BCR of 5 i.e. offer £5 of welfare for every £1 of cost (higher than GDP perpound because this captures a broader range of benefits than just GDP); but afterenvironmental effects are accounted for, the VfM BCR may be 4 (i.e. overall welfare returnis £4 for every £1 cost).
It has not been possible to provide VfM BCRs for all the interventions considered by thestudy, so in such cases a qualitative assessment has been carried out, highlighting the likelyimplications for value for money.
a For more detail see www.webtag.org.uk. b Though recent developments in appraisal guidance will lead to future appraisals, capturing the value of changes tocarbon emissions and noise.c Transport, wider economic benefits and impacts on GDP, DfT, 2005.

EV I D E N C E A N D M E T H O D O LO GY3.5SOURCES OF EVIDENCE FOR THE STUDY
5.5 A wide range of evidence from a range of sources has been drawn on, includingbroader academic literature. Evidence from real existing and proposed schemes in the UK hasbeen used heavily. However, the evidence available does not cover some policy options soadditional evidence has been generated from a range of modelling sources. This includesnational transport modelling for the year 2025, rail network modelling for the year 2026,aviation and ports modelling for 2030, limited modelling in the West Midlands and a strategicmodelling case study of South and West Yorkshire. The full range of sources is listed inFigure 5.3.
5.6 The strategic modelling work has been discussed and reviewed by a number of expertacademics in the field and more detailed reports on this analysis, including a description ofthe methodology used, are published alongside this report.
5.7 Unlike a detailed CBA, strategic modelling provides an earlier stage of analysis. Itassesses the returns from improvements to particular transport corridors without specifyingprecise routes. This is a tractable way of conducting strategic assessments, but can only everprovide a high-level assessment of some of the environmental and social impacts involved;and it adopts rules of thumb for high-level costings. Nonetheless, it does form a useful sourceof analysis where detailed appraisals are not available and can help guide policy makerstowards areas where more detailed appraisals are likely to be worthwhile.
218 TH E ED D I N GT O N TR A N S P O RT ST U DY: MA I N RE P O RT: VO LU M E 3
Figure 5.3: Sources of cost-benefit analysis
• DfT’s value for money assessments: a sample of projects submitted for ministerialapproval over the last two years including public transport interventions andstrategic and local roads.
• A case study of South and West Yorkshire using the South and West YorkshireStrategic Model (SWYSM) exploring a range of illustrative interventions; and anillustrative intervention in the West Midlands using the Policy ResponsiveIntegrated Strategy Model (PRISM).
• Transport for London analysis and business cases.
• Air Transport White Paper and Ports Policy Review analysis on the costs andbenefits of increasing ports and airports capacity in the period to 2030.
• National Transport Model strategic modelling of road pricing and strategic roadinvestment in 2025.
• Strategic modelling of inter-urban variable capacity rail enhancements using thePLANET suite of models for 2026.
• Sustrans analysis of walk and cycle interventions.
• High Speed Line Study – Summary Report .a
• A review of the literature on step-change measures in the UK and overseas.
In total, the database of evidence contains relatively detailed information on the returns ofover 170 interventions, plus a range of additional evidence from external sources andmodelling.
a High Speed Line Study- Summary Report, published October 2004. Available from www.dft.gov.uk.

EV I D E N C E A N D M E T H O D O LO GY 3.55.8 Relying on detailed appraisals of particular interventions provides importantinsights; but it is important to bear in mind that it does not allow a comparison of a full rangeof options for each transport challenge. The case study of South and West Yorkshire goes someway to rectifying this, as described more fully in Chapter 3.4, as it has compared a fuller rangeof illustrative options in a particular area.
5.9 However, there are some types of options on which the evidence is very limited,including:
• rail freight: options for urban, inter-urban and surface access links;
• the impact of different types of road pricing on the case for additionalinfrastructure. The evidence is emerging for the strategic road network, butthere is still much to do in understanding the impact in urban areas and onpublic transport needs; and
• the full range of interventions in growing and congested urban centres, forexample urban traffic management or bus measures.
5.10 On balance, the evidence is considered sufficient to provide a guide as to the range ofreturns from different types of options; and to highlight the gaps that should now be a priorityfor transport strategists to fill. The evidence available covers a broad range of locations acrossthe UK, as shown in Figure 5.4.
219TH E ED D I N GT O N TR A N S P O RT ST U DY: MA I N RE P O RT: VO LU M E 3

Figure 5.4: Location of interventions in the evidence base
Key
Trunk A road
Trunk motorway
Local road
Public transport
Rail
Tram
M25 Road schemes (trunk motorway)
Urban areas with a population >100k
Ordnance Survey ©Crown copyright. All rights reservedDepartment for Transport 100020237 2006 gisu0607j052Map8Source: DfT.
EV I D E N C E A N D M E T H O D O LO GY3.5
220 TH E ED D I N GT O N TR A N S P O RT ST U DY: MA I N RE P O RT: VO LU M E 3
EV I D E N C E A N D M E T H O D O LO GY 3.5INTERPRETING THE EVIDENCE
5.11 To make maximum use of the wide range of evidence available in comparing policyoptions and informing the strategic transport priorities, it is important to fully understand itswider context, strengths and limitations.
5.12 As described in Figure 5.1, the purpose of transport appraisal is to assess the full rangeof costs and benefits of each transport intervention consistently and comprehensively. Fourkey metrics have been relied on for this study to allow the relative magnitudes of differentimpacts to be demonstrated. Of greatest importance for the decision-making process is thenotion of value for money – as captured by the VfM BCR because this reflects the broadestpossible range of impacts, including environmental effects and impacts on the economy thatare not currently captured in appraisals.1
5.13 But even this measure does not capture all of the impacts of transport interventions.Importantly, at present there is no methodology for estimating the benefits of increased tradeand attracting more globally mobile investment. These are particularly likely to be prevalentfor some inter-urban links and international gateway options. In addition, dynamic impactsare also not captured in current appraisals. Such dynamic effects are likely to be notablewhere, for example, transport is constraining growth and interventions are able to supporturban areas as innovation centres; or where they provide reliability improvements that allowfurther consolidation of just-in-time supply chains; or open up new trading opportunitiesthat extend the reach of markets to provide increased economies of scale in production.Unlocking even small scale improvements to the growth rate will cumulate to providesignificant benefits through time. So, although uncertain, where current ‘missing’ GDPimpacts have here been estimated, if anything, they are likely to be underestimates.
5.14 In many ways, the ‘missing’ GDP impacts are less well understood than theassessment of the value of time saved that forms the bedrock of conventional appraisal, so itis only right that they are separately identified. At the same time, care must be taken not toapply a higher standard of proof to new appraisal developments than to more familiarmethods. For example, with current data and analytical tools, there remains muchuncertainty around the modelling and appraisal of freight benefits that are incorporated intransport assessments. This area is evolving and will improve as more evidence comes to lightof freight responses to transport interventions and their value.
5.15 Not only are there uncertainties around the ‘missing’ GDP estimates, there are alsouncertainties around the estimated environmental impacts. There are two aspects of thisuncertainty. Firstly, the appraisal information available from real interventions containsdetailed assessments of the environmental impacts, but it is not monetised at the scheme-specific level. Therefore, best available evidence must be relied on to estimate the magnitudeof these effects, for example, Defra guidance on the value of carbon emissions, and landscapevalues from the then ODPM.2 Secondly, given the nature of the strategic modelling of a rangeof interventions, detailed assessment of environmental impacts is not possible. But, it ispossible to draw from the experience of real interventions to estimate the indicativemagnitude of such effects. For example, with strategic road widening, estimates have beenmade of the extent and type of landscape affected and carbon impacts have been estimatedbased on the changes in road use.3 The assessment is therefore generic rather than scheme-specific.
Uncertainties ofcourse remain
221TH E ED D I N GT O N TR A N S P O RT ST U DY: MA I N RE P O RT: VO LU M E 3
1 For more detail, see separate paper Transport demand to 2025 and the economic case for road pricing and investment, DfT,2006.2 Eftec and Entec 2002 Valuing the External Benefits of Undeveloped Land: A Review of the Economic Literature. A Report forthe Office of the Deputy Prime Minister, London, 2002.3 For more detail see Transport demand to 2025 and the economic case for road pricing and investment, DfT, 2006.

EV I D E N C E A N D M E T H O D O LO GY3.55.16 Likewise, where scheme specific costs have not been available, as for the strategicmodelling of interventions, assessments have been made on the basis of evidence of the costsfrom real schemes. For example, for strategic road widening, average costs per lane kilometrehave been estimated from real strategic road widening schemes, including land costs andoptimism bias.
5.17 These estimates significantly improve the evidence for this study but as highlightedthroughout this volume, for actual funding decisions, there is no substitute for detailedscheme assessment.
5.18 Given the long-life nature of transport investments, appraisals must be carried out onthe basis of expected travel patterns and demands. Inevitably, looking to the longer termthere are uncertainties over the variables that determine travel demands. These uncertaintiesare likely to impact on the most appropriate timing and scope of an intervention and thefunding decision-making process must be robust to the possibility that the future may lookdifferent to that projected.
5.19 This study has also made use of the returns possible from some private sectorinvestment but because these are privately funded, the BCR as defined is not available.4
Information on scheme costs, user benefits and, in the case of airports, carbon impacts isavailable and is discussed.
WHAT CAN BE INFERRED FROM THE ANALYSIS IN THISVOLUME
5.20 The metrics discussed are able to tell us a significant amount about the returns oninvestment. The reason for relying on metrics is to allow a transparent and consistentcomparison to be made across the range of interventions for which evidence is available. Theinformation that can be inferred from the analysis in this volume is a strategic assessment of:
• whether there are transport schemes that justify their costs and so provide neteconomic benefits;
• the nature of economic welfare and GDP returns that are available ontransport projects (though some effects are missing); and
• clues as to the types of projects that offer the highest returns, subject tomissing benefits, missing projects and limited analysis of packages.
5.21 It does not:
• justify proceeding on any individual project – detailed cost-benefit analysiswithin a robust prioritisation process would be needed; or
• provide any accurate and scheme-specific estimations of the wider economicbenefits.
222 TH E ED D I N GT O N TR A N S P O RT ST U DY: MA I N RE P O RT: VO LU M E 3
4 The BCR has been defined to represent the welfare returns per pound of government funds.
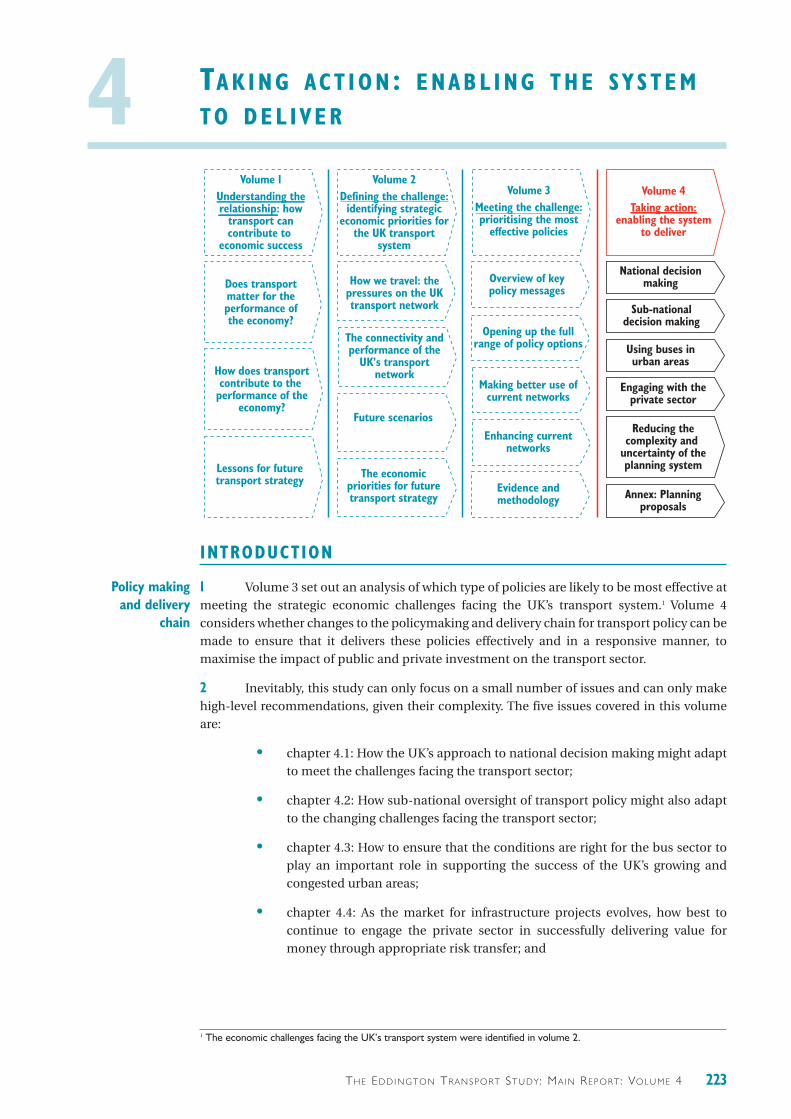
4 TA K I N G AC T I O N : E N A B L I N G T H E S Y S T E MT O D E L I V E R
TH E ED D I N GT O N TR A N S P O RT ST U DY: MA I N RE P O RT: VO LU M E 4
INTRODUCTION
1 Volume 3 set out an analysis of which type of policies are likely to be most effective atmeeting the strategic economic challenges facing the UK’s transport system.1 Volume 4considers whether changes to the policymaking and delivery chain for transport policy can bemade to ensure that it delivers these policies effectively and in a responsive manner, tomaximise the impact of public and private investment on the transport sector.
2 Inevitably, this study can only focus on a small number of issues and can only makehigh-level recommendations, given their complexity. The five issues covered in this volumeare:
• chapter 4.1: How the UK’s approach to national decision making might adaptto meet the challenges facing the transport sector;
• chapter 4.2: How sub-national oversight of transport policy might also adaptto the changing challenges facing the transport sector;
• chapter 4.3: How to ensure that the conditions are right for the bus sector toplay an important role in supporting the success of the UK’s growing andcongested urban areas;
• chapter 4.4: As the market for infrastructure projects evolves, how best tocontinue to engage the private sector in successfully delivering value formoney through appropriate risk transfer; and
Policy makingand delivery
chain
223
Volume 1Understanding the relationship: how
transport can contribute to
economic success
Does transport matter for the performance of the economy?
How does transport contribute to the
performance of the economy?
Lessons for future transport strategy
How we travel: the pressures on the UK transport network
Overview of key policy messages
Engaging with the private sector
Annex: Planning proposals
Reducing the complexity and
uncertainty of the planning system
Opening up the fullrange of policy options
Making better use of current networks
Enhancing current networks
Evidence and methodology
Future scenarios
The economic priorities for future transport strategy
The connectivity and performance of the
UK’s transport network
Volume 2Defining the challenge:
identifying strategic economic priorities for
the UK transportsystem
Volume 3Meeting the challenge:prioritising the most
effective policies
Volume 4Taking action:
enabling the systemto deliver
National decision making
Using buses in urban areas
Sub-national decision making
1 The economic challenges facing the UK’s transport system were identified in volume 2.

TA K I N G AC T I O N : E N A B L I N G T H E S Y S T E M T O D E L I V E R4• chapter 4.5: Whether the planning system for major transport projects enables
the public and private sectors to bring forward projects aimed at addressingtransport bottlenecks, whilst balancing the environmental, economic andsocial impacts. In light of responses received from stakeholders, this chaptersets out an in-depth analysis of the system and makes detailedrecommendations for significant reforms. Further detail on thoserecommendations can be found in the annex.
224 TH E ED D I N GT O N TR A N S P O RT ST U DY: MA I N RE P O RT: VO LU M E 4