Embed Size (px)
Citation preview

The Economy and External Environment
10th Annual Georgia Idea Institute
August 19, 2015Bill Hampel, Chief Policy Officer
Credit Union National Association

Starting questions:
• Equity markets• Exempt employee changes• Rates• Oil industry impact• NIM• China devaluation• Bubbles?• Euro• Puetro Rico

Economic Summary
• Beginning the seventh year of recovery.• First quarter slowdowns “normal”?• Job market improving, but still significant
slack.• Inflation outlook moderate. • Economy now in a sustained recovery:
escape velocity.• External risks not life threatening.

Gross Domestic Product Quarterly Changes at Annual Rates, Real
98 99 00 01 02 03 04 05 06 07 08 09 10 11 12 13 14 15
-10
-8
-6
-4
-2
0
2
4
6
8
10
Great RecessionOf 2008 - 2009
2.4% since 2009 III
2001 Recession

Gross Domestic Product Quarterly Changes at Annual Rates, Real
REVISED JULY 30
98 99 00 01 02 03 04 05 06 07 08 09 10 11 12 13 14 15
-10
-8
-6
-4
-2
0
2
4
6
8
10
Great RecessionOf 2008 - 2009
2001 Recession
2.2% since 2009 III

Household Finances• Recovered:
– Debt payments low– Stock market recovered– Home prices rising
• But still room for further improvement:– Debt outstanding still relatively high– Home prices still off peak
• Improved ability to spend, willingness finally catching up?
• Demand backlogs

Household Debt OutstandingTo Annual Disposable Income
1959196219651968197219751978198119851988199119941998200120042007201120140%
20%
40%
60%
80%
100%
120%
140%
Mortgage
123%
Consumer
96%
Latest: 2015 QI

Household Debt Service RatioMonthly Payments to Disposable Income
1980 1982 1984 1986 1989 1991 1993 1995 1998 2000 2002 2004 2007 2009 2011 20130
2
4
6
8
10
12
14
Mortgage
Consumer
Percent
Latest: 2015 QI

US Home PricesCase-Schiller National Index, Jan 2000 = 100
1975197719801983198619891992199419972000200320062009201120140
20
40
60
80
100
120
140
160
180
200

US Home vs.Stock PricesCase-Schiller National Index, S&P 500
197519781981198419871990199319961999200220052008201120140
20
40
60
80
100
120
140
160
180
200
-200
300
800
1300
1800
2300
Case Schiller S&P 500

Household Net Worth
2006
2006
2007
2007
2008
2008
2009
2009
2010
2010
2011
2011
2012
2012
2013
2013
2014
2014
2015
$0
$10,000
$20,000
$30,000
$40,000
$50,000
$60,000
$70,000
$80,000
$90,000

Annual Light Vehicle SalesMillions

Annual Light Vehicle SalesMillions

Annual Light Vehicle SalesMillions

Annual Light Vehicle SalesMillions
1976
1979
1982
1985
1988
1991
1994
1997
2000
2003
2006
2009
2012
2014
0.0
2.0
4.0
6.0
8.0
10.0
12.0
14.0
16.0
18.0
20.0

Annual Light Vehicle SalesMillions
1976
1978
1980
1982
1984
1986
1988
1990
1992
1994
1996
1998
2000
2002
2004
2006
2008
2010
2012
2014
0.0
2.0
4.0
6.0
8.0
10.0
12.0
14.0
16.0
18.0
20.0

Non-Farm PayrollsMonthly Changes SA, to June 2015
06 07 08 09 10 11 12 13 14 15-1000
-800
-600
-400
-200
0
200
400
600
8.7 million jobs lost
12.1 million jobs gainedNet Gain: 3.4 million

Job Loss and Recovery: Four Recessions Since 1980
Scaled to 2008 Employment of 138 million
Great Recession
Job Losses in Recession
8.7 million
Job Gains First Five Years
12.1 million
Net Change Five Yrs into Recovery
PLUS3.4 million

Job Loss and Recovery: Four Recessions Since 1980
Scaled to 2008 Employment of 138 million
Great Recession
Average of Three Previous Recessions
Job Losses in Recession
8.7 million 3.0 million
Job Gains First Five Years
12.1 million 14.0 million
Net Change Five Yrs into Recovery
PLUS3.4 million
PLUS11 million

Job Loss and Recovery: Four Recessions Since 1980
Scaled to 2008 Employment of 138 million
Great Recession
Average of Three Previous Recessions Difference
Job Losses in Recession
8.7 million 3.0 million 5.7 million
Job Gains First Five Years
12.1 million 14.0 million -1.9 million
Net Change Five Yrs into Recovery
PLUS3.4 million
PLUS11 million
BEHIND7.6 million


Unemployment Rates and RecessionsPercent of the Labor Force
80 85 90 95 00 05 10 1502468
101214161820
Recessions Top Line Rate U6 Rate
Broadest Measure 10.4%Down from 17.4%, Oct 2009
Narrow Measure 5.3%Down from 10.1%

Consumer Confidence? Conference Board
05 06 07 08 09 10 11 12 13 14 150
20
40
60
80
100
120

Consumer Price Inflation1970 to Present, Annual Rates
70 73 76 79 82 85 88 91 94 97 00 03 06 09 12 15 16F
-2
0
2
4
6
8
10
12
14
16
12 Months to June
Top Line = 0.2%Core = 1.8%

Interest Rate Outlook

Interest Rates1988 to Present
88 89 90 91 92 93 94 95 96 97 98 99 00 01 02 03 04 05 06 07 08 09 10 11 12 13 14 150
2
4
6
8
10
12
Fed Funds10-yr Treas

Waiting on the Fed• The Fed has lost its patience.• But we exist in international financial
markets.• Fed Funds Rate Move:
– September, October?– Speed and frequency
• Longer-term rates.• Liquidity vs. NEV or Net Interest Income

Interest Rates1988 to Present
88 89 90 91 92 93 94 95 96 97 98 99 00 01 02 03 04 05 06 07 08 09 10 11 12 13 14 150
1
2
3
4
5
6
7
8
9
10
10-yr Treas

Treasury Yield Curves
3 mth 1 Yr 3 Yrs 5 Yrs 7 Yrs 9 Yrs 10 Yrs0.00
0.50
1.00
1.50
2.00
2.50
3.00
April 2013 April 2014 July 2015

Treasury Yield Curves
3 mth 1 Yr 3 Yrs 5 Yrs 7 Yrs 9 Yrs 10 Yrs0
1
2
3
4
5
6
July 2015 Dec 2016 ? June 2017 ?

Credit Union Outlook Through 2015
• Weak savings and asset growth– Low interest rates– Consumer spending growth
• Strengthening loan growth– Household de-leveraging slowing– Improving confidence, building backlogs
• Loan delinquencies and losses about back to normal
• Mixed outlook for net income– See below
• Rising net worth ratios

Credit Union Loan GrowthAnnual Percent Change
80 82 84 86 88 90 92 94 96 98 00 02 04 06 08 10 12 14 16F
-10
-5
0
5
10
15
20
25
30
U.S. GA

Credit Union DelinquencyDollars Delinquent as Percent of Total Portfolio
84 86 88 90 92 94 96 98 00 02 04 06 08 10 12 14 16F
0
0.5
1
1.5
2
2.5

Net Loan Charge-0ffsTotal Portfolio
85 87 89 91 93 95 97 99 01 03 05 07 09 11 13 15F
0
0.2
0.4
0.6
0.8
1
1.2
1.4

Credit Union Savings GrowthAnnualized Percent Change
80 82 84 86 88 90 92 94 96 98 00 02 04 06 08 10 12 14 16F
-5
0
5
10
15
20
25

Credit Union Net IncomeTo Average Assets
80 82 84 86 88 90 92 94 96 98 00 02 04 06 08 10 12 14 16F
-20
0
20
40
60
80
100
120
140
160

Net Capital to Assets
83 85 87 89 91 93 95 97 99 01 03 05 07 09 11 13 15 15F
0
2
4
6
8
10
12
14
16
U.S. New Jersey PCA Well Cap'd PCA Adequate

What’s Driving Earnings?POSITIVES:• Lower provision expenses• Finished stabilization assessments
NEGATIVE, for a while longer:• Net Interest Income
EVAPORATING• Mortgage refinance revenue
AT LONG-TERM RISK• Debit interchange revenue• Overdraft revenue

39

What’s Driving Earnings?POSITIVES:• Lower provision expenses• Finished stabilization assessments
NEGATIVE, for a while longer:• Net Interest Income
EVAPORATING• Mortgage refinance revenue
AT LONG-TERM RISK• Debit interchange revenue• Overdraft revenue

Corporate Stabilization AssessmentsBasis Points of Insured Shares

Corporate Stabilization AssessmentsBasis Points of Insured Shares
?

What’s Driving Earnings?POSITIVES:• Lower provision expenses• Finished stabilization assessments
NEGATIVE, for a while longer:• Net Interest Income
EVAPORATING• Mortgage refinance revenue
AT LONG-TERM RISK• Debit interchange revenue• Overdraft revenue
275
300
325
350
375
400
425
275
300
325
350
375
400
425
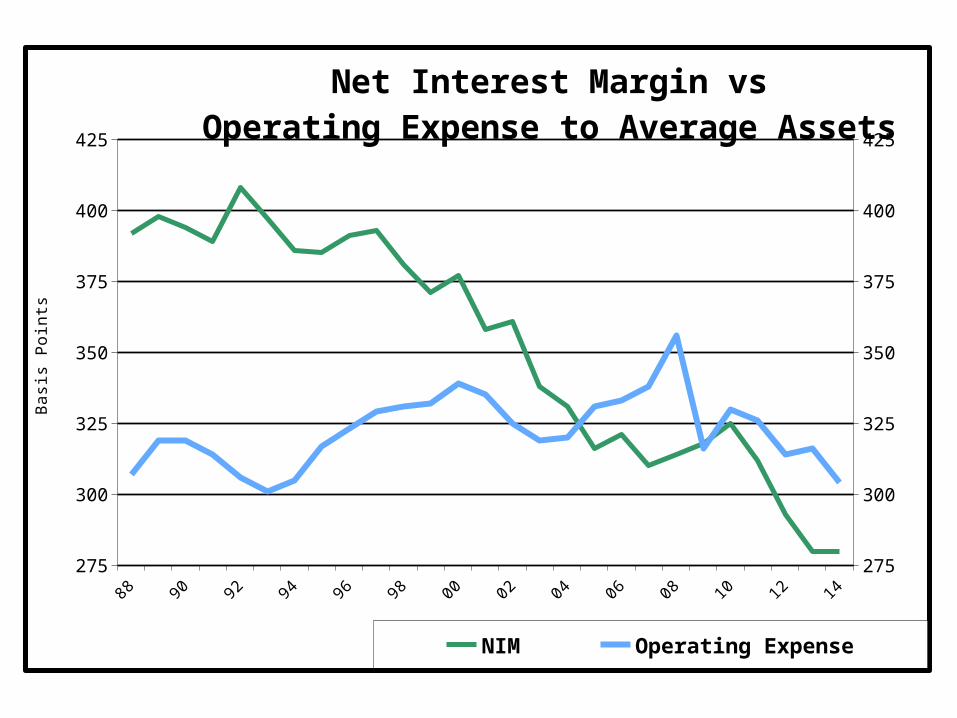
Net Interest Margin vsOperating Expense to Average Assets
NIM Operating Expense
Bas
is P
oint
s

Credit Union Net Interest Income
1991
1993
1995
1997
1999
2001
2003
2005
2007
2009
2011
2013
2015
I0
50
100
150
200
250
300
350
400
450
284

What’s Driving Earnings?POSITIVES:• Lower provision expenses• Finished stabilization assessments
NEGATIVE, for a while longer:• Net Interest Income
EVAPORATING• Mortgage refinance revenue
AT LONG-TERM RISK• Debit interchange revenue• Overdraft revenue

Mortgage Refinancing
88 89 90 91 92 93 94 95 96 97 98 99 00 01 02 03 04 05 06 07 08 09 10 11 12 13 14 150
1
2
3
4
5
6
7
8
9
10
10-yr Treas

What’s Driving Earnings?POSITIVES:• Lower provision expenses• Finished stabilization assessments
NEGATIVE, for a while longer:• Net Interest Income
EVAPORATING• Mortgage refinance revenue
AT LONG-TERM RISK• Debit interchange revenue• Overdraft revenue

Performance Varies by Size
LT $50 $50 - $200 $200 - $500 $500 - $1B GR $1 B
-20
0
20
40
60
80
100
120
19
47
64
81
99
-1
38
1319
2014 ROA Mbr Growth Since 2011
49