Embed Size (px)
Citation preview
Market Platform Dynamics © 2008
1
THE ECONOMICS OF THE
ONLINE ADVERTISING INDUSTRY
David S. Evans*
Founder, Market Platform Dynamics
Visiting Professor/University College London and Lecturer/University of Chicago Law School
January 2008
Contact information: David S. Evans Market Platform Dynamics [email protected]
* The author would like to thank Thomas Eisenmann, Shane Pedersen, Martin Peitz, Greg Sivinski, Daniel Garcia Swartz, and, especially, Howard Chang for many helpful insights and discussions and Marina Danilevsky, Melissa DiBella, and Sokol Vako for exceptional research support. The author has benefited from numerous discussions with people in the online advertising industry including, in particular, Scot McLernon and Bruce Jaret, who were previously with CBS Digital Media. Research support was provided by Microsoft, for which the author expresses his gratitude.
One Main Street ● 3rd Floor ● Cambridge, MA 02142 t. 617.374.4700 ● f. 617.474.1339 ● www.marketplatforms.com
Market Platform Dynamics © 2008
2
ABSTRACT
Online advertising has grown rapidly in the last decade. It now accounts for almost a seventh of
all advertising spending and contributes to the preponderance of revenues for most websites. It is
projected to increase sharply as more consumers spend time online on their personal computers and as
additional devices such as mobile phones and televisions are connected to the web. This article
describes the market structure of the online advertising industry and several complex economic aspects
of it. Using the lens of the new economics of multi-sided platforms it examines search-based
advertising platforms, as well as platforms that facilitate the buying and selling of advertising space on
websites. The unique features of online advertising include the use of Internet-based technologies and
data collection mechanisms to target and track specific individuals, and to automate the buying and
selling of advertising inventory. Like modern finance, online advertising relies heavily on advanced
economic and statistical methods.
Market Platform Dynamics © 2008
3
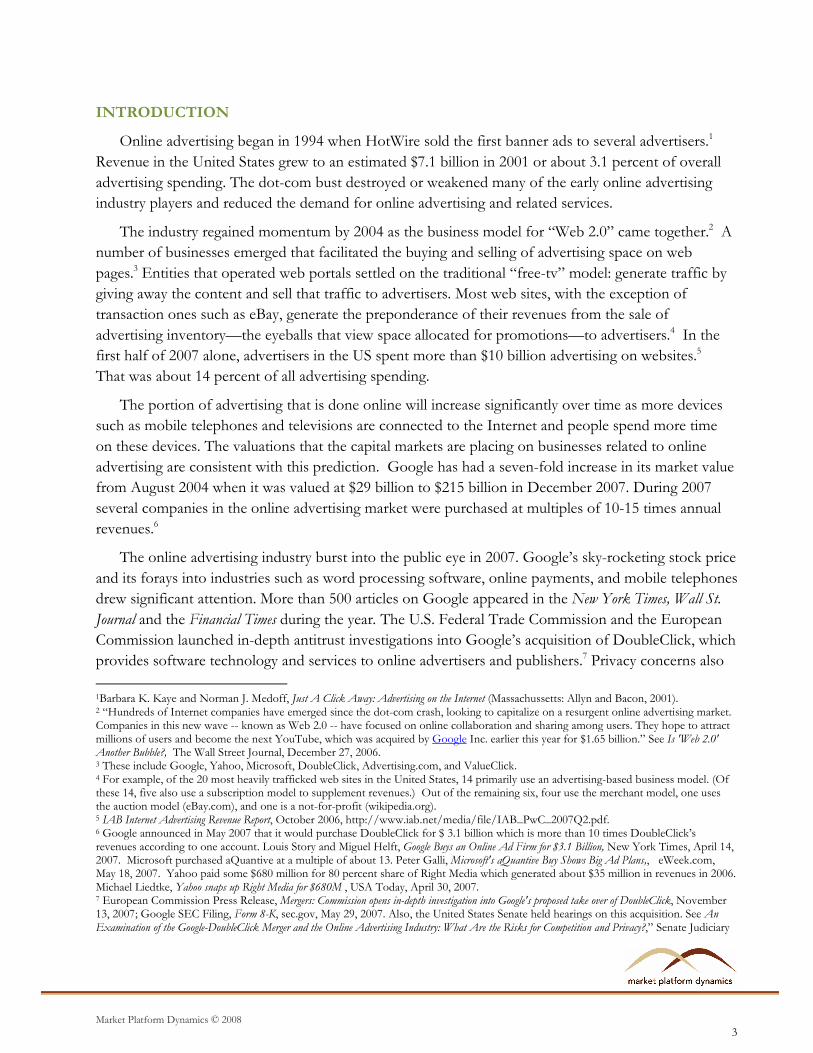
INTRODUCTION
Online advertising began in 1994 when HotWire sold the first banner ads to several advertisers.1
Revenue in the United States grew to an estimated $7.1 billion in 2001 or about 3.1 percent of overall
advertising spending. The dot-com bust destroyed or weakened many of the early online advertising
industry players and reduced the demand for online advertising and related services.
The industry regained momentum by 2004 as the business model for “Web 2.0” came together.2 A
number of businesses emerged that facilitated the buying and selling of advertising space on web
pages.3 Entities that operated web portals settled on the traditional “free-tv” model: generate traffic by
giving away the content and sell that traffic to advertisers. Most web sites, with the exception of
transaction ones such as eBay, generate the preponderance of their revenues from the sale of
advertising inventory—the eyeballs that view space allocated for promotions—to advertisers.4 In the
first half of 2007 alone, advertisers in the US spent more than $10 billion advertising on websites.5
That was about 14 percent of all advertising spending.
The portion of advertising that is done online will increase significantly over time as more devices
such as mobile telephones and televisions are connected to the Internet and people spend more time
on these devices. The valuations that the capital markets are placing on businesses related to online
advertising are consistent with this prediction. Google has had a seven-fold increase in its market value
from August 2004 when it was valued at $29 billion to $215 billion in December 2007. During 2007
several companies in the online advertising market were purchased at multiples of 10-15 times annual
revenues.6
The online advertising industry burst into the public eye in 2007. Google’s sky-rocketing stock price
and its forays into industries such as word processing software, online payments, and mobile telephones
drew significant attention. More than 500 articles on Google appeared in the New York Times, Wall St.
Journal and the Financial Times during the year. The U.S. Federal Trade Commission and the European
Commission launched in-depth antitrust investigations into Google’s acquisition of DoubleClick, which
provides software technology and services to online advertisers and publishers.7 Privacy concerns also
1Barbara K. Kaye and Norman J. Medoff, Just A Click Away: Advertising on the Internet (Massachussetts: Allyn and Bacon, 2001). 2 “Hundreds of Internet companies have emerged since the dot-com crash, looking to capitalize on a resurgent online advertising market. Companies in this new wave -- known as Web 2.0 -- have focused on online collaboration and sharing among users. They hope to attract millions of users and become the next YouTube, which was acquired by Google Inc. earlier this year for $1.65 billion.” See Is 'Web 2.0' Another Bubble?, The Wall Street Journal, December 27, 2006. 3 These include Google, Yahoo, Microsoft, DoubleClick, Advertising.com, and ValueClick. 4 For example, of the 20 most heavily trafficked web sites in the United States, 14 primarily use an advertising-based business model. (Of these 14, five also use a subscription model to supplement revenues.) Out of the remaining six, four use the merchant model, one uses the auction model (eBay.com), and one is a not-for-profit (wikipedia.org). 5 IAB Internet Advertising Revenue Report, October 2006, http://www.iab.net/media/file/IAB_PwC_2007Q2.pdf. 6 Google announced in May 2007 that it would purchase DoubleClick for $ 3.1 billion which is more than 10 times DoubleClick’s revenues according to one account. Louis Story and Miguel Helft, Google Buys an Online Ad Firm for $3.1 Billion, New York Times, April 14, 2007. Microsoft purchased aQuantive at a multiple of about 13. Peter Galli, Microsoft's aQuantive Buy Shows Big Ad Plans,, eWeek.com, May 18, 2007. Yahoo paid some $680 million for 80 percent share of Right Media which generated about $35 million in revenues in 2006. Michael Liedtke, Yahoo snaps up Right Media for $680M , USA Today, April 30, 2007. 7 European Commission Press Release, Mergers: Commission opens in-depth investigation into Google's proposed take over of DoubleClick, November 13, 2007; Google SEC Filing, Form 8-K, sec.gov, May 29, 2007. Also, the United States Senate held hearings on this acquisition. See An Examination of the Google-DoubleClick Merger and the Online Advertising Industry: What Are the Risks for Competition and Privacy?,” Senate Judiciary
Market Platform Dynamics © 2008
4
came to the fore in 2007 as consumers, government agencies and the media started focusing on the
massive amount of personal data that online advertising companies were storing and using.8
This article describes how the online advertising industry works, focusing on several complex
economic aspects of this business.9 Although the online advertising industry has revolutionized many
aspects of an age-old business, it is important to understand, as we present in Section 2, that the new
industry has much in common with the old. The unique features of online advertising include the use
of Internet-based technologies and data collection mechanisms to target and track specific individuals
and to automate the buying and selling of advertising inventory. Like modern finance, online
advertising relies heavily on advanced economic and statistical methods. These topics are discussed in
Section 3, which focuses on search-based advertising- the most well developed part of online
advertising business to date- and Section 4, which examines non-search based advertising, a rapidly
evolving part of the business. The online advertising industry is highly complex, undergoing a series of
rapid changes, and could well result in a high degree of concentration, if not monopoly, in the
intermediation of advertising inventory and the control of personal data. Section 5, presents
concluding remarks, and explains why the online advertising industry will remain at the center of public
policy debate for many years to come.
THE ADVERTISING BUSINESS
Advertising is designed to promote the sale of a product or service. It has been around in some
form since ancient times and occurs in many cultures. The business of presenting advertisements to
people became enormous during the 20th century with the development of various methods of mass
communication and the perfection of the advertiser-supported model for delivering content.
Advertising spending worldwide is over $625 billion a year, a number that exceeds worldwide spending
on wireless voice communication.10
Brief History
Outdoor advertisements were some of the earliest methods of promoting sales, with signs
appearing in Babylonia as far back as 3000 BC. The ruins of Pompeii have an ad that points travelers to
a tavern in a nearby town. A key innovation in the history of advertising was the insertion of ads into
media that attracted viewers. The first newspaper ad was reported to have occurred in 1672, offering a
reward for the return of 12 stolen horses. The Boston News-Letter began carrying ads in 1704.11
Committee, September 27, 2007. The FTC cleared the transaction on December 20, 2007. See Statement of Federal Trade Commission concerning Google/DoubleClick, FTC File No. 071-0170, http://www.ftc.gov/os/caselist/0710170/071220statement.pdf. 8 Vidya Ram, EU Turns Spotlight On Google, Forbes, May 28, 2007; Steve Lohr, Google Deal Said to Bring U.S. Scrutiny, New York Times, May 29, 2007; Darren Waters, Google privacy policy ‘is vague’, BBC News, May 31, 2007. 9 A companion article examines several issues of law and public policy, in particular competition policy, privacy rights, and copyrights, that arise in part because of the unique economic and technological characteristics of the industry. 10 Stuart Elliott, Forecasters Say Madison Avenue Will Escape a Recession, Just Barely, The New York Times, December 4, 2007. Stephen Minton, Worldwide Telecom Spending 2007–2011 Forecast: Worldwide Telecom Black Book, 2007, IDC, November 2007. 11 Advertising, Microsoft Encarta Online Encyclopedia 2007, http://encarta.msn.com/encyclopedia_761564279/Advertising.html.
Market Platform Dynamics © 2008
5
The advertising industry has developed at least in part as a result of media companies realizing—as
web sites have recently—that a profitable business model involves using content to attract viewers and
selling access to those viewers to advertisers. The magazine industry settled on this “two-sided” model
in the late 19th century.12 One of the leading publishers dropped its magazine price sharply to increase
circulation, and instead earned revenue from selling advertisements. Revenue and profits increased
from this pricing innovation. Most magazine publishers quickly followed, and today that is how most
earn their profits. The radio industry initially struggled with a subscription-based model, but several
stations discovered the power of advertising and the rest quickly followed. Television followed the
same path.13
Advertising agencies emerged in the mid 19th century as brokers between newspapers and
advertisers. The first agency started in 1841 in the United States. Its agents bought large amounts of
newspaper advertising space at a discounted price and then resold it to advertisers. At first the
advertisers designed the ads and the agency just placed them, but later on advertising agencies started
designing the ads and providing other services. The business model that eventually developed involved
giving creative and marketing services away in return for commission on the media buying. In more
recent times agencies have unbundled their intermediation services from their creative and marketing
services.
Role of Advertising
Although all advertising is ultimately designed to generate the sales of goods and services, it does so
in different ways. Some advertising is designed to generate sales directly by identifying “leads”.
Advertising in the yellow pages is an example. People who look up a type of service in the yellow pages
are generally interested in purchasing that service. The paid listings and advertisements in the yellow
pages are designed to encourage solid sales prospects to patronize the advertiser’s business. Other
advertising is informative. It provides consumers with information about prices and products, which
they can use to make purchasing decisions. Newspaper ads for supermarkets that list sale items and
their prices are an example. Still other advertising is about branding or altering people’s perceptions
about a product or service. The “Visa Is Life” television advertisements are an example of this. The
lines between lead-generation, information provision, and branding are blurry. The distinctions are
important for the discussion below, however, because online advertising has provided especially
innovative technology for generating leads.14
Pricing and Business Models
The most common pricing method in the advertising industry is based on cost per thousand
viewers. Newspaper, radio, and television advertisements are typically sold based on estimates of the
number of people with certain demographic characteristics who will view an ad that has been placed in 12 For an introduction to two-sided business models see, David S. Evans and Richard Schmalensee, Catalyst Code: The Strategies of the World’s Most Dynamic Companies (Massachusetts: Harvard Business School Press, 2007). The seminal economics paper in this area is Jean-Charles Rochet & Jean Tirole, Platform Competition in Two-Sided Markets, 1 J. OF EUR. ECON. ASS’N 990 (2003). 13Evans and Schmalensee, supra note 12; Microsoft Encarta supra note 11. 14 For a general introduction to the economics of advertising see Kyle Bagwell, The Economic Analysis of Advertising, Mark Armstrong and Rob Porter (eds.), Handbook of Industrial Organization, Vol. 3, North-Holland: Amsterdam, 2007, pp. 1701-1844.
Market Platform Dynamics © 2008
6
one of those media outlets. Television ad rates, for example, are largely determined by Nielsen Media
Research’s data on demographics and what is being viewed. Broadcasters and ad agencies negotiate
prices based on Nielsen’s numbers, and the outcomes of these negotiations in turn determines which
programs remain on the air.15 Furthermore, contracts between advertisers and TV networks usually
include a rating guarantee. Should ratings of the program in which the ad is shown fall short of the
agreed level, TV networks would provide extra ad time to the advertisers.16
Traditional media that use content to attract viewers have adopted two different models. In the
subscription/advertising model the publisher charges viewers a fee to obtain access to the content, and
advertisers a fee to obtain access to the viewers. Many newspapers and magazines follow this model.
They then balance the demand from advertisers and subscribers to maximize revenues. Some
magazines, e.g., the Economist, have adopted reader-friendly strategies with high reader fees but sparse
advertising. Others have adopted advertiser-friendly strategies, e.g., Vogue, with lower reader fees and
more advertising, some of which makes reading the magazine difficult. In the free-media model the
publishers do not charge viewers for access to the media at all, and in fact try to distribute the media as
widely as possible. They earn all of their revenues and profits from the sale of advertisements. Free
radio and television have embraced this model in the United States. However, there are many free
newspapers and magazines that have adopted the free-tv model. And pay-television and satellite radio
have adopted the mixed subscription/advertising model. These different business models are now
better understood as a result of the work on multi-sided platforms.17
The Online Advertising Industry
The online advertising industry concerns buying and selling advertising space that is accessed by
viewers through the Internet. Industry observers often divide the on-line advertising industry into: (1)
“search advertising” that appears on search-results pages; (2) “display advertising” that appears on non-
search web pages; (3) classified listings that appear on web sites; and (4) Internet e-mail based
advertisements. Tables 1a and 1b report U.S. advertising spending for 2006 in these categories, and
annual growth since 2002.
15 Franklin M. Fisher, John J. McGowan, and David S. Evans, The Audience Revenue Relationship for Local Broadcast Stations, Bell Journal of Economics (Autumn 1980); Nielsen Starts Watching the Ad Watchers, Journalism.org, November 2, 2006; Collecting and Processing the Data, Nielsen Media Research, http://www.nielsenmedia.com. 16 For example, “[I]f NBC Universal [did] not deliver the viewers it [had] promised advertisers, it would have to offer them compensatory commercial time…” (Stuart Elliott, Olympic-Size TV Audience for the Athens Games?, New York Times, August 13, 2004. Also “ABC, CBS, NBC, Fox and the CW network sold $9.3 billion in prime-time ads for this season. In the process, they sold about 80 percent of their time, holding back some to give advertisers should ratings fall short of guarantees.” (Meg James and Alana Semuels, Lower ratings could pinch TV ads, Los Angeles Times, December 12, 2007. 17 Rochet and Tirole, supra note 12; Simon Anderson and Régis Renault, Advertising Content, American Economic Review, 96(1), 93-113 (2006). Simon Anderson and Stephen Coate, Market Provision of Broadcasting: A Welfare Analysis, Review of Economic Studies, Vol 72, No. 4, October 2005, pp. 947-972.
Market Platform Dynamics © 2008
7
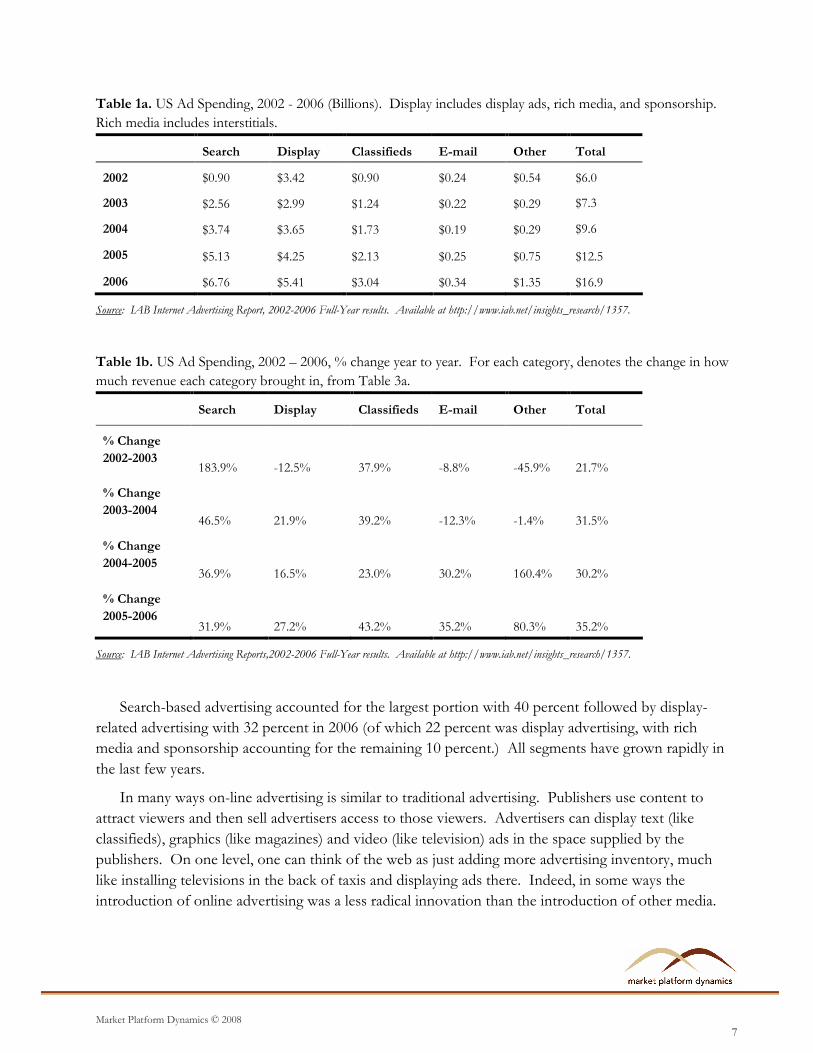
Table 1a. US Ad Spending, 2002 - 2006 (Billions). Display includes display ads, rich media, and sponsorship.
Rich media includes interstitials.
Search Display Classifieds E-mail Other Total
2002 $0.90 $3.42 $0.90 $0.24 $0.54 $6.0
2003 $2.56 $2.99 $1.24 $0.22 $0.29 $7.3
2004 $3.74 $3.65 $1.73 $0.19 $0.29 $9.6
2005 $5.13 $4.25 $2.13 $0.25 $0.75 $12.5
2006 $6.76 $5.41 $3.04 $0.34 $1.35 $16.9
Source: IAB Internet Advertising Report, 2002-2006 Full-Year results. Available at http://www.iab.net/insights_research/1357.
Table 1b. US Ad Spending, 2002 – 2006, % change year to year. For each category, denotes the change in how
much revenue each category brought in, from Table 3a.
Search Display Classifieds E-mail Other Total
% Change
2002-2003 183.9% -12.5% 37.9% -8.8% -45.9% 21.7%
% Change
2003-2004 46.5% 21.9% 39.2% -12.3% -1.4% 31.5%
% Change
2004-2005 36.9% 16.5% 23.0% 30.2% 160.4% 30.2%
% Change
2005-2006 31.9% 27.2% 43.2% 35.2% 80.3% 35.2%
Source: IAB Internet Advertising Reports,2002-2006 Full-Year results. Available at http://www.iab.net/insights_research/1357.
Search-based advertising accounted for the largest portion with 40 percent followed by display-
related advertising with 32 percent in 2006 (of which 22 percent was display advertising, with rich
media and sponsorship accounting for the remaining 10 percent.) All segments have grown rapidly in
the last few years.
In many ways on-line advertising is similar to traditional advertising. Publishers use content to
attract viewers and then sell advertisers access to those viewers. Advertisers can display text (like
classifieds), graphics (like magazines) and video (like television) ads in the space supplied by the
publishers. On one level, one can think of the web as just adding more advertising inventory, much
like installing televisions in the back of taxis and displaying ads there. Indeed, in some ways the
introduction of online advertising was a less radical innovation than the introduction of other media.
Market Platform Dynamics © 2008
8
After all, television enabled advertisers to reach mass audiences with video ads while the web is relying
on quite traditional methods of presentation.
Three drastic innovations, however, distinguish online from off-line advertising. The first has
transformed the service obtained by the advertiser: the Internet provides a highly efficient mechanism
for delivering ads to individual users and collecting information for targeting ads to those users. The
second has transformed the process of buying and selling advertising space: the Internet has enabled
the development of more efficient intermediation markets for advertising- the keyword bidding system
used for search and contextual advertising is the most mature example of this development. The third
is leading to economies of specialization: traditional publishers have integrated content provision for
attracting viewers with selling advertising space to advertisers; online publishers are increasingly turning
selling advertising space over to specialized advertising platforms.
As more advertising moves to Internet-connected devices these radical innovations will dramatically
alter the advertising ecosystem. These innovations are mainly affecting search and display advertising,
which we focus on below.
ADVERTISING ON SEARCH RESULTS PAGES
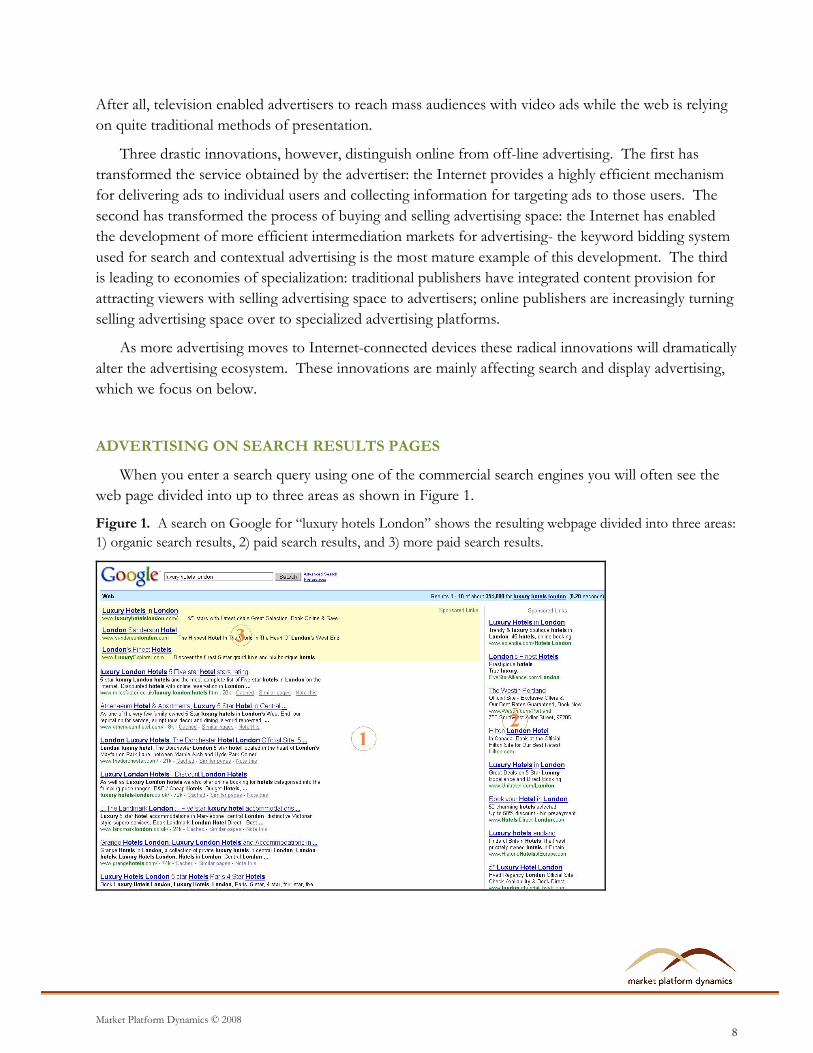
When you enter a search query using one of the commercial search engines you will often see the
web page divided into up to three areas as shown in Figure 1.
Figure 1. A search on Google for “luxury hotels London” shows the resulting webpage divided into three areas:
1) organic search results, 2) paid search results, and 3) more paid search results.
Market Platform Dynamics © 2008
9
The left-hand side of the screen displays the “organic search results”. These are based on an index
of the world-wide-web maintained by the search engine provider and selected based on algorithms that
rank their likely relevance to the search query term(s). The right-hand side of the screen displays “paid
search results,” which are listings sold by the search engine provider to advertisers. The top-left-hand
side of the screen above the organic search results may also include paid search results for some search
engines. A search query may generate a series of pages of search results, and each page may have ads
on the right-hand side if there have been buyers for the space.
A “search-based advertising platform” (search-ad platform for brevity) attracts viewers to its pages
largely by displaying the organic search results from its search engine. It allocates a portion of the page
for the purpose of selling advertising space, divides this place into slots (there are typically 8-10 per
page), and sells these slots to advertisers.18 There are two key technological innovations that underlie
this process, both of which depend on advanced economic and mathematical methods, and which
ultimately help determine the nature of the market structure.
Technological Underpinnings of Search-Based Advertising
Search-ad platforms use a “keyword bidding system.” Advertisers bid on search query terms
known as keywords. They can bid on individual keywords as well as combinations such as “hotel”,
“hotel in Boston”, “luxury hotel in Boston”, “hotel Beacon Hill,” and so on.19 The major commercial
search-ad platforms use a second-price auction with a reserve price for this auction.20 The price is
based on the charge for each time an Internet user clicks on the ad (“cost-per-click” or CPC). All else
equal, a higher bid price will secure a higher slot (one closer to the first slot at the top of the first page).
The bid itself does not, however, determine the slot that an ad is placed in, which brings us to the
second technological innovation. The search-ad platforms want to maximize the revenue they receive
from selling slots. Since they have chosen to charge based on CPC they need to take into account the
number of clicks that an ad will receive. They may earn more profits by putting ads with lower CPC
bids in higher slots if doing so generates more clicks than ads with higher CPC bids. To maximize
revenue the search-ad platform therefore needs to estimate the “click-through-rate” (CTR) for a search
ad bid and allocate the slots to bidders to maximize revenue. Google does this by estimating a “quality
score” for each bid that reflects the expected CTR. Estimating the CTR is especially difficult for
advertisers and keyword combinations for which the search-ad platform has no experience.
18 Many searchers are looking to buy something and therefore may value relevant advertising. It has been reported that about 40 percent of search queries involve potential commercial transactions. See Thomas Eisenmann, The Economics of Internet Advertising: Implications for the Google-DoubleClick Merger, Presentation for AEI-Brookings Joint Center, July 2007; see also Dai, et al, Detecting Online Commercial Intention, World Wide Web Conference, Edinburgh, Scotland, 2006. 19 When users bid on keywords, those keywords are set to a certain match option. These options include a broad match (which displays the ad when customers search for words in the keyword list in any order and possibly with other terms), a phrase match (which displays the ad when a customer's search query includes all keywords in the exact order given, even if the query has other terms that precede or follow the phrase), and an exact match (which makes an ad eligible when a search includes the specific keyword or phrase, in order, and without any other terms in the query). Negative keywords can also be added so that an ad will not be displayed if a search query contains a negative keyword. 20 See Benjamin Edelman, Michael Ostrovsky, and Michael Schwarz, Internet Advertising and the Generalized Second Price Auction: Selling Billions of Dollars Worth of Keywords, American Economic Review, v. 97(1), March 2007, pp.242-259.; Microsoft, What’s the Cost?, http://advertising.microsoft.com/search-advertising/cost. Also see Hal R. Varian, Position Auctions, Working paper, University of California, Berkeley, 2006.
Market Platform Dynamics © 2008
10
The keyword bidding process and the quality score algorithm together determine both the CPC
advertisers pay and the slots they receive. Search-ad platforms sometimes provide bidders guidance on
what they would have to pay to get particular slots. For example, Google reports that bidders would
have to pay an estimated $3.04 to get the third slot for “luxury hotels London” and $0.05 to get the
third slot for “competition economists.”21
These technologies affect the market structure in two ways as we will see below. First, the keyword
bidding system can give rise to demand-side scale economies. There is essentially a liquidity effect
arising from larger platforms having thicker markets for keywords. Second, platforms that have
superior technologies can earn more from additional searchers and therefore bid more for traffic
thereby accelerating positive feedback effects. Before discussing these features in more detail we survey
the current state of competition in the search-based advertising business.
Market Structure of Search-Based Advertising
Because search-based advertising is two-sided, one needs to examine the position of search-ad
platforms on their ability to generate search traffic as well as their ability to sell that search traffic to
advertisers. Considering these two dimensions, we begin by looking at the current structure of the
business and its evolution over time.
Market Structure in 2007
In the United States the search-based advertising business has three major players, as well as some
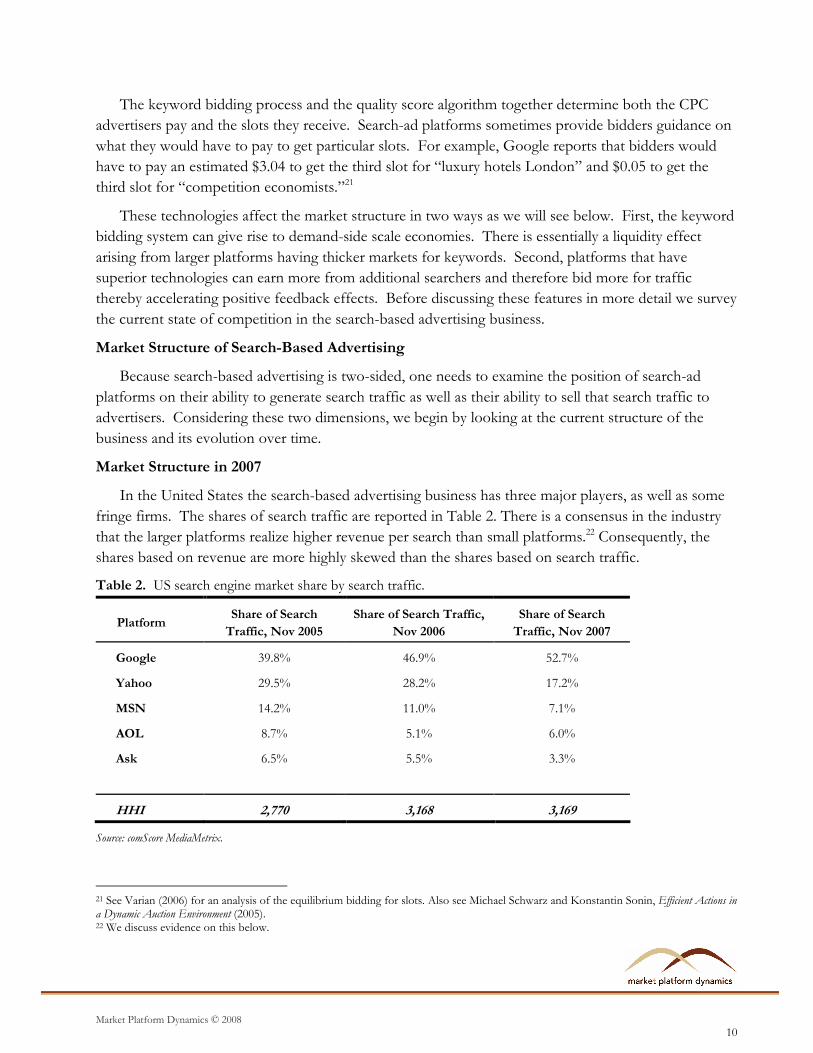
fringe firms. The shares of search traffic are reported in Table 2. There is a consensus in the industry
that the larger platforms realize higher revenue per search than small platforms.22 Consequently, the
shares based on revenue are more highly skewed than the shares based on search traffic.
Table 2. US search engine market share by search traffic.
Platform Share of Search
Traffic, Nov 2005
Share of Search Traffic,
Nov 2006
Share of Search
Traffic, Nov 2007
Google 39.8% 46.9% 52.7%
Yahoo 29.5% 28.2% 17.2%
MSN 14.2% 11.0% 7.1%
AOL 8.7% 5.1% 6.0%
Ask 6.5% 5.5% 3.3%
HHI 2,770 3,168 3,169
Source: comScore MediaMetrix.
21 See Varian (2006) for an analysis of the equilibrium bidding for slots. Also see Michael Schwarz and Konstantin Sonin, Efficient Actions in a Dynamic Auction Environment (2005). 22 We discuss evidence on this below.
Market Platform Dynamics © 2008
11
The industry is highly concentrated with an HHI of over 3,000 based on search traffic and higher
based on advertising revenue.23 The size distribution of firms is highly skewed. Measured by 2006
advertising revenue, the largest platform (Google) is more than two and a half times as large as the
second-largest platform (Yahoo).24 The rankings by search traffic are slightly less skewed.
Most consumers have, or can easily obtain a search engine. The typical computer comes with a
search toolbar preinstalled in the browser. A 2007 study examined PCs sold by OEMs who accounted
for at least 1 percent of U.S. home and small office sales in 2006. All of the PCs had a search toolbar
preinstalled, with Google having the greatest number of installations.25 It is also easy to add additional
search toolbars, such as the Windows Live Toolbar and the Yahoo! Toolbar. Thus, consumers can use
multiple search engines if they want and it is relatively easy to do so.26 On average, consumers use
roughly two search engines each month. That could come from their using multiple engines for the
same search, or different engines for different searches.27 My personal experience is that most
consumers use a single search engine primarily and tend to use other ones for idiosyncratic reasons.28
Thus in the remainder of the paper I will assume that users “single-home” on a search-ad platform
using the terminology from the two-sided platform literature.29
Advertisers use an average of 4.2 search-ad platforms.30 Advertisers pay only when consumers click
on their ads. The value of a click from one search engine is independent of the value of a click from
another search engine since these are almost certainly different lead opportunities. All else equal, there
is therefore no reason to pay for clicks only from a single search engine.31 The major incentive not to
use an additional search-ad platform is the cost of setting up that platform and monitoring ad
campaigns on it. Thus advertisers typically “multi-home” on a search-ad platform. We discuss these
fixed costs in more detail below because they have important implications for positive feedback effects.
23 The HHI is a standard measure of concentration used in merger analysis. It ranges from a high of 10,000 for a pure monopoly to 0 for a perfectly competitive industry. Industries with HHIs in excess of 1,800 are considered to be sufficiently concentrated that US antitrust authorities look closely at mergers in these industries. See Federal Trade Commission, 1992 Horizontal Merger Guidelines[with April 8, 1997, Revisions to Section 4 on Efficiencies], http://www.ftc.gov/bc/docs/horizmer.shtm. 24 Neither Google nor Yahoo break out their search advertising revenues from their contextual advertising revenues, so this ratio is for both search and contextual advertising combined. Google’s worldwide 2006 search and contextual advertising revenue is estimated at $10.5 billion and Yahoo’s worldwide 2006 search and contextual advertising revenue is estimated at $3.7 billion. Estimates come from the Lehman Brothers Internet Data Book, April 2007, pp. 81, 85. The Google to Yahoo ratio based on these revenue figures is about 2.8, while the ratio for search traffic of Google to Yahoo’s in November 2007 was 1.7. 25 Google was found on three of the seven PCs, Yahoo! on two, AOL on one, and Windows Live on one. 26 Google has programmed its search toolbar to make it difficult for users to easily switch. When a user attempts to change the default search, Google blocks the switch by default and briefly displays a notification in the bottom right corner of the screen. If the user clicks on the notification before it disappears, a popup window provides the user with the option to disable Google’s “default search protection”. This does not appear to be the case for Yahoo or Microsoft. 27 There are also “meta” search engines such as Excite, Dogpile, and Metacrawler that deliver results from several engines. These are not widely used as of 2007. 28 My personal experience is reinforced by conversations with the founders of a company that provides incentives for Internet users to switch engines. 29 Rochet and Tirole, supra note 12. 30 This varies based on advertiser size as a result of the fixed costs we discuss below. 31 This statement is not meant to suggest that there are no substitution possibilities from the standpoint of the advertiser. Search generates leads which can translate into sales with some probability. However, advertisers have a number of different methods available to them to generate leads of which search-based advertising is only one way. We would expect that advertisers will invest in different methods of lead generation up to the point where the returns are equalized at the margin. They may therefore increase their investment in platforms that have lower CPCs than platforms that have higher CPCs for given keywords.
Market Platform Dynamics © 2008
12
Evolution of Market Structure
Search-based advertising started in 1995 when Infoseek, one of the earlier search engines for the
web, began to target banner ads in their system to the keywords users entered. The cost-per-click
(CPC) model was introduced in a deal Proctor and Gamble struck with Yahoo in 1996.32 In 1998,
GoTo.com introduced the first clearly marked ads alongside organic search results and charged
advertisers for these ads based on CPC. GoTo.com became Overture which in turn became Yahoo’s ad
search platform. Other search engines quickly followed this model. Google launched AdWords in
2000, which was similar to GoTo but distinguished the ads from the organic search results more
clearly.33
Thus far there have been two leaders in search-based advertising. Although Infoseek started the
search-ad business in 1995 no real leader emerged until 1999. Yahoo held the top spot from 1999 to
2002. Google displaced Yahoo in 2003 and has held the lead ever since. Google’s page rank algorithm,
used to decide which results to present to a searcher, has been described as the “crucial part of
Google’s inner sanctum, a department called ‘search quality’ that the company treats like a state
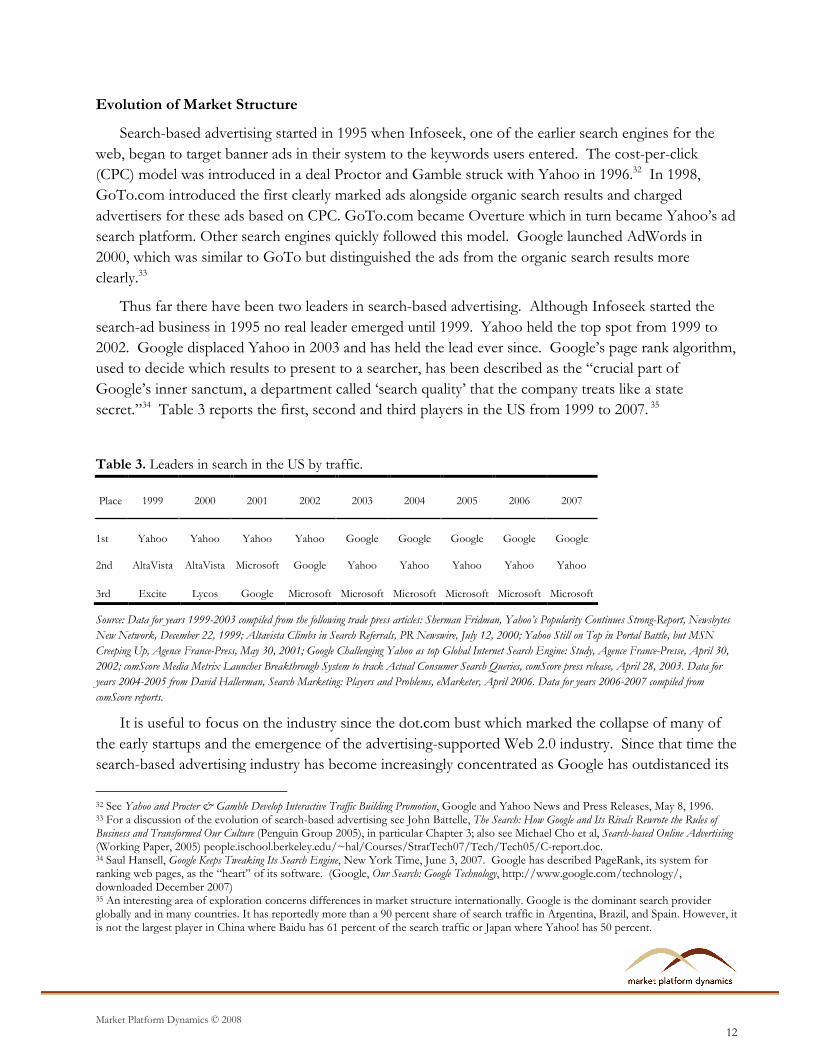
secret.”34 Table 3 reports the first, second and third players in the US from 1999 to 2007. 35
Table 3. Leaders in search in the US by traffic.
Place 1999 2000 2001 2002 2003 2004 2005 2006 2007
1st Yahoo Yahoo Yahoo Yahoo Google Google Google Google Google
2nd AltaVista AltaVista Microsoft Google Yahoo Yahoo Yahoo Yahoo Yahoo
3rd Excite Lycos Google Microsoft Microsoft Microsoft Microsoft Microsoft Microsoft
Source: Data for years 1999-2003 compiled from the following trade press articles: Sherman Fridman, Yahoo’s Popularity Continues Strong-Report, Newsbytes
New Network, December 22, 1999; Altavista Climbs in Search Referrals, PR Newswire, July 12, 2000; Yahoo Still on Top in Portal Battle, but MSN
Creeping Up, Agence France-Press, May 30, 2001; Google Challenging Yahoo as top Global Internet Search Engine: Study, Agence France-Presse, April 30,
2002; comScore Media Metrix Launches Breakthrough System to track Actual Consumer Search Queries, comScore press release, April 28, 2003. Data for
years 2004-2005 from David Hallerman, Search Marketing: Players and Problems, eMarketer, April 2006. Data for years 2006-2007 compiled from
comScore reports.
It is useful to focus on the industry since the dot.com bust which marked the collapse of many of
the early startups and the emergence of the advertising-supported Web 2.0 industry. Since that time the
search-based advertising industry has become increasingly concentrated as Google has outdistanced its
32 See Yahoo and Procter & Gamble Develop Interactive Traffic Building Promotion, Google and Yahoo News and Press Releases, May 8, 1996. 33 For a discussion of the evolution of search-based advertising see John Battelle, The Search: How Google and Its Rivals Rewrote the Rules of Business and Transformed Our Culture (Penguin Group 2005), in particular Chapter 3; also see Michael Cho et al, Search-based Online Advertising (Working Paper, 2005) people.ischool.berkeley.edu/~hal/Courses/StratTech07/Tech/Tech05/C-report.doc. 34 Saul Hansell, Google Keeps Tweaking Its Search Engine, New York Time, June 3, 2007. Google has described PageRank, its system for ranking web pages, as the “heart” of its software. (Google, Our Search: Google Technology, http://www.google.com/technology/, downloaded December 2007) 35 An interesting area of exploration concerns differences in market structure internationally. Google is the dominant search provider globally and in many countries. It has reportedly more than a 90 percent share of search traffic in Argentina, Brazil, and Spain. However, it is not the largest player in China where Baidu has 61 percent of the search traffic or Japan where Yahoo! has 50 percent.
Market Platform Dynamics © 2008
13
rivals. In the US, the HHI based on search traffic increased slightly, from under 2,800 in November
2005 to over 3,100 in November 2007. The gap between Google and rest of the search firms has
increased much more substantially—the ratio of the largest firm (Google) to the next largest (Yahoo)
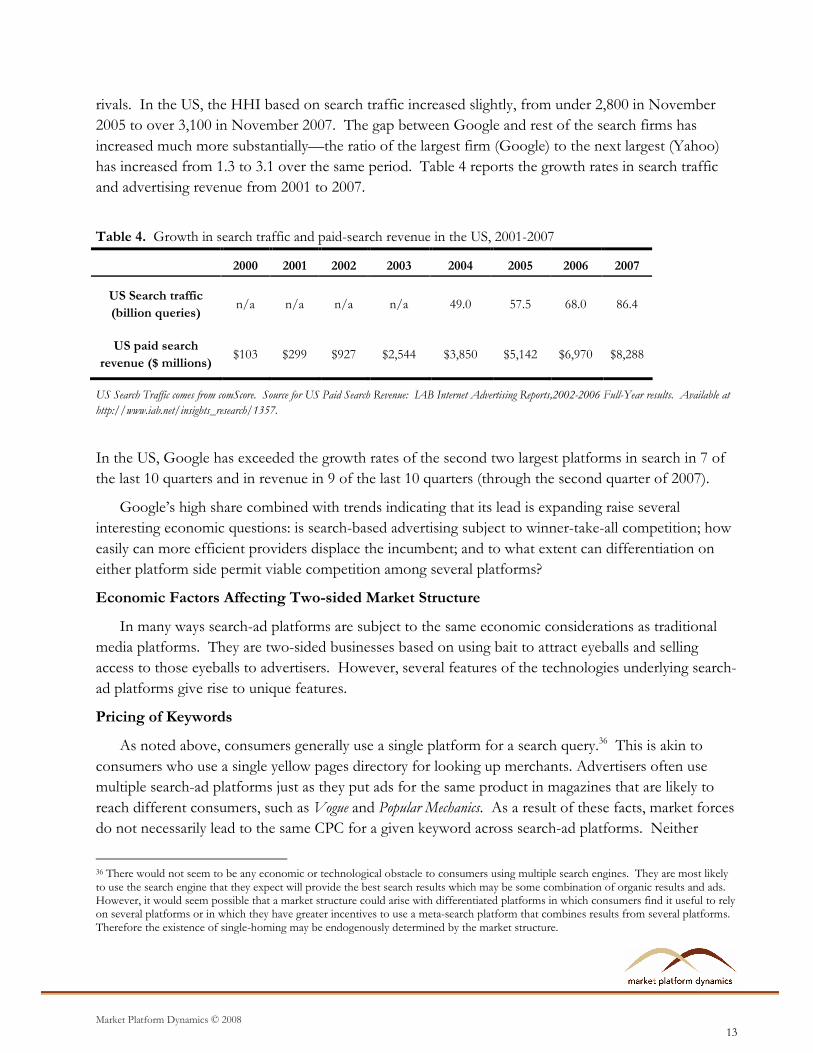
has increased from 1.3 to 3.1 over the same period. Table 4 reports the growth rates in search traffic
and advertising revenue from 2001 to 2007.
Table 4. Growth in search traffic and paid-search revenue in the US, 2001-2007
2000 2001 2002 2003 2004 2005 2006 2007
US Search traffic
(billion queries) n/a n/a n/a n/a 49.0 57.5 68.0 86.4
US paid search
revenue ($ millions) $103 $299 $927 $2,544 $3,850 $5,142 $6,970 $8,288
US Search Traffic comes from comScore. Source for US Paid Search Revenue: IAB Internet Advertising Reports,2002-2006 Full-Year results. Available at
http://www.iab.net/insights_research/1357.
In the US, Google has exceeded the growth rates of the second two largest platforms in search in 7 of
the last 10 quarters and in revenue in 9 of the last 10 quarters (through the second quarter of 2007).
Google’s high share combined with trends indicating that its lead is expanding raise several
interesting economic questions: is search-based advertising subject to winner-take-all competition; how
easily can more efficient providers displace the incumbent; and to what extent can differentiation on
either platform side permit viable competition among several platforms?
Economic Factors Affecting Two-sided Market Structure
In many ways search-ad platforms are subject to the same economic considerations as traditional
media platforms. They are two-sided businesses based on using bait to attract eyeballs and selling
access to those eyeballs to advertisers. However, several features of the technologies underlying search-
ad platforms give rise to unique features.
Pricing of Keywords
As noted above, consumers generally use a single platform for a search query.36 This is akin to
consumers who use a single yellow pages directory for looking up merchants. Advertisers often use
multiple search-ad platforms just as they put ads for the same product in magazines that are likely to
reach different consumers, such as Vogue and Popular Mechanics. As a result of these facts, market forces
do not necessarily lead to the same CPC for a given keyword across search-ad platforms. Neither
36 There would not seem to be any economic or technological obstacle to consumers using multiple search engines. They are most likely to use the search engine that they expect will provide the best search results which may be some combination of organic results and ads. However, it would seem possible that a market structure could arise with differentiated platforms in which consumers find it useful to rely on several platforms or in which they have greater incentives to use a meta-search platform that combines results from several platforms. Therefore the existence of single-homing may be endogenously determined by the market structure.
Market Platform Dynamics © 2008
14
consumers nor advertisers are making marginal substitution decisions between a given keyword on
different platforms. If the CPC for “flat panel televisions in Chicago” was higher on platform 1 than
on platform 2, a Chicago television retailer would still use both platforms so long as the CPC was worth
the value of the lead generated.37
The CPC is ultimately determined by the keyword bidding auction on each platform. Those
auctions could result in similar CPCs for given query terms if there were the same bidders, the auction
rules were similar, and the values of leads for different platforms were similar. We would expect, as
noted above, that platforms that attract fewer bidders for keywords would tend to have lower CPCs for
those keywords. We would also expect that platforms that have less efficient auctions, or generate less
valuable leads would have lower CPCs for given keywords.
In fact, there are significant differences in CPCs for keywords across the search-ad platforms.
None of the platforms reports these measures, but industry estimates generally place Google
significantly above Yahoo. One estimate places Google’s worldwide CPC at around $2.00, nearly three
times its estimate of Yahoo’s CPC of around $0.75.38 It is possible that these differences are partly the
result of compositional effects and do not reflect just differences in the CPCs for given keywords. That
would be the case if Google tended to get more clicks on more valuable keywords.
The Role of Indirect Network Effects
It might appear that indirect network effects are insignificant for search-ad platforms, if they are
present at all.39 An advertiser only pays when a consumer clicks on his ad. That value does not depend
on whether any other consumer on the platform clicks on the ad. The advertiser should therefore be
indifferent to using a platform with few or many searchers so long as the value exceeds the cost of each
click the advertiser gets. Searchers do not benefit in any obvious way from other searchers. So long as
they obtain the information they are looking for they do not care whether the search provider has many
or few searchers. They probably value search-ad platforms that have more ads. But given that
advertisers are indifferent, the density of ads on search pages should not vary depending on the number
37 In reality there are a variety of ways to generate leads, beyond search-ad platforms, and there may be some substitution between these different methods. Moreover, there may be diminishing returns to the value of leads for a variety of reasons including diseconomies of scale in production and distribution. 38See Not Out of the Woods But A Step In The Right Direction, Bear Stearns, October 17, 2007. Other estimates of revenue per search (RPS), which is equal to the CPC times the CTR for each search (not the CTR for each advertiser), place Google substantially above Yahoo. Mark Mahaney, an analyst in Citigroup, estimated that in 2006 Google made 4.5 cents to 5 cents on every search, while Yahoo generated only 2.5 cents to 3 cents a search (See Miguel Helft, A Long-Delayed Ad System Has Yahoo Crossing Its Fingers, New York Times, February 5, 2007); Caris & Co. analyst Tim Boyd estimates that Yahoo made on average between 10¢ and 11¢ per search in 2006, and Google made between 19¢ and 21¢ per search (See Catherine Holahan, Why Yahoo’s Paname Won’t Be Enough, BusinessWeek, Dec 26, 2006); Justin Post, an analyst with Merrill Lynch, estimated that in 2006, each US search generates 4¢ for Yahoo and 11¢ for Google (See Robert D. Hershey Jr., Sunny and Gloomy Signs at a Web Crossroads, New York Times, Nov 19, 2006.); A recent article states that most analysts estimate that Yahoo!'s RPS is about 30 percent less than Google’s (See Henry Blodget, The Real Reason Yahoo’s Revenue Per Search Stinks, Silicon Alley Insider, Oct 2, 2007.). The differences between these estimates is likely due to whether one looks at searches only within the U.S. or worldwide, and whether one looks at only searches for which there are ads or all searches. But within each estimate, Google is placed significantly above Yahoo. 39 Although search-ad platforms have to make investments in developing search engines and other technologies it does not appear that there are significant scale economies that would, by themselves, limit the market to one or just a few players. Search-ad platforms are readily scalable by adding servers and communication. Eisenmann estimates that a search-based advertising platform could break even with about 7.5 percent of the global market. See Eisenmann, supra note 16.
Market Platform Dynamics © 2008
15
of searches. This view, however, ignores key features of transaction platforms that would appear to
lead to strong indirect network effects.
Search-ad platforms are similar to other transaction platforms that seek to match buyers with sellers
and consummate trades. With more buyers there is a higher likelihood that a seller will find a suitable
match that will lead to a beneficial sale, and with more sellers there is a higher likelihood that a buyer
will find a suitable match that will lead to a beneficial purchase. The importance of “liquidity”—the
volume of buyers and sellers that could reach mutually profitable trades—is well documented for
exchanges.40 Without enough liquidity markets are too thin and unsustainable.
In the case of search-ad platforms the advertisers are the buyers of access to Internet users while
the searchers are selling that access through the ad search platform. More advertisers and more
searches increase the likelihood of profitable matches given that advertisers and searchers are
heterogeneous. It is useful to consider why in more detail.
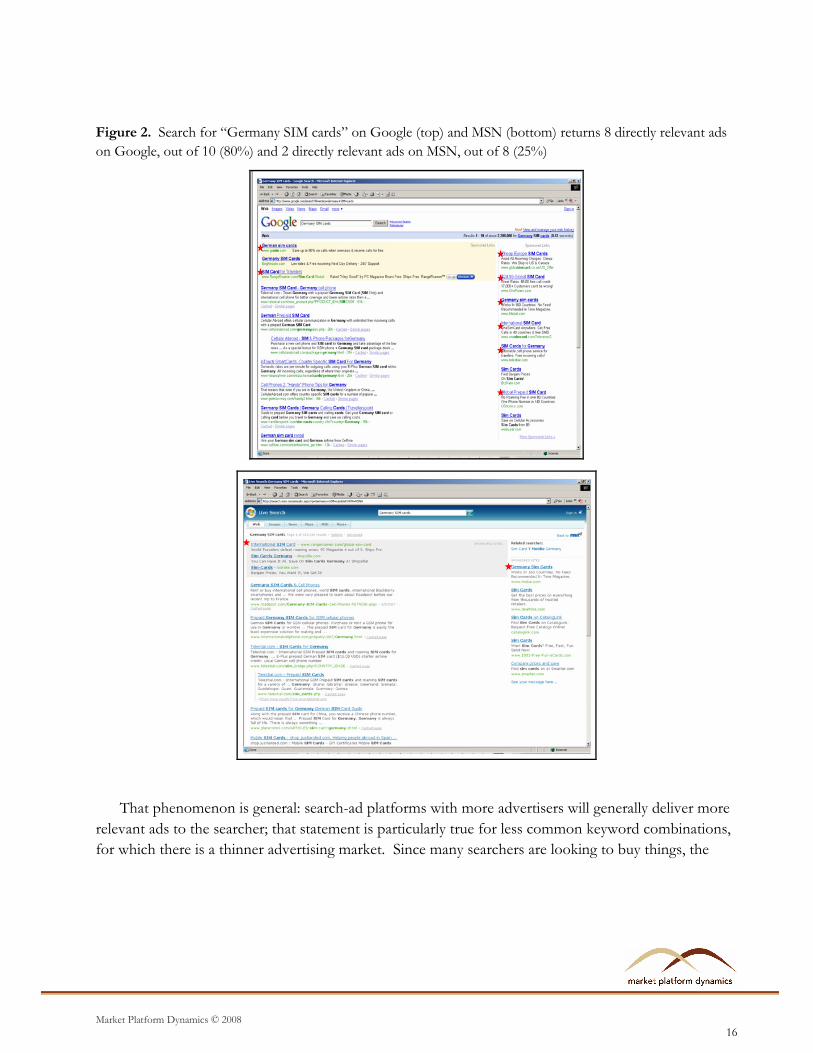
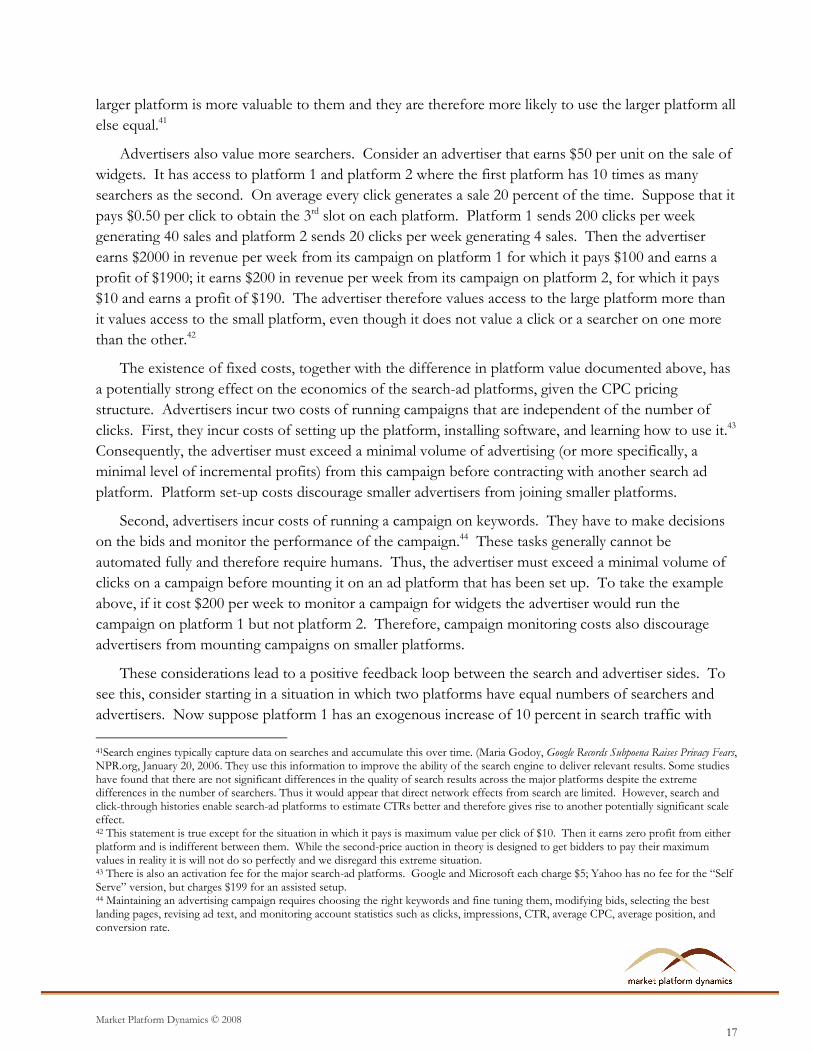
Searchers obtain more relevant ads when there are more advertisers. Suppose an individual is in
Germany and needs a SIM card. She types in “Germany SIM cards” into Google. On September 26,
2007 she will see ten ads of which eight are directly relevant to her query. If she types the same query
into the smaller MSN on that same day she will see eight ads of which two are directly relevant to her
query. Figure 2 presents the screenshot of the two search engine results.
40 See, for example, Kenneth D. Garbade and William L. Silber, Structural Organization of Secondary Markets: Clearing Frequency, Dealer Activity and Liquidity Risk, The Journal of Finance, Vol. 34, No. 3 (June 1979), pp.577-593; See also Nicholas Economides, Network Economics with Application to Finance, Financial Markets, Institutions & Instruments, Vol. 2, No. 5 (1993a), pp. 89-97.
Market Platform Dynamics © 2008
16
Figure 2. Search for “Germany SIM cards” on Google (top) and MSN (bottom) returns 8 directly relevant ads
on Google, out of 10 (80%) and 2 directly relevant ads on MSN, out of 8 (25%)
That phenomenon is general: search-ad platforms with more advertisers will generally deliver more
relevant ads to the searcher; that statement is particularly true for less common keyword combinations,
for which there is a thinner advertising market. Since many searchers are looking to buy things, the
Market Platform Dynamics © 2008
17
larger platform is more valuable to them and they are therefore more likely to use the larger platform all
else equal.41
Advertisers also value more searchers. Consider an advertiser that earns $50 per unit on the sale of
widgets. It has access to platform 1 and platform 2 where the first platform has 10 times as many
searchers as the second. On average every click generates a sale 20 percent of the time. Suppose that it
pays $0.50 per click to obtain the 3rd slot on each platform. Platform 1 sends 200 clicks per week
generating 40 sales and platform 2 sends 20 clicks per week generating 4 sales. Then the advertiser
earns $2000 in revenue per week from its campaign on platform 1 for which it pays $100 and earns a
profit of $1900; it earns $200 in revenue per week from its campaign on platform 2, for which it pays
$10 and earns a profit of $190. The advertiser therefore values access to the large platform more than
it values access to the small platform, even though it does not value a click or a searcher on one more
than the other.42
The existence of fixed costs, together with the difference in platform value documented above, has
a potentially strong effect on the economics of the search-ad platforms, given the CPC pricing
structure. Advertisers incur two costs of running campaigns that are independent of the number of
clicks. First, they incur costs of setting up the platform, installing software, and learning how to use it.43
Consequently, the advertiser must exceed a minimal volume of advertising (or more specifically, a
minimal level of incremental profits) from this campaign before contracting with another search ad
platform. Platform set-up costs discourage smaller advertisers from joining smaller platforms.
Second, advertisers incur costs of running a campaign on keywords. They have to make decisions
on the bids and monitor the performance of the campaign.44 These tasks generally cannot be
automated fully and therefore require humans. Thus, the advertiser must exceed a minimal volume of
clicks on a campaign before mounting it on an ad platform that has been set up. To take the example
above, if it cost $200 per week to monitor a campaign for widgets the advertiser would run the
campaign on platform 1 but not platform 2. Therefore, campaign monitoring costs also discourage
advertisers from mounting campaigns on smaller platforms.
These considerations lead to a positive feedback loop between the search and advertiser sides. To
see this, consider starting in a situation in which two platforms have equal numbers of searchers and
advertisers. Now suppose platform 1 has an exogenous increase of 10 percent in search traffic with
41Search engines typically capture data on searches and accumulate this over time. (Maria Godoy, Google Records Subpoena Raises Privacy Fears, NPR.org, January 20, 2006. They use this information to improve the ability of the search engine to deliver relevant results. Some studies have found that there are not significant differences in the quality of search results across the major platforms despite the extreme differences in the number of searchers. Thus it would appear that direct network effects from search are limited. However, search and click-through histories enable search-ad platforms to estimate CTRs better and therefore gives rise to another potentially significant scale effect. 42 This statement is true except for the situation in which it pays is maximum value per click of $10. Then it earns zero profit from either platform and is indifferent between them. While the second-price auction in theory is designed to get bidders to pay their maximum values in reality it is will not do so perfectly and we disregard this extreme situation. 43 There is also an activation fee for the major search-ad platforms. Google and Microsoft each charge $5; Yahoo has no fee for the “Self Serve” version, but charges $199 for an assisted setup. 44 Maintaining an advertising campaign requires choosing the right keywords and fine tuning them, modifying bids, selecting the best landing pages, revising ad text, and monitoring account statistics such as clicks, impressions, CTR, average CPC, average position, and conversion rate.
Market Platform Dynamics © 2008
18
platform 2 holding steady. That will result in some advertisers joining platform 1 that had previously
found it unprofitable to join either platform, and in some advertisers mounting campaigns on platform
1 that they had previously decided not to mount on either platform. Platform 1 now has more relevant
ads for searchers. We would expect that some searchers would switch from platform 1 to platform 2.
That in turn would increase the volume of advertising on platform 1. One could go through the same
argument with an exogenous increase in advertising on the other platform. In both cases the effect of
an advantage on one side becomes magnified as a result of the positive feedback effects.
Platform 1 obtains a further advantage as it obtains more advertisers. As a result of the keyword
bidding system, an increase in advertisers may increase the bids on keywords. Consider first a situation
in which we would expect the two platforms to secure identical CPCs. Platforms 1 and 2 have the same
20 bidders interested in 10 slots; the slots are as valuable on platform 1 as on platform 2; and the
keyword auction is equally efficient in the sense of getting the bidders to reveal their highest values. In
this case we would expect the auction to result in the same bids for the same slots. Now suppose that
the number of advertisers on platform 1 increases exogenously by two advertisers, while the number of
advertisers on platform 2 is unchanged. If the new advertisers are situated similarly to the existing
advertisers (e.g., if they are all drawn from the same distribution), then it is likely that one of the new
advertiser’s optimal bid will place it in one of the top 10 slots. Suppose, for example, the new
advertiser falls into the sixth slot. This has two main positive revenue effects for the platform. First,
the new advertisers in slots 6 through 10 all have higher bids than before (because the new 10th place
slot is taken by the advertiser previously in slot 9, and so on). With the higher bids come higher
payments to the platform. The second effect comes from the new advertiser in slot 6 having a higher
bid than the prior advertiser in slot 6. This higher bid increases the bid of every advertiser in slots 1
through 5, because their optimal bids depend (positively) on the level of the bidder below them.45
Positive feedback effects alone would tend to lead one ad search platform to achieve a
monopoly position.46 The largest platform would always realize the highest CPC and provide the
largest overall value to searchers and advertisers in the aggregate. The platform that provided the
highest quality search engine for users and ad platform for advertisers would necessarily win the
market. We would, expect, though, that these positive feedback effects would diminish with the size of
the platform. That is because the value of additional bidders decline and more keywords would have
thick markets.
The Role of Rent Extraction and Ad Placement
Another difference between search-ad platforms concerns the revenue-per-search (RPS) they obtain
for comparable search traffic and keyword bids. Platform 2 could realize a higher RPS than platform 1
even though both have the same amount of search and advertiser demand. That could happen if
45 See Varian, supra note 25. 46 This is the classic tipping story for markets with indirect network effects. See Brian Arthur, Increasing Returns and the New World of Business, Harvard Business Review 74 (July–August 1996): 100–109; Michael Katz and Carl Shapiro, Systems Competition and Network Effects. Journal of Economic Perspectives 8 (Spring 1994): 93–115. Tipping does not occur in many real-world markets as discussed in David S. Evans and Richard Schmalensee, The Industrial Organization of Markets Based on Two-Sided Platforms, Competition Policy International, Spring 2007.
Market Platform Dynamics © 2008
19
platform 2 was better at extracting value from advertisers due to having a more efficient keyword
auction, or if platform 2 was better at predicting CTR, and therefore in maximizing revenue from page
placement. Together, these advantages would enable platform 2 to obtain a higher CPC for a given
keyword and to obtain a higher CTR by offering more relevant ads to searchers. (We refer to this as an
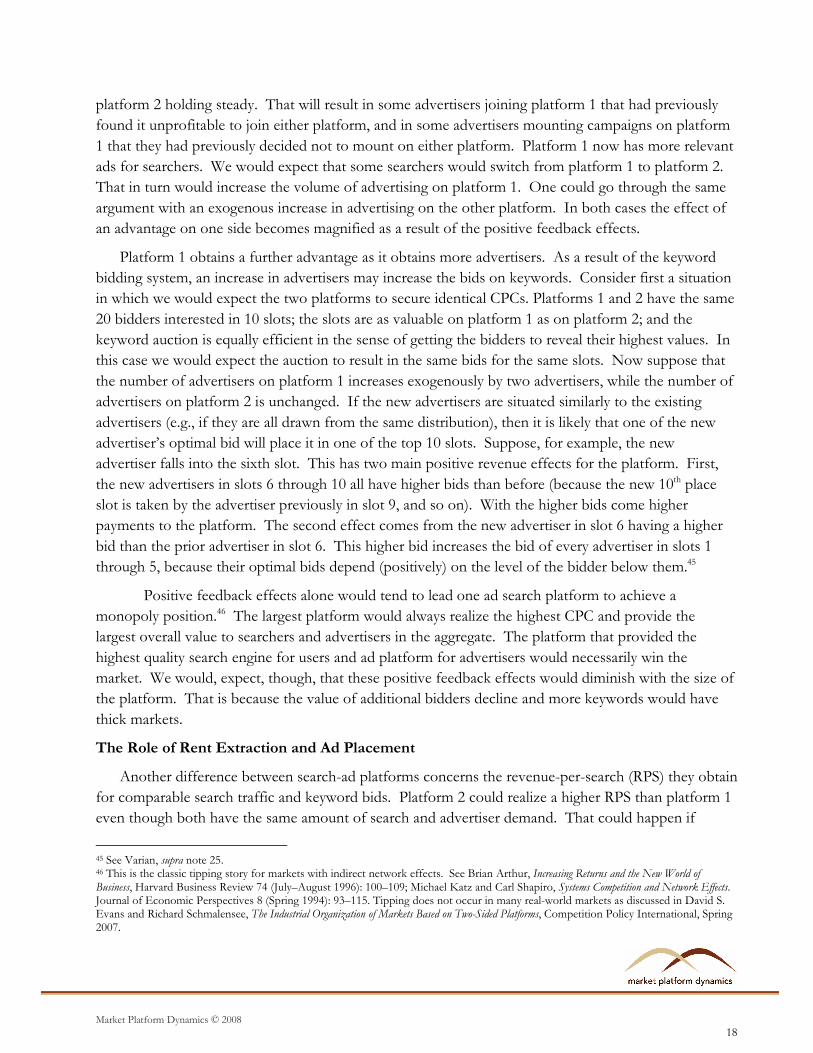
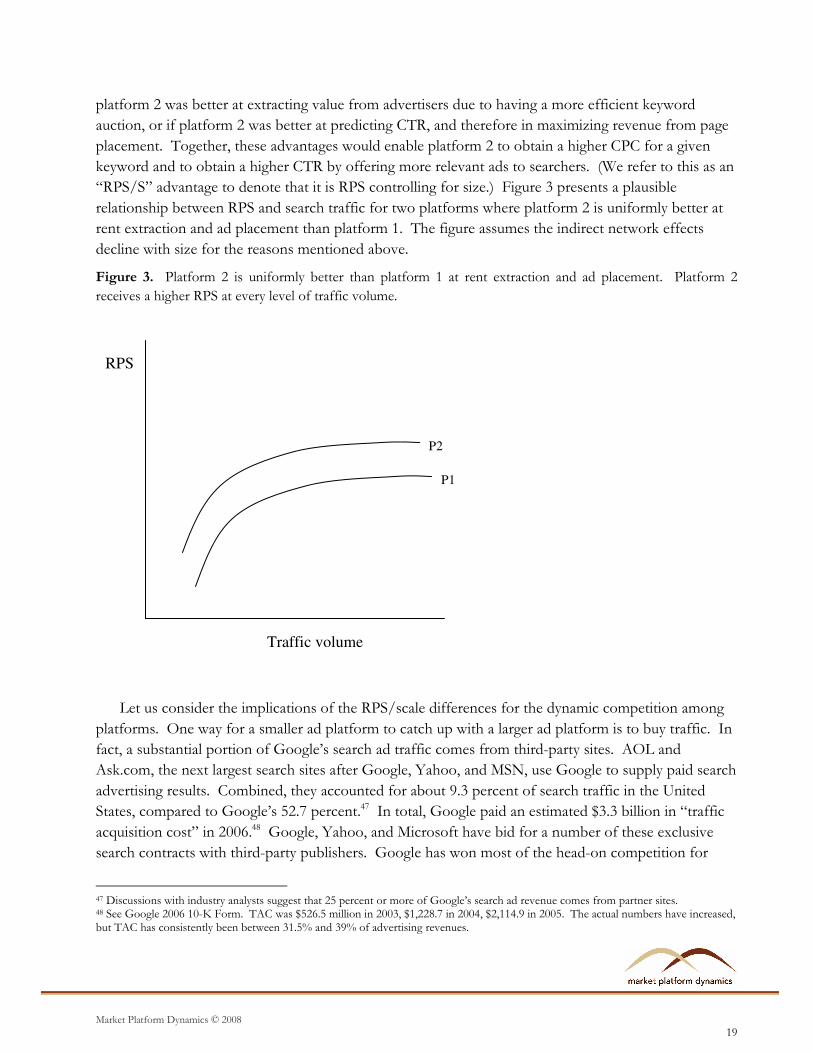
“RPS/S” advantage to denote that it is RPS controlling for size.) Figure 3 presents a plausible
relationship between RPS and search traffic for two platforms where platform 2 is uniformly better at
rent extraction and ad placement than platform 1. The figure assumes the indirect network effects
decline with size for the reasons mentioned above.
Figure 3. Platform 2 is uniformly better than platform 1 at rent extraction and ad placement. Platform 2
receives a higher RPS at every level of traffic volume.
Let us consider the implications of the RPS/scale differences for the dynamic competition among
platforms. One way for a smaller ad platform to catch up with a larger ad platform is to buy traffic. In
fact, a substantial portion of Google’s search ad traffic comes from third-party sites. AOL and
Ask.com, the next largest search sites after Google, Yahoo, and MSN, use Google to supply paid search
advertising results. Combined, they accounted for about 9.3 percent of search traffic in the United
States, compared to Google’s 52.7 percent.47 In total, Google paid an estimated $3.3 billion in “traffic
acquisition cost” in 2006.48 Google, Yahoo, and Microsoft have bid for a number of these exclusive
search contracts with third-party publishers. Google has won most of the head-on competition for
47 Discussions with industry analysts suggest that 25 percent or more of Google’s search ad revenue comes from partner sites. 48 See Google 2006 10-K Form. TAC was $526.5 million in 2003, $1,228.7 in 2004, $2,114.9 in 2005. The actual numbers have increased, but TAC has consistently been between 31.5% and 39% of advertising revenues.
RPS
P1
P2
Traffic volume
Market Platform Dynamics © 2008
20
which public data is available. For example, of the top 10 web sites that offer sponsored search results,
and are not operated by firms that also own search engines, 8 use Google to provide paid search
results.49
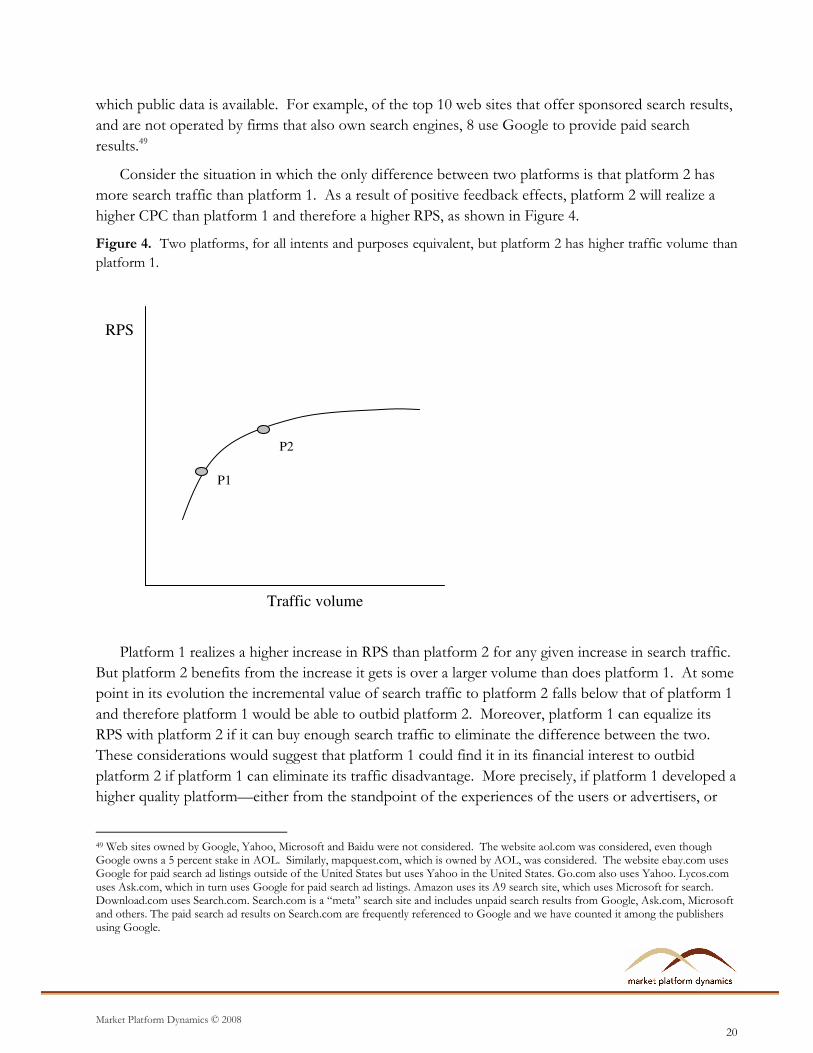
Consider the situation in which the only difference between two platforms is that platform 2 has
more search traffic than platform 1. As a result of positive feedback effects, platform 2 will realize a
higher CPC than platform 1 and therefore a higher RPS, as shown in Figure 4.
Figure 4. Two platforms, for all intents and purposes equivalent, but platform 2 has higher traffic volume than
platform 1.
Platform 1 realizes a higher increase in RPS than platform 2 for any given increase in search traffic.
But platform 2 benefits from the increase it gets is over a larger volume than does platform 1. At some
point in its evolution the incremental value of search traffic to platform 2 falls below that of platform 1
and therefore platform 1 would be able to outbid platform 2. Moreover, platform 1 can equalize its
RPS with platform 2 if it can buy enough search traffic to eliminate the difference between the two.
These considerations would suggest that platform 1 could find it in its financial interest to outbid
platform 2 if platform 1 can eliminate its traffic disadvantage. More precisely, if platform 1 developed a
higher quality platform—either from the standpoint of the experiences of the users or advertisers, or
49 Web sites owned by Google, Yahoo, Microsoft and Baidu were not considered. The website aol.com was considered, even though Google owns a 5 percent stake in AOL. Similarly, mapquest.com, which is owned by AOL, was considered. The website ebay.com uses Google for paid search ad listings outside of the United States but uses Yahoo in the United States. Go.com also uses Yahoo. Lycos.com uses Ask.com, which in turn uses Google for paid search ad listings. Amazon uses its A9 search site, which uses Microsoft for search. Download.com uses Search.com. Search.com is a “meta” search site and includes unpaid search results from Google, Ask.com, Microsoft and others. The paid search ad results on Search.com are frequently referenced to Google and we have counted it among the publishers using Google.
RPS
P1
P2
Traffic volume
Market Platform Dynamics © 2008
21
from the viewpoint of the auction and page-rank methods—it could profitably expand traffic to offset
platform 2’s scale advantage.
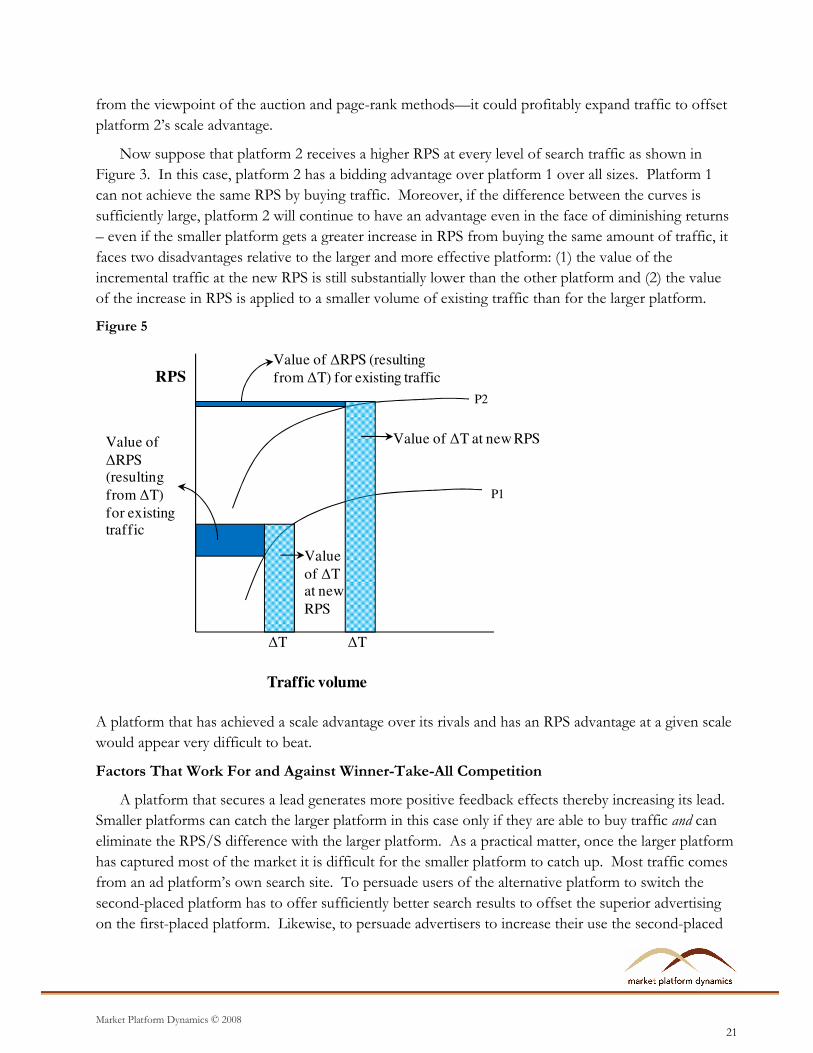
Now suppose that platform 2 receives a higher RPS at every level of search traffic as shown in
Figure 3. In this case, platform 2 has a bidding advantage over platform 1 over all sizes. Platform 1
can not achieve the same RPS by buying traffic. Moreover, if the difference between the curves is
sufficiently large, platform 2 will continue to have an advantage even in the face of diminishing returns
– even if the smaller platform gets a greater increase in RPS from buying the same amount of traffic, it
faces two disadvantages relative to the larger and more effective platform: (1) the value of the
incremental traffic at the new RPS is still substantially lower than the other platform and (2) the value
of the increase in RPS is applied to a smaller volume of existing traffic than for the larger platform.
Figure 5
RPS
P1
P2
Traffic volume
Value of ∆T at new RPS
Value
of ∆T
at new
RPS
Value of
∆RPS
(resulting
from ∆T)
for existing
traffic
∆T ∆T
Value of ∆RPS (resulting
from ∆T) for existing traffic
A platform that has achieved a scale advantage over its rivals and has an RPS advantage at a given scale
would appear very difficult to beat.
Factors That Work For and Against Winner-Take-All Competition
A platform that secures a lead generates more positive feedback effects thereby increasing its lead.
Smaller platforms can catch the larger platform in this case only if they are able to buy traffic and can
eliminate the RPS/S difference with the larger platform. As a practical matter, once the larger platform
has captured most of the market it is difficult for the smaller platform to catch up. Most traffic comes
from an ad platform’s own search site. To persuade users of the alternative platform to switch the
second-placed platform has to offer sufficiently better search results to offset the superior advertising
on the first-placed platform. Likewise, to persuade advertisers to increase their use the second-placed
Market Platform Dynamics © 2008
22
platform despite having less traffic it has to subsidize or otherwise lower their fixed costs of managing
campaigns. Neither effort appears to be impossible, but both seem daunting.
The existence of positive-feedback effects does not, however, lead most multi-sided markets to
converge to monopoly as observed by Evans and Schmalensee (2007). Moreover, although firms
secure quality advantages over each other in most real-world markets it does not appear that positive-
feedback effects together with quality differences typically result in winner-take-all competition.
Multiple competing platforms emerge when it is possible for smaller platforms to differentiate
themselves from the leading platform, and from each other.
To see how such differentiation works in practice it is useful to consider three close analogies to
search-ad platforms. Most traditional media markets have multiple players. That results from market
segmentation in which media firms aggregate particular kinds of consumers and sell access to these
consumers to advertisers for whom those consumers are particularly valuable. The magazine industry
has taken this to the greatest extreme as inspection of any magazine stand demonstrates.50 Financial
markets have traditionally supported a few competing exchanges, although the move to electronic
transactions has led to some consolidation. There is currently global competition among exchanges.51
Another two-sided market where we would expect monopolies is the yellow pages market. For most
parts of the US however this is not the case. Although the local phone companies dominate some
markets, private publishers have a significant presence in the most markets. In particular about 60
percent of submarkets have at least two yellow pages publishers, with roughly 25 percent of submarkets
having more than 2 publishers.52
It remains to be seen whether ad search providers can differentiate enough to sustain a market
structure that is not dominated by a single player. At this stage in the market evolution, it appears that
search-based advertising is heading towards a single winner through some combination of positive
feedback effects and RPS/S advantages. Google has increased its lead in search and advertisers each
year since 2002. It has achieved a more than 75 percent share of search in 10 of the 15 countries for
which data were analyzed.53,54 The fact that it currently receives a CPC that is more than 2 times larger
than its nearest rival also suggests that it has a significant RPS advantage over its rivals that enables it to
bid more than its rivals for incremental traffic.55 And finally, Google has won most of the significant
competitions to provide search toolbars or paid search listings on websites in the last couple of years,
including a deal with AOL, one of the largest search sites of any significance besides Google, Yahoo
50 For example Future, plc is a UK company that focuses on specialized magazines. These include Cross Stitcher, Guitarist, PC Gamer, Fast Car, Revolver, Mountain Biking UK, and Disney Girl. 51 Worldwide, the top exchanges for public equities are NYSE Euronext, NASDAQ, London Stock Exchange, and Tokyo Stock Exchange. In 2006, NYSE Group had the highest value of shares traded which accounted for 31 percent of all traded shares, while NASDAQ accounted for 17 percent, London SE for 11 percent and Tokyo SE for 8 percent. (See http://www.world-exchanges.org/WFE/home.asp?menu=406&document=4144.) Among the leading futures and options markets, the leading exchanges in 2006 were the Korea Exchange with 21 percent of contracts, Eurex with 13 percent, Chicago Mercantile Exchange with 12 percent, Chicago Board of Trade with 7 percent and Euronext.liffe with 6 percent. (See http://www.futuresindustry.org/downloads/fimag/2007/marapr/mar-apr_volume.pdf.) 52 Mark Rysman, Competition Between Networks: A Study of the Market for Yellow Pages, Review of Economic Studies (2004). 53 Source; comScore, “qSearch 2.0 Key Measures Report,” November 2007. 54 The fact that Yahoo lost its lead in search is of course not consistent with a pure positive feedback explanation for Google’s success. 55 See supra 37.
Market Platform Dynamics © 2008
23
and Microsoft, which operate their own search ad platforms.56 These facts would suggest that the
positive feedback and RPS/S effects are very strong. Challenging Google would require reducing the
RPS/S differential, strongly differentiating platforms, and reducing the scale advantage through traffic
acquisition.
ADVERTISING ON PUBLISHER WEBSITES
There were more than 96 million active domains in the world as of December 2007. Worldwide,
there are over 19 thousand websites that have a global reach greater than 0.05 percent. In November
2007, those sites had over 810 million unique visitors.57 All of these web sites have the opportunity to
make space available for ads and to charge advertisers for the eyeballs that view their ads. Almost all
websites with significant traffic have ads. Most websites derive most of their revenue from selling ads.
This section focuses on web publishers that are in the traditional advertising business of generating
content to attract viewers and then selling access to those viewers to advertisers. These web publishers
include traditional media companies such as The New York Times and CNN that have established online
extensions, new media companies such as You Tube, blogs such as technorati.com,58 and social
network sites such as Facebook. They also include web portals that operate their own ad platforms
including MSN and Yahoo.59
The display advertising business has a highly complex ecosystem. Part A provides an overview.
Part B discusses behavioral targeting of ads which is the key technology underlying this part of the
online advertising industry. Part C describes the current market structure and how it may evolve over
time. Part D discusses possible evolutionary paths for this business.
Overview of the Online Display Advertising Business
Web publishers create advertising inventory by designing their web pages, which are written in
HTML, to accept graphical, text, or video ads in various portions of the page.60 These portions of the
page are reserved for ads and usually include code that permits the insertion of advertising on a real-
time basis from various sources. Because of the necessary coding most websites do not change the
56 Google also has deals with Fox, AOL, IAC and Dell. On August 7, 2006, Google and Fox Interactive Media entered into a multi-year contract making Google “the exclusive search and keyword targeted advertising sales provider for Fox Interactive Media.” As part of the agreement Google will pay Fox at least $900 million so long as Fox is able to meet given traffic requirements and other commitments. See http://www.google.com/press/pressrel/ir_20060807.html. In December 2005, Google concluded a $1 billion deal with AOL which among other things would allow “AOL… to sell additional ads for its search engine also [which is] powered by Google.” See http://www.news.com/AOL-to-stick-with-Google/2100-1030_3-5998600.html. Google and IAC (the parent company of Ask.com) extended their sponsored search and advertising agreement in a move which is worth an estimated $3.5 Billion to IAC over the next 5 years. See http://www.nytimes.com/2007/11/06/technology/06diller.html. Dell also recently (May 2006) concluded a deal with Google which “means millions of Dell computers will leave the factories with Google software already installed on them.” See http://news.bbc.co.uk/2/hi/technology/5019416.stm. 57 Source: comScore My Metrix report, November 2007. 58 David S. Evans, Economics of the Blogosphere, The Catalyst Code, August 6, 2007, http://www.thecatalystcode.com/theconversation/blog/2007/08/06/economics-of-the-blogosphere/. 59 Search-engines are a special type of publishers. They use search result pages to attract viewers and then sell access to these viewers to advertisers. 60 Web pages can also include languages such as JavaScript that generate HTML code when a page is called.
Market Platform Dynamics © 2008
24
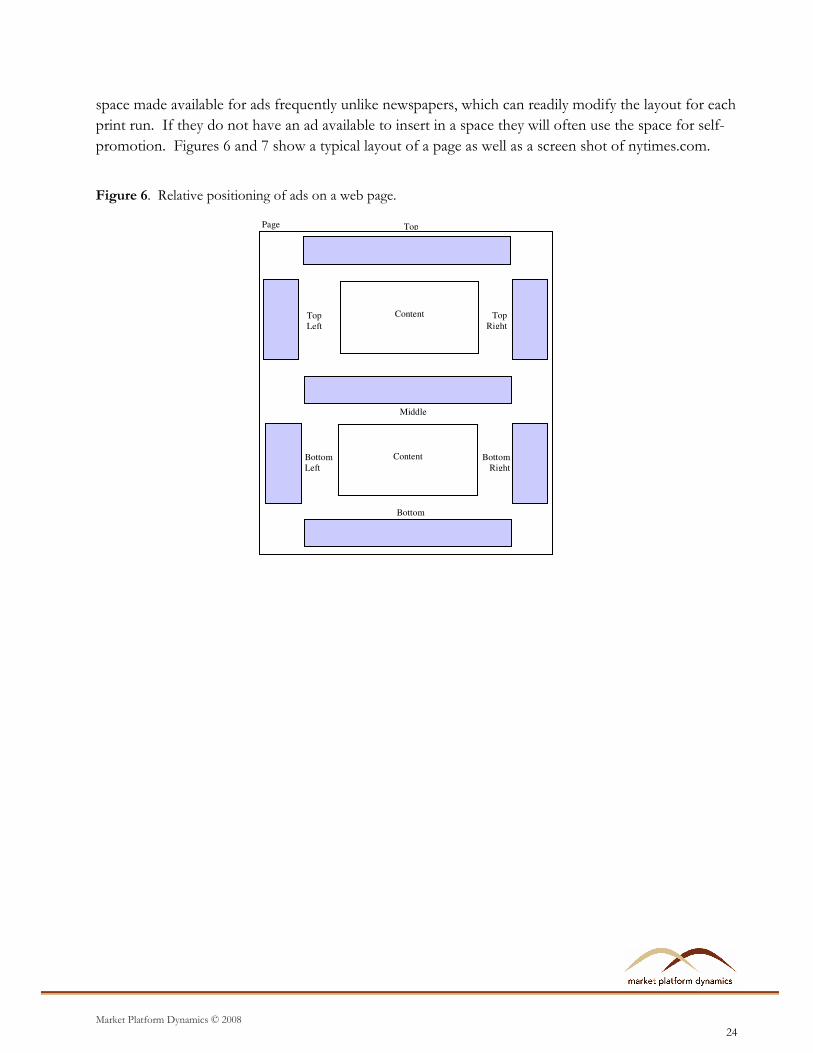
space made available for ads frequently unlike newspapers, which can readily modify the layout for each
print run. If they do not have an ad available to insert in a space they will often use the space for self-
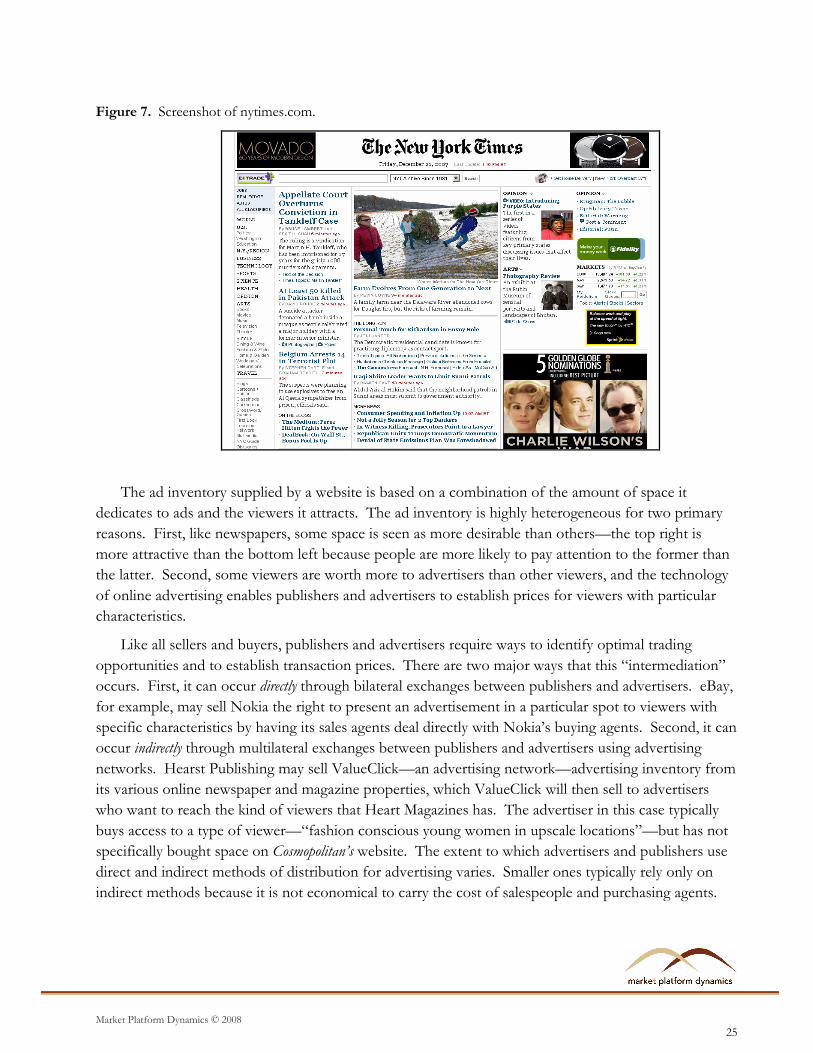
promotion. Figures 6 and 7 show a typical layout of a page as well as a screen shot of nytimes.com.
Figure 6. Relative positioning of ads on a web page.
Bottom
Top
Middle
Top
Left
Top
Right
Bottom
Right
Bottom
Left
Page
Content
Content
Market Platform Dynamics © 2008
25
Figure 7. Screenshot of nytimes.com.
The ad inventory supplied by a website is based on a combination of the amount of space it
dedicates to ads and the viewers it attracts. The ad inventory is highly heterogeneous for two primary
reasons. First, like newspapers, some space is seen as more desirable than others—the top right is
more attractive than the bottom left because people are more likely to pay attention to the former than
the latter. Second, some viewers are worth more to advertisers than other viewers, and the technology
of online advertising enables publishers and advertisers to establish prices for viewers with particular
characteristics.
Like all sellers and buyers, publishers and advertisers require ways to identify optimal trading
opportunities and to establish transaction prices. There are two major ways that this “intermediation”
occurs. First, it can occur directly through bilateral exchanges between publishers and advertisers. eBay,
for example, may sell Nokia the right to present an advertisement in a particular spot to viewers with
specific characteristics by having its sales agents deal directly with Nokia’s buying agents. Second, it can
occur indirectly through multilateral exchanges between publishers and advertisers using advertising
networks. Hearst Publishing may sell ValueClick—an advertising network—advertising inventory from
its various online newspaper and magazine properties, which ValueClick will then sell to advertisers
who want to reach the kind of viewers that Heart Magazines has. The advertiser in this case typically
buys access to a type of viewer—“fashion conscious young women in upscale locations”—but has not
specifically bought space on Cosmopolitan’s website. The extent to which advertisers and publishers use
direct and indirect methods of distribution for advertising varies. Smaller ones typically rely only on
indirect methods because it is not economical to carry the cost of salespeople and purchasing agents.
Market Platform Dynamics © 2008
26
Let us concentrate on large web publishers, which account for the preponderance of advertising
revenue and large advertisers, which account for the preponderance of online spending. 61 A significant
part of the advertising inventory bought and sold by these large advertisers and publishers involves
bilateral exchange. Large publishers either have direct sales forces or hire third-party sales reps to sell
their ad inventory. Likewise, large advertisers have purchasing agents or, more often, use media buyers
at their advertising agency to purchase ad inventory. Advertising inventory sold this way is said to be
“reserved”. Large publishers often sell their “premium ad space” this way.
Large publishers often also rely on other intermediaries—usually advertising networks—to sell ad
inventory indirectly that they have not “reserved” for advertisers directly. Publishers may use ad
networks because they are more efficient than a direct sales force for some, or all, of their ad inventory;
or because they have excess inventory that they have not sold directly, perhaps because of spikes in
viewers. Advertisers use ad networks because it is another way to reach viewers. Hard estimates are
difficult to come by, but advertisers and publishers I have talked to seem to agree that somewhere
around 30 percent of advertising revenue for large publishers is sold indirectly, as well as more than 50
percent of advertising impressions (the number of viewers of an ad); this figure appears to vary
significantly across publishers depending on the way they have chosen to manage their advertising
business. On average, advertising inventory sold indirectly costs less than advertising inventory sold
directly because the space is less desirable than the directly sold space.62
There are several aspects of advertisers’ management of their online campaigns, as well as
publishers’ management of their sales of advertising inventory. As discussed previously, advertisers and
publishers need intermediation services. For bilateral exchanges they may use some combination of in-
house and third-party providers, while for multilateral exchanges they mainly use advertising networks.
Advertisers and publishers likewise need management, reporting, and technology solutions. These tend
to be server-based software that can help manage advertising inventory and campaigns that may involve
millions of ad impressions (that is, views of an ad by an individual) a day. These server-based software
tools are highly sophisticated mission-critical applications.
Large publishers usually use a publisher tool such as DoubleClick’s DART for Publishers
(DFP).63,64 This tool is typically hosted on a web server maintained by the provider. The publisher
hardcodes links to the publisher tool to fill the ad space for which it wants to use the management,
reporting, and serving capabilities of the publisher tool. It will also typically integrate the publisher tool
into many other aspects of the website technology and business practices. As an example of how such
publisher tools are used, consider a visit to cnn.com. When the entertainment page of cnn.com is
clicked, a decision is made as to which ad to present to the user and, once chosen, the ad is displayed so
61 Large publisher refers to one which is sufficiently large to use stand-alone tools to serve their directly sold ads and any remnant ads sold through non-integrated and/or integrated ad networks. This includes at least the top 500 publishers, and accounts for the majority of advertising revenues. Smaller publishers do not find it economically efficient to hire direct sales forces. They usually rely on an ad network to sell their ad inventory. 62 The average masks considerable variation of course with premium space increasingly being sold indirectly as targeting technologies improve. 63 See http://www.doubleclick.com/products/dfp/index.aspx. 64 A handful of mega-large web publishers such as MSN have their own proprietary tools but most others use a third-party tool.
Market Platform Dynamics © 2008
27
the user can see it as the publisher earns some money. The publisher—in this case cnn.com—uses its
publisher tools to check whether the particular ad space that the user is about to see has been
“reserved”, and if not, whether there is an ad network that can fill that inventory space. The publisher
tool then retrieves the chosen ad, or directs the advertiser or ad network’s server to retrieve the ad,
which is then shown to the user. This entire process happens in the blink of an eye. Publishers will
typically only use one publisher tool (i.e., they “single-home” on tools).
Large advertisers and advertising agencies often have an advertiser tool such as aQuantive’s
AdManager or DoubleClick’s DART for Advertisers (DFA).65 Large advertisers typically manage
advertising on hundreds of websites and across numerous products using many methods of online
advertising. This tool helps them manage these various campaigns. Advertisers usually use one
advertiser tool, although advertising agencies may use several. However, single-homing does appear to
be the norm.
A few providers offer more or less complete solutions for advertisers and publishers. Google’s
AdSense/AdWords platform is one of these. Publishers can hardcode ad space to Google’s AdSense66
which takes care of everything – selling the inventory, managing the ad space, serving ads to the viewer,
and sending the publisher a portion of the proceeds after taking a commission.67 Advertisers, likewise,
can buy space from the Google Content Network68 through AdWords69 (which bundles Google’s
search-based and contextual-based advertising products). Yahoo! and Microsoft offer similar all-
inclusive solutions. These solutions have all resulted from leveraging the technologies developed for
search-based advertising – especially the keyword bidding auctions – to the buying and selling of
publisher ad inventory. Some other ad networks are also integrated to lesser degrees; they may offer
publishers serving technologies so that publishers can hardcode an ad network into a particular space.
Many large publishers use an integrated platform for contextual ads and an unintegrated platform
(based on a particular publisher tool) for non-contextual ads; the unintegrated platform is used to
access multiple standalone ad networks, as well as ads sold directly.
Online advertising is highly differentiated. It comes in different forms such as graphic ads that mix
pictures and text, all text ads, and video ads; appears in different places on websites; and is targeted to
viewers in various ways. It is also bought and sold in different ways which leads to differentiation in
terms of the distribution channels used by advertisers and publishers. The underlying economics and
drivers of substitution are fairly straightforward. Publishers are interested in maximizing the rate of
return on investment in their ad inventory. Advertisers are interested in maximizing the rate of return
on investment from their advertising spending, which ultimately means getting consumers to buy
65 See http://www.atlassolutions.com/services.aspx and http://www.doubleclick.com/products/dfa/index.aspx. 66 See https://www.google.com/adsense/login/en_US/. 67 In the online advertising Traffic Acquisitions Costs (TAC) refers to what an advertising platform pays for traffic. Google pays TAC to publishers in return for contributing their advertising inventory to the Google Content Network. The publisher receives TAC. In this case 1-TAC is the percent commission paid by the publisher to Google for selling its ad inventory. If Google pays the publisher 80 percent of the revenue that Google receives from the advertiser, the publisher has paid a commission of 20 percent to Google. 68 See https://adwords.google.com/select/afc.html. 69 See http://adwords.google.com/select/Login.
Market Platform Dynamics © 2008
28
things. Advertiser and publisher decisions on ROI are interlinked because of the two-sided structure of
the industry.
The Use of Data and Targeting
The key technological difference between traditional display advertising and online display
advertising involves the ability to target ads to particular consumers. In the traditional advertising
industry targeting is primarily accomplished through the development of media that use content to
attract particular socioeconomic and demographic groups. Some media are designed to reach a broad
demographic such as people between 25 and 49 (American prime time television) while others target
niches such as men who are interested in fishing (Fly Fisherman). Advertisements that appear in those
traditional media reach all of the individuals who view them. Thus a beer advertisement during the
Superbowl will be watched by people who do not drink and an ad for women’s accessories in Vogue will
be seen by men who are reading one of the articles. In the online advertising industry it is possible to
use various data that can target particular types of individuals. Moreover, the ad space on a particular
web page can be customized to each viewer. People that click on the same site at the same time may
see different ads for that reason.
Currently, advertisers and publishers do not engage in much more targeting than do traditional
media. Coca Cola may target its banner ad to a particular time of day or geography but nothing much
more sophisticated than that. The technology for targeting is, however, advancing very rapidly and may
radically alter the advertising business.
There are three sources of information that are used for this purpose. First, the IP address for each
visitor to a publisher’s website is seen by the website and by the advertising technology it employs. IP
addresses are typically held in blocks by internet service providers (ISPs). Geolocation databases use
this information to provide the likely geographic location of a user, such as the country, state, and/or
city.70,71 The IP address plus time of day can be used to target people who live in particular types of
areas (e.g. high-income area in cold climates) who are looking at a web site on Monday morning.
Second, the ad technologies for websites insert “cookies” onto users’ personal computers. These
cookies keep track of a variety of information including the web pages that the individual has visited.
This information can be used to infer characteristics of an individual, such as whether they have been
looking to buy a new car or are planning for a wedding.72 Third, because people’s IP addresses are
captured through various sources it is possible, at least in principle, to correlate these IP addresses with
various other information about these individuals, possibly even determining precisely who they are.
Targeting technologies use a combination of IP addresses, time of day data, and at least some
additional information collected from cookies to target advertisements. (This information is used in
70 See, e.g., http://www.ip2location.com/. 71 There can be errors using this methodology, because the geolocation database may be inaccurate, or because a user on an internal company network for example, may be in a different physical location than the location at which her company gets its IP connection. IP targeting is nevertheless viewed as reliable enough that publishers typically offer it and advertisers commonly buy ad inventory based on it. 72 The search engines also maintain histories of searches. Some privacy groups have expressed concerns that Google’s acquisition of DoubleClick will enable it to also use this search history data, perhaps in combination with DoubleClick’s cookie data, to target advertisements to individuals.
Market Platform Dynamics © 2008
29
conjunction with information on the web site itself, such as whether it is geared towards individuals
interested in sports or finance.) The advertiser will typically buy ad inventory that has specified
characteristics based on this information. One can think of the advertiser as buying a specific set of
eyeballs—men in the northern suburbs of Boston on Wednesday mid morning who probably own a
boat. The web site would then show ads to visitors with this set of characteristics. Currently, this type
of targeting is most likely done by using the IP address to narrow the population down to the northern
suburbs of Boston and choosing a web site that caters to boat owners. In the future, boat ownership
and other relevant characteristics may be inferred from the combination of various data.
Sophisticated targeting faces challenges that companies are now working on. Web publishers need
to be able to show ads with no visible delay from the standpoint of the user. When the user clicks on a
web page she will see the content and the ads. Between the time she clicks and the page appearing the
ad technology has to process all of the information necessary to decide which ad to show her including
deciding whether to pull a directly sold ad or choosing among alternative ad networks. That means that
the ad technology has to process the necessary data and make targeting decisions very quickly.
The other method of targeting that is used for websites is based on scanning the content of the
page. The search engine platforms have used their keyword bidding systems to sell ads on the pages of
publishers that belong to their networks. Advertisers bid on keywords just as they do for search. The
“contextual” advertising platform then inserts those ads based on whether those keywords appear on a
page. In addition to using the keyword bidding system the advertiser can select ad placements based on
time of day, type of website, and other criteria.
Market Structure for Advertising on Publisher Websites
There are two major types of platforms for connecting advertisers with eyeballs for publisher
websites.
Integrated contextual (“IC”) platforms provide a full suite of integrated services for advertisers and
publishers. The advertiser typically uses the same software that it uses for managing its search-based
advertising campaigns to manage its contextual-based advertising campaigns. It uses this software to
bid on keywords on the platforms’ publisher network. The IC platform then insert ads provided by the
advertiser on those websites based on its bid and the content of the sites on its network.73
Decentralized non-contextual (“DNC”) platforms are based on targeting technologies that do not
examine the content of the web page but rely instead on information about the visitor (although often
nothing more than when the visitor comes to the website, and from where) plus knowledge of the
website generally. These platforms are decentralized in the sense that several independent businesses
are usually involved in the process of getting an ad from an advertiser in front of a viewer. The
publisher will typically use a publisher tool to manage its inventory and help target ads. It will sell its
advertising inventory through some combination of direct and indirect sales. When it sells ads
indirectly it will usually rely on several advertising networks that have consolidated advertising demand.
73 The contextual platforms also used other characteristics for targeting in addition to content.
Market Platform Dynamics © 2008
30
The advertiser will generally use an advertiser tool to manage its campaigns and optimize its spending
across alternative methods. It will buy advertising inventory through some combination of direct and
indirect sales. It will also rely on several advertising networks for the purpose of buying advertising
inventory indirectly.
Public data on the relative size of IC and DNC platforms is not readily available. The size of DNC
platforms is clearly larger at the moment, in part because the DNC platforms include direct sales of
advertising, which generally take place at higher prices than for indirect sales, whether through the
DNC or IC platforms. Best estimates from discussions with knowledgeable industry participants place
the DNC channel at three or four times the IC channel in terms of advertising revenue.
Functions Performed by Market Participants
Intermediation is the most critical activity performed by ad platforms. This involves two functions.
First, matching the supply and demand of advertising inventory. In practice that means connecting an
advertiser that wants to reach a user with a particular profile (detected through contextual or non-
contextual targeting) with inventory on publisher web sites that match that profile. Second, establishing
transaction prices for the advertising inventory. With direct sales the intermediation functions are
performed through discussions between publisher and advertiser representatives. With indirect sales
the intermediation functions are usually performed through an automated or non-automated process.
An automated process would involve a keyword bidding system or an electronic exchange. A non-
automated process would involve an advertising network aggregating demand and supply from
advertisers and publishers through direct discussions.
Advertisers also need tools for managing their campaigns. That includes deciding where to spend
their advertising budgets, assessing relative returns from different types of advertising, delivering
advertising copy to the publisher’s website, and monitoring the results of their campaigns. These
functions are performed by standalone advertising tools for the DNC platforms. They are also
performed at least in part by the IC platforms. Advertisers, for example, use AdWords to manage their
contextual ad campaigns, bid on keywords, and deliver ads to AdSense which in turn delivers them to
the relevant websites.
Publishers also need tools for optimizing the value of their ad inventory, reporting results to
management, making actual selections of ads from various alternatives, and either grabbing the
advertisement from an upstream provider and inserting into the web page or handing this task off to
another entity such as an ad network.
Pricing
IC platforms typically charge advertisers on a CPC basis which is determined from the keyword
bidding process. They pay publishers “traffic acquisition costs” (TAC). Roughly speaking, TAC
measured as a percentage reflects the commission that the IC platforms take from publishers for selling
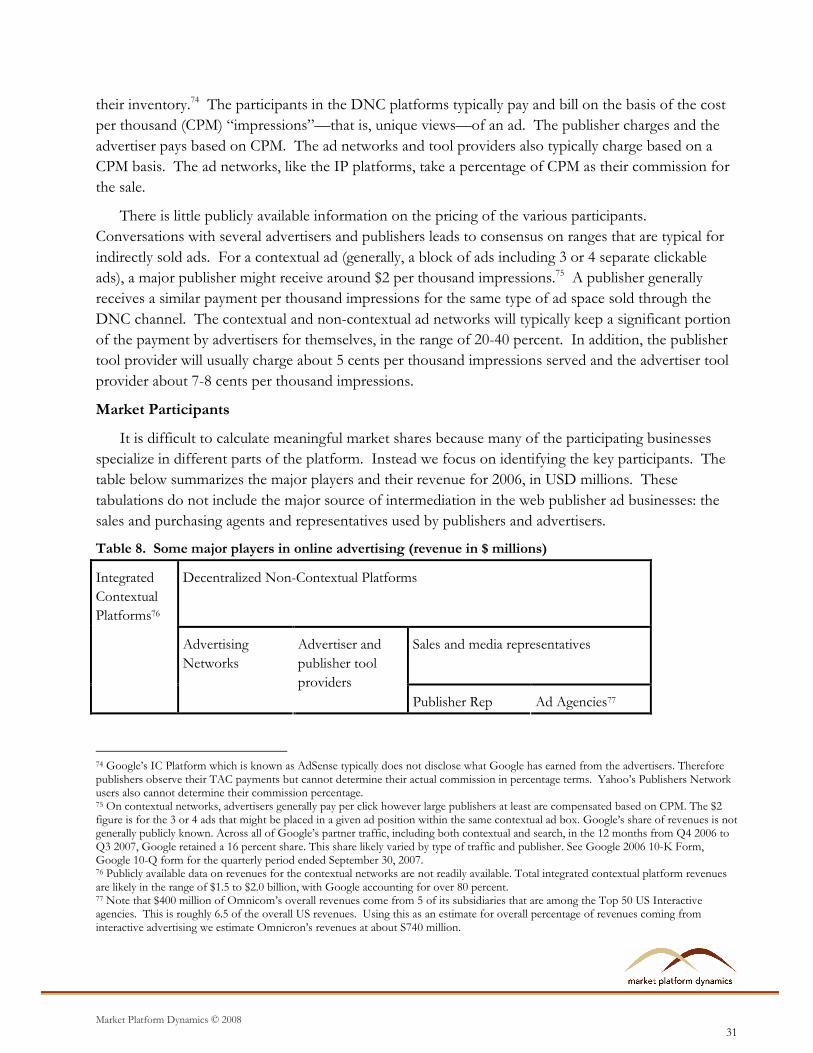
Market Platform Dynamics © 2008
31
their inventory.74 The participants in the DNC platforms typically pay and bill on the basis of the cost
per thousand (CPM) “impressions”—that is, unique views—of an ad. The publisher charges and the
advertiser pays based on CPM. The ad networks and tool providers also typically charge based on a
CPM basis. The ad networks, like the IP platforms, take a percentage of CPM as their commission for
the sale.
There is little publicly available information on the pricing of the various participants.
Conversations with several advertisers and publishers leads to consensus on ranges that are typical for
indirectly sold ads. For a contextual ad (generally, a block of ads including 3 or 4 separate clickable
ads), a major publisher might receive around $2 per thousand impressions.75 A publisher generally
receives a similar payment per thousand impressions for the same type of ad space sold through the
DNC channel. The contextual and non-contextual ad networks will typically keep a significant portion
of the payment by advertisers for themselves, in the range of 20-40 percent. In addition, the publisher
tool provider will usually charge about 5 cents per thousand impressions served and the advertiser tool
provider about 7-8 cents per thousand impressions.
Market Participants
It is difficult to calculate meaningful market shares because many of the participating businesses
specialize in different parts of the platform. Instead we focus on identifying the key participants. The
table below summarizes the major players and their revenue for 2006, in USD millions. These
tabulations do not include the major source of intermediation in the web publisher ad businesses: the
sales and purchasing agents and representatives used by publishers and advertisers.
Table 8. Some major players in online advertising (revenue in $ millions)
Integrated
Contextual
Platforms76
Decentralized Non-Contextual Platforms
Sales and media representatives
Advertising
Networks Advertiser and
publisher tool
providers
Publisher Rep Ad Agencies77
74 Google’s IC Platform which is known as AdSense typically does not disclose what Google has earned from the advertisers. Therefore publishers observe their TAC payments but cannot determine their actual commission in percentage terms. Yahoo’s Publishers Network users also cannot determine their commission percentage. 75 On contextual networks, advertisers generally pay per click however large publishers at least are compensated based on CPM. The $2 figure is for the 3 or 4 ads that might be placed in a given ad position within the same contextual ad box. Google’s share of revenues is not generally publicly known. Across all of Google’s partner traffic, including both contextual and search, in the 12 months from Q4 2006 to Q3 2007, Google retained a 16 percent share. This share likely varied by type of traffic and publisher. See Google 2006 10-K Form, Google 10-Q form for the quarterly period ended September 30, 2007. 76 Publicly available data on revenues for the contextual networks are not readily available. Total integrated contextual platform revenues are likely in the range of $1.5 to $2.0 billion, with Google accounting for over 80 percent. 77 Note that $400 million of Omnicom’s overall revenues come from 5 of its subsidiaries that are among the Top 50 US Interactive agencies. This is roughly 6.5 of the overall US revenues. Using this as an estimate for overall percentage of revenues coming from interactive advertising we estimate Omnicron’s revenues at about S740 million.
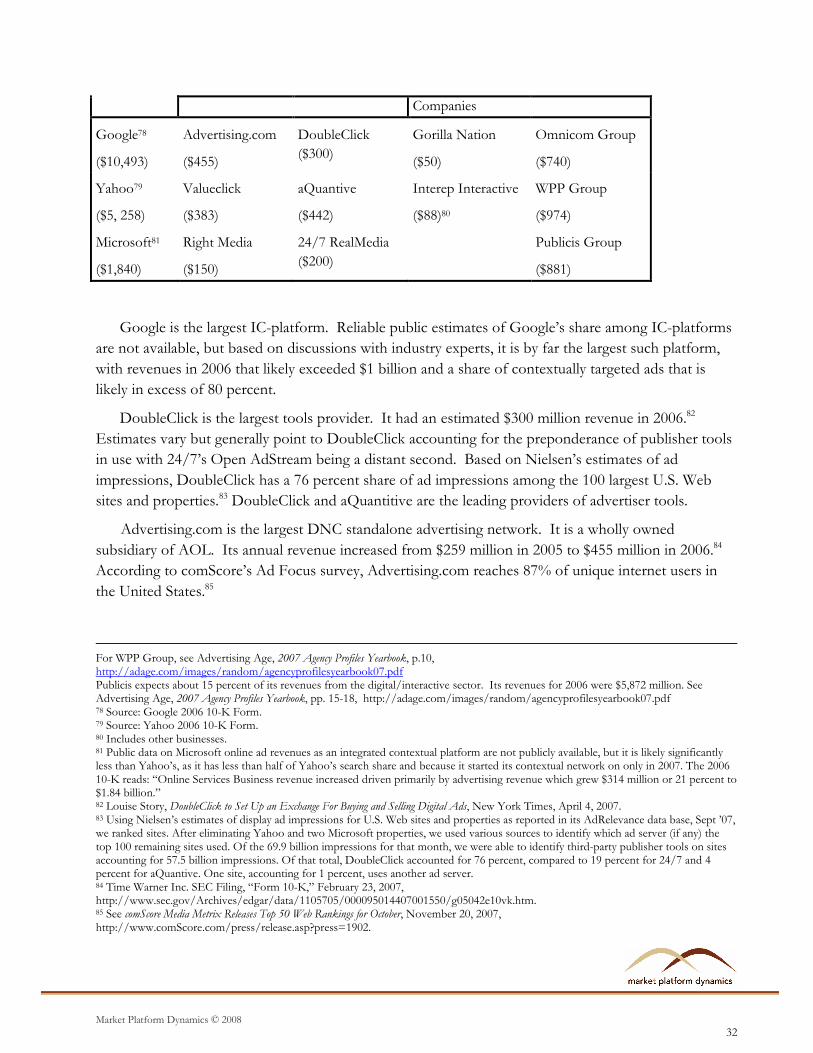
Market Platform Dynamics © 2008
32
Companies
Google78
($10,493)
Advertising.com
($455)
DoubleClick
($300) Gorilla Nation
($50)
Omnicom Group
($740)
Yahoo79
($5, 258)
Valueclick
($383)
aQuantive
($442)
Interep Interactive
($88)80
WPP Group
($974)
Microsoft81
($1,840)
Right Media
($150)
24/7 RealMedia
($200) Publicis Group
($881)
Google is the largest IC-platform. Reliable public estimates of Google’s share among IC-platforms
are not available, but based on discussions with industry experts, it is by far the largest such platform,
with revenues in 2006 that likely exceeded $1 billion and a share of contextually targeted ads that is
likely in excess of 80 percent.
DoubleClick is the largest tools provider. It had an estimated $300 million revenue in 2006.82
Estimates vary but generally point to DoubleClick accounting for the preponderance of publisher tools
in use with 24/7’s Open AdStream being a distant second. Based on Nielsen’s estimates of ad
impressions, DoubleClick has a 76 percent share of ad impressions among the 100 largest U.S. Web
sites and properties.83 DoubleClick and aQuantitive are the leading providers of advertiser tools.
Advertising.com is the largest DNC standalone advertising network. It is a wholly owned
subsidiary of AOL. Its annual revenue increased from $259 million in 2005 to $455 million in 2006.84
According to comScore’s Ad Focus survey, Advertising.com reaches 87% of unique internet users in
the United States.85
For WPP Group, see Advertising Age, 2007 Agency Profiles Yearbook, p.10, http://adage.com/images/random/agencyprofilesyearbook07.pdf Publicis expects about 15 percent of its revenues from the digital/interactive sector. Its revenues for 2006 were $5,872 million. See Advertising Age, 2007 Agency Profiles Yearbook, pp. 15-18, http://adage.com/images/random/agencyprofilesyearbook07.pdf 78 Source: Google 2006 10-K Form. 79 Source: Yahoo 2006 10-K Form. 80 Includes other businesses. 81 Public data on Microsoft online ad revenues as an integrated contextual platform are not publicly available, but it is likely significantly less than Yahoo’s, as it has less than half of Yahoo’s search share and because it started its contextual network on only in 2007. The 2006 10-K reads: “Online Services Business revenue increased driven primarily by advertising revenue which grew $314 million or 21 percent to $1.84 billion.” 82 Louise Story, DoubleClick to Set Up an Exchange For Buying and Selling Digital Ads, New York Times, April 4, 2007. 83 Using Nielsen’s estimates of display ad impressions for U.S. Web sites and properties as reported in its AdRelevance data base, Sept ’07, we ranked sites. After eliminating Yahoo and two Microsoft properties, we used various sources to identify which ad server (if any) the top 100 remaining sites used. Of the 69.9 billion impressions for that month, we were able to identify third-party publisher tools on sites accounting for 57.5 billion impressions. Of that total, DoubleClick accounted for 76 percent, compared to 19 percent for 24/7 and 4 percent for aQuantive. One site, accounting for 1 percent, uses another ad server. 84 Time Warner Inc. SEC Filing, “Form 10-K,” February 23, 2007, http://www.sec.gov/Archives/edgar/data/1105705/000095014407001550/g05042e10vk.htm. 85 See comScore Media Metrix Releases Top 50 Web Rankings for October, November 20, 2007, http://www.comScore.com/press/release.asp?press=1902.
Market Platform Dynamics © 2008
33
The market structure of this part of the online advertising business is changing rapidly. There were
nine major acquisitions of DNC-related businesses in 2007. Google bought DoubleClick for $3.1
billion; Microsoft bought aQuantive for $6 billion and AdECN, an advertising exchange, for an
undisclosed amount; Yahoo bought ad networks RightMedia for $380 million and BlueLithium for
$300 million; Time Warner’s AOL bought publisher tool provider AdTech for an undisclosed amount,
mobile advertising network Third Screen media for an undisclosed amount, and behavioral ad network
Tacoda for an undisclosed amount; and WPP—the world’s largest advertising agency—bought
advertiser and publisher tool provider 24/7 Real Media for $649 million. Depending upon how these
assets are deployed they could result in increased integration of the DNC-platforms and between the IC
and DNC platforms.
The participants in these businesses are also moving into other specialized areas. DoubleClick
formed an advertising exchange in 2007. This exchange enables users of DoubleClick’s publisher tool
to sell remnant advertising through the integrated exchange. Google developed publisher and
advertiser tools to compete with those offered by DoubleClick but appears to have abandoned this
effort in the wake of its acquisition of DoubleClick.
Market Evolution
For large publishers the online advertising business does not look much different than the
traditional advertising business but for the fact that space can be customized for each viewer. A large
fraction of the revenues come from old-fashioned selling of ads by hand. And even for remnant space
the ad networks are not much different economic beasts than the American ad agency created in 1841
that bought space and sold it at a discount to publishers. Several trends may, however, revolutionize
this part of the online advertising business. If that happens, it will dramatically change much of the
advertising industry as people consume more content over Internet-connected devices such as
televisions, mobile phones, e-book readers, and personal computers. Two developments could lead the
way.
The first involves the use of computerized matching, clearing, and settlement of transactions
between advertisers and publishers. The advertising networks currently do much of this work through
human effort—they call publishers and advertisers. Some exchanges have been launched, which
provided an electronic exchange between advertisers and publishers. A few exchanges also connect
advertising networks to facilitate the trading of excess supply and demand between them. The
challenge for these automated trading mechanisms is obtaining sufficient liquidity.86
The second development increases the value of electronic exchanges and is therefore likely to help
ensure that they achieve a critical mass of liquidity. Data-intensive behavioral targeting can significantly
increase the likelihood that an ad will reach a consumer to whom that ad is relevant and who is likely to
translate into a sale for the advertisers. As this technology improves the value of selling ads through
86 These are B2B exchanges. We know from the dramatic collapse of B2Bs in the early 2000s that obtaining liquidity, especially from the supply side (publishers in the case of online advertising) is the most serious challenge. See Silicon.com, B2B exchanges - What happens now?, January 23, 2002; Hazel Ward, B2B exchanges fail to deliver, Computer Weekly, November 29, 2001; Bob Tedeschi, Investing; How Killer B-to-B's Went Into A Tailspin, New York Times, May 7, 2000.
Market Platform Dynamics © 2008
34
automated processes rather than through direct selling will increase. Not much sophisticated targeting
occurs now and it may take time before the technology advances enough for it to change the game.
The market structure that would result from these developments would have one or more
advertising platforms sitting between publishers and advertisers. Trading platforms typically have
significant scale economies and positive feedback effects. That results in a small number of viable
players. In the case of financial exchanges the globalization of markets combined with the
development of electronic trading has led to consolidations and increased concentration. Several
factors suggest that there would be stronger forces leading to the emergence of a single advertising
platform than has been the case for financial exchanges. First, behavioral targeting requires the use of
historical information on consumers often pulled from their past behavior as observed by the
advertising platform. Larger platforms could secure advantages that would be hard for smaller
platforms to replicate. Second, behavioral targeting may have some of the long-tail effects that have
given large search platforms advantages. As the supply and demand is sliced more finely, larger
platforms have thicker markets in every niche. Third, effective behavioral targeting is likely to require
significant technical advances as well significant computer capacity. The IP rights in particular could
establish barriers to smaller players.
Winner-take-all competition stories, however, tend to work better in theory than in practice in
many industries. While it seems implausible that there will be many commercially significant
advertising platforms, two factors identified in the multi-sided platform literature could lead to several
viable platforms. The first is whether it is possible for advertising platforms to differentiate themselves
sufficiently from their rivals from the standpoint of advertisers or publishers while maintaining
sufficient liquidity. The second concerns the extent to which advertisers or publishers can multi-home.
There would not appear to be any obstacles to advertisers using multiple advertising platforms.
Publishers currently rely on their publisher tools to multi-home with multiple alternative channels. If
publisher tools become integrated into the advertising platform the ability to multi-home is likely to
decline, thereby reducing competition (except for exclusives) at the advertiser level.
The development of advertising platforms for trading ads and eyeballs would alter market structure
in the publishing industry as well. Most online and offline media companies are vertically integrated
into selling advertising. They have their own sales forces which, for the larger publishers, sell the bulk
of advertising. As advertising platforms evolve, publishers may specialize in attracting content and
leave the advertising business to the platforms. Many small publishers now do just that.
CONCLUDING REMARKS
Internet-based technologies are revolutionizing the stodgy $625 billion global advertising industry.
Advertisers once had only crude methods available for targeting their ads to consumers who were likely
to buy their products. That was done mainly by selecting advertising media—such as particular
television shows or magazines—that specialized in the relevant audiences. Advertisers also had little
information on who actually watched their ads and what activities followed. The Internet has changed
Market Platform Dynamics © 2008
35
that by allowing advertisers to target specific individuals and paying only when those individuals click
on the ads. More sophisticated technologies are beginning to track not only whether individuals clicked
on an ad but whether that actually translated into a sale. Search-based advertising has developed the
most advanced methods for targeting consumers and charging for results. Non-search based
advertising is not far behind.
These new technologies are critically important for understanding the evolution of the advertising
business because more of the devices that people use for consuming content will have an internet
connection in the future. Most mobile phones will have Internet connections and the initial success of
the iPhones at least points to the likely popularity of this development. Most televisions will also have
Internet connections. It is too early to know whether the product will catch on, but Amazon’s e-book
reader has an always-on wireless feature that would enable it to deliver targeted ads as well.
These changes are important for understanding the current structure and evolution of the online
advertising business. They are also critical for numerous public policy issues that have emerged. Will a
single ad platform emerge or will several remain viable? What are the consequences of alternative
market structures for ad platforms for a web economy that is increasingly based on selling eyeballs to
advertisers? Data is central to these ad platforms. Historically, communication providers such as the
telephone companies have been extremely respectful of privacy rights. The ad platforms have business
models that are based on collecting and hoarding highly personal data from individuals. The
implications of that have not been fully thought through by either consumers or policymakers. Finally,
web publishers have irritated copyright holders who argue that they are using copyrighted material to
attract traffic. I address these issues in a companion paper.