Embed Size (px)
Citation preview
To appear in Business & Information Systems Engineering 1
Institute of Information Systems and Marketing (IISM)
The Economics of Multi-Hop Ride Sharing: Creating new mobility networks through IS
Timm Teubner a, *, Christoph M. Flath b
a Karlsruhe Institute of Technology (KIT), Germanyb Universität Würzburg
A B S T R A C T
Ride sharing allows to share costs of traveling by car, e.g., for fuel or highway tolls. Furthermore, it reduces congestion andemissions by making better use of vehicle capacities. Ride sharing is hence beneficial for drivers, riders, as well as society. While theconcept has existed for decades, ubiquity of digital and mobile technology and user habituation to peer-to-peer services and electronicmarkets have resulted in particular growth in recent years. This paper explores the novel idea of multi-hop ride sharing and illustrates howInformation Systems can leverage its potential. Based on empirical ride sharing data, we provide a quantitative analysis of the structureand the economics of electronic ride sharing markets. We explore the potential and competitiveness of multi-hop ride sharing and analyzeits implications for platform operators. We find that multi-hop ride sharing proves competitive against other modes of transportation andhas the potential to greatly increase ride availability and city connectedness, especially under high reliability requirements. To fully realizethis potential, platform operators should implement multi-hop search, assume active control of pricing and booking processes, improvecoordination of transfers, enhance data services, and try to expand their market share.
Keywords:multi-hop ride sharing; sharing economy; mobility networks; platform economics
1 | Introduction
Ride sharing, i.e. the joint travel of two or more persons in asingle car, has long been a common way to share the costs andbenefits of private cars (Furuhata et al., 2013). Today, dedi-cated platforms allow drivers to post their rides online. SuchInformation Systems have helped to mitigate many issueswhich previously limited ride sharing. Trust among strangersis established through rating and review systems, meaningfulprofiles, user verification, and automated booking and pay-ment processes (Gefen and Straub, 2004; Kim et al., 2010;Slee, 2013; Teubner et al., 2014). Online platforms havealso dramatically decreased transactional cost for ride listingand search (Beul-Leusmann et al., 2014). Fueled by thesedevelopments, large ride sharing platforms like RelayRides,BlaBlaCar, or Carpooling.com have emerged.
Yet, these platforms have not developed new ride shar-ing concepts. The underlying matching process still resem-bles a billboard of posted rides waiting for interested riders.Consequently, despite its obvious advantages (reduced cost,congestion, environmental impact), ride sharing remains a
somewhat niche transportation option with limited routechoice (mostly connecting larger cities) and sparse schedules(only few rides per route per day). However, today’s ubiq-uitous Information Systems offer the possibility to greatlyextend ride sharing capabilities through real-time monitoringand live matching. Such IS improvements can help to betterutilize existing resources. This is well-aligned with the recentemergence of Green IS advocating the idea that IS researchcan and should play a more active role in solving problemsof ecological and societal relevance (vom Brocke et al., 2013;Dedrick, 2010). Recognizing that mobility is one of the largestenergy-consuming systems globally and the only sector withincreasing emissions in most countries (Bicocchi and Mamei,2014), the notion of IS-enhanced ride sharing also resonateswell with the objectives of the Energy Informatics movement(Watson et al., 2010; Goebel et al., 2014).
One apparent option for augmenting ride sharing is tofacilitate chained ride connections with transfers similar tomulti-leg flights or train rides. While this requires robustmulti-party scheduling capabilities, it also promises to in-crease ride liquidity as well as destination choice. In this
*Correspondence to: Karlsruhe Institute of Technology, Kaiserstr. 12, Bldg. 01.80, 76131 Karlsruhe, Germany. Tel.: +49 721 6084 8389; fax: +49 721 60848399. E-Mail: [email protected]
2 To appear in Business & Information Systems Engineering
paper, we explore the benefits and economic implications ofsuch multi-hop ride sharing (MHRS) systems. To this end, werely on empirical ride sharing data to assess MHRS potentials.Furthermore, we consider economic and transactional chal-lenges, leveraging results from platform economics (Rochetand Tirole, 2003) and service value networks (Basole andRouse, 2008; Blau et al., 2009). In particular, we address thefollowing central research questions:
1. How competitive and reliable are multi-hop ride sharingnetworks?
2. Which operational and strategic challenges does multi-hop ride sharing pose to platform operators?
By addressing these research questions, our study con-tributes to the literature on shared and IS-enhanced mobilitysystems. We assess properties and potentials of multi-hopride sharing systems by leveraging empirical ride sharing data.This approach allows us to reveal structural and economicproperties of such online mobility platforms.
The remainder of this paper is organized as follows: InSection 2, we briefly summarize current research on directand multi-hop ride sharing. Furthermore, we recapitulate keyinsights from platform economics and service value networks.Based on empirical ride sharing data, we simulate multi-hopofferings and evaluate their potentials and competitivenessin Section 3. Section 4 explores challenges for platform oper-ators with respect to pricing, network effects, and platformenvelopment. Finally, we discuss practical implications of ourfindings and indicate paths for future research in Section 5.
2 | Related Work
Multi-hop ride sharing touches upon different researchbranches. Firstly, shared mobility systems are a central partof the Sharing Economy which has recently seen great at-tention (Botsman and Rogers, 2010; Cusumano, 2014; Teub-ner, 2014). Furthermore, ride sharing can be considered atwo-sided market as platform operators cater to two inter-dependent customer groups—drivers and riders (Eisenmannet al., 2006). Finally, the process of creating multi-hop ridesresembles concepts from complex service composition in net-worked service systems (Basole and Rouse, 2008; Blau et al.,2009). This section serves to develop these links and providethe theoretic underpinnings for our subsequent analysis.
2.1 Shared Mobility Systems
Comprehensive overviews on the emergence and develop-ment of ride sharing are provided by Chan and Shaheen(2012) and Furuhata et al. (2013). Ride sharing is as old asthe car itself and experienced particular attention during the1970’s energy crisis and World War II, where the U.S. govern-ment encouraged “[...] four workers to share a ride in onecar to conserve rubber for the war effort” (Chan and Shaheen,
2012, p. 5). Teal (1987, p. 203), almost three decades ago,noted that ride sharing “occupies a rather curious status as acommuting mode, for in some ways it is inferior to both driv-ing alone and public transit riding, whereas in other respectsit is superior to both.”
asset provision
ac
tiv
e
central/ professional/ dedicated use
Ch
au
ffe
ur p
ass
ive
Ho
p o
n/o
ff
Ca
r R
en
tal
Ca
r Sh
arin
g
decentral/ private/ multi-use
e.g., Shuttle Services
cu
sto
me
r ro
le
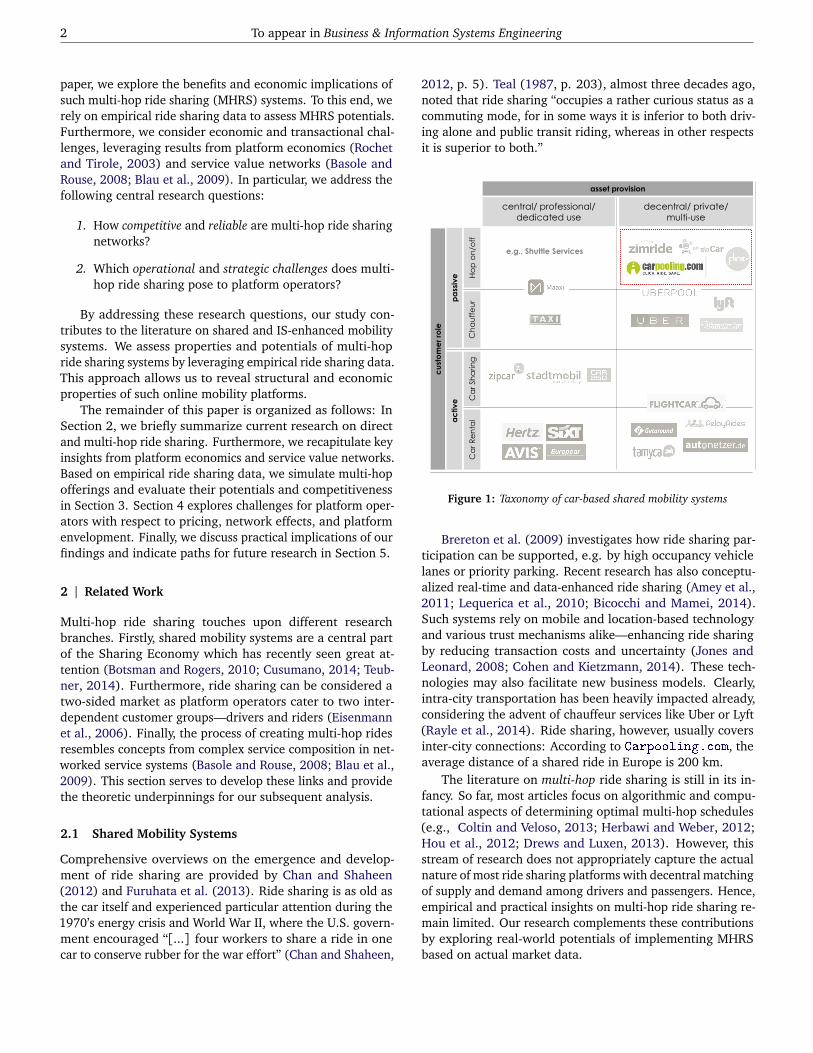
Figure 1: Taxonomy of car-based shared mobility systems
Brereton et al. (2009) investigates how ride sharing par-ticipation can be supported, e.g. by high occupancy vehiclelanes or priority parking. Recent research has also conceptu-alized real-time and data-enhanced ride sharing (Amey et al.,2011; Lequerica et al., 2010; Bicocchi and Mamei, 2014).Such systems rely on mobile and location-based technologyand various trust mechanisms alike—enhancing ride sharingby reducing transaction costs and uncertainty (Jones andLeonard, 2008; Cohen and Kietzmann, 2014). These tech-nologies may also facilitate new business models. Clearly,intra-city transportation has been heavily impacted already,considering the advent of chauffeur services like Uber or Lyft(Rayle et al., 2014). Ride sharing, however, usually coversinter-city connections: According to Carpooling.com, theaverage distance of a shared ride in Europe is 200 km.
The literature on multi-hop ride sharing is still in its in-fancy. So far, most articles focus on algorithmic and compu-tational aspects of determining optimal multi-hop schedules(e.g., Coltin and Veloso, 2013; Herbawi and Weber, 2012;Hou et al., 2012; Drews and Luxen, 2013). However, thisstream of research does not appropriately capture the actualnature of most ride sharing platforms with decentral matchingof supply and demand among drivers and passengers. Hence,empirical and practical insights on multi-hop ride sharing re-main limited. Our research complements these contributionsby exploring real-world potentials of implementing MHRSbased on actual market data.
To appear in Business & Information Systems Engineering 3
To better understand the role of ride sharing in today’smobility systems, we distinguish the concept from other formsof shared mobility. We propose a novel framework (Figure1) to help with this challenge. Our framework maps out theshared mobility ecosystem and how it relates to the Shar-ing Economy landscape. We consider the main dimensionscustomer role and asset provision. Ride sharing, the focus ofthe remainder of this article, is the market reflected by thetop-right sector.
Customer Role—For the case that customers have the carat their (active) disposal, we differentiate between car shar-ing and car rental. In traditional car sharing programs (e.g.,Zipcar or Stadtmobil) customers become members (usuallyassociated with an annual membership charge) and get ac-cess to a fleet of cars. Powered by ubiquity of mobile IS,free-floating car sharing systems with ad-hoc access have re-cently emerged (e.g., Car2Go or DriveNow). These systemsallow car pick up and drop off (almost) anywhere withindowntown areas. Besides car sharing, of course there is carrental with companies like Hertz, Avis or Sixt. In recentyears, car rental platforms for private vehicles have emerged,e.g., Getaround, RelayRides or Tamyca (Shaheen et al., 2012;Bardhi and Eckhardt, 2012).
If customers are in the (passive) passenger role, theymay specify the destination individually—as is the case ofchauffeur services such as traditional taxicabs and emergingon-demand mobility services (e.g., Uber). The route may, incontrast, also be pre-defined like in the case of shuttle servicesor most ride sharing platforms where drivers determine theride specifics such as meeting point and destination before-hand. There is a natural logic to this supply-driven paradigm:Drivers can typically accommodate multiple riders and arehence expected to remain active in the matching system for alonger period.
Asset Provision—Car sharing programs, car rental, as wellas shuttle and taxi services rely on dedicated resources whichare centrally owned and maintained. Their decentral counter-parts are private vehicles—after all, the average private carsits idle for 23 hours a day (Shaheen et al., 1998). Such betterutilization of available resources is a central theme behindthe recent up-rise of the Sharing Economy (Sundararajan,2013). Besides the ownership dimension, asset provision alsoentails an organizational aspect: Decentral systems cannotrely on a central dispatcher matching supply and demand.Rather, there are platforms serving as intermediaries betweendrivers and riders. The attractiveness of such a platform si-multaneously hinges on both the number of active driversand the number of riders. Such two-sided structures are acommon theme throughout the Sharing Economy (Malhotraand Van Alstyne, 2014).
2.2 Platform Economics and Two-Sided Markets
Eisenmann et al. (2006, p. 92) succinctly note that “com-panies in [two-sided markets] make money by linking [...]
different sides of their customer networks.” Such marketsare omnipresent and include, among others, credit card sys-tems (merchants and buyers), video gaming platforms (gamedevelopers and gamers), classifieds (sellers and buyers) ordating sites (men and women). Evans (2003, p. 43) moreprecisely defines two-sided markets by means of the followingthree criteria: “at any point in time there are (a) two distinctgroups of customers; (b) the value obtained by one kind ofcustomers increases with the number of the other kind of cus-tomers; and (c) an intermediary is necessary for internalizingthe externalities created by one group for the other group.”For the case of ride sharing, the distinct customer groups aregiven by riders and drivers. Riders benefit from more rides of-fered by more drivers whereas drivers can better utilize theirvehicle capacity in the face of many riders. Finally, platformsare required to enable the decentral coordination of driversand riders, including the challenge to overcome problemsrelated to (a lack of) trust. Consequently, ride sharing can beconsidered a two-sided market and platform operators needto internalize the economics therein.
2.3 Service Networks
Traditional value chains emphasize isolated transactions inthe context of stable business relationships to efficiently pro-vide standard products. Yet, they are less less suitable torespond and quickly adapt to dynamic and uncertain cus-tomer demand. Against this backdrop, Heck and Vervest(2007, p. 32) characterize Smart Business Networks as a new,ICT-enabled organization form “where business is conductedacross a rapidly formed network with anyone, anywhere, any-time." Such networks can enhance customer value throughrapid adaption as well as provision of complex and bundledproducts. This idea is generalized by the notion of servicevalue networks (SVN) where decentralized service providersact in a networked context. By combining individual ser-vice offers, these networks are capable of augmenting basicservices to complex services which offer superior value to cus-tomers (Blau et al., 2009). Key obstacles to overcome includeinteroperability, service composition, and pricing. FollowingBasole and Rouse (2008), value in SVNs is created throughB2C and C2C relationships, and depends on the technologicaland economic context. Leukel et al. (2011) adopt this visionto characterize supply chain systems as a network of services.Bohmann et al. (2014, p. 76) reiterate the potentials andimportance of networked service systems. They note that“by focusing on economic and societal needs, service systemsinnovation can improve the impact of research on businessand society, e.g., by improving [...] sustainable mobility [...].”Our research explores such a scenario with drivers, riders,and platform operators advancing singular trips towards inter-linked, complex mobility services: Where current ride sharingsystems consider individual rides in isolation, multi-hop ridesharing platforms use ICT systems to create a network of“ride services.” Service value networks offer a theoretical
4 To appear in Business & Information Systems Engineering
framework to model MHRS as a combination of mobility ser-vices, provided by independent individuals, and to considercrucial properties like compatibility, pricing, revenue shar-ing, and default risks. Recombination of individual simpleride services enables higher transport efficiency through im-proved driver-rider mappings and increased mobility optionsfor riders.
3 | Analysis
Our analysis is based on data from the main European ridesharing company Carpooling.com.1 On all its country-specificplatforms, drivers post ride offers and specify departure time,meeting point, ride rules (e.g., smoking, pets or oversize bag-gage) as well as prices. Ride seekers send booking requests.The driver may then demand additional information, or sim-ply confirms or declines the request. The company chargesan 11% provision on the ride’s listed price, paid by the driver.
3.1 Data Description
Figure 2 illustrates the platform’s activity on a weekday anddaily basis. Our data sample comprises rides that were listedfor Friday, February, 15th in 2013, two days prior to that date,connecting the 21 largest German cities (based on popula-tion)2. We chose Friday as it is the most busy ride sharingday with respect to both the number of rides offered as wellas the total distance covered. In total, there are 3,847 directrides in our dataset for that particular day and city-to-citynetwork.
pro
po
rtio
n o
f rid
es
0.00
0.05
0.10
0.15
0.20
0.25
0.30
Mon Tue Wed Thu Fri Sat Sun
0.00
0.02
0.04
0.06
0.08
0.10
0.12
0 3 6 9 12 15 18 21
weekday hour of the day
Figure 2: Carpooling.com—distribution of rides across weekdaysand hours
We extracted the following properties for each ride offer:origin and destination city, date and time of departure, cost inEUR (as specified by the driver). Distance and duration of therides were extracted using Google’s directions web service.
0.00
0.20
0.40
0.60
0.80
1.00
1.20
1.40
1.60
0 10 20 300.00
0.20
0.40
0.60
0.80
1.00
1.20
1.40
1.60
20 30 40 50 60 70 80 90 100 110 120
max. detour [-]min. buffer time [minutes] max. waiting time [minutes]
0.00
0.20
0.40
0.60
0.80
1.00
1.20
1.40
1.60
1.05 1.15 1.25 1.35 1.45
#M
HR/b
asel
ine
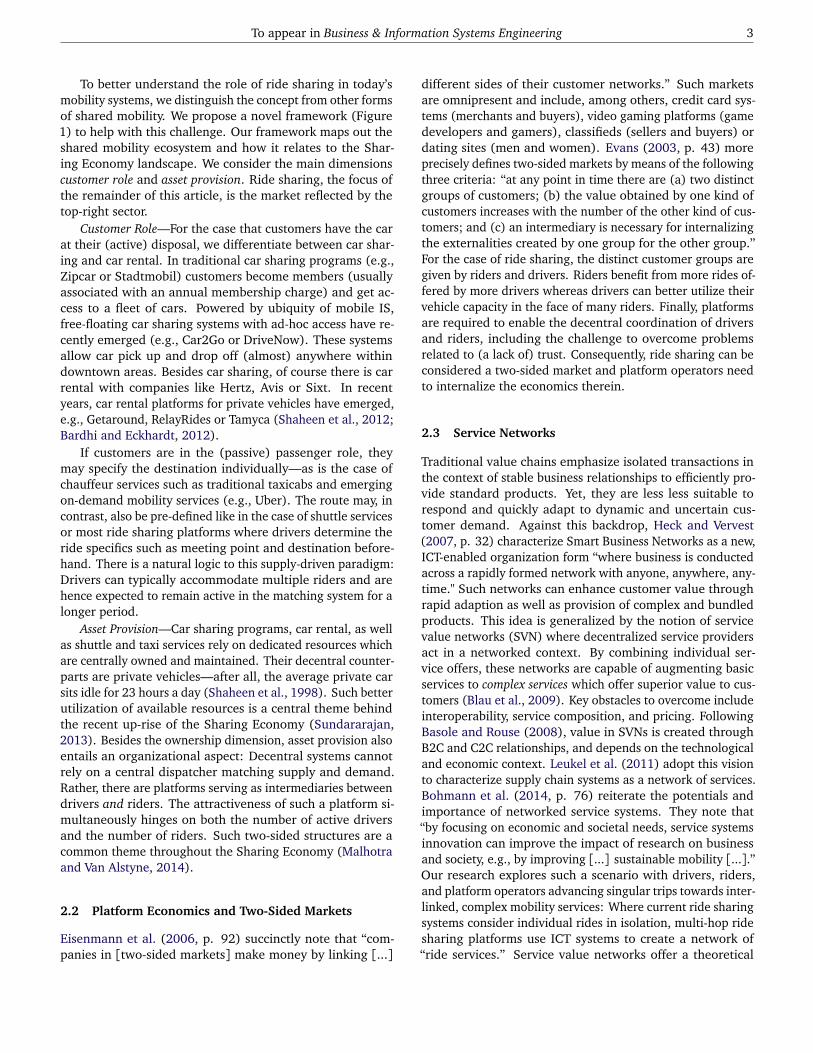
Figure 3: Sensitivity analysis for number of rides, depending on max-imal detour, minimal buffer, and maximal waiting time
3.2 Generating 2-hop Rides
Based on this body of ride offers, we now consider the gener-ation of 2-hop rides and its potentials. To this end we presenta method to generate tight multi-hop schedules from a set ofdirect rides. We generate 2-hop rides as follows: Assume youwish to travel from origin A to destination B. The number ofdirect rides from A to B may, however, be limited so that onecannot find an adequate ride. Hence, we consider the optionto travel from A to X, and then onward from X to B instead.3
We use the following operations to generate a schedule offeasible 2-hop rides:
First, a join of the table of direct rides (T) with itself onT(1).destination == T(2).origin generates all theo-retical 2-hop rides. This data set is instantaneously reduced byconsidering only feasible combinations of rides with respectto time and route constraints. These constraint entail that theconnecting ride must start after the feeder ride has ended, in-cluding some buffer time (lb ≥ 0) and a limit for waiting time(lw > lb). Formally, this yields t1 + l1 + lb ≤ t2 ≤ t1 + l1 + lwwhere t i denotes the start time of ride i and li its duration.Also, we assume a limit for the extra distance travelled alongthe path A-X-B in comparison to the direct distance from Ato B (dAX + dX B ≤ δdAB,δ > 1, where d denotes distance andthe parameter δ specifies the constraint). In the following,we assume lb = 15 minutes, lw = 90 minutes, and δ = 1.25for generating the MHR set.
Note that a specific ride from A to X may facilitate multiplefollow-up rides from X to B within the acceptable time frame.In order not to overestimate the number of rides in the MHRset, we eliminate all dominated connecting rides in termsof cost and time of departure, where lower cost and earlierdeparture time are assumed to be preferable. Similarly, twoor more rides of the first leg may be covered by the very sameride on the second leg. Again, this redundancy is reduced byeliminating all dominated rides. In this case, lower cost and
1While writing this paper, Carpooling.com has been taken over by its France-based competitor BlaBlaCar which, however, does not reduce the validity of ourdata, analyses, or conclusions as the market models of both firms are virtually identical.
2These are (in descending order): Berlin(B), Hamburg(HH), Munich(M), Cologne(K), Frankfurt/Main(F), Stuttgart(S), Düsseldorf(D), Dortmund(DO),Essen(E), Bremen(HB), Leipzig(L), Dresden(DD), Hanover(H), Nuremberg(N), Duisburg(DU), Bochum(BO), Wuppertal(W), Bonn(BN), Bielefeld(BI),Mannheim(MA), and Karlsruhe(KA).
3In this study, we limit the analysis to rides with one transfer (i.e., two hops). Drews and Luxen (2013), found negligible improvements when allowing formore than two hops.
To appear in Business & Information Systems Engineering 5
5 Institute of Information Systems and Marketing (IISM)
2.00
4.00
6.00
8.00
10.00
12.00
14.00
16.00
18.00
20.00
0.6 0.8 1.0 1.2 1.4 1.6 1.8 2.0
duration (h/100km)
co
st (€/1
00k
m)
train
MHRS
bus
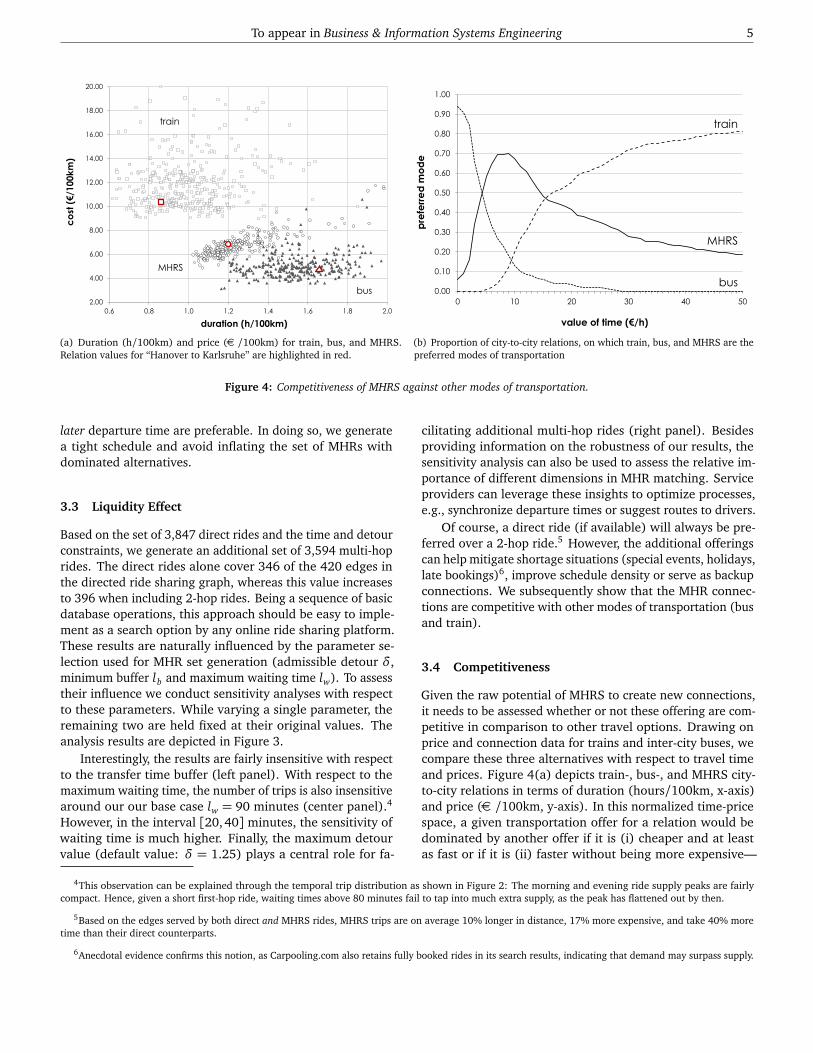
(a) Duration (h/100km) and price (€ /100km) for train, bus, and MHRS.Relation values for “Hanover to Karlsruhe” are highlighted in red.
3 Institute of Information Systems and Marketing (IISM)
value of time (€/h)
pre
ferr
ed
mo
de
MHRS
train
bus 0.00
0.10
0.20
0.30
0.40
0.50
0.60
0.70
0.80
0.90
1.00
0 10 20 30 40 50
(b) Proportion of city-to-city relations, on which train, bus, and MHRS are thepreferred modes of transportation
Figure 4: Competitiveness of MHRS against other modes of transportation.
later departure time are preferable. In doing so, we generatea tight schedule and avoid inflating the set of MHRs withdominated alternatives.
3.3 Liquidity Effect
Based on the set of 3,847 direct rides and the time and detourconstraints, we generate an additional set of 3,594 multi-hoprides. The direct rides alone cover 346 of the 420 edges inthe directed ride sharing graph, whereas this value increasesto 396 when including 2-hop rides. Being a sequence of basicdatabase operations, this approach should be easy to imple-ment as a search option by any online ride sharing platform.These results are naturally influenced by the parameter se-lection used for MHR set generation (admissible detour δ,minimum buffer lb and maximum waiting time lw). To assesstheir influence we conduct sensitivity analyses with respectto these parameters. While varying a single parameter, theremaining two are held fixed at their original values. Theanalysis results are depicted in Figure 3.
Interestingly, the results are fairly insensitive with respectto the transfer time buffer (left panel). With respect to themaximum waiting time, the number of trips is also insensitivearound our our base case lw = 90 minutes (center panel).4
However, in the interval [20,40] minutes, the sensitivity ofwaiting time is much higher. Finally, the maximum detourvalue (default value: δ = 1.25) plays a central role for fa-
cilitating additional multi-hop rides (right panel). Besidesproviding information on the robustness of our results, thesensitivity analysis can also be used to assess the relative im-portance of different dimensions in MHR matching. Serviceproviders can leverage these insights to optimize processes,e.g., synchronize departure times or suggest routes to drivers.
Of course, a direct ride (if available) will always be pre-ferred over a 2-hop ride.5 However, the additional offeringscan help mitigate shortage situations (special events, holidays,late bookings)6, improve schedule density or serve as backupconnections. We subsequently show that the MHR connec-tions are competitive with other modes of transportation (busand train).
3.4 Competitiveness
Given the raw potential of MHRS to create new connections,it needs to be assessed whether or not these offering are com-petitive in comparison to other travel options. Drawing onprice and connection data for trains and inter-city buses, wecompare these three alternatives with respect to travel timeand prices. Figure 4(a) depicts train-, bus-, and MHRS city-to-city relations in terms of duration (hours/100km, x-axis)and price (€ /100km, y-axis). In this normalized time-pricespace, a given transportation offer for a relation would bedominated by another offer if it is (i) cheaper and at leastas fast or if it is (ii) faster without being more expensive—
4This observation can be explained through the temporal trip distribution as shown in Figure 2: The morning and evening ride supply peaks are fairlycompact. Hence, given a short first-hop ride, waiting times above 80 minutes fail to tap into much extra supply, as the peak has flattened out by then.
5Based on the edges served by both direct and MHRS rides, MHRS trips are on average 10% longer in distance, 17% more expensive, and take 40% moretime than their direct counterparts.
6Anecdotal evidence confirms this notion, as Carpooling.com also retains fully booked rides in its search results, indicating that demand may surpass supply.
6 To appear in Business & Information Systems Engineering
i.e., options positioned to its bottom left. Given the distinctordering of the three different options, directly dominatedrelations can hardly be found. Effectively, mode choice willdepend on customers’ individual value of time.
Asserting a constant opportunity cost of travel time cttransforms the customer mode choice problem into a lineartrade-off between travel time t(mode) and direct monetarycosts cm(mode). The preferred mode then obtains as theminimizer of total costs C(mode) = ct t(mode) + cm(mode).7
Figure 4(b) plots the share of total relations for which a giventransportation option is preferred for varying levels of timevalue: Naturally, rather slow but inexpensive buses domi-nate for low values of time (e.g., students), whereas fast andexpensive trains will be chosen for high values (e.g., busi-ness travel). In the intermediate range, MHRS emerges asthe preferred option on most relations. This illustrates thecompetitiveness of MHRS.8 Naturally, this analysis does notaccount for other choice-relevant aspects such as reliabilityor comfort. Still, the results should be informative with re-spect to characterizing the market which may be addressedby MHRS.
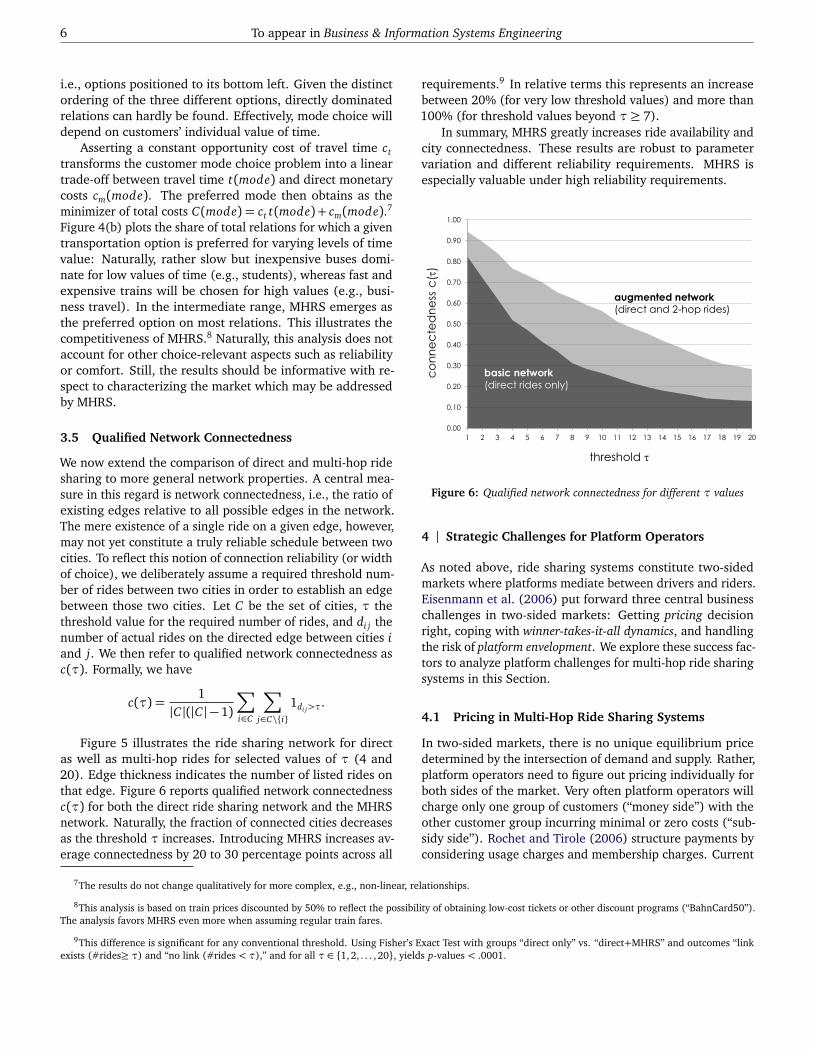
3.5 Qualified Network Connectedness
We now extend the comparison of direct and multi-hop ridesharing to more general network properties. A central mea-sure in this regard is network connectedness, i.e., the ratio ofexisting edges relative to all possible edges in the network.The mere existence of a single ride on a given edge, however,may not yet constitute a truly reliable schedule between twocities. To reflect this notion of connection reliability (or widthof choice), we deliberately assume a required threshold num-ber of rides between two cities in order to establish an edgebetween those two cities. Let C be the set of cities, τ thethreshold value for the required number of rides, and di j thenumber of actual rides on the directed edge between cities iand j. We then refer to qualified network connectedness asc(τ). Formally, we have
c(τ) =1
|C |(|C | − 1)
∑
i∈C
∑
j∈C\{i}
1di j>τ.
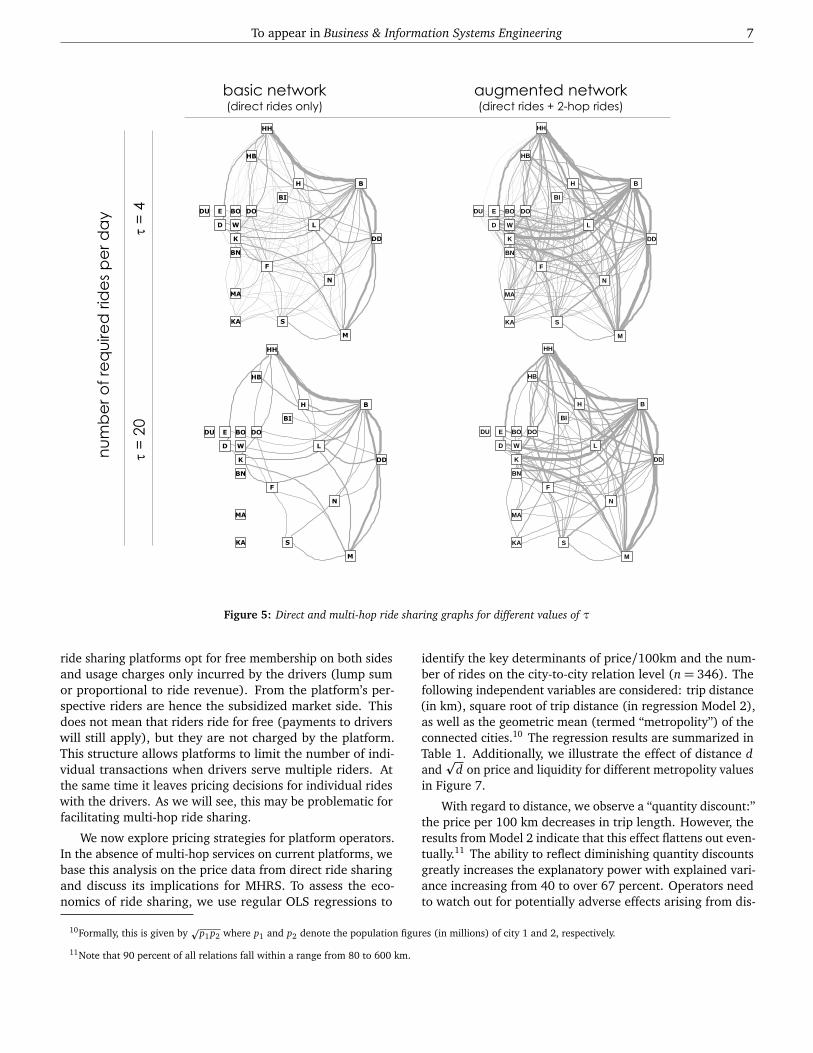
Figure 5 illustrates the ride sharing network for directas well as multi-hop rides for selected values of τ (4 and20). Edge thickness indicates the number of listed rides onthat edge. Figure 6 reports qualified network connectednessc(τ) for both the direct ride sharing network and the MHRSnetwork. Naturally, the fraction of connected cities decreasesas the threshold τ increases. Introducing MHRS increases av-erage connectedness by 20 to 30 percentage points across all
requirements.9 In relative terms this represents an increasebetween 20% (for very low threshold values) and more than100% (for threshold values beyond τ≥ 7).
In summary, MHRS greatly increases ride availability andcity connectedness. These results are robust to parametervariation and different reliability requirements. MHRS isespecially valuable under high reliability requirements.
0.00
0.10
0.20
0.30
0.40
0.50
0.60
0.70
0.80
0.90
1.00
1 2 3 4 5 6 7 8 9 10 11 12 13 14 15 16 17 18 19 20
threshold
co
nn
ec
ted
ne
ss c
()
augmented network (direct and 2-hop rides)
basic network (direct rides only)
Figure 6: Qualified network connectedness for different τ values
4 | Strategic Challenges for Platform Operators
As noted above, ride sharing systems constitute two-sidedmarkets where platforms mediate between drivers and riders.Eisenmann et al. (2006) put forward three central businesschallenges in two-sided markets: Getting pricing decisionright, coping with winner-takes-it-all dynamics, and handlingthe risk of platform envelopment. We explore these success fac-tors to analyze platform challenges for multi-hop ride sharingsystems in this Section.
4.1 Pricing in Multi-Hop Ride Sharing Systems
In two-sided markets, there is no unique equilibrium pricedetermined by the intersection of demand and supply. Rather,platform operators need to figure out pricing individually forboth sides of the market. Very often platform operators willcharge only one group of customers (“money side”) with theother customer group incurring minimal or zero costs (“sub-sidy side”). Rochet and Tirole (2006) structure payments byconsidering usage charges and membership charges. Current
7The results do not change qualitatively for more complex, e.g., non-linear, relationships.
8This analysis is based on train prices discounted by 50% to reflect the possibility of obtaining low-cost tickets or other discount programs (“BahnCard50”).The analysis favors MHRS even more when assuming regular train fares.
9This difference is significant for any conventional threshold. Using Fisher’s Exact Test with groups “direct only” vs. “direct+MHRS” and outcomes “linkexists (#rides≥ τ) and “no link (#rides < τ),” and for all τ ∈ {1, 2, . . . , 20}, yields p-values < .0001.
To appear in Business & Information Systems Engineering 7
B
BI
BO
BN
HB
DO
DD
DU
D
E
F
HH
H
KA
K
L
MA
M
N
S
W
B
BI
BO
BN
HB
DO
DD
DU
D
E
F
HH
H
KA
K
L
MA
M
N
S
W
basic network (direct rides only)
augmented network (direct rides + 2-hop rides)
nu
mb
er
of
req
uire
d r
ide
s p
er
da
y
=
4
=
20
B
BI
BO
BN
HB
DO
DD
DU
D
E
F
HH
H
KA
K
L
MA
M
N
S
W
B
BI
BO
BN
HB
DO
DD
DU
D
E
F
HH
H
KA
K
L
MA
M
N
S
W
Figure 5: Direct and multi-hop ride sharing graphs for different values of τ
ride sharing platforms opt for free membership on both sidesand usage charges only incurred by the drivers (lump sumor proportional to ride revenue). From the platform’s per-spective riders are hence the subsidized market side. Thisdoes not mean that riders ride for free (payments to driverswill still apply), but they are not charged by the platform.This structure allows platforms to limit the number of indi-vidual transactions when drivers serve multiple riders. Atthe same time it leaves pricing decisions for individual rideswith the drivers. As we will see, this may be problematic forfacilitating multi-hop ride sharing.
We now explore pricing strategies for platform operators.In the absence of multi-hop services on current platforms, webase this analysis on the price data from direct ride sharingand discuss its implications for MHRS. To assess the eco-nomics of ride sharing, we use regular OLS regressions to
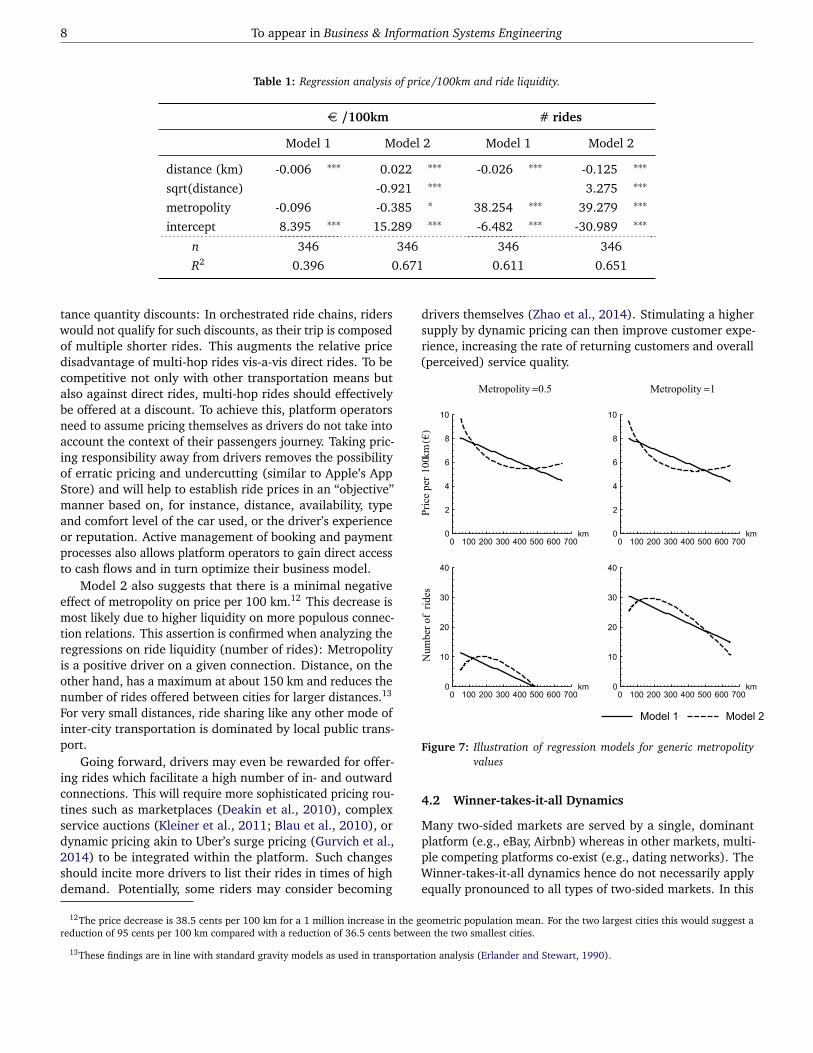
identify the key determinants of price/100km and the num-ber of rides on the city-to-city relation level (n= 346). Thefollowing independent variables are considered: trip distance(in km), square root of trip distance (in regression Model 2),as well as the geometric mean (termed “metropolity”) of theconnected cities.10 The regression results are summarized inTable 1. Additionally, we illustrate the effect of distance dandp
d on price and liquidity for different metropolity valuesin Figure 7.
With regard to distance, we observe a “quantity discount:”the price per 100 km decreases in trip length. However, theresults from Model 2 indicate that this effect flattens out even-tually.11 The ability to reflect diminishing quantity discountsgreatly increases the explanatory power with explained vari-ance increasing from 40 to over 67 percent. Operators needto watch out for potentially adverse effects arising from dis-
10Formally, this is given byp
p1p2 where p1 and p2 denote the population figures (in millions) of city 1 and 2, respectively.
11Note that 90 percent of all relations fall within a range from 80 to 600 km.
8 To appear in Business & Information Systems Engineering
Table 1: Regression analysis of price/100km and ride liquidity.
€ /100km # rides
Model 1 Model 2 Model 1 Model 2
distance (km) -0.006 ∗∗∗ 0.022 ∗∗∗ -0.026 ∗∗∗ -0.125 ∗∗∗
sqrt(distance) -0.921 ∗∗∗ 3.275 ∗∗∗
metropolity -0.096 -0.385 ∗ 38.254 ∗∗∗ 39.279 ∗∗∗
intercept 8.395 ∗∗∗ 15.289 ∗∗∗ -6.482 ∗∗∗ -30.989 ∗∗∗
n 346 346 346 346
R2 0.396 0.671 0.611 0.651
tance quantity discounts: In orchestrated ride chains, riderswould not qualify for such discounts, as their trip is composedof multiple shorter rides. This augments the relative pricedisadvantage of multi-hop rides vis-a-vis direct rides. To becompetitive not only with other transportation means butalso against direct rides, multi-hop rides should effectivelybe offered at a discount. To achieve this, platform operatorsneed to assume pricing themselves as drivers do not take intoaccount the context of their passengers journey. Taking pric-ing responsibility away from drivers removes the possibilityof erratic pricing and undercutting (similar to Apple’s AppStore) and will help to establish ride prices in an “objective”manner based on, for instance, distance, availability, typeand comfort level of the car used, or the driver’s experienceor reputation. Active management of booking and paymentprocesses also allows platform operators to gain direct accessto cash flows and in turn optimize their business model.
Model 2 also suggests that there is a minimal negativeeffect of metropolity on price per 100 km.12 This decrease ismost likely due to higher liquidity on more populous connec-tion relations. This assertion is confirmed when analyzing theregressions on ride liquidity (number of rides): Metropolityis a positive driver on a given connection. Distance, on theother hand, has a maximum at about 150 km and reduces thenumber of rides offered between cities for larger distances.13
For very small distances, ride sharing like any other mode ofinter-city transportation is dominated by local public trans-port.
Going forward, drivers may even be rewarded for offer-ing rides which facilitate a high number of in- and outwardconnections. This will require more sophisticated pricing rou-tines such as marketplaces (Deakin et al., 2010), complexservice auctions (Kleiner et al., 2011; Blau et al., 2010), ordynamic pricing akin to Uber’s surge pricing (Gurvich et al.,2014) to be integrated within the platform. Such changesshould incite more drivers to list their rides in times of highdemand. Potentially, some riders may consider becoming
drivers themselves (Zhao et al., 2014). Stimulating a highersupply by dynamic pricing can then improve customer expe-rience, increasing the rate of returning customers and overall(perceived) service quality.
Metropolity=0.5 Metropolity=1
Priceper100km(€)
0 100 200 300 400 500 600 700km0
2
4
6
8
10
0 100 200 300 400 500 600 700km0
2
4
6
8
10
Numberofrides
0 100 200 300 400 500 600 700km0
10
20
30
40
0 100 200 300 400 500 600 700km0
10
20
30
40
Model 1 Model 2
Figure 7: Illustration of regression models for generic metropolityvalues
4.2 Winner-takes-it-all Dynamics
Many two-sided markets are served by a single, dominantplatform (e.g., eBay, Airbnb) whereas in other markets, multi-ple competing platforms co-exist (e.g., dating networks). TheWinner-takes-it-all dynamics hence do not necessarily applyequally pronounced to all types of two-sided markets. In this
12The price decrease is 38.5 cents per 100 km for a 1 million increase in the geometric population mean. For the two largest cities this would suggest areduction of 95 cents per 100 km compared with a reduction of 36.5 cents between the two smallest cities.
13These findings are in line with standard gravity models as used in transportation analysis (Erlander and Stewart, 1990).
To appear in Business & Information Systems Engineering 9
section we analyze these network dynamics for multi-hopride sharing. MHRS network effects may manifest themselveswith respect to ride liquidity and qualified network connect-edness. Starting off from our market data set, we assess theextent of concentration benefits by analyzing the effect ofvarying platform size on the values of liquidity and qualifiednetwork connectedness. Smaller platform sizes are simulatedas random subsets of the complete ride data set. To minimizesampling biases, we repeat this 100 times for each value ofplatform size (0 to 100 percent in steps of 5 percent).
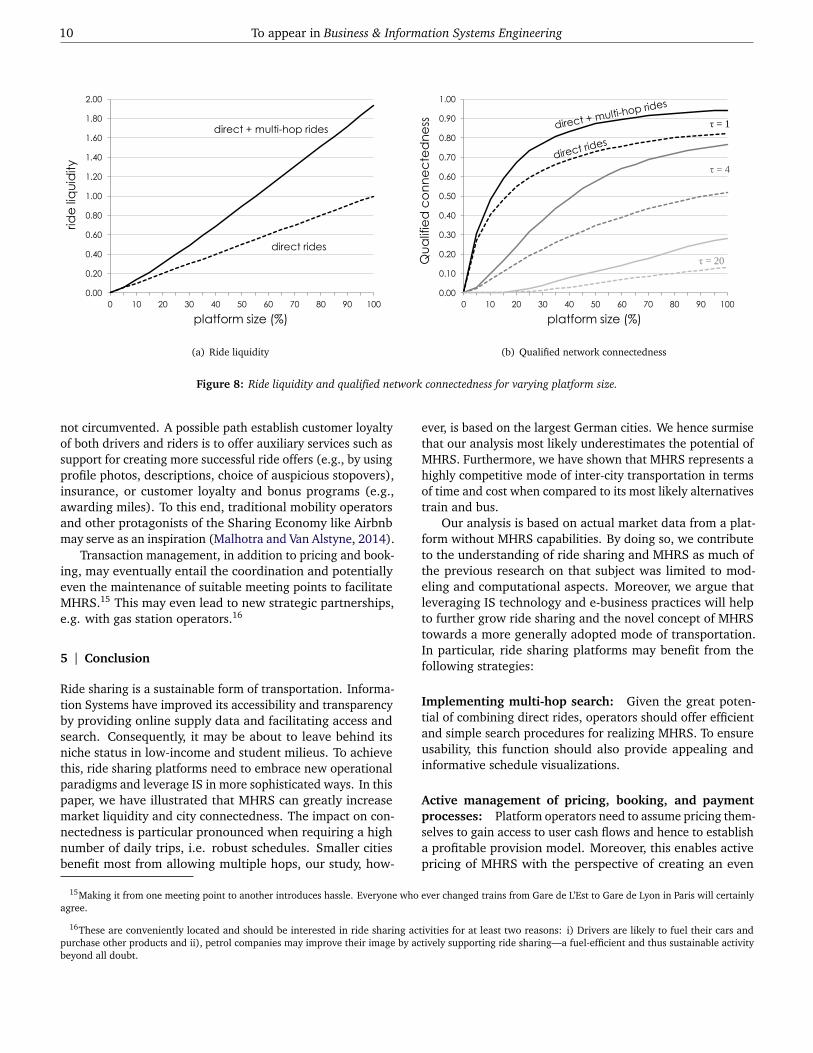
Liquidity: Higher levels of liquidity, i.e. a higher numberof available rides, offer more choice to potential ride sharingusers. This typically involves more available start and endpoints but also a wider choice of departure times or meetingpoints and is thus preferable. Figure 8(a) shows that MHRSliquidity increases much stronger than direct ride liquidity inplatform size. Hence, larger platforms will benefit more fromimplementing MHRS than smaller platforms. Note that thecost of setting up such a system is most likely independent ofthe size of the underlying data base. And even more so, theconvex structure accelerates this effect, stemming from thesuper-additive process of ride recombination.
Connectedness: Qualified network connectedness is morespecific than mere liquidity and captures the share of citiesin the network connected by a minimum number (τ) of al-ternative rides. As noted in Section 3.5, qualified networkconnectedness is a key determinant for ride sharing servicequality. This measure provides a clear quantification of howlikely customers are to find suitable rides for their demand.As depicted in Figure 8(b), qualified network connectednessis naturally increasing in platform size. However, given theupper bound of 100 percent, the marginal benefit of platformsize is decreasing and we observe a concave benefit structure.Consequently, qualified network connectedness is only weaklyincreasing in platform size if a critical mass is reached. Incontrast, the impact of additional ride volume is considerablefor small platforms. Again, the transition from direct rides toMHRS offers great potential in increasing qualified networkconnectedness, particular for moderate values of τ.
Multi-homing: Another important factor in assessingwhether a single firm dominates or not is the possibilityfor customers to be simultaneously active on multiple plat-forms. This is referred to as “multi-homing” (Rochet andTirole, 2003). Most ride sharing platforms do not charge anymembership fees and both advertising and searching for ridesis easy and effortless. So currently, multi-homing is possible.However, in view of automated booking processes this be-comes an issue. Requests on different platforms cannot besynchronized and may likely result in double bookings. Suchconflicts are extremely aggravating for drivers and users and
will not increase perceived quality and trust in ride sharingservices as a whole.
Taken together, MHRS may trigger significant networkeffects. With regard to MHRS liquidity, larger platforms willbe more capable of creating a high-volume and in turn high-quality service. With regard to qualified network connected-ness, ever larger platform sizes will yield limited additionalbenefit. Entrants, however, will struggle as they initiallyfind themselves in a particular steep section of the curveand are hardly capable to offer reasonable connectedness—particularly for higher reliability requirements. Consequently,top dog platforms could well play out their competitive ad-vantage and further strengthen their position by introducingMHRS. Moreover, central booking management approacheswill limit multi-homing and increase customers’ platform loy-alty.
These findings speak in favor of a “winner takes it all”type of market for multi-hop rides (Eisenmann et al., 2006).We suggest that cooperation or acquisition of competing plat-forms could be a worthwhile consequence. In fact, the Eu-ropean ride sharing market currently experiences a processof such concentration.14 In the U.S. in contrast, there stillexists a large variety of (local) ride sharing platforms (Chanand Shaheen, 2012). However, extensive distances betweenareas may limit the concentration potentials.
4.3 Platform Envelopment
The business potential of platforms can be severely eroded or“hijacked" by adjacent platforms catering to similar customers(Eisenmann et al., 2011a). Consequently, compatibility andinter-operability decisions are of strategic importance (Eisen-mann et al., 2011b).
Platforms adjacent to the ride sharing market includerailway and long-distance buses. Given their different posi-tioning in the price-quality space, the risk of envelopment maynot be imminent. Still, multi-hop ride sharing platforms maywant to consider establishing interfaces with other transporta-tion modes. If properly executed, such multi-modal mobilityplatforms may emerge as a new dominant business model.Companies like goeuro.com, moovel.com, fromAtoB.com, orrome2rio.com have started into this very direction.
To succeed in establishing such solutions, platform opera-tors need to incorporate appropriate search functionality toenable users to specifically retrieve suitable ride combinations,possibly routing via cities not taken into account before. Thiscould be supported by GPS- and live traffic data. Suppliers ofconnecting rides may be informed in case feeding rides arestuck in traffic and—if the delay is unacceptable for waiting—alternative connecting rides may be preselected and reserved.For such systems to function, ride sharing platforms wouldideally provide standard interfaces for other service providersto access their ride base. However, they will only offer suchan API if the booking process remains in their hands and is
14http://techcrunch.com/2015/04/15/blablacar-acquires-its-biggest-competitor-carpooling-com-to-dominate-european-market/
10 To appear in Business & Information Systems Engineering
3 Institute of Information Systems and Marketing (IISM)
0.00
0.20
0.40
0.60
0.80
1.00
1.20
1.40
1.60
1.80
2.00
0 10 20 30 40 50 60 70 80 90 100
Final graphic (n=100)
platform size (%)
rid
e li
qu
idity
direct + multi-hop rides
direct rides
(a) Ride liquidity
4 Institute of Information Systems and Marketing (IISM)
0.00
0.10
0.20
0.30
0.40
0.50
0.60
0.70
0.80
0.90
1.00
0 10 20 30 40 50 60 70 80 90 100
Final graphic (n=100)
platform size (%)
Qu
alif
ied
co
nn
ec
ted
ne
ss
τ = 1
τ = 4
τ = 20
(b) Qualified network connectedness
Figure 8: Ride liquidity and qualified network connectedness for varying platform size.
not circumvented. A possible path establish customer loyaltyof both drivers and riders is to offer auxiliary services such assupport for creating more successful ride offers (e.g., by usingprofile photos, descriptions, choice of auspicious stopovers),insurance, or customer loyalty and bonus programs (e.g.,awarding miles). To this end, traditional mobility operatorsand other protagonists of the Sharing Economy like Airbnbmay serve as an inspiration (Malhotra and Van Alstyne, 2014).
Transaction management, in addition to pricing and book-ing, may eventually entail the coordination and potentiallyeven the maintenance of suitable meeting points to facilitateMHRS.15 This may even lead to new strategic partnerships,e.g. with gas station operators.16
5 | Conclusion
Ride sharing is a sustainable form of transportation. Informa-tion Systems have improved its accessibility and transparencyby providing online supply data and facilitating access andsearch. Consequently, it may be about to leave behind itsniche status in low-income and student milieus. To achievethis, ride sharing platforms need to embrace new operationalparadigms and leverage IS in more sophisticated ways. In thispaper, we have illustrated that MHRS can greatly increasemarket liquidity and city connectedness. The impact on con-nectedness is particular pronounced when requiring a highnumber of daily trips, i.e. robust schedules. Smaller citiesbenefit most from allowing multiple hops, our study, how-
ever, is based on the largest German cities. We hence surmisethat our analysis most likely underestimates the potential ofMHRS. Furthermore, we have shown that MHRS represents ahighly competitive mode of inter-city transportation in termsof time and cost when compared to its most likely alternativestrain and bus.
Our analysis is based on actual market data from a plat-form without MHRS capabilities. By doing so, we contributeto the understanding of ride sharing and MHRS as much ofthe previous research on that subject was limited to mod-eling and computational aspects. Moreover, we argue thatleveraging IS technology and e-business practices will helpto further grow ride sharing and the novel concept of MHRStowards a more generally adopted mode of transportation.In particular, ride sharing platforms may benefit from thefollowing strategies:
Implementing multi-hop search: Given the great poten-tial of combining direct rides, operators should offer efficientand simple search procedures for realizing MHRS. To ensureusability, this function should also provide appealing andinformative schedule visualizations.
Active management of pricing, booking, and paymentprocesses: Platform operators need to assume pricing them-selves to gain access to user cash flows and hence to establisha profitable provision model. Moreover, this enables activepricing of MHRS with the perspective of creating an even
15Making it from one meeting point to another introduces hassle. Everyone who ever changed trains from Gare de L’Est to Gare de Lyon in Paris will certainlyagree.
16These are conveniently located and should be interested in ride sharing activities for at least two reasons: i) Drivers are likely to fuel their cars andpurchase other products and ii), petrol companies may improve their image by actively supporting ride sharing—a fuel-efficient and thus sustainable activitybeyond all doubt.
To appear in Business & Information Systems Engineering 11
more competitive service, potentially even in comparison todirect rides.
Coordination of transfers: Unlike central railway stationsor airports, there is usually no single meeting point for ridersand drivers in a given city. Hence, MHRS-oriented systemsneed to encourage the synchronization of transfer time andlocation.17
Improvement of data services: Current ride sharing IS arerudimentary. The use of real-time and location-based servicesallows to provide advance information on schedule updates,delays, or alternative ride opportunities. Also API provisionto third party intermediaries will increase reach, customerbase, and interoperability.
Market share expansion: As the two-sided ride sharingmarket entails winner-takes-it-all properties, data integra-tion or acquisition of competing platforms strengthens anoperators position.
Information technology is omnipresent in day to day lifeand users start to deal with complex services like peer-to-peermarket platforms in a natural way. Ride sharing can play agreater role in future mobility systems, as it compares wellagainst other modes of transportation in terms of cost andtravel time. Going forward, the emergence of self-driving carswill transform streets into cyber-physical systems and blurthe borders between “passengers” and “drivers.” This willfurther reduce the importance of car ownership and affectevery category of car-based mobility (Figure 1). Informationsystems can thus contribute to build a better world by creat-ing novel, connected, and shared mobility services. Multi-hopride sharing may play a vibrant part therein.
References
Amey, A., J. Attanucci, and R. Mishalani (2011). Real-timeridesharing. Transportation Research Record: Journal of theTransportation Research Board 2217(1), 103–110.
Bardhi, F. and G. M. Eckhardt (2012). Access-based con-sumption: The case of car sharing. Journal of ConsumerResearch 39(4), 881–898.
Basole, R. C. and W. B. Rouse (2008). Complexity of servicevalue networks: Conceptualization and empirical investi-gation. IBM Systems Journal 47(1), 53–70.
Beul-Leusmann, S., C. Samsel, M. Wiederhold, K.-H. Krem-pels, E.-M. Jakobs, and M. Ziefle (2014). Usability evalua-tion of mobile passenger information systems. In Design,User Experience, and Usability. Theories, Methods, and Toolsfor Designing the User Experience, pp. 217–228. Springer.
Bicocchi, N. and M. Mamei (2014). Investigating ride sharingopportunities through mobility data analysis. Pervasive andMobile Computing 14(2014), 83–94.
Blau, B., T. Conte, and C. van Dinther (2010). A multidimen-sional procurement auction for trading composite services.Electronic Commerce Research and Applications 9(5), 460–472.
Blau, B., C. van Dinther, T. Conte, Y. Xu, and C. Weinhardt(2009). How to coordinate value generation in servicenetworks. Business & Information Systems Engineering 1(5),343–356.
Bohmann, T., J. M. Leimeister, and K. Möslein (2014). Servicesystems engineering-a field for future information systemsresearch. Business & Information Systems Engineering 6(2),73–79.
Botsman, R. and R. Rogers (2010). What’s mine is yours. NewYork: HarperBusiness.
Brereton, M., P. Roe, M. Foth, J. M. Bunker, and L. Buys(2009). Designing participation in agile ridesharing withmobile social software. In Proceedings of the 21st AnnualConference of the Australian Computer-Human InteractionSpecial Interest Group: Design: Open 24/7, pp. 257–260.ACM.
Chan, N. D. and S. A. Shaheen (2012). Ridesharing in northamerica: Past, present, and future. Transport Reviews 32(1),93–112.
Cohen, B. and J. Kietzmann (2014). Ride on! mobility busi-ness models for the sharing economy. Organization & Envi-ronment 27(3), 279–296.
Coltin, B. J. and M. Veloso (2013). Towards ridesharing withpassenger transfers. In Proceedings of the 2013 internationalconference on Autonomous agents and multi-agent systems,pp. 1299–1300. International Foundation for AutonomousAgents and Multiagent Systems.
Cordeau, J.-F., P. Toth, and D. Vigo (1998). A survey of opti-mization models for train routing and scheduling. Trans-portation Science 32(4), 380–404.
Cusumano, M. A. (2014). How traditional firms must competein the sharing economy. Communications of the ACM 58(1),32–34.
Deakin, E., K. T. Frick, and K. M. Shively (2010). Marketsfor dynamic ridesharing? Transportation Research Record:Journal of the Transportation Research Board 2187(1), 131–137.
Dedrick, J. (2010). Green IS: Concepts and Issues for Informa-tion Systems Research. Communications of the Associationfor Information Systems 27(1), 173–184.
Drews, F. and D. Luxen (2013). Multi-hop ride sharing. InProceedings of the Sixth International Symposium on Combi-natorial Search, pp. 71–79.
17Such optimization could leverage the rich body of research on optimal transit design and train scheduling. See Cordeau et al. (1998) and Guihaire andHao (2008) for comprehensive reviews.
12 To appear in Business & Information Systems Engineering
Eisenmann, T., G. Parker, and M. Van Alstyne (2011a). Plat-form envelopment. Strategic Management Journal 32(12),1270–1285.
Eisenmann, T., G. Parker, and M. W. Van Alstyne (2006).Strategies for two-sided markets. Harvard Business Re-view 84(10), 92–101.
Eisenmann, T. R., G. Parker, and M. Van Alstyne (2011b).Opening platforms: how, when and why? In A. Gawer(Ed.), Platforms, Markets and Innovation, pp. 131–162. Ed-ward Elgar Publishing.
Erlander, S. and N. F. Stewart (1990). The gravity model intransportation analysis: theory and extensions, Volume 3.Utrecht: Brill Academic Publishers.
Evans, D. S. (2003). The antitrust economics of multi-sidedplatform markets. Yale Journal on Regulation 20(2), 325–382.
Furuhata, M., M. Dessouky, F. Ordóñez, M.-E. Brunet, X. Wang,and S. Koenig (2013). Ridesharing: The state-of-the-art andfuture directions. Transportation Research Part B: Method-ological 57(2013), 28–46.
Gefen, D. and D. W. Straub (2004). Consumer trust in b2ce-commerce and the importance of social presence: experi-ments in e-products and e-services. Omega 32(6), 407–424.
Goebel, C., H.-A. Jacobsen, V. del Razo, C. Doblander,J. Rivera, J. Ilg, C. Flath, H. Schmeck, C. Weinhardt,D. Pathmaperuma, H.-J. Appelrath, M. Sonnenschein,S. Lehnhoff, O. Kramer, T. Staake, E. Fleisch, D. Neumann,J. Strüker, K. Erek, R. Zarnekow, H. Ziekow, and J. Lässig(2014). Energy informatics. Business & Information SystemsEngineering 6(1), 25–31.
Guihaire, V. and J.-K. Hao (2008). Transit network designand scheduling: A global review. Transportation ResearchPart A: Policy and Practice 42(10), 1251–1273.
Gurvich, I., M. Lariviere, and A. Moreno (2014). Staffing ser-vice systems when capacity has a mind of its own. Workingpaper. Available at SSRN 2336514.
Heck, E. v. and P. Vervest (2007). Smart business networks:how the network wins. Communications of the ACM 50(6),28–37.
Herbawi, W. M. and M. Weber (2012). A genetic and insertionheuristic algorithm for solving the dynamic ridematchingproblem with time windows. In Proceedings of the four-teenth international conference on Genetic and evolutionarycomputation conference, pp. 385–392. ACM.
Hou, Y., X. Li, and C. Qiao (2012). Tictac: From transfer-incapable carpooling to transfer-allowed carpooling. InGlobal Communications Conference (GLOBECOM), 2012IEEE, pp. 268–273. IEEE.
Jones, K. and L. N. Leonard (2008). Trust in consumer-to-consumer electronic commerce. Information & Manage-ment 45(2), 88–95.
Kim, C., M. Mirusmonov, and I. Lee (2010). An empirical ex-amination of factors influencing the intention to use mobile
payment. Computers in Human Behavior 26(3), 310–322.Kleiner, A., B. Nebel, and V. A. Ziparo (2011). A mechanism
for dynamic ride sharing based on parallel auctions. InIJCAI, Volume 11, pp. 266–272.
Lequerica, I., M. Garcia Longaron, and P. M. Ruiz (2010).Drive and share: efficient provisioning of social net-works in vehicular scenarios. Communications Magazine,IEEE 48(11), 90–97.
Leukel, J., S. Kirn, and T. Schlegel (2011). Supply chain as aservice: a cloud perspective on supply chain systems. IEEESystems Journal 5(1), 16–27.
Malhotra, A. and M. Van Alstyne (2014). The dark side of thesharing economy... and how to lighten it. Communicationsof the ACM 57(11), 24–27.
Rayle, L., S. Shaheen, N. Chan, D. Dai, and R. Cervero (2014).App-based, on-demand ride services: Comparing taxi andridesourcing trips and user characteristics in san francisco.Working Paper.
Rochet, J.-C. and J. Tirole (2003). Platform competitionin two-sided markets. Journal of the European EconomicAssociation 1(4), 990–1029.
Rochet, J.-C. and J. Tirole (2006). Two-sided markets: aprogress report. The RAND Journal of Economics 37(3),645–667.
Shaheen, S., D. Sperling, and C. Wagner (1998). Carsharingin europe and north american: Past, present, and future.Transportation Quarterly 52(3), 35–52.
Shaheen, S. A., M. A. Mallery, and K. J. Kingsley (2012). Per-sonal vehicle sharing services in north america. Researchin Transportation Business & Management 3(2012), 71–81.
Slee, T. (2013). Some obvious things about internet reputa-tion systems. Working Paper.
Sundararajan, A. (2013). From zipcar to the sharing economy.Harvard Business Review.
Teal, R. F. (1987). Carpooling: who, how and why. Trans-portation Research Part A: General 21(3), 203–214.
Teubner, T. (2014). Thoughts on the Sharing Economy. InProceedings of the International Conference on e-Commerce,pp. 322–326.
Teubner, T., M. T. P. Adam, S. Camacho, and K. Hassanein(2014). Understanding resource sharing in c2c platforms:The role of picture humanization. In Proceedings of the 25thAustralasian Conference on Information Systems.
vom Brocke, J., R. T. Watson, C. Dwyer, S. Elliot, andN. Melville (2013). Green information systems: Directivesfor the is discipline. Communications of the Association forInformation Systems 33(30), 509–520.
Watson, R. T., M.-C. Boudreau, and A. J. Chen (2010). In-formation systems and environmentally sustainable devel-opment: Energy informatics and new directions for theIS community. Management Information Systems Quar-terly 34(1), 23–38.

To appear in Business & Information Systems Engineering 13
Zhao, D., D. Zhang, E. H. Gerding, Y. Sakurai, and M. Yokoo(2014). Incentives in ridesharing with deficit control. InProceedings of the 2014 International Conference on Au-tonomous Agents and Multi-agent Systems (AAMAS), pp.1021–1028. International Foundation for AutonomousAgents and Multiagent Systems.