Embed Size (px)
Citation preview
The economics of medicaid
assessing the costs and consequences
ediTed by Jason J. fichTner
An earlier version of chapter 3 was published by Jason J. Fichtner and John Pulito as “Medicaid Overview” (Mercatus Research, Mercatus Center at George Mason University, Arlington, VA, December 11, 2013), available online at http://mercatus.org/publication/medicaid-overview.
Copyright © 2014 by the Mercatus Center at George Mason University
Mercatus Center at George Mason University 3434 Washington Boulevard, 4th Floor Arlington, VA 22201
Library of Congress Cataloging-in-Publication Data
The economics of Medicaid : assessing the costs and consequences / edited by Jason J. Fichtner. p. ; cm. Includes index. ISBN 978-0-9892193-6-5 (paperback) -- ISBN 978-0-9892193-7-2 (kindle) I. Fichtner, Jason J., editor of compilation. II. Mercatus Center, issuing body. [DNLM: 1. United States. Patient Protection and Affordable Care Act. 2. Medicaid--economics. 3. Health Care Reform--economics--United States. 4. Health Policy--economics--United States. W 250 AA1] RA412.4 368.4’200973--dc23
2014003886
Printed in USA

chaPTer 4:
The sTaTe side of The budgeT equaTion
nina oWcharenko
Medicaid consumes a significant portion of state budgets. Taking into account significant federal contributions, Medicaid is the single largest budget item in most state
budgets, surpassing elementary and secondary education. In 2012, 24 percent of state budgets went to Medicaid. Medicaid spending is expected to climb in the future due to increased enrollment, including Medicaid expansion in the Patient Protection and Affordable Care Act (ACA),1 and increased costs of providing medical services in general.
To control spending, states typically use a variety of techniques, including adjusting reimbursement rates for providers, restricting eligibility and enrollment, limiting benefits and services, and adopting care management tools, such as managed care. Some states have also recommended more structural financing changes, such as block grants, as a means to better control costs over the long term. However, just as states are looking to control costs, many are also pursuing eligibility and benefit expansions. (See chapter 1, page 9, for an explanation of the incentives that states face to maximize their federal Medicaid funds while controlling their own costs.)
65

the state sIde oF the Budget equatIon
The current federal–state funding structure creates conflicting incentives that perpetuate these fiscal challenges. Efforts to influence the financing at the federal and state level will likely continue without reform.
hoW is The Program funded? The federal government pays a share of Medicaid costs and the states are responsible for the remaining share. The federal share is calculated by the federal medical assistance percentage (FMAP) formula and adjusted annually. In general, this percentage is determined based on each state’s personal income versus the national average income.2
States also receive enhanced federal funds for serving specific populations, such as Native Americans and Alaskans. They also receive enhanced federal funding for providing certain services, such as family planning, and for opting to extend eligibility or services to nonmandatory groups.3 And administrative costs, which account for about 5 percent of Medicaid spending, are funded separately and typically matched at a 50 percent rate by the federal government, but with exceptions as well.4
In response to the economic downturn, the American Recovery and Reinvestment Act of 2009 provided a temporary increase in the federal match rate to states from October 2008 to June 2011. The average federal share of Medicaid spending in 2010 increased to a high of 67 percent, leaving the average state share at a low of 33 percent.5 In 2012, when the additional federal funds expired, the average federal share dropped back to its historic average of 57 percent, increasing the average state share to 43 percent.
Most recently, the ACA provides an enhanced federal match to cover costs for expanding coverage to childless adults earning up to 138 percent of the federal poverty level. States will receive a 100 percent federal match rate for this expansion group in 2014, 2015, and 2016, and then the federal share will gradually phase down to 90
66

nIna owcharenko
percent by 2020. However, this enhanced match is only for the newly eligible population. States will continue to receive the standard federal matching rates for currently eligible populations, including those previously eligible but not enrolled. By 2020, combining both enhanced and standard rates, the average federal share of Medicaid spending is projected to be 60 percent, leaving states with 40 percent on average.6
The ACA also increased the federal matching rate for primary care providers in Medicaid by raising payment rates for this group of physicians to Medicare-level rates. This enhanced federal match is temporary and is scheduled to expire at the end of 2014.7
Counterintuitively, total Medicaid spending is typically highest in wealthier states, with a 50 percent match. As American Enterprise Institute scholar Robert Helms points out, “Even though wealthier states have lower matching rates, they have expanded their programs to a greater extent than the states that typically have higher proportions of poor people.”8
WhaT PercenTage of sTaTe budgeTsgo ToWard medicaid?
In terms of total state expenditures, Medicaid represents the single largest item in state budgets. Medicaid represented 22.2 percent of spending across all states in FY2010, 23.7 in FY2011, and an estimated 23.9 percent in FY2012.9 To compare, spending for elementary and secondary education was 20.4 percent in FY2010, 20.2 percent in FY2011, and estimated 19.8 percent in FY2012.10
It is worth noting, however, that these total state expenditures take into account federal contributions. Federal grants to Medicaid represented 62.7 percent of total state Medicaid spending in FY2011, while state general fund spending represented 26.9 percent.11 By comparison, federal grants represented only 21.0 percent of total elementary and secondary education expenditures in FY2011, while state general fund expenditures represented 66.5 percent.12 (See figure 1.)
67

Total State Expenditures for Elementary and Secondary Educa<on (le>) and Medicaid (right) by Fund Source,
Fiscal Year 2011
Source: Na:onal Associa:on of State Budget Officers, "State Expenditure Report: Examining Fiscal 2010-‐2012 State Spending."
State Expenditures for Medicaid by Fund Source, Fiscal 2011
Source: Na;onal Associa;on of State Budget Officers, "State Expenditure Report: Examining Fiscal 2010-‐2012 State Spending."
the state sIde oF the Budget equatIon
Figure 1. Total State Expenditures for Elementary and Secondary Education (left) and Medicaid (right) by Funding Source, Fiscal Year 2011
Source: National Association of State Budget Officers, “State Expenditure Report: Examining Fiscal 2010-2012 State Spending.”
sTaTe sPending by enrollee,grouP, and service
State Medicaid spending varies by state for many reasons, including eligibility, benefits, and cost of care. States are required to provide care to certain mandatory populations and for certain mandatory services.13 But, beyond these designations, states are permitted to extend their Medicaid programs to serve certain optional populations and provide certain optional services. Furthermore, states have the latitude to administer their programs differently in other ways, such as determining provider reimbursement levels. Because of such variations, no two Medicaid programs are alike at the state level.
According to the Henry J. Kaiser Family Foundation, national per enrollee spending in FY2009 was $5,527.14 The highest per enrollee spending by state was $9,577 in Connecticut, $9,143 in the District of Columbia, and $8,960 in New York. The lowest per enrollee spending by state was $3,527 in California, $3,979 in Georgia, and $4,081 in Alabama.
By group, 65 percent of national Medicaid spending in FY2009 went to the elderly and disabled, while the remaining 35 percent was
68

nIna owcharenko
spent on adults and children.15 State-level spending on the elderly and disabled ranged from a high of 77 percent in the District of Columbia to 76 percent in North Dakota and New Jersey, and a low of 51 percent in Delaware, 54 percent in Alaska, and 55 percent in Georgia. State level spending on working-aged adults and children ranged from a high of 59 percent in Arizona and New Mexico and 49 percent in Delaware, and a low of 24 percent in New Jersey and North Dakota and 27 percent in West Virginia and Pennsylvania.
By services, 65.6 percent of national Medicaid spending in FY2011 was on acute care services and 30.2 percent on long-term care services.16 State-level spending on acute care ranged from a high of 91.9 percent in Hawaii, 88.9 percent in New Mexico, and 88.3 percent in Vermont, to a low of 37.6 percent in North Dakota, 45.4 percent in New Hampshire, and 50 percent in Connecticut. State-level spending on long-term care ranged from a high of 62.1 percent in North Dakota and 46.7 percent in Connecticut and Wyoming, to a low of 6.9 percent in Hawaii, 8.9 percent in Vermont, and 10.3 percent in New Mexico.
WhaT are The sTaTe medicaid sPending TraJecTories?
While year-to-year spending fluctuates, the long-term spending trend in Medicaid remains on an upward trajectory. In 1990, combined federal and state spending on Medicaid was $72.2 billion, with the state share at $31.3 billion and a total enrollment of 22.9 million.17 By 2000, total Medicaid spending increased to $206.2 billion, with the state share at $89.2 billion and enrollment at 34.5 million. In 2010, total Medicaid spending reached $401.5 billion, with the state share at $131.7 billion and total enrollment estimated to be 53.7 million. (See figure 2.)
The Government Accountability Office’s (GAO’s) state and local fiscal outlook report warns of the following: “The primary driver of fiscal challenges for the state and local government sector in the long term continues to be the projected growth in health-related costs.
69

Total Medicaid Spending and State Medicaid Spending, Historical and Projected
Total Expenditures
State Expenditures
0
100
200
300
400
500
600
700
800
900
1966
1968
1970
1972
1974
1976
1978
1980
1982
1984
1986
1988
1990
1992
1994
1996
1998
2000
2002
2004
2006
2008
2010
2012
2014
2016
2018
2020
Billions of US$
Total Medicaid Spending and State Medicaid Spending, Historical and Projected
the state sIde oF the Budget equatIon
Figure 2. Total Medicaid Spending and State Medicaid Spending, Historical and Projected
Source: Centers for Medicare and Medicaid Services, 2012 Actuarial Report on the Financial Outlook for Medicaid.
Specifically, state and local expenditures on Medicaid and the cost of health care compensation for state and local government employees and retirees are projected to grow more than GDP.”18 In FY2011, Medicaid spending represented 2.8 percent of GDP and is expected to reach 3.2 percent of GDP by FY2021.19
In its 2008 report, before the enactment of the ACA, the Centers for Medicare and Medicaid Services, Office of the Actuary projected that combined federal and state spending on Medicaid would reach $673.7 billion in FY2017, with the state share at $290.3 billion and total enrollment reaching 55.1 million.20 After enactment of the ACA, the Actuary’s 2011 report projected that total Medicaid spending would reach $871.1 billion in 2020, with the state share reaching $340.0 billion and enrollment topping 85 million.21
But predicting future spending is always tentative and the Supreme Court decision in National Federation of Independent Business v. Sebelius, which overturned a key ACA Medicaid provision, underscores that uncertainty. The Supreme Court decision clarified that
70
nIna owcharenko
states that chose not to expand their Medicaid program to childless adults would lose only the enhanced funding for the expansion population—not all federal funding for Medicaid.22
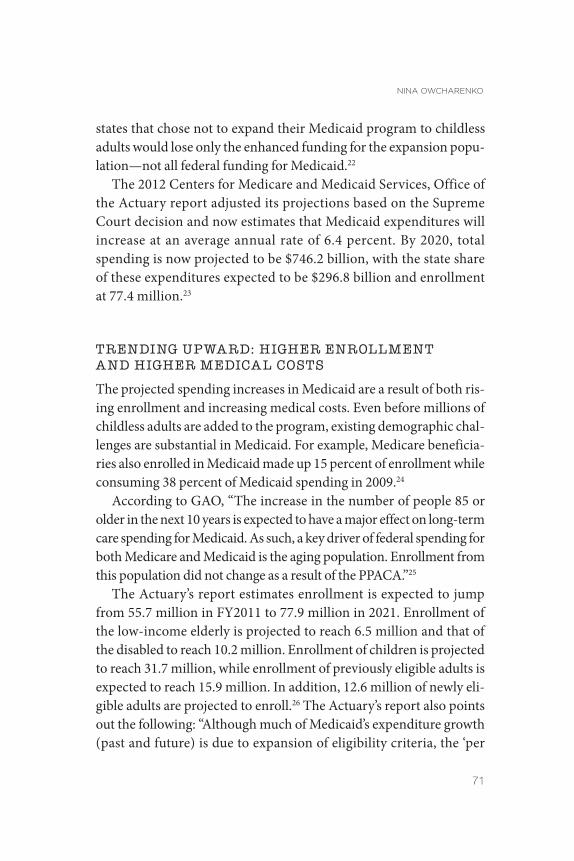
The 2012 Centers for Medicare and Medicaid Services, Office of the Actuary report adjusted its projections based on the Supreme Court decision and now estimates that Medicaid expenditures will increase at an average annual rate of 6.4 percent. By 2020, total spending is now projected to be $746.2 billion, with the state share of these expenditures expected to be $296.8 billion and enrollment at 77.4 million.23
Trending uPWard: higher enrollmenTand higher medical cosTs
The projected spending increases in Medicaid are a result of both rising enrollment and increasing medical costs. Even before millions of childless adults are added to the program, existing demographic challenges are substantial in Medicaid. For example, Medicare beneficiaries also enrolled in Medicaid made up 15 percent of enrollment while consuming 38 percent of Medicaid spending in 2009.24
According to GAO, “The increase in the number of people 85 or older in the next 10 years is expected to have a major effect on long-term care spending for Medicaid. As such, a key driver of federal spending for both Medicare and Medicaid is the aging population. Enrollment from this population did not change as a result of the PPACA.”25
The Actuary’s report estimates enrollment is expected to jump from 55.7 million in FY2011 to 77.9 million in 2021. Enrollment of the low-income elderly is projected to reach 6.5 million and that of the disabled to reach 10.2 million. Enrollment of children is projected to reach 31.7 million, while enrollment of previously eligible adults is expected to reach 15.9 million. In addition, 12.6 million of newly eligible adults are projected to enroll.26 The Actuary’s report also points out the following: “Although much of Medicaid’s expenditure growth (past and future) is due to expansion of eligibility criteria, the ‘per
71

the state sIde oF the Budget equatIon
Figure 3. 2011 and 2021 Per Enrollee Expenditures, by Category
Source: Centers for Medicare and Medicaid Services, 2012 Actuarial Report on the Financial Outlook for Medicaid.
enrollee’ costs for Medicaid have also usually increased significantly faster than per capita GDP.”27
According to the projections, total Medicaid spending per beneficiary will also rise to an average of $9,532 by FY2021, compared with $6,982 in FY2011.28 Average spending per disabled person will rise to $27,647 by FY2021; average spending per elderly individual will rise to $22,446; average spending per child will rise to $4,389; average spending on previously eligible adults will rise to $ 6,939; and spending will average $4,684 for newly eligible adults. (See figure 3.)
sTaTe efforTs To conTrol medicaid cosTs and sPending
Faced with higher spending, states—as administrators of this joint federal–state program—play a significant role in determining Medicaid costs and spending. Most recently, the Actuary’s report points out the following: “Following the expiration of temporary
72

nIna owcharenko
increases in the Federal matching rate, the States’ share of Medicaid expenditures have grown rapidly over the last 2 years—nearly 40 per-cent—and the States have acted to reduce provider payment rates and/ or optional benefits. Their actions had a substantial impact in 2012 and emphasize the difficulty in balancing Medicaid against other government programs in the context of States’ budgets.”29
States focus their efforts to control costs through a variety of policy initiatives. The Henry J. Kaiser Family Foundation’s 50 State Annual Medicaid Budget Survey offers an overview of such state budget actions. It found that 43 states implemented at least one cost containment measure in FY2013 and the same number plan to do so in FY2014.30 At the same time, 46 states reported implementing a program improvement in FY2013 and 47 states expect to in FY2014.
Provider rates. One of the most common tools used by states to control Medicaid costs is to adjust payment rates for health care providers serving Medicaid patients. Thirty-nine states implemented some rate restrictions on providers in FY2013, and 34 states adopted restrictions for FY2014.31 Hospitals and nursing homes were most targeted.
Of course, one consequence of provider cuts is that fewer providers will participate in the program. Today, physicians are less willing to accept new Medicaid patients.32 The access issue will be increasingly important as millions of new patients are expected to join the program as a result of the ACA. Possibly because of these challenges, the Kaiser survey found that 40 states increased certain provider rates in FY2013 and 44 adopted increases for FY2014.33 As noted earlier, the ACA does provide additional federal dollars to states to increase payment rates for primary care physicians in order to meet Medicare levels. This boost in federal funding, however, is temporary, and it remains unclear whether states will resume lower reimbursement rates once these federal funds expire at the end of 2014.
Eligibility and enrollment. States have also considered limiting eligibility and enrollment to control Medicaid growth. Policies such as scaling back eligible populations to lower income levels and freezing or capping enrollment for some groups have been initiated by some
73

the state sIde oF the Budget equatIon
states. However, such changes have been more limited than in previous years. According to the Annual Medicaid Budget Survey, 5 states scaled back eligibility for adults in FY2013,34 whereas in FY2006, for example, 18 states adopted eligibility restrictions.35
Some of this change is likely a result of the “maintenance of effort” (MOE) requirement in the American Recovery and Reinvestment Act of 2009, which prohibited states from implementing policy changes that would restrict eligibility or enrollment, as a condition of receiving the additional federal funding.36 Some is a likely result of the overall push of the ACA to expand, not restrict, eligibility and enrollment. In fact, the Kaiser survey found 45 states reported adopting enrollment expansions or enhancements (such as streamlining application and renewal processes) for FY2014.37
Benefits. Adjusting benefits and benefit designs are other cost control tools used by the states. These changes can focus on eliminating or limiting a type of benefit or service. For example, in FY2013, 14 states adopted some level of benefit restrictions.38 Of those, 5 states reported eliminating at least one benefit all together.39
Pharmaceutical benefits are another area that states target for cost control. According to the Henry J. Kaiser Family Foundation survey, 24 states issued some cost containment measures to manage pharmaceutical costs for FY2013 and 25 adopted new policies for FY2014.40
Policies range from preferred drug lists, to supplemental rebates, to limiting the number of allowable prescriptions.
States also use premiums and cost sharing to manage costs. The Deficit Reduction Act of 2005 provided additional leeway for states to require enrollees at various income levels to participate in cost-sharing arrangements, whether premiums or copays. In FY2013, 39 states reported premium requirements for some group in Medicaid.41
Care management. States are looking to control costs by more effectively coordinating and managing care delivery for Medicaid enrollees. Most notable is the shift toward Medicaid managed care. States are able to control costs by capping reimbursement to private insurers. According to the Medicaid and CHIP Payment and Access
74

nIna owcharenko
Commission: “In 1995, 15 percent of Medicaid enrollees were enrolled in such an arrangement. By 2011, half of all Medicaid enrollees were enrolled in a comprehensive risk-based plan.”42
States are also looking to adopt policies focused on the most costly enrollees—the disabled and the elderly. Only 24 percent of enrollees are elderly or disabled, but they represent 64 percent of total Medicaid spending. According to the Congressional Research Service, long-term care services account for more than one-third of all Medicaid spending.43 Increasingly, states are focused on adopting policies to better coordinate care and costs for these long-term care services.
Other cost containment efforts. In the past, some states’ cost containment strategies looked beyond their existing scope of authority and turned to federal waivers44 to experiment with larger budget strategies. Vermont and Rhode Island are two notable examples.45
Both states negotiated an agreement with the federal government to accept capped federal funding over a period of time with some policy changes. The concept behind these initiatives was to demonstrate that states could keep spending below the federal cap if given additional tools to manage the program.
Along these same lines, there is growing interest in the states to advance block grant concepts for Medicaid. The Republican Governors Association sent a letter in support of the FY2012 House budget proposal that included a Medicaid block grant structure.46 (See chapter 7, page 138, for more information on the mechanics of block grants.)
It could be argued that not opting for the ACA Medicaid expansion is also a form of cost containment. Analysis shows the long-term cost implications of the Medicaid expansion may outweigh any temporary, short-term benefit.47
WhaT incenTives do sTaTes face givenfederal funding formulas?
The open-ended nature of the Medicaid funding structure and the joint federal–state partnership creates perverse incentives at both the
75

the state sIde oF the Budget equatIon
state and federal levels. States are driven to leverage as many federal dollars as possible, and the federal government uses its funding power to persuade states to adopt certain policies. For every dollar a state puts in, the federal government matches one for one and sometimes provides even more.48
As noted, the federal grants are a key component of the state budgets. Unfortunately, this leads states to spend funds on Medicaid they otherwise would not have. The ACA is a good example. Total Medicaid spending is expected to increase by 13 percent in FY2014 for states opting for the new ACA Medicaid expansion (and its enhanced federal funding), compared with 6.8 percent in states opting not to expand.49 Thus, states opting for the expansion are fueling overall Medicaid spending.
The incentive to maximize and leverage unlimited federal dollars has led states to develop financing schemes such as provider taxes, where states tax Medicaid providers in order to gain the federal match and then “repay” these providers with Medicaid reimbursement.50
Although these provider tax techniques are under greater scrutiny, states’ use of them continues to grow. According to the Kaiser survey: “At the beginning of FY 2003, a total of 32 states had at least one provider tax in place. … By FY 2013, all but one state (Alaska) has one or more provider taxes in place.”51
Federal Medicaid funding policies also create perverse incentives for the states to adopt certain federal policies, such as expanding coverage, services, and benefits. This is most evident in the use of the enhanced match rate under the ACA to entice states to extend Medicaid eligibility to the childless adult population.52 Another example is CHIP, which uses enhanced federal Medicaid match rates to coerce states into agreeing to expand coverage to children above the normal Medicaid eligibility levels. Other examples include enhanced federal match rates for family planning services, certain long-term care initiatives, and for the adoption of health information technologies.53
76

nIna owcharenko
conclusion The fiscal challenges facing Medicaid are real. As the GAO report on the state and local fiscal outlook found: “The state and local government sector continues to face near-term and long-term fiscal challenges which add to the nation’s overall fiscal challenges.”54 Such warnings suggest that policy changes at the federal and state levels will be needed to address the long-term viability of the program. In the meantime, it is likely that the pressure to control Medicaid spending will continue to fall on the states, which in turn will push states to continue to explore new ways to address the fiscal challenges in Medicaid.
noTes 1. Patient Protection and Affordable Care Act, Pub. L. No. 111-148, 124 Stat. 119 (2010)
(codified as amended sections of 42 U.S.C.).
2. See Joseph Antos’s more detailed explanation in chapter 1.
3. Henry J. Kaiser Family Foundation, “Medicaid Financing: An Overview of the Federal Medicaid Match Rate,” September 2012, 7, http://www.kaiserfamilyfoundation.files .wordpress.com/2013/01/8352.pdf.
4. Ibid., 9.
5. Office of the Actuary, Centers for Medicare and Medicaid Services, US Department of Health and Human Services, “2012 Actuarial Report on the Financial Outlook for Medicaid,” March 2013, 22, http://www.medicaid.gov/Medicaid-CHIP-Program -Information/By-Topics/Financing-and-Reimbursement/Downloads/medicaid -actuarial-report-2012.pdf.
6. Office of the Actuary, “2012 Actuarial Report on the Financial Outlook for Medicaid,” 22.
7. Health Care and Education Reconciliation Act of 2010, Pub. L. No. 111–152, § 1202 (enacted March 30, 2010). This law made several changes to the underlying Patient Protection and Affordable Care Act of 2010, Pub. L. No. 111-148 (enacted March 23, 2010).
8. Robert Helms, “Medicaid: The Forgotten Issue in Health Reform,” American Enterprise Institute Outlook No. 14, November 2009, 2, http://www.aei.org/files/2009/11/06 /14-HPO-Helms-g.pdf.
9. National Association of State Budget Officers, “State Expenditure Report,” 2012, 9, http://www.nasbo.org/sites/default/files/State%20Expenditure%20Report_1.pdf.
10. Ibid.
11. Ibid., 45.
12. Ibid., 14.
13. For a discussion of the mandatory and optional populations and services, see Henry J.
77

the state sIde oF the Budget equatIon
Kaiser Family Foundation, “Medicaid: An Overview of Spending on ‘Mandatory’ vs. ‘Optional’ Populations and Services,” June 2005, http://kaiserfamilyfoundation.files .wordpress.com/2013/01/medicaid-an-overview-of-spending-on.pdf.
14. Henry J. Kaiser Family Foundation, “Medicaid: A Primer,” March 2013, 43, http://kaiserfamilyfoundation.files.wordpress.com/2010/06/7334-05.pdf.
15. Ibid., 42.
16. Ibid., 44.
17. Office of the Actuary, “2012 Actuarial Report,” 22.
18. US General Accountability Office, “State and Local Governments’ Fiscal Outlook,” April 2013, 5, http://www.gao.gov/assets/660/654255.pdf.
19. Office of the Actuary, “2012 Actuarial Report,” 49, 50.
20. Office of the Actuary, Centers for Medicare and Medicaid Services, US Department of Health and Human Services, “2008 Actuarial Report on the Financial Outlook for Medicaid,” October 2008, 16, 18, http://medicaid.gov/Medicaid-CHIP-Program -Information/By-Topics/Financing-and-Reimbursement/Downloads/medicaid -actuarial-report-2008.pdf.
21. Office of the Actuary, Centers for Medicare and Medicaid Services, US Department of Health and Human Services, “2011 Actuarial Report on the Financial Outlook for Medicaid,” March 16, 2012, 19, http://medicaid.gov/Medicaid-CHIP-Program -Information/By-Topics/Financing-and-Reimbursement/Downloads/medicaid -actuarial-report-2011.pdf.
22. For a discussion of the new options, see Charles Blahous, “The Affordable Care Act’s Optional Medicaid Expansion: Considerations Facing State Governments,” Mercatus Center at George Mason University, March 5, 2013, http://mercatus.org/sites/default /files/Blahous_MedicaidExpansion_v1.pdf.
23. Office of the Actuary, “2012 Actuarial Report,” 22.
24. Kaiser Family Foundation, “Medicaid: A Primer,” 10.
25. US Government Accountability Office, “Patient Protection and Affordable Care Act: Effect on Long-Term Federal Budget Outlook Largely Depends on Whether Cost Containment Sustained,” January 2013, 24, http://www.gao.gov/assets/660/651702.pdf.
26. Office of the Actuary, “2012 Actuarial Report,” figure 4, 28.
27. Ibid., i.
28. Ibid., figure 5, 30.
29. Ibid., i.
30. Vernon Smith et al., “Medicaid in a Historic Time of Transition: Results from a 50-State Medicaid Budget Survey for State Fiscal Years 2013 and 2014,” Henry J. Kaiser Family Foundation, October 7, 2013, 86, 87, http://kaiserfamilyfoundation.files.wordpress.com /2013/10/8498-medicaid-in-a-historic-time4.pdf.
31. Ibid., 47.
32. Sandra L. Decker, “In 2011 Nearly One-Third of Physicians Said They Would Not Accept New Medicaid Patients, But Rising Fees May Help,” Health Affairs 31, no. 8 (2012): 1673–79.
33. Ibid.
78

nIna owcharenko
34. Smith et al., “Medicaid in a Historic Time of Transition,” 25.
35. Vernon Smith et al., “Low Medicaid Spending Growth amid Rebounding State Revenues: Results from a 50-State Medicaid Budget Survey State Fiscal Years 2006 and 2007” (Henry J. Kaiser Family Foundation, October 2006), 25, http://kaiserfamilyfoundation.files.wordpress.com/2013/01/7569.pdf.
36. The Affordable Care Act extended these restrictions until 2014 for adults and 2019 for children.
37. Smith et al., “Medicaid in a Historic Time of Transformation,” 4.
38. Ibid., 54.
39. Ibid.
40. Ibid., 55.
41. Ibid., 51.
42. Medicaid and CHIP Payment and Access Commission, “Medicaid Managed Care,” MACFacts, April 2013, https://sites.google.com/a/macpac.gov/macpac/publications /MACFacts-ManagedCare_2013-04.pdf?attredirects=1.
43. Kirsten J. Colello, “Medicaid Coverage of Long-Term Services and Supports,” Congressional Research Service, December 5, 2013, 1, http://www.fas.org/sgp/crs/misc /R43328.pdf.
44. See James Capretta, chapter 7 in this publication, “Reforming Medicaid.”
45. Robert Wood Johnson Foundation, “Rhode Island Pursues Health Reforms in Public and Private Sectors,” State Coverage Initiatives, February 18, 2009, http://www .statecoverage.org/node/1343.
46. Sarah Kliff and J. Lester Feder, “GOP Governors Want Medicaid Block Grants,” Politico, February 28, 2011, http://www.politico.com/news/stories/0211/50288.html.
47. Blahous, “The Affordable Care Act’s Optional Medicaid Expansion.”
48. For a discussion on the FMAP Multiplier, see Henry J. Kaiser Family Foundation, “Medicaid Financing: An Overview of the Federal Medicaid Match Rate,” 4.
49. Smith et al., “Medicaid in a Historic Time of Transition,” 19.
50. Ralph Lindeman, “Medicaid Faces Possible Funding Cuts, Health Law Implementation Challenges,” Daily Report for Executives, Bureau of National Affairs, January 16, 2013.
51. Smith et al., “Medicaid in a Historic Time of Transition,” 50.
52. Carter C. Price and Christine Eibner, “For States That Opt out of Medicaid Expansion: 3.6 Million Fewer Insured and $8.4 Billion Less in Federal Payments,” Health Affairs 32, no. 6 (2013): 1030–36. For an opposing view, see Edmund Haislmaier and Drew Gonshorowski, “State Lawmaker’s Guide to Evaluating Medicaid Expansion Projections,” Issue Brief No. 3720 (Heritage Foundation, September 7, 2012), http://www .heritage.org/research/reports/2012/09/state-lawmakers-guide-to-evaluating-medicaid -expansion-projections.
53. Henry J. Kaiser Family Foundation, “Medicaid Financing.”
54. US General Accountability Office, “State and Local Governments’ Fiscal Outlook,” 1.
79

abouT The mercaTus cenTer aT george mason
universiTy
The Mercatus Center at George Mason University is the world’s premier university source for market-oriented ideas—bridging the gap between academic ideas and real-world problems.
A university-based research center, Mercatus advances knowledge about how markets work to improve people’s lives by training graduate students, conducting research, and applying economics to offer solutions to society’s most pressing problems.
Our mission is to generate knowledge and understanding of the institutions that affect the freedom to prosper and to find sustainable solutions that overcome the barriers preventing individuals from living free, prosperous, and peaceful lives.
Founded in 1980, the Mercatus Center is located on George Mason University’s Arlington campus.
www.mercatus.org


![The economics of medicaid - Mercatus CenterHealth Care Reform--economics--United States. 4. Health Policy--economics--United States. W 250 AA1] RA412.4 368.4’200973--dc23 2014003886](https://img.pdfslide.us/doc/110x75/5fd74d06993ba17f86798b60/the-economics-of-medicaid-mercatus-center-health-care-reform-economics-united.jpg)