Embed Size (px)
Citation preview
The economics of gas and coal-fired
plants – signs of market failure?
Graham Weale - Chief Economist, RWE AG
Markus Roth - RWE Generation SE
IEA Electricity Supply Security Conference 1st October 2013
Forward Looking Statement
Projections of revenues, income, earnings per share, capital expenditures, dividends, capital structure or other financial items,
Statements of plans or objectives for future operations or of future competitive position,
Expectations of future economic performance; and
Statements of assumptions underlying several of the foregoing types of statements are forward-looking statements.
Also words such as “anticipate”, “believe”, “estimate”, “intend”, “may”, “will”, “expect”, “plan”, “project” “should” and similar expressions are
intended to identify forward-looking statements.
The forward-looking statements reflect the judgment of RWE's management based on factors currently known to it. No assurances can be
given that these forward-looking statements will prove accurate and correct, or that anticipated, projected future results will be achieved. All
forward-looking statements are subject to various risks and uncertainties that could cause actual results to differ materially from expectations.
Such risks and uncertainties include, but are not limited to, changes in general economic and social environment, business, political and legal
conditions, fluctuating currency exchange rates and interest rates, price and sales risks associated with a market environment in the throes of
deregulation and subject to intense competition, changes in the price and availability of raw materials, risks associated with energy trading
(e.g. risks of loss in the case of unexpected, extreme market price fluctuations and credit risks resulting in the event that trading partners do not
meet their contractual obligations), actions by competitors, application of new or changed accounting standards or other government agency
regulations, changes in, or the failure to comply with, laws or regulations, particularly those affecting the environment and water quality (e.g.
introduction of a price regulation system for the use of power grid, creating a regulation agency for electricity and gas or introduction of trading
in greenhouse gas emissions), changing governmental policies and regulatory actions with respect to the acquisition, disposal, depreciation
and amortisation of assets and facilities, operation and construction of plant facilities, production disruption or interruption due to accidents or
other unforeseen events, delays in the construction of facilities, the inability to obtain or to obtain on acceptable terms necessary regulatory
approvals regarding future transactions, the inability to integrate successfully new companies within the RWE Group to realise synergies from
such integration and finally potential liability for remedial actions under existing or future environmental regulations and potential liability
resulting from pending or future litigation. Any forward-looking statement speaks only as of the date on which it is made. RWE neither intends
to nor assumes any obligationto update these forward-looking statements. For additional information regarding risks, investors are referred to
RWE’s latest annual report and to other most recent reports filed with Frankfurt Stock Exchange and to all additional information published on
RWE’s Internet Web site.
This presentation contains certain forward-looking statements within the meaning of the US federal securities laws.
Especially all of the following statements
Page 2 RWE AG – CEA : Weale IEA Conference 01.10.2013
Page 3 RWE AG – CEA : Weale IEA Conference 01.10.2013
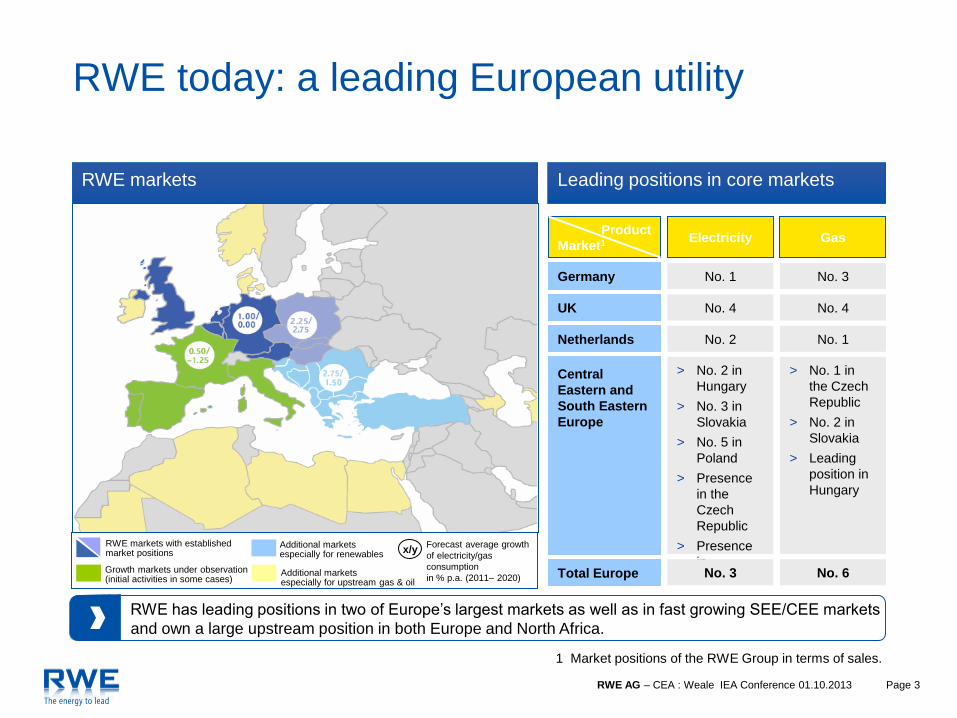
RWE today: a leading European utility
1 Market positions of the RWE Group in terms of sales.
RWE markets Leading positions in core markets
RWE has leading positions in two of Europe’s largest markets as well as in fast growing SEE/CEE markets
and own a large upstream position in both Europe and North Africa.
Gas Electricity Market1
Product
Germany No. 1 No. 3
UK No. 4 No. 4
> No. 2 in
Hungary
> No. 3 in
Slovakia
> No. 5 in
Poland
> Presence
in the
Czech
Republic
> Presence
in
Turkey
> No. 1 in
the Czech
Republic
> No. 2 in
Slovakia
> Leading
position in
Hungary
Central
Eastern and
South Eastern
Europe
Total Europe No. 3 No. 6
Netherlands No. 2 No. 1
x/y RWE markets with established market positions
Growth markets under observation (initial activities in some cases)
Additional markets especially for renewables
Additional markets especially for upstream gas & oil
Forecast average growth
of electricity/gas
consumption
in % p.a. (2011– 2020)
Page 4 RWE AG – CEA : Weale IEA Conference 01.10.2013
Agenda
1. Definition and determinants of „economics“ and key input
parameters
2. Power prices set through merit-order curve
3. Performance of plants and cost recovery
Page 5 RWE AG – CEA : Weale IEA Conference 01.10.2013
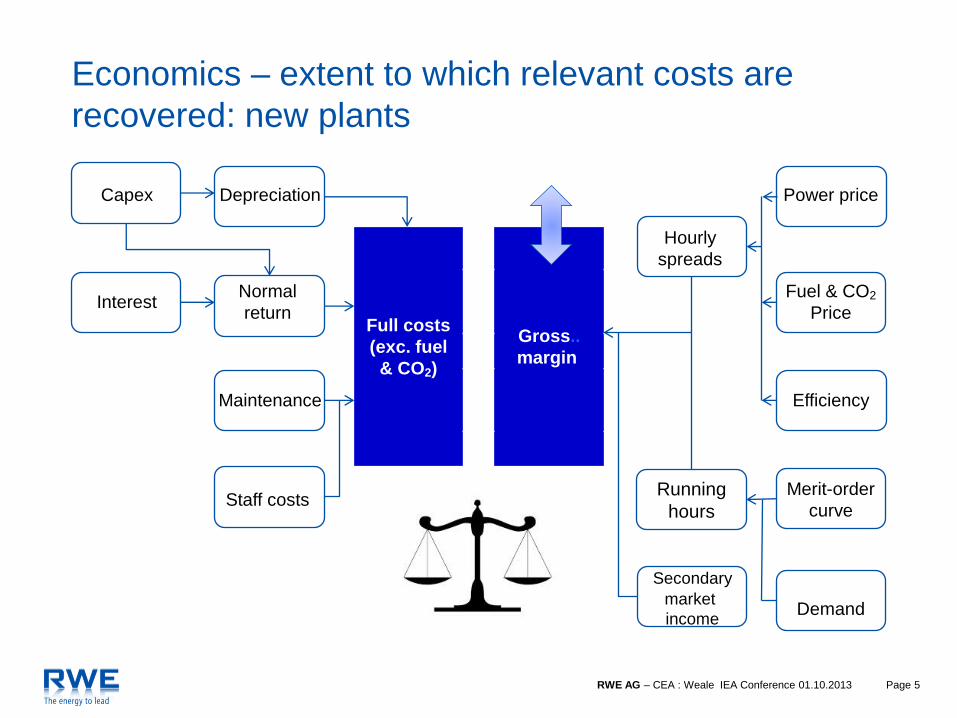
Capex Depreciation Power price
Full costs
(exc. fuel
& CO2)
Gross..
margin
Hourly
spreads
Interest Normal
return
Fuel & CO2
Price
Maintenance Efficiency
Staff costs Merit-order
curve
Secondary
market
income
Demand
Economics – extent to which relevant costs are
recovered: new plants
Running
hours
Page 6 RWE AG – CEA : Weale IEA Conference 01.10.2013
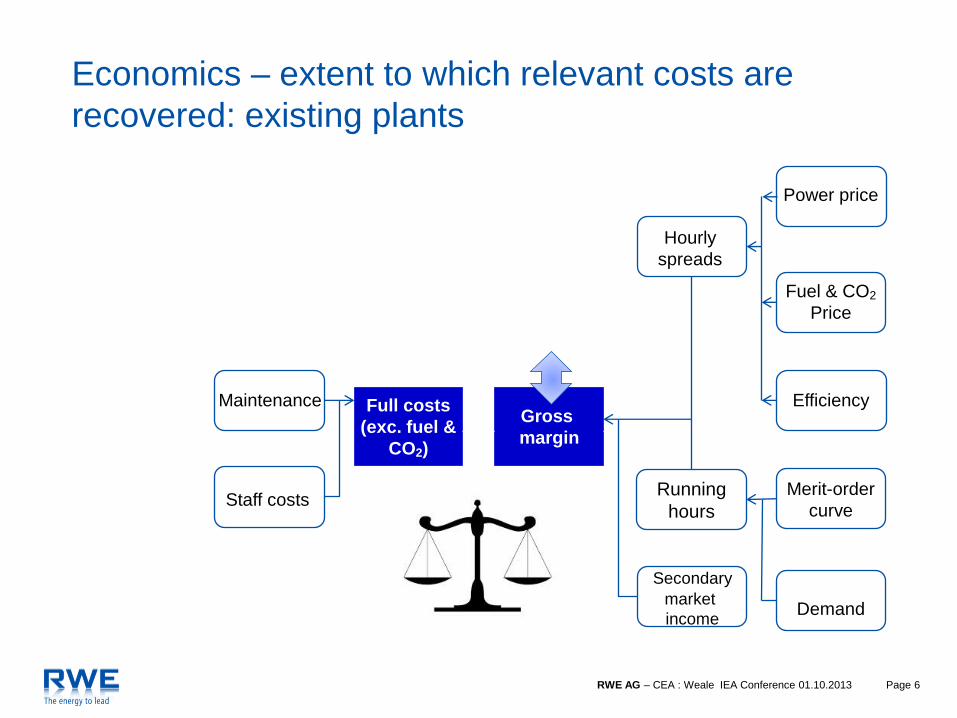
Depreciation Power price
Full costs
(exc. fuel &
CO2)
Hourly
spreads
Interest Normal
return
Fuel & CO2
Price
Maintenance Efficiency Full costs
(exc. fuel &
CO2)
Gross.
margin
Staff costs Merit-order
curve
Secondary
market
income
Demand
Economics – extent to which relevant costs are
recovered: existing plants
Running
hours
Page 7 RWE AG – CEA : Weale IEA Conference 01.10.2013
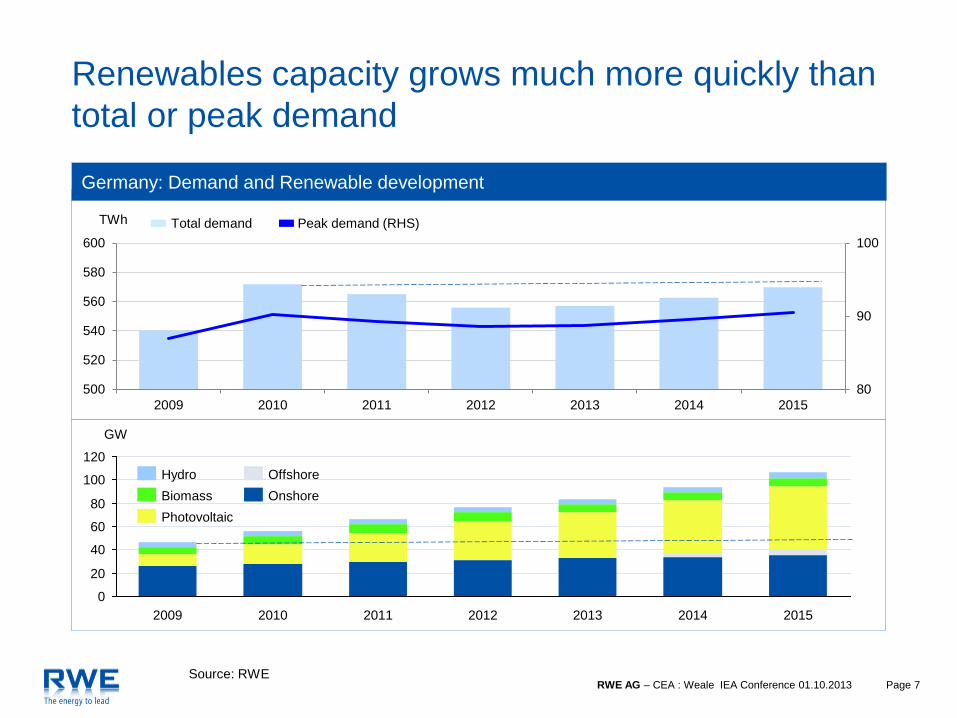
Renewables capacity grows much more quickly than
total or peak demand
80
90
100
500
520
540
560
580
600
2009 2010 2011 2012 2013 2014 2015
Total demand Peak demand (RHS)
GW Germany: Demand and Renewable development
TWh
2010 2011 2012 2013 2014 2015 2009
120
100
80
60
40
20
0
GW
Hydro
Biomass
Photovoltaic
Offshore
Onshore
Source: RWE
Page 8 RWE AG – CEA : Weale IEA Conference 01.10.2013
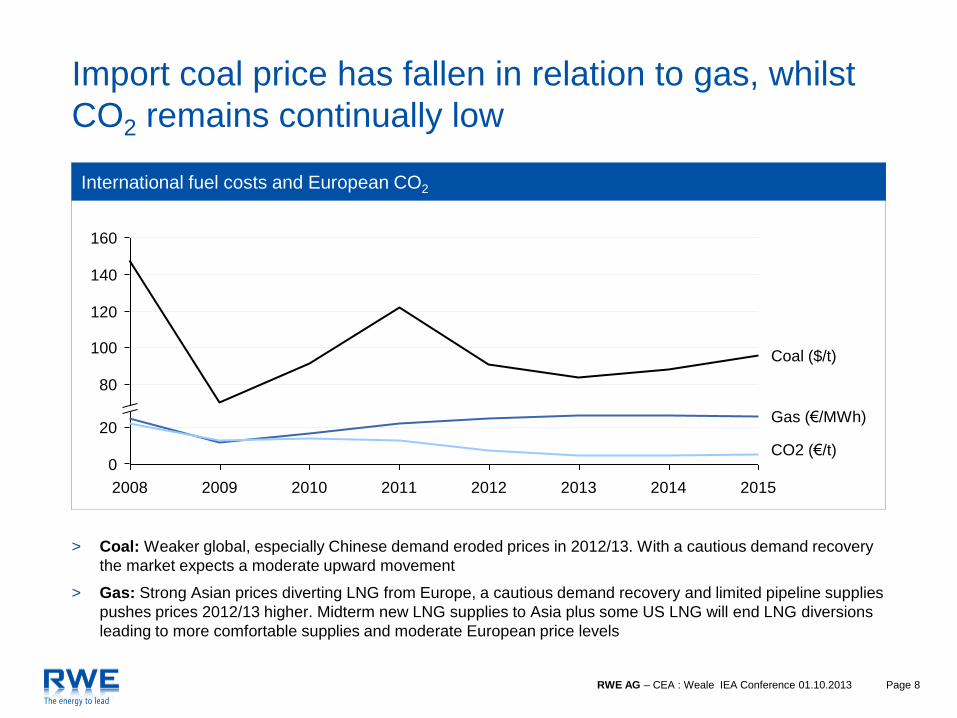
Import coal price has fallen in relation to gas, whilst
CO2 remains continually low
> Coal: Weaker global, especially Chinese demand eroded prices in 2012/13. With a cautious demand recovery
the market expects a moderate upward movement
> Gas: Strong Asian prices diverting LNG from Europe, a cautious demand recovery and limited pipeline supplies
pushes prices 2012/13 higher. Midterm new LNG supplies to Asia plus some US LNG will end LNG diversions
leading to more comfortable supplies and moderate European price levels
2008 2009 2010 2011 2012 2013 2014 2015
120
80
140
160
0
100
20
Coal ($/t)
Gas (€/MWh)
CO2 (€/t)
International fuel costs and European CO2
Page 9 RWE AG – CEA : Weale IEA Conference 01.10.2013
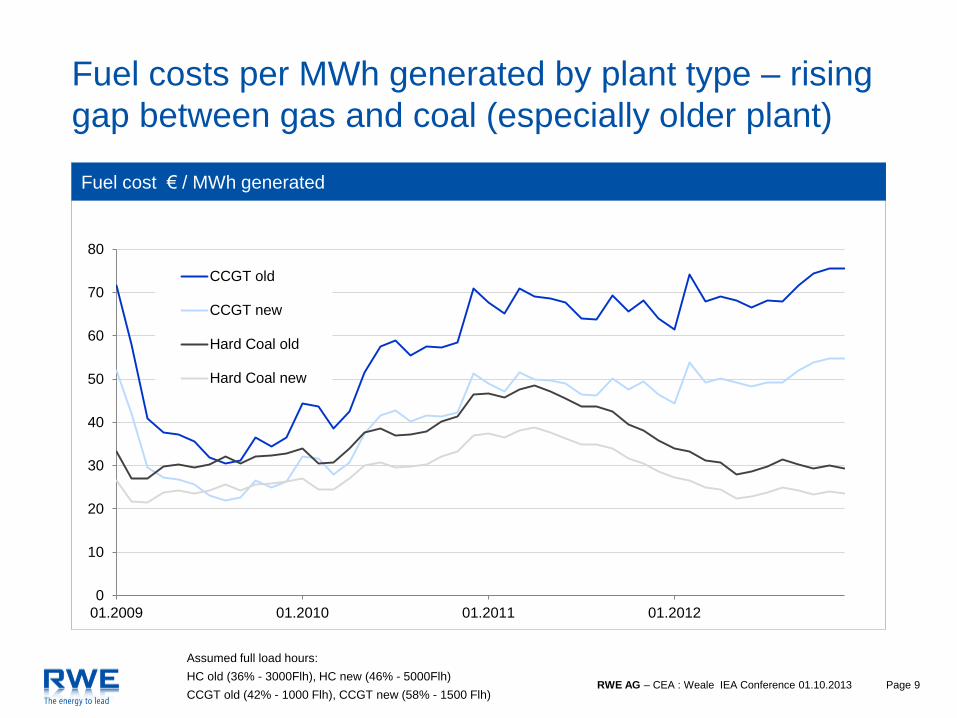
Fuel cost € / MWh generated
0
10
20
30
40
50
60
70
80
01.2009 01.2010 01.2011 01.2012
CCGT old
CCGT new
Hard Coal old
Hard Coal new
Assumed full load hours:
HC old (36% - 3000Flh), HC new (46% - 5000Flh)
CCGT old (42% - 1000 Flh), CCGT new (58% - 1500 Flh)
Fuel costs per MWh generated by plant type – rising
gap between gas and coal (especially older plant)
Page 10 RWE AG – CEA : Weale IEA Conference 01.10.2013
Agenda
1. Definition and determinants of „economics“ and key input
parameters
2. Power prices set through merit-order curve
3. Performance of plants and cost recovery
Page 11 RWE AG – CEA : Weale IEA Conference 01.10.2013
35
40
45
50
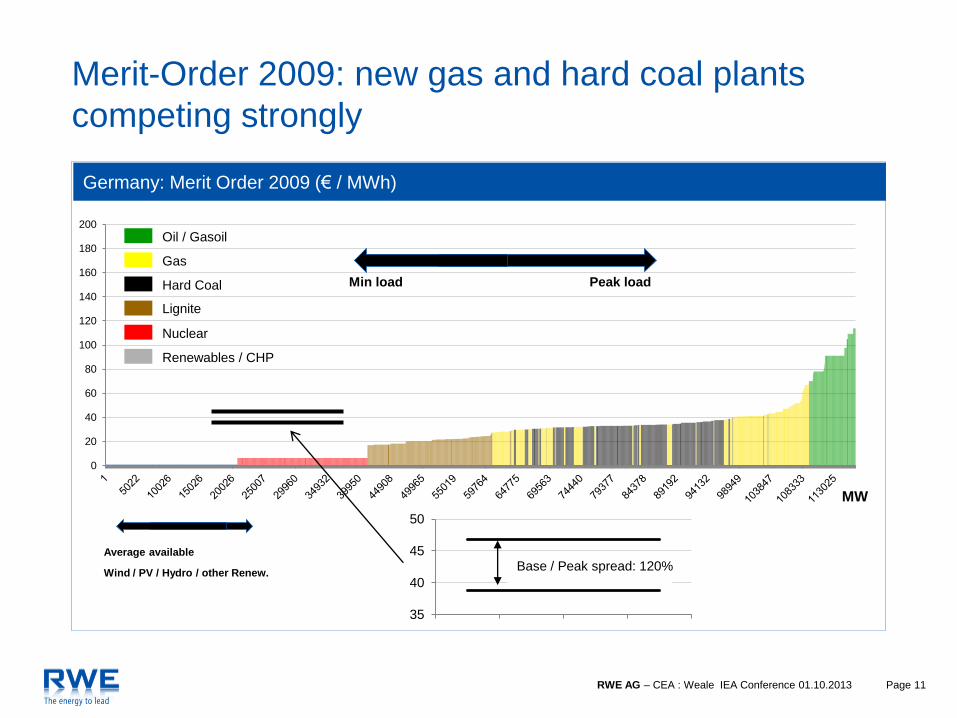
Base / Peak spread: 120%
0
20
40
60
80
100
120
140
160
180
200
Peak load Min load
MW
Germany: Merit Order 2009 (€ / MWh)
Average available
Wind / PV / Hydro / other Renew.
Renewables / CHP
Nuclear
Hard Coal
Gas
Oil / Gasoil
Lignite
Merit-Order 2009: new gas and hard coal plants
competing strongly
Page 12 RWE AG – CEA : Weale IEA Conference 01.10.2013
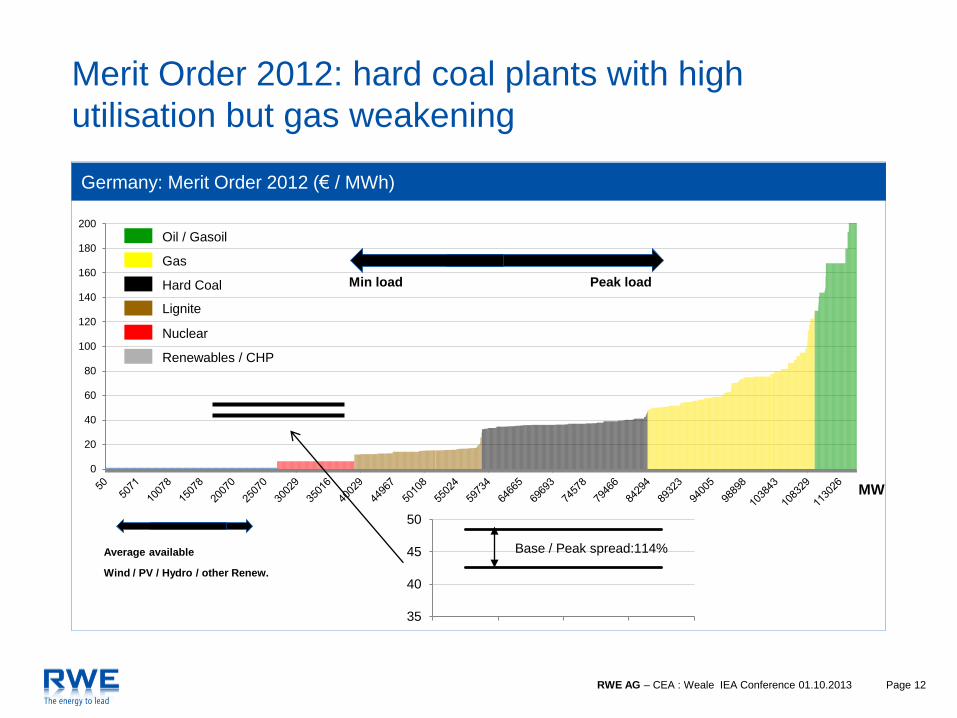
Germany: Merit Order 2012 (€ / MWh)
0
20
40
60
80
100
120
140
160
180
200
Peak load Min load
35
40
45
50
Base / Peak spread:114%
Merit Order 2012: hard coal plants with high
utilisation but gas weakening
Average available
Wind / PV / Hydro / other Renew.
Renewables / CHP
Nuclear
Hard Coal
Gas
Oil / Gasoil
Lignite
MW
Page 13 RWE AG – CEA : Weale IEA Conference 01.10.2013
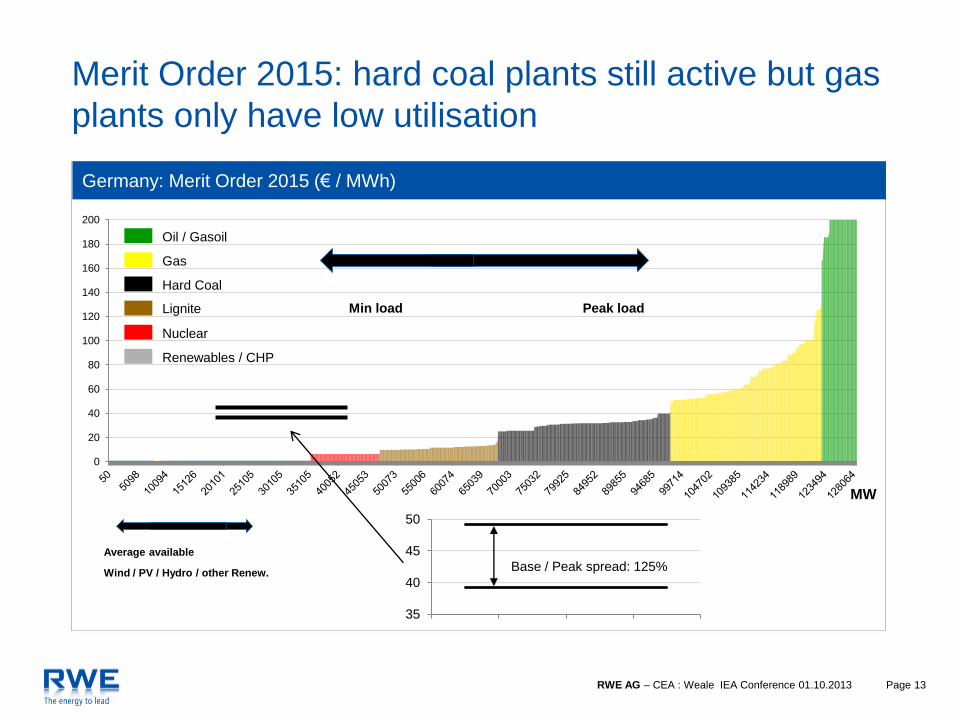
Germany: Merit Order 2015 (€ / MWh)
0
20
40
60
80
100
120
140
160
180
200
MW
35
40
45
50
Base / Peak spread: 125%
Merit Order 2015: hard coal plants still active but gas
plants only have low utilisation
Average available
Wind / PV / Hydro / other Renew.
Renewables / CHP
Nuclear
Hard Coal
Gas
Oil / Gasoil
Lignite Peak load Min load
Page 14 RWE AG – CEA : Weale IEA Conference 01.10.2013
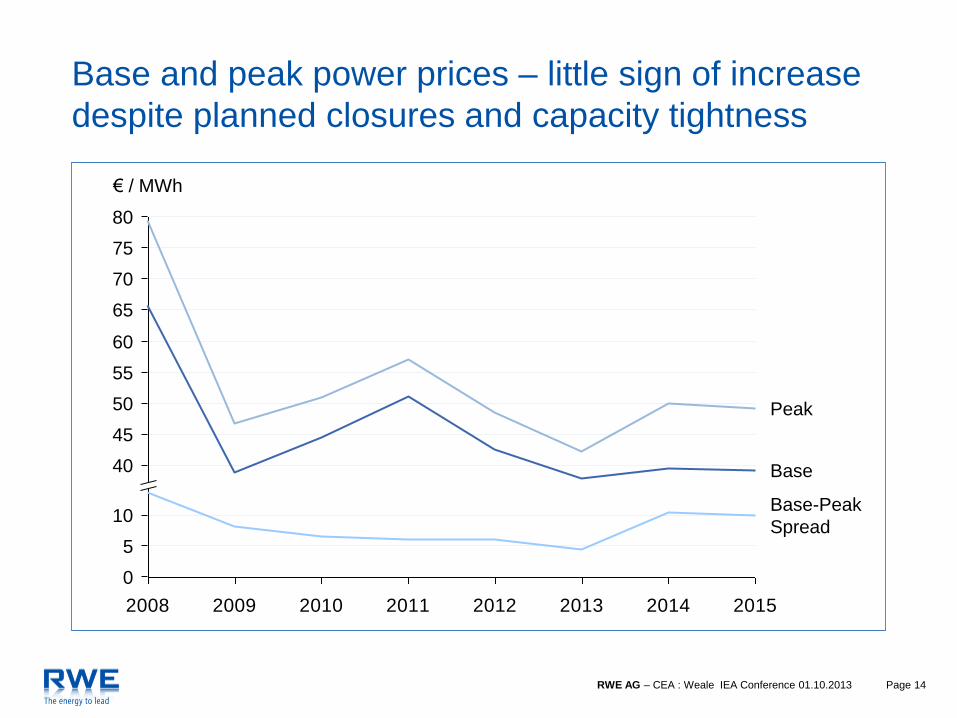
Base and peak power prices – little sign of increase
despite planned closures and capacity tightness
2008 2009 2010 2011 2012 2013 2014 2015
Peak
Base-Peak
Spread
Base
45
10
5
55
75
80
€ / MWh
50
0
65
40
60
70
Page 15 RWE AG – CEA : Weale IEA Conference 01.10.2013
Agenda
1. Definition and determinants of „economics“ and key input
parameters
2. Power prices set through merit-order curve
3. Performance of plants and cost recovery
Page 16 RWE AG – CEA : Weale IEA Conference 01.10.2013
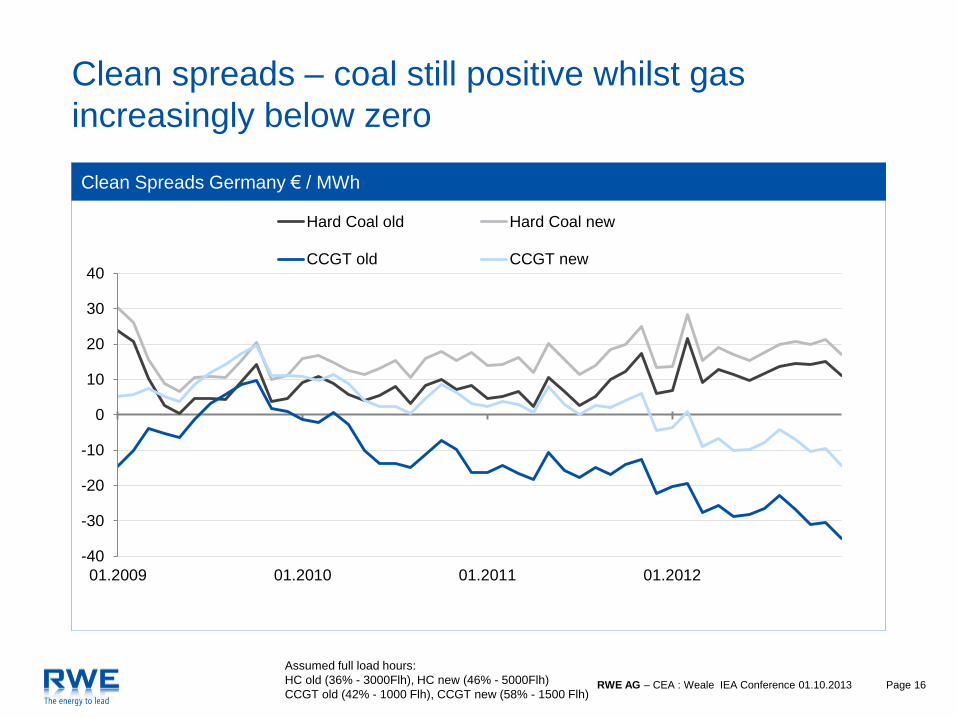
Clean Spreads Germany € / MWh
-40
-30
-20
-10
0
10
20
30
40
01.2009 01.2010 01.2011 01.2012
Hard Coal old Hard Coal new
CCGT old CCGT new
Assumed full load hours:
HC old (36% - 3000Flh), HC new (46% - 5000Flh)
CCGT old (42% - 1000 Flh), CCGT new (58% - 1500 Flh)
Clean spreads – coal still positive whilst gas
increasingly below zero
Page 17 RWE AG – CEA : Weale IEA Conference 01.10.2013
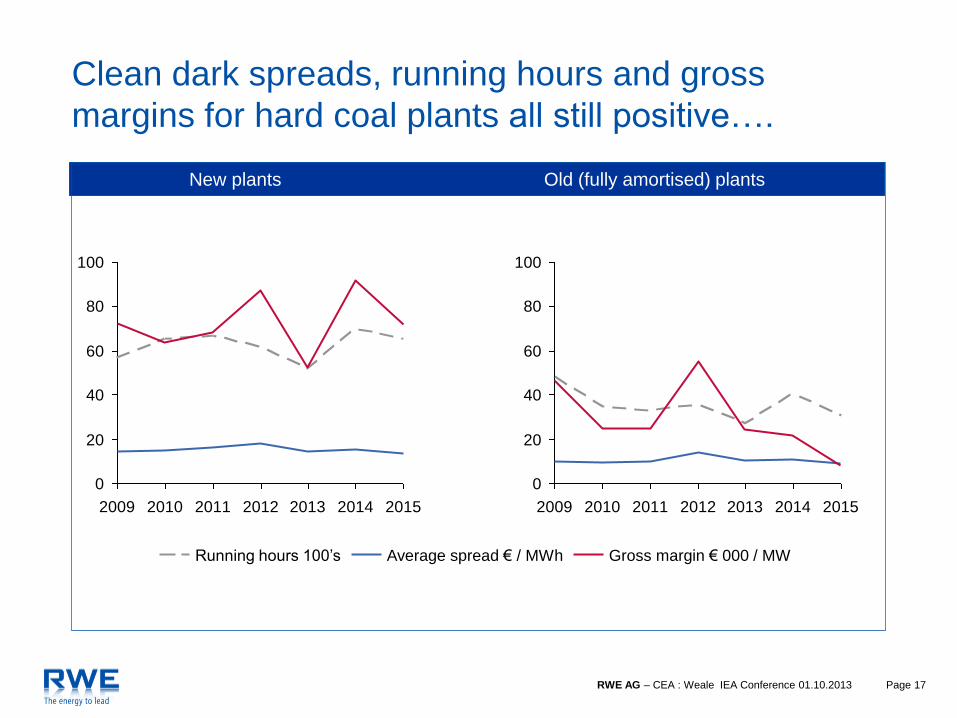
Clean dark spreads, running hours and gross
margins for hard coal plants all still positive….
0
20
40
60
80
100
2009 2010 2011 2012 2013 2014 2015
Gross margin € 000 / MW Average spread € / MWh Running hours 100’s
0
20
40
60
80
100
2009 2010 2011 2012 2013 2014 2015
New plants Old (fully amortised) plants
Page 18 RWE AG – CEA : Weale IEA Conference 01.10.2013
2009 2011 2012 2013 2014
100
150
€ 000 / MW
2010
0
2015
50
2013
0
2015 2010 2012 2011 2009 2014
50
100
150
€ 000 / MW
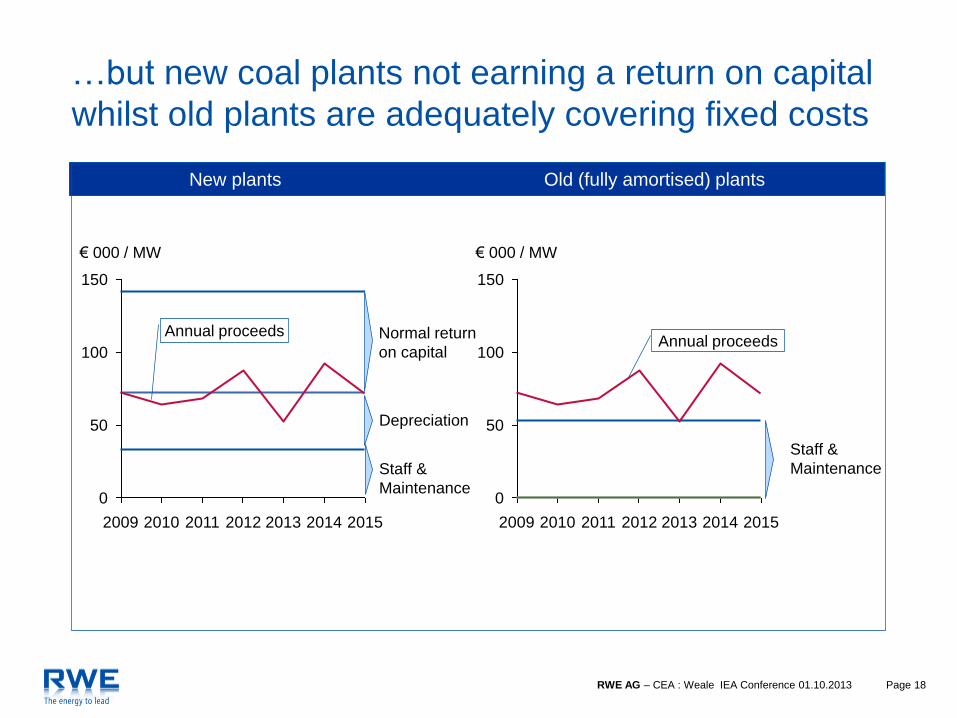
…but new coal plants not earning a return on capital
whilst old plants are adequately covering fixed costs
New plants Old (fully amortised) plants
Normal return
on capital
Depreciation
Staff &
Maintenance
Annual proceeds Annual proceeds
Staff &
Maintenance
Page 19 RWE AG – CEA : Weale IEA Conference 01.10.2013
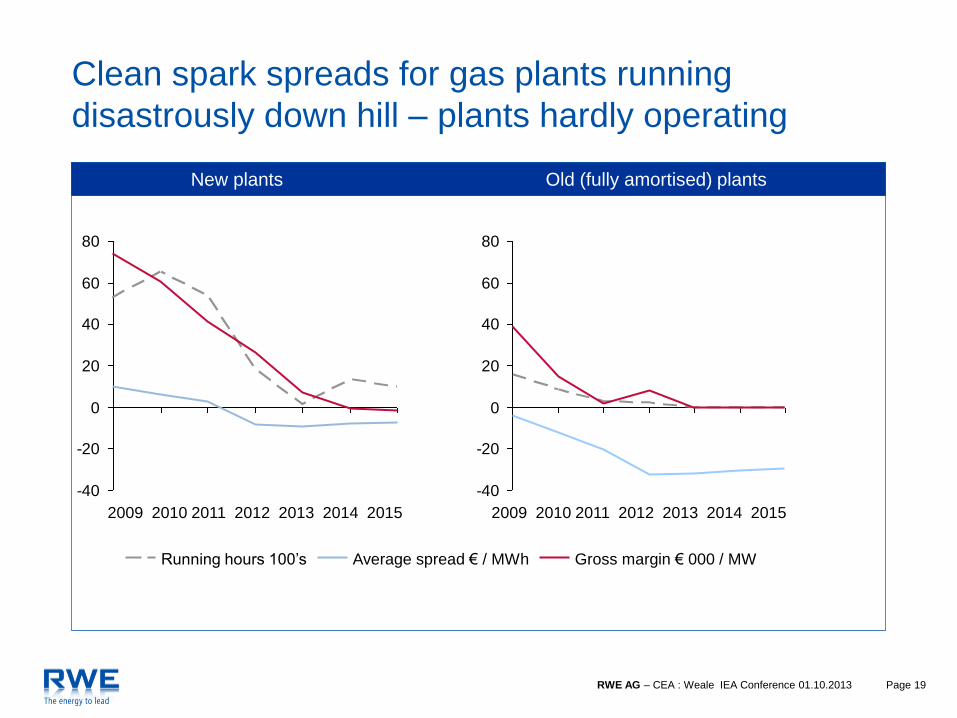
Clean spark spreads for gas plants running
disastrously down hill – plants hardly operating
-40
-20
0
20
40
60
80
Gross margin € 000 / MW Average spread € / MWh Running hours 100’s
New plants Old (fully amortised) plants
-40
-20
0
20
40
60
80
2009 2010 2011 2012 2013 2014 2015 2009 2010 2011 2012 2013 2014 2015
Page 20 RWE AG – CEA : Weale IEA Conference 01.10.2013
€ 000 / MW
2014 2010 2013 2015 2012 2009
0
10
20
30
40
50
60
70
80
90
2011
80
90
30
2013
10
2015
€ 000 / MW
0
2014
20
2012
40
70
60
50
2009 2010 2011
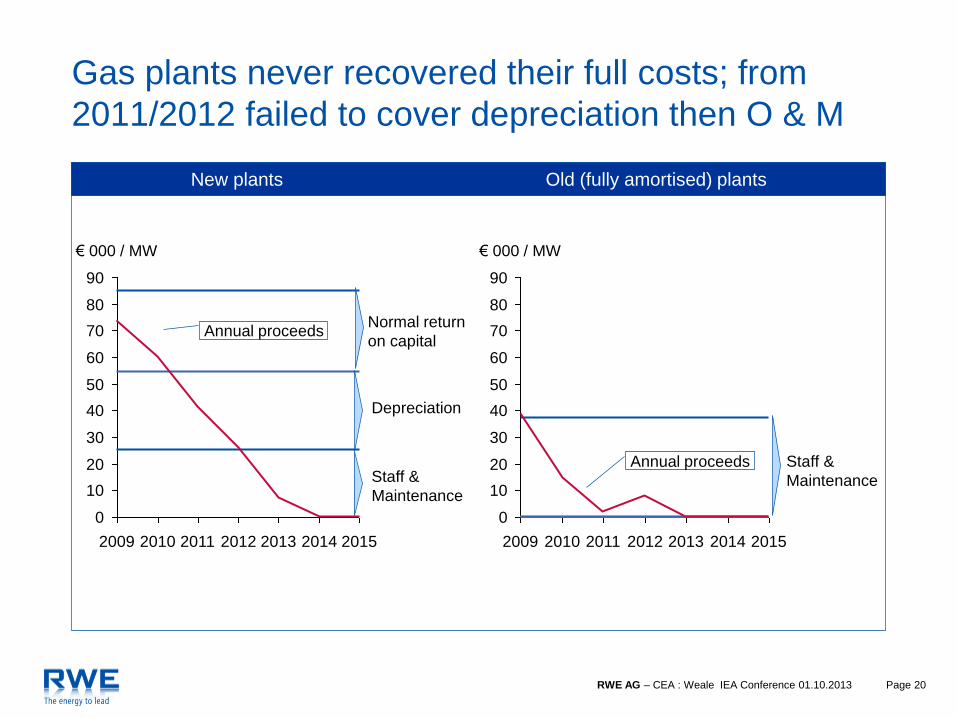
Gas plants never recovered their full costs; from
2011/2012 failed to cover depreciation then O & M
New plants Old (fully amortised) plants
Normal return
on capital
Depreciation
Staff &
Maintenance
Annual proceeds
Annual proceeds Staff &
Maintenance
Page 21 RWE AG – CEA : Weale IEA Conference 01.10.2013
Conclusions – strong evidence of market failure,
requiring new instruments to ensure supply security
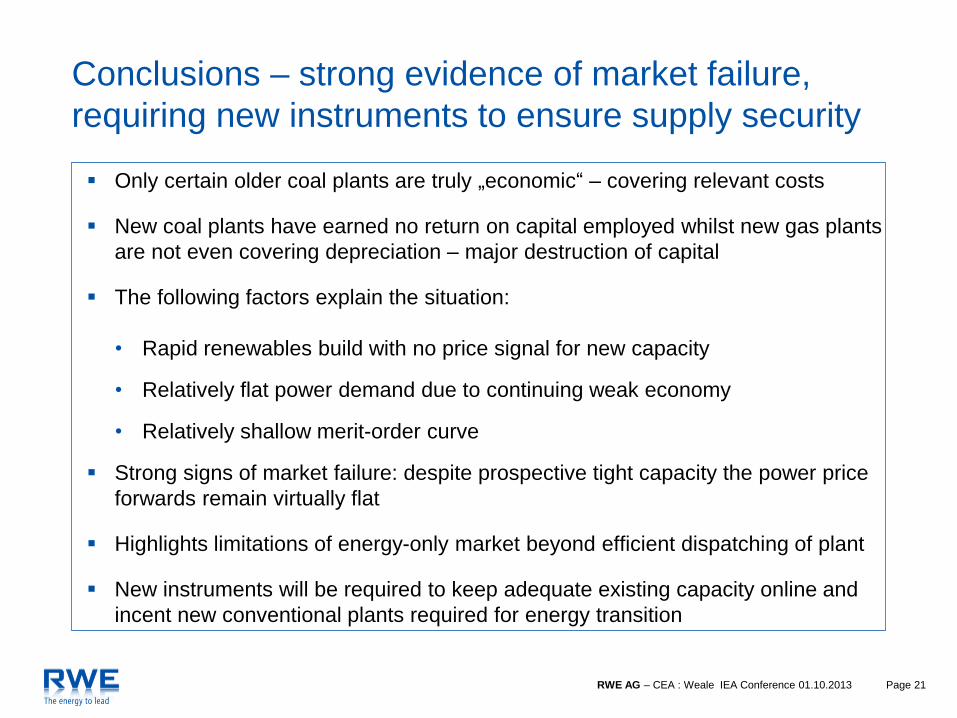
Only certain older coal plants are truly „economic“ – covering relevant costs
New coal plants have earned no return on capital employed whilst new gas plants
are not even covering depreciation – major destruction of capital
The following factors explain the situation:
• Rapid renewables build with no price signal for new capacity
• Relatively flat power demand due to continuing weak economy
• Relatively shallow merit-order curve
Strong signs of market failure: despite prospective tight capacity the power price
forwards remain virtually flat
Highlights limitations of energy-only market beyond efficient dispatching of plant
New instruments will be required to keep adequate existing capacity online and
incent new conventional plants required for energy transition


![EXERGY DIAGNOSIS OF COAL FIRED COMBINED … · Exergy Diagnosis of Coal Fired Combined Heat and Power ... in coal fired combined heat and power plant have ... Thermoeconomic [2] analysis](https://img.pdfslide.us/doc/110x75/5b4f746a7f8b9a1b6e8c4949/exergy-diagnosis-of-coal-fired-combined-exergy-diagnosis-of-coal-fired-combined.jpg)