Embed Size (px)
Citation preview

The Economics of Energy Efficiency & the Efficient Gap
- the NSW experience
Robert SmithManager – Demand Management Policy & Strategy
EnergyAustralia
14 June 2006
2
The rebirth of interest in Demand Management
Late 70s 1980s 1990s 2000
Energy Crisis
Hig
hL
ow
Greenhouse
Deregulation

3 Late 70s 1980s 1990s 2000
Energy Crisis
Hig
hL
ow
Greenhouse
Deregulation
The rebirth of interest in Demand Management

4 Late 70s 1980s 1990s 2000
Energy Crisis
Hig
hL
ow
Greenhouse
Deregulation
The rebirth of interest in Demand Management

5 Late 70s 1980s 1990s 2000
Energy Crisis
Hig
hL
ow
Greenhouse
Deregulation
The rebirth of interest in Demand Management

6 Late 70s 1980s 1990s 2000
Energy Crisis
Hig
hL
ow
Greenhouse
Deregulation
The rebirth of interest in Demand Management
Energy Crisis

Demand changes
Lifestyle changes & growth
– New appliances and increased uptake
– 7kVA per house from 3.5kVA in 1990’s
– Over a decade of economic growth
– Growth in air conditioning loads
– Peak growth - 3.5% peak cw 2.1% usage
– Shift to summer peaking
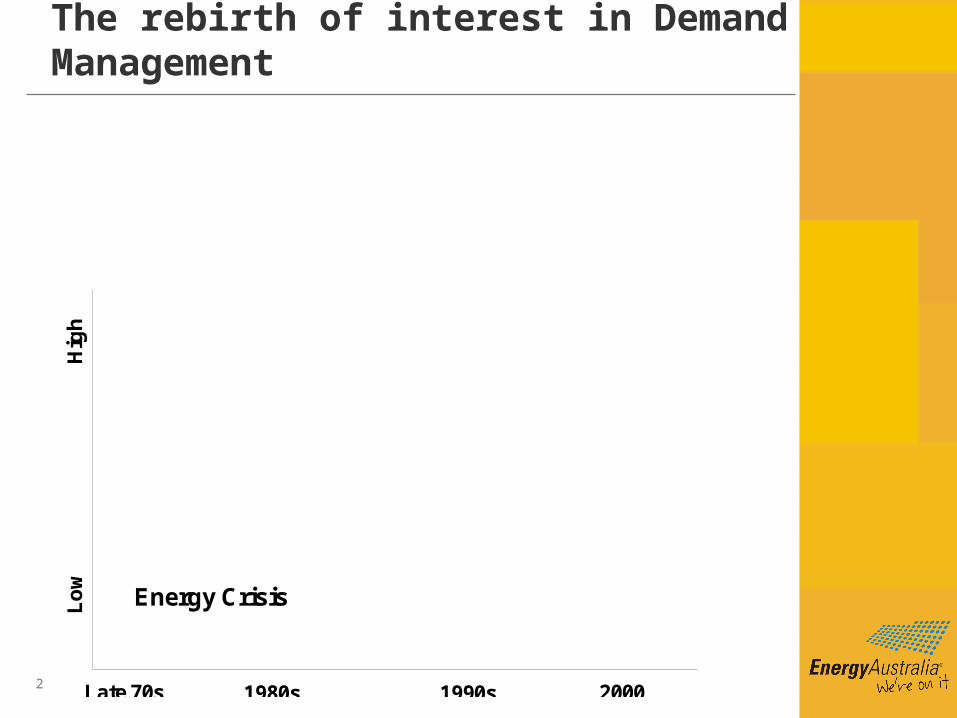
Demand Management in NSW
“It is the Tribunal’s strong view that there is significant untapped potential for efficient demand management. To a large extent, one of the major obstacles continues to be a culture which favours traditional “build” engineering solutions and which pays little more than lip service to alternative options” Dr Tom Parry, Chairman, Independent Pricing & Regulatory Tribunal, Inquiry into the role of Demand management and Other Options in the provision of Energy Services, Final Report, October, 2002

9
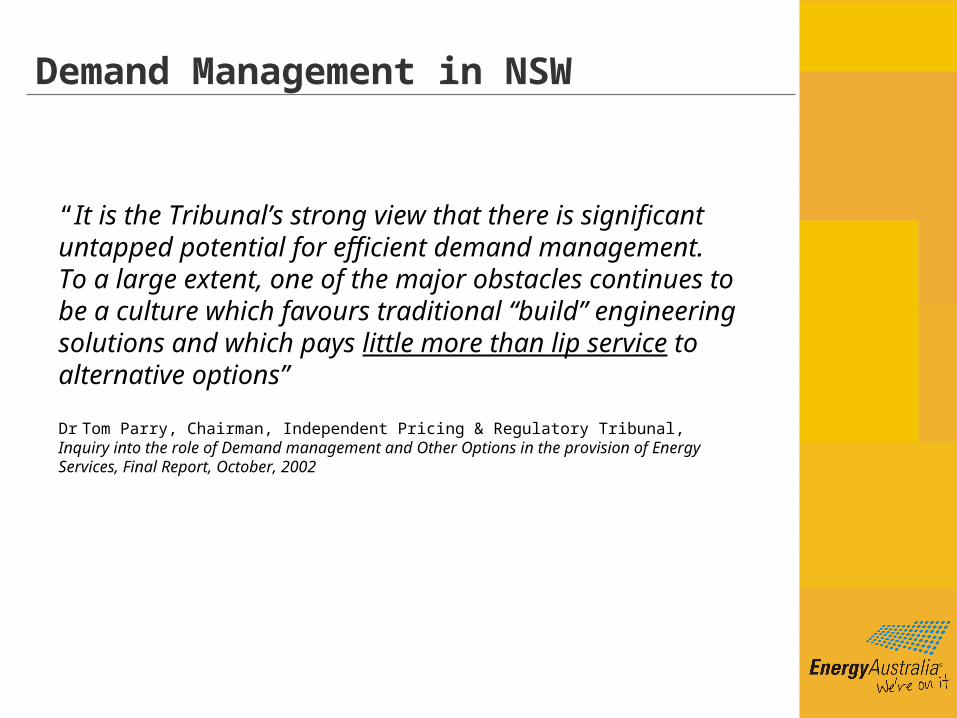
Environmentally driven reducing greenhouse gas emissions
Wholesale market driven reducing wholesale pool prices
Network driven deferring network investment
Customer driven changing usage, patterns or fuel
The Four Drivers of Demand Management
10
Environmentally driven reducing greenhouse gas emissions
Wholesale market driven reducing wholesale pool prices
Network driven deferring network investment
Customer driven changing usage, patterns or fuel
The Four Drivers of Demand Management
Externality
Lumpy capital
End use efficiency

Missing electricity value
NEM VOLL = $10,000 MWh cw Customers 13¢ kWh

NSW Greenhouse Plan - costs
Source: NSW Greenhouse Plan, NSW Greenhouse Office, 2005
• Energy efficiency in existing homes identified as cost-effective
• Barriers - expectations of short payback periods, lack of information and materiality of electricity costs in household expenses
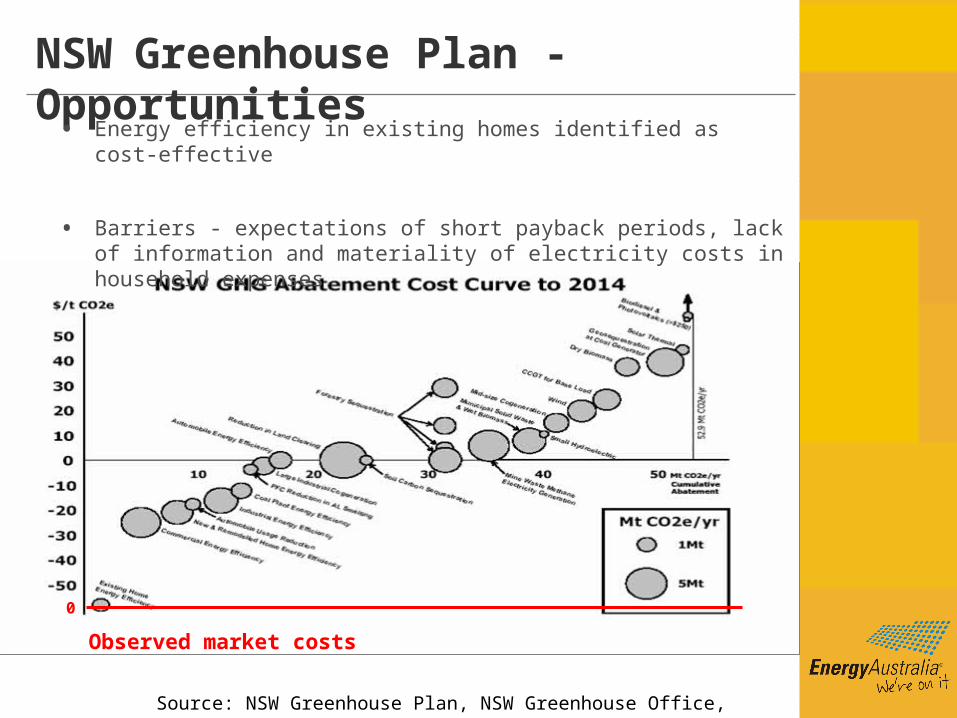
NSW Greenhouse Plan - Opportunities
Source: NSW Greenhouse Plan, NSW Greenhouse Office, 2005
Observed market costs
0
• Energy efficiency in existing homes identified as cost-effective
• Barriers - expectations of short payback periods, lack of information and materiality of electricity costs in household expenses
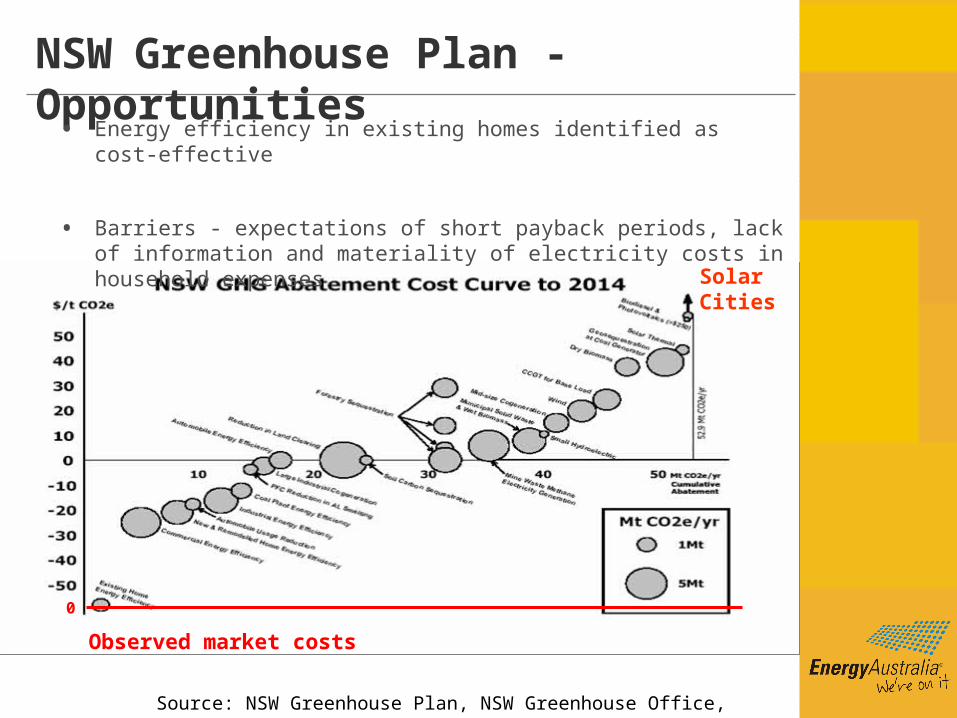
NSW Greenhouse Plan - Opportunities
Source: NSW Greenhouse Plan, NSW Greenhouse Office, 2005
Observed market costs
0
• Energy efficiency in existing homes identified as cost-effective
• Barriers - expectations of short payback periods, lack of information and materiality of electricity costs in household expenses
Solar Cities

Productivity Commission Report - 2005
“Examine why measures that appear to be privately cost effective are not being adopted”
Market Failure
– Asymmetric information - Public good information
– Split incentives - Positive externalities
Behavioural & Cultural
– Bounded rationality - Organisational barriers
Other Barriers & Impediments
– Implementation costs - Risk & uncertainty
– Capital constraints - Asset replacement costs

Productivity Commission Report - tone
“Contentious” to argue for mandatory measures or intervention
– “preparedness of governments to force firms to supposedly “help themselves” “opportunities ostensibly in their own interest”
– “override consumer and producer sovereignty”
– “perception that there can be win-win options”
– MEPS used “quite aggressively to remove whole swathes of product”
– ‘Seems counterintuitive that a measure that denies customer choice and can increase purchase prices could be in their interests’

Productivity Commission Report - conclusions
“Scope for government to efficiently intervene to address barriers and impediments ..appears to be modest”
“None of this is to deny that firms and individuals are sometimes not acting as rationally as they might. There is nothing intrinsically different about energy in this regard: nor does failure to take up such opportunities necessarily warrant policy intervention”
“Temptation has been to overstate the private cost-effectiveness aspects of energy efficacy programs when public benefits from greenhouse gas abatement often seems the real policy target”
Productivity Commission Report - observations
– TOR create Hamlet without the greenhouse prince
– Scepticism of zealots shaped the report
– Strict private cost effectives only - no margin
– Simplified rational competitive market model underpins assumptions and conclusions particularly in uncertainty, Office of Regulation Review 1998 repackaged–
Good economics or Galbraith’s “innocent fraud”?
– Compare with the Indonesia free market model

Java comparison – proposed lighting program
Peak demand and oil prices
– 70% of fuel cost for electricity generation for 30 % of time
– Electricity cost 600Rph/KWh - oil cost PLN 1,500Rph/KWh
– 6.00pm-10.00pm evening peaks from households lighting
Issues
– No standards or stars for appliances or CFLs
• Counterfeit Phillips 15W incandescent globes on sale
– Increasing CFL imports and sales
• CFLs 60% bad (cheap poor quality), 40% good
– Household electricity bills of $8.00 a quarter
• CFL cost of $2.50 creates real cash flow problems
– No greenhouse gas programs or trading
• CDM - Clean Development Mechanism untested

NSW situation
Favourable regulation
• NGACs – CO2 $15.71 a tonne
• D-factor – Network deferral X 2
• Energy Savings Fund – $61m, 2006-07
• NEM VOLL – $10,000 MWh
• Solar Cities – $75m for 4
• MEPS - Minimum appliance standards
• Stars - Energy appliance ratings
• NEM Rules - DM investigation
• BASIX & ABGR – Building ratings
• RECs - greenhouse incentives
• Audits & Action Plans - NSW & Fed
Low prices
21
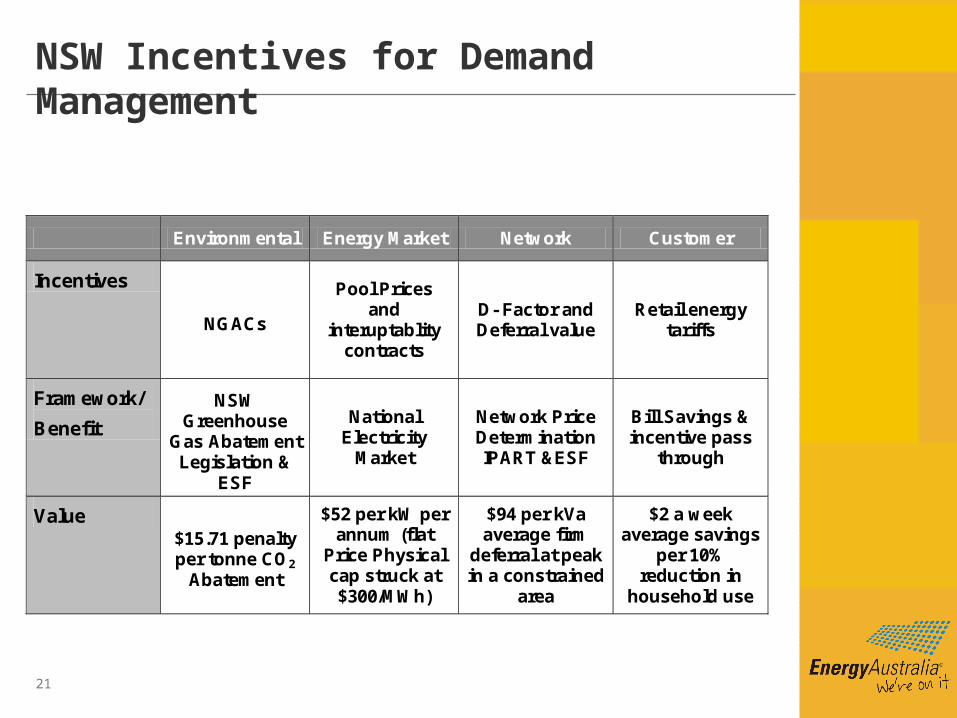
Environmental Energy Market Network Customer
Incentives
NGACs
Pool Prices and
interuptablity contracts
D- Factor and Deferral value
Retail energy tariffs
Framework/
Benefit
NSW Greenhouse
Gas Abatement Legislation &
ESF
National Electricity
Market
Network Price Determination IPART &ESF
Bill Savings & incentive pass
through
Value $15.71 penalty per tonne CO2
Abatement
$52 per kW per annum (flat
Price Physical cap struck at $300/MWh)
$94 per kVa average firm
deferral at peak in a constrained
area
$2 a week average savings
per 10% reduction in
household use
NSW Incentives for Demand Management

EA developments in managing demand
Network D- factor
– $5.5M in deferrals in 2004-05
– Power Factor success
– 26 investigations underway
Energy efficiency & Greenhouse
– CFL’S 500K in 2004, 2M in 2006
– Spare Fridge retirement of 1,000
– On–Line Shop
– Refit – home installation
– Insulation offers
– On-line education – calculators
– www.energy.com.au
23
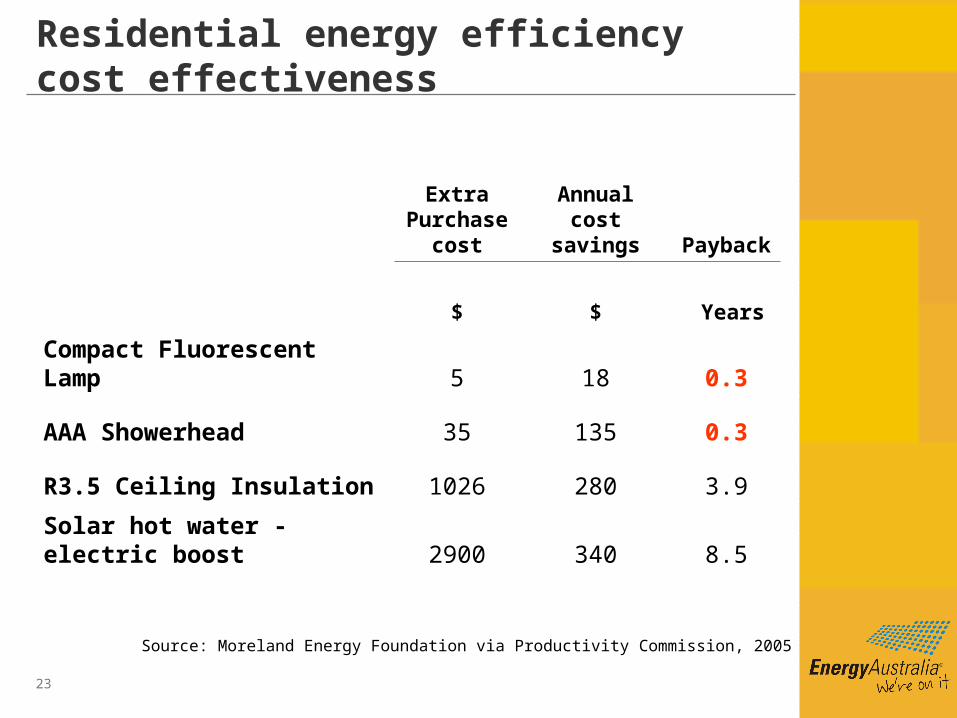
Residential energy efficiency cost effectiveness
Extra Purchase
costAnnual cost
savings Payback
$ $ Years
Compact Fluorescent Lamp 5 18 0.3
AAA Showerhead 35 135 0.3
R3.5 Ceiling Insulation 1026 280 3.9
Solar hot water - electric boost 2900 340 8.5
Source: Moreland Energy Foundation via Productivity Commission, 2005

24
Compact Fluorescent light (CFLs) example

CFL economics - 15,000hr 15W bulb
Calculations
Energy saving 80%
kWh saving per year (4 hr a day) 88
$ saving per year $14
CFL life (years) 10.3
CFL Saving over life $144
Wholesale purchase cost $2.50
Default Factor NGAS (15,000hr) 0.9
NGAC Value at penalty cost $15.71 *0.8 $11.30

CFL economics - responses
Market share
– energy saving lights in 37.2% of households in NSW 2005
Free giveaway programs
– LESS – libraries and newspaper coupons
– ORIGAN – energy sales promotion
– FeildForce – streets and Easter Show
– NECO – streets and on-line shop (postage)
– Easy Being Green – streets
Retail outlets – Still $7.00 and limited shelf space
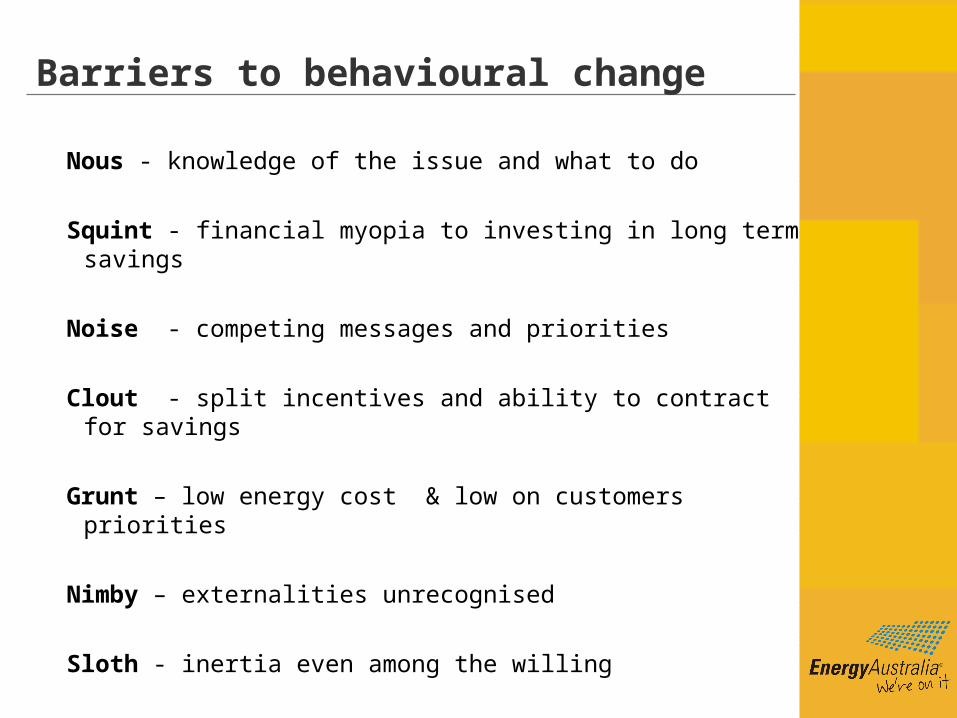
Barriers to behavioural change
Nous - knowledge of the issue and what to do
Squint - financial myopia to investing in long term savings
Noise - competing messages and priorities
Clout - split incentives and ability to contract for savings
Grunt – low energy cost & low on customers priorities
Nimby – externalities unrecognised
Sloth - inertia even among the willing
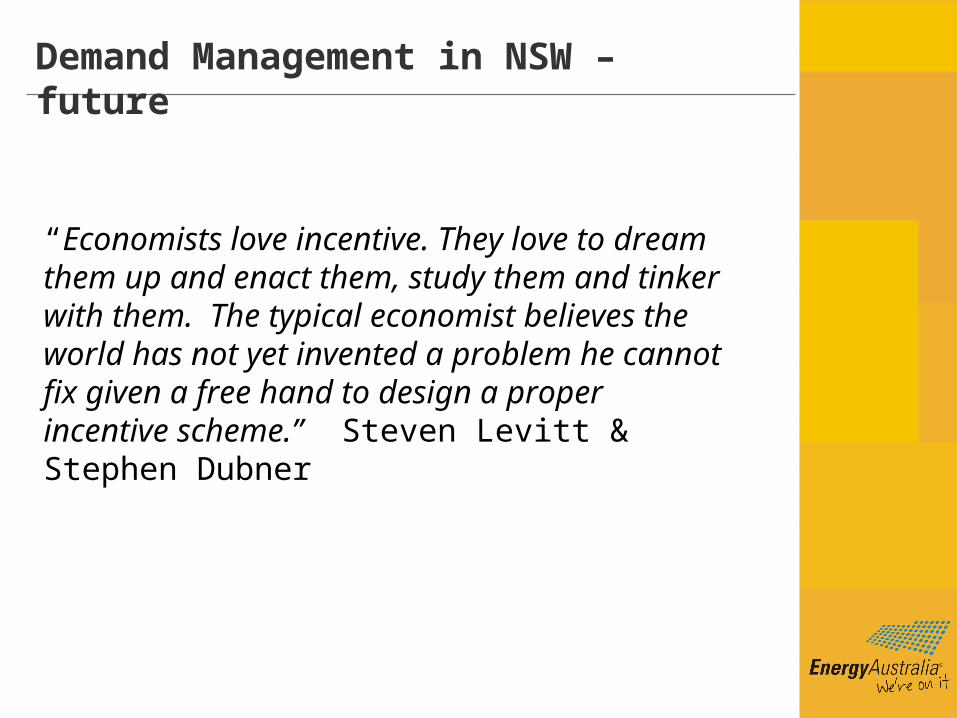
Demand Management in NSW – future
“Economists love incentive. They love to dream them up and enact them, study them and tinker with them. The typical economist believes the world has not yet invented a problem he cannot fix given a free hand to design a proper incentive scheme.” Steven Levitt & Stephen Dubner

Demand Management in NSW – future
Questions
Observations
Gripes

Developments in the metering & pricing
Time of Use pricing
– First utility in the world to mandate ToU for all new connections/meters
– Voluntary TOU pool offer
– Strategic pricing trial 1,300
Smart Meters and ToU progress
– 160,000 meters installed
– Mandatory for >40MWh
– 22,000 customers paying ToU
– “Smarter” meters 10,000 trial 2007
ToU Target
– 220,000 customers by 2008

Regulation and energy efficiency initiatives
Regulatory Frameworks Key EA Initiatives
2003 NSW DM Code Tips brochures
IPART DM review REFIT pilot
NGACs introduced Learn-by-Doing pilots
2004 Network D- Factor CFL give-away 500,000
2005 D-Factor Guidelines Home Energy Saver
Energy Savings Fund One line Shop
Solar Cites Competition ToU roll-out
2006 D- Factor pass through Pump -TOU Trial
NGAC review Spare Fridge program
Insulation program
CFL 2,000,000 (six pack)

Local constraints reviewed for DM

Dem
an
d (
kW
)
Time of day
Air conditioning usage
AC, hot workday
AC, avg workday
No AC, avg workday No AC, hot workday
Midnight MidnightMidday6 a.m. 6 p.m.
2.5
1.5
1.0
0.5
0.0
2.0
Each air conditioned customer is subsidised c.$70 p.a. by each non air conditioned customer
Trends in Demand – Air conditioner impacts

• One of the world’s first mandatory greenhouse gas emissions trading schemes in (Jan 2003)
• Aggressive “beyond Kyoto” commitment for NSW creating an imbalance between supply of and demand for abatement certificates
Greenhouse Gas Abatement Scheme Introduction, March 2006
NGAC Forecast Shortfall