Embed Size (px)
Citation preview
Department of Primary Industries and Fisheries
The economics of beef in Central Queensland
GROSS MARGINS AND PRODUCTION NOTES
The economics of beef in Central Queensland2
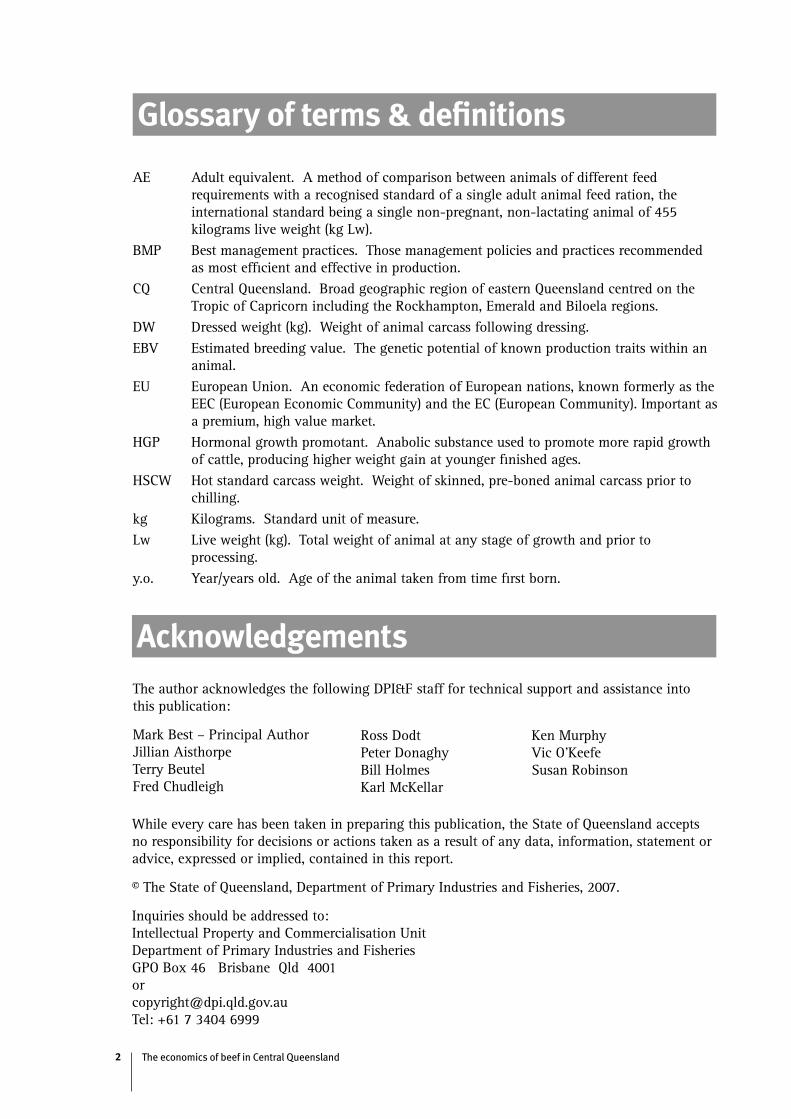
Glossary of terms & definitions
AE Adult equivalent. A method of comparison between animals of different feed requirements with a recognised standard of a single adult animal feed ration, the international standard being a single non-pregnant, non-lactating animal of 455 kilograms live weight (kg Lw).
BMP Best management practices. Those management policies and practices recommended as most efficient and effective in production.
CQ Central Queensland. Broad geographic region of eastern Queensland centred on the Tropic of Capricorn including the Rockhampton, Emerald and Biloela regions.
DW Dressed weight (kg). Weight of animal carcass following dressing.EBV Estimated breeding value. The genetic potential of known production traits within an
animal. EU European Union. An economic federation of European nations, known formerly as the
EEC (European Economic Community) and the EC (European Community). Important as a premium, high value market.
HGP Hormonal growth promotant. Anabolic substance used to promote more rapid growth of cattle, producing higher weight gain at younger finished ages.
HSCW Hot standard carcass weight. Weight of skinned, pre-boned animal carcass prior to chilling.
kg Kilograms. Standard unit of measure.Lw Live weight (kg). Total weight of animal at any stage of growth and prior to
processing. y.o. Year/years old. Age of the animal taken from time first born.
AcknowledgementsThe author acknowledges the following DPI&F staff for technical support and assistance into this publication:
Mark Best – Principal AuthorJillian AisthorpeTerry Beutel Fred Chudleigh
Ross DodtPeter DonaghyBill HolmesKarl McKellar
Ken MurphyVic O’KeefeSusan Robinson
While every care has been taken in preparing this publication, the State of Queensland accepts no responsibility for decisions or actions taken as a result of any data, information, statement or advice, expressed or implied, contained in this report.
© The State of Queensland, Department of Primary Industries and Fisheries, 2007.
Inquiries should be addressed to:Intellectual Property and Commercialisation UnitDepartment of Primary Industries and FisheriesGPO Box 46 Brisbane Qld [email protected]: +61 7 3404 6999
The economics of beef in Central Queensland 3
Contents
Glossary of terms and definitions _____________________________________________________________ 2
Acknowledgements ______________________________________________________________________________ 2
1 Introduction _______________________________________________________________________________________ 4
Central Queensland region _____________________________________________________________________ 4
Land types _________________________________________________________________________________________ 4
2 Property modelling ______________________________________________________________________________ 6
Gross margins introduction ____________________________________________________________________ 7
Gross margin sensitivities ______________________________________________________________________ 7
Market specifications ____________________________________________________________________________ 7
3 Property profiles __________________________________________________________________________________ 8
Coastal speargrass store weaner production model _______________________________________ 8
Coastal speargrass breeder/store steer production model _____________________________ 11
Brigalow Breeder (EU) _________________________________________________________________________ 14
Brigalow bullocks trade (Jap Ox) ______________________________________________________________ 17
4 Production notes ________________________________________________________________________________18
Herd parameters _________________________________________________________________________________18
Herd bull ratio ____________________________________________________________________________________18
Husbandry practices ____________________________________________________________________________18
Additional assumptions ________________________________________________________________________ 19
Appendix 1 Land type descriptions _____________________________________________________________ 20
Coastal speargrass land types _______________________________________________________________ 20
Brigalow land types _____________________________________________________________________________23
Appendix 2 Variable cost inputs _________________________________________________________________25
Appendix 3 Sale price derivation _______________________________________________________________ 26
Web linkages _____________________________________________________________________________________27
Bibliography ______________________________________________________________________________________27
The economics of beef in Central Queensland4
This booklet contains technical production, market specific and economic information common to extensive beef production systems of Central Queensland (CQ). Representative property models are used to generate farm enterprise estimates. Cost structure and market price information is applied in order to establish gross margin profitability estimates. The intent of the document is to provide representative gross margins for selected beef production systems across CQ land types.
Central Queensland region
Central Queensland includes the area surrounding Rockhampton and extending inland as far as the central highland region around Emerald. CQ beef production systems typically centre on Brigalow1 and coastal speargrass2 land types. Coastal production systems are found in a narrow strip extending along the coastline from Rockhampton to north of Mackay. The brigalow belt extends inland of Rockhampton, includes the Dawson and Callide Valleys, sweeps west through the Springsure area and extends north towards the Townsville region.
Land types
Land type influences the productive capacity of extensive grazing operations. The land type of a property effectively determines the productive capacity and development potential for that property. Land types typically demonstrate different grass species, soil types and associated carrying capacities as well as different recovery periods from grazing. Further, because different pasture varieties suit different soils, inherent fertility coupled with
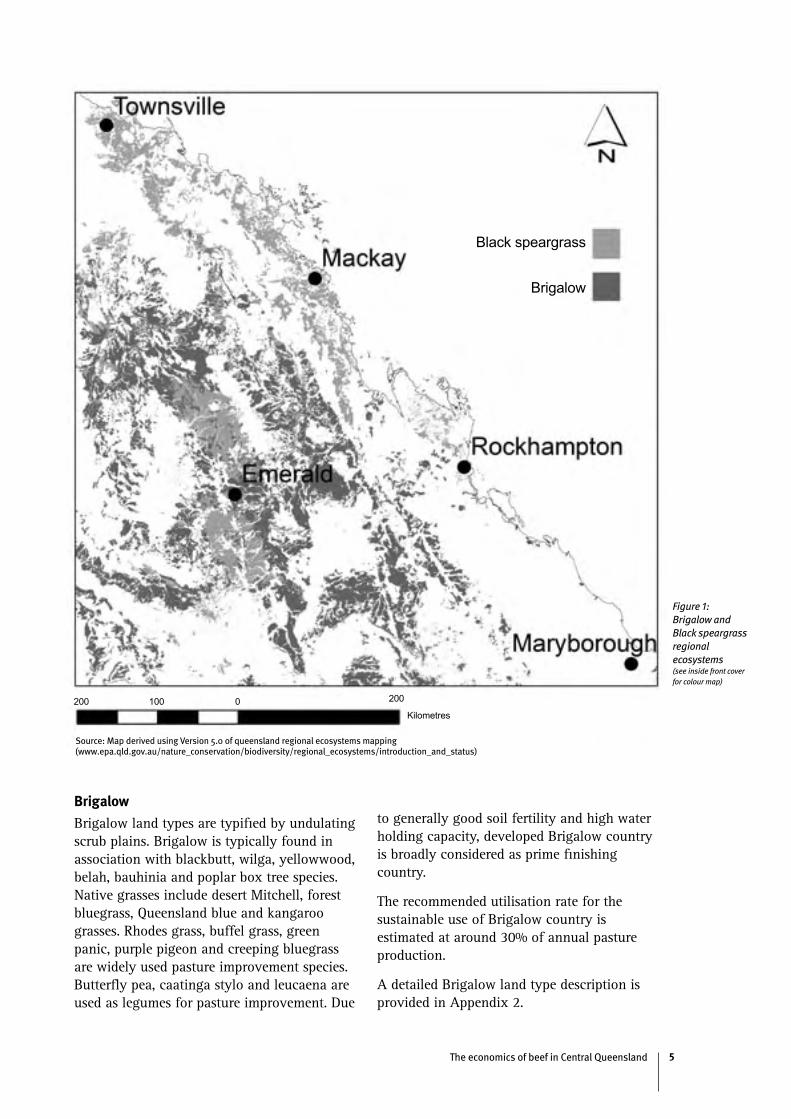
water holding capacity determines potential productivity from improved pasture species. Coastal speargrass and Brigalow land types feature prominently in CQ beef production land types3. Figure 1 maps noteworthy Brigalow and Black speargrass regional ecosystems throughout CQ.
Coastal speargrass
Coastal speargrass land types are typified by a mixed range of landforms including mountains, ranges and alluvial plains. Typical tree species in coastal land types include various gum-topped box, swamp mahogany, teatrees, bloodwoods and a large diversity of eucalypt species including poplar gum and ironbark. Typical pasture species include native sorghum, golden beard grass, giant and black speargrass and native legumes. Introduced species commonly used for pasture improvement include Pangola grass, Rhodes grass and Bisset creeping bluegrass. Commonly utilised legumes include seca and verano stylo, wynn cassia and leucaena. Due to much of this land type being unsuitable for finishing stock, the trend has been for this area to produce store cattle suitable for finishing or backgrounding on fertile land types (Murphy, 1995) or more recently in feedlot operations.
Utilisation rates4 vary depending on the fertility of the country. The utilisation recommendation (i.e. the amount of total forage load consumed through sustainable grazing) for this land type is around 15% of annual pasture growth.
Detailed information on coastal speargrass land types is provided in Appendix 1.
Introduction
1 Acacia harpophylla2 Including Black speargrass, Heteropogon contortus3 Although used here in the context of a general description of land type, it is acknowledged that Central Queensland beef cattle properties typically consist of some mixture of other land types. Examples of other land types include Desert uplands and Downs type country.4 Utilisation rate is the proportion of annual pasture growth consumed. Excessive utilisation adversely affects the capacity of the pasture to convert water and nutrients into growth, thereby having detrimental impacts on sustainability. Source: Chilcott, et. al. (2005)
1
The economics of beef in Central Queensland 5
Black speargrass
Brigalow
200 100 0 200
Kilometres
Figure 1: Brigalow and Black speargrass regional ecosystems(see inside front coverfor colour map)
Source: Map derived using Version 5.0 of queensland regional ecosystems mapping (www.epa.qld.gov.au/nature_conservation/biodiversity/regional_ecosystems/introduction_and_status)
Brigalow
Brigalow land types are typified by undulating scrub plains. Brigalow is typically found in association with blackbutt, wilga, yellowwood, belah, bauhinia and poplar box tree species. Native grasses include desert Mitchell, forest bluegrass, Queensland blue and kangaroo grasses. Rhodes grass, buffel grass, green panic, purple pigeon and creeping bluegrass are widely used pasture improvement species. Butterfly pea, caatinga stylo and leucaena are used as legumes for pasture improvement. Due
to generally good soil fertility and high water holding capacity, developed Brigalow country is broadly considered as prime finishing country.
The recommended utilisation rate for the sustainable use of Brigalow country is estimated at around 30% of annual pasture production.
A detailed Brigalow land type description is provided in Appendix 2.
The economics of beef in Central Queensland6
Property modelling2Representative models of typical grazing enterprises were developed on information gathered from existing publications, local census data and technical specialists. Beef extension staff were consulted for husbandry and herd management practices typical within the region. Both breeding and trading scenarios were modelled. Estimates of biological production factors including weaning, death rates and bull mating ratios were combined with estimates of herd husbandry costs to produce each of the representative farm models.
For assessing relative returns a number of enterprises, based on land type5, were modelled. These included:
1. Coastal speargrass land type operations
a. Breeder weaner turnoffb. Breeder store steer turnoff
2. Brigalow land type operations
a. Breeder EU steer turnoffb. Jap Ox finish
The Breedcow programme of the Breedcow and Dynama Herd Budgeting Software Package (Holmes, 2005) was used in modelling selected breeding herd structures. The programme was used in estimating optimal adult equivalent numbers and gross profitability.
Breedcow allows changing of parameters for each operation. Breeder mortality rates, weaning rates and sale prices were altered to assess changes on overall profitability. These parameters were changed within the model to derive sensitivity matrices. Current market prices were obtained from commercial operators and saleyards and applied to models.
The computer programme ‘Bullocks’6 was used to model the gross margin returns of
a bullock finishing operation. Purchase and sales weights and prices were inputted. Other required inputs included dressing percentage, mortality rate, variable costs per head and interest rate. The program calculated gross margin per head, gross margin per adult equivalent, gross margin per head less interest, gross margin per adult equivalent less interest and percentage return per year on capital investment.
The use of adult equivalents to estimate carrying capacity requirements allows comparison of results between different production systems. In order to account for the forage demand of the herd, allowances are made for each animal class, according to the breed, weight and lactation status of the animal. An example is the relatively higher forage requirement for a lactating cow. All animals within the herd are assigned values in proportion to the feed demands of an adult maintenance ration. In this way limiting factors of production including land type and herd feed requirements are accounted for when comparing different herd structures and grazing strategies.
The value of livestock capital is the total value of the retained herd. The opportunity cost7 of holding that stock has been estimated by using a notional interest rate of 10 per cent and is termed the opportunity cost of livestock capital. By including the opportunity of livestock capital in an economic analysis, the economic returns from different herd structures, with differing capital requirements, can be compared.
Thus, the use of adult equivalents and accounting for the opportunity cost of maintaining a particular herd structure, allows for direct comparison of gross margins across different land types and herd structures.
5A land type is commonly viewed as a distinct geographical area with distinct land forms, native vegetation and grass species6‘Bullocks’ is one of nine programs contained within the Breedcow and Dynama Herd Budgeting Software Package.7Using that capital invested in cattle for some alternate use such as loan repayment or alternate investment.
The economics of beef in Central Queensland 7
Using adult equivalents to account for feed consumption differences among animal classes, allowing for differing capital requirements according to herd structure (influenced mainly by age of male turnoff), allows fair comparison of gross margins across different herd structures.
Selected output for each operation was summarised and is presented in table form8. Information includes herd structure, cattle numbers, adult equivalencies, herd valuations and gross margins less interest cost9.
Gross margins introduction
The gross margin for an operation within a stable herd structure is equivalent to the gross income received less the variable costs incurred. Variable costs are those directly attributable to an individual animal which vary in proportion to the size of the operation. Examples include animal husbandry and marketing expenses.
Gross margin ratios have been calculated against limiting resource inputs. Gross margin per adult equivalent (AE), giving an indication of gross margin per beast area, enables comparison between different land types.
Gross margin sensitivities
Each gross margin has an attached sensitivity table. The table offers an indication of the effect on gross margins of changes in herd composition parameters and/or pricing. Examples of herd composition changes modelled include breeder mortality and weaning rates. Live weight prices vary the gross margin return and therefore the choice of market is critical to achieving higher returns.
Both breeder mortality and weaning rate affect total herd numbers. The achievement of higher weaning rates will mean that there are higher animal numbers available to the herd – animals available for use as either replacement
stock, for further growing out or immediate sale. A reduced rate of breeder mortality will mean higher numbers of retained breeders available and a reduction in the requirement for replacement weaner heifers to cover breeding herd attrition. Again, sales turnover would be expected to be increased as more animals are available for sale. Prices obviously have gross margin impacts by directly changing the income stream from cattle sales.
Market specifications
Meeting product specification within the selected market enhances supplier reputation for supplying quality product and is critical in achieving price premiums. Markets define preferred product requirement in the form of market specifications. The ability to meet market specifications results in the maintenance of producer premiums for marketed product. Market specifications for European Union (EU) and Japanese Oxen (Jap Ox) cattle classes are outlined in section 3.
8Small discrepancies may exist between cost and sales summations and breakdowns due to rounding.9In reporting gross margins less interest, the effect of holding higher valued herds has been accounted for.
The economics of beef in Central Queensland8
Property profiles3Coastal speargrass store weaner production model
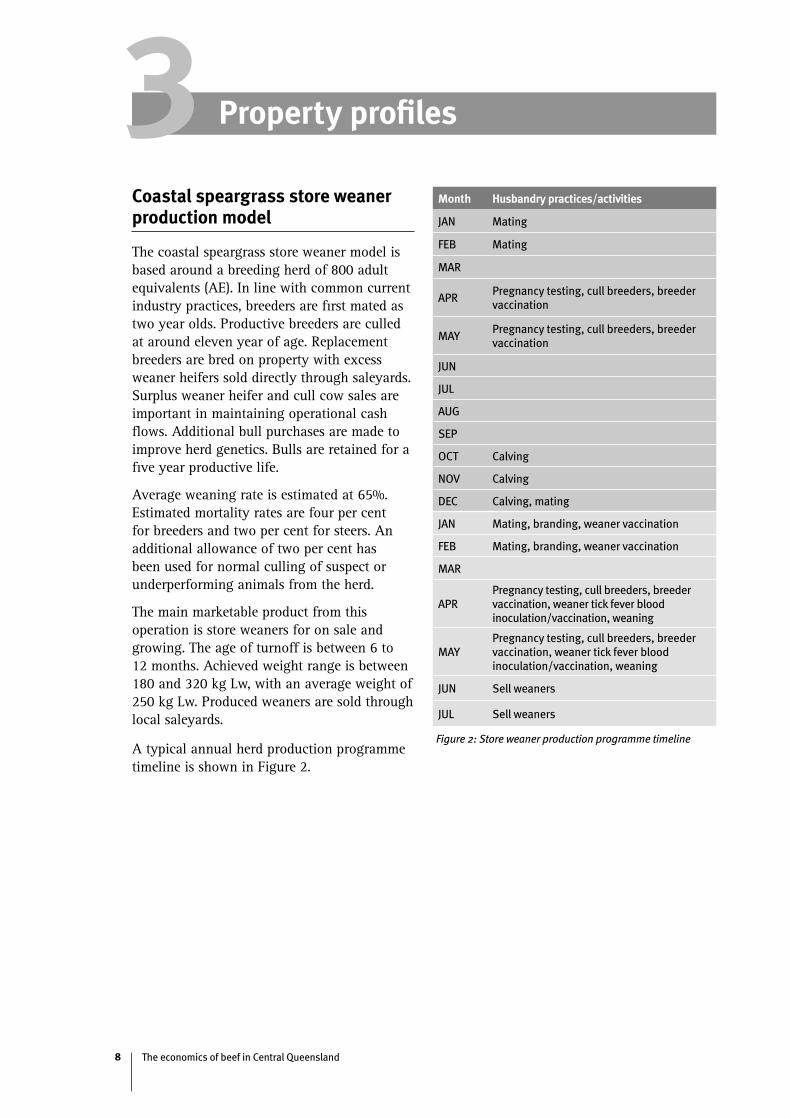
The coastal speargrass store weaner model is based around a breeding herd of 800 adult equivalents (AE). In line with common current industry practices, breeders are first mated as two year olds. Productive breeders are culled at around eleven year of age. Replacement breeders are bred on property with excess weaner heifers sold directly through saleyards. Surplus weaner heifer and cull cow sales are important in maintaining operational cash flows. Additional bull purchases are made to improve herd genetics. Bulls are retained for a five year productive life.
Average weaning rate is estimated at 65%. Estimated mortality rates are four per cent for breeders and two per cent for steers. An additional allowance of two per cent has been used for normal culling of suspect or underperforming animals from the herd.
The main marketable product from this operation is store weaners for on sale and growing. The age of turnoff is between 6 to 12 months. Achieved weight range is between 180 and 320 kg Lw, with an average weight of 250 kg Lw. Produced weaners are sold through local saleyards.
A typical annual herd production programme timeline is shown in Figure 2.
Month Husbandry practices/activities
JAN Mating
FEB Mating
MAR
APRPregnancy testing, cull breeders, breeder vaccination
MAYPregnancy testing, cull breeders, breeder vaccination
JUN
JUL
AUG
SEP
OCT Calving
NOV Calving
DEC Calving, mating
JAN Mating, branding, weaner vaccination
FEB Mating, branding, weaner vaccination
MAR
APRPregnancy testing, cull breeders, breeder vaccination, weaner tick fever blood inoculation/vaccination, weaning
MAYPregnancy testing, cull breeders, breeder vaccination, weaner tick fever blood inoculation/vaccination, weaning
JUN Sell weaners
JUL Sell weaners
Figure 2: Store weaner production programme timeline
The economics of beef in Central Queensland 9
Age at start of rating period Number carried AE/beast Total AE for groupExtra for lactating cows - 0.35 139Weaners – 5 months 94 0.48 45Heifers 1 y.o. 89 0.66 59Heifers 2 y.o. 86 0.8 69Cows 3 y.o. + 525 0.88 462Steers 1 y.o. 1 0.69 1Bulls all ages 18 1.43 26
Total number carried 813 Total AE 800
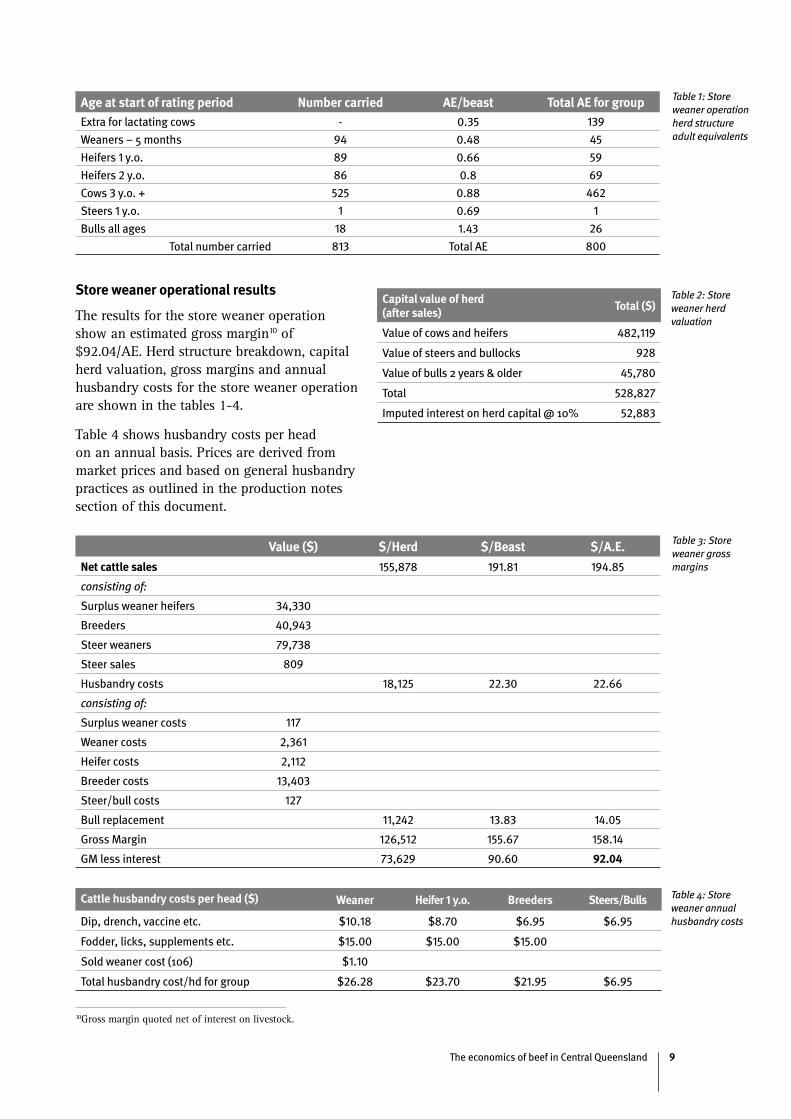
Table 1: Store weaner operation herd structure adult equivalents
Capital value of herd (after sales)
Total ($)
Value of cows and heifers 482,119
Value of steers and bullocks 928
Value of bulls 2 years & older 45,780
Total 528,827
Imputed interest on herd capital @ 10% 52,883
Table 2: Store weaner herd valuation
Value ($) $/Herd $/Beast $/A.E.
Net cattle sales 155,878 191.81 194.85
consisting of:
Surplus weaner heifers 34,330
Breeders 40,943
Steer weaners 79,738
Steer sales 809
Husbandry costs 18,125 22.30 22.66
consisting of:
Surplus weaner costs 117
Weaner costs 2,361
Heifer costs 2,112
Breeder costs 13,403
Steer/bull costs 127
Bull replacement 11,242 13.83 14.05
Gross Margin 126,512 155.67 158.14
GM less interest 73,629 90.60 92.04
Table 3: Store weaner gross margins
10Gross margin quoted net of interest on livestock.
Store weaner operational results
The results for the store weaner operation show an estimated gross margin10 of $92.04/AE. Herd structure breakdown, capital herd valuation, gross margins and annual husbandry costs for the store weaner operation are shown in the tables 1-4.
Table 4 shows husbandry costs per head on an annual basis. Prices are derived from market prices and based on general husbandry practices as outlined in the production notes section of this document.
Cattle husbandry costs per head ($) Weaner Heifer 1 y.o. Breeders Steers/Bulls
Dip, drench, vaccine etc. $10.18 $8.70 $6.95 $6.95
Fodder, licks, supplements etc. $15.00 $15.00 $15.00
Sold weaner cost (106) $1.10
Total husbandry cost/hd for group $26.28 $23.70 $21.95 $6.95
Table 4: Store weaner annual husbandry costs
The economics of beef in Central Queensland10
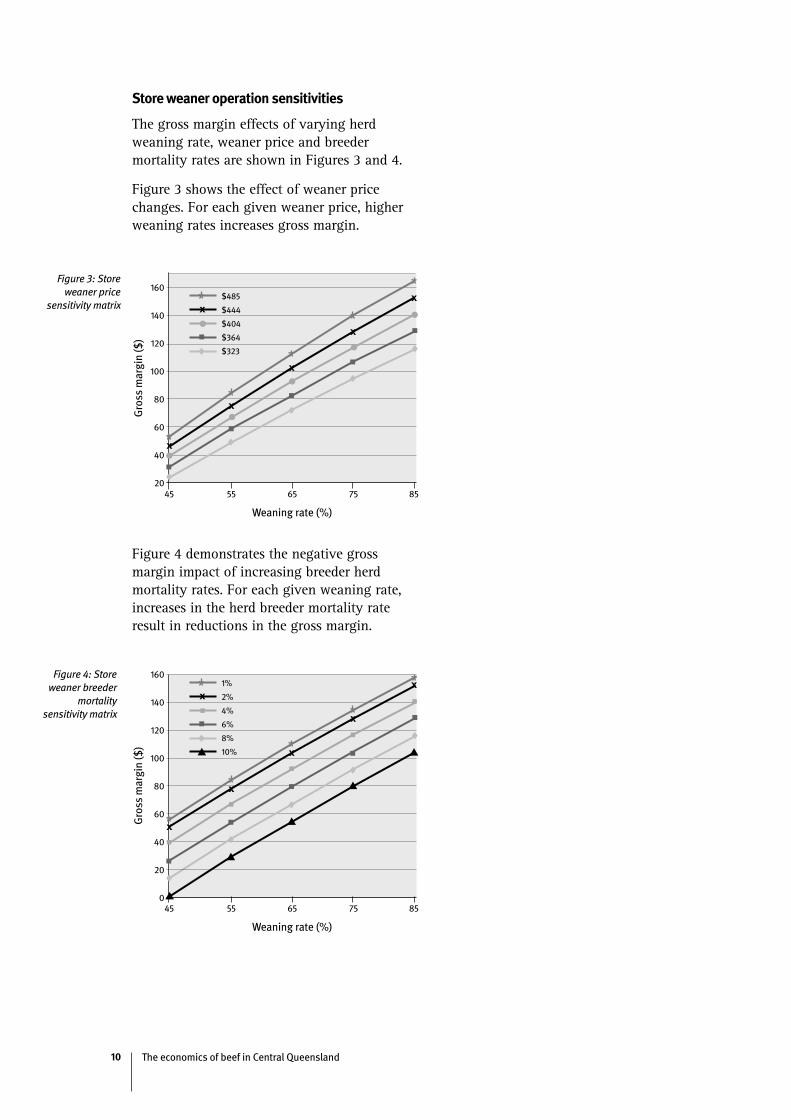
Store weaner operation sensitivities
The gross margin effects of varying herd weaning rate, weaner price and breeder mortality rates are shown in Figures 3 and 4.
Figure 3 shows the effect of weaner price changes. For each given weaner price, higher weaning rates increases gross margin.
Figure 3: Store weaner price
sensitivity matrix
Figure 4: Store weaner breeder
mortality sensitivity matrix
Weaning rate (%)
160
140
120
100
80
60
40
20
Gro
ss m
argi
n ($
)
x
x
x
x
x
45 55 65 75 85
x$485
$444
$404
$364
$323
Weaning rate (%)
160
140
120
100
80
60
40
20
0
Gro
ss m
argi
n ($
)
x
x
x
x
x
45 55 65 75 85
x1%
2%
4%
6%
8%
10%
Figure 4 demonstrates the negative gross margin impact of increasing breeder herd mortality rates. For each given weaning rate, increases in the herd breeder mortality rate result in reductions in the gross margin.
The economics of beef in Central Queensland 11
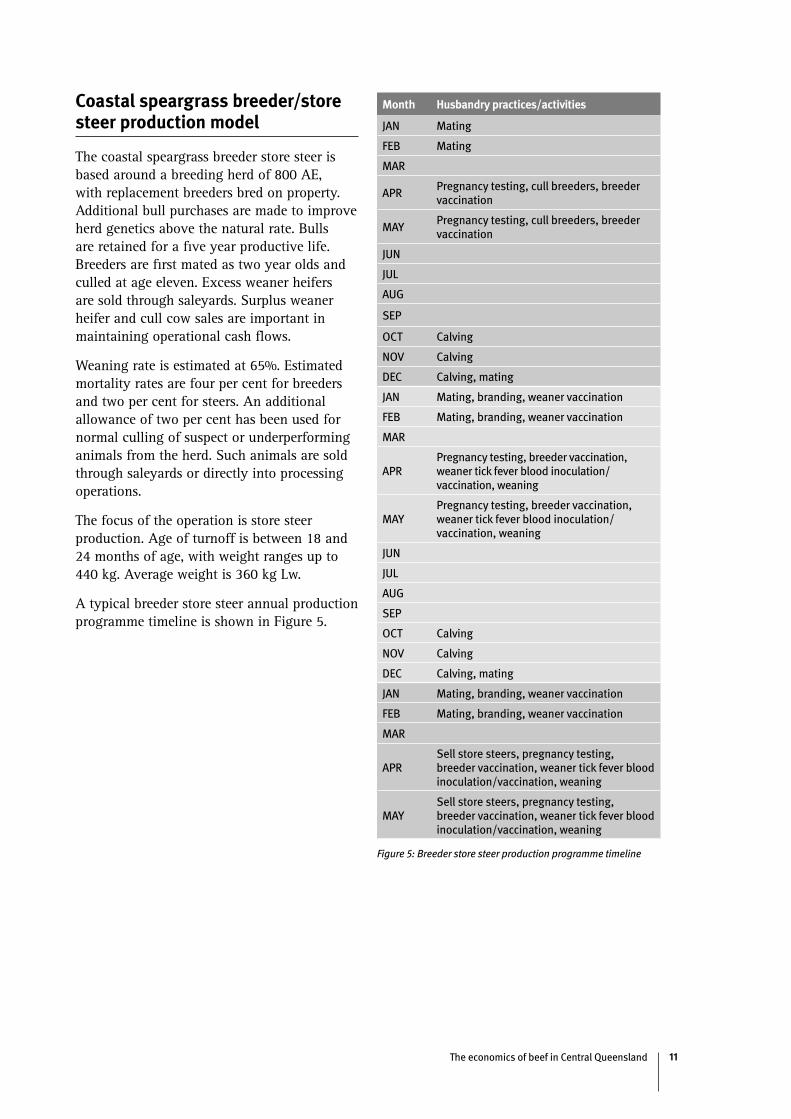
Coastal speargrass breeder/store steer production model
The coastal speargrass breeder store steer is based around a breeding herd of 800 AE, with replacement breeders bred on property. Additional bull purchases are made to improve herd genetics above the natural rate. Bulls are retained for a five year productive life. Breeders are first mated as two year olds and culled at age eleven. Excess weaner heifers are sold through saleyards. Surplus weaner heifer and cull cow sales are important in maintaining operational cash flows.
Weaning rate is estimated at 65%. Estimated mortality rates are four per cent for breeders and two per cent for steers. An additional allowance of two per cent has been used for normal culling of suspect or underperforming animals from the herd. Such animals are sold through saleyards or directly into processing operations.
The focus of the operation is store steer production. Age of turnoff is between 18 and 24 months of age, with weight ranges up to 440 kg. Average weight is 360 kg Lw.
A typical breeder store steer annual production programme timeline is shown in Figure 5.
Figure 5: Breeder store steer production programme timeline
Month Husbandry practices/activities
JAN Mating
FEB Mating
MAR
APRPregnancy testing, cull breeders, breeder vaccination
MAYPregnancy testing, cull breeders, breeder vaccination
JUN
JUL
AUG
SEP
OCT Calving
NOV Calving
DEC Calving, mating
JAN Mating, branding, weaner vaccination
FEB Mating, branding, weaner vaccination
MAR
APRPregnancy testing, breeder vaccination, weaner tick fever blood inoculation/vaccination, weaning
MAYPregnancy testing, breeder vaccination, weaner tick fever blood inoculation/vaccination, weaning
JUN
JUL
AUG
SEP
OCT Calving
NOV Calving
DEC Calving, mating
JAN Mating, branding, weaner vaccination
FEB Mating, branding, weaner vaccination
MAR
APRSell store steers, pregnancy testing, breeder vaccination, weaner tick fever blood inoculation/vaccination, weaning
MAYSell store steers, pregnancy testing, breeder vaccination, weaner tick fever blood inoculation/vaccination, weaning
The economics of beef in Central Queensland12
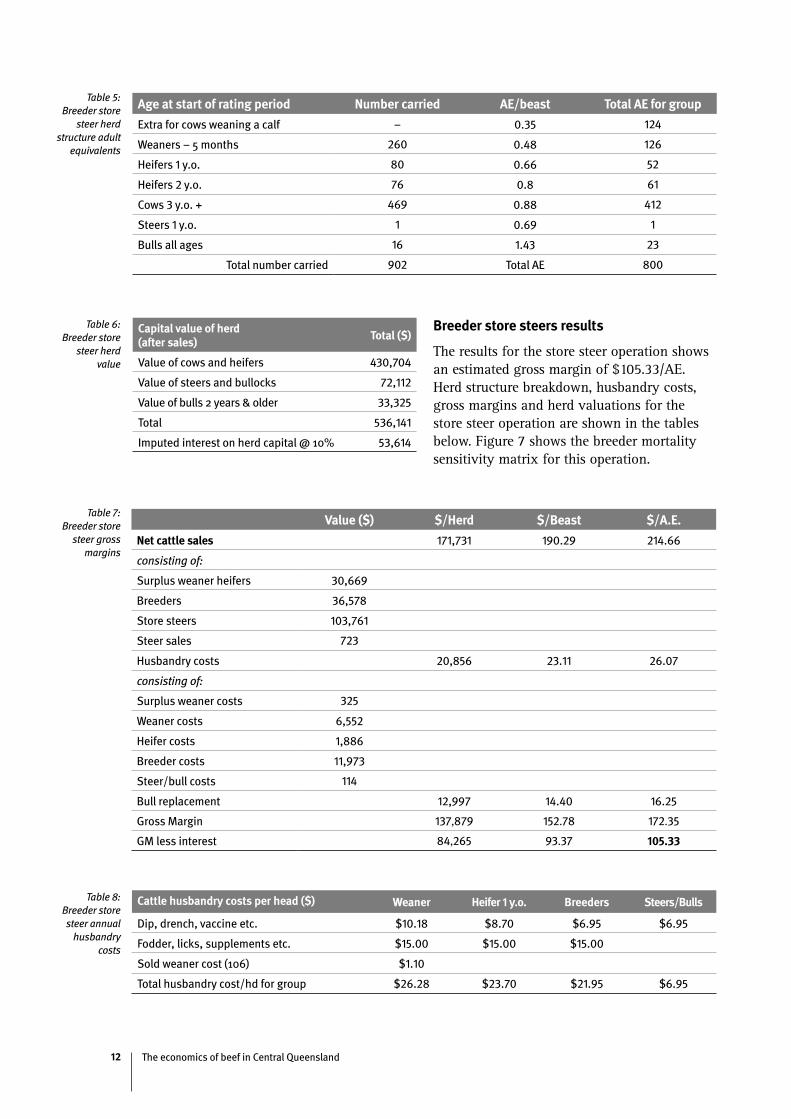
Breeder store steers results
The results for the store steer operation shows an estimated gross margin of $105.33/AE. Herd structure breakdown, husbandry costs, gross margins and herd valuations for the store steer operation are shown in the tables below. Figure 7 shows the breeder mortality sensitivity matrix for this operation.
Age at start of rating period Number carried AE/beast Total AE for group
Extra for cows weaning a calf – 0.35 124
Weaners – 5 months 260 0.48 126
Heifers 1 y.o. 80 0.66 52
Heifers 2 y.o. 76 0.8 61
Cows 3 y.o. + 469 0.88 412
Steers 1 y.o. 1 0.69 1
Bulls all ages 16 1.43 23
Total number carried 902 Total AE 800
Capital value of herd (after sales) Total ($)
Value of cows and heifers 430,704
Value of steers and bullocks 72,112
Value of bulls 2 years & older 33,325
Total 536,141
Imputed interest on herd capital @ 10% 53,614
Value ($) $/Herd $/Beast $/A.E.
Net cattle sales 171,731 190.29 214.66
consisting of:
Surplus weaner heifers 30,669
Breeders 36,578
Store steers 103,761
Steer sales 723
Husbandry costs 20,856 23.11 26.07
consisting of:
Surplus weaner costs 325
Weaner costs 6,552
Heifer costs 1,886
Breeder costs 11,973
Steer/bull costs 114
Bull replacement 12,997 14.40 16.25
Gross Margin 137,879 152.78 172.35
GM less interest 84,265 93.37 105.33
Cattle husbandry costs per head ($) Weaner Heifer 1 y.o. Breeders Steers/Bulls
Dip, drench, vaccine etc. $10.18 $8.70 $6.95 $6.95
Fodder, licks, supplements etc. $15.00 $15.00 $15.00
Sold weaner cost (106) $1.10
Total husbandry cost/hd for group $26.28 $23.70 $21.95 $6.95
Table 5: Breeder store
steer herd structure adult
equivalents
Table 6: Breeder store
steer herd value
Table 7: Breeder store
steer gross margins
Table 8: Breeder store steer annual
husbandry costs
The economics of beef in Central Queensland 13
Weaning rate (%)
190
170
150
130
110
90
70
50
30
Gro
ss m
argi
n ($
)
x
x
x
x
x
45 55 65 75 85
x$713
$653
$594
$535
$475
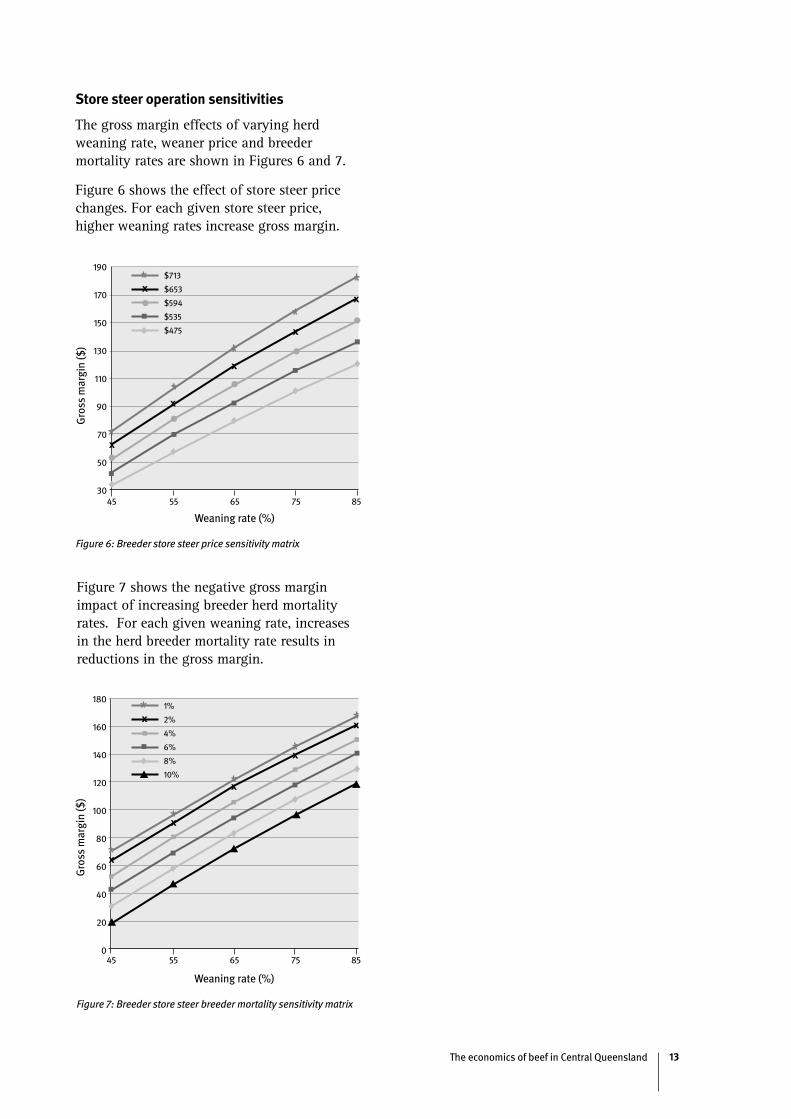
Figure 6: Breeder store steer price sensitivity matrix
Figure 7 shows the negative gross margin impact of increasing breeder herd mortality rates. For each given weaning rate, increases in the herd breeder mortality rate results in reductions in the gross margin.
Weaning rate (%)
180
160
140
120
100
80
60
40
20
0
Gro
ss m
argi
n ($
)
x
x
x
x
x
45 55 65 75 85
x1%
2%
4%
6%
8%
10%
Figure 7: Breeder store steer breeder mortality sensitivity matrix
Store steer operation sensitivities
The gross margin effects of varying herd weaning rate, weaner price and breeder mortality rates are shown in Figures 6 and 7.
Figure 6 shows the effect of store steer price changes. For each given store steer price, higher weaning rates increase gross margin.
The economics of beef in Central Queensland14
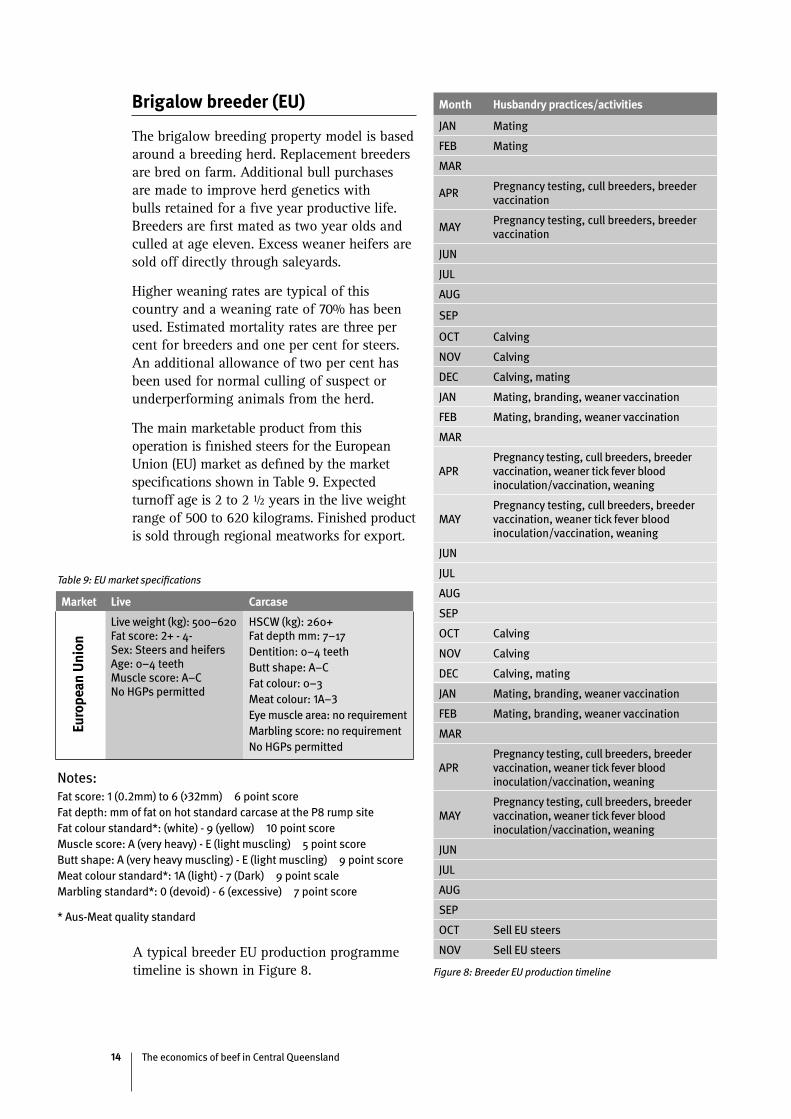
Brigalow breeder (EU)
The brigalow breeding property model is based around a breeding herd. Replacement breeders are bred on farm. Additional bull purchases are made to improve herd genetics with bulls retained for a five year productive life. Breeders are first mated as two year olds and culled at age eleven. Excess weaner heifers are sold off directly through saleyards.
Higher weaning rates are typical of this country and a weaning rate of 70% has been used. Estimated mortality rates are three per cent for breeders and one per cent for steers. An additional allowance of two per cent has been used for normal culling of suspect or underperforming animals from the herd.
The main marketable product from this operation is finished steers for the European Union (EU) market as defined by the market specifications shown in Table 9. Expected turnoff age is 2 to 2 ½ years in the live weight range of 500 to 620 kilograms. Finished product is sold through regional meatworks for export.
Month Husbandry practices/activities
JAN Mating
FEB Mating
MAR
APRPregnancy testing, cull breeders, breeder vaccination
MAYPregnancy testing, cull breeders, breeder vaccination
JUN
JUL
AUG
SEP
OCT Calving
NOV Calving
DEC Calving, mating
JAN Mating, branding, weaner vaccination
FEB Mating, branding, weaner vaccination
MAR
APRPregnancy testing, cull breeders, breeder vaccination, weaner tick fever blood inoculation/vaccination, weaning
MAYPregnancy testing, cull breeders, breeder vaccination, weaner tick fever blood inoculation/vaccination, weaning
JUN
JUL
AUG
SEP
OCT Sell EU steers
NOV Sell EU steers
Figure 8: Breeder EU production timeline
Market Live Carcase
Live weight (kg): 500–620 Fat score: 2+ - 4- Sex: Steers and heifers Age: 0–4 teeth Muscle score: A–C No HGPs permitted
HSCW (kg): 260+ Fat depth mm: 7–17Dentition: 0–4 teethButt shape: A–CFat colour: 0–3Meat colour: 1A–3Eye muscle area: no requirementMarbling score: no requirementNo HGPs permitted
Euro
pean
Uni
on
Notes: Fat score: 1 (0.2mm) to 6 (>32mm) 6 point score Fat depth: mm of fat on hot standard carcase at the P8 rump site Fat colour standard*: (white) - 9 (yellow) 10 point scoreMuscle score: A (very heavy) - E (light muscling) 5 point scoreButt shape: A (very heavy muscling) - E (light muscling) 9 point scoreMeat colour standard*: 1A (light) - 7 (Dark) 9 point scaleMarbling standard*: 0 (devoid) - 6 (excessive) 7 point score
* Aus-Meat quality standard
Table 9: EU market specifications
A typical breeder EU production programme timeline is shown in Figure 8.
The economics of beef in Central Queensland 15
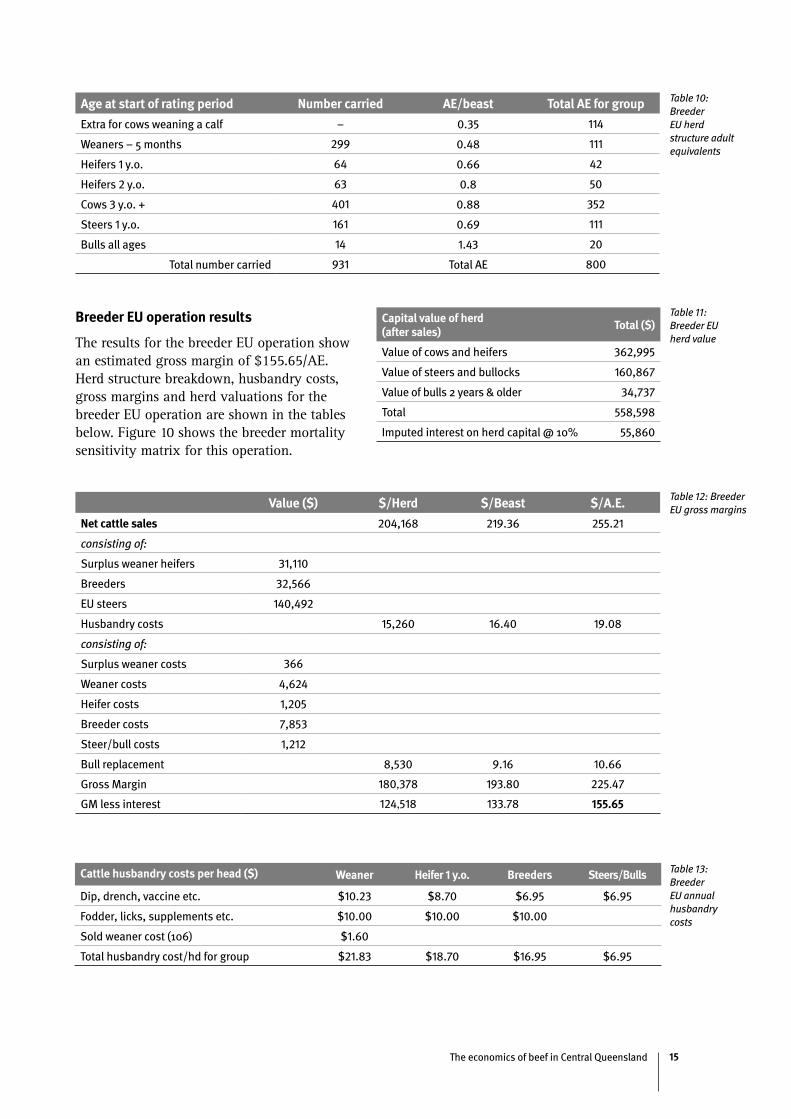
Age at start of rating period Number carried AE/beast Total AE for group
Extra for cows weaning a calf – 0.35 114
Weaners – 5 months 299 0.48 111
Heifers 1 y.o. 64 0.66 42
Heifers 2 y.o. 63 0.8 50
Cows 3 y.o. + 401 0.88 352
Steers 1 y.o. 161 0.69 111
Bulls all ages 14 1.43 20
Total number carried 931 Total AE 800
Capital value of herd (after sales)
Total ($)
Value of cows and heifers 362,995
Value of steers and bullocks 160,867
Value of bulls 2 years & older 34,737
Total 558,598
Imputed interest on herd capital @ 10% 55,860
Value ($) $/Herd $/Beast $/A.E.
Net cattle sales 204,168 219.36 255.21
consisting of:
Surplus weaner heifers 31,110
Breeders 32,566
EU steers 140,492
Husbandry costs 15,260 16.40 19.08
consisting of:
Surplus weaner costs 366
Weaner costs 4,624
Heifer costs 1,205
Breeder costs 7,853
Steer/bull costs 1,212
Bull replacement 8,530 9.16 10.66
Gross Margin 180,378 193.80 225.47
GM less interest 124,518 133.78 155.65
Cattle husbandry costs per head ($) Weaner Heifer 1 y.o. Breeders Steers/Bulls
Dip, drench, vaccine etc. $10.23 $8.70 $6.95 $6.95
Fodder, licks, supplements etc. $10.00 $10.00 $10.00
Sold weaner cost (106) $1.60
Total husbandry cost/hd for group $21.83 $18.70 $16.95 $6.95
Breeder EU operation results
The results for the breeder EU operation show an estimated gross margin of $155.65/AE. Herd structure breakdown, husbandry costs, gross margins and herd valuations for the breeder EU operation are shown in the tables below. Figure 10 shows the breeder mortality sensitivity matrix for this operation.
Table 10: Breeder EU herd structure adult equivalents
Table 12: Breeder EU gross margins
Table 11: Breeder EU herd value
Table 13: Breeder EU annual husbandry costs
The economics of beef in Central Queensland16
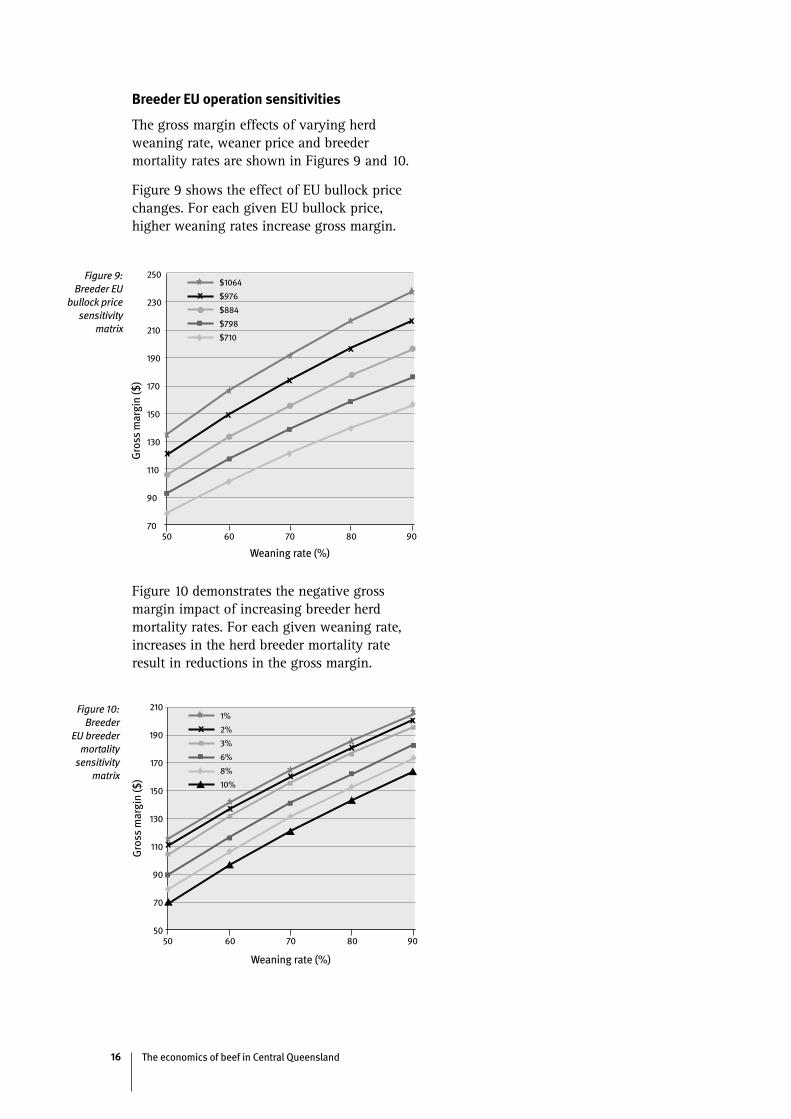
Breeder EU operation sensitivities
The gross margin effects of varying herd weaning rate, weaner price and breeder mortality rates are shown in Figures 9 and 10.
Figure 9 shows the effect of EU bullock price changes. For each given EU bullock price, higher weaning rates increase gross margin.
Weaning rate (%)
250
230
210
190
170
150
130
110
90
70
Gro
ss m
argi
n ($
)
x
x
x
x
x
50 60 70 80 90
x$1064
$976
$884
$798
$710
Figure 10 demonstrates the negative gross margin impact of increasing breeder herd mortality rates. For each given weaning rate, increases in the herd breeder mortality rate result in reductions in the gross margin.
Weaning rate (%)
210
190
170
150
130
110
90
70
50
Gro
ss m
argi
n ($
)
x
x
x
x
x
50 60 70 80 90
x1%
2%
3%
6%
8%
10%
Figure 9: Breeder EU
bullock price sensitivity
matrix
Figure 10: Breeder
EU breeder mortality
sensitivity matrix
The economics of beef in Central Queensland 17
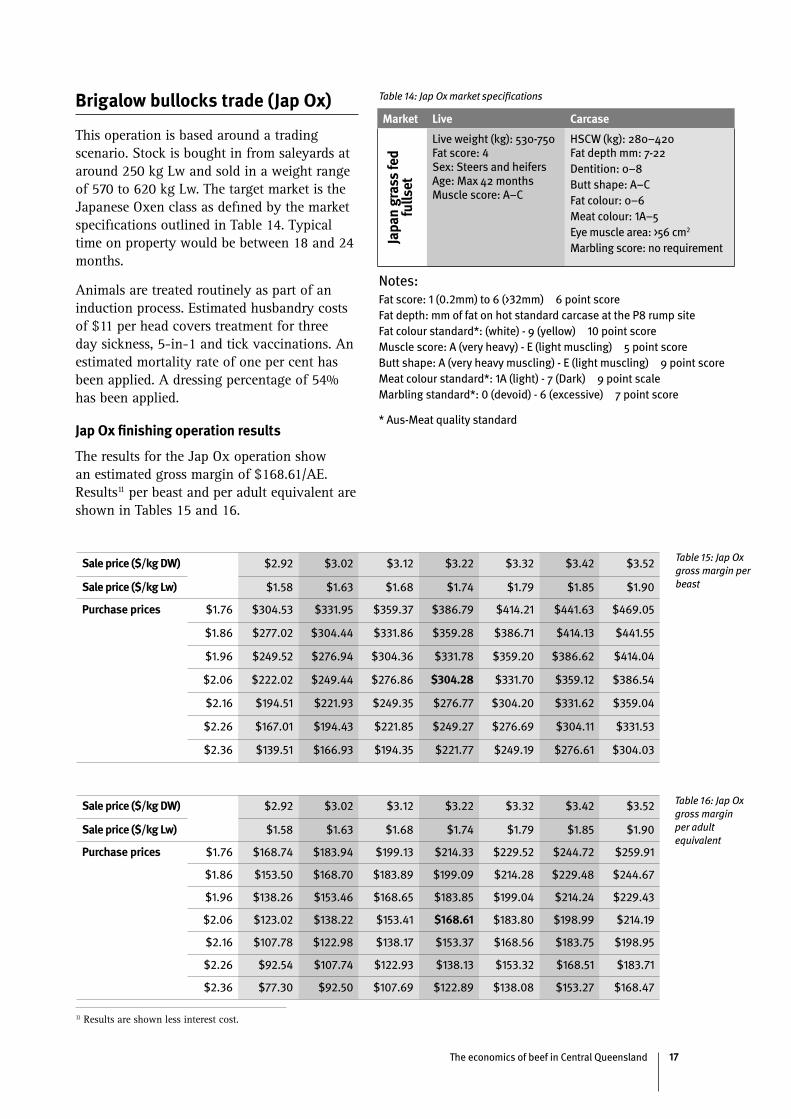
Market Live Carcase
Live weight (kg): 530-750 Fat score: 4 Sex: Steers and heifers Age: Max 42 months Muscle score: A–C
HSCW (kg): 280–420 Fat depth mm: 7-22Dentition: 0–8Butt shape: A–CFat colour: 0–6Meat colour: 1A–5Eye muscle area: >56 cm2
Marbling score: no requirement
Notes: Fat score: 1 (0.2mm) to 6 (>32mm) 6 point score Fat depth: mm of fat on hot standard carcase at the P8 rump site Fat colour standard*: (white) - 9 (yellow) 10 point scoreMuscle score: A (very heavy) - E (light muscling) 5 point scoreButt shape: A (very heavy muscling) - E (light muscling) 9 point scoreMeat colour standard*: 1A (light) - 7 (Dark) 9 point scaleMarbling standard*: 0 (devoid) - 6 (excessive) 7 point score
* Aus-Meat quality standard
Table 14: Jap Ox market specificationsBrigalow bullocks trade (Jap Ox)
This operation is based around a trading scenario. Stock is bought in from saleyards at around 250 kg Lw and sold in a weight range of 570 to 620 kg Lw. The target market is the Japanese Oxen class as defined by the market specifications outlined in Table 14. Typical time on property would be between 18 and 24 months.
Animals are treated routinely as part of an induction process. Estimated husbandry costs of $11 per head covers treatment for three day sickness, 5-in-1 and tick vaccinations. An estimated mortality rate of one per cent has been applied. A dressing percentage of 54% has been applied.
Jap Ox finishing operation results
The results for the Jap Ox operation show an estimated gross margin of $168.61/AE. Results11 per beast and per adult equivalent are shown in Tables 15 and 16.
Japa
n gr
ass
fed
fulls
et
11 Results are shown less interest cost.
Sale price ($/kg DW) $2.92 $3.02 $3.12 $3.22 $3.32 $3.42 $3.52
Sale price ($/kg Lw) $1.58 $1.63 $1.68 $1.74 $1.79 $1.85 $1.90
Purchase prices
$1.76 $304.53 $331.95 $359.37 $386.79 $414.21 $441.63 $469.05
$1.86 $277.02 $304.44 $331.86 $359.28 $386.71 $414.13 $441.55
$1.96 $249.52 $276.94 $304.36 $331.78 $359.20 $386.62 $414.04
$2.06 $222.02 $249.44 $276.86 $304.28 $331.70 $359.12 $386.54
$2.16 $194.51 $221.93 $249.35 $276.77 $304.20 $331.62 $359.04
$2.26 $167.01 $194.43 $221.85 $249.27 $276.69 $304.11 $331.53
$2.36 $139.51 $166.93 $194.35 $221.77 $249.19 $276.61 $304.03
Sale price ($/kg DW) $2.92 $3.02 $3.12 $3.22 $3.32 $3.42 $3.52
Sale price ($/kg Lw) $1.58 $1.63 $1.68 $1.74 $1.79 $1.85 $1.90
Purchase prices
$1.76 $168.74 $183.94 $199.13 $214.33 $229.52 $244.72 $259.91
$1.86 $153.50 $168.70 $183.89 $199.09 $214.28 $229.48 $244.67
$1.96 $138.26 $153.46 $168.65 $183.85 $199.04 $214.24 $229.43
$2.06 $123.02 $138.22 $153.41 $168.61 $183.80 $198.99 $214.19
$2.16 $107.78 $122.98 $138.17 $153.37 $168.56 $183.75 $198.95
$2.26 $92.54 $107.74 $122.93 $138.13 $153.32 $168.51 $183.71
$2.36 $77.30 $92.50 $107.69 $122.89 $138.08 $153.27 $168.47
Table 15: Jap Ox gross margin per beast
Table 16: Jap Ox gross margin per adult equivalent
The economics of beef in Central Queensland18
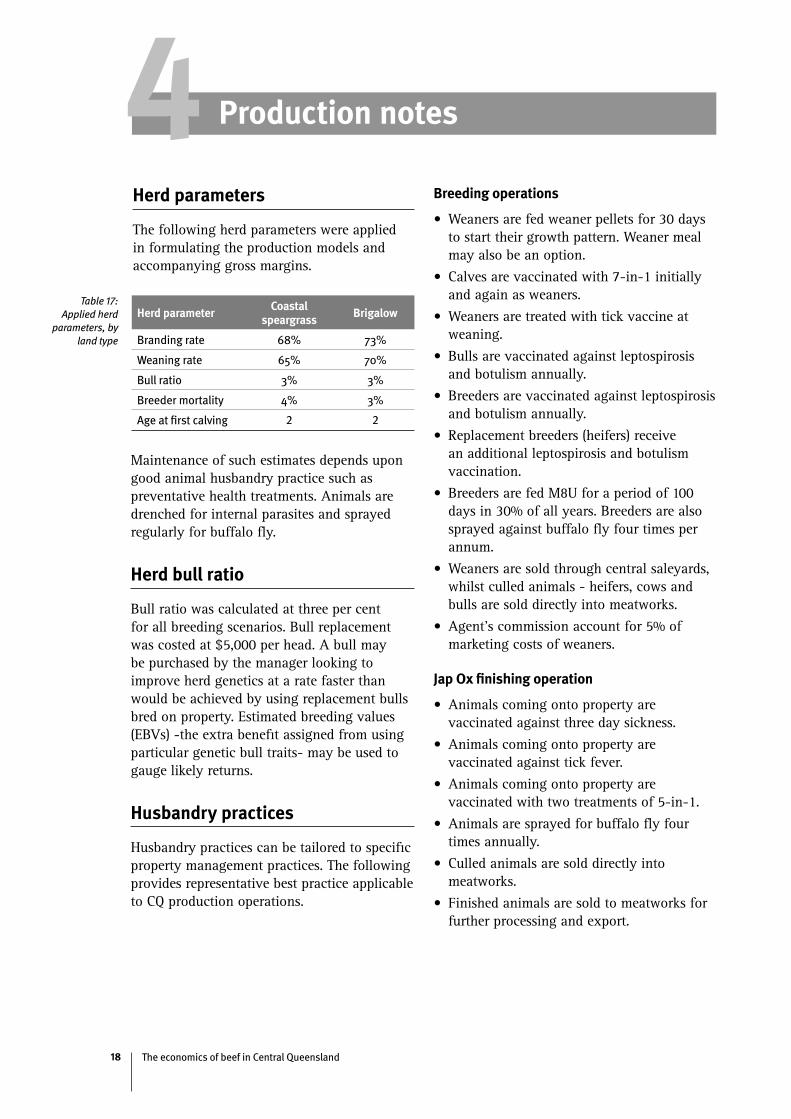
Production notes4Herd parameters
The following herd parameters were applied in formulating the production models and accompanying gross margins.
Herd parameterCoastal
speargrassBrigalow
Branding rate 68% 73%
Weaning rate 65% 70%
Bull ratio 3% 3%
Breeder mortality 4% 3%
Age at first calving 2 2
Table 17: Applied herd
parameters, by land type
Maintenance of such estimates depends upon good animal husbandry practice such as preventative health treatments. Animals are drenched for internal parasites and sprayed regularly for buffalo fly.
Herd bull ratio
Bull ratio was calculated at three per cent for all breeding scenarios. Bull replacement was costed at $5,000 per head. A bull may be purchased by the manager looking to improve herd genetics at a rate faster than would be achieved by using replacement bulls bred on property. Estimated breeding values (EBVs) -the extra benefit assigned from using particular genetic bull traits- may be used to gauge likely returns.
Husbandry practices
Husbandry practices can be tailored to specific property management practices. The following provides representative best practice applicable to CQ production operations.
Breeding operations
• Weaners are fed weaner pellets for 30 days to start their growth pattern. Weaner meal may also be an option.
• Calves are vaccinated with 7-in-1 initially and again as weaners.
• Weaners are treated with tick vaccine at weaning.
• Bulls are vaccinated against leptospirosis and botulism annually.
• Breeders are vaccinated against leptospirosis and botulism annually.
• Replacement breeders (heifers) receive an additional leptospirosis and botulism vaccination.
• Breeders are fed M8U for a period of 100 days in 30% of all years. Breeders are also sprayed against buffalo fly four times per annum.
• Weaners are sold through central saleyards, whilst culled animals - heifers, cows and bulls are sold directly into meatworks.
• Agent’s commission account for 5% of marketing costs of weaners.
Jap Ox finishing operation
• Animals coming onto property are vaccinated against three day sickness.
• Animals coming onto property are vaccinated against tick fever.
• Animals coming onto property are vaccinated with two treatments of 5-in-1.
• Animals are sprayed for buffalo fly four times annually.
• Culled animals are sold directly into meatworks.
• Finished animals are sold to meatworks for further processing and export.
The economics of beef in Central Queensland 19
Additional assumptions
• Best management practices (BMP) are used in the running of the beef enterprise business. This includes completion of all recommended veterinary tasks and the feeding of supplementary rations as appropriate.
• Recent market prices are used. Prices should be seen in context of their historic record high levels.
• Animal weights are taken from past publications as well as expert technical advice from extension staff.
• No additional labour has been costed in the current gross margin analyses. All labour is provided from on farm resources.
• All variable costs are based on recommended retail prices (r.r.p) at Rockhampton as at May 2006.
The economics of beef in Central Queensland20
ppendix 1 Land type descriptionsA��
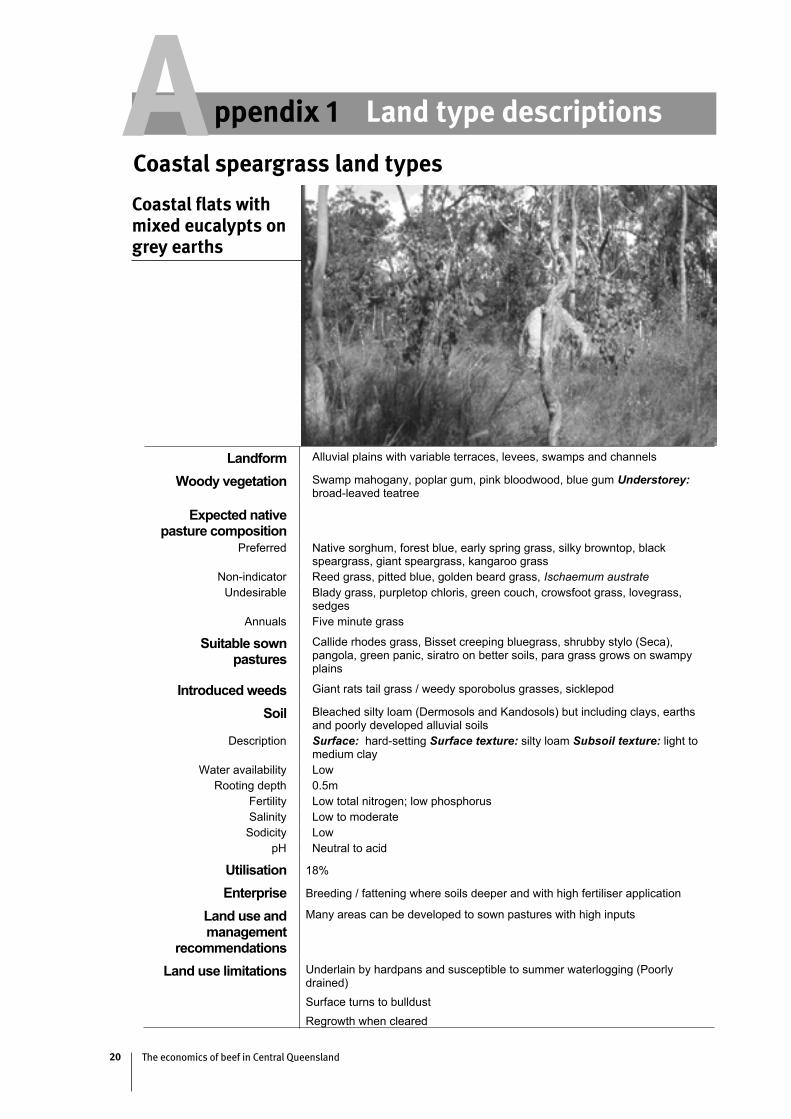
Landform Alluvial plains with variable terraces, levees, swamps and channels
Woody vegetation Swamp mahogany, poplar gum, pink bloodwood, blue gum Understorey:broad-leaved teatree
Expected native pasture composition
Preferred Native sorghum, forest blue, early spring grass, silky browntop, blackspeargrass, giant speargrass, kangaroo grass
Non-indicator Reed grass, pitted blue, golden beard grass, Ischaemum austrateUndesirable Blady grass, purpletop chloris, green couch, crowsfoot grass, lovegrass,
sedgesAnnuals Five minute grass
Suitable sownpastures
Callide rhodes grass, Bisset creeping bluegrass, shrubby stylo (Seca),pangola, green panic, siratro on better soils, para grass grows on swampy plains
Introduced weeds Giant rats tail grass / weedy sporobolus grasses, sicklepod
Soil Bleached silty loam (Dermosols and Kandosols) but including clays, earthsand poorly developed alluvial soils
Description Surface: hard-setting Surface texture: silty loam Subsoil texture: light to medium clay
Water availability LowRooting depth 0.5m
Fertility Low total nitrogen; low phosphorusSalinity Low to moderate
Sodicity LowpH Neutral to acid
Utilisation 18%
Enterprise Breeding / fattening where soils deeper and with high fertiliser application
Land use andmanagement
recommendations
Many areas can be developed to sown pastures with high inputs
Land use limitations Underlain by hardpans and susceptible to summer waterlogging (Poorlydrained)Surface turns to bulldustRegrowth when cleared
Coastal flats with mixed eucalypts on grey earths
Coastal speargrass land types
The economics of beef in Central Queensland 21
��
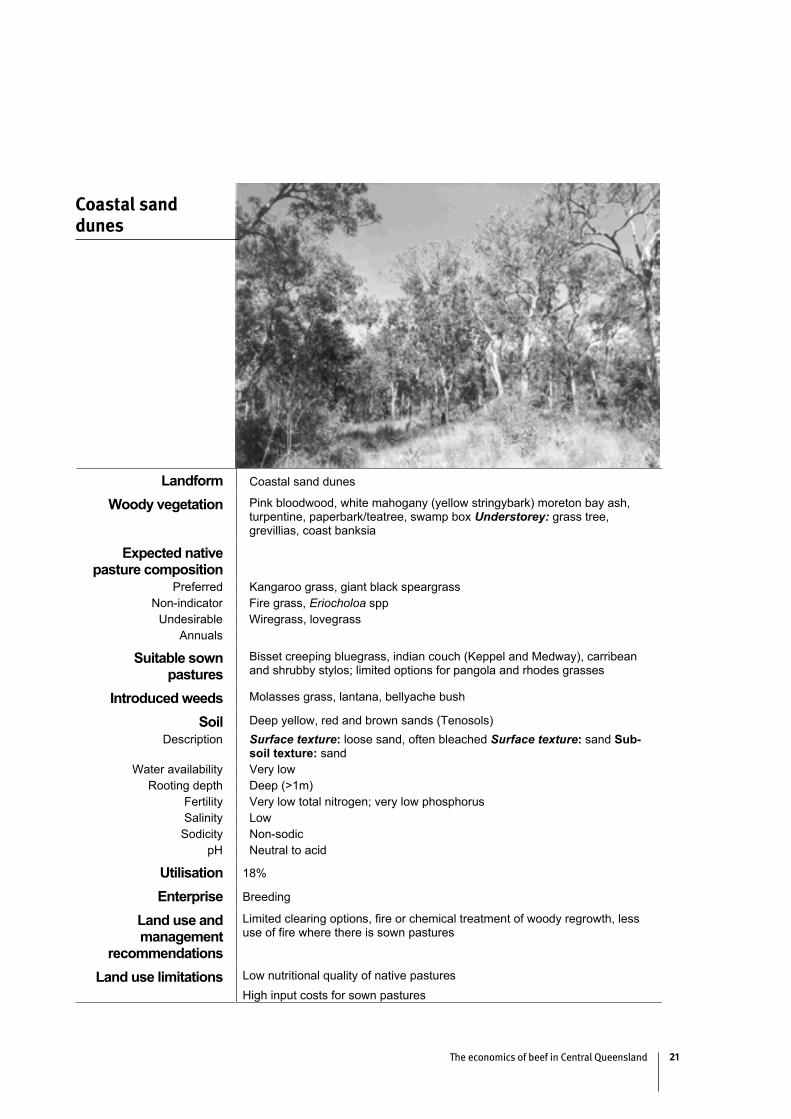
Landform Coastal sand dunes
Woody vegetation Pink bloodwood, white mahogany (yellow stringybark) moreton bay ash, turpentine, paperbark/teatree, swamp box Understorey: grass tree,grevillias, coast banksia
Expected native pasture composition
Preferred Kangaroo grass, giant black speargrassNon-indicator Fire grass, Eriocholoa spp
Undesirable Wiregrass, lovegrassAnnuals
Suitable sownpastures
Bisset creeping bluegrass, indian couch (Keppel and Medway), carribeanand shrubby stylos; limited options for pangola and rhodes grasses
Introduced weeds Molasses grass, lantana, bellyache bush
Soil Deep yellow, red and brown sands (Tenosols)Description Surface texture: loose sand, often bleached Surface texture: sand Sub-
soil texture: sandWater availability Very low
Rooting depth Deep (>1m) Fertility Very low total nitrogen; very low phosphorusSalinity Low
Sodicity Non-sodicpH Neutral to acid
Utilisation 18%
Enterprise Breeding
Land use andmanagement
recommendations
Limited clearing options, fire or chemical treatment of woody regrowth, less use of fire where there is sown pastures
Land use limitations Low nutritional quality of native pasturesHigh input costs for sown pastures
Coastal sand dunes
The economics of beef in Central Queensland22
��
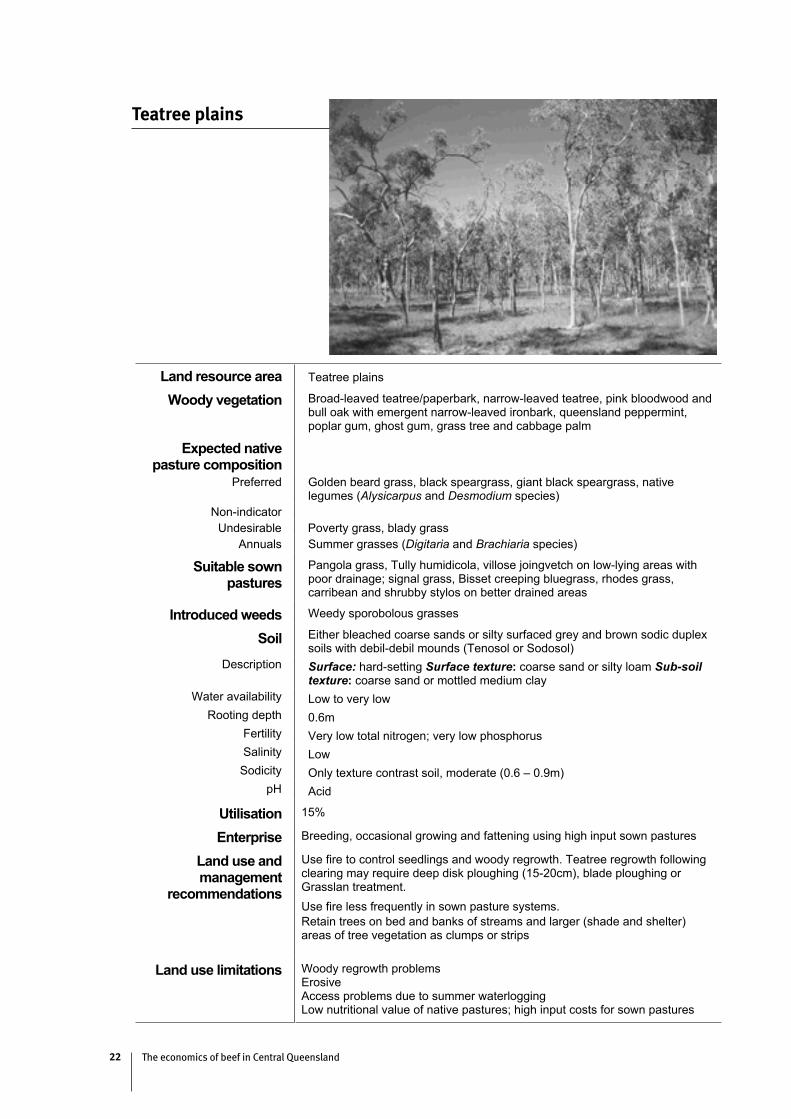
Land resource area Teatree plains
Woody vegetation Broad-leaved teatree/paperbark, narrow-leaved teatree, pink bloodwood and bull oak with emergent narrow-leaved ironbark, queensland peppermint,poplar gum, ghost gum, grass tree and cabbage palm
Expected native pasture composition
Preferred Golden beard grass, black speargrass, giant black speargrass, nativelegumes (Alysicarpus and Desmodium species)
Non-indicatorUndesirable Poverty grass, blady grass
Annuals Summer grasses (Digitaria and Brachiaria species)
Suitable sownpastures
Pangola grass, Tully humidicola, villose joingvetch on low-lying areas withpoor drainage; signal grass, Bisset creeping bluegrass, rhodes grass,carribean and shrubby stylos on better drained areas
Introduced weeds Weedy sporobolous grasses
Soil Either bleached coarse sands or silty surfaced grey and brown sodic duplexsoils with debil-debil mounds (Tenosol or Sodosol)
Description Surface: hard-setting Surface texture: coarse sand or silty loam Sub-soiltexture: coarse sand or mottled medium clay
Water availability Low to very low Rooting depth 0.6m
Fertility Very low total nitrogen; very low phosphorusSalinity Low
Sodicity Only texture contrast soil, moderate (0.6 – 0.9m) pH Acid
Utilisation 15%
Enterprise Breeding, occasional growing and fattening using high input sown pastures
Land use andmanagement
recommendations
Use fire to control seedlings and woody regrowth. Teatree regrowth followingclearing may require deep disk ploughing (15-20cm), blade ploughing or Grasslan treatment.Use fire less frequently in sown pasture systems.Retain trees on bed and banks of streams and larger (shade and shelter) areas of tree vegetation as clumps or strips
Land use limitations Woody regrowth problemsErosiveAccess problems due to summer waterloggingLow nutritional value of native pastures; high input costs for sown pastures
Teatree plains
The economics of beef in Central Queensland 23
��
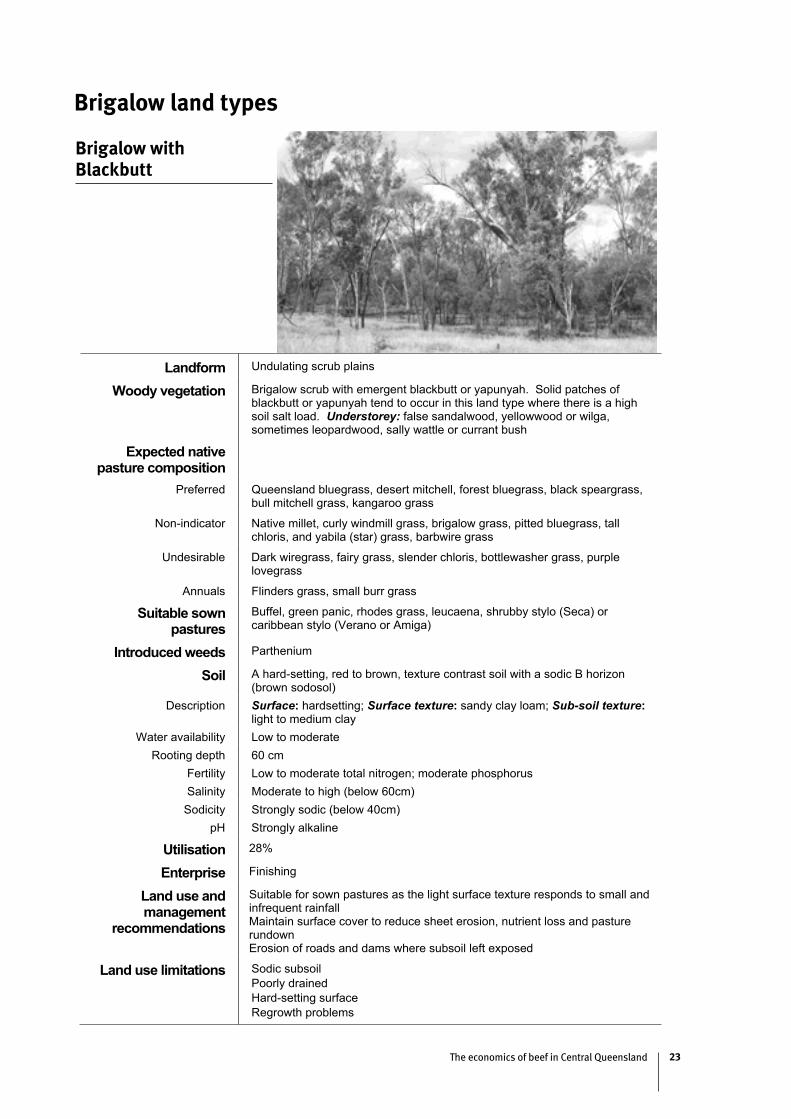
Landform Undulating scrub plains
Woody vegetation Brigalow scrub with emergent blackbutt or yapunyah. Solid patches of blackbutt or yapunyah tend to occur in this land type where there is a high soil salt load. Understorey: false sandalwood, yellowwood or wilga,sometimes leopardwood, sally wattle or currant bush
Expected native pasture composition
Preferred Queensland bluegrass, desert mitchell, forest bluegrass, black speargrass,bull mitchell grass, kangaroo grass
Non-indicator Native millet, curly windmill grass, brigalow grass, pitted bluegrass, tall chloris, and yabila (star) grass, barbwire grass
Undesirable Dark wiregrass, fairy grass, slender chloris, bottlewasher grass, purplelovegrass
Annuals Flinders grass, small burr grass
Suitable sownpastures
Buffel, green panic, rhodes grass, leucaena, shrubby stylo (Seca) orcaribbean stylo (Verano or Amiga)
Introduced weeds Parthenium
Soil A hard-setting, red to brown, texture contrast soil with a sodic B horizon(brown sodosol)
Description Surface: hardsetting; Surface texture: sandy clay loam; Sub-soil texture:light to medium clay
Water availability Low to moderate Rooting depth 60 cm
Fertility Low to moderate total nitrogen; moderate phosphorusSalinity Moderate to high (below 60cm)
Sodicity Strongly sodic (below 40cm)pH Strongly alkaline
Utilisation 28%
Enterprise Finishing
Land use andmanagement
recommendations
Suitable for sown pastures as the light surface texture responds to small andinfrequent rainfallMaintain surface cover to reduce sheet erosion, nutrient loss and pasturerundownErosion of roads and dams where subsoil left exposed
Land use limitations Sodic subsoilPoorly drainedHard-setting surfaceRegrowth problems
Brigalow with Blackbutt
Brigalow land types
The economics of beef in Central Queensland24
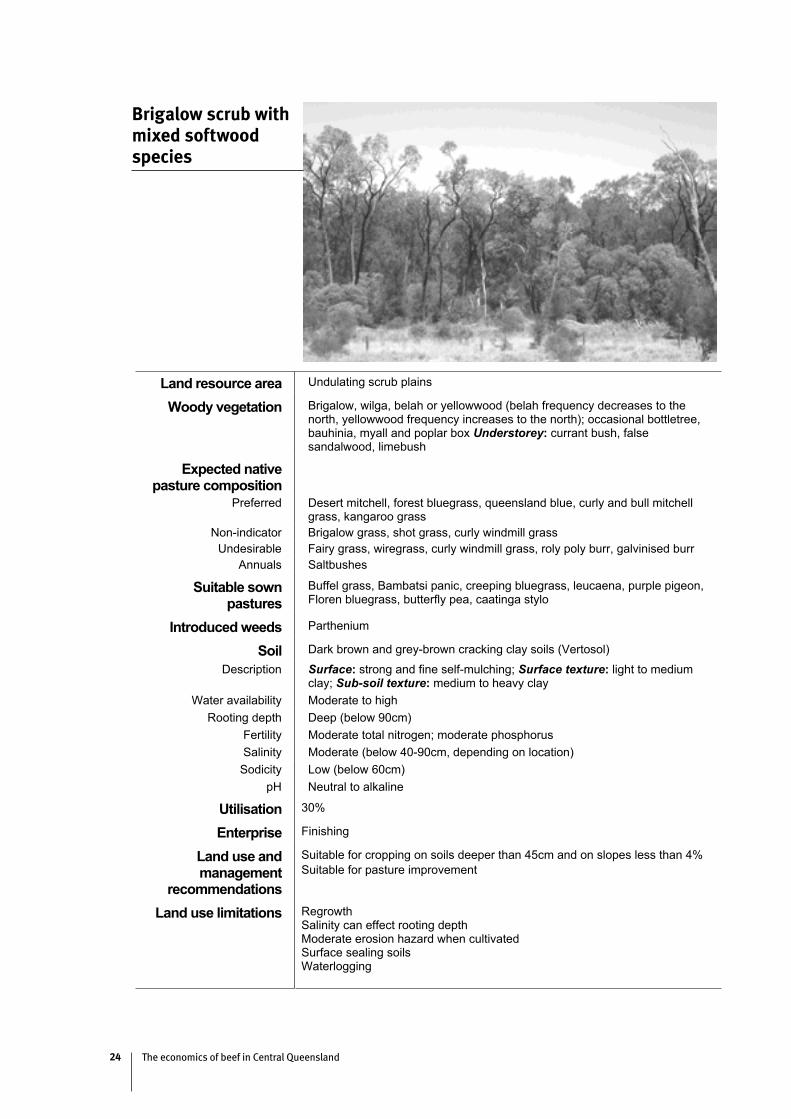
Land resource area Undulating scrub plains
Woody vegetation Brigalow, wilga, belah or yellowwood (belah frequency decreases to the north, yellowwood frequency increases to the north); occasional bottletree,bauhinia, myall and poplar box Understorey: currant bush, false sandalwood, limebush
Expected native pasture composition
Preferred Desert mitchell, forest bluegrass, queensland blue, curly and bull mitchell grass, kangaroo grass
Non-indicator Brigalow grass, shot grass, curly windmill grass Undesirable Fairy grass, wiregrass, curly windmill grass, roly poly burr, galvinised burr
Annuals Saltbushes
Suitable sownpastures
Buffel grass, Bambatsi panic, creeping bluegrass, leucaena, purple pigeon, Floren bluegrass, butterfly pea, caatinga stylo
Introduced weeds Parthenium
Soil Dark brown and grey-brown cracking clay soils (Vertosol)
Description Surface: strong and fine self-mulching; Surface texture: light to mediumclay; Sub-soil texture: medium to heavy clay
Water availability Moderate to high Rooting depth Deep (below 90cm)
Fertility Moderate total nitrogen; moderate phosphorusSalinity Moderate (below 40-90cm, depending on location)
Sodicity Low (below 60cm)pH Neutral to alkaline
Utilisation 30%
Enterprise Finishing
Land use andmanagement
recommendations
Suitable for cropping on soils deeper than 45cm and on slopes less than 4% Suitable for pasture improvement
Land use limitations RegrowthSalinity can effect rooting depthModerate erosion hazard when cultivatedSurface sealing soilsWaterlogging
Brigalow scrub with mixed softwood species
The economics of beef in Central Queensland 25
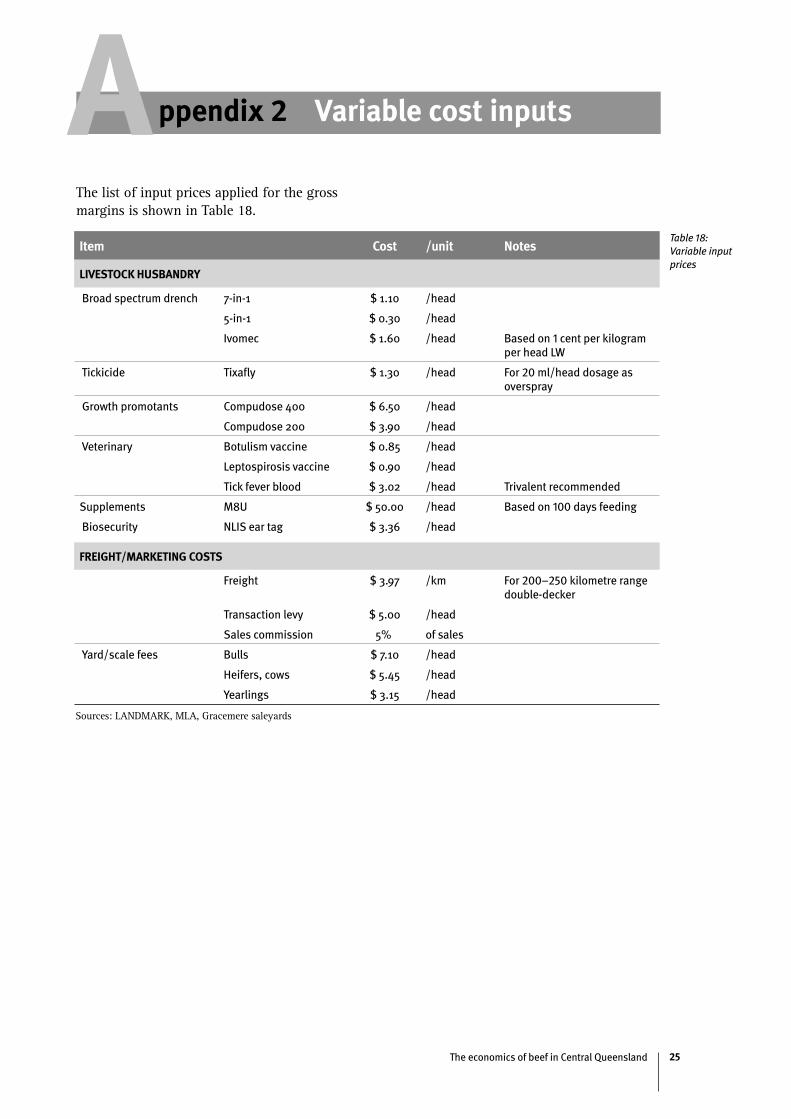
ppendix 2 Variable cost inputsAThe list of input prices applied for the gross margins is shown in Table 18.
Item Cost /unit Notes
LIVESTOCK HUSBANDRY
Broad spectrum drench 7-in-1 $ 1.10 /head
5-in-1 $ 0.30 /head
Ivomec $ 1.60 /head Based on 1 cent per kilogram per head LW
Tickicide Tixafly $ 1.30 /head For 20 ml/head dosage as overspray
Growth promotants Compudose 400 $ 6.50 /head
Compudose 200 $ 3.90 /head
Veterinary Botulism vaccine $ 0.85 /head
Leptospirosis vaccine $ 0.90 /head
Tick fever blood $ 3.02 /head Trivalent recommended
Supplements M8U $ 50.00 /head Based on 100 days feeding
Biosecurity NLIS ear tag $ 3.36 /head
FREIGHT/MARKETING COSTS
Freight $ 3.97 /km For 200–250 kilometre range double-decker
Transaction levy $ 5.00 /head
Sales commission 5% of sales
Yard/scale fees Bulls $ 7.10 /head
Heifers, cows $ 5.45 /head
Yearlings $ 3.15 /head
Sources: LANDMARK, MLA, Gracemere saleyards
Table 18: Variable input prices
The economics of beef in Central Queensland26
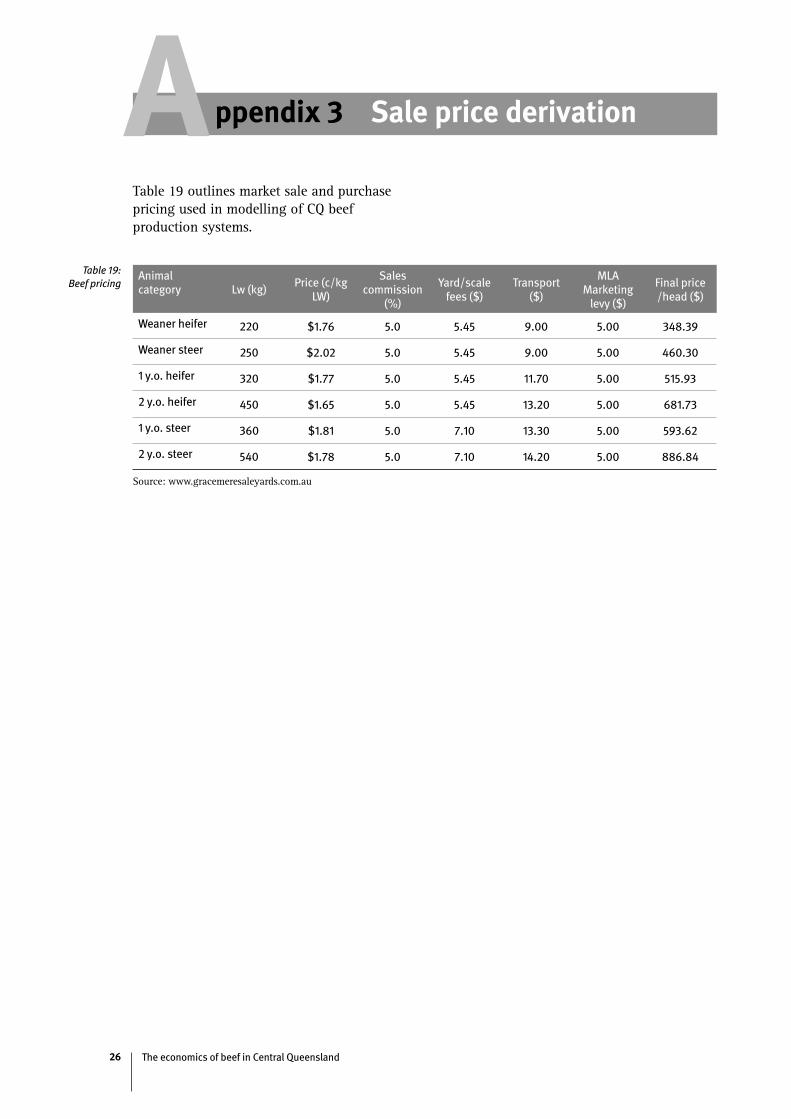
ppendix 3 Sale price derivationAAnimal category Lw (kg)
Price (c/kg LW)
Sales commission
(%)
Yard/scale fees ($)
Transport ($)
MLA Marketing
levy ($)
Final price /head ($)
Weaner heifer 220 $1.76 5.0 5.45 9.00 5.00 348.39
Weaner steer 250 $2.02 5.0 5.45 9.00 5.00 460.30
1 y.o. heifer 320 $1.77 5.0 5.45 11.70 5.00 515.93
2 y.o. heifer 450 $1.65 5.0 5.45 13.20 5.00 681.73
1 y.o. steer 360 $1.81 5.0 7.10 13.30 5.00 593.62
2 y.o. steer 540 $1.78 5.0 7.10 14.20 5.00 886.84
Source: www.gracemeresaleyards.com.au
Table 19: Beef pricing
Table 19 outlines market sale and purchase pricing used in modelling of CQ beef production systems.
The economics of beef in Central Queensland 27
Web linkagesThe following are useful for the purposes of building similar gross margin analyses.
http://www.agric.nsw.gov.au/tools/cattle/index.html provides market specification information for a range of products and different markets
http://www.gracemeresaleyards.com.au/saleyards/market-reports/ provides market reports and price information from Gracemere saleyards
http://www.mla.com.au provides a cost of production calculator
www.dpi.qld.gov.au/cps/rde/xchg/dpi/hs.xsl/27_119_ENA_HTML.htm is the beef industry page from the Queensland Department of Primary Industries and Fisheries website and covers numerous aspects of beef production
http://www2.dpi.qld.gov.au/breedcowdynama/2816.html contains information on Breedcow and Dynama computer programs as well as ordering information
www.epa.qld.gov.au contains a wealth of information on natural resource and vegetation management issues including land type descriptions and regional ecosystems mapping
The above is by no means an exhaustive listing, but serves as a point of reference for users seeking further information.
BibliographyAisthorpe, J. (2006). Land type identification
sheets: Stocktake workshop: balancing supply and demand, Queensland Department of Primary Industries and Fisheries, Emerald.
Chilcott, C.R., Sandral C.J., Aisthorpe, J.L., Paton, C.J., McCallum B.S. (2005). Grazing Land Management- Fitzroy Basin Version, Meat and Livestock Australia Limited, Australia.
Holmes, W.E. (2005). Breedcow and Dynama Herd Budgeting Software Package, Version 5.04 for Windows 95, 98, Me, NT, 2000 and XP. Training Series QE99002, Queensland Department of Primary Industries and Fisheries, Townsville.
Murphy, K. (1995). Beef production systems, Tropical Beef Centre, Rockhampton.
Ryan, T.F. (1991). Cattle costs and returns Central Queensland 1991, Queensland Department of Primary Industries, Rockhampton.

The economics of beef in Central Queensland28


![USTA TrafficAnalysisBriefing V7 0 20150530 FINAL[1] · PDF file1."Executive"Summary" ... In2014thethreemajorGulfcarriers" –"Emirates,"Qatar"Airways"and"Etihad" Airways"–"carried"some"4.3"million"passengers"intoandout"of"the](https://img.pdfslide.us/doc/110x75/5aa125967f8b9a46238b5bf2/usta-trafficanalysisbriefing-v7-0-20150530-final1-in2014thethreemajorgulfcarriers.jpg)