Embed Size (px)
Citation preview
Asia-Pacific Development Journal Vol. 19, No. 1, June 2012
1
THE ECONOMIC RELATIONS OF CHINA AND INDIAWITH PAKISTAN: A COMPARATIVE ANALYSIS
Pravakar Sahoo*
In recent years China has taken several steps to improve trade andinvestment relations with Pakistan, including, among others, the signingof a bilateral free trade agreement (FTA) in 2006. Trade between the twocountries has increased manifold, which, in turn, has resulted in a hugegap between the amount of trade China engages in with Pakistancompared with India. This slowing of India-Pakistan economic relationsvis-à-vis China-Pakistan coupled with strained and uncertain politicalrelations is a cause for concern. In this context, the present studyexamines trade and investment relations between China and Pakistan andanalyses factors that have led to the growing presence of China inPakistan vis-à-vis India. India has lost out to China in many importantindustries due to non-tariff barriers and non-economic factors. Inaddition, China scores over India in scale economies, pricecompetitiveness and trade complementarity.
JEL Classification: F14, F18.
Key words: Trade, investment, comparative advantage, trade complimentarity, tradebarriers.
I. INTRODUCTION
In recent years, China has taken several steps and initiatives to improve itstrade and investment relations with Pakistan. China and Pakistan have signed a FTA(2006), a memorandum of understanding (MoU), a bilateral investment treaty (BIT) andmany other agreements to increase trade and investment. China has been given
* Associate Professor, Institute of Economic Growth (IEG), Delhi University, Delhi, India. E-mail:[email protected]. I thank the anonymous referee for useful comments and suggestions. I also thankProfessor Nisha Taneja and Dr. Rajiv Kumar for their feedback and encouragement during the study. Theresearch assistance by Ms. Sneha Baksi is appreciated. However, the views are personal and the usualdisclaimer applies.
Asia-Pacific Development Journal Vol. 19, No. 1, June 2012
2
several incentives by Pakistan which include access to the Pakistan market, cheapraw materials and use of Pakistani ports for trade. Pakistan, in return, has gainedaccess to Chinese markets through preferential treatment under the FTA and movedcloser to becoming a hub in the region, which may lead to significant transit revenues.The closer relationship between the two countries has also helped China builda “trade and energy corridor” through Pakistan (Aneja, 2006; Kumar, 2006).
Another reason behind the growing Pakistan-China ties is the expandinginfluence of India (because of the presence of the United States of America) inAfghanistan, and the increasing presence of the United States in general in the region(Kumar, 2006). Historically, China has been a major partner to Pakistan in its nuclearand fuel missile technology, but recently, there has been a shift in the relationship.Apart from collaboration on the political and defense front, the basic objective of thecloser ties, is to nurture and strengthen economic relations between the twocountries, furthering the interests of both countries in the region. Though theeconomic relations are yet to reach their full potential, military cooperation betweenthe two countries is at a high level, with the strategic location of Pakistan being ofparticular interest to China as the former is the main route between China and theMiddle East and China and Central Asia (Kumar, 2006; Sahoo, 2010). According toRahman (2011), Pakistan-China relations are at their highest level given the layers ofinteractions between two countries. Over the years, Pakistan and China havedeveloped a clear vision of their economic relations based on frequent exchange ofideas and high-level consultations between two countries (Memon, 2009).
Normality in political and economic relations between India-Pakistan isessential for a peaceful and prosperous South Asia. However, this has not beenachieved because trade is restricted between the two countries mostly due to non-economic reasons. The trade restrictions have consequently resulted in, among otherthings, large-scale smuggling and third party trade and an increase in the prices ofcommodities for consumers (Ashraf, 2009; Khan, 2009). Other factors limiting tradebetween the two countries are lack of information on tradable items, India-Pakistantrade compliance regulations, facilities and high trade and transaction costs (Taneja,2006). Though it has been recognized by both sides that the potential benefit fromeconomic cooperation is immense, trade has suffered due to fluctuating politicalrelations between the two countries (CUTS, 2011). However, it is believed thatimproved trade relations can significantly enhance political ties between the twocountries (Malhotra, 2009; Khan, 2009).

Asia-Pacific Development Journal Vol. 19, No. 1, June 2012
3
Trade between India and Pakistan is limited even though they are bothmembers of the South Asian Free Trade Agreement (SAFTA). Pakistan currently doesnot provide most favoured nation (MFN) status1 to Indian exports despite the fact thatboth countries are members of World Trade Organization (WTO). However, India hasextended this privilege to Pakistan. In addition, Pakistan allows only some traderoutes for transportation of goods listed in its positive list to and from India. On thecontrary, China has become an important trading partner of Pakistan in the region.The country has been investing and giving bilateral development assistance toPakistan. In this context, the present study analyses economic relations betweenIndia-Pakistan vis-à-vis China-Pakistan within the framework of bilateral trade andinvestment arrangements. As economic cooperation is one way of breaking thedeadlock between India and Pakistan, a comparative study of China-Pakistaneconomic relations vis-à-vis India-Pakistan will be useful to policymakers andacademia. The focus of the paper is to analyse the economic relations of China, interms of both trade and investment, with Pakistan vis-à-vis the economic relations ofIndia for the period 1992-2007. The emphasis is on the period 2000-2007 when Chinaimproved its position substantially and gained a large foothold in many industries inPakistan. The study tries to answer some pertinent questions, such as (a) why Indiahas lost market share to China in Pakistan and (b) whether non-tariff barriers and thefocus only on the positive list of Pakistan is responsible for the loss. The study isbased on data from secondary sources including United Nations Comtrade2 andinsights received from experts and policymakers.
India-Pakistan and China-Pakistan trade relations
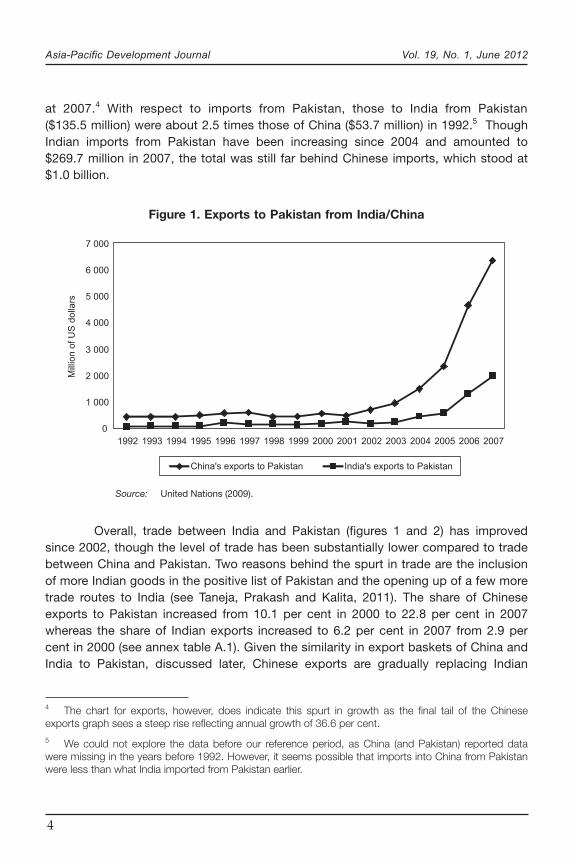
Pakistan is the only country in South Asia in which trade with China, in termsof both exports and imports, has been more than trade with India during the studyperiod. Since 2000, exports from China to Pakistan have accelerated (figure 1). Thefigure shows that exports from India were 1 per cent ($52.2 million)3 of the totalexports to Pakistan in 1992 and increased to 6.2 per cent in 2007, amounting to $1.9billion while exports from China increased from 9 per cent in 1992 ($421.1 million) to23 per cent of total exports in 2007, amounting to $6.4 billion. The sharp rise inexports from China was partially due to the acceleration of economic cooperationbetween the two countries since 2000. Another spurt in trade and economic relationsbetween China and Pakistan has occurred since 2006 following the successfulcompletion of the FTA, though it is difficult to capture this impact as the analysis ends
1 However, Pakistan agreed to give MFN status to India in March 2012 in bilateral trade negotiations.2 United Nations Commodity Trade Statistics Database.3 The source of all trade data is WITS COMTRADE HS 1988/92.
Asia-Pacific Development Journal Vol. 19, No. 1, June 2012
4
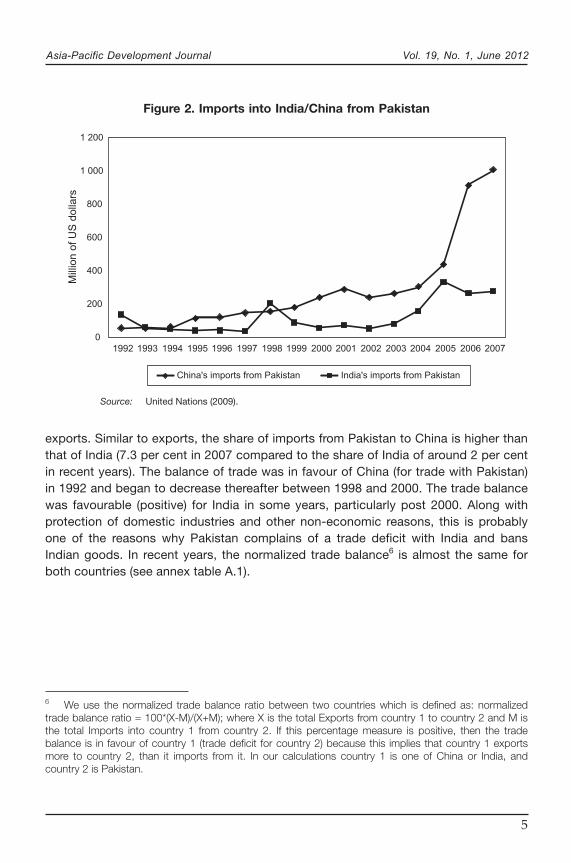
at 2007.4 With respect to imports from Pakistan, those to India from Pakistan($135.5 million) were about 2.5 times those of China ($53.7 million) in 1992.5 ThoughIndian imports from Pakistan have been increasing since 2004 and amounted to$269.7 million in 2007, the total was still far behind Chinese imports, which stood at$1.0 billion.
Figure 1. Exports to Pakistan from India/China
Source: United Nations (2009).
4 The chart for exports, however, does indicate this spurt in growth as the final tail of the Chineseexports graph sees a steep rise reflecting annual growth of 36.6 per cent.5 We could not explore the data before our reference period, as China (and Pakistan) reported datawere missing in the years before 1992. However, it seems possible that imports into China from Pakistanwere less than what India imported from Pakistan earlier.
0
1 000
2 000
3 000
4 000
5 000
6 000
7 000
1992 1993 1994 1995 1996 1997 1998 1999 2000 2001 2002 2003 2004 2005 2006 2007
China's exports to Pakistan India's exports to Pakistan
Mill
ion
of
US
do
llars
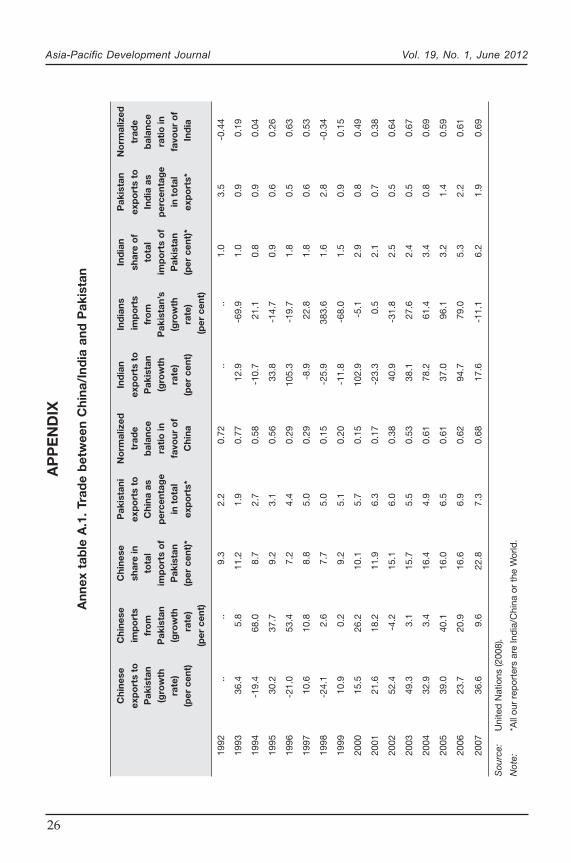
Overall, trade between India and Pakistan (figures 1 and 2) has improvedsince 2002, though the level of trade has been substantially lower compared to tradebetween China and Pakistan. Two reasons behind the spurt in trade are the inclusionof more Indian goods in the positive list of Pakistan and the opening up of a few moretrade routes to India (see Taneja, Prakash and Kalita, 2011). The share of Chineseexports to Pakistan increased from 10.1 per cent in 2000 to 22.8 per cent in 2007whereas the share of Indian exports increased to 6.2 per cent in 2007 from 2.9 percent in 2000 (see annex table A.1). Given the similarity in export baskets of China andIndia to Pakistan, discussed later, Chinese exports are gradually replacing Indian
Asia-Pacific Development Journal Vol. 19, No. 1, June 2012
5
exports. Similar to exports, the share of imports from Pakistan to China is higher thanthat of India (7.3 per cent in 2007 compared to the share of India of around 2 per centin recent years). The balance of trade was in favour of China (for trade with Pakistan)in 1992 and began to decrease thereafter between 1998 and 2000. The trade balancewas favourable (positive) for India in some years, particularly post 2000. Along withprotection of domestic industries and other non-economic reasons, this is probablyone of the reasons why Pakistan complains of a trade deficit with India and bansIndian goods. In recent years, the normalized trade balance6 is almost the same forboth countries (see annex table A.1).
Figure 2. Imports into India/China from Pakistan
Source: United Nations (2009).
0
200
400
600
800
1 000
1 200
1992 1993 1994 1995 1996 1997 1998 1999 2000 2001 2002 2003 2004 2005 2006 2007
China's imports from Pakistan India's imports from Pakistan
Mill
ion o
f U
S d
olla
rs
6 We use the normalized trade balance ratio between two countries which is defined as: normalizedtrade balance ratio = 100*(X-M)/(X+M); where X is the total Exports from country 1 to country 2 and M isthe total Imports into country 1 from country 2. If this percentage measure is positive, then the tradebalance is in favour of country 1 (trade deficit for country 2) because this implies that country 1 exportsmore to country 2, than it imports from it. In our calculations country 1 is one of China or India, andcountry 2 is Pakistan.

Asia-Pacific Development Journal Vol. 19, No. 1, June 2012
6
II. REVEALED COMPARATIVE ADVANTAGE
Comparative advantage in exports to the world and share in Pakistan market
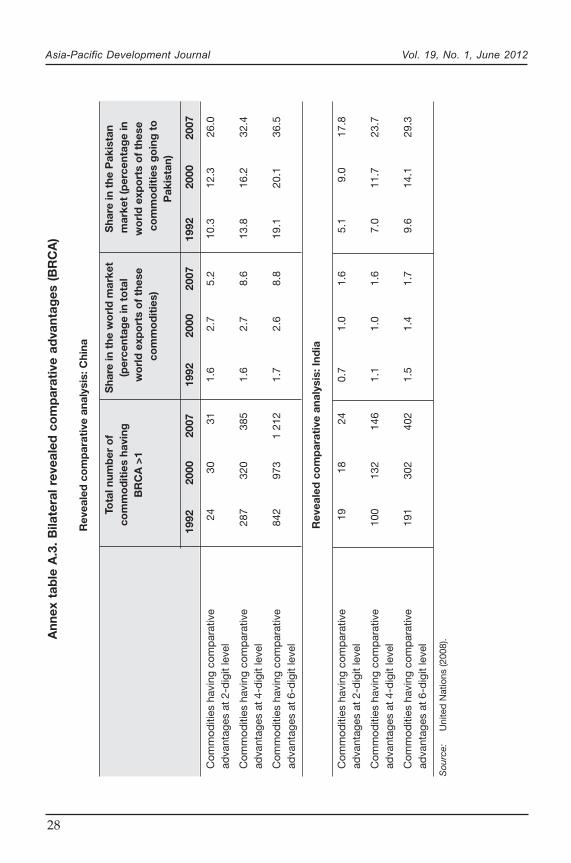
Export competitiveness is an important determinant of successful integrationof a country with the world economy. A high degree of comparative advantagereflects relative cost advantages, superior product attributes and lesser traderestrictions.7 In this study, the revealed comparative advantage (RCA) of exports fromChina and India to the world economy was analysed using the Balassa index(Balassa, 1965)8 for the period 1992-2007. We also calculated an index derived fromthe Balassa index to suit the bilateral context9 for the reference years. The sectoralcomparative advantage is an important indicator of a country’s export prowess.10 Theinternational revealed comparative advantage (IRCA) and bilateral revealedcomparative advantage (BRCA) of Chinese and Indian exports and their respectiveshare11 in world trade and share in the Pakistan market as well is reported in annextables A.2 and A.3. The goods that show a revealed comparative advantage asmeasured by their IRCA for China have a greater share of the market in Pakistan thanthat of India. This can be understood by the shares of both Chinese and Indian RCAproducts, at the 2-, 4- and 6-digit levels in 1992, 2000 and 2007, respectively, asreported in annex table A.2. Even in the case of BRCA, China has an edge over Indiain the Pakistan market (annex table A.3). Overall, China has a higher market sharein Pakistan in the commodities it has IRCA than India in the same categories.This indicates that non-tariff barriers exist between Pakistan and India. In addition,China has a comparative advantage (both in terms of IRCA and BRCA) ina greater number of commodities than India, and the numbers have been increasing.
7 The determinants of export competitiveness include price-related factors, such as domestic wages ormaterial costs; availability of labour; exchange rate; foreign direct investment (FDI) and management; andreduced cost of communication and transportation (Adams, Gangnes and Shachmurove, 2006) as wellas qualitative attributes.8 In order to analyse IRCA of Indian and Chinese exports, we use the Balassa index as follows: IRCA
ij =
(Xij/X
j)/(X
iw/X
w); where i is the product/industry of interest for calculation of comparative advantage, j is the
country of interest whose comparative advantage is being calculated, and w is the set of all countries inthe world. Therefore, the index is the ratio of the share of ith product/industry in the exports of country j asa proportion of ith product/industry in world exports.9 See Pascha (2002).10 This expectation, however, assumed that nothing other than comparative advantage affects bilateraltrade, which in practical international trade does not hold. We, therefore, encountered various products/industries in the trade of which other factors supersede the comparative advantage effect. We tried toexplain the deviations from these expected patterns in the context of trade arrangements and tradepolicies.11 Though we calculated RCA for all the years from 1992-2007, we only reported three time points,1992, 2000 and 2007 due to space constraint.
Asia-Pacific Development Journal Vol. 19, No. 1, June 2012
7
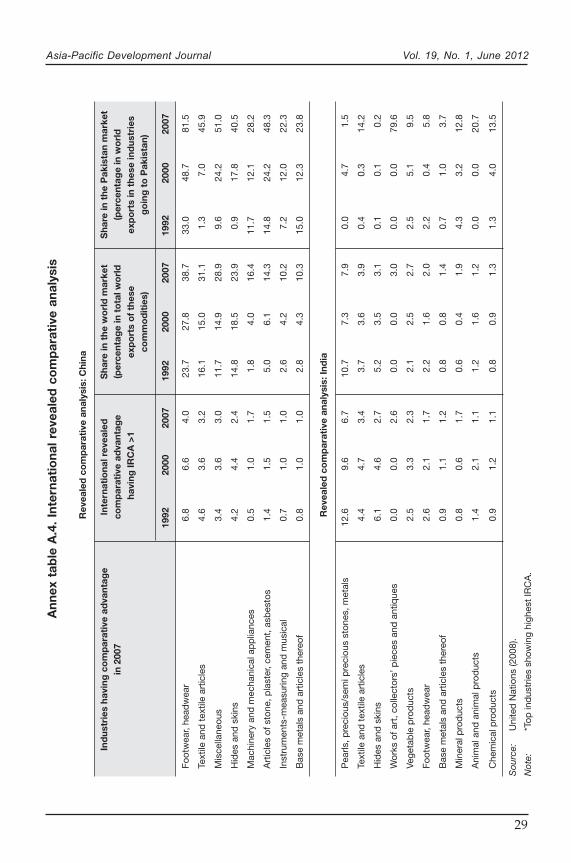
Major industries having comparative advantages for both countries and therespective share of these industries in the world market and as well as in the Pakistanmarket are reported in annex table A.4. Both China and India have several commonexport items to Pakistan in which both countries enjoy IRCA, such as footwear andheadwear, textile and textiles articles, hide and skins, and base metals, and articles,though China has a higher market share than India for those items. China exportsmuch more than India in these industries to Pakistan and Chinese exports constitutea major portion of world exports in these industries. Even industries in which India hasa high IRCA, their presence in Pakistan is negligible. For example, industries, such aspearls, precious stones and metals, and footwear and headwear, have witnessednegligible and fluctuating growth during the study period as a majority of the items inthese industries are banned in Pakistan (not part of the positive lists). Anotherexample is the industry of hide and skins, in which India enjoys a high comparativeadvantage in the world market but has zero presence in Pakistan. On the contrary,China exports 40 per cent of the total world exports in this industry to Pakistan. Thisreflects the non-tariff barriers mainly through the positive list approach, whichincluded nine items in 2000 but increased to 45 items in 2009. This ad hoc approachof positive lists, which fluctuates every year and sometimes in a few months, createsuncertainty about the market for Indian exports and also dependency of Pakistanimporters on India.
Comparative focus in exports to Pakistan
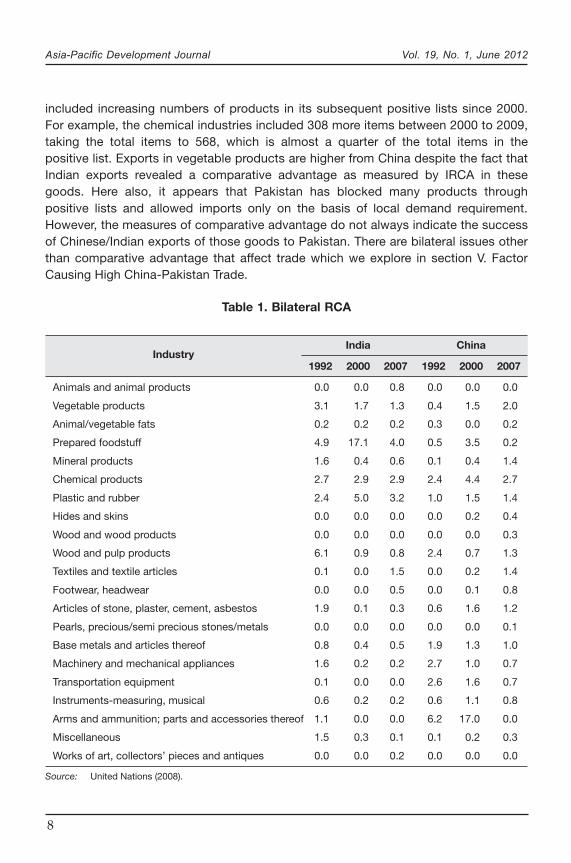
The BRCA measures for Chinese and Indian exports to Pakistan aresummarized in table 1. The highest BRCA measures are seen in arms andammunition, parts and accessories; chemical products; plastic and rubber; and basemetals and articles in which BRCA>1 in all three years, 1992, 2000 and in 2007. At the4-digit level, nuclear reactors, fuel elements, machinery and apparatus (HS 8401)show a comparative advantage before 2007 while lead waste and scrap (HS 7802)show the maximum bilateral comparative advantage in 2007. Indian exports showa bilateral comparative advantage consistently in all three years in chemical products;plastic and rubber; vegetable products and prepared foodstuff. The share of topexports for both China and India and their respective BRCA is reported in annextable A.5. Notably, vegetable products (HS 14) and sugars and sugar confectionary(HS 17) are the top focus for Indian exports to Pakistan in the last 10 years.
Chinese and Indian exports both show BRCA (in all three years) in chemicalproducts and in plastic and rubber. However, Chinese exports exceeded Indianexports in both these industries. In the plastic and rubber industry, neither Indian norChinese exports reveal IRCA whereas Indian exports only reveal an advantage inchemical products. India is doing well in both these industries as Pakistan has
Asia-Pacific Development Journal Vol. 19, No. 1, June 2012
8
included increasing numbers of products in its subsequent positive lists since 2000.For example, the chemical industries included 308 more items between 2000 to 2009,taking the total items to 568, which is almost a quarter of the total items in thepositive list. Exports in vegetable products are higher from China despite the fact thatIndian exports revealed a comparative advantage as measured by IRCA in thesegoods. Here also, it appears that Pakistan has blocked many products throughpositive lists and allowed imports only on the basis of local demand requirement.However, the measures of comparative advantage do not always indicate the successof Chinese/Indian exports of those goods to Pakistan. There are bilateral issues otherthan comparative advantage that affect trade which we explore in section V. FactorCausing High China-Pakistan Trade.
Table 1. Bilateral RCA
IndustryIndia China
1992 2000 2007 1992 2000 2007
Animals and animal products 0.0 0.0 0.8 0.0 0.0 0.0
Vegetable products 3.1 1.7 1.3 0.4 1.5 2.0
Animal/vegetable fats 0.2 0.2 0.2 0.3 0.0 0.2
Prepared foodstuff 4.9 17.1 4.0 0.5 3.5 0.2
Mineral products 1.6 0.4 0.6 0.1 0.4 1.4
Chemical products 2.7 2.9 2.9 2.4 4.4 2.7
Plastic and rubber 2.4 5.0 3.2 1.0 1.5 1.4
Hides and skins 0.0 0.0 0.0 0.0 0.2 0.4
Wood and wood products 0.0 0.0 0.0 0.0 0.0 0.3
Wood and pulp products 6.1 0.9 0.8 2.4 0.7 1.3
Textiles and textile articles 0.1 0.0 1.5 0.0 0.2 1.4
Footwear, headwear 0.0 0.0 0.5 0.0 0.1 0.8
Articles of stone, plaster, cement, asbestos 1.9 0.1 0.3 0.6 1.6 1.2
Pearls, precious/semi precious stones/metals 0.0 0.0 0.0 0.0 0.0 0.1
Base metals and articles thereof 0.8 0.4 0.5 1.9 1.3 1.0
Machinery and mechanical appliances 1.6 0.2 0.2 2.7 1.0 0.7
Transportation equipment 0.1 0.0 0.0 2.6 1.6 0.7
Instruments-measuring, musical 0.6 0.2 0.2 0.6 1.1 0.8
Arms and ammunition; parts and accessories thereof 1.1 0.0 0.0 6.2 17.0 0.0
Miscellaneous 1.5 0.3 0.1 0.1 0.2 0.3
Works of art, collectors’ pieces and antiques 0.0 0.0 0.2 0.0 0.0 0.0
Source: United Nations (2008).
Asia-Pacific Development Journal Vol. 19, No. 1, June 2012
9
III. TRADE COMPOSITION AND INDUSTRY WISE ANALYSIS
Concentration
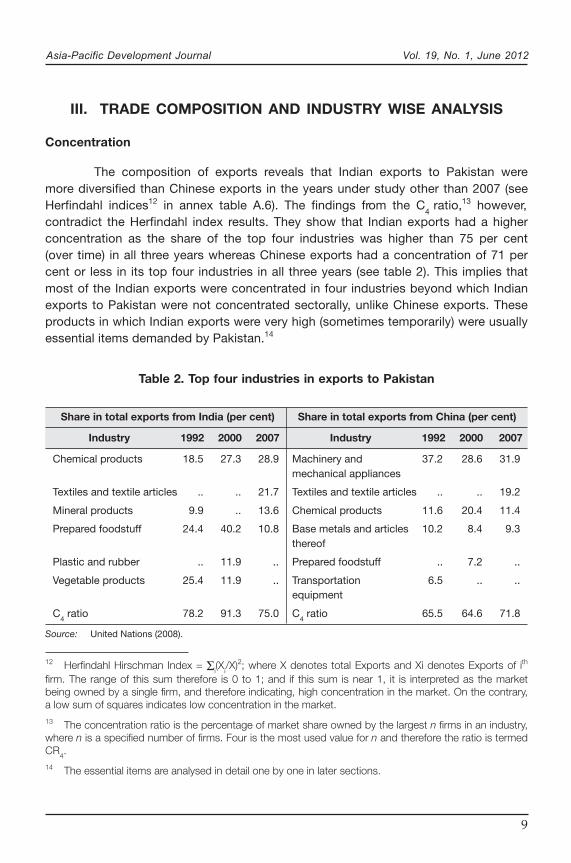
The composition of exports reveals that Indian exports to Pakistan weremore diversified than Chinese exports in the years under study other than 2007 (seeHerfindahl indices12 in annex table A.6). The findings from the C
4 ratio,13 however,
contradict the Herfindahl index results. They show that Indian exports had a higherconcentration as the share of the top four industries was higher than 75 per cent(over time) in all three years whereas Chinese exports had a concentration of 71 percent or less in its top four industries in all three years (see table 2). This implies thatmost of the Indian exports were concentrated in four industries beyond which Indianexports to Pakistan were not concentrated sectorally, unlike Chinese exports. Theseproducts in which Indian exports were very high (sometimes temporarily) were usuallyessential items demanded by Pakistan.14
Table 2. Top four industries in exports to Pakistan
Share in total exports from India (per cent) Share in total exports from China (per cent)
Industry 1992 2000 2007 Industry 1992 2000 2007
Chemical products 18.5 27.3 28.9 Machinery and 37.2 28.6 31.9mechanical appliances
Textiles and textile articles .. .. 21.7 Textiles and textile articles .. .. 19.2
Mineral products 9.9 .. 13.6 Chemical products 11.6 20.4 11.4
Prepared foodstuff 24.4 40.2 10.8 Base metals and articles 10.2 8.4 9.3thereof
Plastic and rubber .. 11.9 .. Prepared foodstuff .. 7.2 ..
Vegetable products 25.4 11.9 .. Transportation 6.5 .. ..equipment
C4 ratio 78.2 91.3 75.0 C
4 ratio 65.5 64.6 71.8
Source: United Nations (2008).
12 Herfindahl Hirschman Index = Σi(X
i/X)2; where X denotes total Exports and Xi denotes Exports of ith
firm. The range of this sum therefore is 0 to 1; and if this sum is near 1, it is interpreted as the marketbeing owned by a single firm, and therefore indicating, high concentration in the market. On the contrary,a low sum of squares indicates low concentration in the market.13 The concentration ratio is the percentage of market share owned by the largest n firms in an industry,where n is a specified number of firms. Four is the most used value for n and therefore the ratio is termedCR
4.
14 The essential items are analysed in detail one by one in later sections.

Asia-Pacific Development Journal Vol. 19, No. 1, June 2012
10
Industry components
The most important items of export to Pakistan from China are machineryand mechanical appliances and those from the textiles and textile articles industry(table 2). These two categories comprise about 51 per cent of all exports from Chinagoing to Pakistan. Machinery and mechanical appliances maintained the top positionwhile textiles and textile articles replaced chemical product in the number twoposition in 2007, accounting for about one fifth of the total exports from China.15
Regarding Indian exports to Pakistan, vegetable products, which used to be the mostimportant industry in the early 1990s, lost a large portion of its share of total exportsfrom India by 2001, with prepared foodstuff emerging as the most important industry.However, chemical products replaced prepared foodstuff in 2007 as the largestcomponent. The textiles and textile products industry has grown in terms of exportvolume to occupy the second largest component position. In fact, the textile industryhas grown in relative share for both Chinese and Indian exports to Pakistan. In thiscontext, some important export industries of India and China are explained below.
Prepared foodstuff
Indian exports to Pakistan in the prepared foodstuff industry are generallyunprocessed, such as cane or beet sugar and chemically pure sugar (HS 1701) and oilcake and other solid residue (HS 2304).16 In 2007, this industry accounted for10.5 per cent of total Indian exports to Pakistan. However, there have been hugefluctuations in exports of cane or beet sugar from India to Pakistan in the last fewyears.17 We explored the positive list that allows items from India into Pakistan forjustifications of these fluctuations. In fact, according to a notification by Pakistan on6 August 2005, imports from India of raw cane and beet sugar (without addedflavouring/colouring) and white crystalline cane or beet sugar (four tariff lines at the8-digit) were allowed into Pakistan effective from that date.18 This is the reason whyimports from India have risen starting in 2005 after being close to zero in 2004. In
15 In the following sections, the concessions that China receives according to the FTA is examined whilekeeping in mind these important industries.16 India uses International Trade Centre (ITC) codes and Pakistan uses Pakistan Custom Tariff codes. Alltrade data are in international HS 1988/92 codes because our period of data begins in 1992, but theconcession lists are in the codes of the declaring country. Differences with respect to HS codes are verysmall.17 For example, sugars and sugar confectionery (HS 17) became the most important product categoryfor Indian exports in 2006 (with cane or beet sugar (HS 1701) which alone was about 26 per cent ofIndian exports to Pakistan in 2006) but this was a random spurt. Exports of the same item were close to0 per cent of Indian exports to Pakistan in 2004 and around 30 per cent in 2000 and 2001.18 Pakistan, Ministry of Commerce, Order S.R.O. 788 (I)/2005, 6 August 2005.
Asia-Pacific Development Journal Vol. 19, No. 1, June 2012
11
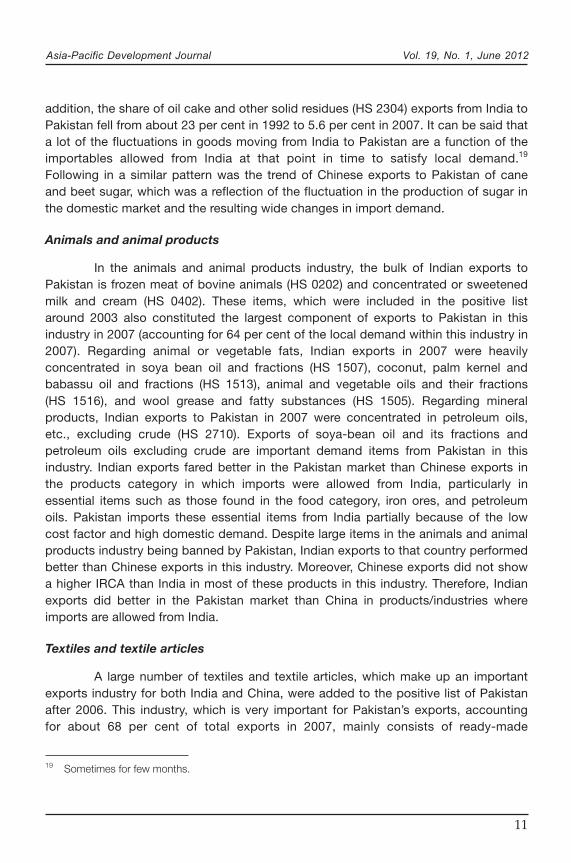
addition, the share of oil cake and other solid residues (HS 2304) exports from India toPakistan fell from about 23 per cent in 1992 to 5.6 per cent in 2007. It can be said thata lot of the fluctuations in goods moving from India to Pakistan are a function of theimportables allowed from India at that point in time to satisfy local demand.19
Following in a similar pattern was the trend of Chinese exports to Pakistan of caneand beet sugar, which was a reflection of the fluctuation in the production of sugar inthe domestic market and the resulting wide changes in import demand.
Animals and animal products
In the animals and animal products industry, the bulk of Indian exports toPakistan is frozen meat of bovine animals (HS 0202) and concentrated or sweetenedmilk and cream (HS 0402). These items, which were included in the positive listaround 2003 also constituted the largest component of exports to Pakistan in thisindustry in 2007 (accounting for 64 per cent of the local demand within this industry in2007). Regarding animal or vegetable fats, Indian exports in 2007 were heavilyconcentrated in soya bean oil and fractions (HS 1507), coconut, palm kernel andbabassu oil and fractions (HS 1513), animal and vegetable oils and their fractions(HS 1516), and wool grease and fatty substances (HS 1505). Regarding mineralproducts, Indian exports to Pakistan in 2007 were concentrated in petroleum oils,etc., excluding crude (HS 2710). Exports of soya-bean oil and its fractions andpetroleum oils excluding crude are important demand items from Pakistan in thisindustry. Indian exports fared better in the Pakistan market than Chinese exports inthe products category in which imports were allowed from India, particularly inessential items such as those found in the food category, iron ores, and petroleumoils. Pakistan imports these essential items from India partially because of the lowcost factor and high domestic demand. Despite large items in the animals and animalproducts industry being banned by Pakistan, Indian exports to that country performedbetter than Chinese exports in this industry. Moreover, Chinese exports did not showa higher IRCA than India in most of these products in this industry. Therefore, Indianexports did better in the Pakistan market than China in products/industries whereimports are allowed from India.
Textiles and textile articles
A large number of textiles and textile articles, which make up an importantexports industry for both India and China, were added to the positive list of Pakistanafter 2006. This industry, which is very important for Pakistan’s exports, accountingfor about 68 per cent of total exports in 2007, mainly consists of ready-made
19 Sometimes for few months.
Asia-Pacific Development Journal Vol. 19, No. 1, June 2012
12
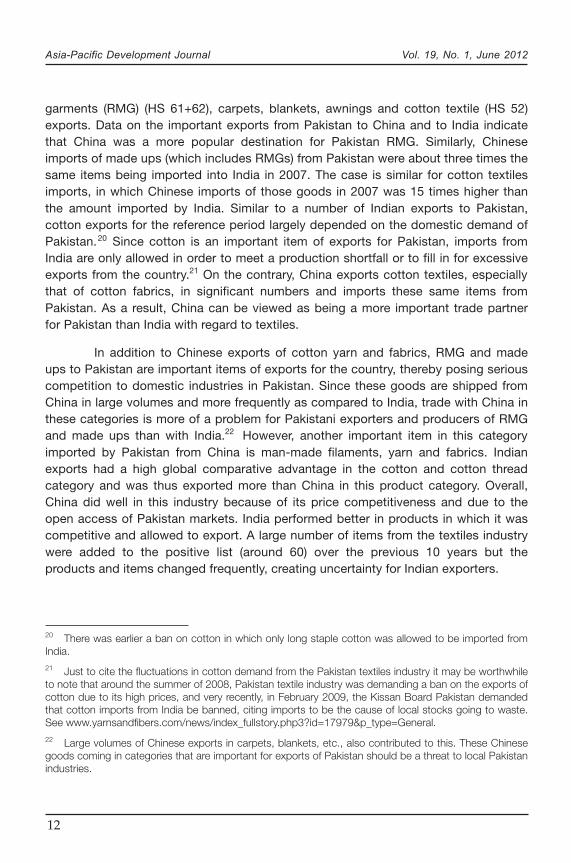
garments (RMG) (HS 61+62), carpets, blankets, awnings and cotton textile (HS 52)exports. Data on the important exports from Pakistan to China and to India indicatethat China was a more popular destination for Pakistan RMG. Similarly, Chineseimports of made ups (which includes RMGs) from Pakistan were about three times thesame items being imported into India in 2007. The case is similar for cotton textilesimports, in which Chinese imports of those goods in 2007 was 15 times higher thanthe amount imported by India. Similar to a number of Indian exports to Pakistan,cotton exports for the reference period largely depended on the domestic demand ofPakistan. Since cotton is an important item of exports for Pakistan, imports fromIndia are only allowed in order to meet a production shortfall or to fill in for excessiveexports from the country.21 On the contrary, China exports cotton textiles, especiallythat of cotton fabrics, in significant numbers and imports these same items fromPakistan. As a result, China can be viewed as being a more important trade partnerfor Pakistan than India with regard to textiles.
In addition to Chinese exports of cotton yarn and fabrics, RMG and madeups to Pakistan are important items of exports for the country, thereby posing seriouscompetition to domestic industries in Pakistan. Since these goods are shipped fromChina in large volumes and more frequently as compared to India, trade with China inthese categories is more of a problem for Pakistani exporters and producers of RMGand made ups than with India.22 However, another important item in this categoryimported by Pakistan from China is man-made filaments, yarn and fabrics. Indianexports had a high global comparative advantage in the cotton and cotton threadcategory and was thus exported more than China in this product category. Overall,China did well in this industry because of its price competitiveness and due to theopen access of Pakistan markets. India performed better in products in which it wascompetitive and allowed to export. A large number of items from the textiles industrywere added to the positive list (around 60) over the previous 10 years but theproducts and items changed frequently, creating uncertainty for Indian exporters.
20 There was earlier a ban on cotton in which only long staple cotton was allowed to be imported fromIndia.21 Just to cite the fluctuations in cotton demand from the Pakistan textiles industry it may be worthwhileto note that around the summer of 2008, Pakistan textile industry was demanding a ban on the exports ofcotton due to its high prices, and very recently, in February 2009, the Kissan Board Pakistan demandedthat cotton imports from India be banned, citing imports to be the cause of local stocks going to waste.See www.yarnsandfibers.com/news/index_fullstory.php3?id=17979&p_type=General.22 Large volumes of Chinese exports in carpets, blankets, etc., also contributed to this. These Chinesegoods coming in categories that are important for exports of Pakistan should be a threat to local Pakistanindustries.
20

Asia-Pacific Development Journal Vol. 19, No. 1, June 2012
13
Machinery and mechanical appliances
At the 2-digit product category level, the top exports from China to Pakistanare electrical machinery, equipment and parts (HS 85) and nuclear reactors, boilers,machinery appliances (HS 84), which make up for the entire machinery andmechanical appliances industry. The exports of machinery and mechanical appliancescomprised a 32 per cent share of total Chinese exports to Pakistan in 2007,amounting to $1.9 billion. This is an industry in which China enjoys a globalcomparative advantage (IRCA of 1.7 in 2007) whereas Indian exports do not reveala comparative advantage. From the point of view of Pakistan, the machinery andmechanical appliances industry is very important, with 25.7 per cent of exports toPakistan in 2007 being in this industry alone. The largest components of exports inthis industry to Pakistan in 2007 were electrical telephonic, telegraphic and faxapparatus (HS 8517); transmission apparatus for radios or televisions (HS 8525);electric generating sets and rotary (HS 8502); and air or vacuum pumps, compressors(HS 8414). China was a larger supplier of these important items of demand inPakistan than India in 2007, with shares of 46.2 per cent, 28.7 per cent, 13.8 per centand 15.3 per cent, respectively. In the case of textile machinery, another importantdemand item in Pakistan, China exported more than India and accounted for 22 percent of total exports. Regarding items of the machinery and mechanical appliancesindustry, Chinese exports constituted 31.9 per cent of total exports in 2007 whereasIndian exports were a mere 1.6 per cent.
China has, in fact, been dominating India as well as the world markets in theexport of items from the machinery and mechanical appliance industry due to its veryhigh IRCA. Even though a substantial number of products in this category from Indiawere added to the positive list (around 2,000 during the last 10 years), the country hadnot been able to compete with China in the price-sensitive Pakistan market. There arealso issues of post delivery services, logistical follow-up and the trust factor, whichmake Pakistan importers prefer Chinese over Indian products in this category.
Chemical products
The most important Indian export product at the HS 2-digit level is organicchemicals (HS 29). Though at the industry level, Chinese exports exceeded Indianexports, Indian exported more organic chemicals than China. India supplied about31 per cent of the total exports of organic chemicals to Pakistan, which comprised13.3 per cent of total exports to the county in this category. Another significant itemimported by Pakistan in this industry is mineral or chemical fertilizers (HS 3105).Notably, China supplied 36 per cent of the total exports to Pakistan of this product.The chemical industry is one of the few industries in which India fares better thanChina in the world market. However, in Pakistan, it outpaces China only in a few
Asia-Pacific Development Journal Vol. 19, No. 1, June 2012
14
products, such as organic chemicals. Therefore, China exports more than India asa whole in this industry. The better performance of China in this industry is mainly dueto non-tariff barriers imposed on Indian exports by Pakistan.
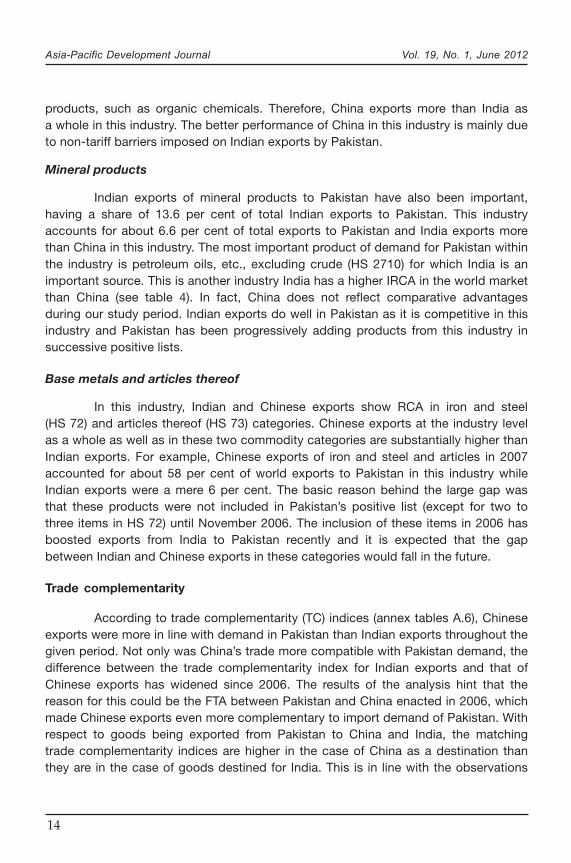
Mineral products
Indian exports of mineral products to Pakistan have also been important,having a share of 13.6 per cent of total Indian exports to Pakistan. This industryaccounts for about 6.6 per cent of total exports to Pakistan and India exports morethan China in this industry. The most important product of demand for Pakistan withinthe industry is petroleum oils, etc., excluding crude (HS 2710) for which India is animportant source. This is another industry India has a higher IRCA in the world marketthan China (see table 4). In fact, China does not reflect comparative advantagesduring our study period. Indian exports do well in Pakistan as it is competitive in thisindustry and Pakistan has been progressively adding products from this industry insuccessive positive lists.
Base metals and articles thereof
In this industry, Indian and Chinese exports show RCA in iron and steel(HS 72) and articles thereof (HS 73) categories. Chinese exports at the industry levelas a whole as well as in these two commodity categories are substantially higher thanIndian exports. For example, Chinese exports of iron and steel and articles in 2007accounted for about 58 per cent of world exports to Pakistan in this industry whileIndian exports were a mere 6 per cent. The basic reason behind the large gap wasthat these products were not included in Pakistan’s positive list (except for two tothree items in HS 72) until November 2006. The inclusion of these items in 2006 hasboosted exports from India to Pakistan recently and it is expected that the gapbetween Indian and Chinese exports in these categories would fall in the future.
Trade complementarity
According to trade complementarity (TC) indices (annex tables A.6), Chineseexports were more in line with demand in Pakistan than Indian exports throughout thegiven period. Not only was China’s trade more compatible with Pakistan demand, thedifference between the trade complementarity index for Indian exports and that ofChinese exports has widened since 2006. The results of the analysis hint that thereason for this could be the FTA between Pakistan and China enacted in 2006, whichmade Chinese exports even more complementary to import demand of Pakistan. Withrespect to goods being exported from Pakistan to China and India, the matchingtrade complementarity indices are higher in the case of China as a destination thanthey are in the case of goods destined for India. This is in line with the observations

Asia-Pacific Development Journal Vol. 19, No. 1, June 2012
15
that China is a more accessible destination for important exports of Pakistan thanIndia.
IV. TRADE ARRANGEMENTS OR PREFERENCES RECEIVEDFROM (OFFERED TO) PAKISTAN
China and Pakistan trade arrangements or preferences
China and Pakistan signed a FTA in 2006, which came into force in early2007. In the China-Pakistan FTA, Pakistan offered tariff concessions for Chinesegoods across all industry slabs and margin of preference (MOP) reduction rates atdifferent levels. The FTA has a provision for the elimination of tariffs or the reduction oftariffs to 0 to 5 per cent within the first five years. The industries that receivedconcessions on more than 100 tariff lines at the 8-digit level are listed in table 3.Therefore, tariff duties applicable on Chinese exports in the particular tariff lines inthese industries will be almost eliminated by 2012.
Table 3. Chinese exports receiving concessions >100 tariff linesin categories I and II from Pakistan
Industry Number of tariff lines in categories I and II
Animals and animal products 152
Vegetable products 204
Mineral products 186
Chemical products 919
Textiles and textile articles 133
Base metals and articles thereof 427
Machinery and mechanical appliances 776
Instruments – measuring and musical 252
Miscellaneous 110
Source: United Nations (2008).
China struck a good deal with Pakistan in tariff concessions in its majorexports to Pakistan, such as machinery and mechanical appliances, textiles andtextile articles, chemical products and base metals and articles thereof (see annextable A.7 for Pakistan’s tariff concessions to China according to the FTA). Though thefull effects of these concessions are yet to be seen, the annual growth rate of Chineseexports in these industries has improved as a result of the FTA. For example, from

Asia-Pacific Development Journal Vol. 19, No. 1, June 2012
16
2006 to 2007, the exports of animals and animal products increased by 114 per cent,mineral products by 103 per cent and measuring and musical instruments by 120 percent.
The top 10 Chinese exports to Pakistan at the HS 2-digit level (table 4 below)were granted concessions in category I (except man-made filaments, fertilizers, andart of apparel and clothing accessories) with the understanding that tariffs on themwere to be eliminated by 2010. In fact, 3 of the top 10 products have receivedcategory I concessions on very large numbers of tariff lines. For example, organicchemicals received these tariff concessions on 445 tariff lines, and all machinery(HS 84 and 85) on 622 tariff lines at the 8-digit level. Garments and clothingaccessories, another important item of Chinese exports, were ignored in the categoryI, but were awarded tariff concessions in category II in which tariffs were reduced to0 to 5 per cent within five years beginning 2007. Chinese exports in these items wereto get a further boost and possibly give tougher competition to Indian exports by theend of three years, by 2010, when duty on the tariff lines in category I were to be fullyphased out. Major Indian exports, such as organic chemicals and iron and steelarticles, may face stiff competition from China and the advantages of the new itemsbeing listed in the positive list of Pakistan may not be realized.
In turn, China gave tariff concessions (awarded to tariff lines at the 8-digitlevel) to imports from Pakistan (see annex table A.8 for details). Table 4 below showsthe industries in which Pakistan exports received concessions on greater than 100tariff lines in categories I and II from China under the Pakistan-China FTA. Textiles andtextile articles and other top exports industries of Pakistan, such as base metals andarticles thereof, and mineral products, have received substantial concessions onsignificant numbers of tariff lines in categories I and II. These generous tariffconcessions from China are a factor behind the good deal China obtained fromPakistan in the FTA. The most important singular item of import from Pakistan aftercotton yarn is unrefined copper and copper anodes (HS 7402), which receivedconcessions in category I on the entire 4-digit category (HS 74020000). The same isthe case with another important item of import into China from Pakistan, namelychromium ores and concentrates (HS 2610).

Asia-Pacific Development Journal Vol. 19, No. 1, June 2012
17
India and Pakistan trade arrangements or preferences
India and Pakistan are both members of SAFTA, according to whichmembers are supposed to bring down tariffs on all goods in a phased manner otherthan those on their respective negative lists. However, Pakistan does not honour thisobligation due to non-economic reasons. Pakistan allows only a list of items to beimported from India under its positive list. The 2008 positive list (according to theImport Policy Order 2008) allows 1,938 items for imports. The positive list is changedfrequently,23 either to satisfy local demand or to bring down prices or due to politicalconflicts.
A large number of items were added to the positive list of Pakistan in 2006 inthe following industries: chemical products; base metals and articles and machineryand mechanical appliances. Consequently, the export of many items from Indiaincreased as the list included 302 more items of importables from India.24 Many itemsplaced on the positive list are from the following property categories: nuclear reactors,boilers, machinery and mechanical appliances, textile industry, electrical machinery,equipment and parts, sound and television equipment and chemical products (see
Table 4. Pakistan exports receiving concessions >100 tariff linesin categories I and II from China
Industry Number of tariffs lines in categories I and II
Animals and animal products 169
Vegetable products 257
Mineral products 195
Chemical products 1 080
Plastic and rubber 208
Wood and wood products 128
Textiles and textile articles 743
Base metals and articles thereof 619
Machinery and mechanical appliances 1 105
Transportation equipment 161
Instruments – measuring, musical 188
Source: United Nations (2008).
23 Even sometimes for a few months temporarily.24 Pakistan, Ministry of Commerce, Order S.R.O. 1100 (I)/2006, 3 November 2006.
Asia-Pacific Development Journal Vol. 19, No. 1, June 2012
18
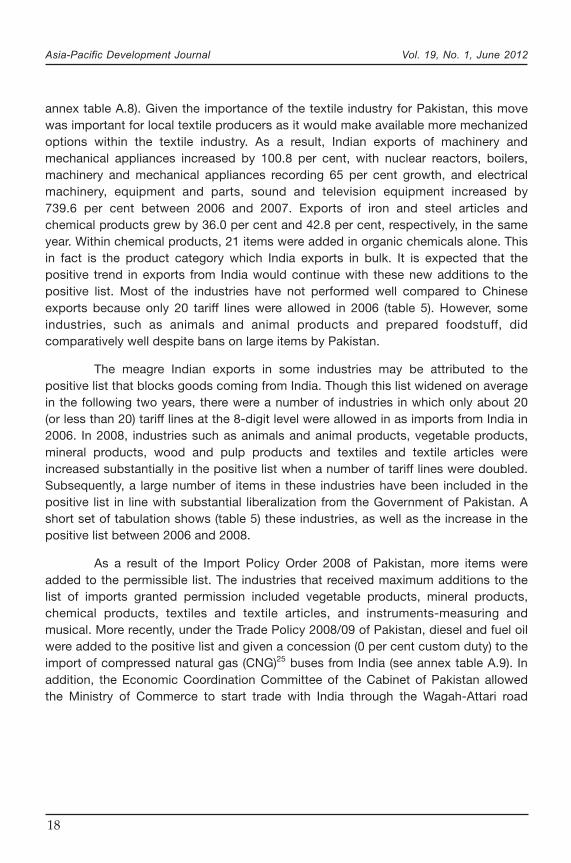
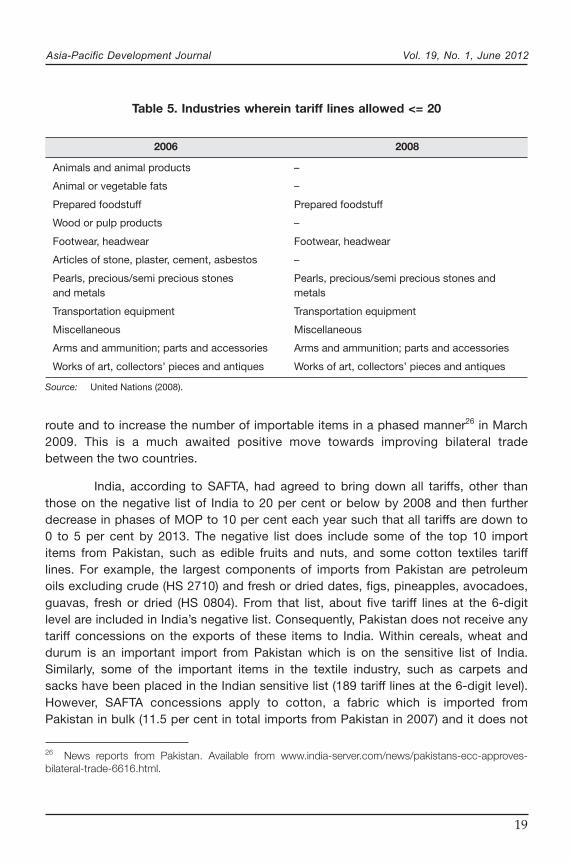
annex table A.8). Given the importance of the textile industry for Pakistan, this movewas important for local textile producers as it would make available more mechanizedoptions within the textile industry. As a result, Indian exports of machinery andmechanical appliances increased by 100.8 per cent, with nuclear reactors, boilers,machinery and mechanical appliances recording 65 per cent growth, and electricalmachinery, equipment and parts, sound and television equipment increased by739.6 per cent between 2006 and 2007. Exports of iron and steel articles andchemical products grew by 36.0 per cent and 42.8 per cent, respectively, in the sameyear. Within chemical products, 21 items were added in organic chemicals alone. Thisin fact is the product category which India exports in bulk. It is expected that thepositive trend in exports from India would continue with these new additions to thepositive list. Most of the industries have not performed well compared to Chineseexports because only 20 tariff lines were allowed in 2006 (table 5). However, someindustries, such as animals and animal products and prepared foodstuff, didcomparatively well despite bans on large items by Pakistan.
The meagre Indian exports in some industries may be attributed to thepositive list that blocks goods coming from India. Though this list widened on averagein the following two years, there were a number of industries in which only about 20(or less than 20) tariff lines at the 8-digit level were allowed in as imports from India in2006. In 2008, industries such as animals and animal products, vegetable products,mineral products, wood and pulp products and textiles and textile articles wereincreased substantially in the positive list when a number of tariff lines were doubled.Subsequently, a large number of items in these industries have been included in thepositive list in line with substantial liberalization from the Government of Pakistan. Ashort set of tabulation shows (table 5) these industries, as well as the increase in thepositive list between 2006 and 2008.
As a result of the Import Policy Order 2008 of Pakistan, more items wereadded to the permissible list. The industries that received maximum additions to thelist of imports granted permission included vegetable products, mineral products,chemical products, textiles and textile articles, and instruments-measuring andmusical. More recently, under the Trade Policy 2008/09 of Pakistan, diesel and fuel oilwere added to the positive list and given a concession (0 per cent custom duty) to theimport of compressed natural gas (CNG)25 buses from India (see annex table A.9). Inaddition, the Economic Coordination Committee of the Cabinet of Pakistan allowedthe Ministry of Commerce to start trade with India through the Wagah-Attari road
Asia-Pacific Development Journal Vol. 19, No. 1, June 2012
19
route and to increase the number of importable items in a phased manner26 in March2009. This is a much awaited positive move towards improving bilateral tradebetween the two countries.
India, according to SAFTA, had agreed to bring down all tariffs, other thanthose on the negative list of India to 20 per cent or below by 2008 and then furtherdecrease in phases of MOP to 10 per cent each year such that all tariffs are down to0 to 5 per cent by 2013. The negative list does include some of the top 10 importitems from Pakistan, such as edible fruits and nuts, and some cotton textiles tarifflines. For example, the largest components of imports from Pakistan are petroleumoils excluding crude (HS 2710) and fresh or dried dates, figs, pineapples, avocadoes,guavas, fresh or dried (HS 0804). From that list, about five tariff lines at the 6-digitlevel are included in India’s negative list. Consequently, Pakistan does not receive anytariff concessions on the exports of these items to India. Within cereals, wheat anddurum is an important import from Pakistan which is on the sensitive list of India.Similarly, some of the important items in the textile industry, such as carpets andsacks have been placed in the Indian sensitive list (189 tariff lines at the 6-digit level).However, SAFTA concessions apply to cotton, a fabric which is imported fromPakistan in bulk (11.5 per cent in total imports from Pakistan in 2007) and it does not
Table 5. Industries wherein tariff lines allowed <= 20
2006 2008
Animals and animal products –
Animal or vegetable fats –
Prepared foodstuff Prepared foodstuff
Wood or pulp products –
Footwear, headwear Footwear, headwear
Articles of stone, plaster, cement, asbestos –
Pearls, precious/semi precious stones Pearls, precious/semi precious stones andand metals metals
Transportation equipment Transportation equipment
Miscellaneous Miscellaneous
Arms and ammunition; parts and accessories Arms and ammunition; parts and accessories
Works of art, collectors’ pieces and antiques Works of art, collectors’ pieces and antiques
Source: United Nations (2008).
26 News reports from Pakistan. Available from www.india-server.com/news/pakistans-ecc-approves-bilateral-trade-6616.html.
Asia-Pacific Development Journal Vol. 19, No. 1, June 2012
20
see any tariff lines in the sensitive list. Overall, trade between India and Pakistan islanguishing because of banned trade from Pakistan and lack of tariff liberalizationfrom India.
V. FACTOR CAUSING HIGH CHINA-PAKISTAN TRADE
The most important industries in which China holds dominant positions in thePakistan market pertain to machinery and mechanical appliances and textiles andtextile articles. In machinery and mechanical appliances industry, China dominatesthe Pakistan market in two products, namely RMG, and machinery and mechanicalappliances. Meanwhile, Indian exports of these products are negligible. Limited Indianexports in some industries areas may be attributed to the positive list that blocksgoods coming from India. On the contrary, in the China-Pakistan FTA, tariffconcessions were given by both countries to each other country’s exports. Some ofthe major factors responsible for the success of Chinese exports in Pakistan arediscussed below. Firstly, the Government of Pakistan is extending a helping hand inevery possible way by supporting Chinese business activities and trade. Moreover,Chinese traders do not face visa problems or antagonism in Pakistan as is case forIndian traders. Secondly, China’s trade with Pakistan, particularly exports, has notfaced any barriers in Pakistan in recent years, particularly after the implementation ofthe China-Pakistan FTA. China is doing well in Pakistan as the tariffs are almost zeroin most of the exports from China. Thirdly, China is performing well in the textileindustry as this industry enjoys the economies of scale and price competitiveness. Itis successful in Pakistan because of its low price and lack of competitors. Fourthly,China finds it easier to do trade and invest in Pakistan due to the cooperative attitudeof the people of Pakistan. In addition, China is encouraging the business houses fromPakistan to participate in their exhibitions and more detailed information about theChinese products is available in Pakistan, helping to boost Chinese imports. Lastly,trade and transaction costs are lower with China than with India (Taneja, 2007).
VI. INVESTMENT IN PAKISTAN: INDIA AND CHINAPERSPECTIVES
Investment flows between China and Pakistan27
Pakistan and China signed a bilateral investment treaty in February 1989. Amajor reason for Chinese interest in Pakistan is the trade and energy corridor from theGwadar (in Balochistan) port of Pakistan to the western regions of China. Pakistan
27 For details of FDI Policy, flows, pattern in South Asia, see Sahoo (2006) and Sahoo and Nataraj(2008).
Asia-Pacific Development Journal Vol. 19, No. 1, June 2012
21
provides the shortest possible route from Gwadar through the Karakoram highway tothe western regions of China. Apart from being short and secure, this route can serveas an alternative to the sea route that passes through the piracy-prone Straits ofMalacca, which is currently used to carry most of the Chinese crude oil imports.Therefore, Chinese investors have supported infrastructure projects in Balochistan.The Government of Pakistan, on the other hand, would like to turn Gwadar intoa regional hub of commercial activity as the port is near the Straits of Hormuz throughwhich large volumes of the world’s oil supplies flow. Pakistan would, in turn, earntransit revenues (Aneja, 2006).
Another project, the Karakoram highway, which is planned to span about90 kilometres, is in progress. China supported this project with funding and byproviding technical assistance for the Gwadar deep sea project which started in 2002and was inaugurated in 2007. Notably, the port is being operated by a Singaporeancompany. Another large project in Pakistan supported by Chinese investment is theChashma Nuclear Power Plant in 2004-2005. In addition, some joint venturesbetween the private sectors of these countries have been set up, such as the SpecialEconomic Zone in Pakistan involving Haier (China) and Ruba group (Pakistan). Chinaand Pakistan also launched an equal joint venture in July 2007 called the Pak-ChinaInvestment Company Limited (PCICL) with support from the Government of Pakistan(through Ministry of Finance) and Government of China (through China DevelopmentBank CDB) to undertake financially viable projects and facilitate Chinese investmentin Pakistan.
The two countries are also cooperating on setting up the first Chineseoverseas economic zone in Pakistan. In an additional agreement, which entailedamending the protocol to the FTA, the two countries have established China-Pakistaneconomic zones in Pakistan. The Government of Pakistan is providing variousincentives to projects/ventures which receive at least 40 per cent of the funding fromChinese investors. In addition, China and Pakistan will consider the reduction orelimination of tariffs for goods produced in these economic zone and even elsewhereto support trade between the two countries.28 More recently, the two countries haveissued some investment-related joint statements and communiqués29 includinga decision to establish working links between the China Investment PromotionAgency and Pakistan Board of Investment.
28 Text of the Amending Protocol to the FTA between China and Pakistan.29 http://pk2.mofcom.gov.cn/aarticle/bilateralcooperation/bilateralagreement/200706/20070604805796.html, http://pk2.mofcom.gov.cn/aarticle/bilateralvisits/200804/20080405489467.html.
Asia-Pacific Development Journal Vol. 19, No. 1, June 2012
22
Chinese FDI inflows into Pakistan are mainly in the following industries:communication; financial business; and oil and gas exploration. Chinese firms inPakistan are operating industries related to oil and gas, information technology,telecommunications, power generation, engineering, infrastructure and mining. Chinahas recently started to help Pakistan develop industries related to hydro powergeneration, science and technology, minerals, services, and to invest in the financeand banking sector. Also a large part of Chinese FDI in Pakistan is linked with themining of natural resources in important projects, such as (a) the Saindak Copper-Gold deposits, (b) the Duddar Lead-Zinc deposits and (c) the Thar and Badin Coaldeposits. In all of these projects, Chinese companies gain a generous share of theminerals.
Similarly, the report of Five Year Development Programme on Trade andEconomic Cooperation (2006) between Pakistan and China includes a list of priorityprojects (in various stages of completion) that have been jointly undertaken (public/private sectors). Projects involving investments are mostly in the communication andtelecommunication, infrastructural development and petroleum and natural resourcesfield. China had also steadily been assisting Pakistan with aid and assistance inresponse to the natural disasters that have destroyed property in the country, such asfloods and earthquakes. External debt from China increased to $568 million in 2005from $53 million in 1975.
Investment flows between India and Pakistan
A closer look at the FDI inflows data shows that there is hardly any directinvestment outflows from India to Pakistan. Since there is a ban on FDI from Pakistaninto India as India still has Pakistan in its negative list according to the ForeignExchange Management Act,30 there is a reciprocal discouragement regarding IndianFDI into Pakistan, though no official ban has been set.31 In fact, the very low yetpositive level of Indian FDI into Pakistan in some years is exactly reflective of theinformal prohibition on Indian FDI into Pakistan. However, it was proposed in 2009that FDI from Pakistan would be allowed through the Foreign Investment PromotionBoard (FIPB) route on a case-by-case basis. A positive move for Indian investmentswas also seen in the latest Trade Policy of Pakistan (Trade Policy 2008/09), in whichthe country opened the prospect of Indian investments in CNG buses manufacturing
30 RBI Master Circular – Foreign Investment in India, 1 July 2008. Available from www.bilaterals.org/article.php3?id_article=9799.31 It is difficult to get proper official information about cross border investment between two countries.For example, Secretariat for Industrial Assistance (SIA), the official Indian sources and Ministry of Finance,report Indian overseas project approvals to Pakistan but do not report incoming FDI from Pakistan.

Asia-Pacific Development Journal Vol. 19, No. 1, June 2012
23
in Pakistan.32 India, on the other hand, because of political mistrust with Pakistan,has missed out on the opportunity of investing in that country. The basis of the mutualban on investments between the two countries is purely political in nature and it islikely to continue until the Kashmir issue is fully resolved. Due to the bilateral politicalconflict, India is unable to take advantage of the liberal investment policy set inPakistan while, on the other hand, China is using it to its utmost advantage.
VII. CONCLUDING REMARKS
Pakistan is the only country in South Asia in which trade with China, in termsof both exports and imports, has been greater than with India throughout thereference period 1992-2007. The goods that show a comparative advantage for Chinahave accounted for larger shares of the market in Pakistan than that of Indian exportshaving a comparative advantage. The most important industries in which Chinadominates in the Pakistan market are machinery and mechanical appliances andtextiles and textile articles. The most important industries which constitute Indianexports are chemical products, textiles and textile products and prepared foodstuff.Some bulk exports of India to Pakistan are cane or beet sugar and chemically puresugar; oil cake and other solid residue and prepared foodstuff, which are included inthe positive list of Pakistan. However, we observe huge fluctuations in exports ofthese products depending upon local demand in Pakistan. Indian exports are doingbetter in the Pakistan market than Chinese exports in the products category in whichimports are allowed from India, particularly in essential items, such as food category,iron ores and petroleum oils. Therefore, the meagre Indian exports in some industriesmay be blamed on the positive list that blocks goods coming from India.
Overall, Chinese trade has been more compatible with the demand ofPakistan and the difference between the trade complementarity index for Indianexports and that of Chinese exports has widened since 2006. Trade between Chinaand Pakistan has been substantially higher and it appears that it will proceed forwardat a faster pace after the implementation of the FTA. On the other hand, tradebetween India and Pakistan is languishing because of banned trade from Pakistan’send and lack of tariff liberalization from India’s end. China has also been investing andsteadily assisting Pakistan with aid. India, on the other hand, due to the politicalmistrust with Pakistan, has missed out on the opportunity of investing in that country.Thus, China is using the liberal investment policy of Pakistan and the fact that India islosing out on this to its utmost advantage.
32 Given a firm commitment from the Indian party following which Pakistan would allow specialdispensation for import of 10 buses per each possible investor by road via Wagah as test consignments(Pakistan Trade Policy 2008/09).
Asia-Pacific Development Journal Vol. 19, No. 1, June 2012
24
In this context, the priority for India is to negotiate with Pakistan to abandonits policy of the positive lists approach for Indian exports and ask for MFN treatmentas soon as possible which would give it market access to Indian exporters in allproducts. As a reciprocal measure, India should also reduce all kinds of non-tariffbarriers, a move that would create confidence among Pakistani traders. Other factorsadversely affecting India-Pakistan trade are underdeveloped trade infrastructure andlogistics and complicated bilateral protocols. It is time to explore more trade routesrather than depend only on the Mumbai-Karachi sea link and Attari-Wagah land route.More rail and road routes and reducing trade and transaction costs would certainlyimprove India-Pakistan trade flows directly rather than going through the indirectchannels through a third country.
Asia-Pacific Development Journal Vol. 19, No. 1, June 2012
25
REFERENCES
Adams, F.G., B. Gangnes, and Y. Shachmurove (2006). Why is China so competitive? – Measuringand explaining China’s competitiveness. The World Economy, vol. 29, No. 2, pp. 95-122.
Aneja, U. (2006). Pakistan-China relations: recent developments. Special Report No. 26, New Delhi:Institute of Peace and Conflict Studies.
Ashraf, S. (2009). India and Pakistan – the economic stand-off. Working Paper No. 57. Singapore:Institute for South Asian Studies.
Balassa, B. (1965). Trade liberalization and revealed comparative advantage. The Manchester School,vol. 33, No. 2, pp. 99-123.
Consumer Unity & Trust Society (CUTS) (2011). The Future of Indo-Pak Relations. Jaipu, India.
Khan, Mohsin S. (2009). India-Pakistan trade: a roadmap for enhancing economic relations. PolicyBrief 09-15. Washington, D.C.: Peterson Institute for International Economics. Availablefrom www.iie.com/publications/pb/pb09-15.pdf.
Kumar, A. (2006). China-Pakistan economic relations. Special Report No. 30. New Delhi: Institute ofPeace and Conflict Studies.
Malhotra, P. (2009). Enhancing Indo-Pak trade: perspective from India. Issue Brief No. 119. NewDelhi: Institute of Peace and Conflict Studies.
Memon, N.A. (2009). Pak-China economic and trade relations. Pakistan Textile Journal, (September),pp. 44-45.
Pascha, Werner (2002). Economic relations between Germany and Japan – an analysis of recentData. Working Papers on East Asian Economic Studies No. 61. Duisburg, Germany:Duisburg University.
Rahman, F. (2011). Pakistan-China trade and investment relations. Paper presented at the seminar onPakistan-China Relations - 2011: Year of Friendship, Islamabad, 11-12 January.
Sahoo, P. (2006). FDI in South Asia: trends, policy, impact and determinants. Discussion Paper SeriesNo. 56. Tokyo: Asian Development Bank Institute.
(2010). China’s clout over South Asia. Hindu Business Line, 16 November.
Sahoo, P., and G. Nataraj (2008). FDI in South Asia: policy, trends and prospects. GITAM Journal ofInternational Business, vol.1, No. 1, pp. 17-30.
Taneja, N. (2006). India-Pakistan trade. Working Paper No. 182. New Delhi: Indian Council forResearch on International Economic Relations.
(2007). India’s exports to Pakistan: transaction cost analysis. Economic and PoliticalWeekly, vol. 13, pp. 96-99.
Taneja, N., S. Prakash, and P. Kalita (2011). Issues in India-Pakistan trade negotiations. Economic andPolitical Weekly, vol. XLVI, No. 30, pp. 24-28.
United Nations (2008). United Nations Commodity Trade Statistics Database. Available from http://comtrade.un.org/.
(2009). United Nations Commodity Trade Statistics Database. Available from http://comtrade.un.org/.
Asia-Pacific Development Journal Vol. 19, No. 1, June 2012
26
AP
PE
ND
IX
Ann
ex t
able
A.1
. Tr
ade
bet
wee
n C
hina
/Ind
ia a
nd P
akis
tan
Chi
nese
Chi
nese
Chi
nese
Pak
ista
niN
orm
aliz
edIn
dia
nIn
dia
nsIn
dia
nP
akis
tan
No
rmal
ized
exp
ort
s to
imp
ort
ssh
are
inex
po
rts
totr
ade
exp
ort
s to
imp
ort
ssh
are
of
exp
ort
s to
trad
eP
akis
tan
fro
mto
tal
Chi
na a
sb
alan
ceP
akis
tan
fro
mto
tal
Ind
ia a
sb
alan
ce(g
row
thP
akis
tan
imp
ort
s o
fp
erce
ntag
era
tio
in(g
row
thP
akis
tan’
sim
po
rts
of
per
cent
age
rati
o in
rate
)(g
row
thP
akis
tan
in t
ota
lfa
vour
of
rate
)(g
row
thP
akis
tan
in t
ota
lfa
vour
of
(per
cen
t)
rate
)(p
er c
ent)
*ex
po
rts*
Chi
na(p
er c
ent)
rate
)(p
er c
ent)
*ex
po
rts*
Ind
ia(p
er c
ent)
(per
cen
t)
1992
....
9.3
2.2
0.72
....
1.0
3.5
-0.4
4
1993
36.4
5.8
11.2
1.9
0.77
12.9
-69.
91.
00.
90.
19
1994
-19.
468
.08.
72.
70.
58-1
0.7
21.1
0.8
0.9
0.04
1995
30.2
37.7
9.2
3.1
0.56
33.8
-14.
70.
90.
60.
26
1996
-21.
053
.47.
24.
40.
2910
5.3
-19.
71.
80.
50.
63
1997
10.6
10.8
8.8
5.0
0.29
-8.9
22.8
1.8
0.6
0.53
1998
-24.
12.
67.
75.
00.
15-2
5.9
383.
61.
62.
8-0
.34
1999
10.9
0.2
9.2
5.1
0.20
-11.
8-6
8.0
1.5
0.9
0.15
2000
15.5
26.2
10.1
5.7
0.15
102.
9-5
.12.
90.
80.
49
2001
21.6
18.2
11.9
6.3
0.17
-23.
30.
52.
10.
70.
38
2002
52.4
-4.2
15.1
6.0
0.38
40.9
-31.
82.
50.
50.
64
2003
49.3
3.1
15.7
5.5
0.53
38.1
27.6
2.4
0.5
0.67
2004
32.9
3.4
16.4
4.9
0.61
78.2
61.4
3.4
0.8
0.69
2005
39.0
40.1
16.0
6.5
0.61
37.0
96.1
3.2
1.4
0.59
2006
23.7
20.9
16.6
6.9
0.62
94.7
79.0
5.3
2.2
0.61
2007
36.6
9.6
22.8
7.3
0.68
17.6
-11.
16.
21.
90.
69
Sou
rce:
Uni
ted
Nat
ions
(200
8).
Not
e:*A
ll ou
r re
por
ters
are
Ind
ia/C
hina
or
the
Wor
ld.

Asia-Pacific Development Journal Vol. 19, No. 1, June 2012
27
Ann
ex t
able
A.2
. In
tern
atio
nal r
evea
led
co
mp
arat
ive
adva
ntag
es (
IRC
A)
Rev
eale
d c
om
par
ativ
e an
alys
is: C
hina
Tota
l num
ber
of
Sha
re in
the
wo
rld
Sha
re in
the
Pak
ista
nco
mm
od
itie
s ha
ving
mar
ket
(per
cent
age
inm
arke
t (p
erce
ntag
e in
IRC
A >
1to
tal w
orl
d e
xpo
rts
wo
rld
exp
ort
s o
f th
ese
of
thes
e co
mm
od
itie
s)co
mm
od
itie
s g
oin
gto
Pak
ista
n)
1992
2000
2007
1992
2000
2007
1992
2000
2007
Com
mod
ities
hav
ing
com
par
ativ
e46
4746
12.5
9.0
17.6
5.6
13.8
32.6
adva
ntag
es a
t 2-
dig
it le
vel
Com
mod
ities
hav
ing
com
par
ativ
e47
249
350
013
.111
.624
.817
.720
.145
.0ad
vant
ages
at
4-d
igit
leve
l
Com
mod
ities
hav
ing
com
par
ativ
e1
804
1 89
51
886
15.6
14.4
27.3
23.4
23.3
50.5
adva
ntag
es a
t 6-
dig
it le
vel
Rev
eale
d c
om
par
ativ
e an
alys
is: I
ndia
Tota
l num
ber
of
Sha
re in
the
wo
rld
Sha
re in
the
Pak
ista
nco
mm
od
itie
sm
arke
tm
arke
t (p
er c
ent)
(per
cen
t)
1992
2000
2007
1992
2000
2007
1992
2000
2007
Com
mod
ities
hav
ing
com
par
ativ
e36
4339
3.2
2.5
2.6
3.7
5.6
14.9
adva
ntag
es a
t 2-
dig
it le
vel
Com
mod
ities
hav
ing
com
par
ativ
e28
836
536
44.
63.
44.
93.
78.
220
.0ad
vant
ages
at
4-d
igit
leve
l
Com
mod
ities
hav
ing
com
par
ativ
e1
027
1 35
41
394
6.8
4.5
5.6
5.1
9.7
21.6
adva
ntag
es a
t 6-
dig
it le
vel
Sou
rce:
Uni
ted
Nat
ions
(200
8).
Asia-Pacific Development Journal Vol. 19, No. 1, June 2012
28
Ann
ex t
able
A.3
. B
ilate
ral r
evea
led
co
mp
arat
ive
adva
ntag
es (
BR
CA
)
Rev
eale
d c
om
par
ativ
e an
alys
is: C
hina
Tota
l num
ber
of
Sha
re in
the
wo
rld
mar
ket
Sha
re in
the
Pak
ista
nco
mm
od
itie
s ha
ving
(per
cent
age
in t
ota
l m
arke
t (p
erce
ntag
e in
BR
CA
>1
wo
rld
exp
ort
s o
f th
ese
wo
rld
exp
ort
s o
f th
ese
co
mm
od
itie
s) c
om
mo
dit
ies
go
ing
to
Pak
ista
n)
1992
2000
2007
1992
2000
2007
1992
2000
2007
Com
mod
ities
hav
ing
com
par
ativ
e24
3031
1.6
2.7
5.2
10.3
12.3
26.0
adva
ntag
es a
t 2-
dig
it le
vel
Com
mod
ities
hav
ing
com
par
ativ
e28
732
038
51.
62.
78.
613
.816
.232
.4ad
vant
ages
at
4-d
igit
leve
l
Com
mod
ities
hav
ing
com
par
ativ
e84
297
31
212
1.7
2.6
8.8
19.1
20.1
36.5
adva
ntag
es a
t 6-
dig
it le
vel
Rev
eale
d c
om
par
ativ
e an
alys
is: I
ndia
Com
mod
ities
hav
ing
com
par
ativ
e19
1824
0.7
1.0
1.6
5.1
9.0
17.8
adva
ntag
es a
t 2-
dig
it le
vel
Com
mod
ities
hav
ing
com
par
ativ
e10
013
214
61.
11.
01.
67.
011
.723
.7ad
vant
ages
at
4-d
igit
leve
l
Com
mod
ities
hav
ing
com
par
ativ
e19
130
240
21.
51.
41.
79.
614
.129
.3ad
vant
ages
at
6-d
igit
leve
l
Sou
rce:
Uni
ted
Nat
ions
(200
8).
Asia-Pacific Development Journal Vol. 19, No. 1, June 2012
29
Ann
ex t
able
A.4
. In
tern
atio
nal r
evea
led
co
mp
arat
ive
anal
ysis
Rev
eale
d c
om
par
ativ
e an
alys
is: C
hina
Ind
ustr
ies
havi
ng c
om
par
ativ
e ad
vant
age
Inte
rnat
iona
l rev
eale
dS
hare
in t
he w
orl
d m
arke
tS
hare
in t
he P
akis
tan
mar
ket
in 2
007
com
par
ativ
e ad
vant
age
(per
cent
age
in t
ota
l wo
rld
(per
cent
age
in w
orl
d h
avin
g IR
CA
>1
exp
ort
s o
f th
ese
exp
ort
s in
the
se in
dus
trie
sco
mm
od
itie
s)g
oin
g t
o P
akis
tan)
1992
2000
2007
1992
2000
2007
1992
2000
2007
Foot
wea
r, he
adw
ear
6.8
6.6
4.0
23.7
27.8
38.7
33.0
48.7
81.5
Text
ile a
nd t
extil
e ar
ticle
s4.
63.
63.
216
.115
.031
.11.
37.
045
.9
Mis
cella
neou
s3.
43.
63.
011
.714
.928
.99.
624
.251
.0
Hid
es a
nd s
kins
4.2
4.4
2.4
14.8
18.5
23.9
0.9
17.8
40.5
Mac
hine
ry a
nd m
echa
nica
l ap
plia
nces
0.5
1.0
1.7
1.8
4.0
16.4
11.7
12.1
28.2
Art
icle
s of
sto
ne, p
last
er, c
emen
t, a
sbes
tos
1.4
1.5
1.5
5.0
6.1
14.3
14.8
24.2
48.3
Inst
rum
ents
-mea
surin
g an
d m
usic
al0.
71.
01.
02.
64.
210
.27.
212
.022
.3
Bas
e m
etal
s an
d a
rtic
les
ther
eof
0.8
1.0
1.0
2.8
4.3
10.3
15.0
12.3
23.8
Rev
eale
d c
om
par
ativ
e an
alys
is: I
ndia
Pea
rls, p
reci
ous/
sem
i pre
ciou
s st
ones
, met
als
12.6
9.6
6.7
10.7
7.3
7.9
0.0
4.7
1.5
Text
ile a
nd t
extil
e ar
ticle
s4.
44.
73.
43.
73.
63.
90.
40.
314
.2
Hid
es a
nd s
kins
6.1
4.6
2.7
5.2
3.5
3.1
0.1
0.1
0.2
Wor
ks o
f art
, col
lect
ors’
pie
ces
and
ant
ique
s0.
00.
02.
60.
00.
03.
00.
00.
079
.6
Vege
tab
le p
rod
ucts
2.5
3.3
2.3
2.1
2.5
2.7
2.5
5.1
9.5
Foot
wea
r, he
adw
ear
2.6
2.1
1.7
2.2
1.6
2.0
2.2
0.4
5.8
Bas
e m
etal
s an
d a
rtic
les
ther
eof
0.9
1.1
1.2
0.8
0.8
1.4
0.7
1.0
3.7
Min
eral
pro
duc
ts0.
80.
61.
70.
60.
41.
94.
33.
212
.8
Ani
mal
and
ani
mal
pro
duc
ts1.
42.
11.
11.
21.
61.
20.
00.
020
.7
Che
mic
al p
rod
ucts
0.9
1.2
1.1
0.8
0.9
1.3
1.3
4.0
13.5
Sou
rce:
Uni
ted
Nat
ions
(200
8).
Not
e:*T
op in
dus
trie
s sh
owin
g hi
ghes
t IR
CA
.
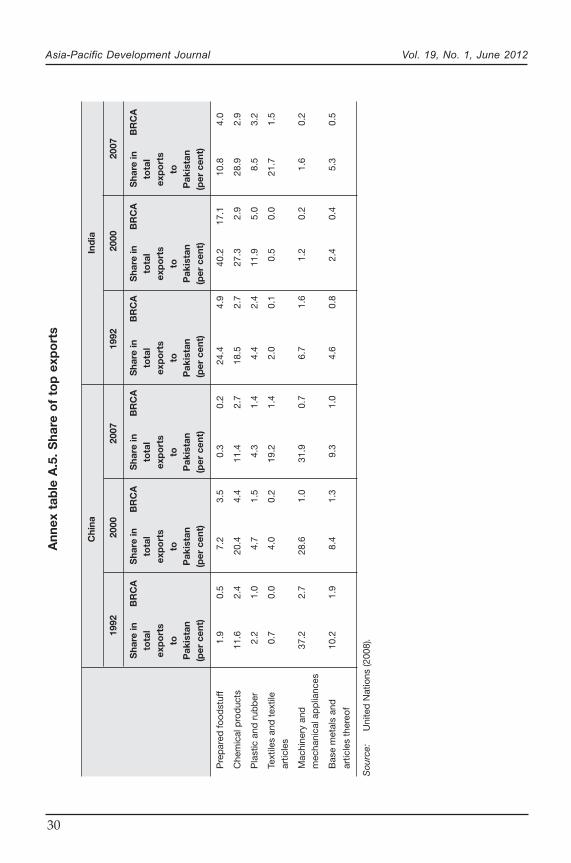
Asia-Pacific Development Journal Vol. 19, No. 1, June 2012
30
Ann
ex t
able
A.5
. S
hare
of
top
exp
ort
s
Chi
naIn
dia
1992
2000
2007
1992
2000
2007
Sha
re in
BR
CA
Sha
re in
BR
CA
Sha
re in
BR
CA
Sha
re in
BR
CA
Sha
re in
BR
CA
Sha
re in
BR
CA
tota
lto
tal
tota
lto
tal
tota
lto
tal
exp
ort
sex
po
rts
exp
ort
sex
po
rts
exp
ort
sex
po
rts
toto
toto
toto
Pak
ista
nP
akis
tan
Pak
ista
nP
akis
tan
Pak
ista
nP
akis
tan
(per
cen
t)(p
er c
ent)
(per
cen
t) (p
er c
ent)
(per
cen
t)(p
er c
ent)
Pre
par
ed fo
odst
uff
1.9
0.5
7.2
3.5
0.3
0.2
24.4
4.9
40.2
17.1
10.8
4.0
Che
mic
al p
rod
ucts
11.6
2.4
20.4
4.4
11.4
2.7
18.5
2.7
27.3
2.9
28.9
2.9
Pla
stic
and
rub
ber
2.2
1.0
4.7
1.5
4.3
1.4
4.4
2.4
11.9
5.0
8.5
3.2
Text
iles
and
tex
tile
0.7
0.0
4.0
0.2
19.2
1.4
2.0
0.1
0.5
0.0
21.7
1.5
artic
les
Mac
hine
ry a
nd37
.22.
728
.61.
031
.90.
76.
71.
61.
20.
21.
60.
2m
echa
nica
l ap
plia
nces
Bas
e m
etal
s an
d10
.21.
98.
41.
39.
31.
04.
60.
82.
40.
45.
30.
5
artic
les
ther
eof
Sou
rce:
Uni
ted
Nat
ions
(200
8).
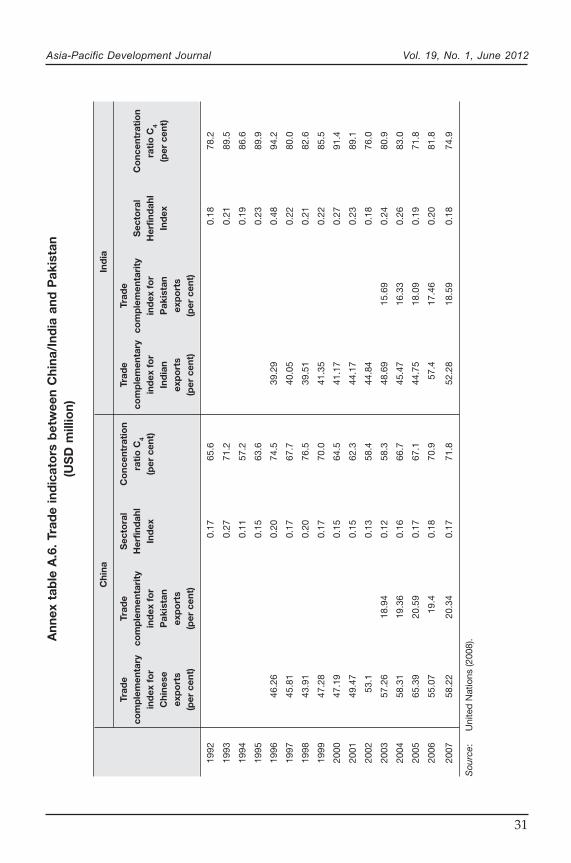
Asia-Pacific Development Journal Vol. 19, No. 1, June 2012
31
Ann
ex t
able
A.6
. Tr
ade
ind
icat
ors
bet
wee
n C
hina
/Ind
ia a
nd P
akis
tan
(US
D m
illio
n)
Chi
naIn
dia
Trad
eTr
ade
Sec
tora
lC
onc
entr
atio
nTr
ade
Trad
eco
mp
lem
enta
ryco
mp
lem
enta
rity
Her
find
ahl
rati
o C
4co
mp
lem
enta
ryco
mp
lem
enta
rity
Sec
tora
lC
onc
entr
atio
nin
dex
fo
rin
dex
fo
rIn
dex
(per
cen
t)in
dex
fo
rin
dex
fo
rH
erfin
dah
lra
tio
C4
Chi
nese
Pak
ista
nIn
dia
nP
akis
tan
Ind
ex(p
er c
ent)
exp
ort
sex
po
rts
exp
ort
sex
po
rts
(per
cen
t)(p
er c
ent)
(per
cen
t)(p
er c
ent)
1992
0.17
65.6
0.18
78.2
1993
0.27
71.2
0.21
89.5
1994
0.11
57.2
0.19
86.6
1995
0.15
63.6
0.23
89.9
1996
46.2
60.
2074
.539
.29
0.48
94.2
1997
45.8
10.
1767
.740
.05
0.22
80.0
1998
43.9
10.
2076
.539
.51
0.21
82.6
1999
47.2
80.
1770
.041
.35
0.22
85.5
2000
47.1
90.
1564
.541
.17
0.27
91.4
2001
49.4
70.
1562
.344
.17
0.23
89.1
2002
53.1
0.13
58.4
44.8
40.
1876
.0
2003
57.2
618
.94
0.12
58.3
48.6
915
.69
0.24
80.9
2004
58.3
119
.36
0.16
66.7
45.4
716
.33
0.26
83.0
2005
65.3
920
.59
0.17
67.1
44.7
518
.09
0.19
71.8
2006
55.0
719
.40.
1870
.957
.417
.46
0.20
81.8
2007
58.2
220
.34
0.17
71.8
52.2
818
.59
0.18
74.9
Sou
rce:
Uni
ted
Nat
ions
(200
8).
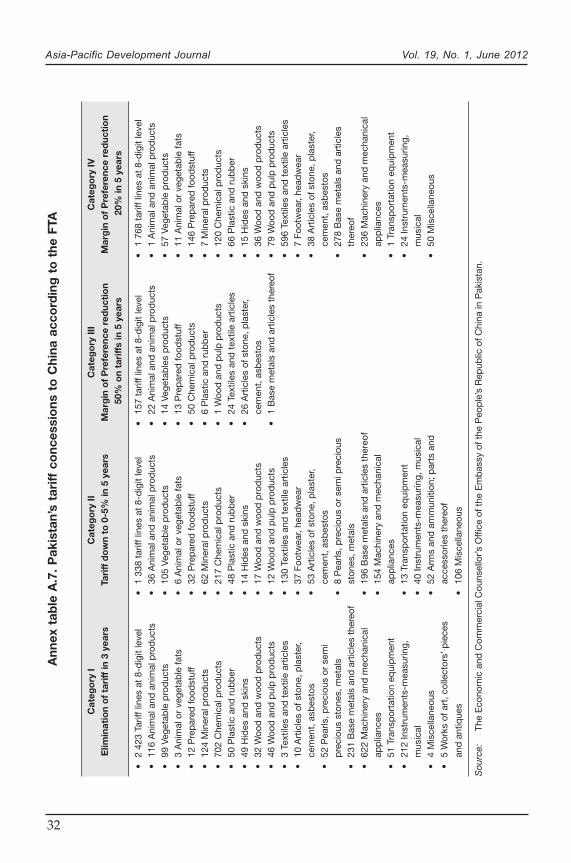
Asia-Pacific Development Journal Vol. 19, No. 1, June 2012
32
Ann
ex t
able
A.7
. P
akis
tan’
s ta
riff
co
nces
sio
ns t
o C
hina
acc
ord
ing
to
the
FTA
Cat
ego
ry I
Cat
ego
ry II
Cat
ego
ry II
IC
ateg
ory
IVE
limin
atio
n o
f ta
riff
in 3
yea
rsTa
riff
do
wn
to 0
-5%
in 5
yea
rsM
arg
in o
f P
refe
renc
e re
duc
tio
nM
arg
in o
f P
refe
renc
e re
duc
tio
n 5
0% o
n ta
riff
s in
5 y
ears
20%
in 5
yea
rs
•2
423
Tarif
f lin
es a
t 8-
dig
it le
vel
•1
338
tarif
f lin
es a
t 8-
dig
it le
vel
•15
7 ta
riff l
ines
at
8-d
igit
leve
l•
1 76
8 ta
riff l
ines
at
8-d
igit
leve
l•
116
Ani
mal
and
ani
mal
pro
duc
ts•
36 A
nim
al a
nd a
nim
al p
rod
ucts
•22
Ani
mal
and
ani
mal
pro
duc
ts•
1 A
nim
al a
nd a
nim
al p
rod
ucts
•99
Veg
etab
le p
rod
ucts
•10
5 Ve
geta
ble
pro
duc
ts•
14 V
eget
able
s p
rod
ucts
•57
Veg
etab
le p
rod
ucts
•3
Ani
mal
or
vege
tab
le fa
ts•
6 A
nim
al o
r ve
geta
ble
fats
•13
Pre
par
ed fo
odst
uff
•11
Ani
mal
or
vege
tab
le fa
ts•
12 P
rep
ared
food
stuf
f•
32 P
rep
ared
food
stuf
f•
50 C
hem
ical
pro
duc
ts•
146
Pre
par
ed fo
odst
uff
•12
4 M
iner
al p
rod
ucts
•62
Min
eral
pro
duc
ts•
6 P
last
ic a
nd r
ubb
er•
7 M
iner
al p
rod
ucts
•70
2 C
hem
ical
pro
duc
ts•
217
Che
mic
al p
rod
ucts
•1
Woo
d a
nd p
ulp
pro
duc
ts•
120
Che
mic
al p
rod
ucts
•50
Pla
stic
and
rub
ber
•48
Pla
stic
and
rub
ber
•24
Tex
tiles
and
tex
tile
artic
les
•66
Pla
stic
and
rub
ber
•49
Hid
es a
nd s
kins
•14
Hid
es a
nd s
kins
•26
Art
icle
s of
sto
ne, p
last
er,
•15
Hid
es a
nd s
kins
•32
Woo
d a
nd w
ood
pro
duc
ts•
17 W
ood
and
woo
d p
rod
ucts
cem
ent,
asb
esto
s•
36 W
ood
and
woo
d p
rod
ucts
•46
Woo
d a
nd p
ulp
pro
duc
ts•
12 W
ood
and
pul
p p
rod
ucts
•1
Bas
e m
etal
s an
d a
rtic
les
ther
eof
•79
Woo
d a
nd p
ulp
pro
duc
ts•
3 Te
xtile
s an
d t
extil
e ar
ticle
s•
130
Text
iles
and
tex
tile
artic
les
•59
6 Te
xtile
s an
d t
extil
e ar
ticle
s•
10 A
rtic
les
of s
tone
, pla
ster
,•
37 F
ootw
ear,
head
wea
r•
7 Fo
otw
ear,
head
wea
rce
men
t, a
sbes
tos
•53
Art
icle
s of
sto
ne, p
last
er,
•38
Art
icle
s of
sto
ne, p
last
er,
•52
Pea
rls, p
reci
ous
or s
emi
cem
ent,
asb
esto
sce
men
t, a
sbes
tos
pre
ciou
s st
ones
, met
als
•8
Pea
rls, p
reci
ous
or s
emi p
reci
ous
•27
8 B
ase
met
als
and
art
icle
s•
231
Bas
e m
etal
s an
d a
rtic
les
ther
eof
ston
es, m
etal
sth
ereo
f•
622
Mac
hine
ry a
nd m
echa
nica
l•
196
Bas
e m
etal
s an
d a
rtic
les
ther
eof
•23
6 M
achi
nery
and
mec
hani
cal
app
lianc
es•
154
Mac
hine
ry a
nd m
echa
nica
lap
plia
nces
•51
Tra
nsp
orta
tion
equi
pm
ent
app
lianc
es•
1 Tr
ansp
orta
tion
equi
pm
ent
•21
2 In
stru
men
ts-m
easu
ring,
•13
Tra
nsp
orta
tion
equi
pm
ent
•24
Inst
rum
ents
-mea
surin
g,m
usic
al•
40 In
stru
men
ts-m
easu
ring,
mus
ical
mus
ical
•4
Mis
cella
neou
s•
52 A
rms
and
am
mun
ition
; par
ts a
nd•
50 M
isce
llane
ous
•5
Wor
ks o
f art
, col
lect
ors’
pie
ces
acce
ssor
ies
ther
eof
and
ant
ique
s•
106
Mis
cella
neou
s
Sou
rce:
The
Eco
nom
ic a
nd C
omm
erci
al C
ouns
ello
r’s O
ffice
of t
he E
mb
assy
of t
he P
eop
le’s
Rep
ublic
of C
hina
in P
akis
tan.
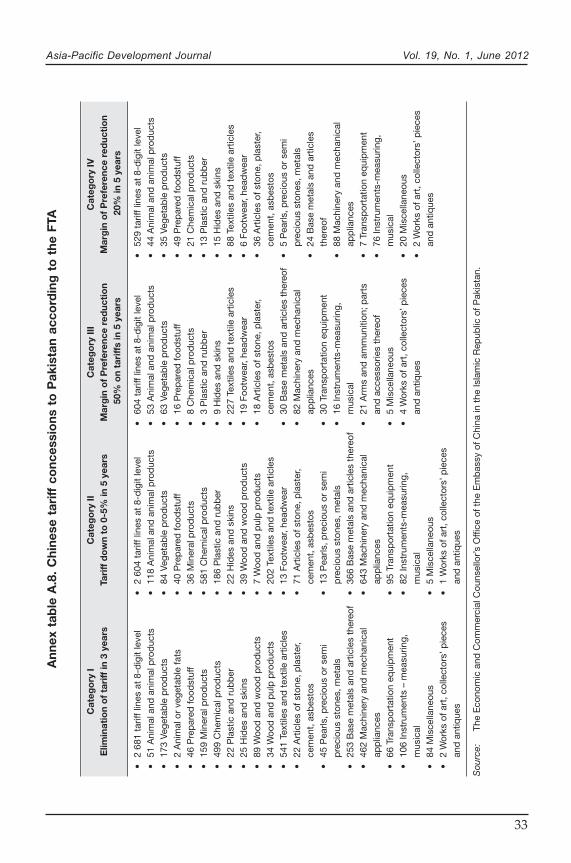
Asia-Pacific Development Journal Vol. 19, No. 1, June 2012
33
Ann
ex t
able
A.8
. C
hine
se t
ariff
co
nces
sio
ns t
o P
akis
tan
acco
rdin
g t
o t
he F
TA
Cat
ego
ry I
Cat
ego
ry II
Cat
ego
ry II
IC
ateg
ory
IVE
limin
atio
n o
f ta
riff
in 3
yea
rsTa
riff
do
wn
to 0
-5%
in 5
yea
rsM
arg
in o
f P
refe
renc
e re
duc
tio
nM
arg
in o
f P
refe
renc
e re
duc
tio
n 5
0% o
n ta
riff
s in
5 y
ears
20%
in 5
yea
rs
•2
681
tarif
f lin
es a
t 8-
dig
it le
vel
•2
604
tarif
f lin
es a
t 8-
dig
it le
vel
•60
4 ta
riff l
ines
at
8-d
igit
leve
l•
529
tarif
f lin
es a
t 8-
dig
it le
vel
•51
Ani
mal
and
ani
mal
pro
duc
ts•
118
Ani
mal
and
ani
mal
pro
duc
ts•
53 A
nim
al a
nd a
nim
al p
rod
ucts
•44
Ani
mal
and
ani
mal
pro
duc
ts•
173
Vege
tab
le p
rod
ucts
•84
Veg
etab
le p
rod
ucts
•63
Veg
etab
le p
rod
ucts
•35
Veg
etab
le p
rod
ucts
•2
Ani
mal
or
vege
tab
le fa
ts•
40 P
rep
ared
food
stuf
f•
16 P
rep
ared
food
stuf
f•
49 P
rep
ared
food
stuf
f•
46 P
rep
ared
food
stuf
f•
36 M
iner
al p
rod
ucts
•8
Che
mic
al p
rod
ucts
•21
Che
mic
al p
rod
ucts
•15
9 M
iner
al p
rod
ucts
•58
1 C
hem
ical
pro
duc
ts•
3 P
last
ic a
nd r
ubb
er•
13 P
last
ic a
nd r
ubb
er•
499
Che
mic
al p
rod
ucts
•18
6 P
last
ic a
nd r
ubb
er•
9 H
ides
and
ski
ns•
15 H
ides
and
ski
ns•
22 P
last
ic a
nd r
ubb
er•
22 H
ides
and
ski
ns•
227
Text
iles
and
tex
tile
artic
les
•88
Tex
tiles
and
tex
tile
artic
les
•25
Hid
es a
nd s
kins
•39
Woo
d a
nd w
ood
pro
duc
ts•
19 F
ootw
ear,
head
wea
r•
6 Fo
otw
ear,
head
wea
r•
89 W
ood
and
woo
d p
rod
ucts
•7
Woo
d a
nd p
ulp
pro
duc
ts•
18 A
rtic
les
of s
tone
, pla
ster
,•
36 A
rtic
les
of s
tone
, pla
ster
,•
34 W
ood
and
pul
p p
rod
ucts
•20
2 Te
xtile
s an
d t
extil
e ar
ticle
sce
men
t, a
sbes
tos
cem
ent,
asb
esto
s•
541
Text
iles
and
tex
tile
artic
les
•13
Foo
twea
r, he
adw
ear
•30
Bas
e m
etal
s an
d a
rtic
les
ther
eof
•5
Pea
rls, p
reci
ous
or s
emi
•22
Art
icle
s of
sto
ne, p
last
er,
•71
Art
icle
s of
sto
ne, p
last
er,
•82
Mac
hine
ry a
nd m
echa
nica
lp
reci
ous
ston
es, m
etal
sce
men
t, a
sbes
tos
cem
ent,
asb
esto
sap
plia
nces
•24
Bas
e m
etal
s an
d a
rtic
les
•45
Pea
rls, p
reci
ous
or s
emi
•13
Pea
rls, p
reci
ous
or s
emi
•30
Tra
nsp
orta
tion
equi
pm
ent
ther
eof
pre
ciou
s st
ones
, met
als
pre
ciou
s st
ones
, met
als
•16
Inst
rum
ents
-mea
surin
g,•
88 M
achi
nery
and
mec
hani
cal
•25
3 B
ase
met
als
and
art
icle
s th
ereo
f•
366
Bas
e m
etal
s an
d a
rtic
les
ther
eof
mus
ical
app
lianc
es•
462
Mac
hine
ry a
nd m
echa
nica
l•
643
Mac
hine
ry a
nd m
echa
nica
l•
21 A
rms
and
am
mun
ition
; par
ts•
7 Tr
ansp
orta
tion
equi
pm
ent
app
lianc
esap
plia
nces
and
acc
esso
ries
ther
eof
•76
Inst
rum
ents
-mea
surin
g,•
66 T
rans
por
tatio
n eq
uip
men
t•
95 T
rans
por
tatio
n eq
uip
men
t•
5 M
isce
llane
ous
mus
ical
•10
6 In
stru
men
ts –
mea
surin
g,•
82 In
stru
men
ts-m
easu
ring,
•4
Wor
ks o
f art
, col
lect
ors’
pie
ces
•20
Mis
cella
neou
sm
usic
alm
usic
alan
d a
ntiq
ues
•2
Wor
ks o
f art
, col
lect
ors’
pie
ces
•84
Mis
cella
neou
s•
5 M
isce
llane
ous
and
ant
ique
s•
2 W
orks
of a
rt, c
olle
ctor
s’ p
iece
s•
1 W
orks
of a
rt, c
olle
ctor
s’ p
iece
san
d a
ntiq
ues
and
ant
ique
s
Sou
rce:
The
Eco
nom
ic a
nd C
omm
erci
al C
ouns
ello
r’s O
ffice
of t
he E
mb
assy
of C
hina
in t
he Is
lam
ic R
epub
lic o
f Pak
ista
n.
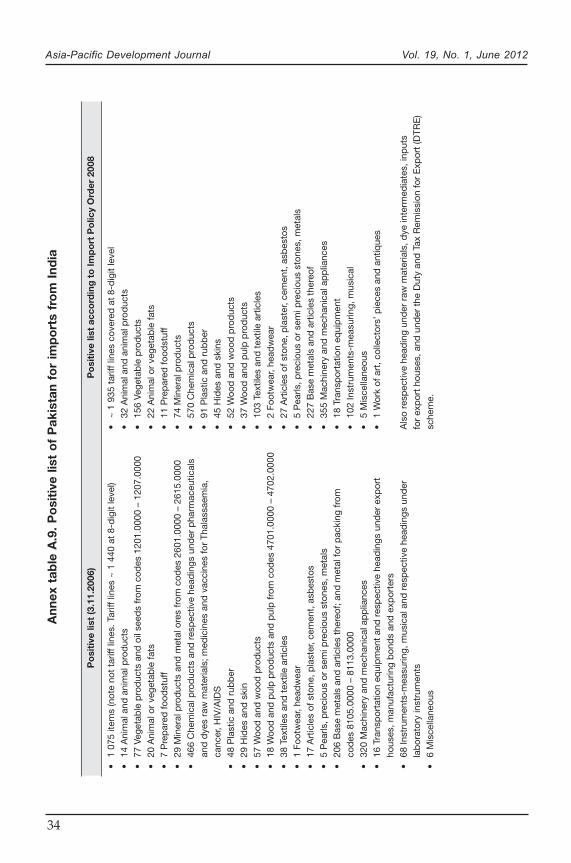
Asia-Pacific Development Journal Vol. 19, No. 1, June 2012
34
Ann
ex t
able
A.9
. P
osi
tive
list
of
Pak
ista
n fo
r im
po
rts
fro
m I
ndia
Po
siti
ve li
st (3
.11.
2006
)P
osi
tive
list
acc
ord
ing
to
Imp
ort
Po
licy
Ord
er 2
008
•1
075
item
s (n
ote
not
tarif
f lin
es. T
ariff
line
s ~
1 4
40 a
t 8-
dig
it le
vel)
•~
1 9
35 t
ariff
line
s co
vere
d a
t 8-
dig
it le
vel
•14
Ani
mal
and
ani
mal
pro
duc
ts•
32 A
nim
al a
nd a
nim
al p
rod
ucts
•77
Veg
etab
le p
rod
ucts
and
oil
seed
s fr
om c
odes
120
1.00
00 –
120
7.00
00•
156
Vege
tab
le p
rod
ucts
•20
Ani
mal
or
vege
tab
le fa
ts•
22 A
nim
al o
r ve
geta
ble
fats
•7
Pre
par
ed fo
odst
uff
•11
Pre
par
ed fo
odst
uff
•29
Min
eral
pro
duc
ts a
nd m
etal
ore
s fr
om c
odes
260
1.00
00 –
261
5.00
00•
74 M
iner
al p
rod
ucts
•46
6 C
hem
ical
pro
duc
ts a
nd r
esp
ectiv
e he
adin
gs u
nder
pha
rmac
eutic
als
•57
0 C
hem
ical
pro
duc
tsan
d d
yes
raw
mat
eria
ls; m
edic
ines
and
vac
cine
s fo
r Th
alas
saem
ia,
•91
Pla
stic
and
rub
ber
canc
er, H
IV/A
IDS
•45
Hid
es a
nd s
kins
•48
Pla
stic
and
rub
ber
•52
Woo
d a
nd w
ood
pro
duc
ts•
29 H
ides
and
ski
n•
37 W
ood
and
pul
p p
rod
ucts
•57
Woo
d a
nd w
ood
pro
duc
ts•
103
Text
iles
and
tex
tile
artic
les
•18
Woo
d a
nd p
ulp
pro
duc
ts a
nd p
ulp
from
cod
es 4
701.
0000
– 4
702.
0000
•2
Foot
wea
r, he
adw
ear
•38
Tex
tiles
and
tex
tile
artic
les
•27
Art
icle
s of
sto
ne, p
last
er, c
emen
t, a
sbes
tos
•1
Foot
wea
r, he
adw
ear
•5
Pea
rls, p
reci
ous
or s
emi p
reci
ous
ston
es, m
etal
s•
17 A
rtic
les
of s
tone
, pla
ster
, cem
ent,
asb
esto
s•
227
Bas
e m
etal
s an
d a
rtic
les
ther
eof
•5
Pea
rls, p
reci
ous
or s
emi p
reci
ous
ston
es, m
etal
s•
355
Mac
hine
ry a
nd m
echa
nica
l ap
plia
nces
•20
6 B
ase
met
als
and
art
icle
s th
ereo
f; an
d m
etal
for
pac
king
from
•18
Tra
nsp
orta
tion
equi
pm
ent
cod
es 8
105.
0000
– 8
113.
0000
•10
2 In
stru
men
ts-m
easu
ring,
mus
ical
•32
0 M
achi
nery
and
mec
hani
cal a
pp
lianc
es•
5 M
isce
llane
ous
•16
Tra
nsp
orta
tion
equi
pm
ent
and
res
pec
tive
head
ings
und
er e
xpor
t•
1 W
ork
of a
rt, c
olle
ctor
s’ p
iece
s an
d a
ntiq
ues
hous
es, m
anuf
actu
ring
bon
ds
and
exp
orte
rs•
68 In
stru
men
ts-m
easu
ring,
mus
ical
and
res
pec
tive
head
ings
und
erA
lso
resp
ectiv
e he
adin
g un
der
raw
mat
eria
ls, d
ye in
term
edia
tes,
inp
uts
lab
orat
ory
inst
rum
ents
for
exp
ort
hous
es, a
nd u
nder
the
Dut
y an
d T
ax R
emis
sion
for
Exp
ort
(DTR
E)
•6
Mis
cella
neou
ssc
hem
e.
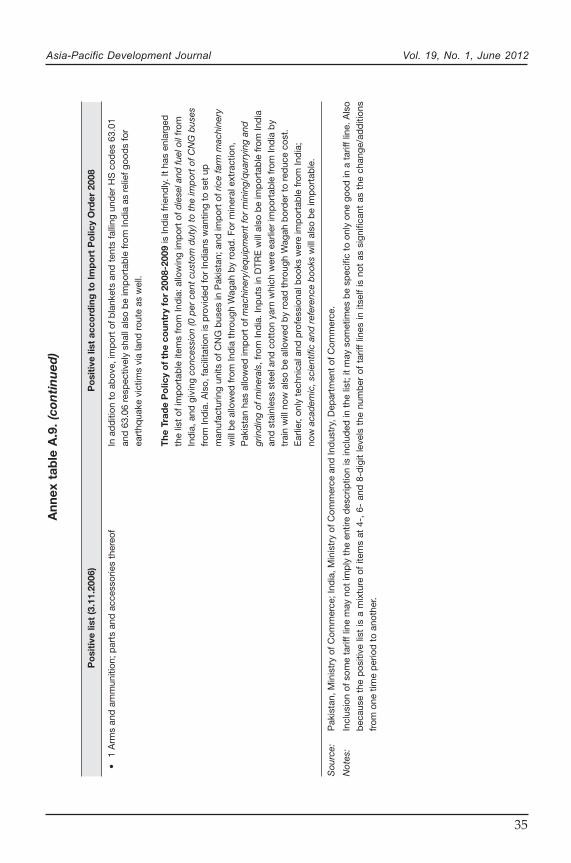
Asia-Pacific Development Journal Vol. 19, No. 1, June 2012
35
•1
Arm
s an
d a
mm
uniti
on; p
arts
and
acc
esso
ries
ther
eof
In a
dd
ition
to
abov
e, im
por
t of
bla
nket
s an
d t
ents
falli
ng u
nder
HS
cod
es 6
3.01
and
63.
06 r
esp
ectiv
ely
shal
l als
o b
e im
por
tab
le fr
om In
dia
as
relie
f goo
ds
for
eart
hqua
ke v
ictim
s vi
a la
nd r
oute
as
wel
l.
The
Tra
de
Po
licy
of
the
coun
try
for
2008
-200
9 is
Ind
ia fr
iend
ly. I
t ha
s en
larg
edth
e lis
t of
imp
orta
ble
item
s fr
om In
dia
: allo
win
g im
por
t of
die
sel a
nd fu
el o
il fr
omIn
dia
, and
giv
ing
conc
essi
on (0
per
cen
t cu
stom
dut
y) t
o th
e im
por
t of
CN
G b
uses
from
Ind
ia. A
lso,
faci
litat
ion
is p
rovi
ded
for
Ind
ians
wan
ting
to s
et u
pm
anuf
actu
ring
units
of C
NG
bus
es in
Pak
ista
n; a
nd im
por
t of
ric
e fa
rm m
achi
nery
will
be
allo
wed
from
Ind
ia t
hrou
gh W
agah
by
road
. For
min
eral
ext
ract
ion,
Pak
ista
n ha
s al
low
ed im
por
t of
mac
hine
ry/e
qui
pm
ent
for
min
ing/
qua
rryi
ng a
ndgr
ind
ing
of m
iner
als,
from
Ind
ia. I
nput
s in
DTR
E w
ill a
lso
be
imp
orta
ble
from
Ind
iaan
d s
tain
less
ste
el a
nd c
otto
n ya
rn w
hich
wer
e ea
rlier
imp
orta
ble
from
Ind
ia b
ytr
ain
will
now
als
o b
e al
low
ed b
y ro
ad t
hrou
gh W
agah
bor
der
to
red
uce
cost
.E
arlie
r, on
ly t
echn
ical
and
pro
fess
iona
l boo
ks w
ere
imp
orta
ble
from
Ind
ia;
now
aca
dem
ic, s
cien
tific
and
ref
eren
ce b
ooks
will
als
o b
e im
por
tab
le.
Sou
rce:
Pak
ista
n, M
inis
try
of C
omm
erce
; Ind
ia, M
inis
try
of C
omm
erce
and
Ind
ustr
y, D
epar
tmen
t of
Com
mer
ce.
Not
es:
Incl
usio
n of
som
e ta
riff l
ine
may
not
imp
ly t
he e
ntire
des
crip
tion
is in
clud
ed in
the
list
; it
may
som
etim
es b
e sp
ecifi
c to
onl
y on
e go
od in
a t
ariff
line
. Als
ob
ecau
se t
he p
ositi
ve li
st is
a m
ixtu
re o
f ite
ms
at 4
-, 6
- an
d 8
-dig
it le
vels
the
num
ber
of
tarif
f lin
es in
itse
lf is
not
as
sign
ifica
nt a
s th
e ch
ange
/ad
diti
ons
from
one
tim
e p
erio
d t
o an
othe
r.
Ann
ex t
able
A.9
. (c
onti
nu
ed)
Po
siti
ve li
st (3
.11.
2006
)P
osi
tive
list
acc
ord
ing
to
Imp
ort
Po
licy
Ord
er 2
008