Embed Size (px)
Citation preview

The Economic Outlook for
the U.S. and Indiana
Jim Diffley
Senior Director
Chief Regional Economist
IHS Global Insight
December 15, 2010

Copyright © 2010 IHS Global Insight. All Rights Reserved.
2
The U.S. Recovery: Uneven and Subpar
• Recession ―over‖, but GDP hasn’t regained previous peak yet
• Growth boost from fiscal stimulus and inventories is fading
• Recent data slightly more upbeat, but headwinds are still blowing from consumer and business caution
• The key problem is the hangover from the financial boom and bust
• QE II is here; it’s not a cure-all
• It’s too early to tighten fiscal policy when the private sector is gripped by an ―epidemic of thrift‖
Copyright © 2010 IHS Global Insight. All Rights Reserved.
3
0.98
1.00
1.02
1.04
1.06
1.08
1.10
-8 -7 -6 -5 -4 -3 -2 -1 0 1 2 3 4 5 6 7 8
Quarters from Trough
Current Recovery* Post-1950 Average Recovery
(Real GDP compared with recession trough)
Deep Recession, Slower Recovery
* 2009Q2 trough

Financial Clouds Lifting,
Slowly

Copyright © 2010 IHS Global Insight. All Rights Reserved.
5
1,100
1,200
1,300
1,400
1,500
1,600
1,700
Jan-07 Jul-07 Jan-08 Jul-08 Jan-09 Jul-09 Jan-10 Jul-10
(Loans outstanding, billions of dollars)
Bank Commercial and Industrial Loans:
Bottoming Out?

Copyright © 2010 IHS Global Insight. All Rights Reserved.
6
-20
0
20
40
60
80
100
2007 2008 2009 2010
0
20
40
60
80
100
2007 2008 2009 2010
Source: Diffusion Indexes from Fed Senior Loan Officer Survey
Tightening Comm. & Ind. Credit Tightening Comm. Mortgage Credit
Tightening Cons. Credit Tightening Home Mortgage Credit
Large & Medium Firms
Bank Credit: Beginning to Loosen
(Percent)
-20
0
20
40
60
80
2007 2008 2009 2010
Credit Cards
Other Loans
Small
Firms
-20
0
20
40
60
80
2007 2008 2009 2010
Prime Loans

Copyright © 2010 IHS Global Insight. All Rights Reserved.
7
300
400
500
600
700
Jan-08 Jul-08 Jan-09 Jul-09 Jan-10 Jul-10
Decline In Initial Unemployment Insurance Claims Resumes
(Initial unemployment insurance claims, 4-week moving average, thousands)

Copyright © 2010 IHS Global Insight. All Rights Reserved.
8
-8
-6
-4
-2
0
2
4
6
2008 2009 2010 2011 2012
GDP Final Sales
(Annualized real rate of growth, Q/Q, percent)
Inventory Cycle Support For Growth Has Peaked

Copyright © 2010 IHS Global Insight. All Rights Reserved.
9
(Percent change unless otherwise noted)
U.S. Economic Growth by Sector
2009 2010 2011 2012
Real GDP -2.6 2.8 2.4 3.0
Final Sales -2.1 1.3 2.6 3.1
Consumption -1.2 1.7 2.7 2.4
Light Vehicle Sales (Millions) 10.4 11.5 12.8 14.8
Residential Investment -22.9 -3.5 -0.3 28.7
Housing Starts (Millions) 0.55 0.59 0.70 1.09
Business Fixed Investment -17.1 5.4 5.7 7.7
Federal Government 5.7 4.6 -0.3 -3.5
State and Local Government -0.9 -1.2 0.1 0.0
Exports -9.5 11.6 7.9 8.1
Imports -13.8 12.8 5.4 5.2

Copyright © 2010 IHS Global Insight. All Rights Reserved.
10
(Percent unless otherwise noted)
Other Key Indicators
2009 2010 2011 2012
Industrial Production (% growth) -9.3 5.4 2.9 4.0
Employment (% growth) -4.3 -0.5 1.2 2.1
Unemployment Rate 9.3 9.6 9.5 8.9
CPI Inflation -0.3 1.6 1.3 1.8
Oil Prices (WTI, US$/bbl) 62 79 83 89
Core PCE Price Inflation 1.5 1.4 1.1 1.4
Federal Funds Rate 0.16 0.18 0.17 1.27
10-year Government Bond Yield 3.26 3.17 2.77 3.43
Dollar (Major Currencies, 2005=1) 0.93 0.90 0.87 0.88

The Housing Cycle:
Still At The Bottom

Copyright © 2010 IHS Global Insight. All Rights Reserved.
12
Key Single-Family Housing Indicators:
No Underlying Improvement Yet
4
6
8
10
12
14
2007 2008 2009 2010
New Existing
0.2
0.4
0.6
0.8
1.0
2007 2008 2009 2010
3
4
5
6
2007 2008 2009 2010
*Millions, SA; **Single-Family Homes for sale divided by monthly selling rate
Existing Home Sales* New Home Sales*
Months’ Supply of Homes** Housing Starts*
0.25
0.50
0.75
1.00
1.25
2007 2008 2009 2010

Copyright © 2010 IHS Global Insight. All Rights Reserved.
13
0.5
1.0
1.5
2.0
2.5
3.0
1975 1980 1985 1990 1995 2000 2005 2010
(Proportion of homeowner inventory vacant and for sale, percent)
The Housing Overhang
Source: Census Bureau

Copyright © 2010 IHS Global Insight. All Rights Reserved.
14
0.8
0.9
1.0
1.1
1.2
1.3
1975 1980 1985 1990 1995 2000 2005 2010
(FHFA house price index* divided by average labor compensation, 2000 = 1.0)
House Price Adjustment Has Gone a Long Way:
Probably Not Complete
* Purchase-only index from 1991 onwards

Copyright © 2010 IHS Global Insight. All Rights Reserved.
15
0.0
0.4
0.8
1.2
1.6
2.0
2.4
2003 2004 2005 2006 2007 2008 2009 2010 2011 2012
165
175
185
195
205
215
225
Housing Starts (Left scale) FHFA House Price Index (Right scale)
(Million units)
Housing Starts Have Hit Bottom:
Prices Not Quite There Yet
(Purchase-only index, 1991Q1 = 100)

The Consumer :
Reviving, But Without Vigor

Copyright © 2010 IHS Global Insight. All Rights Reserved.
17
The Personal Saving Rate Has Risen
0
2
4
6
8
10
1998 1999 2000 2001 2002 2003 2004 2005 2006 2007 2008 2009 2010
(Personal savings rate, percent of disposable income)
Microsoft Dividend
9/11
Post 9/11 vehicle incentives
Stimulus
Payments
Economic
Recovery
Payments

Copyright © 2010 IHS Global Insight. All Rights Reserved.
18
-6
-4
-2
0
2
4
6
Jan-08 Jul-08 Jan-09 Jul-09 Jan-10 Jul-10
Consumer Indicators
6
8
10
12
14
16
Jan-08 Jul-08 Jan-09 Jul-09 Jan-10 Jul-10
*Y/Y % change; **Millions, annualized, SA; ***Reuters/Michigan Index
Retail Sales ex-Autos and Gasoline* Light Vehicle Sales**
Consumer Sentiment*** Consumer Credit Growth*
-6
-3
0
3
6
Jan-08 Jul-08 Jan-09 Jul-09 Jan-10 Jul-10
50
60
70
80
Jan-08 Jul-08 Jan-09 Jul-09 Jan-10 Jul-10
Copyright © 2010 IHS Global Insight. All Rights Reserved.
19
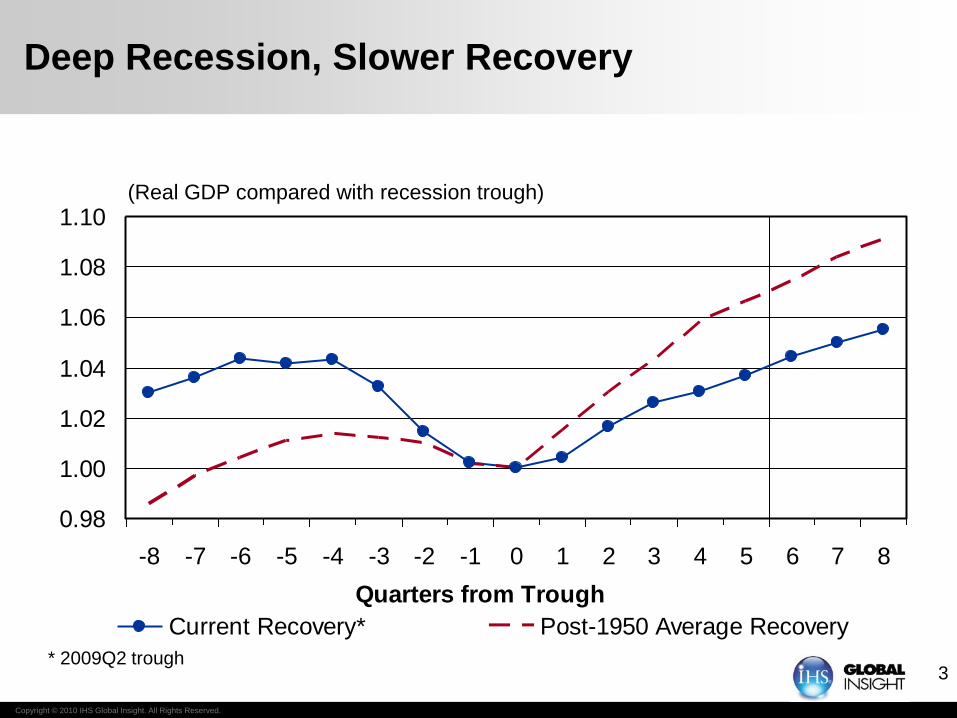
Consumer Sentiment Off the Floor But Still Weak
50
60
70
80
90
100
110
120
1978 1982 1986 1990 1994 1998 2002 2006 2010
(Reuters/University of Michigan Index, 1966=100)

Copyright © 2010 IHS Global Insight. All Rights Reserved.
20
0
50
100
150
200
250
Jan-10 Mar-10 May-10 Jul-10 Sep-10 Nov-10
Employment Is Turning, But Not Rapidly
4
6
8
10
12
Jan-08 Jul-08 Jan-09 Jul-09 Jan-10 Jul-10
*Thousands, monthly change, SA; **Percent; ***Hours, SA
Private Payroll Employment* Unemployment Rate**
Length of Workweek*** Temporary Employment*
-100
-50
0
50
100
Jan-08 Jul-08 Jan-09 Jul-09 Jan-10 Jul-10
33.6
33.8
34.0
34.2
34.4
34.6
34.8
Jan-08 Jul-08 Jan-09 Jul-09 Jan-10 Jul-10

Copyright © 2010 IHS Global Insight. All Rights Reserved.
21
-4
-2
0
2
4
6
2003 2004 2005 2006 2007 2008 2009 2010 2011 2012
(Annualized rate of growth)
Consumer Spending Stabilizing,
But Not a Strong Driver of Recovery

Inflation and Interest Rates

Copyright © 2010 IHS Global Insight. All Rights Reserved.
23
0
200
400
600
800
1000
1200
1400
1600
1800
1960 1965 1970 1975 1980 1985 1990 1995 2000 2005 2010
2.5
3.0
3.5
4.0
4.5
5.0
5.5
6.0
6.5
7.0
Billions of Dollars Percent of total corporate assets
(Billions of dollars)
The Growing Corporate Cash Pile*:
A Long-Established Trend
*Nonfarm nonfinancial corporations’ liquid assets (foreign deposits, checkable deposits and currency, time & savings deposits,
money market fund shares, security RPs, commercial paper, Treasuries, agency and GSE-backed securities. Source: Federal Reserve Board
(Percent of total corporate assets)

Copyright © 2010 IHS Global Insight. All Rights Reserved.
24
Business Equipment Demand Recovering
(Non-defense capital goods ex-aircraft, 3-mo moving average, US$ billions)
45
50
55
60
65
70
1998 2000 2002 2004 2006 2008 2010
Orders Shipments

Copyright © 2010 IHS Global Insight. All Rights Reserved.
25
(2005=1.0, inflation-adjusted)
The U.S. Dollar: Secular Weakness Against EMG
Currencies
0.6
0.8
1.0
1.2
1.4
1.6
1976 1980 1984 1988 1992 1996 2000 2004 2008 2012
Major Currency Index Other Important Trading Partners Index

Copyright © 2010 IHS Global Insight. All Rights Reserved.
26
(Percent change from a year earlier)
Core Inflation Is Still Easing
-2
-1
0
1
2
3
4
5
6
2006 2007 2008 2009 2010 2011 2012
All-Urban CPI Core PCE Price Index

Copyright © 2010 IHS Global Insight. All Rights Reserved.
27
Wage Inflation Not An Issue
(Percent change, year-on-year)
1.0
1.5
2.0
2.5
3.0
3.5
2007 2008 2009 2010 2011 2012
ECI Private Compensation

Copyright © 2010 IHS Global Insight. All Rights Reserved.
28
(Percent)
Federal Funds Rate to Stay Near Zero Until 2012:
QE II Keeps Long Rates Low
0
1
2
3
4
5
6
7
1999 2001 2003 2005 2007 2009 2011
Federal Funds 10-Year Treasury Yield

Copyright © 2010 IHS Global Insight. All Rights Reserved.
29
What Can QE II Accomplish?
• Don’t expect too much from QE II
• Quantitative easing is powerful in a crisis...
• ...but financial markets are not in meltdown now...
• QE II of $500bln-$1 trl can push down long-term interest rates
(25-50bps?), already in the market...
• ...and help growth a tenth or two in 2011...
• ...not a game-changer

Copyright © 2010 IHS Global Insight. All Rights Reserved.
30
Federal Fiscal Policy Assumptions
• Long-run tightening essential... but immediate tightening risky... and
markets are not demanding it
• We assume:
– Bush tax cuts extended for two more years (1.1% of GDP in
CY 2011)
– Emergency UI program extended into 2011
– Making Work Pay tax credit ends 2011 (0.3% of GDP in CY
2011)
• Upper-income tax cuts (0.3% of GDP) assumed to expire in 2013
• Further income-tax increases in 2014 and beyond

Copyright © 2010 IHS Global Insight. All Rights Reserved.
31
The Tax Compromise and Its Implications
• Includes most of what we expected plus...
• Payroll tax cut of 2 percentage points for employees for 2011 (worth
$120 billion, 0.8% of GDP)
• Full expensing of equipment and software spending for 2011
• Likely impact on GDP growth around 0.6% for 2011 (i.e. 3.0%, up
from 2.4%)

Copyright © 2010 IHS Global Insight. All Rights Reserved.
32
-2
0
2
4
6
8
10
2007 2008 2009 2010 2011 2012
Current Spending Current Receipts
(Percent growth, nominal, year-on-year)
State and Local Spending Constrained:
Receipts Driven by Federal Transfers, Not by the Economy

Copyright © 2010 IHS Global Insight. All Rights Reserved.
33
(Annualized rate of growth)
GDP Growth Outlook
-8
-6
-4
-2
0
2
4
6
2008 2009 2010 2011 2012
Baseline (60%) Pessimistic Scenario (20%) Optimistic Scenario (20%)

Copyright © 2010 IHS Global Insight. All Rights Reserved.
34
Bottom Line
• Deep recession, slow recovery
• The tax package improves 2011 growth prospects
• Inflation to stay low; deflation is the risk
• Fed is trying more asset purchases; don’t expect too much
• A deficit reduction plan is needed—but not yet action
• The question is not whether taxes will rise but when and how

Regional Outlook
Copyright © 2010 IHS Global Insight. All Rights Reserved.
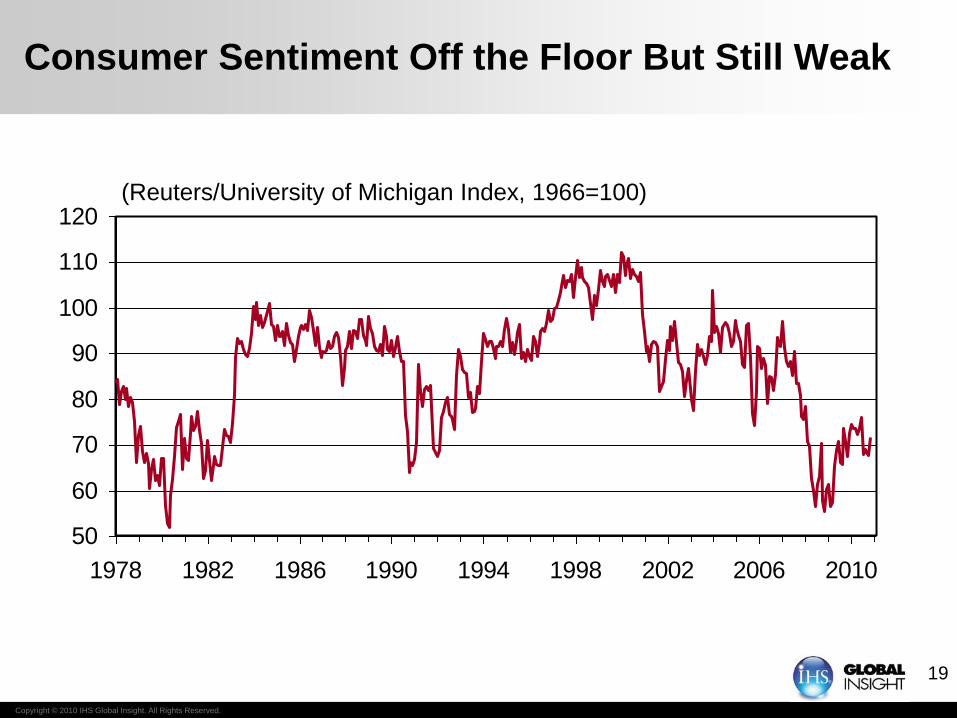
Regional Dynamics 2010
• Forty-six states have seen payroll expansion this year
• With business spending the key driver, Texas,
Massachusetts, and Indiana have expanded briskly
• The leading role of manufacturing has brightened the
outlook in the industrial midwest
• Lack of any housing upturn keeps parts of Sunbelt in
recession

Copyright © 2010 IHS Global Insight. All Rights Reserved.
Where we’ve been: Jobs
Peak to September 2010 Employment Change, %US: -5.6%

Copyright © 2010 IHS Global Insight. All Rights Reserved.
Percent
-0.2 to 0.5
0.6 to 0.8
0.8 to 1.2
1.3 to 1.7
Recovery gathers momentum in 2011
Employment Growth 2011, %
US: 0.9%

Copyright © 2010 IHS Global Insight. All Rights Reserved.
Return To Peak
2010 to 2011
2012
2013
2014 to 2015
Past 2015
… though a while before we return to peak
Year of Return to Peak Employment

Indiana Outlook

Copyright © 2010 IHS Global Insight. All Rights Reserved.
41
Bottom Line
• Deeper, earlier recession than most
• Among 2010 growth leaders
– Transportation equipment rebound
– Low paying temp and business services jobs
• Slow recovery, but a recovery is indeed in place
• Medium term performance near average among states
– Outpacing other midwest manufacturing giants

Copyright © 2010 IHS Global Insight. All Rights Reserved.
42
Indiana Employment Forecast
14131211100908
4
2
0
-2
-4
-6
-8
3050
3000
2950
2900
2850
2800
2750
perc
en
t ch
an
ge y
ear
ag
oT
ho
usan
ds
Growth - L Level - R

Copyright © 2010 IHS Global Insight. All Rights Reserved.
43
Wage Gains Return
(nominal total wages and salaries)
1211100908
6
4
2
0
-2
-4
-6
-8
6
4
2
0
-2
-4
-6
-8
perc
en
t ch
an
ge y
ear
ag
op
erc
en
t ch
an
ge y
ear a
go
Indiana US

Copyright © 2010 IHS Global Insight. All Rights Reserved.
44
Cars and Houses
121110090807
280
260
240
220
200
180
160
140
30
25
20
15
10
tho
usan
ds
tho
usan
ds
New Car Registrations - L
Housing Starts - R

Copyright © 2010 IHS Global Insight. All Rights Reserved.
45
(Percent unless otherwise noted)
Forecast Summary
2009 2010 2011 2012
Employment -5.7 0.3 1.2 2.1
Unemployment Rate 10.0 10.0 10.0 9.5
Personal Income -2.4 2.8 3.2 3.3
Housing Starts (000) 13.1 13.1 15.2 21.9
Retail Sales -7.1 6.2 4.8 5.4
Gross State Product -3.6 2.7 1.5 2.9

Thank you!
Jim Diffley
Senior Director
Chief Regional Economist
IHS Global Insight