Embed Size (px)
Citation preview

1
The Economic Opportunity for Robotics in Offshore Wind and Key Energy Markets September 2021
Author: Gavin Smart, ORE Catapult
Date: 10.09.2021

1
ABOUT THE AUTHOR
Gavin Smart joined ORE Catapult in April 2014 and holds the post
of Head of Analysis & Insights. Gavin is responsible for developing
and maintaining ORE Catapult’s financial and economic modelling,
which feeds directly into the organisation’s commercial strategy.
Gavin spent three years as Senior Investment Analyst for a major
European utility and offshore wind developer, developing models
and analysis tools for UK and European offshore wind and marine
projects. Prior to this, he worked as a Valuation & Business Modelling consultant in the Middle East
for one of the “Big Four” accounting firms, engaged in projects covering a variety of industries.
Contact: [email protected] .org.uk
BACKGROUND
Robotics and autonomous systems (henceforth, we’ll shorten to ‘RAS’) are set to become a critical
component in the safety, cost reduction and efficiency of offshore wind farm operations. They will
play a key role in the safe and cost-effective operation of increased numbers of offshore wind
turbines, operating in deeper waters and more challenging conditions further from shore.
The potential for robotics is huge, with applications across the offshore wind value chain, including
site survey and consenting, installation, operations and maintenance and decommissioning. This
presents significant opportunities to technology developers, SMEs and innovators; not just to serve
the rapidly growing UK market but also to export innovation to offshore wind markets around the
world.
Indeed, we believe that adoption of robotics and autonomous systems by the wind sector will be
vital to achieving the renewables expansion needed for Net Zero.
There are three compelling reasons why:
1. To achieve our net zero targets, the UK’s offshore wind capacity will need to increase more
than sevenfold by 2050. That means pushing operations into ever-deeper, more remote and
more treacherous waters with narrower weather windows for safe human access.
2. Robotics can take on the routine maintenance tasks such as scouring the surfaces of
thousands of blades for critical cracking and erosion (there are 30,000 currently at UK wind
farms - onshore and offshore) or checking the approximately 10 million bolts at these farms
for loss of tension and integrity. Ultimately, this will mean better pre-emptive maintenance
and control over these essential net-zero assets.

2
3. Finally, with better pre-emptive maintenance, we can extend the lifetime of components and
turbines at sea, helping the industry progress to a circular, zero-waste economy.
The market opportunity for offshore wind is a compelling one: a high growth industry that is set to
grow at least seven-fold by mid-century, requiring a transformation in its operations and
maintenance as assets push into deeper, more remote and tempestuous waters. Many of the
technologies being designed for this market are adaptations of existing technologies for similar
environments in the oil and gas, shipping and nuclear industries. While offshore wind is now
becoming the catalyst for robotics innovations of its own, many of which will have applications well
beyond wind.
Offshore wind is our natural starting point for this analysis of the economic opportunity the growing
demand for robotics represents, but we have also chosen onshore wind, nuclear and offshore oil and
gas as ‘spin-off sectors’ that many of the same technologies will also find natural homes in. All these
areas represent growing markets, except for oil and gas, where we expect a decline to set in during
the mid-2040s in line with the global energy transition.
Robotics do of course have far wider application beyond energy industries, but the wind, oil and gas
and nuclear industries have been used as representing a meaningful subset of the overall potential
market, covering industries which have clear applications for these technologies.
ORE Catapult’s Role
ORE Catapult will play a key role in delivering the UK’s largest clean growth opportunity, through our
mission to accelerate the creation and growth of UK companies in the offshore renewable energy
sector. We will use our unique facilities and research and engineering capabilities to bring together
industry and academia and drive innovation in renewable energy. In this case, we work with
developers of robotic, artificial intelligence and autonomous systems under our Smart O&M
programmes that aim to spearhead a digital revolution in the offshore wind sector.
In our latest interactive brochure, you can find out more about ORE Catapult’s expanding facilities for
robotics and autonomous systems across the UK, our technology innovation and supply chain
programmes, collaborative research projects and partnerships with industry and academia. RO
Read more about ORE Catapult’s RAS facilities, services, research and technology innovation
projects.
PURPOSE OF THIS REPORT
The purpose of this research was to stimulate interest in the future market potential of robotics and
autonomous systems. The scale of this global opportunity presents a strong argument for the UK to
back the development and commercialisation of these technologies and invest in world-class
facilities for their developers.

3
It should also provide inspiration to developers working in a variety of technology areas–from data
and digital, robotics and autonomy to artificial intelligence and mission planning. Offshore wind is a
sector that is highly welcoming to cross-sector innovation, and this report gives a glimpse into how
this sector’s opportunity can open doorways into markets beyond.
IMAGE 1. Innvotek’s Amphibian demonstrates its inspection and cleaning capabilities at ORE Catapult’s
National Renewable Energy Centre in Blyth, Northumberland. This platform has a variety of applications in
the wind, shipping and oil and gas sectors.
METHODOLOGY AND MARKET BREAKDOWNS
The analysis has been conducted slightly differently for different industries depending on the
information available. Detailed analysis was conducted of the key operations and maintenance
(O&M) tasks and costs identified and costed in ORE Catapult’s in-house O&M cost model.
Offshore Wind
The cost of each task for a sample 1GW project was split into:
• Labour
• Equipment and consumables
• Vessels
For each task, an assessment was made of:

4
1. The applicability and timescales for RAS to impact or replace the task [Scale: 5-10 years; >10
years; or N/A)]
2. The cost reduction impact of RAS on labour and vessels (equipment and consumables
assumed to be unaffected) [Scale: Low 5%; Medium 20%; and High 50%]
3. The portion of the revised cost attributable to RAS [Scale: Low 2%; Medium 10%; and High
20%]
The portion of revised cost attributable to RAS (Step 3) across all tasks was aggregated to form an
estimate of the O&M spend on RAS for the sample 1GW project.
The market value of RAS in offshore wind O&M at 2030, 2040 and 2050 was estimated as the spend
per 1GW multiplied by the number of UK offshore wind GW’s in operation by each year and based on
the timescales for application (Step 1).
IMAGE 2. BladeBUG’s inspect-and-repair robot can crawl wind farm blades and is now being extended to
bolt inspections on turbine structures using an ultrasonic solution created by EchoBolt. Both technologies
were supported by ORE Catapult and have trialled at the Levenmouth Demonstration Turbine.
The market penetration in each of 2030, 2040 and 2050 of RAS in the total UK offshore wind O&M
market was estimated as RAS market value divided by total estimated market value. The resulting
estimates for market penetration in offshore wind O&M are:
2030 3.8%

5
2040 4.5%
2050 4.5%
The same levels of market penetration were applied to estimates of the offshore wind O&M markets
in the rest of Europe and Rest of World (RoW) to derive estimates of export market potential.
Table 1: Offshore wind - key inputs and estimates
Metric Unit 2030 2040 2050
Installed capacity - UK GW 35 60 100
Installed capacity - rest of Europe GW 67 147 263
Installed capacity - RoW GW 111 253 380
Installed capacity - Global GW 213 460 743
Total O&M market - UK £m 1,474 2,526 4,210
Total O&M market - rest of Europe £m 2,821 6,189 11,073
Total O&M market - RoW £m 4,674 10,652 16,000
Total O&M market - Global £m 8,968 19,368 31,284
RAS penetration % 3.8% 4.5% 4.5%
O&M RAS market - UK £m 56 113 189
O&M RAS market - rest of Europe £m 107 277 496
O&M RAS market - RoW £m 178 477 716
Offshore Wind O&M RAS market £m 341 867 1,401
Onshore Wind
The same process applied to offshore wind was carried out for onshore wind, with key differences
being:
• Vessel costs excluded to arrive at high-level estimates of onshore wind O&M costs
• Applicability of RAS reduced or excluded for many tasks as not being as relevant as offshore (for
example, RAS assumed to have similar applicability for blade maintenance activities, but much
lower or zero applicability for other turbine and balance of plant activities)
The resulting estimates for market penetration in onshore wind O&M are:
2030 2.3%

6
2040 2.4%
2050 2.4%
Key figures are shown in Table 2. Note that the onshore wind O&M cost base is lower than for
offshore wind, meaning that the penetration %s are only slightly lower than for offshore wind.
Table 2: Onshore wind - key inputs and estimates
Metric Unit 2030 2040 2050
Installed capacity - UK GW 21 29 39
Installed capacity - rest of Europe GW 229 307 415
Installed capacity - RoW GW 977 1,452 2,162
Installed capacity - Global GW 1,227 1,788 2,616
Total O&M market - UK £m 718 991 1,333
Total O&M market - rest of Europe £m 7,825 10,491 14,181
Total O&M market - RoW £m 33,385 49,617 73,878
Total O&M market - Global £m 41,928 61,098 89,392
RAS penetration % 2.3% 2.4% 2.4%
O&M RAS market - UK £m 17 24 32
O&M RAS market - rest of Europe £m 182 249 337
O&M RAS market - RoW £m 778 1,179 1,756
Onshore Wind O&M RAS market £m 977 1,452 2,124
Nuclear Energy
A higher- level approach was taken for nuclear energy. Estimates of O&M cost per MW were taken
from the 2016 Electricity Generation Cost Report from the Department for Business, Energy and
Industrial Strategy (nuclear was not updated in 2020 report) and applied to estimates of future
nuclear capacity in the UK, rest of Europe and RoW from the International Atomic Energy Agency
(Electricity and Nuclear Power Estimates for the Period up to 2050) to make an estimate of the value
of the nuclear energy O&M market.
Given the complex and hazardous nature of nuclear O&M tasks, the market penetration %s
estimated for offshore wind were applied to obtain estimates of RAS market value in 2030, 2040 and
2050.

7
The table to the right summarises the key inputs and estimates.
Table 3: Nuclear energy - key inputs and estimates
Metric Unit 2030 2040 2050
Installed capacity - UK GW 5 8 11
Installed capacity - rest of Europe GW 143 134 121
Installed capacity - RoW GW 274 344 407
Installed capacity - Global GW 422 486 539
Total O&M market - UK £m 365 583 802
Total O&M market - rest of Europe £m 10,425 9,769 8,821
Total O&M market - RoW £m 19,975 25,041 29,670
Total O&M market - Global £m 30,764 35,393 39,293
RAS penetration % 3.8% 4.5% 4.5%
O&M RAS market - UK £m 14 26 36
O&M RAS market - rest of Europe £m 396 437 395
O&M RAS market - RoW £m 760 1,121 1,329
Nuclear Energy O&M RAS market £m 1,170 1,585 1,759
Offshore Oil and Gas
A higher- level approach was taken for offshore oil & gas. Estimates of OPEX ($15 per barrel) were
applied to annual production for UK, rest of Europe and RoW. In line with work undertaken with the
Net Zero Technology Centre in 2020 looking at the North Sea, offshore oil & gas production is
assumed to decline 25% from 2030 to 2040 and by a further 25% from 2040 to 2050.
Given the similarities in working conditions between offshore wind and offshore oil & gas, the
market penetration %’s estimated for offshore wind were applied to obtain estimates of RAS market
value in 2030, 2040 and 2050. The level of penetration in oil & gas may be greater, given that most
installations are manned (while wind turbines are unmanned), so our estimates may be conservative.
Table 4: Offshore oil & gas - key inputs and estimates
Metric Unit 2030 2040 2050
Annual production - UK mbbl* 617 463 347
Annual production - rest of Europe mbbl 2,008 1,506 1,129

8
Annual production - RoW mbbl 8,326 6,244 4,683
Annual production - Global mbbl 10,950 8,213 6,159
Total O&M market - UK £m 7,000 5,250 3,938
Total O&M market - rest of Europe £m 22,781 17,086 12,814
Total O&M market - RoW £m 100,000 75,000 56,250
Total O&M market - Global £m 129,781 97,336 73,002
RAS penetration % 3.8% 4.5% 4.5%
O&M RAS market - UK £m 266 235 176
O&M RAS market - rest of Europe £m 866 765 574
O&M RAS market - RoW £m 3,802 3,358 2,519
Offshore Oil & Gas O&M RAS market £m 4,935 4,358 3,269
*mbbl = 1,000 barrels
IMAGE 3. Aberdeen’s Honuworx is developing a subsea robotic system concept, known as Loggerhead,
which will utilise an uncrewed submersible robotic vessel as a mobile power and communication hub for
ROVs and AUVs
9
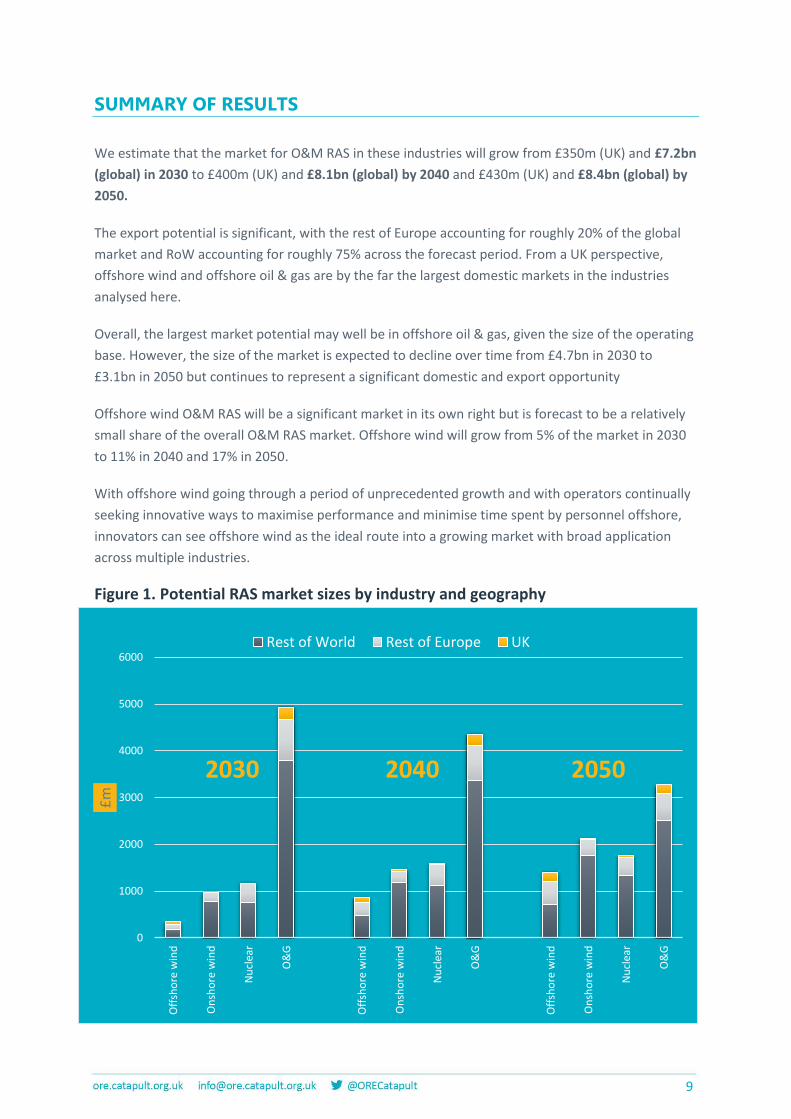
SUMMARY OF RESULTS
We estimate that the market for O&M RAS in these industries will grow from £350m (UK) and £7.2bn
(global) in 2030 to £400m (UK) and £8.1bn (global) by 2040 and £430m (UK) and £8.4bn (global) by
2050.
The export potential is significant, with the rest of Europe accounting for roughly 20% of the global
market and RoW accounting for roughly 75% across the forecast period. From a UK perspective,
offshore wind and offshore oil & gas are by the far the largest domestic markets in the industries
analysed here.
Overall, the largest market potential may well be in offshore oil & gas, given the size of the operating
base. However, the size of the market is expected to decline over time from £4.7bn in 2030 to
£3.1bn in 2050 but continues to represent a significant domestic and export opportunity
Offshore wind O&M RAS will be a significant market in its own right but is forecast to be a relatively
small share of the overall O&M RAS market. Offshore wind will grow from 5% of the market in 2030
to 11% in 2040 and 17% in 2050.
With offshore wind going through a period of unprecedented growth and with operators continually
seeking innovative ways to maximise performance and minimise time spent by personnel offshore,
innovators can see offshore wind as the ideal route into a growing market with broad application
across multiple industries.
Figure 1. Potential RAS market sizes by industry and geography market
0
1000
2000
3000
4000
5000
6000
Off
sho
re w
ind
On
sho
re w
ind
Nu
clea
r
O&
G
Off
sho
re w
ind
On
sho
re w
ind
Nu
clea
r
O&
G
Off
sho
re w
ind
On
sho
re w
ind
Nu
clea
r
O&
G
£m
Rest of World Rest of Europe UK
2030 2040 2050

10
Offshore Wind RAS Market
We estimate that the UK offshore wind O&M market for RAS will double in size from £55m in 2030 to
£110m in 2040, with a further 70% growth to £190m by 2050. Our estimates show the global export
market for RAS in offshore wind O&M growing by 160% from £285m in 2030 to £750m in 2040 and
by a further 60% by 2050 to £1.2bn
Figure 2. Potential offshore wind RAS market sizes by geography
0
200
400
600
800
1000
1200
1400
1600
2030 2040 2050
£m
Rest of World Rest of Europe UK

1
GLASGOW
ORE Catapult
Inovo
121 George Street
Glasgow
G1 1RD
BLYTH
National Renewable
Energy Centre
Offshore House
Albert Street, Blyth
Northumberland
NE24 1LZ
LEVENMOUTH
Fife Renewables Innovation
Centre (FRIC)
Ajax Way
Leven
KY8 3RS
+44 (0)333 004 1400 +44 (0)1670 359555 +44 (0)1670 357649
GRIMSBY
O&M Centre of Excellence
ORE Catapult, Port Office
Cleethorpe Road
Grimsby
DN31 3LL
ABERDEEN
Subsea UK
30 Abercrombie Court
Prospect Road, Westhill
Aberdeenshire
AB32 6FE
CORNWALL
Hayle Marine Renewables
Business Park
North Quay
Hayle, Cornwall
TR27 4DD
+44 (0)333 004 1400 07436 389067 +44 (0)1872 322 119
PEMBROKESHIRE
Marine Energy Engineering
Centre of Excellence (MEECE)
Bridge Innovation Centre
Pembrokeshire Science
& Technology Park
Pembroke Dock, Wales
SA72 6UN
CHINA
11th Floor
Lan Se Zhi Gu No. 15
Ke Ji Avenue,
Hi-Tech Zone
Yantai City
Shandong Province
China
LOWESTOFT
OrbisEnergy
Wilde Street
Lowestoft
Suffolk
NR32 1XH
+44 (0)333 004 1400 +44 (0)333 004 1400 01502 563368
Disclaimer
While the information contained in this report has been prepared and collated in good faith, ORE Catapult makes no representation
or warranty (express or implied) as to the accuracy or completeness of the information contained herein nor shall be liable for any loss or damage resultant from reliance on same.