Embed Size (px)
Citation preview
1
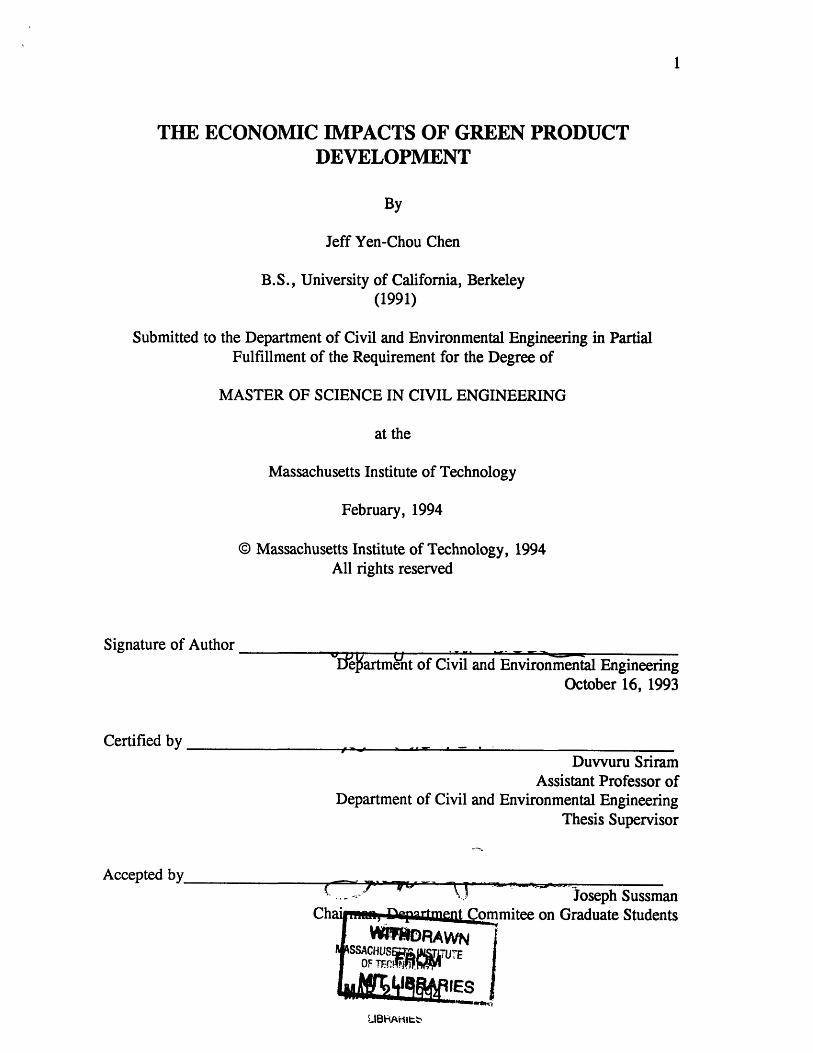
THE ECONOMIC IMPACTS OF GREEN PRODUCTDEVELOPMENT
By
Jeff Yen-Chou Chen
B.S., University of California, Berkeley(1991)
Submitted to the Department of Civil and Environmental Engineering in PartialFulfillment of the Requirement for the Degree of
MASTER OF SCIENCE IN CIVIL ENGINEERING
at the
Massachusetts Institute of Technology
February, 1994
© Massachusetts Institute of Technology, 1994All rights reserved
Signature of Author
Certified by
le1artment of Civil and Environmental EngineeringOctober 16, 1993
Duvvuru SriramAssistant Professor of
Department of Civil and Environmental EngineeringThesis Supervisor
Accepted byv Joseph Sussman , ._....!3' JIoseph Sussman
mitee on Graduate Students
$1. I,�

2
3
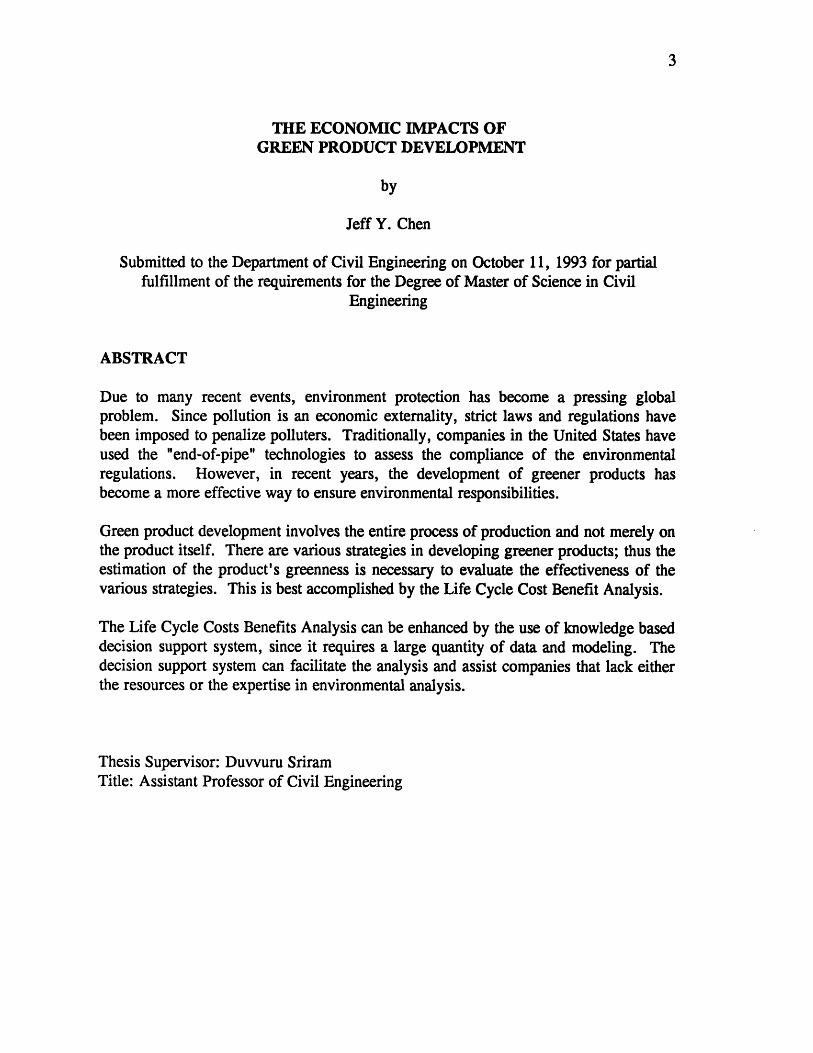
THE ECONOMIC IMPACTS OFGREEN PRODUCT DEVELOPMENT
by
Jeff Y. Chen
Submitted to the Department of Civil Engineering on October 11, 1993 for partialfulfillment of the requirements for the Degree of Master of Science in Civil
Engineering
ABSTRACT
Due to many recent events, environment protection has become a pressing globalproblem. Since pollution is an economic externality, strict laws and regulations havebeen imposed to penalize polluters. Traditionally, companies in the United States haveused the "end-of-pipe" technologies to assess the compliance of the environmentalregulations. However, in recent years, the development of greener products hasbecome a more effective way to ensure environmental responsibilities.
Green product development involves the entire process of production and not merely onthe product itself. There are various strategies in developing greener products; thus theestimation of the product's greenness is necessary to evaluate the effectiveness of thevarious strategies. This is best accomplished by the Life Cycle Cost Benefit Analysis.
The Life Cycle Costs Benefits Analysis can be enhanced by the use of knowledge baseddecision support system, since it requires a large quantity of data and modeling. Thedecision support system can facilitate the analysis and assist companies that lack eitherthe resources or the expertise in environmental analysis.
Thesis Supervisor: Duvvuru SriramTitle: Assistant Professor of Civil Engineering

4

Acknowledgments
I would like to take this opportunity to express my gratitude to Dr. DuvvuruSriram, the thesis supervisor, for his guidance and advice. I would also like to thankmy brothers, David, Jonathan, and Andy who gave me continuing support during mystudy. I thank my parents for their love and understanding, while I was away atschool. Finally, I would like to thank a special friend, Tak Kee Kwan, who stands byme during all my college and graduate school years. Thank you all.

6
7
TABLE OF CONTENTS
CHAPTER ONE
IntroductionMotivation Behind Development of "Greener Products" 10
The Concern Over the Environment 10Laws and Regulations 11Pressure from the Environmental Groups 14Pressure from the Consumers 15The Insurance Crisis 15Sense of Responsibility 16Profits from the Environmental Movements 16Maintaining Competitive Advantages 17
Objectives of the Thesis 17Organization of the Thesis 18
CHAPTER TWO
Background of Green Product DevelopmentIntroduction 19Definition of Green Products 19Micro-economic Frameworks of Green Products 20
Supply and Demand of Goods 20The Marginal Benefits and Marginal Costs of Greening of Goods 23
The Strategies in Product Development for Environmental Concerns 24Introduction 24Green Development Strategies 25
Recycling 26End of Pipe Technology 28Improve Durability of a Product 29Total Quality Management 30Energy Alternatives 30Material Usage 31Environmental Claims 32
CHAPTER THREE
Social Costs Benefits Model for Green DevelopmentIntroduction 33Social Costs of a Product 33
Damages by Pollution 35
8
Elements that Influence the Potency Factor 38Modeling and Auditing 39Sources of Data 41Amount of Pollutants 43I)amage Cost 43An Example 44An Inferior Alternative 46Life Cycle Analysis for a Product 46An Example of Life Cycle Cost Analysis 56
Social Benefits from a ProductIntroduction 57Willingness to Pay 58Easier to Obtain Funding 58Social-Economic Benefits 58Boost in Employee's Morale 59
Discount RatesIntroduction 60I)iscount Rate for Manufacturing Cost 60Social Discount Rate 60
Implementation of a Decision Support System in Estimating 61
CHAPTER FOR.
Case Study-- Disposable Diaper vs. Cloth DiaperIntroduction 63Emission Data 64Cost Data 67Emssion Cost of the Diaper Systems 70Other Considerations 72
CHAPTER FIVE
Summary and ConclusionIntroduction 74Application of the Model 74Advantages of the Model 75Disadvantages of the Model 77Final Remarks 81
REFERENCES 85

9
10
Chapter 1 Introduction
Many recent events have contributed to the need for the development of
"greener products." Most of these events are spurred by increasing public awareness of
the relationship between pollution and diseases. These events include stricter
environmental laws and regulations, pressures from the consumers and environmental
groups, lack of environmental insurance, company's own sense of responsibilities, and
to maintain a competitive edge over the competitors, and the opportunities to profit
from the environmental movements.
This chapter explains the motivation behind the development of "greener
products." Furthermore, this chapter specifies the objectives and the organization of
the thesis.
1.1 Motivation Behind the Development of "Greener Products"
1.1.1 The Concern Over the Environment
Since the late 1960s, studies concerning the effects of the environment on
human health have proliferated. These studies have shown that chronic and
degenerative diseases, which have become the leading causes of death in the developed
nations, are aggravated by air and water pollution. In addition, the presence of toxic
substances in the environment has complicated cardiac and respiratory problems.
These studies have also demonstrated the negative health effects to radiation and noise.
This substantial gain in medical knowledge has spurred the public's concern to protect
the environment.
11
1.1.2 Laws and Regulations
Pollution is an economic externality, i.e., without government intervention,
businesses are not required to bear the costs of polluting the environment. Since
factories producing pollution have little incentive to create "environmental-friendly"
methods of production, the implementation of laws and regulations is necessary to
discourage polluters.
The mounting public concerns for the environment have pressured the U.S.
government to empower organizations to protect human health and the environment and
to further study the effects of pollutants on human health and the ecology. These
organizations, along with state and local agencies, have been imposing increasingly
stricter limits on the types and the amounts of substances that a business is allowed to
emit without being penalized.
The most important agency set up by the U.S. government is the Environmental
Protection Agency (EPA). Established in 1970, the EPA has ten regional offices to
monitor environmental quality and to control pollution caused by solid wastes,
pesticides, toxic substances in air and water, hazardous wastes, and toxic chemicals.
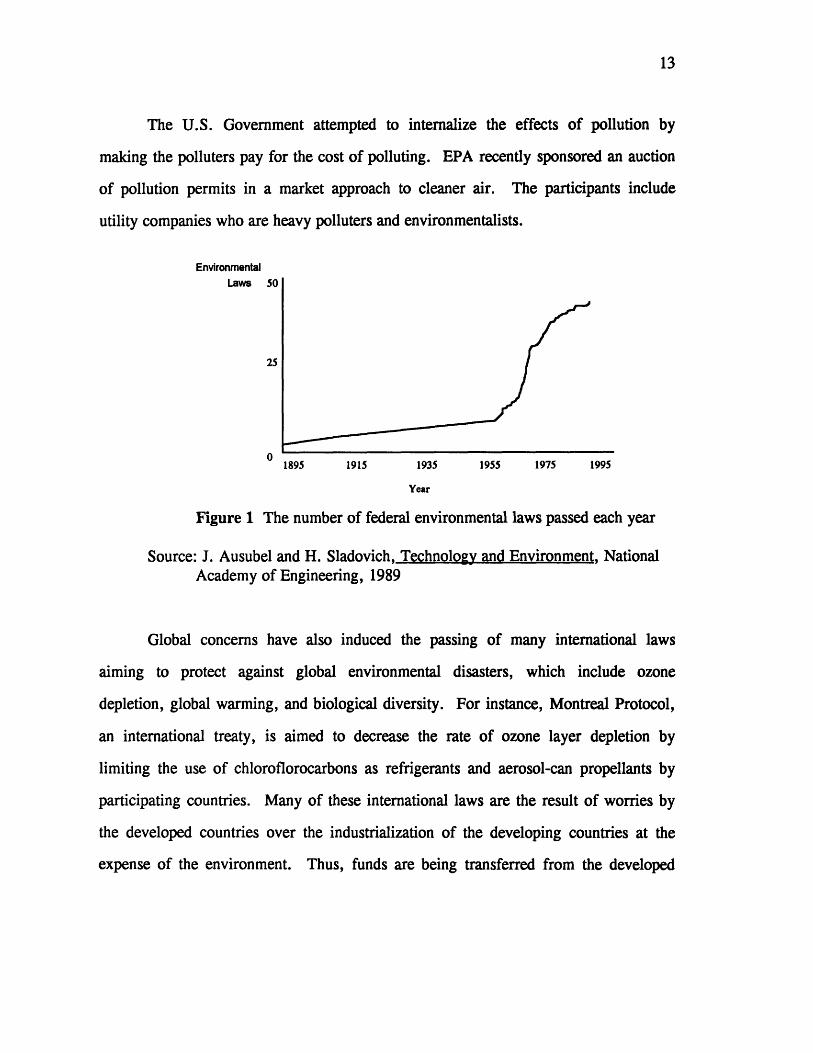
The number of laws passed by the federal government has increased many folds
in the recent period (see Figure 1). Clean Water and Clean Air Acts attempt to curb
air and water pollution by issuing permits only to those businesses that meet the set
standards and to provide the use of the best available control technology (BACT) in
controlling harmful emissions. Comprehensible Environmental Response
Compensation and Liability Act (CERCLA), also known as Superfund, was enacted in
12
1980. It requires companies that dumped hazardous wastes in the past be responsible
for cleaning up these wastes, even when these dumpings were legal at the time
[Felsenthal, 1993]. CERCLA forces companies to realize that what is legal presently
may not be legal in the future; therefore, it may sometimes be less costly in the long
run to control emission beyond what regulations require. Another implication of
CERCLA is the cradle to grave approach for toxic wastes. Companies are responsible
for the toxic wastes from the creation of the wastes to the disposal. The responsibility
continues even after another firm (such as a waste management firm) has been paid to
dump the wastes [Felsenthal, 1993]. Other regulations include disclosure of pollutants
to the Security Exchange Commission and the general public. These regulations
coupled with banks' responsibility to clean up polluted sites in case of a foreclosure
severely influence the capital firms are able to attract for future investments [Bloom, et
al., 1991]. Other state legislatures require companies to use at least certain percentages
of recycled materials in their products.
In order to make environmental quality a factor in federal project planning, the
EPA requires all U.S. government agencies to issue an environmental impact statement
on any project it plans to undertake. An environmental impact statement is a report on
the environmental effects of proposed projects that may significantly affect the
environment. The Endangered Species Act, designed to protect nearly extinct animals
and plants, has been used to block several federal projects. Recently, environmental
groups have threaten to use the Endangered Species Act to influence the logging in the
Northwest United States to protect the Spotted Owls. [Reinhardt, 1991, pl-p3]
Another important implication of the regulation is the recent trend toward more severe
measures of punishment for environmental violations. An individual knowingly
violates or authorizes the violation of the environmental laws can be subject to criminal
prosecution.
13
The U.S. Government attempted to internalize the effects of pollution by
making the polluters pay for the cost of polluting. EPA recently sponsored an auction
of pollution permits in a market approach to cleaner air. The participants include
utility companies who are heavy polluters and environmentalists.
EnvironmentalLaws 50
25
1895 1915 1935 1955 1975 1995
Year
Figure 1 The number of federal environmental laws passed each year
Source: J. Ausubel and H. Sladovich, Technology and Environment, NationalAcademy of Engineering, 1989
Global concerns have also induced the passing of many international laws
aiming to protect against global environmental disasters, which include ozone
depletion, global warming, and biological diversity. For instance, Montreal Protocol,
an international treaty, is aimed to decrease the rate of ozone layer depletion by
limiting the use of chloroflorocarbons as refrigerants and aerosol-can propellants by
participating countries. Many of these international laws are the result of worries by
the developed countries over the industrialization of the developing countries at the
expense of the environment. Thus, funds are being transferred from the developed
14
countries to help the developing countries with improving their environmental
technology.
1.1.3 Pressure from the Environmental Groups
Pressure from environmental groups, such as Green Peace, is another force that
drives firms to develop "greener products." The environmental groups not only push
for tougher regulations and controls on pollutants through lobbying, but they also
threaten the companies which manufacture environmentally unsafe products with large
law-suits. Under the U.S. environmental laws, any citizen may sue a company
administrator who fails to abide by the environmental laws.
Some environmental groups take direct and confrontational actions to influence
public decisions. Other environmental groups, such as Not In My Back Yard
(NIMBY), have effectively pushed up the cost of waste disposal by restricting the
number of solid waste disposal sites. These groups have a direct educational effect on
the consumers, i.e., they make consumers more environmentally conscious. In recent
years, these groups have become globally involved and have forced companies with
lenient environmental policies in less stringent countries to reconsider their
environmental strategies.
1 The knowledge about transferring of funds was adapted from a graduate course titled " EnvironmentalManagement", taught at the MIT Sloan School by Henry D. Jacobs.
15
1.1.4 Pressure from Consumers
Increase media coverage of environmental issues have contributed to the
public's concern for a healthy environment. Companies accused by the environmental
groups suffer not only by the lawsuits but also by the damage to their public image.
Oftentimes, the public boycotts not just the product in question but all the products that
the firm makes. McDonalds Restaurants recently replaced their styrofoam food
containers with paper containers to prevent possible boycotting by consumers [Livesey,
1990]. Exxon's image suffered tremendously when the company's ship Valdez ran
ashore in Alaska. Many consumers boycotted all Exxon products. Consumers'
awareness of environmental issues has forced many companies to reevaluate their
responsibility to their environment. Environmental groups use "green labels" as a
method of disapproving products. Products not labeled green are in risk of being
boycotted by consumers [OECD, 1991, pp.12-14]. An example of green labeling is
the dolphin-safe label on tuna products.
1.1.5 The Insurance Crisis
During the 1980's, due to the losses suffered for the payment of cleanup fees,
most insurance companies withdrew from the environmental liability market, making
companies liable responsible for their own products [Baram, 1992]. Without insurance
coverage, many companies must make greater efforts to be environmentally responsible
so to protect themselves against future environmental liabilities, or they will suffer
tremendous financial consequences.
16
1.1.6 Sense of Responsibility
Governmental regulations and pressures from environmental and consumer
groups are not the only reasons that a company may want to "go green." A sense of
responsibility to the environment also compels companies to "turn green." More
American businesses now accept the challenge of environmentalism. They aim to
achieve a balance between economic growth and a sound environment. Responsible
Care, a program set up by the chemical industry, is established by the larger chemical
companies, such as Du Pont and Dow Chemical, who feel a responsibility to the
environment [Simmon, et al., 1991].
1.1.7 Profit from Environmental Movements
Environmental consciousness can sometimes save money for companies. Some
companies find ways to develop products that minimize waste production. With
increasing cost in waste disposal, the saving can be immense. Other companies find
ways to recycle their waste. A Du Pont plant recently saved millions of dollars in
disposal costs by selling their waste to a recycling company [Buchholz, et al., 1992].
Xerox decreased packaging costs by improving their environmentally sound packaging
($2 million yearly savings), and by reusing pallets and other packaging supplies ($15
million yearly saving) [Smart, 1992]. In the mean time, other companies are
developing products that minimize material usage, thus reducing material cost and
disposal costs.
17
1.1.8 Maintaining Competitive Advantage
Because of legislatures like Consumers' Right to Know More, companies that
use certain chemicals in their manufacturing process are required to keep and report
their inventory. In addition to the enormous expense of keeping records of inventory
records, many of the companies' trade secrets are revealed. Competitors can use these
data to their advantage. This is especially true in the chemical industry. "Reverse
Engineering" can often be done to determine the formulas of products [Sheridan,
1992]. Companies that do not use or use very little of these chemicals are in an
advantageous position because they are not required to report their use of such
chemicals.
Furthermore, companies that barely comply to the environmental regulations
find themselves having to redesign their products or process periodically to keep up
with the stricter regulations that are passed each year. Companies that are ahead of the
regulations will not need to worry about violating regulations. These companies will
have advantages over companies that are behind in environmental protection.
1.2 The Objectives of the Thesis
This research intends to develop a model that measures the costs and the
benefits of products. Most of the researches in this field have focused on project by
project cases [Quinby-Hunt, et al., 1986]. Only government agencies or large firms
18
have the resources available to perform such studies. There is a need for developing a
model that utilizes a "cook-book" type approach.
There are three objectives that this thesis tries to achieve. The first objective is
to develop an inexpensive model that performs relatively quick environmental
assessment. The second objective is to make the model flexible to a product, that is
even if the product changes attributes. Third, the model one should be able to be
utilized in assessing various products.
1.3 Organization of the Thesis
Chapter Two of this thesis describes the definition and the concept of "green
products." It includes current efforts in "green product" development, and micro-
economic framework of environmental concerns. Chapter Three illustrates the life
cycle benefit cost models in assessment of a product. It includes measuring the social
costs and benefits of a product, the discounting factors in assessing cash flows that
occurred in different periods of time, and the application of the decision support system
framework. Chapter Four is a case study, which compares the environmental
soundness of two diaper systems. Finally, Chapter Five discusses the advantages and
disadvantages of the model and summarizes this thesis.
19
Chapter 2 Background of Green Product Development
2.1 Introduction
This chapter is divided into three parts. First, a formal definition of "green
products" will be presented. Second, micro-economic frameworks will be used to
argue for the importance of measuring the "greenness" of products. Finally, current
efforts and strategies in developing "greener products" will be summarized.
2.2 Definition of Green Products
Businesses and environmentalists often have different definitions of "greenness."
Most companies think that "greenness" refers to minimization of waste level within a
company. Environmentalists, on the other hand, believe "greenness" is sustainability,
which is defined by the WCED (1987) as development that meets the needs of the
present without compromising the ability of future generations to meet their own needs
[Gardner, 1989]. Besides for minimization of waste, sustainability also includes
maintaining bio-diversity, minimizing use of depletable resources, and preservation of
natural resources.
A common goal must be realized by both the industries and the
environmentalists. Industries must realize that minimization of wastes does not
necessarily make a company "green." "Greenness" relates to all the processes of a
product from manufacturing to disposal. On the other hand environmentalists must
understand that there are tradeoffs between economic growth and the environment.
Certainly, stopping all business activities will minimize all kinds of pollution; however,
20
this does not provide future generations with better living standards. Furthermore,
many specialized environmental groups are often only concern with their own causes,
thus creating conflicts between the various groups. To achieve a healthy environment,
these groups must realize that the environment encompasses all elements.
"Green product" development should focus on the entire production process and
not just on the products itself. There are numerous ways to achieve "green product"
development. All the market externalities of the product must be considered. These
market externalities include both costs, such as environmental damages, and benefits
such as job creations. The assessment of these market externalities will be discussed in
the next chapter.
2.3. Micro-economic Frameworks of Green Products
2.3.1 The Supply and Demand of Goods (Including Environmental
Considerations)
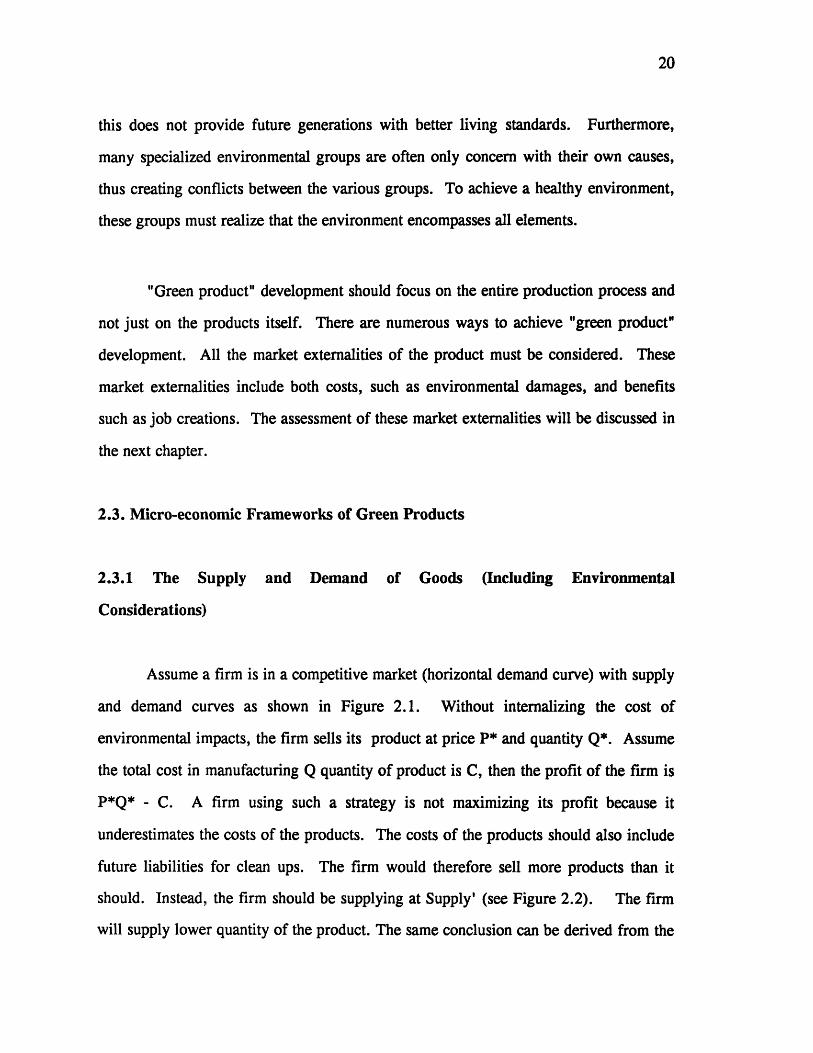
Assume a firm is in a competitive market (horizontal demand curve) with supply
and demand curves as shown in Figure 2.1. Without internalizing the cost of
environmental impacts, the firm sells its product at price P* and quantity Q*. Assume
the total cost in manufacturing Q quantity of product is C, then the profit of the firm is
P*Q* - C. A firm using such a strategy is not maximizing its profit because it
underestimates the costs of the products. The costs of the products should also include
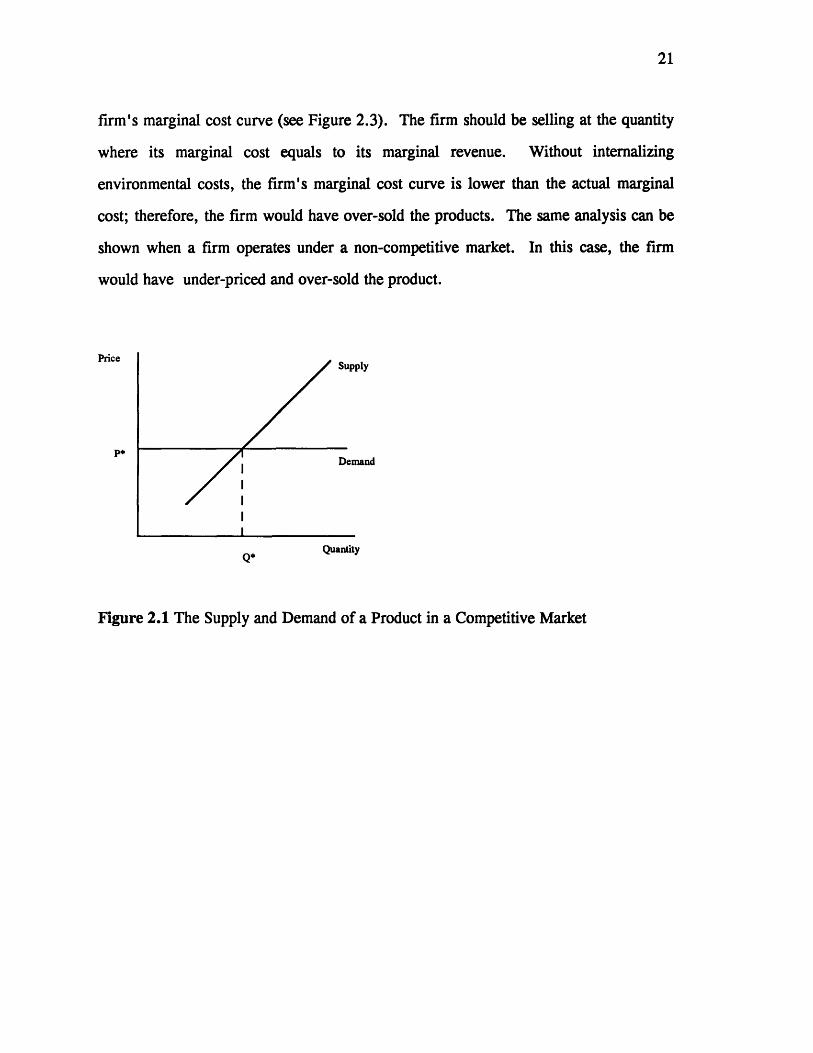
future liabilities for clean ups. The firm would therefore sell more products than it
should. Instead, the firm should be supplying at Supply' (see Figure 2.2). The firm
will supply lower quantity of the product. The same conclusion can be derived from the
21
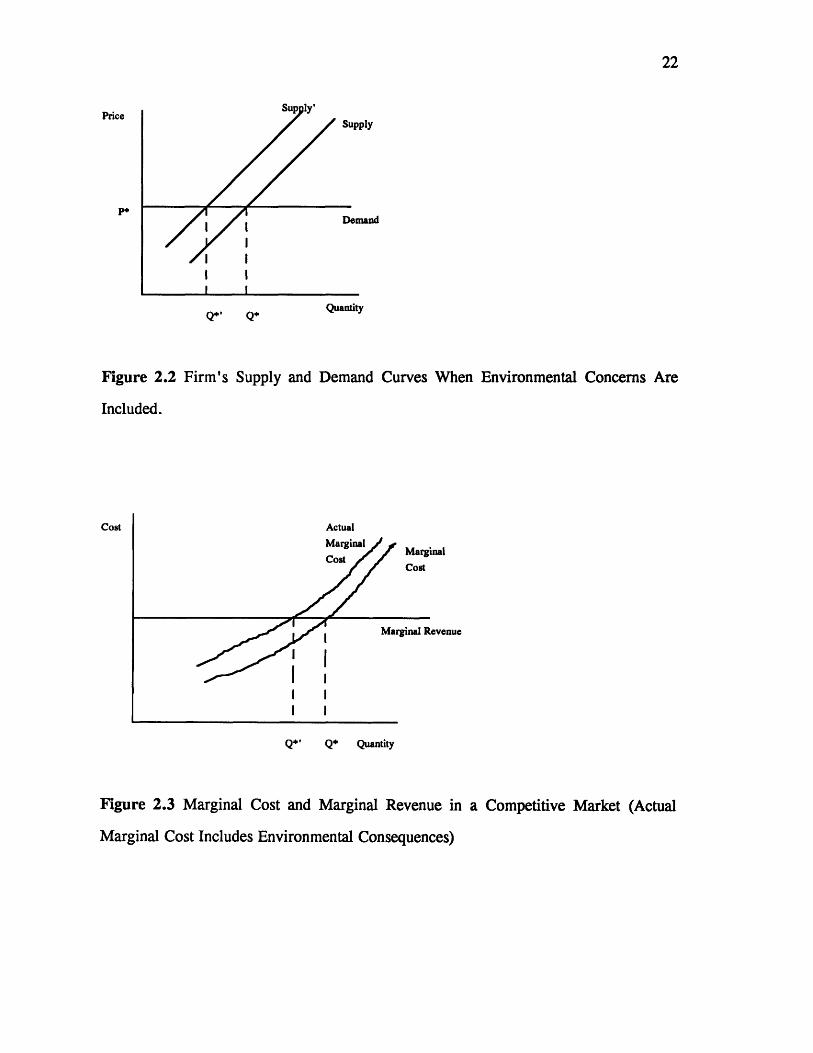
firm's marginal cost curve (see Figure 2.3). The firm should be selling at the quantity
where its marginal cost equals to its marginal revenue. Without internalizing
environmental costs, the firm's marginal cost curve is lower than the actual marginal
cost; therefore, the firm would have over-sold the products. The same analysis can be
shown when a firm operates under a non-competitive market. In this case, the firm
would have under-priced and over-sold the product.
Price
Quantity
Figure 2.1 The Supply and Demand of a Product in a Competitive Market
22
Price
P*
Supply
I I
I II I
Q' Q*
Demnand
Quantity
Figure 2.2 Firm's Supply and Demand Curves When Environmental Concerns Are
Included.
Cost
inal
Revenue
I I
I I
Q' Q* Quantity
Figure 2.3 Marginal Cost and Marginal Revenue in a Competitive Market (Actual
Marginal Cost Includes Environmental Consequences)
I
23
Since the future liabilities are unknown, the firm must estimate these liabilities
by finding the true marginal cost (marginal social cost) of the product. In the next
chapter, an attempt to assess the marginal social cost will be presented.
Consumers usually are willing to pay a premium for a "greener" product. The
premium depends on many factors. These factors will be described in the next chapter.
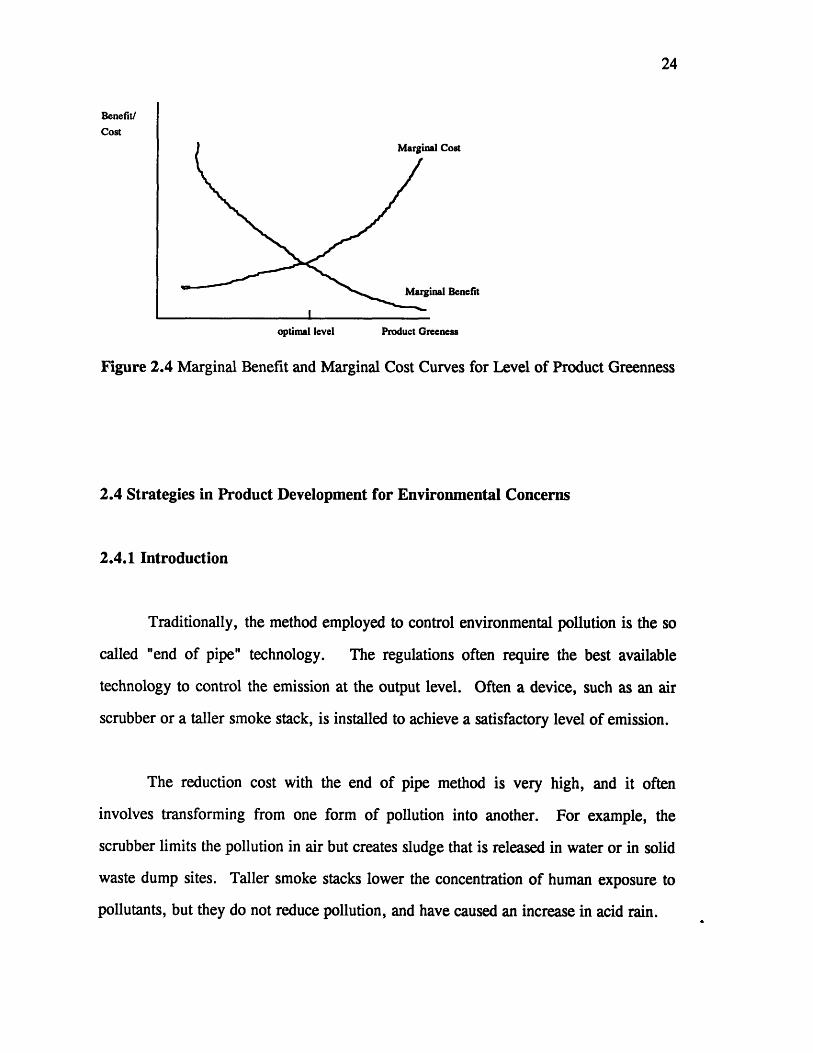
2.3.2 The Marginal Benefits and Marginal Costs of Greening of Goods
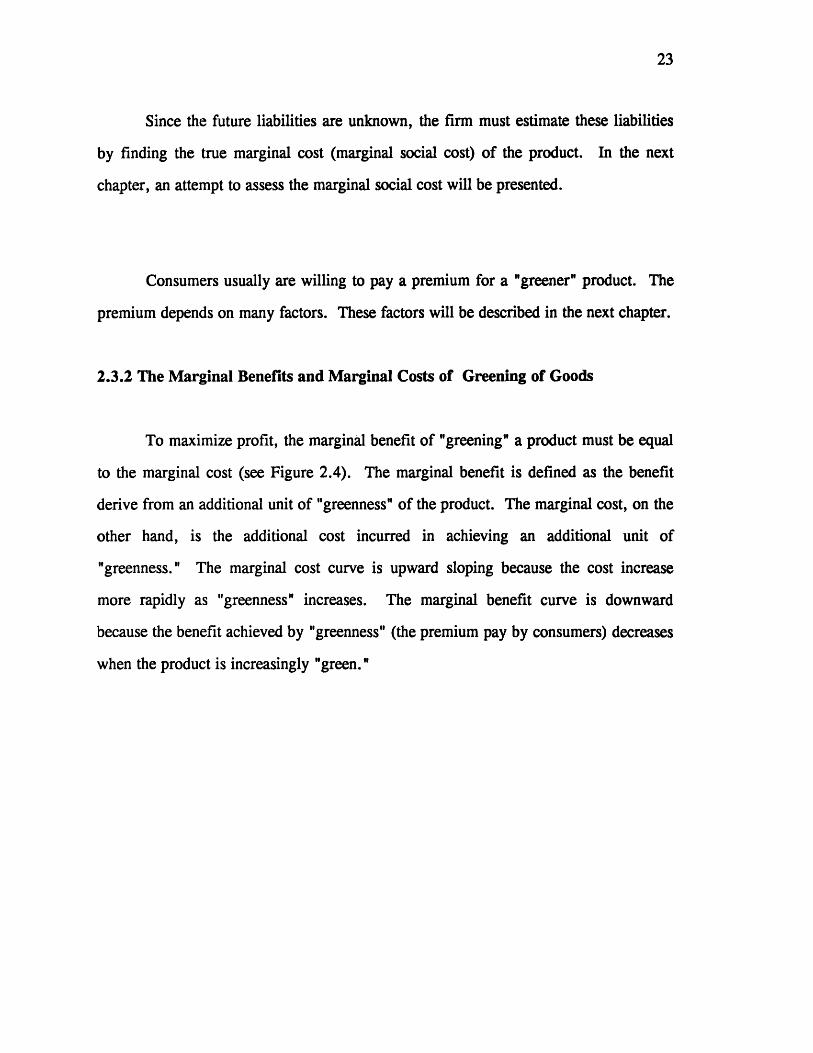
To maximize profit, the marginal benefit of "greening" a product must be equal
to the marginal cost (see Figure 2.4). The marginal benefit is defined as the benefit
derive from an additional unit of "greenness" of the product. The marginal cost, on the
other hand, is the additional cost incurred in achieving an additional unit of
"greenness." The marginal cost curve is upward sloping because the cost increase
more rapidly as "greenness" increases. The marginal benefit curve is downward
because the benefit achieved by "greenness" (the premium pay by consumers) decreases
when the product is increasingly "green."
24
Benefit/
Cost
al Cost
inal Benefit
optimal level Product Greeness
Figure 2.4 Marginal Benefit and Marginal Cost Curves for Level of Product Greenness
2.4 Strategies in Product Development for Environmental Concerns
2.4.1 Introduction
Traditionally, the method employed to control environmental pollution is the so
called "end of pipe" technology. The regulations often require the best available
technology to control the emission at the output level. Often a device, such as an air
scrubber or a taller smoke stack, is installed to achieve a satisfactory level of emission.
The reduction cost with the end of pipe method is very high, and it often
involves transforming from one form of pollution into another. For example, the
scrubber limits the pollution in air but creates sludge that is released in water or in solid
waste dump sites. Taller smoke stacks lower the concentration of human exposure to
pollutants, but they do not reduce pollution, and have caused an increase in acid rain.
I I
25
The cost of removing an additional percentage of a pollutant increases rapidly as
a greater percentage of the pollutant is removed. Use of such technologies is justified
only under the following two scenarios: first, in an old plant that does not meet the
recently adopted stricter emission requirements, and it is too expensive to replace the
old machines; second, in a product that meets the emission standards in most regions
but not in a region that has tougher requirements. Installation of the device for selling
in the region may be justified if redesigning the product costs too much, e.g., the
catalytic converter used in automobiles in regions of stricter regulations.
The most effective way to achieve environmental protection is the inclusion of
environmental policies during product development. This involves developing products
that results in the best combination of material usage, choice of material, waste
emission, and cost effectiveness without compromising the quality of the product
[Navin-Chandra, 1993]. Europe is ahead of the U.S. in the incorporation of
environmental policies in the product development phase. Design for disassembly
(DFD), an idea started in Europe, involves simplifying parts and materials to make
them easy and inexpensive to be disassembled, sorted and recycled. German
legislation recently required German car makers to take their cars back to be recycled
[Nassbaum, 1990]. Car makers, such as BMW and Opel, have developed cars that can
be easily recycled. These cars have characteristics of ease of disassembly, ease of
sorting and the use for recycled thermo-plastics [Smock, 1992].
2.4.2 Green Development Strategies
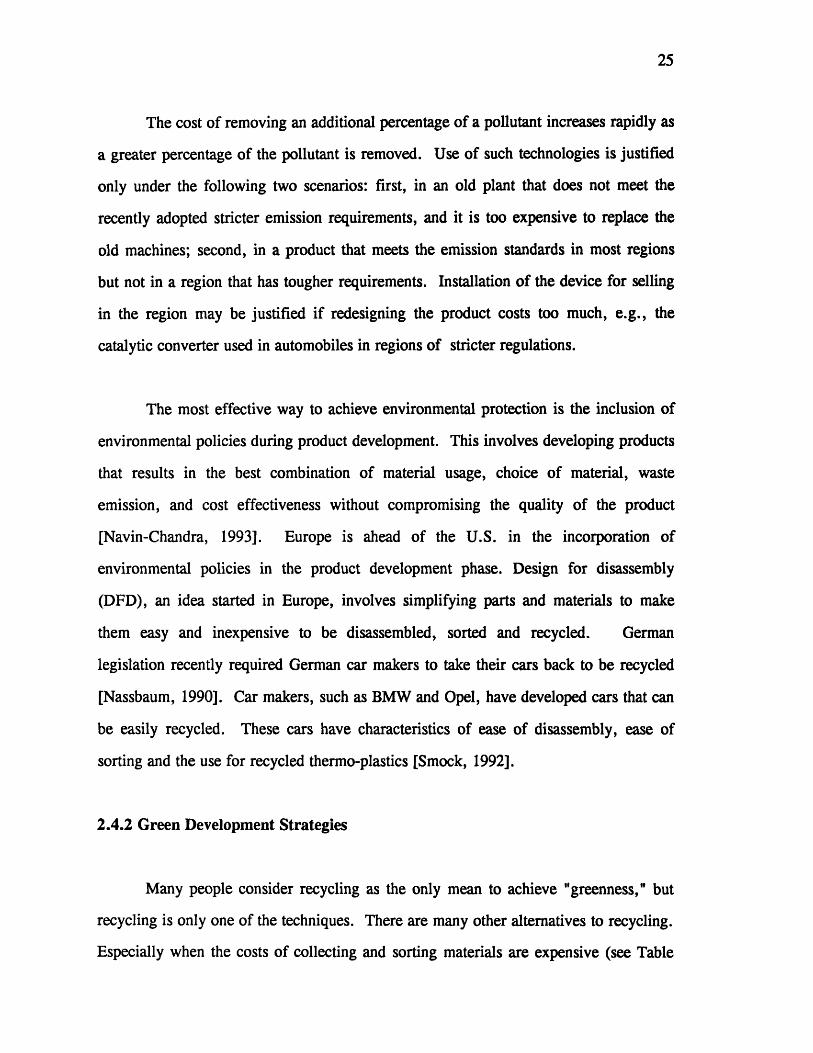
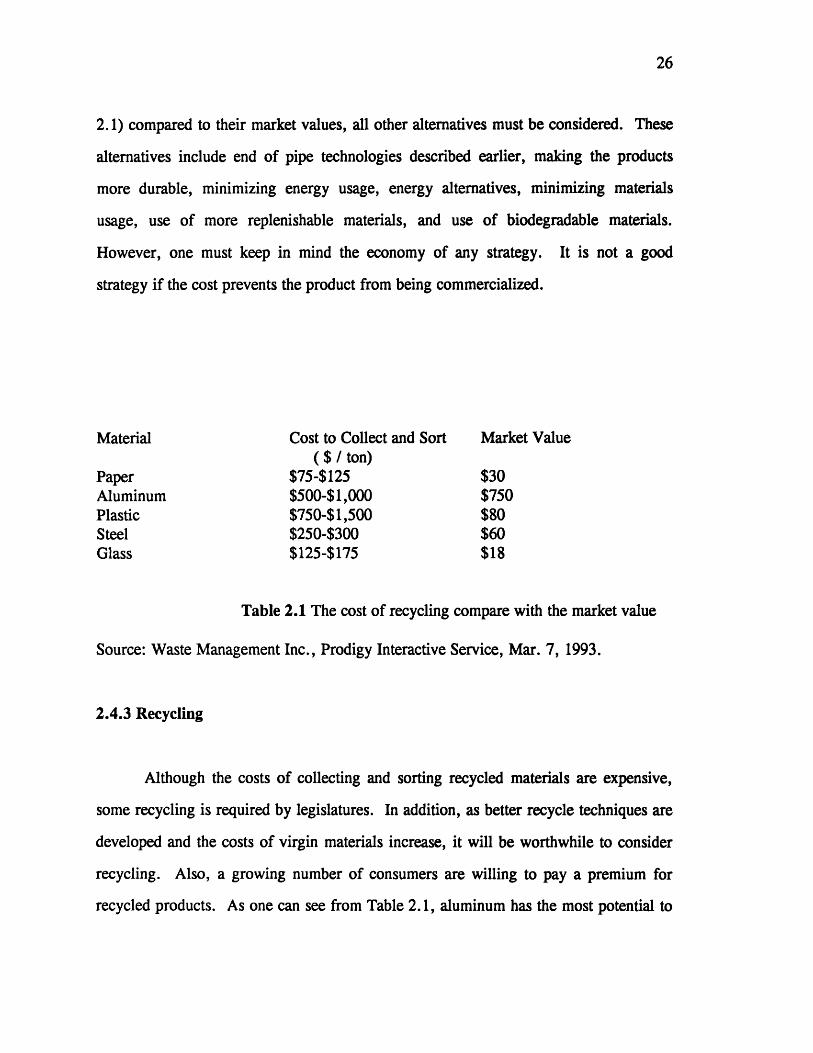
Many people consider recycling as the only mean to achieve "greenness," but
recycling is only one of the techniques. There are many other alternatives to recycling.
Especially when the costs of collecting and sorting materials are expensive (see Table
26
2.1) compared to their market values, all other alternatives must be considered. These
alternatives include end of pipe technologies described earlier, making the products
more durable, minimizing energy usage, energy alternatives, minimizing materials
usage, use of more replenishable materials, and use of biodegradable materials.
However, one must keep in mind the economy of any strategy. It is not a good
strategy if the cost prevents the product from being commercialized.
Cost to Collect and Sort($ / ton)
$75-$125$500-$1,000$750-$1,500$250-$300$125-$175
Market Value
$30$750$80$60$18
Table 2.1 The cost of recycling compare with the market value
Source: Waste Management Inc., Prodigy Interactive Service, Mar. 7, 1993.
2.4.3 Recycling
Although the costs of collecting and sorting recycled materials are expensive,
some recycling is required by legislatures. In addition, as better recycle techniques are
developed and the costs of virgin materials increase, it will be worthwhile to consider
recycling. Also, a growing number of consumers are willing to pay a premium for
recycled products. As one can see from Table 2.1, aluminum has the most potential to
Material
PaperAluminumPlasticSteelGlass
27
be considered for recycling, because the cost of collecting and sorting is the closest to
the market value; plastic has the least potential.
Recycling can be done with two methods: reuse and remanufacture. Examples
of reuse products include refillable bottles, upgradable computers, as well as auto parts
from auto junk yards. Reuse product is more efficient because there is no need to
remelt and to reshape the product. Old products are collected, cleaned, and refilled.
For example, Hewlett Packard recently began collecting their old printer cartridges to
be refilled. This method also has the advantage of allowing products to be made with
more kinds of material without having to consider if the material can be melted and
remolded. There are also disadvantages. Transportation cost often precludes bottles
from being reused. For example, the bulkiness of bottles makes it cheaper to compact
the bottle and remanufacture it. In addition, not all products can be reused.
Newspaper, for example, cannot be reused. Remanufacturing is the second and more
common method of recycling. Products are disassembled, sorted, and remanufactured
into new products. Examples are recycled paper, recycled plastic, etc.
Products that are designed to be recycled must be able to be disassembled easily
and inexpensively. There must be a well-developed recycle infrastructure to collect the
used products. State sponsored collections of bottles are more successful because of the
well developed recycle infrastructures.
Design for Disassembly (DFD) can be used to facilitate recycling. By making
products easily disassembled, consumers can sort the parts by the types of materials
which makes recycling easier. Increasingly, consumer products are made with snap-on
parts. This design not only makes disassembly easier, but it also saves material. In
addition, there is no need to clean the glue off the material. Making products with
28
uniform material is another way to make the recycling process easier. Products that are
made of uniform material and are freed of glue will not have to be disassembled before
recycling.
In addition to meeting the mandated recycling bill, an assessment must be made
to exam whether additional recycling is needed. The net cost of recycling is the
difference between the market value of the material and the cost of collecting, sorting,
and remanufacturing. The benefits are the sum of the premium that consumers are
willing to pay for the recycled product and the improvement to the company's public
image that would enable it to increase sale of its other products.
2.4.4 End of Pipe Technologies
End-of-pipe method is comparatively more expensive than other methods; thus,
when possible, it should be avoided. However, it is sometimes necessary to adopt such
strategies because of the mandated legislature or lack of other methods. As described
earlier, it is sometimes too expensive to redesign a product to fit a region with stricter
environmental laws, and it may be too expensive to replace old machinery that does not
meet the current requirements. In these cases, end-of-pipe technology is appropriate.
Sometimes, it is necessary to install additional treatments for wastewater to meet
the federal or state regulations. Wastewater treatments include screening for larger
particles and settling out suspended material in tank. Additional treatment uses bacteria
to break down organic matter, and, if necessary, the wastewater is chlorinated to kill
microorganisms. The sludge (the leftovers) is reduced in volume by dewatering or by
incineration and is disposed of in land fills. Other more effective, but also more
29
costly, methods of treatment can be used to treat wastewater to a level that meets
drinking water standards. Air pollution treatment methods include wet scrubber,
precipitator, and cyclone separator to remove particles in air.2
An interesting but controversial treatment process is the incineration of solid
waste. Local concerns over air pollution and the disposal of incinerated ash have made
it very difficult to site such facilities [Siskind, et al., 1990].
2.4.5 Improve the Durability of a Product
The durability of a product has major impacts on the environment. When a
product is built to last longer, there is less need for replacement; hence, less emission is
produced and less waste results. Furthermore, the cost of disposal is delayed until
later.
Repairability is an important factor in the durability of a product, and hence the
product's environmental soundness. Because of high labor cost, many of our consumer
products are made to be replaced rather than repaired. With increasing environmental
concerns, focus should shift back to making products that are easy and inexpensive to
be repaired.
Making a product repairable at home is one way to extent the product's life.
Another way is to make products with standardized parts. Making products with
2 The knowledge on the treatments are adapted from an undergraduate course titled Introduction toEnvironmental Engineering" taught by Professor Williamson in the Department of Civil Engineering atU.C. Berkeley.
30
standardized parts not only minimize parts inventory, but also make repairs easier and
less time consuming.
Oftentimes, products may be durable, but technological obsolescence precludes
products from being used for a prolong period of time. Upgradablility lengthen the
useful life of a product that may be obsolete otherwise.
2.4.6 Total Quality Management
Total Quality Management (TQM) can also be applied to the environmental
context. Many of the TQM methods, such as the Just in Time (JIT) method, minimize
storage of inventory and finished products. Materials are delivered right before they
are needed to be processed. This minimizes storage sites required as well as the
possibility of a disastrous event especially in dealing with the storage of chemicals and
other hazardous materials. Making products defects-free increases the durability of the
products, and saves disposal space.
2.4.7 Energy Alternative
Selecting the type of energy for manufacturing and transporting raw materials
and products is an important decision. Some alternatives to utilizing petroleum and
coal as fuel should be considered since the pollution from such fuels greatly contributes
to the urban smog problem. The energy alternatives include methane, natural gas,
water power, nuclear, solar, and wind; however, these alternatives all have their own
advantages and disadvantages.
31
2.4.8 Material Usage
Selection of materials is very important in achieving environmental soundness of
a product. Product developer must consider both the functional aspects and the
environmental aspects of a material. There are tradeoffs between these two aspects in
selecting materials. There are also tradeoffs between different environmental aspects.
For example, in the case of paper verses styrofoam, paper has the advantage of being
biodegradability, and the raw material for paper, or trees, are replenishable. However,
the continual cutting of trees has resulted in an increase in green-house gases. These
tradeoffs are sometimes hard to determine. For example, in 1990, McDonalds used
one study that showed use of Styrofoam food containers is more environmental friendly
than the use paper containers, while other studies have shown that paper is better
[Livesey, 1990].
Because our landfill wastes consist mostly of consumer packages, EPA has
mandated the requirements to reduce packaging. Many consumer product
manufacturers have switched to less packaging. For example, detergent manufactures
have now made their product more concentrated, hence, reducing packaging
requirements. Making products more compact not only saves package, but it also
requires less storage space and makes the transportation of products easier.
Materials that are environmental friendly should emit little pollutants during
extraction and production. Recyclability is another important aspect of a material.
When a material can be easily recycled, the solid wastes it generates will be
32
significantly less. In addition, extraction of virgin material, which generates more
pollution, will be unnecessary.
2.4.9 Environmental Claims
Environmental claim is an important strategy for companies. The public's
awareness today prevents any company from making false claims. Companies should
invite all the relevant and established environmental groups to test their products for the
environmental claims. Having the seal of approval, such as "ozone safe", can improve
the marketability of a product [OECD, 1990].
In product development, a firm must consider the criteria used for
environmental labeling by the environmental groups. Working closely with
environmental groups is one way to assure that the criteria imposed by the
environmental groups are used in designing products.
33
Chapter 3 Social Costs Benefits Model for Green Development
3.1 Introduction
This chapter presents the life cycle social cost benefit model, which is used to
assess the social value of a product. This chapter is divided into four parts: the social
costs of a product, the social benefits of a product, the discount rate used to calculate
present values, and the implementation of a decision support system.
3.2 The Social Costs of a Product
In the traditional business context, environmental concerns are rarely issues for
a company. Before the 1960's, when environmental costs are external to market
prices, and hence the profitability of a product, the traditional approach made sense.
However, the business enterprises are now required to pay for the social costs either
present or in the future. It is best to measure and minimize these costs now.
In assessing the best combination of the strategies to achieve "greenness," we
must have a common way to assess the cost. For example, how do we compare the
environmental soundness of a product that is 100% recyclable to a product that is made
of 100% recycled material? The assessment of a product's social value is best done by
"life cycle" costs-benefits analysis. The life-cycle of a product is depicted in Figure
3.1. Life cycle of a product consists of virgin material extraction, re-manufacturing
material, re-used material, manufacturing, useful life and disposal. Greening of a
product consists of making greater use of remanufactured or reused material, making
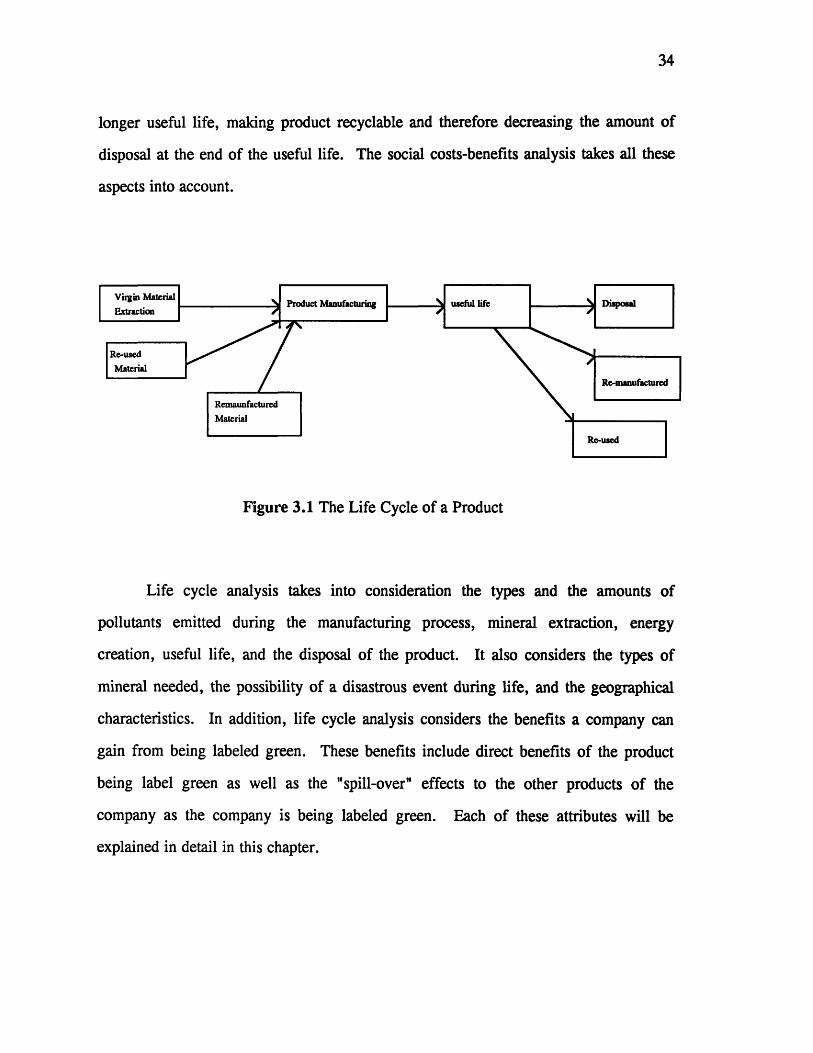
34
longer useful life, making product recyclable and therefore decreasing the amount of
disposal at the end of the useful life. The social costs-benefits analysis takes all these
aspects into account.
Figure 3.1 The Life Cycle of a Product
Life cycle analysis takes into consideration the types and the amounts of
pollutants emitted during the manufacturing process, mineral extraction, energy
creation, useful life, and the disposal of the product. It also considers the types of
mineral needed, the possibility of a disastrous event during life, and the geographical
characteristics. In addition, life cycle analysis considers the benefits a company can
gain from being labeled green. These benefits include direct benefits of the product
being label green as well as the "spill-over" effects to the other products of the
company as the company is being labeled green. Each of these attributes will be
explained in detail in this chapter.
35
3.2.2 the Damages by pollution
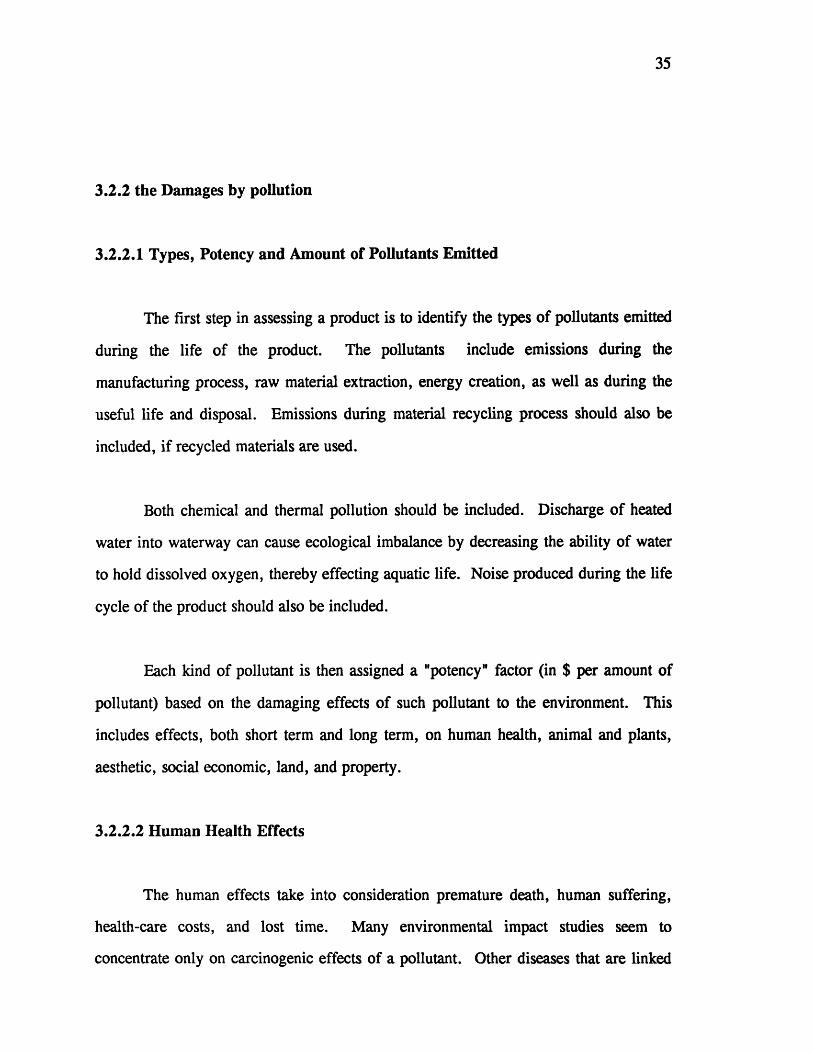
3.2.2.1 Types, Potency and Amount of Pollutants Emitted
The first step in assessing a product is to identify the types of pollutants emitted
during the life of the product. The pollutants include emissions during the
manufacturing process, raw material extraction, energy creation, as well as during the
useful life and disposal. Emissions during material recycling process should also be
included, if recycled materials are used.
Both chemical and thermal pollution should be included. Discharge of heated
water into waterway can cause ecological imbalance by decreasing the ability of water
to hold dissolved oxygen, thereby effecting aquatic life. Noise produced during the life
cycle of the product should also be included.
Each kind of pollutant is then assigned a "potency" factor (in $ per amount of
pollutant) based on the damaging effects of such pollutant to the environment. This
includes effects, both short term and long term, on human health, animal and plants,
aesthetic, social economic, land, and property.
3.2.2.2 Human Health Effects
The human effects take into consideration premature death, human suffering,
health-care costs, and lost time. Many environmental impact studies seem to
concentrate only on carcinogenic effects of a pollutant. Other diseases that are linked
36
to pollution, such as reproductive effects and neurological effects, are largely ignored
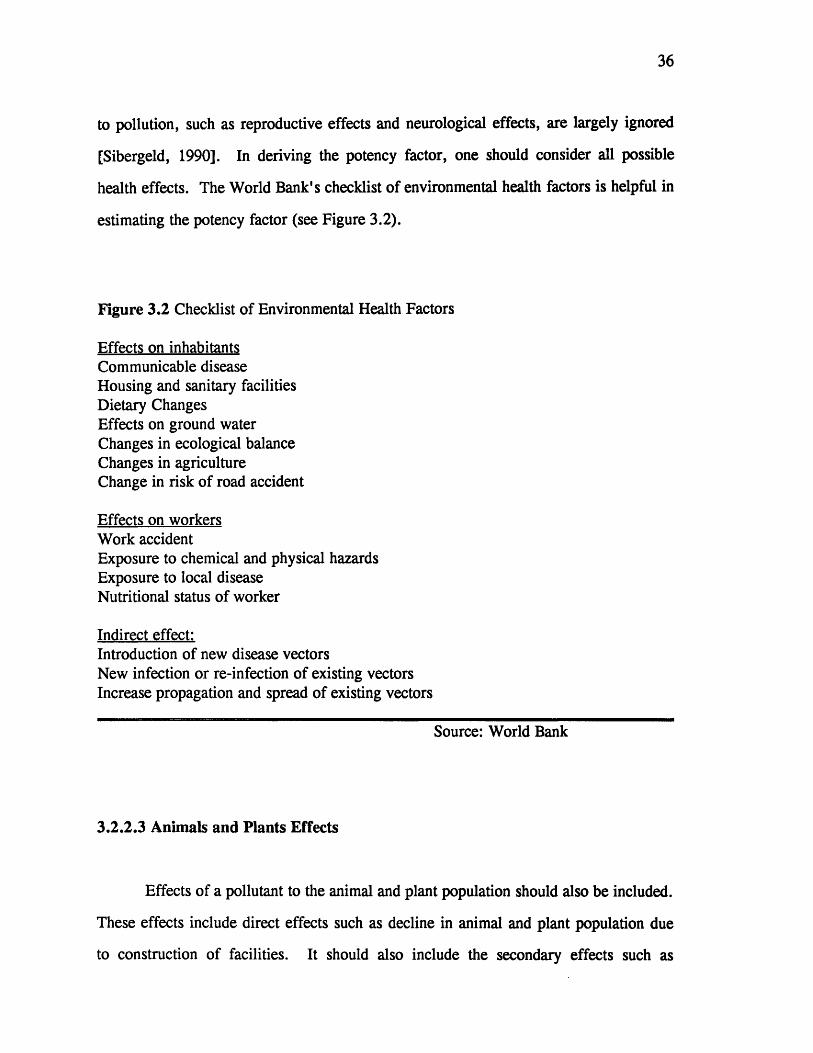
[Sibergeld, 1990]. In deriving the potency factor, one should consider all possible
health effects. The World Bank's checklist of environmental health factors is helpful in
estimating the potency factor (see Figure 3.2).
Figure 3.2 Checklist of Environmental Health Factors
Effects on inhabitantsCommunicable diseaseHousing and sanitary facilitiesDietary ChangesEffects on ground waterChanges in ecological balanceChanges in agricultureChange in risk of road accident
Effects on workersWork accidentExposure to chemical and physical hazardsExposure to local diseaseNutritional status of worker
Indirect effect:Introduction of new disease vectorsNew infection or re-infection of existing vectorsIncrease propagation and spread of existing vectors
Source: World Bank
3.2.2.3 Animals and Plants Effects
Effects of a pollutant to the animal and plant population should also be included.
These effects include direct effects such as decline in animal and plant population due
to construction of facilities. It should also include the secondary effects such as
37
disruption of the food chains for other animals. The pollution that damages animals
and plants can often transfer to humans. For example, pollution causes high level of
toxins accumulating in the tissue of many species of the fishes. Eating these species of
fish will transfer the toxins to human. In addition, lose to agriculture and domestic
animals should be considered.
3.2.2.4 Aesthetic Effects
Loses in landscapes aesthetics due to the construction of factories or other
facilities should also be included. The effects include the loss in tourism, local
residents' view, etc. Moreover, the decrease in visibility caused by urban smog and
other pollution may contribute to an increase in auto accidents.
3.2.2.5 Social Effects
The pollution and the unsightly views of factories may induce people to move
out of the area. The cost and inconvenience in moving should also be taken into
consideration.
3.2.2.6 Land and Property Effects
The pollutants may and are likely to deteriorate local buildings and properties,
making their values decline. The decrease in value of the properties caused by the
pollutant must also be included.
38
3.2.2.7 Longer Term Effects
The factors should also include the contributions to long term effects such as
global warming and breaking of ozone layer. These effects are the most difficult to
estimate.
3.2.3 Elements that influence the potency factor
3.2.3.1 Population, Terrain, Weather and Location
The potency factor varies in different geographical regions as the damages are
different. The factor is influenced by the population within the vicinity of emission,
the terrain (possibility of trapping the pollutants in a basin, the possibility of soil
erosion and the contamination of ground water), the weather (wind, temperature,
humidity that either transport the pollutant or facilitates the chemical reactions by the
pollutant) and the availability and the proximity of solid waste disposal sites. Other
contributions to the potency factor include the concentration of the pollutant already in
the environment, and the concentration of its chemical reagents.
3.2.3.2 Methods of Emission
The potency factor is also influenced by the way the pollutants are emitted.
Same pollutants may have different damaging effects depending on the methods of
39
emission. Emission from a higher smoke stack may decrease the effects of the
pollutants.
3.2.4 Modeling and Auditing
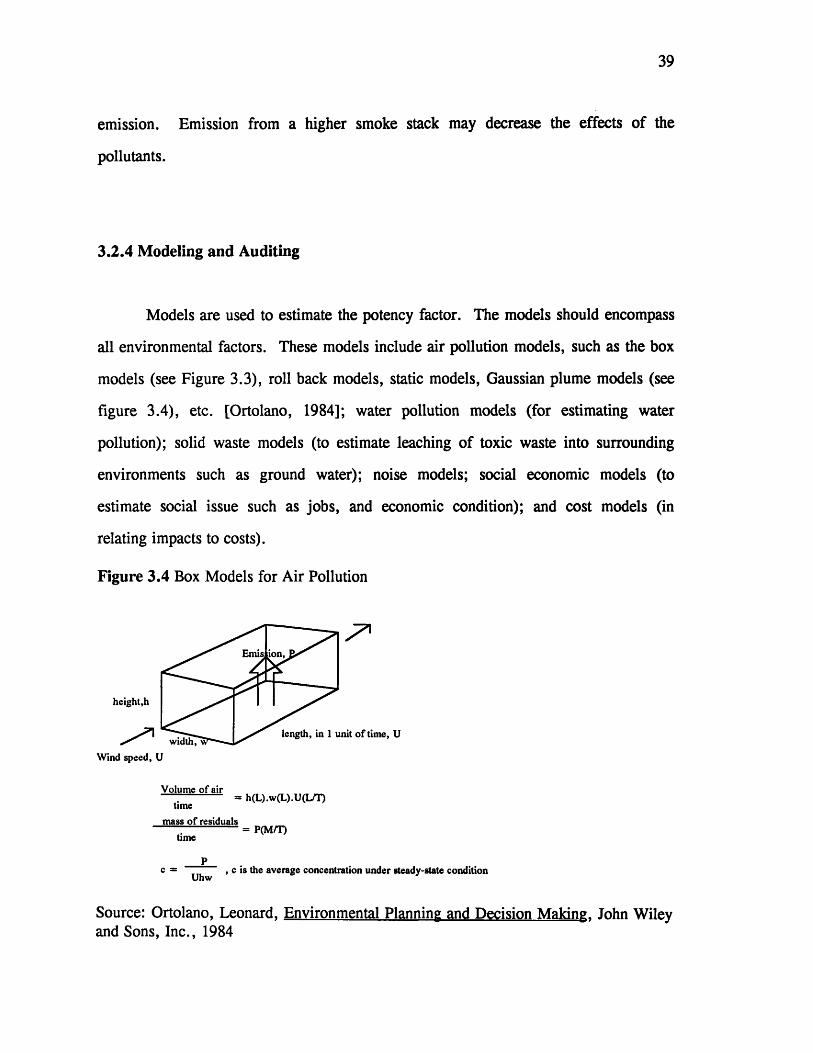
Models are used to estimate the potency factor. The models should encompass
all environmental factors. These models include air pollution models, such as the box
models (see Figure 3.3), roll back models, static models, Gaussian plume models (see
figure 3.4), etc. [Ortolano, 1984]; water pollution models (for estimating water
pollution); solid waste models (to estimate leaching of toxic waste into surrounding
environments such as ground water); noise models; social economic models (to
estimate social issue such as jobs, and economic condition); and cost models (in
relating impacts to costs).
Figure 3.4 Box Models for Air Pollution
17
nit of time, U
Wind speed, U
Volume of air= h(L).w(L).U(L/T)
time
mass of residuals= P(M/T)
time
c = ' c is the average concentration under steady-state conditionUhw
Source: Ortolano, Leonard, Environmental Planning and Decision Making, John Wileyand Sons, Inc., 1984
height,h
40
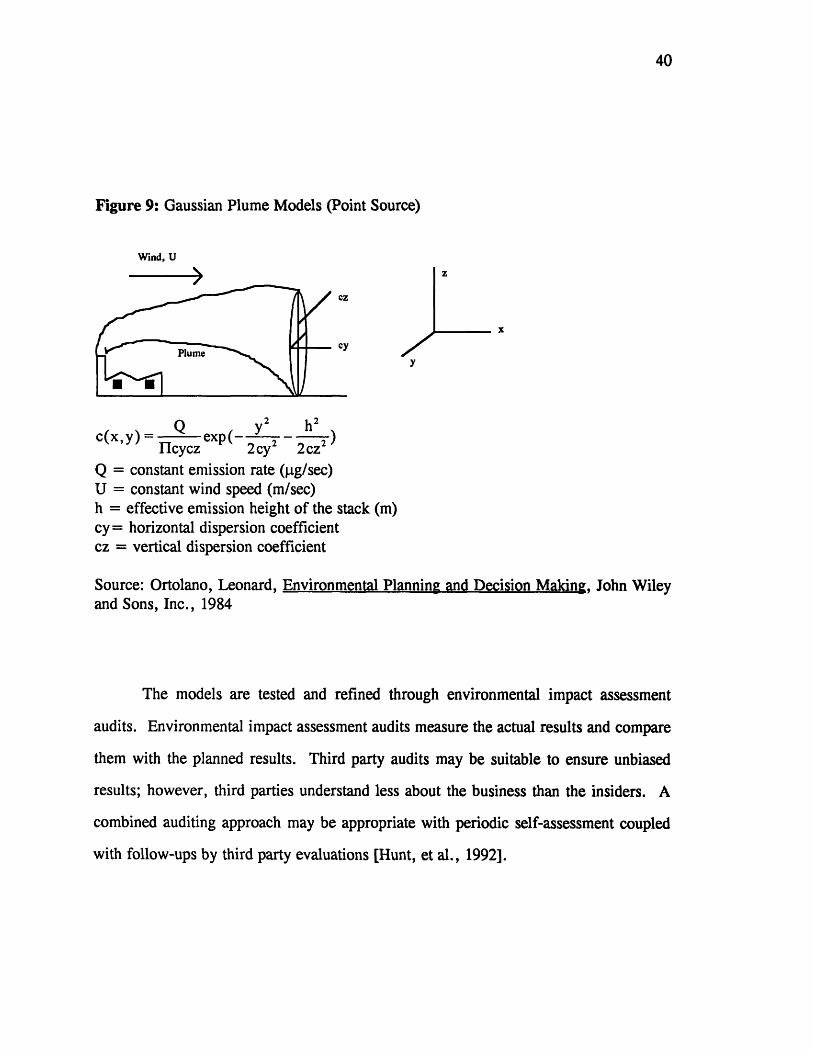
Figure 9: Gaussian Plume Models (Point Source)
Wind, U
x
Y
Q ___2 h2c(x,y)= Q exp(- 2 2Cflcycz 2cy2 2cz2
Q = constant emission rate (g/sec)U = constant wind speed (m/sec)h = effective emission height of the stack (m)cy= horizontal dispersion coefficientcz = vertical dispersion coefficient
Source: Ortolano, Leonard, Environmental Planning and Decision Making, John Wileyand Sons, Inc., 1984
The models are tested and refined through environmental impact assessment
audits. Environmental impact assessment audits measure the actual results and compare
them with the planned results. Third party audits may be suitable to ensure unbiased
results; however, third parties understand less about the business than the insiders. A
combined auditing approach may be appropriate with periodic self-assessment coupled
with follow-ups by third party evaluations [Hunt, et al., 1992].
4Z
i
41
3.2.5 Sources of Data
The sources of data necessary to estimate the medical costs and premature
deaths, caused by pollutants resulted from both animal research and human research.
Animal research is done by injecting chemicals into animals and detecting and
measuring the harm of the diseases. Extrapolation is required to translate the results
into human effects. Direct human tests are very difficult to conduct. Often, the
researches consist of statistical analysis of disease cases between different cities, with
different pollution level, between urban and rural areas, between different time periods
of the same city, and between workers of different industries. The data is often poor,
especially in assessing non-cancer diseases [Sibergeld, 1990].
In cases where the pollution are more local, such as thermal pollution, the
effects of the pollution are easier to estimate. However in most cases, the estimation of
the potency factor is very difficult because the effects can travel very far. In addition,
many of these damaging effects are not very well understood. For example, many
pollutants are carcinogenic to animals in high dosage in a short period of time, but their
effects in human in low dosage and longer periods of time are not known [Ames, et al.,
1990]. The weakness is mainly due to the lack of human data and the fact that many of
the carcinogens work slowly.
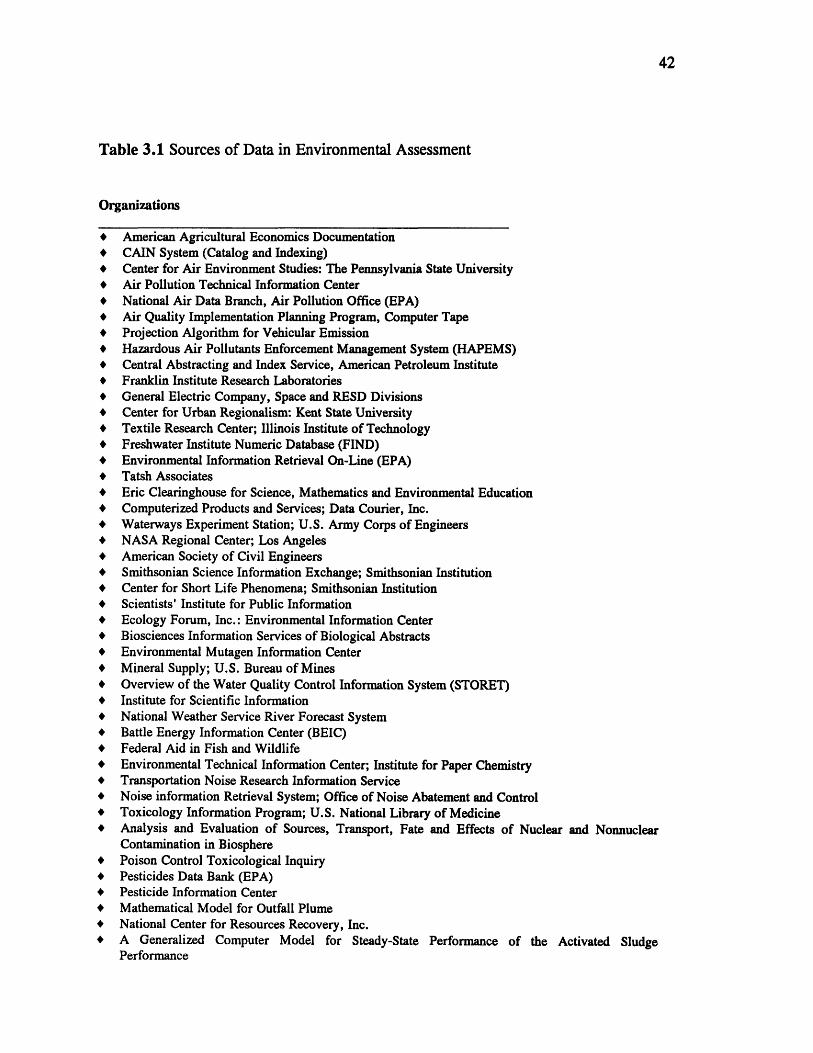
Some sources of data are shown on Table 3.1. There are great difficulties in
the collection of the data because the data is scattered in various agencies and
organizations.
42
Table 3.1 Sources of Data in Environmental Assessment
Organizations
* American Agricultural Economics Documentation* CAIN System (Catalog and Indexing)* Center for Air Environment Studies: The Pennsylvania State University* Air Pollution Technical Information Center* National Air Data Branch, Air Pollution Office (EPA)* Air Quality Implementation Planning Program, Computer Tape* Projection Algorithm for Vehicular Emission* Hazardous Air Pollutants Enforcement Management System (HAPEMS)* Central Abstracting and Index Service, American Petroleum Institute* Franklin Institute Research Laboratories* General Electric Company, Space and RESD Divisions* Center for Urban Regionalism: Kent State University* Textile Research Center; Illinois Institute of Technology* Freshwater Institute Numeric Database (FIND)* Environmental Information Retrieval On-Line (EPA)* Tatsh Associates* Eric Clearinghouse for Science, Mathematics and Environmental Education* Computerized Products and Services; Data Courier, Inc.* Waterways Experiment Station; U.S. Army Corps of Engineers* NASA Regional Center; Los Angeles* American Society of Civil Engineers* Smithsonian Science Information Exchange; Smithsonian Institution* Center for Short Life Phenomena; Smithsonian Institution* Scientists' Institute for Public Information* Ecology Forum, Inc.: Environmental Information Center* Biosciences Information Services of Biological Abstracts* Environmental Mutagen Information Center* Mineral Supply; U.S. Bureau of Mines* Overview of the Water Quality Control Information System (STORET)* Institute for Scientific Information* National Weather Service River Forecast System* Battle Energy Information Center (BEIC)* Federal Aid in Fish and Wildlife* Environmental Technical Information Center; Institute for Paper Chemistry* Transportation Noise Research Information Service* Noise information Retrieval System; Office of Noise Abatement and Control* Toxicology Information Program; U.S. National Library of Medicine* Analysis and Evaluation of Sources, Transport, Fate and Effects of Nuclear and Nonnuclear
Contamination in Biosphere* Poison Control Toxicological Inquiry* Pesticides Data Bank (EPA)* Pesticide Information Center* Mathematical Model for Outfall Plume* National Center for Resources Recovery, Inc.* A Generalized Computer Model for Steady-State Performance of the Activated Sludge
Performance
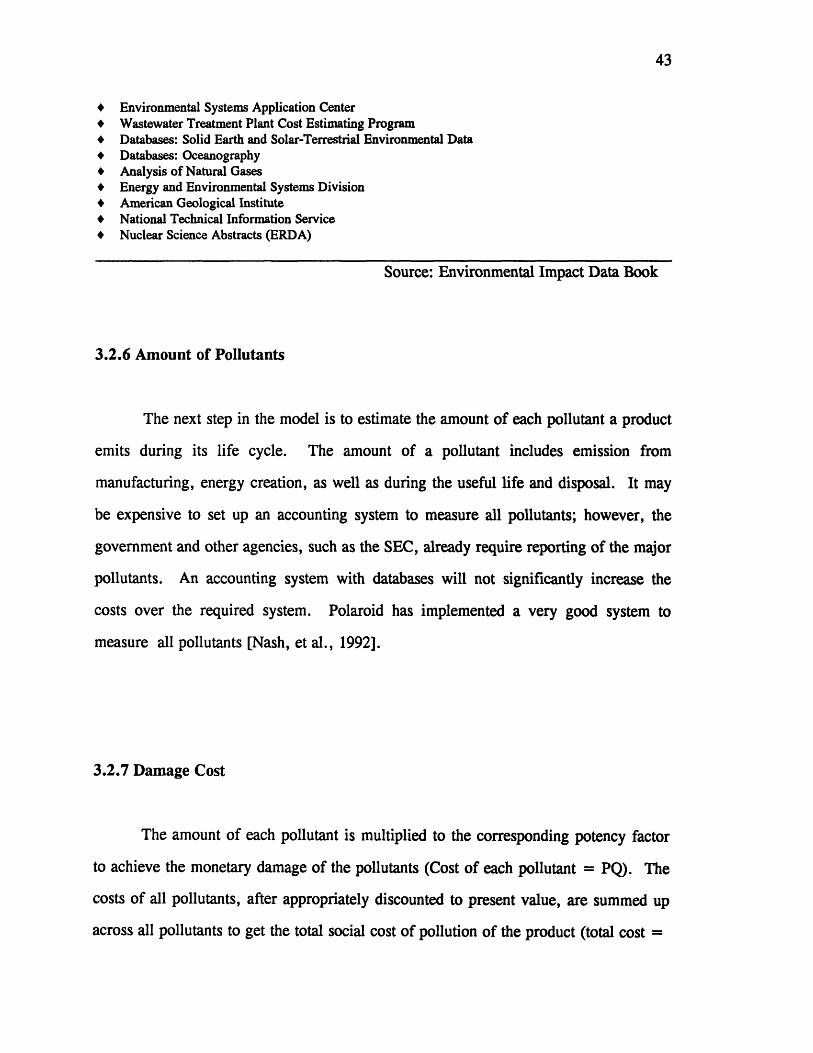
43
* Environmental Systems Application Center* Wastewater Treatment Plant Cost Estimating Program* Databases: Solid Earth and Solar-Terrestrial Environmental Data* Databases: Oceanography* Analysis of Natural Gases* Energy and Environmental Systems Division* American Geological Institute* National Technical Information Service* Nuclear Science Abstracts (ERDA)
Source: Environmental Impact Data Book
3.2.6 Amount of Pollutants
The next step in the model is to estimate the amount of each pollutant a product
emits during its life cycle. The amount of a pollutant includes emission from
manufacturing, energy creation, as well as during the useful life and disposal. It may
be expensive to set up an accounting system to measure all pollutants; however, the
government and other agencies, such as the SEC, already require reporting of the major
pollutants. An accounting system with databases will not significantly increase the
costs over the required system. Polaroid has implemented a very good system to
measure all pollutants [Nash, et al., 1992].
3.2.7 Damage Cost
The amount of each pollutant is multiplied to the corresponding potency factor
to achieve the monetary damage of the pollutants (Cost of each pollutant = PQ). The
costs of all pollutants, after appropriately discounted to present value, are summed up
across all pollutants to get the total social cost of pollution of the product (total cost =
44
E PQ). Discounting is very important because not all pollutants are emitted at the
same time. Some pollution, such as the disposal of products, are done years after the
emissions of pollutants during manufacturing. Discount rates will be discussed in
Section 3.4.
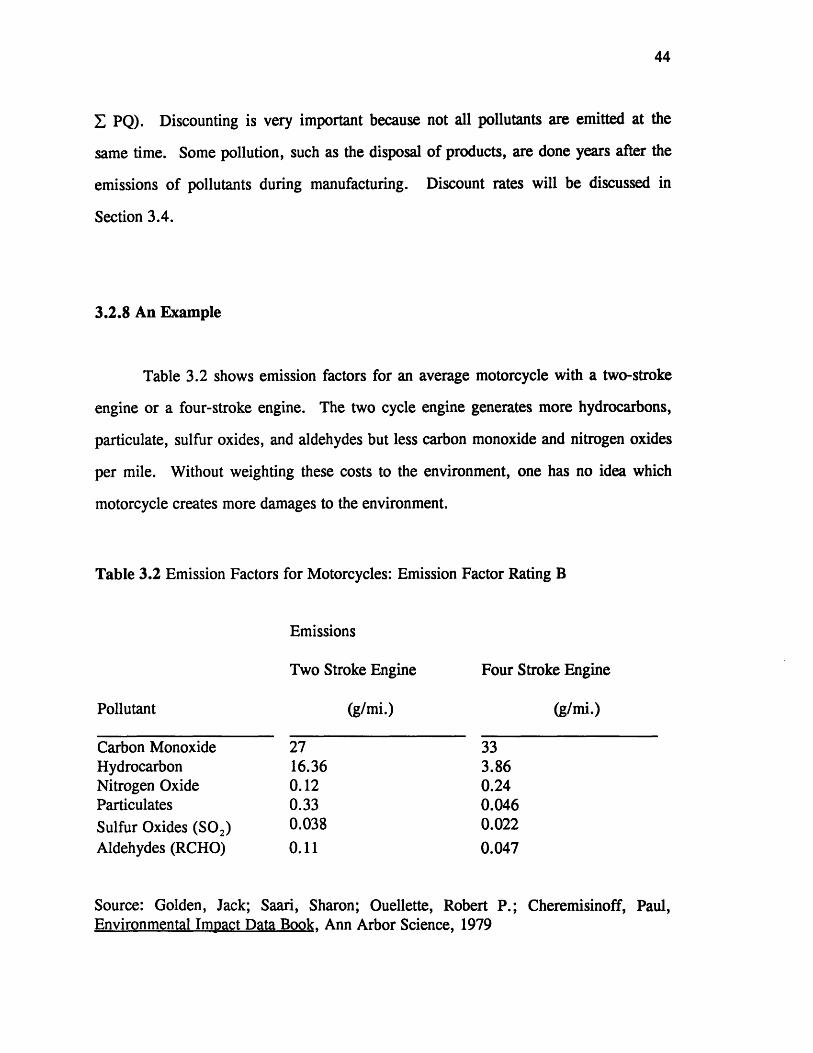
3.2.8 An Example
Table 3.2 shows emission factors for an average motorcycle with a two-stroke
engine or a four-stroke engine. The two cycle engine generates more hydrocarbons,
particulate, sulfur oxides, and aldehydes but less carbon monoxide and nitrogen oxides
per mile. Without weighting these costs to the environment, one has no idea which
motorcycle creates more damages to the environment.
Table 3.2 Emission Factors for Motorcycles: Emission Factor Rating B
Emissions
Two Stroke Engine Four Stroke Engine
Pollutant (g/mi.) (g/mi.)
Carbon Monoxide 27 33Hydrocarbon 16.36 3.86Nitrogen Oxide 0.12 0.24Particulates 0.33 0.046
Sulfur Oxides (SO2) 0.038 0.022
Aldehydes (RCHO) 0.11 0.047
Source: Golden, Jack; Saari, Sharon; Ouellette, Robert P.; Cheremisinoff, Paul,Environmental Impact Data Book, Ann Arbor Science, 1979
45
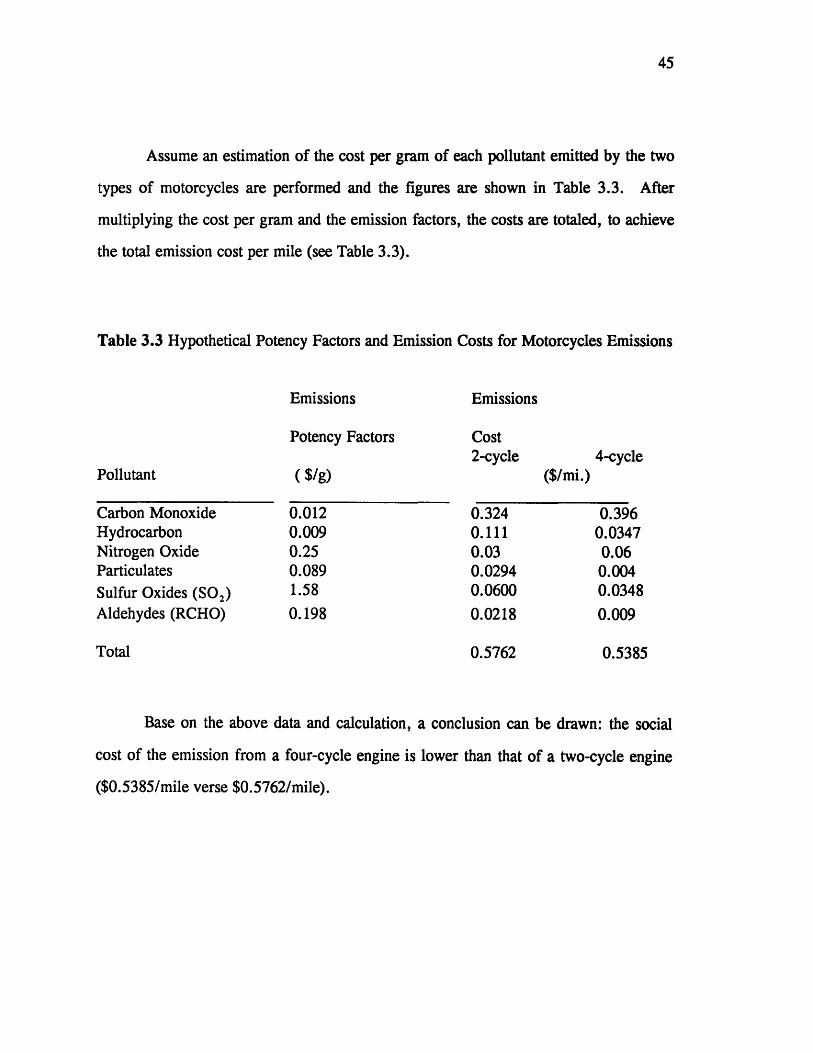
Assume an estimation of the cost per gram of each pollutant emitted by the two
types of motorcycles are performed and the figures are shown in Table 3.3. After
multiplying the cost per gram and the emission factors, the costs are totaled, to achieve
the total emission cost per mile (see Table 3.3).
Table 3.3 Hypothetical Potency Factors and Emission Costs for Motorcycles Emissions
Emissions Emissions
Potency Factors Cost2-cycle 4-cycle
Pollutant ($/g) ($/mi.)
Carbon Monoxide 0.012 0.324 0.396Hydrocarbon 0.009 0.111 0.0347Nitrogen Oxide 0.25 0.03 0.06Particulates 0.089 0.0294 0.004Sulfur Oxides (SO2) 1.58 0.0600 0.0348Aldehydes (RCHO) 0.198 0.0218 0.009
Total 0.5762 0.5385
Base on the above data and calculation, a conclusion can be drawn: the social
cost of the emission from a four-cycle engine is lower than that of a two-cycle engine
($0.5385/mile verse $0.5762/mile).
46
3.2.9 An Inferior Alternative
Due to the difficulties in obtaining the potency factor, some authors have
recommended the use of compliance cost [Bailey, 1991]. Using compliance cost is
much easier than using social cost analysis. The cost of materials, for example, would
simply just be the sale prices if the vendors are complying with the regulations.
However, using the compliance cost may underestimate the actual cost because firms
may be required to clean up in the future. In addition, compliance cost excludes the
cost of pollution that is emitted during energy creation; therefore, it may underestimate
the importance of conserving energy. It also does not consider emissions during use
and disposal. So when using compliance cost, all the above factors should be included.
Furthermore, environmental regulatory agencies now considers cradle to grave
approach in determining the social responsibilities of a company. Merely using
compliance cost may induce a company to pick the least socially responsible material
vendors because of lower prices of the materials. Besides, only complying with the
regulations may not be enough. There is a need to go beyond compliance.
3.2.10 Life Cycle Analysis of a Product
The social costs of each stage of a product's life cycle are aggregated and
summed together with the manufacturing costs to make up the total cost of a product.
These costs will be described in detail in this section (see Figure 3.1 again for life cycle
of a product).
47
3.2.10.1 From Material Extraction to Manufacturing
When a product requires any virgin material to be manufactured, the social
impact of material extraction must be estimated. These materials include direct
material in making the product and any agents used to process the product. These costs
include energy usage, pollution emissions during extraction and transportation,
opportunity cost, and the cost of the material including direct transportation cost of the
material.
3.2.10.1.1 Energy Usage
The pollution emitted during to the creation of energy used for extracting raw
material should be considered. For example, if electricity is used, pollutants emitted
during the creation of the electricity must be considered. The cost is equal to the
potency factor of the each pollutant multiplied by the corresponding amount of the
pollutant released during the creation of the energy.
Cost = PiQ1 Pi: the potency factor of ith pollutantemitted during the extraction of virgin rawmaterial
Qi: the amount of ith pollutant emittedduring the extraction of raw material.
48
3.2.10.1.2 Extracting and Transporting Process
Pollution also occurs during the extraction of material. For example, trucking
raw materials from extracting site to the factory pollutes the environment. The cost of
this pollution must be determined.
Cost= PQi Pi: the potency factor of eachpollutant emitted during theextracting and transporting of rawmaterials.
Qi: the quantify of each pollutantemitted during the same process
3.2.10.1.3 Opportunity Costs
The opportunity costs are the benefits forgone if the material were extracted.
For example, cutting down trees for lumber damages environment in other ways than
pollution. The trees could have absorbed carbon dioxide which contributes to global
warming. The trees also make the sites more pleasant to the eyes. Furthermore,
animals populations may decrease because their living places are destroyed. Therefore,
it is important to consider the geographical location of the trees.
3.2.10.1.4 Costs of Virgin Materials
Finally, the costs of virgin materials which include all delivering costs, must be
included. These costs, however, should be net of compliance cost. Compliance cost is
49
only a transfer of money to the government; therefore, it should not be considered as a
social cost.
3.2.10.2 Remanufactured Material to Manufacturing
Using the remanufactured material is less damaging to the environment since
there is no opportunity costs involved. Moreover, the emissions during the
remanufacturing process are often lower. However, if the cost of using remanufactured
material is higher than using virgin material, it may not be worthwhile to use
remanufactured materials. The costs we must consider when using remanufactured
materials are energy use, emission during remanufacturing, collecting and transporting,
and the cost of remanufactured materials.
3.2.10.2.1 Energy Usage
Similar to material extraction, energy usage must be considered during re-
manufacturing of recycled products. This includes the energy used in collecting the
used product, taking the product apart, sorting and, transporting the components of the
product, and remanufacturing the parts into material desired. The cost is similarly:
Cost = E PQi Pi: the potency factor of eachpollutant emitted during thecreation of energy required for theremanufacture of materials.
Qi: the quantify of each pollutantemitted during the same process
50
3.2.10.2.2 Emissions During Remanufacturing and Transporting
Pollutants emitted during remanufacturing and transporting as well as during
collecting and sorting. The cost of pollution again is:
Cost = E PQ, Pi: the potency factor of eachpollutant emitted directly by theprocess of remanufacturing
Qi: the quantify of each pollutantemitted during the same process
3.2.10.2.3 Costs of Remanufactured Materials
The costs of the remanufactured materials must be considered. Again, the costs
should be net of compliance costs. It is justified to pay more for the remanufactured
materials than virgin materials if the total costs of remanufactured materials are lower
than those of virgin materials; otherwise, virgin materials should be used.
3.2.10.3 Reused material to Manufacturing
Reused materials are even better environmentally than remanufactured
materials. The materials do not have to be reprocessed. However, transportation cost
sometimes precludes the reuse of materials. The social costs are the cost of energies
use in collecting, taking apart, sorting, and transporting of reused material, the
corresponding emission during these processes, and the cost of the reused material.
51
3.2.10.3.1 The Cost of Energy
As in the case of remanufactured material, the cost of energy used in collecting
and transporting the reused material is also I PQj Pi refers to the potency factor of
each pollutant during the creation of the energy required to transport and to collect the
reused material into production process. Q refers to the amount of each pollutant.
3.2.10.3.2 The Cost of Emission
The emissions in transporting and collecting the reused material must be taken
into consideration. The total cost of emissions is PjQj. Pi here refers to the potency
factor of each pollutant emitted during transportation and collection. Q refers to the
amount of each pollutant.
3.2.10.4 Manufacturing Process
The manufacturing process is an important component in the determination of
the greenness of a product. This process is the only element that companies have good
control over. This is also the part that is easiest to measure. It considers energy usage
and emission during manufacturing, recycling and treatment costs, and costs of
manufacturing.
52
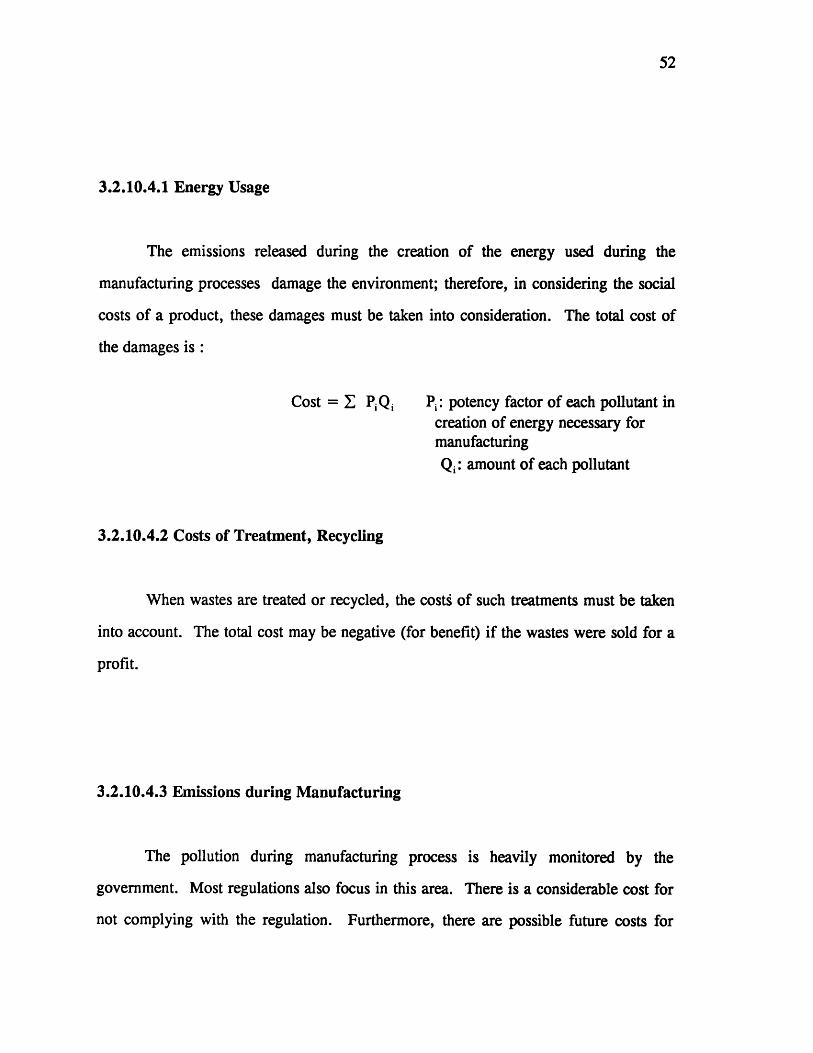
3.2.10.4.1 Energy Usage
The emissions released during the creation of the energy used during the
manufacturing processes damage the environment; therefore, in considering the social
costs of a product, these damages must be taken into consideration. The total cost of
the damages is:
Cost = Z PQi Pi: potency factor of each pollutant increation of energy necessary formanufacturing
Qi: amount of each pollutant
3.2.10.4.2 Costs of Treatment, Recycling
When wastes are treated or recycled, the costs of such treatments must be taken
into account. The total cost may be negative (for benefit) if the wastes were sold for a
profit.
3.2.10.4.3 Emissions during Manufacturing
The pollution during manufacturing process is heavily monitored by the
government. Most regulations also focus in this area. There is a considerable cost for
not complying with the regulation. Furthermore, there are possible future costs for
53
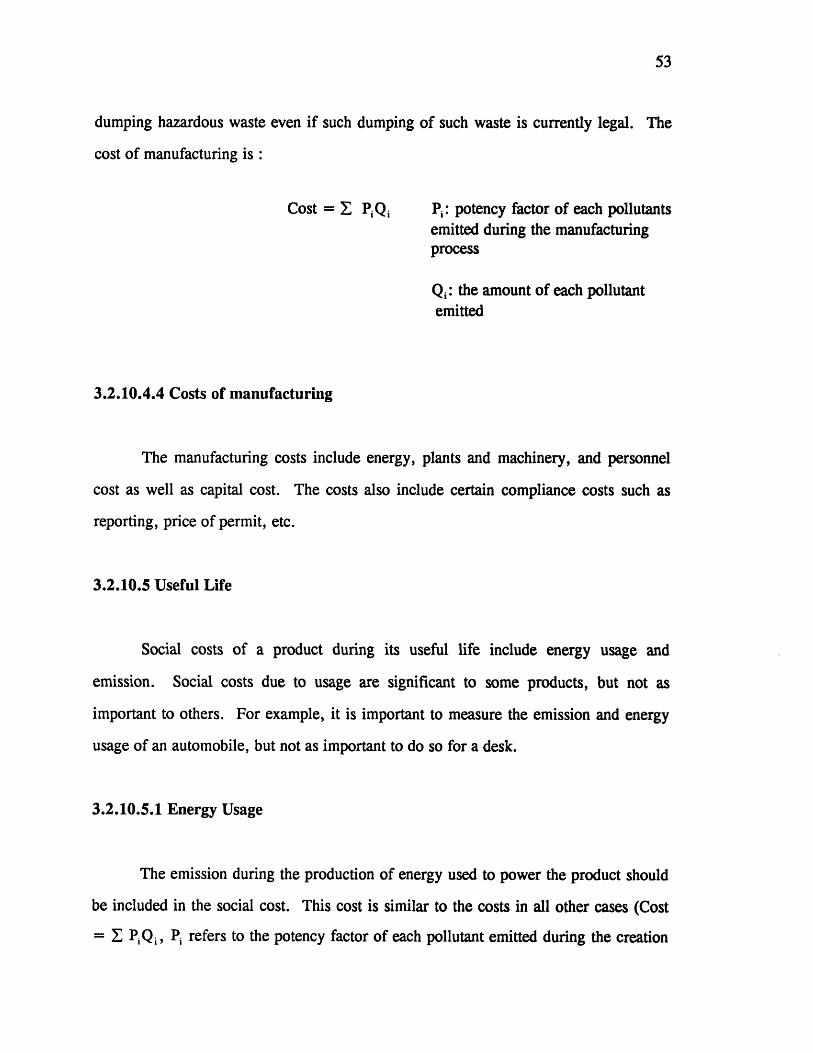
dumping hazardous waste even if such dumping of such waste is currently legal. The
cost of manufacturing is :
Cost = I PiQi Pi: potency factor of each pollutantsemitted during the manufacturingprocess
Q i: the amount of each pollutantemitted
3.2.10.4.4 Costs of manufacturing
The manufacturing costs include energy, plants and machinery, and personnel
cost as well as capital cost. The costs also include certain compliance costs such as
reporting, price of permit, etc.
3.2.10.5 Useful Life
Social costs of a product during its useful life include energy usage and
emission. Social costs due to usage are significant to some products, but not as
important to others. For example, it is important to measure the emission and energy
usage of an automobile, but not as important to do so for a desk.
3.2.10.5.1 Energy Usage
The emission during the production of energy used to power the product should
be included in the social cost. This cost is similar to the costs in all other cases (Cost
= E PQj, Pi refers to the potency factor of each pollutant emitted during the creation
54
of energy requires to run the product and, Qi refers to the quantity of each
corresponding pollutant).
3.2.10.5.2 Emissions during Usage
The emission of pollutants during usage should be estimated. The cost of
emission is also E PiQ,, where Pi is the potency factor of pollutants emitted during the
useful life of the product, and Qi is the quantity of pollutants.
3.2.10.6 Disposal of the Product
At the end of a product's useful life, if any portion of the product must be
disposed of, the social cost of such disposal must be considered. The social cost
depend on factors such as biodegradability and toxicity of the product. The same
formula, Cost = PiQi, can be applied. Pi here refers to the potency factor of the
disposed product; Qi is the quantity of the disposed product.
3.2.10.7 Catastrophes
Another cost of the product life is associated with disastrous events. When
manufacturing and transporting of a product may cause a disastrous event, the cost of
such an event must be taken into consideration. For example, when Union Carbide's
plant in Bhopal released deadly gas that killed 2,000 people and injured hundred of
thousands and when Exxon Valdez spilled oil in the Alaskan Coast, these companies
must pay for the direct damages of cleaning up and settling lawsuits. They must also
55
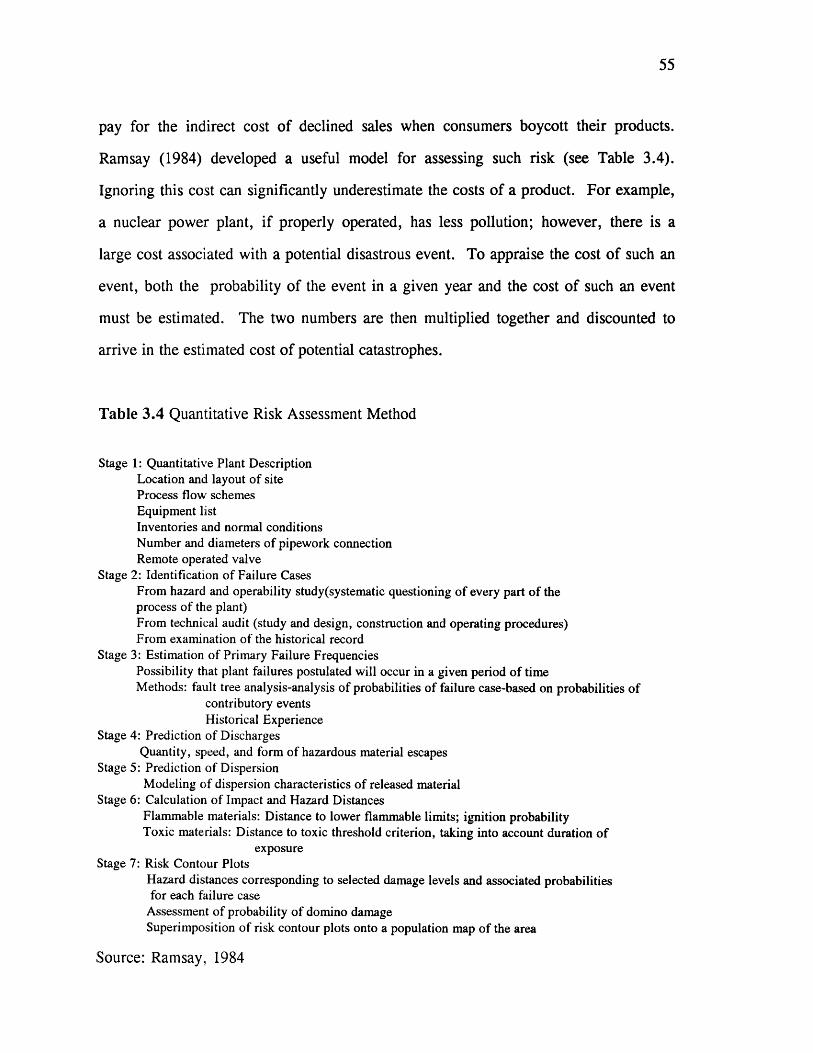
pay for the indirect cost of declined sales when consumers boycott their products.
Ramsay (1984) developed a useful model for assessing such risk (see Table 3.4).
ignoring this cost can significantly underestimate the costs of a product. For example,
a nuclear power plant, if properly operated, has less pollution; however, there is a
large cost associated with a potential disastrous event. To appraise the cost of such an
event, both the probability of the event in a given year and the cost of such an event
must be estimated. The two numbers are then multiplied together and discounted to
arrive in the estimated cost of potential catastrophes.
Table 3.4 Quantitative Risk Assessment Method
Stage 1: Quantitative Plant DescriptionLocation and layout of siteProcess flow, schemesEquipment listInventories and normal conditionsNumber and diameters of pipework connectionRemote operated valve
'Stage 2: Identification of Failure CasesFrom hazard and operability study(systematic questioning of every part of theprocess of the plant)From technical audit (study and design, construction and operating procedures)From examination of the historical record
Stage 3: Estimation of Primary Failure FrequenciesPossibility that plant failures postulated will occur in a given period of timeMethods: fault tree analysis-analysis of probabilities of failure case-based on probabilities of
contributory eventsHistorical Experience
Stage 4: Prediction of DischargesQuantity, speed, and form of hazardous material escapes
Stage 5: Prediction of DispersionModeling of dispersion characteristics of released material
Stage 6: Calculation of Impact and Hazard DistancesFlammable materials: Distance to lower flammable limits; ignition probabilityToxic materials: Distance to toxic threshold criterion, taking into account duration of
exposureStage 7: Risk Contour Plots
Hazard distances corresponding to selected damage levels and associated probabilitiesfor each failure case
Assessment of probability of domino damageSuperimposition of risk contour plots onto a population map of the area
Source: Ramsay, 1984
56
In addition to the potential cost of a catastrophic event, the psychological cost of
such an event must also be considered. The psychological cost refers to the
nervousness of people who live near the potentially disastrous plant. Daily life may be
interrupted by the fear of a disastrous event.
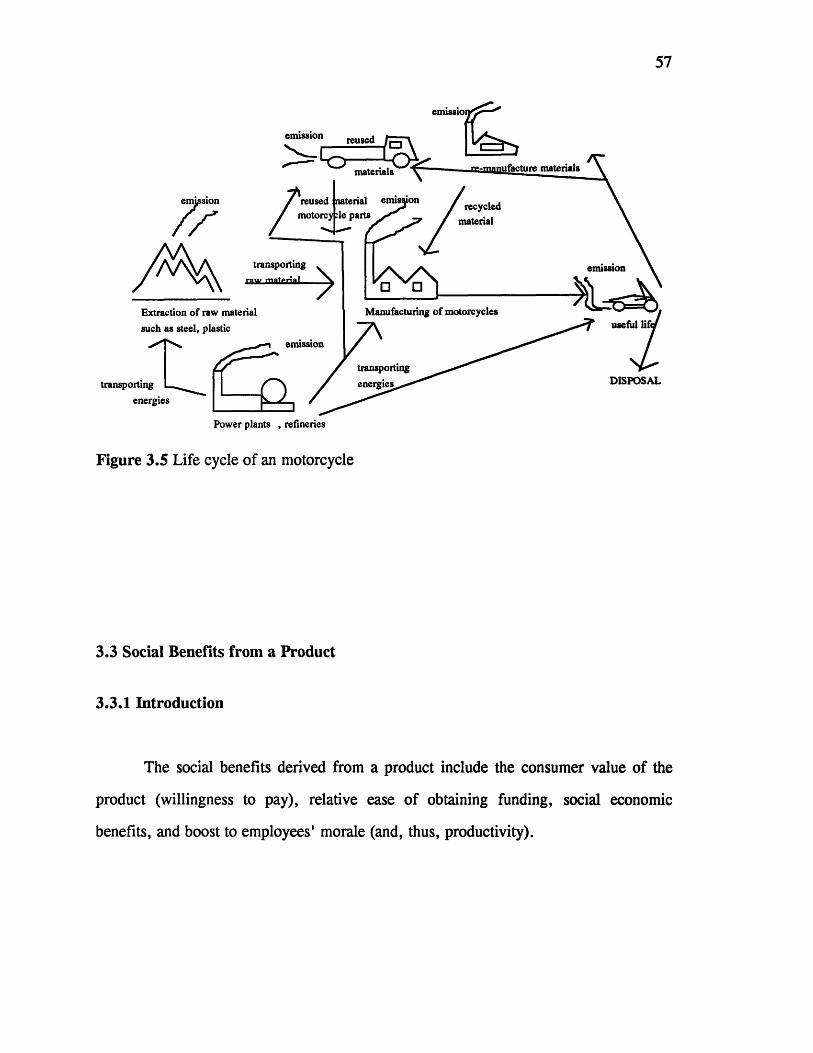
3.2.11 An Example of Life Cycle Cost Analysis
Referring to the earlier example of a two cycle verses a four cycle motorcycle
engine, the life cycle of a motorcycle is shown in Figure 3.5. Because the engines use
different composite and amount of materials, all pollutants and costs are tracked from
the creation to the disposal of the materials. Emission during the use of the motorcycle
is only one of several issues that must be evaluated. Other issues include fuel mileage
(and, therefore, emission during creation of the fuel), manufacturing costs (including
emission during manufacturing), and transportation cost (including emissions during
transportation).
57
Extraction of ra'
such as steel, pl1
transporting
energies
Power plants , refineries
Figure 3.5 Life cycle of an motorcycle
3.3 Social Benefits from a Product
3.3.1 Introduction
The social benefits derived from a product include the consumer value of the
product (willingness to pay), relative ease of obtaining funding, social economic
benefits, and boost to employees' morale (and, thus, productivity).
58
3.3.2 Willingness to Pay
The benefits of a product derived from consumers can be measured by
consumers' willingness to pay. Consumers' willingness to pay a premium for greener
products depends on factors such as personal income, current economic condition,
education, and competitions. It also depends on the price elasticity of the product and
the availability of substitutes.
This willingness to pay should include the price of the product and the spill-over
effect. Consumers may pay more for a company's other products if the company has
the good reputation of being a green company.
3.3.3 Easier to Obtain Funding
Additional benefits include ease of obtaining funding from banks or investors.
Chevron has found in a survey of its stockholders, that environmental responsibleness
is considered to be a sound investment for a company [Smart, 1992]. Banks recognize
that lending to a greener company reduces its potential future liability. This benefit is
measured by the difference between the cost of borrowing for a company when it
produces green products and when it does not.
3.3.4 Social-Economic Benefits
Most studies on environmental impact studies have ignored the social
consequences of a product [Craig, 1989]. The most important consequence is another
59
economic externality: job creation. A commercialized product creates employment in
the product industry as well as in the material industries and the output industries (retail
chains). However, we must also consider the possible shifts in the labor force. In a
full employment economy, any jobs created by the products means a job is lost
somewhere else. Furthermore, there may be a loss of tourism due to the product;
thus, there is really no positive effects from the product during an economic boom.
During a recession, however, the benefits of job creation would be significant
[McDonald, 1990].
A regional economic impact assessment would be helpful in determining the
effects of change in employment (both direct or indirect). The direct effects are job
creation and income created by the jobs. The indirect effects are the effects due to the
multiplier, i.e. income is spent and more jobs are created. The assessment involves
high complexity of estimating input, output, income, spending, etc. Many models are
used to run these social economic assessments. These models include Regional
Keynesian Multiplier and Input-Output Analysis based upon the Leontief matrix
[McDonald, 1990].
3.3.5 Boost in Employee's Morale
Another benefit that is difficult to quantify is the employees' morale. Greening
of the company's product tends to boost employees' morale as well. Monsanto
Company found very positive reactions from its employees after its announcement of
Monsanto Pledge -- a program design to improve the quality of the environment
[Smart, 1992]. This boost in morale can transform to higher productivity.
60
3.4 Discount Rates
3.4.1 Introduction
Not all cash flows occur at the same time. Many effects such as the disposal of
products occur years after the production; therefore, discounting is required to
determine the present values of the benefits and the costs of a product.
3.4.2 Discount Rate for Manufacturing Cost
The discount rate for the manufacturing cost (excluding social cost) and
revenues derived from a product is the company's cost of capital. This discount rate is
determined by the business risk of this product. CAPM model can be applied to
determine this rate.
3.4.3 Social Discount Rate
The discount rate for the social costs is more difficult to determine. Many
authors argue that discounting the future is unethical because we are not weighing the
future generations with equal importance; thus, they propose using a zero discount rate.
However, it is likely that future generations may be more able to cope with the same
problems, such as health care, than we can now through advances in technologies.
Also, what we consider as an important environmental effect may not be as important
during the future generations. The future needs are uncertain; therefore, the cash flows
61
derived from current estimate of future needs should not be weighted the same as the
current needs. So, the use of a positive discount rate could be justified. The cost of a
product is very sensitive to the discount rate; hence, the determination of a social
discount rate is very important. Lind (1982) proposes the use of a 3 percent rate for
the risk-adjusted social rate of time preference.
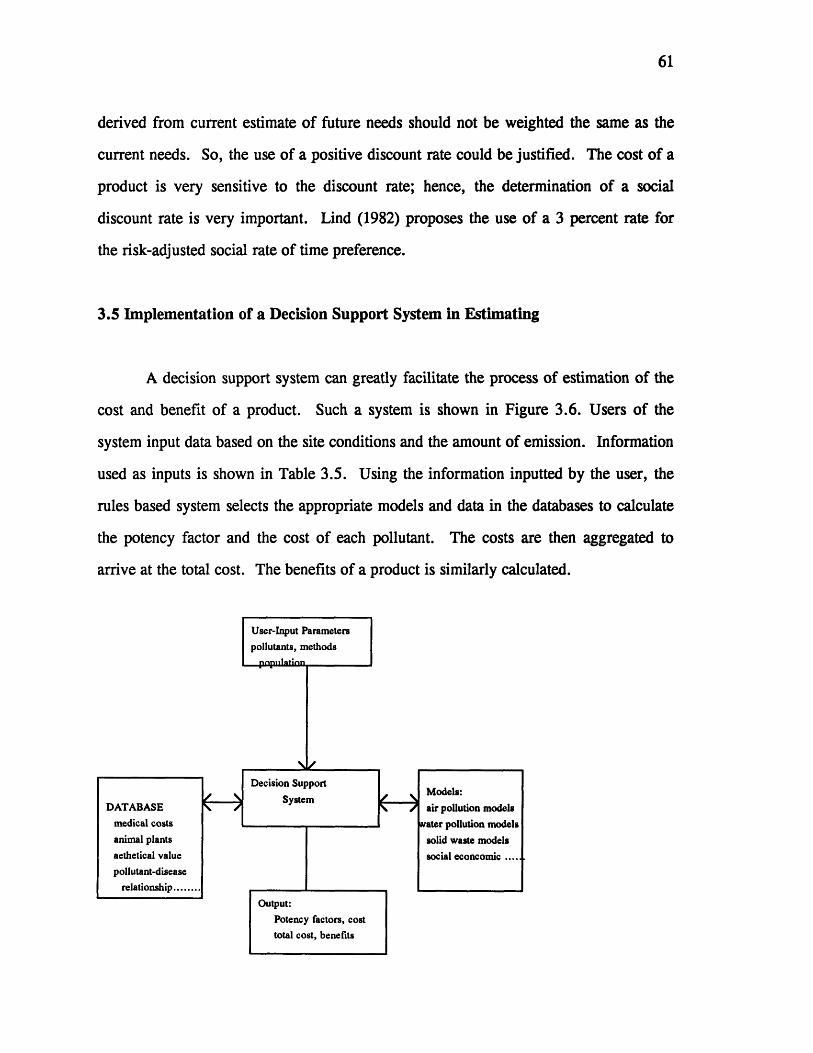
3.5 Implementation of a Decision Support System in Estimating
A decision support system can greatly facilitate the process of estimation of the
cost and benefit of a product. Such a system is shown in Figure 3.6. Users of the
system input data based on the site conditions and the amount of emission. Information
used as inputs is shown in Table 3.5. Using the information inputted by the user, the
rules based system selects the appropriate models and data in the databases to calculate
the potency factor and the cost of each pollutant. The costs are then aggregated to
arrive at the total cost. The benefits of a product is similarly calculated.
User-Input Parameters
pollutants, methods
LIZUW
Decision Support
System
Output:
Potency factors, cost
total cost, benefits
DATABASE
medical costs
animal plants
aethetical value
pollutant-disease
relationship........
Models:
air pollution models
water pollution models
solid waste models
social econcomic ...._1
62
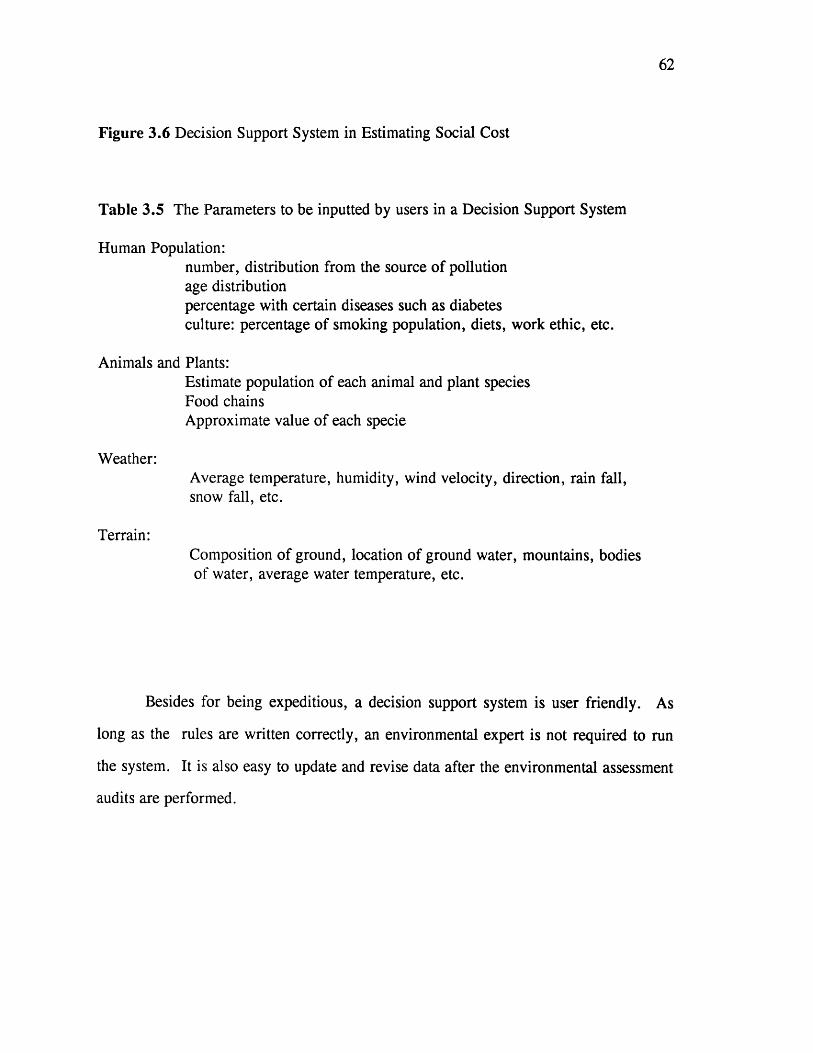
Figure 3.6 Decision Support System in Estimating Social Cost
Table 3.5 The Parameters to be inputted by users in a Decision Support System
Human Population:number, distribution from the source of pollutionage distributionpercentage with certain diseases such as diabetesculture: percentage of smoking population, diets, work ethic, etc.
Animals and Plants:Estimate population of each animal and plant speciesFood chainsApproximate value of each specie
'Weather:Average temperature, humidity, wind velocity, direction, rain fall,snow fall, etc.
Terrain:Composition of ground, location of ground water, mountains, bodiesof water, average water temperature, etc.
Besides for being expeditious, a decision support system is user friendly. As
long as the rules are written correctly, an environmental expert is not required to run
the system. It is also easy to update and revise data after the environmental assessment
audits are performed.
63
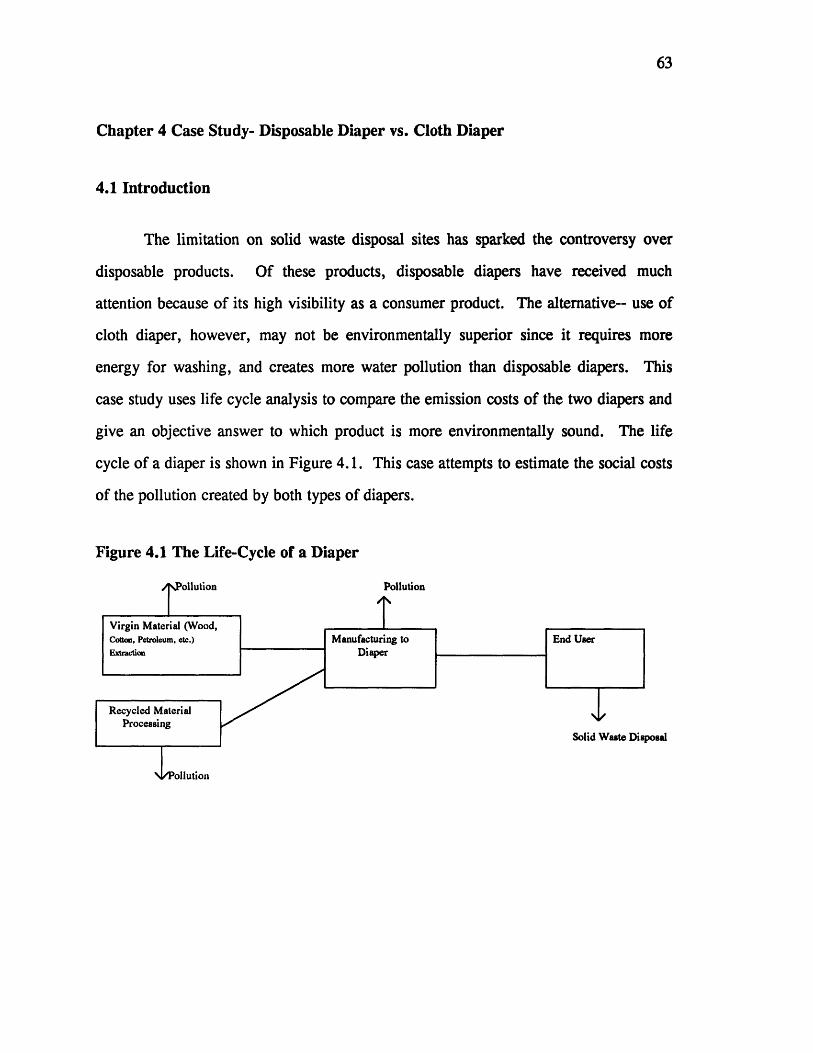
Chapter 4 Case Study- Disposable Diaper vs. Cloth Diaper
4.1 Introduction
The limitation on solid waste disposal sites has sparked the controversy over
disposable products. Of these products, disposable diapers have received much
attention because of its high visibility as a consumer product. The alternative-- use of
cloth diaper, however, may not be environmentally superior since it requires more
energy for washing, and creates more water pollution than disposable diapers. This
case study uses life cycle analysis to compare the emission costs of the two diapers and
give an objective answer to which product is more environmentally sound. The life
cycle of a diaper is shown in Figure 4.1. This case attempts to estimate the social costs
of the pollution created by both types of diapers.
Figure 4.1 The Life-Cycle of a Diaper
Pollution
posal
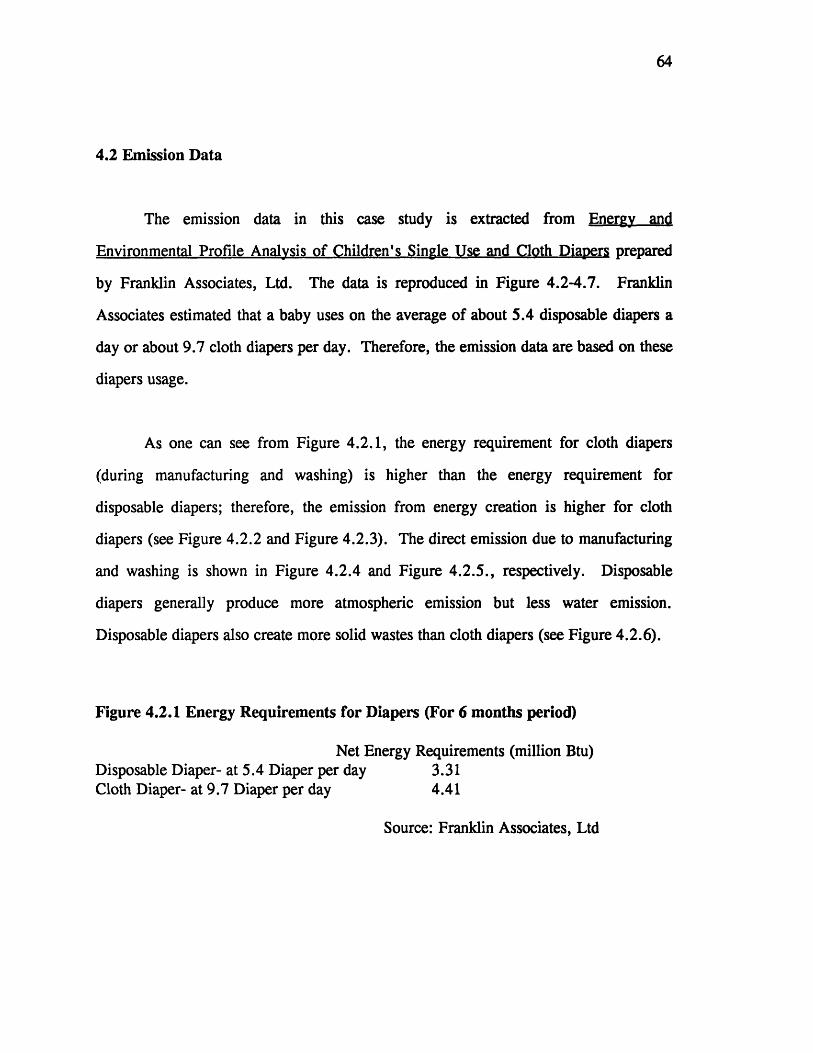
64
4.2 Emission Data
The emission data in this case study is extracted from Energy and
Environmental Profile Analysis of Children's Single Use and Cloth Diapers prepared
by Franklin Associates, Ltd. The data is reproduced in Figure 4.2-4.7. Franklin
Associates estimated that a baby uses on the average of about 5.4 disposable diapers a
day or about 9.7 cloth diapers per day. Therefore, the emission data are based on these
diapers usage.
As one can see from Figure 4.2.1, the energy requirement for cloth diapers
(during manufacturing and washing) is higher than the energy requirement for
disposable diapers; therefore, the emission from energy creation is higher for cloth
diapers (see Figure 4.2.2 and Figure 4.2.3). The direct emission due to manufacturing
and washing is shown in Figure 4.2.4 and Figure 4.2.5., respectively. Disposable
diapers generally produce more atmospheric emission but less water emission.
Disposable diapers also create more solid wastes than cloth diapers (see Figure 4.2.6).
Figure 4.2.1 Energy Requirements for Diapers (For 6 months period)
Net Energy Requirements (million Btu)Disposable Diaper- at 5.4 Diaper per day 3.31Cloth Diaper- at 9.7 Diaper per day 4.41
Source: Franklin Associates, Ltd
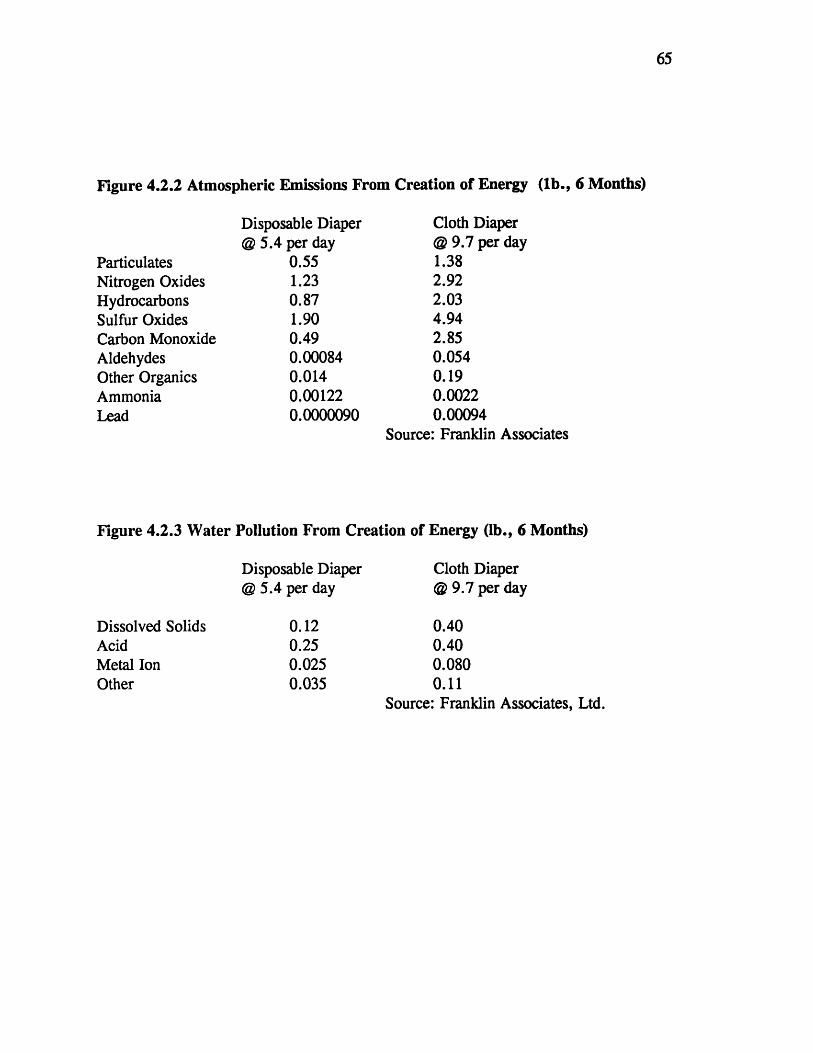
65
Figure 4.2.2 Atmospheric Emissions From Creation of Energy (lb., 6 Months)
ParticulatesNitrogen OxidesHydrocarbonsSulfur OxidesCarbon MonoxideAldehydesOther OrganicsAmmoniaLead
Disposable Diaper@ 5.4 per day
0.551.230.871.900.490.000840.0140.001220.0000090
Cloth Diaper@ 9.7 per day1.382.922.034.942.850.0540.190.00220.00094
Source: Franklin Associates
Figure 4.2.3 Water Pollution From Creation of Energy (lb., 6 Months)
Disposable Diaper@ 5.4 per day
Dissolved SolidsAcidMetal IonOther
0.120.250.0250.035
Cloth Diaper@ 9.7 per day
0.400.400.0800.11
Source: Franklin Associates, Ltd.
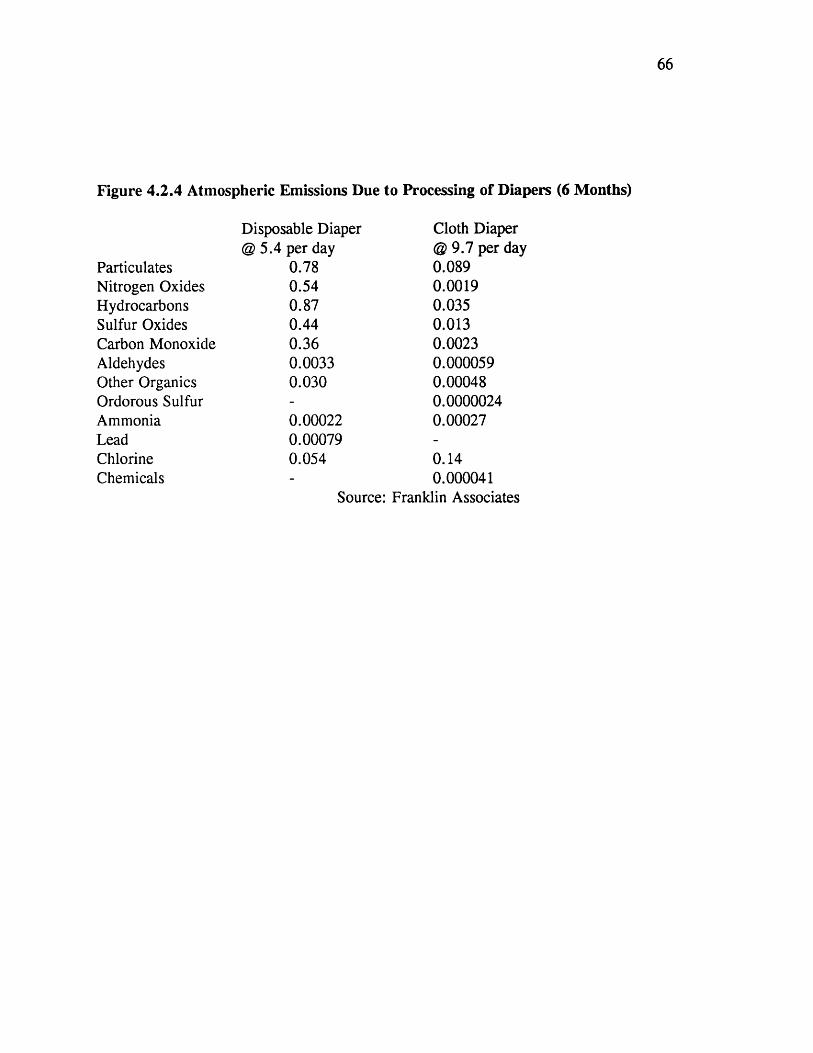
66
Figure 4.2.4 Atmospheric Emissions Due to Processing of Diapers (6 Months)
ParticulatesNitrogen OxidesHydrocarbonsSulfur OxidesCarbon MonoxideAldehydesOther OrganicsOrdorous SulfurAmmoniaLeadChlorineChemicals
Disposable Diaper@ 5.4 per day
0.780.540.870.440.360.00330.030
0.000220.000790.054
Sou:
Cloth Diaper@ 9.7 per day0.0890.00190.0350.0130.00230.0000590.000480.00000240.00027
0.140.000041
rce: Franklin Associates
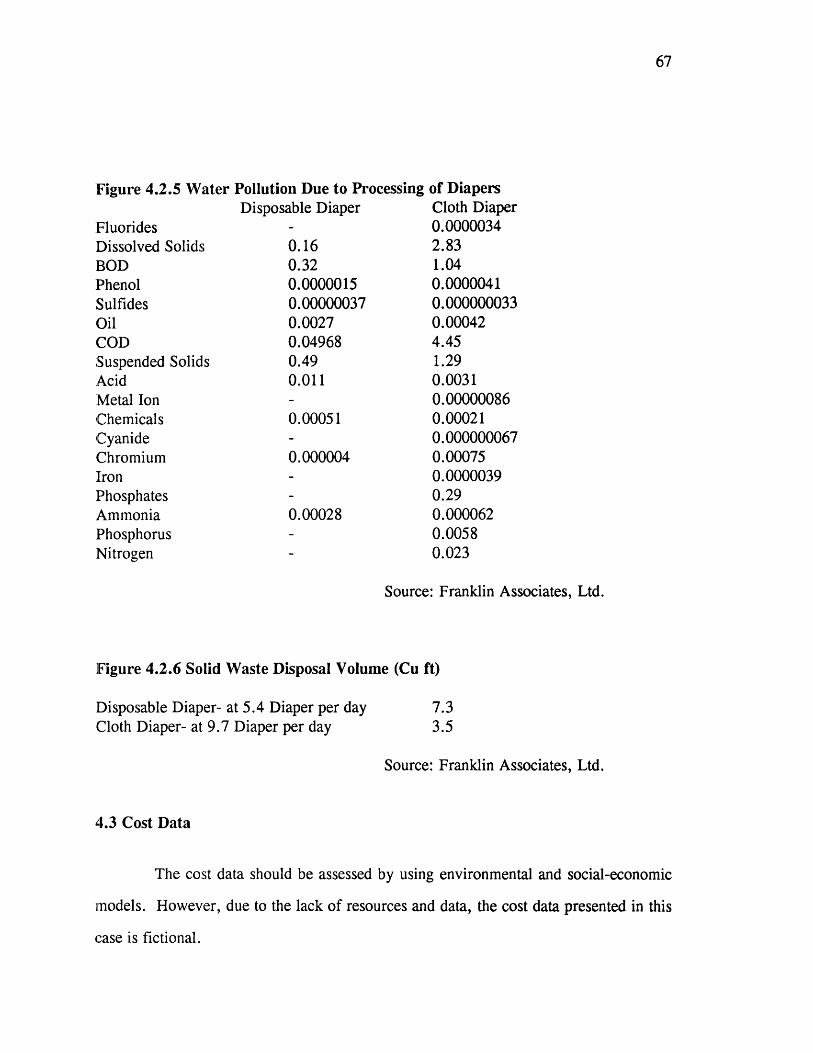
Figure 4.2.5 Water Pollution Due to ProcessingDisposable Diaper
FluoridesDissolved SolidsBODPhenolSulfides'OilCODSuspended SolidsAcidMetal IonChemicalsCyanideChromiumIronPhosphatesAmmonia]PhosphorusNitrogen
0.160.320.00000150.000000370.00270.049680.490.011
0.00051
0.000004
0.00028
of DiapersCloth Diaper0.00000342.831.040.00000410.0000000330.000424.451.290.00310.000000860.000210.0000000670.000750.00000390.290.0000620.00580.023
Source: Franklin Associates, Ltd.
Figure 4.2.6 Solid Waste Disposal Volume (Cu ft)
Disposable Diaper- at 5.4 Diaper per dayCloth Diaper- at 9.7 Diaper per day
7.33.5
Source: Franklin Associates, Ltd.
4.3 Cost Data
The cost data should be assessed by using environmental and social-economic
models. However, due to the lack of resources and data, the cost data presented in this
case is fictional.
67
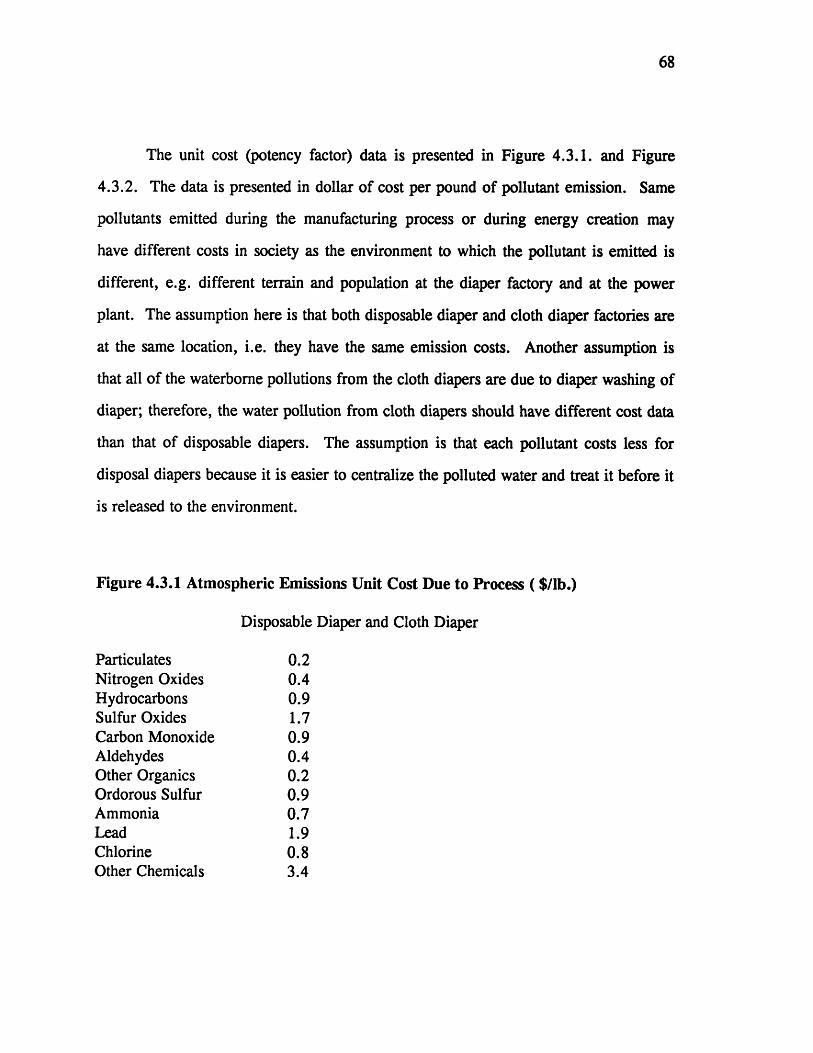
68
The unit cost (potency factor) data is presented in Figure 4.3.1. and Figure
4.3.2. The data is presented in dollar of cost per pound of pollutant emission. Same
pollutants emitted during the manufacturing process or during energy creation may
have different costs in society as the environment to which the pollutant is emitted is
different, e.g. different terrain and population at the diaper factory and at the power
plant. The assumption here is that both disposable diaper and cloth diaper factories are
at the same location, i.e. they have the same emission costs. Another assumption is
that all of the waterborne pollutions from the cloth diapers are due to diaper washing of
diaper; therefore, the water pollution from cloth diapers should have different cost data
than that of disposable diapers. The assumption is that each pollutant costs less for
disposal diapers because it is easier to centralize the polluted water and treat it before it
is released to the environment.
Figure 4.3.1 Atmospheric Emissions Unit Cost Due to Process ($/lb.)
Disposable Diaper and Cloth Diaper
Particulates 0.2Nitrogen Oxides 0.4Hydrocarbons 0.9Sulfur Oxides 1.7Carbon Monoxide 0.9Aldehydes 0.4Other Organics 0.2Ordorous Sulfur 0.9Ammonia 0.7Lead 1.9Chlorine 0.8Other Chemicals 3.4
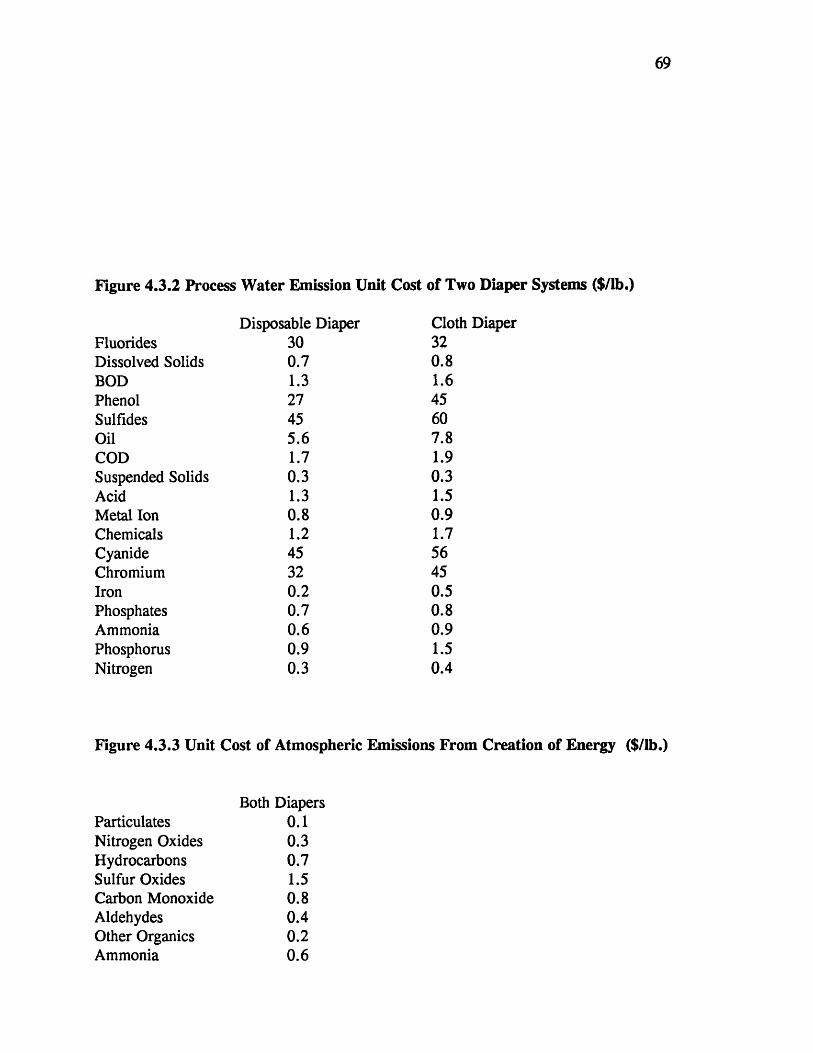
69
Figure 4.3.2 Process Water Emission Unit Cost of Two Diaper Systems ($/lb.)
FluoridesDissolved SolidsBODPhenolSulfidesOilCODSuspended SolidsAcidMetal IonChemicalsCyanideChromiumIronPhosphatesAmmoniaPhosphorusNitrogen
Disposable Diaper300.71.327455.61.70.31.30.81.245320.20.70.60.90.3
Cloth Diaper320.81.645607.81.90.31.50.91.756450.50.80.91.50.4
Figure 4.3.3 Unit Cost of Atmospheric Emissions From Creation of Energy ($/lb.)
ParticulatesNitrogen OxidesHydrocarbonsSulfur OxidesCarbon MonoxideAldehydesOther OrganicsAmmonia
Both Diapers0.10.30.71.50.80.40.20.6
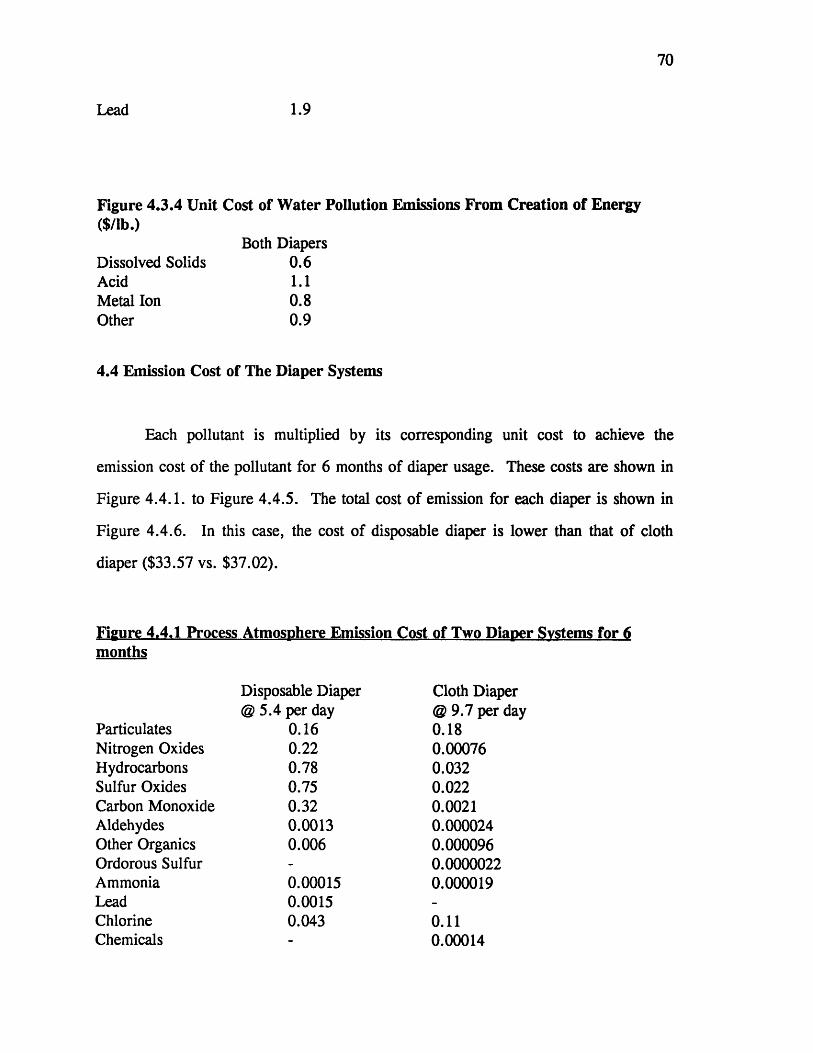
70
1.9
Figure 4.3.4 Unit Cost of Water Pollution Emissions From Creation of Energy($/lb.)
Dissolved SolidsAcidMetal IonOther
Both Diapers0.61.10.80.9
4.4 Emission Cost of The Diaper Systems
Each pollutant is multiplied by its corresponding unit cost to achieve the
emission cost of the pollutant for 6 months of diaper usage. These costs are shown in
Figure 4.4.1. to Figure 4.4.5. The total cost of emission for each diaper is shown in
Figure 4.4.6. In this case, the cost of disposable diaper is lower than that of cloth
diaper ($33.57 vs. $37.02).
Figure 4.4.1 Process Atmosphere Emission Costmonths
of Two Dianer Systems for 6
ParticulatesNitrogen OxidesHydrocarbonsSulfur OxidesCarbon MonoxideAldehydesOther OrganicsOrdorous SulfurAmmoniaLeadChlorineChemicals
Disposable Diaper@ 5.4 per day
0.160.220.780.750.320.00130.006
0.000150.00150.043
Cloth Diaper@ 9.7 per day0.180.000760.0320.0220.00210.0000240.0000960.00000220.000019
0.110.00014
Lead
__ _ · · _ ___I__ _ �1____1 ___ _
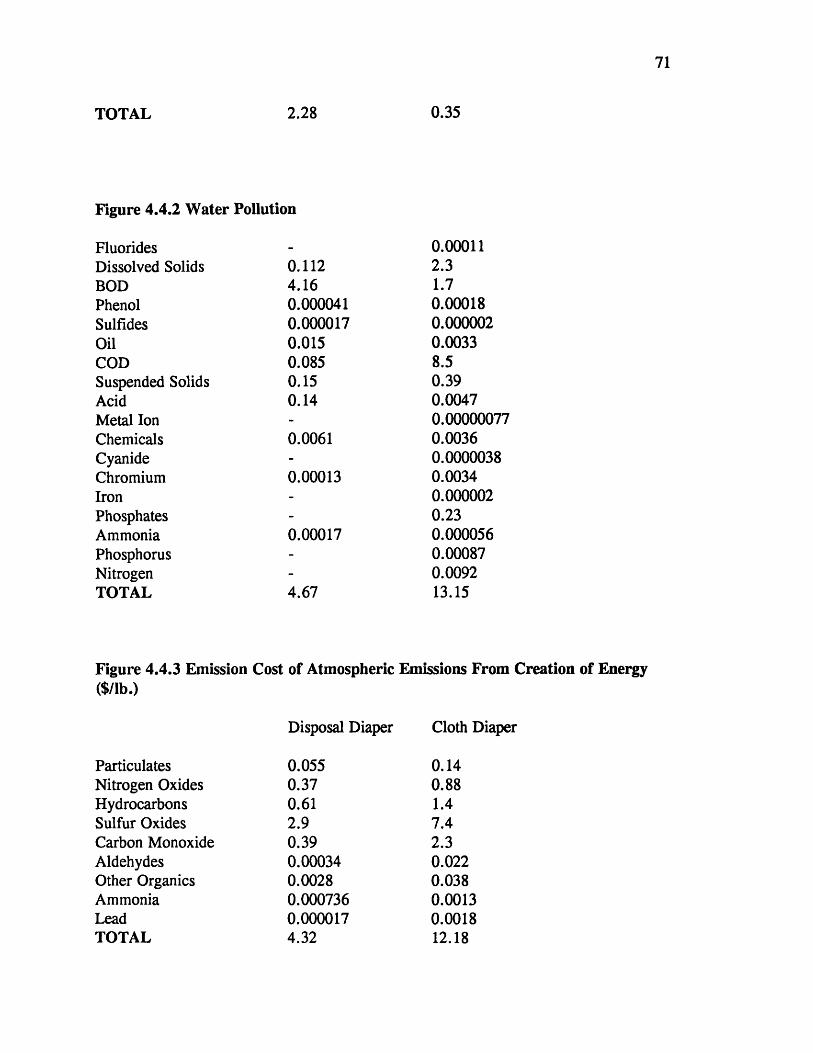
TOTAL 2.28
Figure 4.4.2 Water Pollution
FluoridesDissolved SolidsBODPhenolSulfidesOilCODSuspended SolidsAcidMetal IonChemicalsCyanideChromiumIronPhosphatesAmmoniaPhosphorusNitrogenTOTAL
Figure 4.4.3 Emission Cost($/lb.)
0.1124.160.0000410.0000170.0150.0850.150.14
0.0061
0.00013
0.00017
4.67
0.000112.31.70.000180.0000020.00338.50.390.00470.000000770.00360.00000380.00340.0000020.230.0000560.000870.009213.15
of Atmospheric Emissions From Creation of Energy
Disposal Diaper Cloth Diaper
ParticulatesNitrogen OxidesHydrocarbonsSulfur OxidesCarbon MonoxideAldehydesOther OrganicsAmmoniaLeadTOTAL
0.35
71
0.0550.370.612.90.390.000340.00280.0007360.0000174.32
0.140.881.47.42.30.0220.0380.00130.001812.18
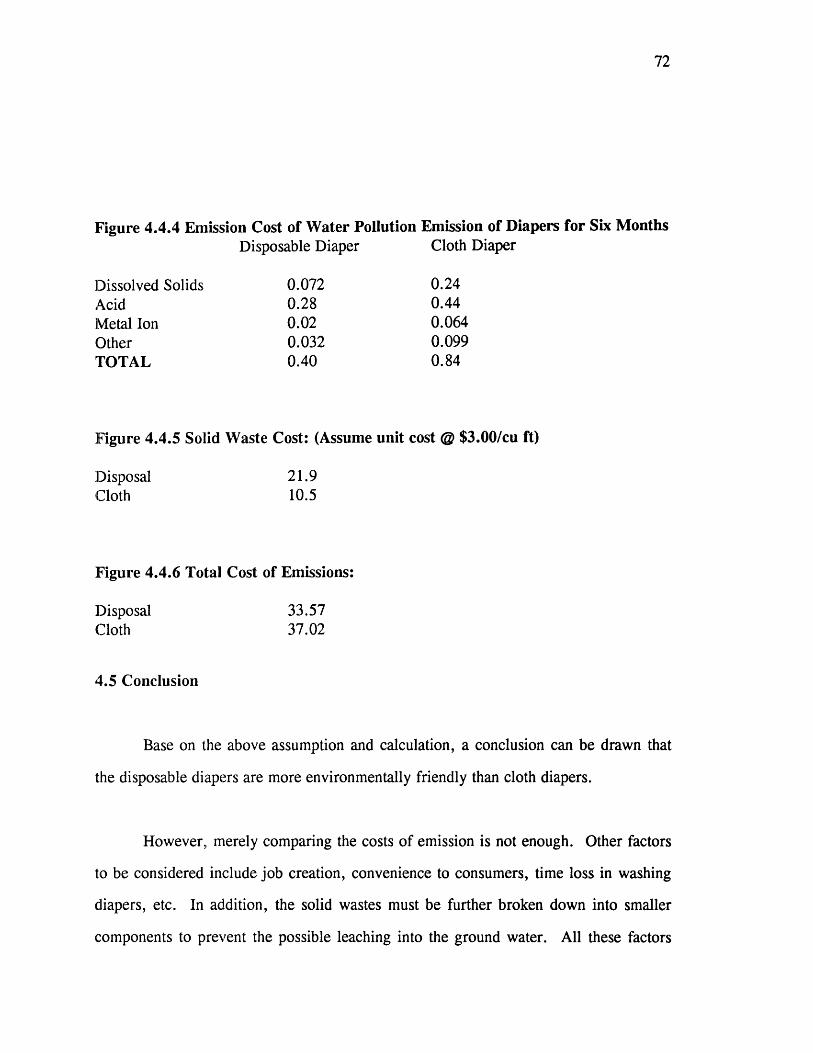
72
Figure 4.4.4 Emission Cost of Water Pollution Emission of Diapers for Six MonthsDisposable Diaper Cloth Diaper
Dissolved Solids 0.072 0.24Acid 0.28 0.44Metal Ion 0.02 0.064Other 0.032 0.099TOTAL 0.40 0.84
Figure 4.4.5 Solid Waste Cost: (Assume unit cost @ $3.00/cu ft)
Disposal 21.9Cloth 10.5
Figure 4.4.6 Total Cost of Emissions:
Disposal 33.57cloth 37.02
4.5 Conclusion
Base on the above assumption and calculation, a conclusion can be drawn that
the disposable diapers are more environmentally friendly than cloth diapers.
However, merely comparing the costs of emission is not enough. Other factors
to be considered include job creation, convenience to consumers, time loss in washing
diapers, etc. In addition, the solid wastes must be further broken down into smaller
components to prevent the possible leaching into the ground water. All these factors

73
should be considered and their costs estimated before one can assess which is the better
diaper system.
74
Chapter 5 Summary and Conclusion
5.1 Introduction
In this chapter, a description of the model's application, the advantages and
disadvantages of the model, and the final remarks of the model will be presented.
5.2 Application of the Model
In addition to the decision on whether the product is worth producing, the
system is very useful in the planning stage. It can be used to choose technologies,
product designs (material selection, energy consideration, etc.), manufacturing sites,
material vendors, etc.
When the assessment is used to compare two similar products with different life
spans, the cost must be based on considered on the same life-span. For example, when
Product A is twice as durable as Product B, comparison must be made by assuming that
two of Product B are used, one after another, to compare to one of product A.
Similarly, the products can be compared on an equivalent annual cost basis. When the
capacity of the two products being compared are different, the figures must be adjusted
so the same capacity applies.
The system can be used to assist with making budgeting decisions. If the
decision maker has only a limited budget to lower the social cost of the product, he can
pick the combination that yields the highest net benefit.
75
The system can be broken to perform sub-tasks. For example, the system can
be used to select material vendors. Because the new liabilities imposed by regulations
are joined and several, dealing with an irresponsible supplier can be costly for a
company. The lowest social cost in producing the material can be used as a criterion
for choosing vendors. Another sub-task is for selecting a manufacturing site. Land
cost as well as other social costs (pollution cost, aesthetic cost, etc.) can be taken into
consideration in deciding on a manufacturing site.
Furthermore, decision maker can use the system as an insurance decision on
where and how much to invest to minimize potential future liabilities.
.5.3 Advantages of the Model
The model has the following advantages: gives an objective answer, educates
employees, improves public relationships, reduces compliance costs, is easy to be
modified, and is easy to assess data.
5.3.1 Gives an Objective Answer
The system weighs the different methods of emission reduction as well as other
costs, such as materials and manufacturing, and assigns a cost number that is easy to
understand. The model is very flexible. This cost system can help management set
goals in reducing waste. It helps to identify the potential problems and to allocate
resources and capitals accordingly to improve the problem. For example, if a
treatment program costs $lm in present value, then the net benefit (reduction in cost) in
present value must exceed $lm for it to be a worthy project.
76
5.3.2 Educating Employees
The cost system not only evaluates trade-offs between different methods of
abatement but is also a very useful management tool. It makes all employees
understand and be conscious of the costs of emissions. Oftentimes, employees will be
able to come up with alternatives that may lower the costs.
5.3.3 Improve Public Relationship by Educating the Public
A study by Michael Elliot (1984) shows that the up to 50% of the residents
can be persuaded to support a project if the project are of high quality. Often, the
success of a project depends on the support of local residents. This is especially true in
the siting of facilities. The analysis will assist local residents in understanding the costs
and the benefits of the product. The system improves public relations by disclosing all
information.
5.3.4 Reduce Compliance Cost
The system can be easily modified to satisfy the multiple reporting requirements
imposed by various federal and state agencies as well as banks and the SEC.
5.3.5 Easy to Modify
The system can be modified and reused for other projects. This is especially
helpful for developing countries where insufficient manpower and resources are
available for environmental studies [Brown, 1990].
77
5.3.6 Easy Access of Data
Brown (1990) found that there are difficulties in assessing environmental data.
There were many gaps between agencies; information is often outdated; and its
reliability is questionable, Information that is available is often scattered across
agencies. With the help of a decision support system, the data can be centralized. This
will facilitate the impact study.
5.4 Disadvantages of the Model
The model has two types of weaknesses: technical weakness and ethical
weakness. Technical weakness refers to the lack of research data, quality of such data,
and the lack of understanding for the cause-and-effect relationships. There are many
doubts regarding the reliability of computer models, especially in determining the long
term effects. Many environmental assessments that study the same project have
different results because they are based on different assumptions. Furthermore, new
technological processes, materials, and chemicals that are untested environmentally
contribute to the weakness. Ethical weakness refers to the putting of numerical value
on human lives, a practice that is considered unethical by many. Lastly, there is also
the possibility of manipulation by the user to achieve desire results.
78
5.4.1 Technical Weaknesses
As the technologies for modeling and measuring the pollutants improve, the
extent of the technical weakness declines. The weakness also diminishes as
environmental audits are performed to test the model.
5.4.1.1 Health risk
As mentioned earlier, the effects of human exposure to many chemicals are
unknown since human tests are impossible or limited. Assessing the diseases that an
additional pollutant will cause is extremely difficult. In addition, the discoveries of
these effects are further complicated by the presence of other chemicals and/or
diseases. Human culture and behavior, such as cigarette smoking are also factors.
Furthermore, there seem to be thresholds for the effects of most chemicals on humans,
and the thresholds are very difficult to determine [Kalkstein, 1989]. Besides, the
thresholds differ for everybody. All these health factors are interrelated and very hard
to be separated.
Martin (1986) points out that there have been problems with the identification of
hazards, limitations of epidemiological methodology, and inadequacies in biological
knowledge of chemical toxicity and environmental disease processes. This is largely
due to the lack of direct human data and the difficulties in relating animal research
data to human health. There are also lack of resources and abilities to test new
chemicals or materials.
79
5.4.1.2 Modeling Weakness
There are serious limitations to using a model. Models can only approximate
the actual situation. Rubin (1986) characterized various uncertainties about models: (1)
statistical variation (random error), (2) subjective judgment (systematic error); (3)
linguistic imprecision; (4) sampling variability; (5) inherent randomness; (6) scientific
disagreement; and (7) approximations. The most serious limitation is that models are
usually based on questionable assumptions. For example, the models used to study the
shifts in the labor force assumes static conditions, e.g., unemployment rate stays the
same, etc. However, the economy is dynamic and its actual ability is more complex
and very difficult to predict.
5.4.1.3 Too Many Long Term Uncertainties
Many of these effects are long term in nature. Estimating long term risks is
extremely difficult. For example, the effects of global warming and ozone depletion
are both uncertain and long-term in nature, and the cost of these events is very difficult
to estimate. Kalkstein (1989) studied the possible effects of premature death of human
due to global warming. The finding is very inconclusive and is dependent upon many
assumptions that are hard to verify. In addition, many future events are very uncertain.
For example, the main reason for preserving many animal and plant species is to
develop potential new medicines. Nevertheless, the value of each species cannot be
determined without knowing what medicine will be developed from it. Furthermore,
many human health impacts are also long term in nature. There is usually a time lag
between exposure to the pollutants and the development of health problems.
80
5.4.1.4 Requirement of Large Amount of Data
The system requires a large amount of data and models. Furthermore, data are
scattered among many agencies (see Table 3.1). Researching for the data will take a
tremendous amount of time and resources. However, once the system is complete,
refining it will be easy.
5.4.1.5 Value Conflicts
Perhaps the biggest problem with the cost system is the conflict of value. Even
if health care cost could be estimated, people have different values for other
environment problems and for aesthetic view. People also place different values on the
cost of suffering due to sickness. What the appropriate costs are depends on who is
making the decision. For example, preserving old growth trees save animal and
preserve aesthetic view. However, these benefits are more valuable to animal lovers
and out-door lovers than for others. The major problems were the use of subjective
opinions to arrive at objective estimates.
5.4.2 Ethical Weakness
The ethical weakness of the model refers to the numeric valuation on human life
and the possible manipulation by model user. These weaknesses do not reduce with
advances in technologies.
81
5.4.2.1 Human Life Value
In order to arrive at a cost estimate, it is necessary to place a monetary value on
human life. Many people have objected to this approach, since very few people can
agree on the exact monetary value of a human life. In an EPA estimate, the value of a
death avoided is in the range of $400,000 to $7 million [Whittington, 1990]. Even if
this range is accurate, the high end and the low end of the range differ by a factor of
almost 20. Using one number or another will significantly affect the outcome of the
model.
5.4.2.2 Manipulation
Many of the data are based on subjective assumptions, so there are possibilities
that the system may be manipulated. Model and data can be used in one way or
another to achieve desired results. For example, one can place a large discount rate for
long term effects, thus, place greater burden on the future generation. Furthermore,
the data researched by the industries may be biased to achieve the desired outcome.
Monitoring is, therefore, very essential in keeping the system objective.
5.5 Final Remarks
There are four concluding remarks that can be drawn from this thesis. The
remarks represent changes that must be made to firm policies for environmental
concerns. They are the need for changes in corporate structure, the utilization of the
82
"cook book" approach, EPA involvement and the sharing of environmental data, and
public and environmental group involvement.
5.5.1 The Need for Changes in Organizational Structure
Few companies today are concerned with protect themselves against future
environmental liabilities. The strategy for pollution control has always been to reduce
rather than to prevent. The organizational structure in this case is a bottom up
approach. Engineers at the lower level direct the need for controlling the pollution to
achieve compliance. Development of greener product is a required step in avoiding
these liabilities. In developing greener products, there is an urgency to adapt a new
organizational structure. The new organizational structure is a combination of both the
top-down and bottom-up approaches. Top management in the corporate level should
fully support the research and development efforts to develop a greener product.
Engineers at the local level who better understand the manufacturing process better
should provide ideas on ways to produce product that reduces damage to the
environment.
5.5.2 the Importance of "Cook-Book" Type Approaches
Because of the large resources and expertise requirements, currently only very
large firms and governmental agencies are able to complete environmental assessment
studies. Smaller companies are often under-protected. Because small companies
together make up a very large percentage of most of the important industries, it is
urgent to develop environmental assessments that utilize the "cook-book" approaches
for small companies to employ. The knowledge based decision support system
described in Chapter Three is the easiest approach.
83
5.5.3 Sharing of Data and EPA Involvement
The environmental studies and data are very scattered, and the qualities of the
data are inconsistent. Some data that are done by industries are biased to achieve
certain results. There is a need to centralize these data and to discard the biased data.
The EPA has both the resource and the expertise for the task. When compiling the
data, it is very important that the EPA remain unbiased.
5.5.4 Public Participation
There is often an adversarial relationship between the companies (potential
polluters) and the public. The NIMBY approach by the local public has frustrated
many companies' effort to build new factories. To alleviate this problem, companies
should make the public more involved in the development process. The same can also
be done with the environmental groups. Having cooperation from the public and the
environmental groups more efficient than having confrontation. Unfortunately, this is
usually not the step taken by corporations.

84
85
References:
Ames, Bruce N.; Magaw, R.; Gold, S."Ranking Possible Carcinogenic Hazards", published in Readings in Risk,Resources for the Future, 1990: pp. 76-92.
Bailey, Paul E."Full Cost Accounting for Life Cycle Costs-A Guide for Engineers andFinancial Analysts", published in Environmental Finance, Spring 1991: pp. 13-29.
Baram, M.S.; Dillion, P.; Ruffle, B.Managing Chemical Risks, Lewis Publishing, 1992.
Bloom, Gordon F.; Morton, Michael S."Hazardous Waste is Every Manager's Problem", published in SloanManagement Review, MIT Sloan School of Management, summer 1991: pp.75-84.
Brown, Lex A."Environmental Impact Assessment in a Development Context", published inEnvironmental Impact Assessment Review, Elsevier Science Publishing Co.,Inc., 1989: pp. 317-327.
Buchholz, R. A.; Marcus, A.; Post, J.Managing Environmental Issues: A Casebook, Prentice Hall, 1992.
Craig, Donna"Social Impact Assessment: Politically Oriented Approaches and Applications",published in Environmental Impact Assessment Review, Elsevier SciencePublishing Co., Inc., 1990: pp. 37-53.
Elliot, M."Coping with Conflicting Perceptions of Risk in Hazardous Waste FacilitySiting Disputes. Diss., Massachusetts Institute of Technology, 1984.
Erikson, Kai"Toxic Reckoning: Business Faces a New Kind of Fear", Published in HarvardBusiness Review, Harvard Business School, Jan.-Feb., 1990: number 90105.
86
Felsenthal, Edward"No Exit: Mass Liability Suits Can Trap Minor Players that Prefer to Settle",the Wall Street Journal, Jan. 4, 1993.
Franklin Associates, Ltd.Energy and Environmental profile Analysis of Children's Single Use and ClothDiapers, Franklin associates, Ltd., May 1992.
Gardner, Julia E."Decision Making for Sustainable Development: Selected Approaches toEnvironmental Assessment and Management", published in EnvironmentalImpact Assessment Review, Elsevier Science Publishing Co., Inc., 1989: pp.337-367.
Golden, Jack; Ouellette, Robert P.; Saari, Sharon; Cheremisinoff, Paul N.Environmental Impact Data Book, Ann Arbor Science Publishers, Inc., 1979.
Hunt, Christopher B.; Auster E."Proactive Environmental Management: Avoiding the Toxic Trap", published inSloan Management Review, MIT Sloan School of Management, Winter 1990:pp. 7-18.
Kalkstein, Laurence S."Climate Change and Public Health: What Do We Know and Where Are WeGoing?", published in Environmental Impact Assessment Review, ElsevierScience Publishing Co., Inc., 1990: pp. 383-391.
Lind, R. C.Discounting for Time and Risk in Energy Policy, The Johns Hopkins UniversityPress, 1982.
Livesey, Sharon M."McDonald's and the Environment", Harvard Business School Case, HarvardCollege, 1991.
Martin, Julie E."Environmental Health Impact Assessment: Methods and Sources", publishedin Environmental Impact Assessment Review, Elsevier Science Publishing Co.,Inc., 1986: pp. 7-47.
87
McDonald, Geoffrey T."Regional Economic and Social Impact Assessment", published inEnvironmental Impact Assessment Review, Elsevier Science Publishing Co.,Inc., 1990: pp. 25-35.
Navin-Chandra, D.The Green Engineering Project: Designing Products for EnvironmentalCompatibility, Carnegie Mellon University, 1993
Nash, Jennifer; Nutt, K.; Maxwell, J.; Ehrenfeld, J."Polaroid's Environmental Accounting and Reporting System: Benefits andLimitations of a TQEM Measurement Tool", published in Total QualityEnvironmental Management, Autumn 1992: pp. 3-15.
Nassbaum, Bruce; Templeman, J."Built to Last-Until It's Time to Take It Apart", Business Week, Sept. 17,1990: pp. 102-106.
OECDEnvironmental Labeling in OECD Countries, Organization for Economic Do-Operation and Development, 1991.
Ortolano, LeonardEnvironmental Planning and Decision Making, John Wiley and Sons, Inc.,1984.
Quinby-Hunt, Mary S.; Wilde, P.; Dengler, A.T."Potential Environmental Impacts of Open-Cycle Thermal Energy Conversion",published in Environmental Impact Assessment Review, Elsevier SciencePublishing Co., Inc., 1986: pp. 77-91.
Ramsay, C. G."Assessment of Health and Risk", published in Perspectives on EnvironmentalImpact Assessment, Reidel, 1984.
Reinhardt, Forest L."Champion International Corporation", Harvard Business School Case, HarvardCollege, 1991.
Sheridan, John D."Getting Tougher with Toxics", published in the Environment, 1992: pp. 92-93.
Sibergeld, Ellen K."Toxic Hazards: Beyond Cancer to Other Health Effects Priorities", publishedin Environmental Impact Assessment Review, Elsevier Science Publishing Co.,Inc., 1990: pp. 433-449.
Simmons, Peter; Wynne, B."Industry Association Standard-Setting: Identity, Credibility and Trust",published in The Greening of Industry Research Needs and Policy Implicationsfor a Sustainable Future, 1991.
Siskind, Esther; Susskind, Lawrence E."The Incineration Conflicts: Addressing Public Concerns", published inEnvironmental Impact Assessment Review, Elsevier Science Publishing Co.,Inc., 1989: pp. 317-327.
Smart, B."Beyond Compliance: A New Industry View of the Environment", published inEngaging the Organization, World Resources Institute, 1992: pp. 97-120.
Smock, Doug"Plastics in New Opels Will Be 'Easily Recyclable", published in Plastic World,April, 1992: pg. 12.
Susskind, Lawrence"The Siting Puzzle: Balancing Economic and Environmental Gains and Losses",published in Environmental Impact Assessment Review, Elsevier SciencePublishing Co., Inc., 1985: pp. 157-163.
Titenburg, T.Environmental and Natural Resource Economics, Scott Foresman, 3d ed., 1992.
Tye, William B."Microeconomics Measurement of the Social Costs of EnvironmentalRegulation", published in Environmental Impact Assessment Review, ElsevierScience Publishing Co., Inc., 1985: pp. 117-131.
WCEDBrundtland Report, WCED, 1987: p.43.
89
Whittington, Dale; Drummond, William"An Examination of EPA's Regulatory Impact Analysis of EnvironmentalStandards for Uranium Mill Tailings", published in Environmental ImpactAssessment Review, Elsevier Science Publishing Co., Inc., 1986: pp. 233-251.
World BankThe Environment, Public Health and Human Ecology: Considerations forEconomic Development, Washington D.C., World Bank, 1982.