Embed Size (px)
Citation preview
Economic Modeling Specialists Inc. • 1187 Alturas Dr., Moscow ID 83843 (866) 999-3674 • www.economicmodeling.com
The
ECONOMIC IMPACTA Look at Jobs and Earnings in Wood County, Wisconsin
OF FRAC SAND MINING

Acknowledgments / i
ACKNOWLEDGMENTS
We gratefully acknowledge the staff of the City of Marshfield, particularly Jason Angell, Director of Plan-ning & Economic Development, who contributed in the advising, industry networking, and data collection. We also thank the local industry management and exec-utives who provided time, insight into the operations, and data. CENTERGY Inc. is especially acknowledged
for providing financial support for this project. Any errors in the report are those of the authors and not the aforementioned individuals. This project was led by EMSI staff members Hank Robison, Chief Economist; Timothy Nadreau, Senior Research Econo-mist; and Joshua Wright, Senior Editor.

ii / The Economic Impact of Frac Sand Mining: A Look at Jobs and Earnings in Wood County, Wisconsin
EXECUTIVE SUMMARY
The purpose of this analysis is to show the impact of development and expansion of the “frac sand” mining industry in Wood County, Wisconsin. Impacts are reported in terms of newly created jobs and newly
created earnings (i.e., labor income). We also estimate the creation of new revenues to county and local gov-ernments.
Key Highlights• New frac sand plant and transport facility
investments amounting to over $161 million is projected to occur over the first seven years of the project, including $86 million in the first 18 months, and another $75 million over the subsequent 5½ years.
• In the first year of the project, new facilities con-struction will result in the creation of approxi-mately 616 new jobs and some $33.3 million in new earnings in Wood County.
• By Year 3 of the project, with plants, mining, and transport facilities in place, frac sand pro-duction will account for approximately 700 new
jobs and over $42.8 million in Wood County earnings.
• By Year 8 of the project, with both initial and expansion phase investments in place, frac sand production will account for nearly 930 per-manent jobs and over $58.7 million in Wood County earnings.
• Frac sand mining will create an array of new county and local government revenues in Wood County. These revenues are estimated to be roughly $1.5 million in Year 1 of the project, growing to nearly $2.6 million per year by Year 8 and continuing at roughly that level every year thereafter.

Introduction / iii
INTRODUCTION
With the growing demand for hydraulic fracturing and the discovery and extraction of natural gas in the Marcellus Shale, Wood County, Wisconsin is poised to expand its mining and manufacturing of silica sands that are plentiful in the region. The purpose of this analysis is to show the impact of development and expansion of the “frac sand” mining industry in Wood County. The frac sands operations include four major components:
• Quarrying: Operating heavy mining equipment, workers extract unprocessed sands from well-defined deposits. Wages are paid, taxes are paid, inputs are purchased, and profits are generated.
• Hauling: Trucks and trains haul unprocessed sands from quarry sites to processing plants. Again, wages are paid, taxes are paid, inputs are purchased, and profits are generated.
• Processing: Plants representing significant capital investments receive the unprocessed sands and clean and otherwise refine these into finished product ready for shipment. Wages are paid, taxes are paid, inputs are purchased, and profits are generated.
• Out-Shipping: Rail and truck transport finished product to final users outside Wood County.
Based on data and discussions provided by members in the industry and City of Marshfield officials, we break our analysis into three phases: 1) initial construc-tion, 2) operations and expansion, and 3) full opera-tion. Capital investments will occur through Phases 1 and 2; after that the industry will settle in Phase 3 into something approximating a steady equilibrium. In equilibrium, the industry will support a more or less constant number of employees, purchase a stable amount of local production inputs, and pay local taxes.

iv / The Economic Impact of Frac Sand Mining: A Look at Jobs and Earnings in Wood County, Wisconsin
TABLE OF CONTENTS
Acknowledgments / i
Executive Summary / ii
Introduction / iii
Phase 1: Initial Investment Impacts / 11 Plant Construction2 Rail Construction2 Total Impacts
Phase 2: Expansion & Operations / 44 Phase 2 Capital Expansion6 Phase 2 Operations
Phase 3: Full Operation / 7
Summary and Conclusions / 8
Appendix 1: Input-Output Modeling / 10
Appendix 2: About the Authors / 13

Phase 1: Initial Investment Impacts / 1
PHASE 1: INITIAL INVESTMENT IMPACTS
Phase 1 captures the main construction part of the proj-ect. These capital construction investments are expected to last 18 months and result in investment spending of $86 million. At the end of Phase 1, operations of the refinery plants and mining will begin.
Plant ConstructionConstruction in Phase 1 puts in place the initial instal-lation of plant and transport infrastructure. Table 1.1 below focuses on plant construction alone, estimated to account for $65.2 million of the overall $86.0 million in Phase 1 costs. The impacts of transport construction are considered in the next section. Table 1.1 reports the creation of new labor income (also called “earnings”) in Wood County over the 18 months of Phase 1 new plant construction. Even though plant construction is composed of $65.2 million in spending, we convert this spending into earnings to cap-ture the creation of new income in the Wood County
economy. For more on the differences between spending and earnings, please refer to the box on the following page. The first two columns of Table 1.1 show the North American Industry Classification System (NAICS) Code and industry description. The column labeled “initial” shows earnings in the construction devoted to building $65.2 million in new plant infrastructure. The second column shows the multiplier effects, reported as new earnings, resulting from the initial spending on plant construction. In general, multiplier effects result from the spending on input supplies by the construction sec-tor itself (sometimes called “direct effects), the additional labor income created in firms that supply the suppli-ers (sometimes called “indirect effects”), and the labor income created as a result of consumer expenditures from income generated in the initial, direct, and indirect rounds of spending (sometimes called “induced effects”). The final column sums the initial and multiplier effects of the $65.2 million in new plant infrastructure
Table 1.1: Earnings Impacts of $65.2 Million Spending on Plant Construction
NAICS Code Industry description Initial Effects Multiplier EffectsTotal
Effects212322 Frac-Sands Processing $0 $0 $0212322 Frac-Sands Mining $0 $0 $0482112 Frac-Sands Ore Haulage $0 $0 $021 All other Mining $0 $45,754 $45,75411 Agriculture, Forestry, Fishing and Hunting $0 $46,908 $46,90822, 23 Utilities, Construction $30,273,845 $659,760 $30,933,60531–33 Manufacturing $0 $1,072,492 $1,072,49242, 44, 45 Trade $0 $1,366,327 $1,366,32748, 49 Transportation and Warehousing $0 $336,029 $336,02951, 52, 53 Finance, Insurance, Information, Real Estate $0 $708,988 $708,98854, 55, 56 Professional, Management, Administrative Services $0 $990,697 $990,69761, 62, 71 Education, Health Care, Arts, Misc. Services $0 $1,226,670 $1,226,67072, 81 Accommodation, Food, Misc. Services $0 $588,082 $588,08290 Government $0 $538,954 $538,954
TOTAL $30,273,845 $7,580,661 $37,854,506

2 / The Economic Impact of Frac Sand Mining: A Look at Jobs and Earnings in Wood County, Wisconsin
investment. Three sectors see over $1 million in new earnings: “manufacturing,” “retail trade,” and “health care and social assistance.” Other sectors are impacted as shown in the table. Altogether, the construction of new frac sands plants initially creates approximately $30.3 million in new earnings in the construction sector alone, and some $7.6 million in additional multiplier effect earnings. In total, Phase 1 construction amounts to $37,854,506 in new earnings.
Rail ConstructionThe other large construction taking place in Phase 1 is in rail transport. An estimated $20.8 million is to be spent on upgrades to existing rail lines and construc-tion of new rail lines. The new earnings created by this spending are shown in Table 1.2 on the following page. Following a parallel logic to that described above for the new plant investment impact, and summing the initial plus multiplier effects, yields a total rail construc-tion impact of $12,099,826 in new earnings.
Total ImpactsWe can sum the impacts of plant and rail construction to get the total 18-month impacts resulting from the $86 million in initial investment. Initial investment impacts on Wood County result in a total of $49,954,332 in additional earnings—the total of impacts for plant (Table 1.1) and rail (Table 1.2). Because of the time component to this investment (i.e., 18 months), we constructed Table 1.3 that details earnings impacts for Year 1 versus Year 2. Phase 1 con-struction creates a total of $33.3 million in new earnings in Year 1, and half that amount, approximately $16.7 million, in Year 2. Table 1.4 shows job impacts. In the case of jobs some additional clarification is in order. As described above, it takes 18 months to complete Phase 1 and absent finer detail on the specific timing of expenditures we are obliged to assume an approximately even expenditure flow. Accordingly, we assume two-thirds of the invest-ment takes place in Year 1 and this in turn creates 606 full-year jobs (as shown in Table 1.4). Year 2 is different; it starts with the same level of day-to-day jobs, 606, but
Sales vs. EarningsAdvocates sometimes favor gross sales over earnings as an impact measure, because sales are always larger than the earnings. Using this as an impact measure has notable drawbacks, however. An immediate drawback is that, unlike earnings, there is generally no published total against which a sales impact can be measured. More importantly, though, the most troublesome aspect of gross sales impact measures is captured in the following example: Two visitors spend $50,000 each in the economic region. One visits a local auto dealer and purchases a new luxury automobile. The other undergoes a medical procedure at the local hospital. In terms of direct economic impact, both have spent $50,000. However, the expenditures will likely have very differ-ent meanings to the local economy. Of the $50,000 spent for the luxury automobile, perhaps $10,000 remains in the county as salesperson commissions and auto dealer income (part of the economic region’s overall earnings), while the other $40,000 leaves the area for Detroit or somewhere else as wholesale pay-ment for the new automobile. Contrast this to the hospital expenditure. Here perhaps $40,000 appears as physician, nurse, and assorted hospital employee wages (part of the county’s overall earnings), while only $10,000 leaves the area, to pay for hospital supplies, or to help amortize building and equipment loans. In terms of sales, both have the same impact, while in terms of earnings, the former has one-fourth the impact of the latter.

Phase 1: Initial Investment Impacts / 3
the project concludes at the half-year mark (i.e., at the overall end of the 18 month investment period). So as not to confuse with the full-year investment (Year 1),
we show created jobs in a full-year equivalent sense: so 606 jobs over a six-month period is reported in Table 1.4 as 303 jobs.
Table 1.3: Earnings Impacts By Year of $65.2 Million Spending
on Plant ConstructionNAICS Code Industry description Year 1 Year 2212322 Frac-Sands Processing $0 $0212322 Frac-Sands Mining $0 $0482112 Frac-Sands Ore Haulage $0 $021 All other Mining $40,255 $20,127
11 Agriculture, Forestry, Fishing and Hunting $41,208 $20,604
22,23 Utilities, Construction $27,220,282 $13,610,14131-33 Manufacturing $943,701 $471,85042, 44,45 Trade $1,200,883 $600,44248,49 Transportation and Warehousing $295,501 $147,751
51, 52, 53 Finance, Insurance, Information, Real Estate $623,223 $311,612
54, 55, 56 Professional, Management, Adminis-trative Services $871,515 $435,757
61, 62, 71 Education, Health Care, Arts, Misc. Services $1,075,940 $537,970
72,81 Accommodation, Food, Misc. Ser-vices $516,735 $258,367
90 Government $473,645 $236,823TOTAL $33,302,888 $16,651,444
Table 1.4: Jobs Impacts By Year of $65.2 Million Spending on
Plant ConstructionNAICS Code Industry description Year 1 Year 2212322 Frac-Sands Processing 0 0212322 Frac-Sands Mining 0 0482112 Frac-Sands Ore Haulage 0 021 All other Mining 0 0
11 Agriculture, Forestry, Fishing and Hunting 1 1
22,23 Utilities, Construction 480 24031-33 Manufacturing 14 742, 44,45 Trade 28 1448,49 Transportation and Warehousing 6 3
51, 52, 53 Finance, Insurance, Information, Real Estate 11 5
54, 55, 56 Professional, Management, Adminis-trative Services 19 10
61, 62, 71 Education, Health Care, Arts, Misc. Services 32 16
72,81 Accommodation, Food, Misc. Ser-vices 18 9
90 Government 8 4
TOTAL 616 308
Table 1.2: Earnings Impacts of $20.8 Million Spending on Rail Transport
NAICS Code Industry descriptionInitial
Effects Multiplier EffectsTotal
Effects212322 Frac-Sands Processing $0 $0 $0212322 Frac-Sands Mining $0 $0 $0482112 Frac-Sands Ore Haulage $0 $0 $021 All other Mining $0 $14,628 $14,62811 Agriculture, Forestry, Fishing and Hunting $0 $14,904 $14,90422,23 Utilities, Construction $9,687,524 $209,294 $9,896,81831-33 Manufacturing $0 $343,059 $343,05942, 44,45 Trade $0 $434,998 $434,99848,49 Transportation and Warehousing $0 $107,223 $107,22351, 52, 53 Finance, Insurance, Information, Real Estate $0 $225,847 $225,84754, 55, 56 Professional, Management, Administrative Services $0 $316,575 $316,57561, 62, 71 Education, Health Care, Arts, Misc. Services $0 $387,240 $387,24072,81 Accommodation, Food, Misc. Services $0 $187,020 $187,02090 Government $0 $171,514 $171,514
TOTAL $9,687,524 $2,412,302 $12,099,826

4 / The Economic Impact of Frac Sand Mining: A Look at Jobs and Earnings in Wood County, Wisconsin
PHASE 2: EXPANSION & OPERATIONS
In Phase 2 the plants and rail transport constructed in Phase 1 become fully operational. But this is not all—production capacities continue to grow though additional infusions of capital investment, this time extending over a five-year period. Phase 2 begins at the midpoint of the second year of the analysis, at the conclusion of Phase 1. The five-year capital expansion entails $75 million in additional investment spending that, for the sake of simplicity, we assume is equally distributed over the five-year period. Operations of the local plants and raw sand extraction from the mining pits also begin in this period. Readers will note the different effects on jobs and earnings resulting from construction (the initial invest-ment shown in the previous section and expansion
investment shown in this section) and the day-to-day ongoing operations of the frac sands mines and process-ing plants. At the conclusion of construction phases, those jobs and their associated earnings cease. In con-trast, jobs and earnings from ongoing plant operations are of a more permanent character.
Phase 2 Capital ExpansionThe beginnings of the $75 million in plant invest-ments under Phase 2 follow immediately on the heel of Phase 1’s $86 million initial investment (i.e., at the midpoint of Year 2 of the analysis). The total impacts of this investment, including the multiplier effects, are shown below in Table 2.1. Notice that the initial
Table 2.1: Impacts of $75 million Spending on Capital ExpansionNAICS CODE Industry description Initial Effects Multiplier Effects Total Effects212322 Frac-Sands Processing $0 $0 $0212322 Frac-Sands Mining $0 $0 $0482112 Frac-Sands Ore Haulage $0 $0 $021 All other Mining $0 $52,671 $52,67111 Agriculture, Forestry, Fishing and Hunting $0 $53,999 $53,99922,23 Utilities, Contruction $34,850,400 $759,498 $35,609,89831-33 Manufacturing $0 $1,234,623 $1,234,62342, 44,45 Trade $0 $1,572,878 $1,572,87848,49 Transportation and Warehousing $0 $386,826 $386,82651, 52, 53 Finance, Insurance, Information, Real Estate $0 $816,166 $816,16654, 55, 56 Professional, Management, Administrative Services $0 $1,140,462 $1,140,46261, 62, 71 Education, Health Care, Arts, Misc. Services $0 $1,412,107 $1,412,10772,81 Accommodation, Food, Misc. Services $0 $676,983 $676,98390 Government $0 $620,428 $620,428
61 Total $34,850,400 $8,726,641 $43,577,041
Phase 2: Expansion & Operations / 5
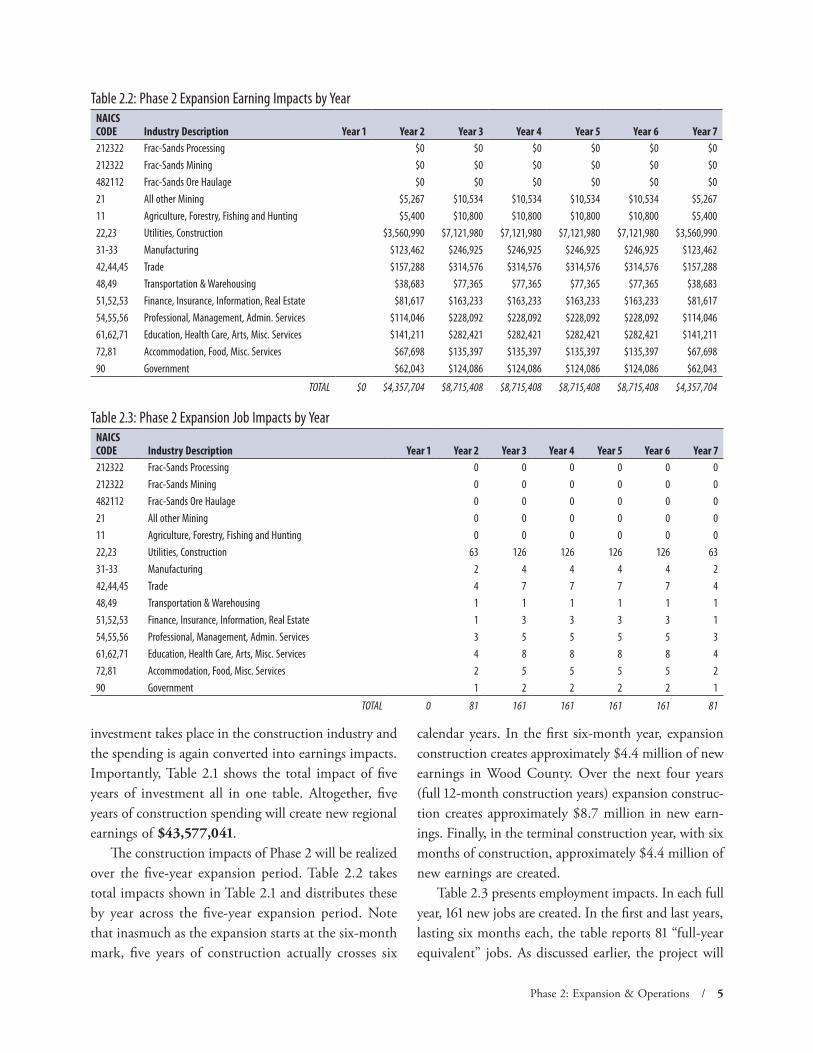
investment takes place in the construction industry and the spending is again converted into earnings impacts. Importantly, Table 2.1 shows the total impact of five years of investment all in one table. Altogether, five years of construction spending will create new regional earnings of $43,577,041. The construction impacts of Phase 2 will be realized over the five-year expansion period. Table 2.2 takes total impacts shown in Table 2.1 and distributes these by year across the five-year expansion period. Note that inasmuch as the expansion starts at the six-month mark, five years of construction actually crosses six
calendar years. In the first six-month year, expansion construction creates approximately $4.4 million of new earnings in Wood County. Over the next four years (full 12-month construction years) expansion construc-tion creates approximately $8.7 million in new earn-ings. Finally, in the terminal construction year, with six months of construction, approximately $4.4 million of new earnings are created. Table 2.3 presents employment impacts. In each full year, 161 new jobs are created. In the first and last years, lasting six months each, the table reports 81 “full-year equivalent” jobs. As discussed earlier, the project will
Table 2.2: Phase 2 Expansion Earning Impacts by YearNAICS CODE Industry Description Year 1 Year 2 Year 3 Year 4 Year 5 Year 6 Year 7212322 Frac-Sands Processing $0 $0 $0 $0 $0 $0212322 Frac-Sands Mining $0 $0 $0 $0 $0 $0482112 Frac-Sands Ore Haulage $0 $0 $0 $0 $0 $021 All other Mining $5,267 $10,534 $10,534 $10,534 $10,534 $5,26711 Agriculture, Forestry, Fishing and Hunting $5,400 $10,800 $10,800 $10,800 $10,800 $5,40022,23 Utilities, Construction $3,560,990 $7,121,980 $7,121,980 $7,121,980 $7,121,980 $3,560,99031-33 Manufacturing $123,462 $246,925 $246,925 $246,925 $246,925 $123,46242,44,45 Trade $157,288 $314,576 $314,576 $314,576 $314,576 $157,28848,49 Transportation & Warehousing $38,683 $77,365 $77,365 $77,365 $77,365 $38,68351,52,53 Finance, Insurance, Information, Real Estate $81,617 $163,233 $163,233 $163,233 $163,233 $81,61754,55,56 Professional, Management, Admin. Services $114,046 $228,092 $228,092 $228,092 $228,092 $114,04661,62,71 Education, Health Care, Arts, Misc. Services $141,211 $282,421 $282,421 $282,421 $282,421 $141,21172,81 Accommodation, Food, Misc. Services $67,698 $135,397 $135,397 $135,397 $135,397 $67,69890 Government $62,043 $124,086 $124,086 $124,086 $124,086 $62,043
TOTAL $0 $4,357,704 $8,715,408 $8,715,408 $8,715,408 $8,715,408 $4,357,704
Table 2.3: Phase 2 Expansion Job Impacts by YearNAICS CODE Industry Description Year 1 Year 2 Year 3 Year 4 Year 5 Year 6 Year 7212322 Frac-Sands Processing 0 0 0 0 0 0212322 Frac-Sands Mining 0 0 0 0 0 0482112 Frac-Sands Ore Haulage 0 0 0 0 0 021 All other Mining 0 0 0 0 0 011 Agriculture, Forestry, Fishing and Hunting 0 0 0 0 0 022,23 Utilities, Construction 63 126 126 126 126 6331-33 Manufacturing 2 4 4 4 4 242,44,45 Trade 4 7 7 7 7 448,49 Transportation & Warehousing 1 1 1 1 1 151,52,53 Finance, Insurance, Information, Real Estate 1 3 3 3 3 154,55,56 Professional, Management, Admin. Services 3 5 5 5 5 361,62,71 Education, Health Care, Arts, Misc. Services 4 8 8 8 8 472,81 Accommodation, Food, Misc. Services 2 5 5 5 5 290 Government 1 2 2 2 2 1
TOTAL 0 81 161 161 161 161 81

6 / The Economic Impact of Frac Sand Mining: A Look at Jobs and Earnings in Wood County, Wisconsin
actually create 161 jobs, but for only six months, so we accordingly display these as 81 full-year equivalent jobs.
Phase 2 OperationsOperations are set to begin at the 18-month mark, at the conclusion of the initial $86 million new plant and rail transport investment. The operating scale of the plants will continue to grow as a result of the five additional years of investment ($75 million) discussed in the preceding sub-section. The new jobs and earnings in plant and transport operations begin in the middle
of Year 2. Table 2.4 shows the earnings related to the operation of the plants. They will operate for six months in Year 2 and grow steadily until operating at nearly full capacity in Year 7 at the end of the expansion process. Table 2.5 tells the same story in terms of operating jobs. Altogether, plant, transport, and mining operations will create approximately $15.7 million in new earn-ings in the first year (a six-month year) of operations, approximately $31.1 million in Year 2, and over $56 million in the final Year 7 of development, at the con-clusion of expansion investment.
Table 2.4: Phase 2 Operations Earning Impacts by YearNAICS CODE Industry Description Year 1 Year 2 Year 3 Year 4 Year 5 Year 6 Year 7212322 Frac-Sands Processing $7,338,007 $15,955,899 $18,515,669 $21,075,439 $23,635,209 $26,194,979212322 Frac-Sands Mining $2,201,402 $4,786,770 $5,554,701 $6,322,632 $7,090,563 $7,858,494482112 Frac-Sands Ore Haulage $2,440,480 $5,306,626 $6,157,956 $7,009,287 $7,860,617 $8,711,94821 All other Mining $0 $0 $0 $0 $0 $011 Agriculture, Forestry, Fishing and Hunting $31,231 $67,909 $78,803 $89,698 $100,592 $111,48722,23 Utilities, Construction $226,920 $493,419 $572,577 $651,735 $730,893 $810,05231-33 Manufacturing $197,610 $429,687 $498,621 $567,554 $636,488 $705,42242,44,45 Trade $822,890 $1,789,307 $2,076,362 $2,363,417 $2,650,471 $2,937,52648,49 Transportation & Warehousing $52,330 $113,787 $132,042 $150,297 $168,551 $186,80651,52,53 Finance, Insurance, Info., Real Estate $567,700 $1,234,417 $1,432,452 $1,630,487 $1,828,522 $2,026,55754,55,56 Profess., Management, Admin. Services $455,900 $991,317 $1,150,352 $1,309,387 $1,468,422 $1,627,45761,62,71 Educ, Health Care, Arts, Misc. Services $672,800 $1,462,949 $1,697,647 $1,932,344 $2,167,042 $2,401,74072,81 Accommodation, Food, Misc. Services $499,290 $1,085,665 $1,259,836 $1,434,007 $1,608,178 $1,782,34990 Government $184,680 $401,572 $465,995 $530,418 $594,841 $659,265
TOTAL $0 $15,691,240 $34,119,325 $39,593,014 $45,066,702 $50,540,391 $56,014,079
Table 2.5: Phase 2 Operations Jobs Impacts by YearNAICS CODE Industry Description Year 1 Year 2 Year 3 Year 4 Year 5 Year 6 Year 7212322 Frac-Sands Processing 100 217 252 287 322 357212322 Frac-Sands Mining 30 65 76 86 97 107482112 Frac-Sands Ore Haulage 30 65 76 86 97 10721 All other Mining 0 0 0 0 0 011 Agriculture, Forestry, Fishing and Hunting 1 2 3 3 3 422,23 Utilities, Contruction 4 9 10 11 13 1431-33 Manufacturing 3 7 8 9 10 1142,44,45 Trade 19 41 48 55 61 6848,49 Transportation and Warehousing 1 2 3 3 3 451,52,53 Finance, Insurance, Information, Real Estate 10 22 25 29 32 3654,55,56 Professional, Management, Administrative Services 10 22 25 29 32 3661,62,71 Education, Health Care, Arts, Misc. Services 20 43 50 57 64 7172,81 Accommodation, Food, Misc. Services 17 37 43 49 55 6190 Government 3 7 8 9 10 11
TOTAL 0 248 539 626 712 799 885

Phase 3: Full Operation / 7
PHASE 3: FULL OPERATION
Phase 3 captures operations impacts after all investment ($86 million initial investment and $75 million expan-sion investment) has taken place. The earnings and jobs in Phase 3 are permanent jobs, reflecting plant, trans-port, and mining operation at full capacity. Beyond this
point no construction impacts will occur. The plants are assumed to be in a steady state of operations. Tables 3.1 and 3.2 show the earning and job impacts stretching out into the future for as long as the plants continue.
Table 3.1: Phase 3 Operations Earning Impacts by YearNAICS CODE Industry Description Year 8 Year 9 Year 10212322 Frac-Sands Processing $27,474,864 $27,474,864 $27,474,864
•••
212322 Frac-Sands Mining $8,242,459 $8,242,459 $8,242,459482112 Frac-Sands Ore Haulage $9,137,613 $9,137,613 $9,137,61321 All other Mining $0 $0 $011 Agriculture, Forestry, Fishing and Hunting $116,934 $116,934 $116,93422,23 Utilities, Construction $849,631 $849,631 $849,63131-33 Manufacturing $739,889 $739,889 $739,88942,44,45 Trade $3,081,053 $3,081,053 $3,081,05348,49 Transportation & Warehousing $195,933 $195,933 $195,93351,52,53 Finance, Insurance, Information, Real Estate $2,125,574 $2,125,574 $2,125,57454,55,56 Professional, Management, Administrative Services $1,706,974 $1,706,974 $1,706,97461,62,71 Education, Health Care, Arts, Misc. Services $2,519,088 $2,519,088 $2,519,08872,81 Accommodation, Food, Misc. Services $1,869,435 $1,869,435 $1,869,43590 Government $691,476 $691,476 $691,476
TOTAL $58,750,924 $58,750,924 $58,750,924
Table 3.2: Phase 3 Operations Job Impacts by YearNAICS CODE Industry Description Year 8 Year 9 Year 10212322 Frac-Sands Processing 374 374 374
•••
212322 Frac-Sands Mining 112 112 112482112 Frac-Sands Ore Haulage 112 112 11221 All other Mining 0 0 011 Agriculture, Forestry, Fishing and Hunting 4 4 422,23 Utilities, Construction 15 15 1531-33 Manufacturing 11 11 1142,44,45 Trade 71 71 7148,49 Transportation & Warehousing 4 4 451,52,53 Finance, Insurance, Information, Real Estate 37 37 3754,55,56 Professional, Management, Administrative Services 37 37 3761,62,71 Education, Health Care, Arts, Misc. Services 75 75 7572,81 Accommodation, Food, Misc. Services 64 64 6490 Government 11 11 11
TOTAL 929 929 929
8 / The Economic Impact of Frac Sand Mining: A Look at Jobs and Earnings in Wood County, Wisconsin
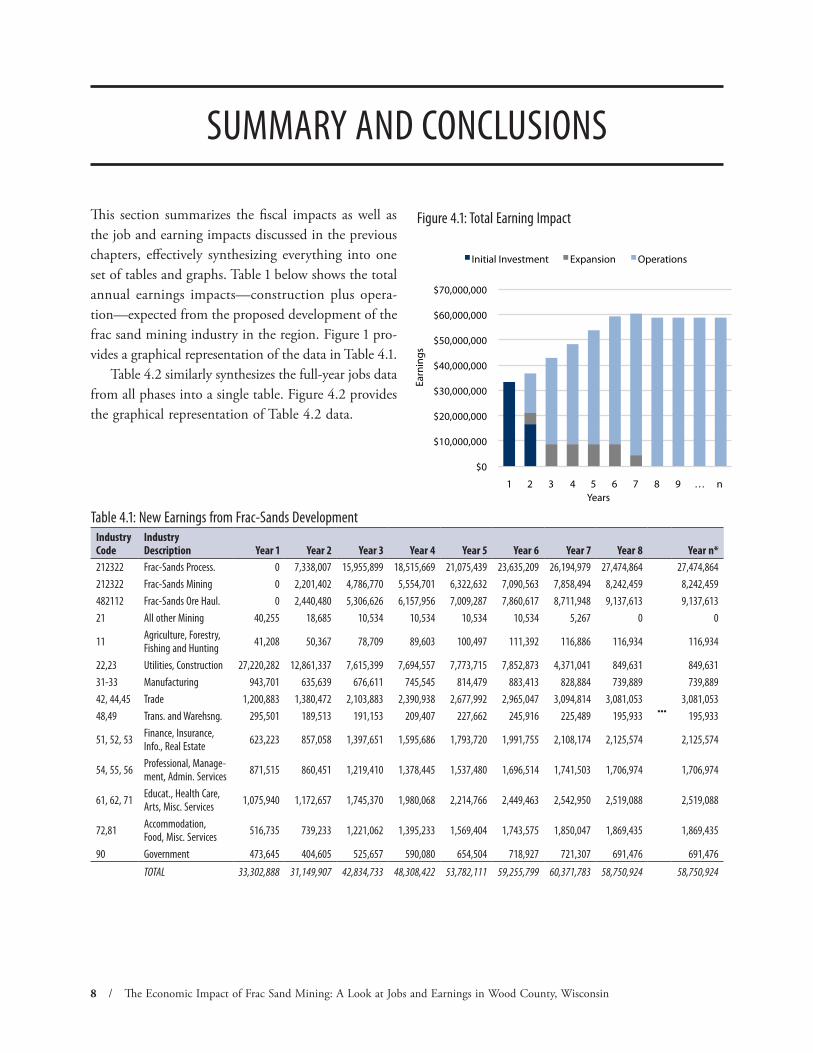
$0
$10,000,000
$20,000,000
$30,000,000
$40,000,000
$50,000,000
$60,000,000
$70,000,000
1 2 3 4 5 6 7 8 9 … n
Earn
ings
Years
Initial Investment Expansion Operations
SUMMARY AND CONCLUSIONS
Table 4.1: New Earnings from Frac-Sands DevelopmentIndustry Code
Industry Description Year 1 Year 2 Year 3 Year 4 Year 5 Year 6 Year 7 Year 8 Year n*
212322 Frac-Sands Process. 0 7,338,007 15,955,899 18,515,669 21,075,439 23,635,209 26,194,979 27,474,864
•••
27,474,864212322 Frac-Sands Mining 0 2,201,402 4,786,770 5,554,701 6,322,632 7,090,563 7,858,494 8,242,459 8,242,459482112 Frac-Sands Ore Haul. 0 2,440,480 5,306,626 6,157,956 7,009,287 7,860,617 8,711,948 9,137,613 9,137,61321 All other Mining 40,255 18,685 10,534 10,534 10,534 10,534 5,267 0 0
11 Agriculture, Forestry, Fishing and Hunting 41,208 50,367 78,709 89,603 100,497 111,392 116,886 116,934 116,934
22,23 Utilities, Construction 27,220,282 12,861,337 7,615,399 7,694,557 7,773,715 7,852,873 4,371,041 849,631 849,63131-33 Manufacturing 943,701 635,639 676,611 745,545 814,479 883,413 828,884 739,889 739,88942, 44,45 Trade 1,200,883 1,380,472 2,103,883 2,390,938 2,677,992 2,965,047 3,094,814 3,081,053 3,081,05348,49 Trans. and Warehsng. 295,501 189,513 191,153 209,407 227,662 245,916 225,489 195,933 195,933
51, 52, 53 Finance, Insurance, Info., Real Estate 623,223 857,058 1,397,651 1,595,686 1,793,720 1,991,755 2,108,174 2,125,574 2,125,574
54, 55, 56 Professional, Manage-ment, Admin. Services 871,515 860,451 1,219,410 1,378,445 1,537,480 1,696,514 1,741,503 1,706,974 1,706,974
61, 62, 71 Educat., Health Care, Arts, Misc. Services 1,075,940 1,172,657 1,745,370 1,980,068 2,214,766 2,449,463 2,542,950 2,519,088 2,519,088
72,81 Accommodation, Food, Misc. Services 516,735 739,233 1,221,062 1,395,233 1,569,404 1,743,575 1,850,047 1,869,435 1,869,435
90 Government 473,645 404,605 525,657 590,080 654,504 718,927 721,307 691,476 691,476
TOTAL 33,302,888 31,149,907 42,834,733 48,308,422 53,782,111 59,255,799 60,371,783 58,750,924 58,750,924
Figure 4.1: Total Earning ImpactThis section summarizes the fiscal impacts as well as the job and earning impacts discussed in the previous chapters, effectively synthesizing everything into one set of tables and graphs. Table 1 below shows the total annual earnings impacts—construction plus opera-tion—expected from the proposed development of the frac sand mining industry in the region. Figure 1 pro-vides a graphical representation of the data in Table 4.1. Table 4.2 similarly synthesizes the full-year jobs data from all phases into a single table. Figure 4.2 provides the graphical representation of Table 4.2 data.

Summary and Conclusions / 9
Now that the earnings and jobs data have been syn-thesized we can look at the expected annual impacts on government revenues. Table 4.3 shows total government revenue impacts broken out according to five separate entities: City of Marshfield, Wood County, Mid-State Technical College, Marshfield School District, and “all other.” In Year 1 (with the commencement of Phase 1 construction), total increase government revenues amount to approximately $1.5 million. This figure eventually climbs to nearly $2.6 million in Year 8 and beyond.
Table 4.2: New Jobs from Frac-Sands DevelopmentIndustry Code
Industry Description Year 1 Year 2 Year 3 Year 4 Year 5 Year 6 Year 7 Year 8 Year n*
212322 Frac-Sands Process. 0 100 217 252 287 322 357 374
•••
374212322 Frac-Sands Mining 0 30 65 76 86 97 107 112 112482112 Frac-Sands Ore Haul. 0 30 65 76 86 97 107 112 11221 All other Mining 0 0 0 0 0 0 0 0 011 Agriculture, Forestry, Fishing and Hunting 1 2 3 3 3 4 4 4 422,23 Utilities, Construction 480 227 134 136 137 138 77 15 1531-33 Manufacturing 14 10 10 11 12 13 13 11 1142, 44,45 Trade 28 32 49 55 62 68 71 71 7148,49 Trans. and Warehsng. 6 4 4 4 4 5 4 4 451, 52, 53 Finance, Insurance, Info., Real Estate 11 15 25 28 32 35 37 37 3754, 55, 56 Professional, Management, Admin. Services 19 19 27 30 34 37 38 37 3761, 62, 71 Educat., Health Care, Arts, Misc. Services 32 35 52 59 66 73 76 75 7572,81 Accommodation, Food, Misc. Services 18 25 42 48 53 59 63 64 6490 Government 8 7 9 10 11 12 12 11 11
TOTAL 616 534 701 787 874 960 966 929 929
Figure 4.2: Total Job Impacts by Year
0
200
400
600
800
1000
1200
1 2 3 4 5 6 7 8 9 … n
Jobs
Years
Initial Investment Expansion Operations
Table 4.3: New Tax Revenues from Frac Sand DevelopmentCHANGE IN TAX REVENUES 1 2 3 4 5 6 7 8 Year n*City of Marshfield $426,277 $398,719 $548,285 $618,348 $688,411 $758,474 $772,759 $752,012
•••
$752,012Wood County $220,751 $206,479 $283,933 $320,216 $356,499 $392,781 $400,179 $389,435 $389,435Mid-State Technical College $77,072 $72,090 $99,132 $111,799 $124,467 $137,135 $139,718 $135,966 $135,966Marshfield School District $434,365 $406,284 $558,687 $630,080 $701,472 $772,865 $787,421 $766,280 $766,280Other $306,862 $287,024 $394,691 $445,128 $495,564 $546,000 $556,283 $541,348 $541,348
TOTAL $1,465,327 $1,370,596 $1,884,728 $2,125,571 $2,366,413 $2,607,255 $2,656,358 $2,585,041 $2,585,041

10 / The Economic Impact of Frac Sand Mining: A Look at Jobs and Earnings in Wood County, Wisconsin
APPENDIX 1: INPUT-OUTPUT MODELING
Introduction and data sourcesEMSI’s input-output model represents the economic relationships among a region’s industries, with particular reference to how much each industry purchases from each other industry. Using a complex, automated pro-cess, we can create regionalized models for geographic areas comprised by counties or ZIP codes in the United States. Our primary data sources are the following:
1. The Industry Economic Accounts from the Bureau of Economic Analysis (BEA); specifically the “make” and “use” tables from the annual and benchmark input-output accounts.
2. Regional and national jobs-by-industry totals, and national sales-to-jobs ratios (from EMSI’s industry employment and earnings data process).
3. Proprietor earnings from State and Local Personal Income Reports (BEA).
Creation of the national Z matrixThe BEA “make” and “use” tables (MUTs) show which industries make or use which commodity types. These two tables are combined to replace the industry-com-modity-industry relationships with simple industry-industry relationships in dollar terms. This is called the
national “Z” matrix, which shows the total amount ($) each industry purchases from others. Industry purchases run down the columns, while industry sales run across the rows. The value 1,532.5 in this table means that Industry 2 purchases $1,532,500,000 worth of commodities and/or services from Industry 1. The whole table is basically an economic double-entry accounting system, configured so that all money inflows have corresponding outflows elsewhere. In addition to regular industries (such as “oil and gas extraction,” “machinery manufacturing,” “food and beverage stores,” “hospitals,” and so on), there are three additional rows representing labor earnings, profits, and business taxes, which together represent industry “value added” and account for the fact that industries do not spend all of their income on inputs from other industries. There are also three rows and columns rep-resenting federal, state, and local government (we later separate federal government into civilian and military sectors). We create two separate Z matrices since there are two sets of MUTs—annual and benchmark. The bench-mark data are produced every five years with a five-year lag and specify up to 500 industry sectors; annual data have a one-year lag but specify only 80 industrial sec-tors. The basic equation is as follows:
Z = VQˆ– 1Uwhere V is the industry “make” table, Qˆ– 1 is a vector of total gross commodity output, and U is the industry “use” table. In reality, this equation is more complex because we also need to “domesticate” the Z matrix by removing all imports. This is needed because we are creating a
Table 1: Sample “Z” matrix ($ millions)Industry 1 Industry 2 . . . Industry N
Industry 1 3.3 1,532.5 . . . 232.1Industry 2 9.2 23.0 . . . 1,982.7. . . . . . . . . . . . . . .Industry N 819.3 2,395.6 . . . 0

Appendix 1: Input-Output Modeling / 11
“closed” type of national model. In addition, there are a number of modifications that need to be made to the BEA data before the cal-culations can begin. These are almost all related to the conversion of certain data in BEA categories to new categories that are more compatible with other data sets we use in the process, and describing them in detail is beyond the scope of this document.
Disaggregation of the national Z matrixThe previous step resulted in two national Z matrices—one based on the benchmark BEA data (five years old, approximately 500 industries) and the other based on the annual BEA data (one year old, but only about 80 industries). These initial national Z matrices are then combined and disaggregated to 1,125 industry sectors. Combining them allows us to capitalize on both the recency of the annual data and the detail of the bench-mark data. The disaggregation is performed for each initial Z matrix using probability matrices that allow us to estimate industry transactions for the more detailed sectors based on the known transactions of their parent sectors. The probability matrix is created from detailed EMSI industry earnings data, which are available for all 1,125 sectors and are created using a separate process.
Creation of the national A matrixThe national disaggregated Z matrix is then “normal-ized” to show purchases as percentages of each industry’s output rather than total dollar amounts. This is called the national “A” matrix. Each cell value represents the percentage of a row industry’s output that goes toward purchasing inputs from each column industry. Thus, the cell containing .112 above means that Industry 1 spends 11.2% of its
total output to obtain inputs from Industry 2. At this point, our additional rows representing earn-ings, profits, and business taxes are removed. However, we will use them in a different form later.
Regionalization of the A matrixTo create a regional input-output model, we regionalize the national A matrix using that region’s industry mix. The major step in the process is the calculation of per-industry out-of-region exports. This is performed using a combination of the following standard tech-niques that are present in the academic literature:
• Stevens regional purchase coefficients (RPCs)
• Simple location quotient of value added sales
• Supply/demand pools derived from the national A matrix
We try to maximize exports in order to account as fully as possible for “cross-hauling,” which is the simultaneous export and import of the same good or service to/from a region, since it is quite common in most industries. Another major part of the process is the regional-ization of consumption, investment, and local govern-ment “row industries” (rows referring to the rows of the A matrix). These represent the percentage of each industry’s sales that end up going toward consump-tion, capital purchases, and taxes to local government, respectively. They are created from the “value added” rows that we removed earlier. Consumption is calculated using each industry’s earnings and profits, as well as a constant called “the average propensity to consume,” which describes the approximate percentage of earnings and profits that are spent on consumption. Investment and local government rows are calculated by distribut-ing the known total investment and endogenous local government for the entire region to individual industries proportionally to their value added. The A-matrix regionalization process is automated for any given region for which industry data are avail-able. Although partially derived from national figures, the regional A matrix offers a best possible estimate of
Table 2: Sample “A” matrix
Industry 1 Industry 2 . . .Industry
1125Industry 1 .001 .112 . . . .035Industry 2 .097 0 . . . .065. . . . . . . . . . . . . . .Industry 1125 .002 .076 . . . 0

12 / The Economic Impact of Frac Sand Mining: A Look at Jobs and Earnings in Wood County, Wisconsin
regional values without resorting to costly and time-consuming survey techniques, which in most cases are completely infeasible.
Creating multipliers & using the A matrixFinally, we convert the regional “A” matrix to a “B” matrix using the standard Leontief inverse B=(I−A)−1. The “B” matrix consists of inter-industry sales mul-
tipliers, which can be converted to jobs or earnings multipliers using per-industry jobs-to-sales or earnings-to-sales ratios. The resulting tables and vectors from this process are then used in the actual end-user software to calculate regional requirements, calculate the regional economic base, estimate sales multipliers, and run impact sce-narios.

Appendix 2: About the Authors / 13
APPENDIX 2: ABOUT THE AUTHORS
Dr. Hank Robison is EMSI’s co-founder and chief economist with 30 years of international and domes-tic experience. He is recognized for theoretical work blending regional input-output and spatial trade theory, and for development of community-level input-output modeling as the basis for establishing agency protocol for conducting sub-county economic impact analysis. He served 10 years as faculty member and consultant to the University of Idaho, and produced a wide array of grants and contract research. Dr. Robison specializes in economic impact analysis, regional data develop-ment, and custom crafted community and broader area input-output models. His client list includes a diverse mix of state and federal government agencies and private industry.
Mr. Timothy Nadreau is a senior research economist at EMSI. While his specialty is in abstract and linear algebras, his consulting work has focused largely on cluster theory, human capital, and international trade. He was awarded the coveted Iddings fellowship for his work on optimal public investments and tuition levels for community and technical colleges. He has also done work revolving around agricultural policies and regional development. In 2011, Mr. Nadreau completed his master’s degree in economics at the University of Idaho. Prior to joining EMSI, Mr. Nadreau received a bachelor’s degree in theoretical mathematics from the University of Idaho.

14 / The Economic Impact of Frac Sand Mining: A Look at Jobs and Earnings in Wood County, Wisconsin

Appendix 2: About the Authors / 15