Embed Size (px)
Citation preview
May 2015
FBK-IRVAPP Working Paper No. 2015-04
Research Institute for the Evaluation of Public Policies
The Economic Impact of the Friuli-Venezia
Giulia Autonomy. A Synthetic Control Analysis
of Asymmetric Italian Federalism
Federico Podestà
FBK
-IR
VA
PP
Wo
rkin
g P
ape
r se
rie
s
Re
sear
ch In
stit
ute
fo
r th
e E
valu
atio
n o
f P
ub
lic P
oli
ces
htt
p:/
/irva
pp
.fb
k.e
u
The Economic Impact of the Friuli-Venezia Giulia Autonomy.
A Synthetic Control Analysis of Asymmetric Italian Federalism
Federico Podestà
FBK-IRVAPP
FBK-IRVAPP Working Paper No. 2015-04
May 2015
Research Institute for the Evaluation of Public Policies
Bruno Kessler Foundation
Via S. Croce 77, 38122 Trento (Italy)
Phone: (+39) 0461.314209
Fax: (+39) 0461.314240
E-mail: [email protected]
Website: http://irvapp.fbk.eu
The purpose of the IRVAPP Working Papers series is to promote the circulation of working papers prepared
within the Institute or presented in IRVAPP seminars by outside researchers with the aim of stimulating
comments and suggestions. Updated review of the papers are available in the Reprint Series, if published, or
directly at the IRVAPP.
The views expressed in the articles are those of the authors and do not involve the responsibility of the
Institute.
1
The Economic Impact of the Friuli-Venezia Giulia Autonomy.
A Synthetic Control Analysis of Asymmetric Italian Federalism*
Federico Podestà †
May 2015
Abstract
Given that the existing literature on the relationship between fiscal federalism and
economic development has given scant consideration to asymmetric federalism, this article
illustrates a case study on the economic impact of autonomy of one of the five Italian
special-statute regions, namely Friuli-Venezia Giulia (FVG). The study has been
performed in the counterfactual framework of causal inference, applying the synthetic
control method. For this purpose, a suitable synthetic FVG has been constructed to contrast
the evolution of FVG’s real per capita GDP, observed over the post-autonomy period, with
the corresponding evolution of the same aggregate for the synthetic counterpart. This
comparison reveals that, if FVG were not an autonomous region, its per capita GDP would
be significantly lower than that effectively observed.
Keywords: Regional autonomy; Asymmetric Italian Federalism; Economic development;
policy evaluation; Synthetic control method
* I would like to thank the following for helpful suggestions and research assistance: Davide Azzolini, Erich
Battistin, Gianfranco Cerea, Manuela Cumerlotti, Claudio Gianesin, Samuele Poy, Enrico Rettore, and Livio
Romano. † FBK-IRVAPP, [email protected].
2
1. Introduction
Since World War II, both developed and developing countries have experienced several
decentralization processes because, in many cases, authority and responsibility for public
functions have been transferred from the central government to subnational and/or
subordinate organizations (Manor, 1999).1 These processes have been generally intended
to improve the delivery of public services and to adapt government structures so that they
suit the needs of the citizens better.
As a consequence, a growing body of literature has investigated the relationship
between economic development and fiscal federalism, i.e. the allocation across different
(vertical) layers of the administration of competencies (expenditure side) and fiscal
instruments (revenue side). More precisely, following the theoretical insight on the better
targeting of growth-enhancing services and infrastructural investments, a large number of
empirical studies have been carried out to analyze the association between fiscal federalism
and economic growth. In many cases, quantitative cross-national analyses have been
performed to test whether decentralized countries are able to achieve better economic
output dynamics than more centralized nations. Nonetheless, most of these efforts have
remained in the cross-country framework, without attempts to establish if, within the same
country, subnational entities with higher levels of autonomy are able to attain better
economic performances than the other subnational agencies/territories. In other words, the
existing national cases of asymmetric decentralization, where autonomy is not equally
distributed across subnational governments, have been under-investigated to understand
the mechanisms underlying the different processes of local economic development.
Moreover, the existing literature has almost exclusively adopted the regression method,
neglecting the counterfactual framework of causal inference. In particular, no attempts – to
the best of my knowledge – have been made to quantify the economic development of a
nation or of a region if that country has not been decentralized or that region has not been
autonomous.
In order partially to fill these two gaps, I exploits the asymmetric Italian
decentralization to evaluate the economic impact of the autonomy of one of the five Italian
regioni a statuto speciale (special-statute regions), namely Friuli-Venezia Giulia (FVG).
More precisely, exploiting the delayed creation of that region, the synthetic control method
(Abadie and Gardeazabal, 2003; Abadie et al. 2010; 2014) has been adopted to construct a
pertinent synthetic FVG to best approximate the counterfactual of what would be observed
for the economic output of this region in the absence of its statutory autonomy. Then, the
trajectories of per capita GDP, respectively observed in the presence and in the absence of
the FVG autonomy, have been contrasted in order to estimate the economic effect of the
regional prerogatives. This comparison reveals that, if FVG were not an autonomous
region, its per capita GDP would be significantly lower than that effectively observed.
The rest of the paper is organized as follows. Section 2 provides a brief overview of the
existing literature and provides more detailed information about the case study. Section 3
describes the institutional architecture of the Italian asymmetric federalism, while section 4
delineates the potential channels of the FVG autonomy impact. Section 5 presents the data
1 The term ‘subnational’ collectively stands for levels of government below the national government: both
lower-level governments (municipalities, communes or local councils) and intermediate tiers (regions, states,
provinces, counties, territories or districts).
3
and empirical strategy. Section 6 discusses the results, while section 7 draws some
conclusions.
2. Literature and motivations
Abundant theoretical and empirical efforts have been made to understand how the different
forms of decentralization may (or may not) promote economic development. As Oates
(2005) observes, the theoretical framework has been inspired by the seminal works of
Arrow, Musgrave and Samuelson. The implicit assumption behind these theoretical
arguments had to do with the role of the public sector in relation to market failures.
Seeking to maximize social welfare, government agencies should (and presumably would)
correct various forms of market failure via appropriate public policies. At national level,
central governments are engaged in establishing an equitable distribution of income and in
stabilizing the economic cycle. At the local level, the governments have their raison d’etre
in the provision of goods and services whose consumption is limited to their own
jurisdictions. Specifically, because subnational agencies are closer to people than the
central government, they have better information about the preferences of local populations
and, consequently, are better able to respond to demand for those goods and services. This
means that, by tailoring outputs of such goods and services to the particular preferences
and circumstances of their constituencies, decentralized governments are theoretically able
to increase social welfare to an extent greater than that which would result from the more
uniform levels of such services that are likely under national provision (Oates 1972; 1999;
Azfar et al. 1999, Freille et al. 2007).
In empirical research, a great number of quantitative cross-national analyses have
been carried out to test whether economic growth is faster in decentralized states than in
centralized ones. Accordingly, a great number of regressions have been estimated on cross-
sectional or panel data. Basically, the real GDP (measured in annual changes) is usually
regressed against some fiscal and/or political-administrative decentralization indicators and
a set of control variables. Nevertheless, the results deriving from these studies are often
conflicting. Some works, in fact, find a positive statistically significant relationship
between decentralization and economic growth (Oates, 1993; Iimi, 2005; Thiefen, 2003;
Yilmaz, 1999). In contrast, other analyses have not found a positive significant effect
(Rodriguez-Pose and Bwire, 2004; Thornton, 2007; Davoodi and Zou, 1998; Woller and
Philips, 1998; Baskaran and Feld, 2009; Rodrıguez-Pose and Ezcurra, 2010).
Therefore, this body of studies appears unable to close the debate because of the
scant robustness of “regression methods”: results are generally affected by the set of
regressors, variable measurement, as well as the country sample (Martinez-Vazquez and
McNab, 2005; Bodman, Heaton and Hodge, 2009). Moreover, the cross-country approach
is essentially intended to test propositions derived from general theories, neglecting within-
country processes. In other words, the empirical debate on the economic effects of fiscal
federalism is currently based on the variable-oriented strategy, and it largely ignores the
case-oriented approach aimed at identifying particular institutional conditions that produce
specific patterns of economic development (Ragin, 1987). Put differently, the quantitative
research has primarily focused on the synchronic relationship between decentralization and
growth, for the most part disregarding the potential for time-wise causality (Martinez-
Vazquez and McNab, 2003). On the other hand, although the case-oriented approach
necessarily implies a substantial decrease in the generalizability of findings, its adoption
4
may yield better understanding of how particular decentralizing processes have impacted
on the development trajectories of certain territories. This is because, in line with Mill's
method of difference, such an approach may be used to select a small number of national
cases that are as similar as possible on the important control variables and have different
degrees of decentralization. Accordingly, their economic paths can be compared in order to
establish whether decentralization matters for national development. Analogously, a small
number of sub-national cases can be selected that are as similar as possible on the
important control variables and have different levels of autonomy. By so doing, the
research objective is not to examine whether federal states grow faster than unitary states,
but to investigate whether, within a single country, territories with more degrees of
autonomy are able to achieve better economic performances.
Understandably, such a research design must be applied to those countries in which
legislative power, administrative competences, and/or fiscal arrangements are unequally
distributed across subnational governments. Accordingly, comparative case studies may be
carried out on the existing systems of asymmetric federalism, such as Italy, Spain, UK,
Belgium and Canada – to mention just some developed countries.2 The case-oriented
approach can therefore result useful for investigating an institutional architecture little
considered by the literature on the economic effects of fiscal federalism, namely
asymmetric federalism. In fact, the few works on this topic have almost exclusively
investigated the irregular allocation of autonomy as an outcome of specific domestic
political processes. On the one hand, unequal bargaining power has been recognized as a
source of national agreements that allocate different degrees of authority to different state
and local governments (Congleton, 2006). On the other hand, asymmetric federalism has
been considered a means to obtain political stability and territorial integrity in politically
and ethnically fragmented societies (Bird 2001; 2005). Moreover, the unequal distribution
of power among local agencies has been regarded as the consequence of greater
administrative efficiency. In particular, if some regions have – as a result of their historical
experience with autonomy – greater capacities to provide public goods and services, as
well as to run governments, than other regions, it may be more efficient to devolve more
authority to them (Garcia-Milà and Mc-Gire, 2002).
Nevertheless, there have been – to the best of my knowledge – no prior attempts to
select specific national cases of asymmetric federalism to evaluate if subnational areas
characterized by an higher degree of autonomy have been able to achieve higher levels of
development compared to those with less autonomy.
For this reason, the present study concerns one of the above-mentioned national
cases of asymmetric federalism, namely Italy, and investigates the economic consequences
of the FVG’s autonomy. The reason why the study deals with only one of the five Italian
autonomous regions will be clarified in the next section. Here, however, it must be
explained why the analysis has been conducted using the synthetic control method, instead
of the traditional comparative case study approach.
Explaining the economic impact of FVG’s autonomy necessarily entails
comparison of its development trajectory with the corresponding trajectories of similar, but
non-autonomous, Italian regions. Nevertheless, such a comparison strategy cannot be
rigorously performed via the traditional comparative case study approach (Abadie,
2 Asymmetric federalism is properly related to a federation or confederation, although many unitary states
have a structure of government that resembles that found in an asymmetric federation (e.g. Italy, Spain, and
UK).
5
Diamond and Hainmueller 2014; King, Keohane, and Verba, 1994; Geddes 2003; Collier
and Mahoney 1996). This is essentially because serious doubts about the case selection
may arise when using one or few non-autonomous regions as similar as possible on the
important control variables. In particular, If the control regions are not sufficiently similar
to FVG, then any difference in outcomes between these units may be a mere reflection of
the disparities in their characteristics. Accordingly, Abadie and Gardeazabal (2003) and
Abadie, Diamond and Hainmueller (2010; 2014) suggest using the synthetic control
method, which is based on the idea that a combination of unaffected units often provides a
more appropriate comparison than any single unaffected unit alone. Accordingly, the
synthetic control methodology seeks to formalize the selection of the comparison units
using a data driven procedure. As a consequence, the synthetic FVG has been constructed
as a weighted average of available non-autonomous Italian regions that approximates its
most relevant characteristics prior to the policy-intervention period, namely prior to FVG’s
autonomy (for more details, see section 4).
3. The Italian asymmetric federalism and FVG autonomy
Like other European countries (Spain, France, and the UK), Italy can be categorised as a
decentralized unitary state, since power is transferred to lower levels of government, but
sovereignty rests solely with the central government (Loughlin, 2000). Nevertheless, at the
end of World War II, some competences were unequally transferred to regions (i.e. the
first-level administrative divisions of the state) and, consequently, Italy was the first
country to experiment with decentralized asymmetry (Bilancia, Palermo, and Porchia,
2010).
Besides of common prescription of twenty regions to the Democratic Constitution
(Art. 131 Const.), five regions were regulated in a different way. In particular, Trentino-
Alto Adige (Trentino-South Tyrol), Valle d’Aosta (Aosta Valley), FVG (three relatively
small alpine regions with substantial populations of ethnic minorities), Sicilia (Sicily) and
Sardegna (Sardinia) (the country’s two main islands, both with economic and social
problems) received a higher degree of autonomy as a consequence of either their linguistic
or geographical peculiarities.
These five regions were formally created at different times: Valle d’Aosta and
Sicilia in 1945, Trentino-Alto Adige and Sardegna in 1948, and FVG in 1963. On the other
hand, for complex political reasons, the other fifteen regions (Abruzzo, Basilicata,
Calabria, Campania, Emilia Romagna, Lazio, Liguria, Lombardia, Marche, Molise,
Piemonte, Puglia, Toscana, Umbria, and Veneto) were formally instituted only in 1970
with a much lesser degree of autonomy.
The fundamental difference between the two types of regions concerns their statute.
The above-mentioned five autonomous regions are called regioni a statuto speciale
(special-statute regions), since each has its own statute (regional basic law), approved as a
constitutional law of the state (Art. 116 Const.). Conversely, the other 15 regions are
termed regioni a statuto ordinario (ordinary-statute regions) because they have less ability
to develop autonomous statutes: they fall formally under the ordinary law of the state, and
all have very similar if not identical governmental structures (for more details on the two
types of regions, see the next section).
On the basis of this concise institutional overview, one might think that the impact
evaluation design described in the previous section could be applied to all five regioni a
6
statuto speciale. In fact, all these regions can be considered as the treated units, that is, the
units exposed to the special autonomy allocation policy; while the remaining 15 regioni a
statuto ordinario can be labelled as the untreated units and, consequently, considered as
the reservoir of potential comparison units. Clearly, such a distinction would imply that a
counterfactual analysis – via synthetic control method – should be performed for each
regione a statuto speciale. Nevertheless, if the history of asymmetric Italian federalism is
set in relation to the logic of the synthetic control method, this opportunity is de facto
prevented. This is essentially because, while the synthetic control units must be constructed
in order to best reproduce the characteristics of the treated units during the pre-treatment
period (Abadie and Gardeazabal 2003; Abadie, Diamond, and Hainmueller 2010; 2014), a
pre-intervention period is not reliably observable for all five regioni a statuto speciale. In
fact, as mentioned above, four of these regions, Sardegna, Sicilia, Trentino-Alto Adige and
Valle d’Aosta, were formally created immediately after World War II. This means that the
pre-intervention period for these regions concerns a phase characterized by momentous
historical changes (Italy underwent the Fascist regime and the war period) and by a severe
lack of data. On the other hand, since the FVG statute was approved in 1963 and
implemented in 1965, via apposite national laws (i.e. Norme di attuazione), the
corresponding pre-intervention period can be more straightforwardly reconstructed. In fact,
it can be more realistically limited to the period from 1945 to 1965. Accordingly, the only
regione a statuto speciale practically analyzable via the synthetic control method, is FVG.
Moreover, throughout the entire pre-intervention period, both FVG and the 15 non-
autonomous regions shared the same institutional condition: before 1965, all these regions
were still unfounded (see above).
4. The potential channels of the FVG autonomy impact
On the basis of this setting, appropriate arguments must be developed about the potential
channels through which FVG’s autonomy would have impacted on the region’s economic
development. Since the existing literature explains economic performances in relation to
different allocations of legislative, administrative and fiscal competencies across
subnational organizations (section 2), some details must be first provided on the
differences between FVG and the ordinary regions with respect to such dimensions. On the
basis of such differences, a specific testable hypothesis will be then formulated.
While the ordinary regions enjoy only limited legislative power in specific fields
identified in the national constitution (Art. 117 Const.), FVG, like the other four
autonomous regions, has considerably more legislative power and the ability to negotiate
its by-laws directly with the national government, by-passing the national parliament. In
addition, FVG, as a regione a statuto speciale, enjoys administrative as well as financial
power not available to the 15 ordinary regions. This is because it was given competencies
in specific administrative fields and tax collection. In particular, a number of quotas (from
4/10 to 9/10, Art. 4 FVG Special Statute) of state tax revenues, collected within the
regional territory, are directly assigned to FVG so that it can manage the administrative
competences prescribed by its own statutes. Specifically, although FVG’s administrative
competences are fewer than those attributed to the other autonomous regions, they regard
important economic fields (Cerea, 2012). In conformity with the constraints of national and
international law, the region has legislative and administrative power on all productive
sectors, public works, and city planning (Art. 4 and 8, FVG Special Statute).
7
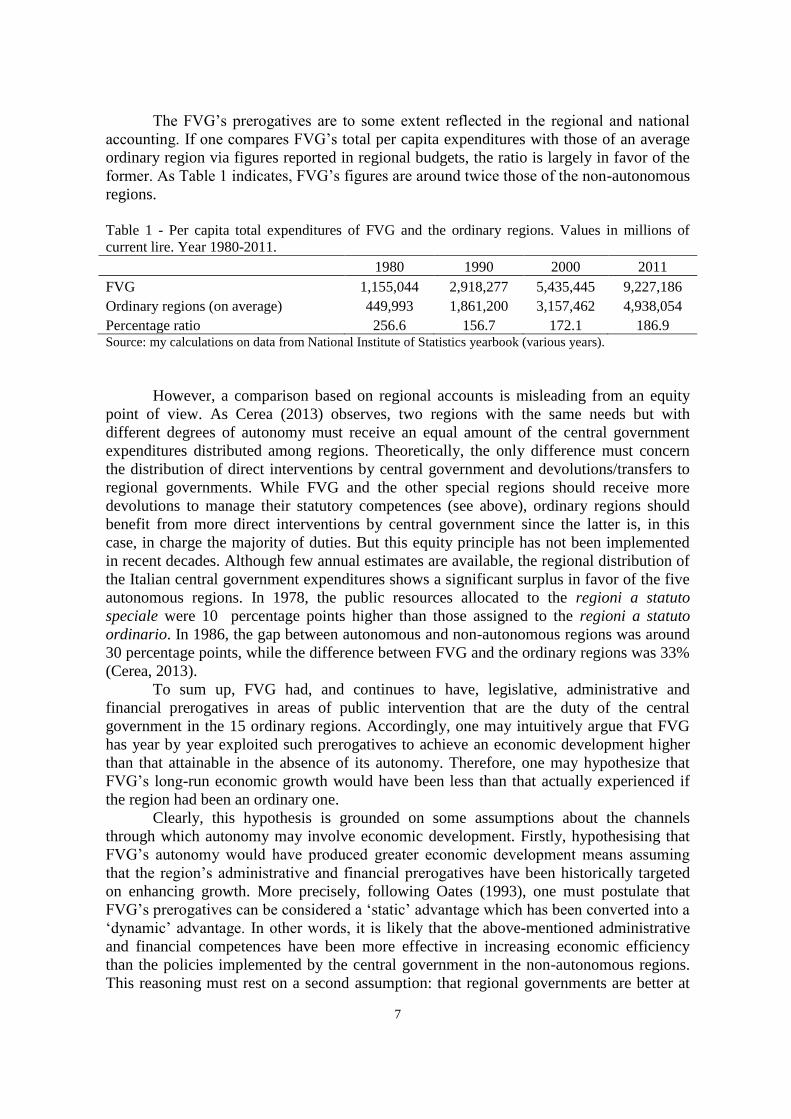
The FVG’s prerogatives are to some extent reflected in the regional and national
accounting. If one compares FVG’s total per capita expenditures with those of an average
ordinary region via figures reported in regional budgets, the ratio is largely in favor of the
former. As Table 1 indicates, FVG’s figures are around twice those of the non-autonomous
regions.
Table 1 - Per capita total expenditures of FVG and the ordinary regions. Values in millions of
current lire. Year 1980-2011.
1980 1990 2000 2011
FVG 1,155,044 2,918,277 5,435,445 9,227,186
Ordinary regions (on average) 449,993 1,861,200 3,157,462 4,938,054
Percentage ratio 256.6 156.7 172.1 186.9 Source: my calculations on data from National Institute of Statistics yearbook (various years).
However, a comparison based on regional accounts is misleading from an equity
point of view. As Cerea (2013) observes, two regions with the same needs but with
different degrees of autonomy must receive an equal amount of the central government
expenditures distributed among regions. Theoretically, the only difference must concern
the distribution of direct interventions by central government and devolutions/transfers to
regional governments. While FVG and the other special regions should receive more
devolutions to manage their statutory competences (see above), ordinary regions should
benefit from more direct interventions by central government since the latter is, in this
case, in charge the majority of duties. But this equity principle has not been implemented
in recent decades. Although few annual estimates are available, the regional distribution of
the Italian central government expenditures shows a significant surplus in favor of the five
autonomous regions. In 1978, the public resources allocated to the regioni a statuto
speciale were 10 percentage points higher than those assigned to the regioni a statuto
ordinario. In 1986, the gap between autonomous and non-autonomous regions was around
30 percentage points, while the difference between FVG and the ordinary regions was 33%
(Cerea, 2013).
To sum up, FVG had, and continues to have, legislative, administrative and
financial prerogatives in areas of public intervention that are the duty of the central
government in the 15 ordinary regions. Accordingly, one may intuitively argue that FVG
has year by year exploited such prerogatives to achieve an economic development higher
than that attainable in the absence of its autonomy. Therefore, one may hypothesize that
FVG’s long-run economic growth would have been less than that actually experienced if
the region had been an ordinary one.
Clearly, this hypothesis is grounded on some assumptions about the channels
through which autonomy may involve economic development. Firstly, hypothesising that
FVG’s autonomy would have produced greater economic development means assuming
that the region’s administrative and financial prerogatives have been historically targeted
on enhancing growth. More precisely, following Oates (1993), one must postulate that
FVG’s prerogatives can be considered a ‘static’ advantage which has been converted into a
‘dynamic’ advantage. In other words, it is likely that the above-mentioned administrative
and financial competences have been more effective in increasing economic efficiency
than the policies implemented by the central government in the non-autonomous regions.
This reasoning must rest on a second assumption: that regional governments are better at
8
discerning the preferences and needs of their constituencies and can more easily adapt their
expenditure policies to fulfill them (Martinez-Vazquez and McNab, 2003). Accordingly,
the regional competences prescribed by the FVG’s statute (see above) must be considered
as conditions ensuring infrastructures and/or public expenditures better suited to the local
economic system than those that would have been guaranteed by the central government in
the absence of the region’s autonomy. This means that the hypothesis formulated above
implies that a certain amount of money spent in FVG should be more growth-enhancing
than the same amount spent in an ordinary region. In other words, the public policies
implemented over time in FVG have been on average associated with a multiplier higher
than that related to the policies implemented in the ordinary regions. More precisely, since
it is hypothesized here that FVG’s autonomy has produced a long-run effect on the
region’s economic output, one must in turn assume that the above-mentioned FVG
competencies on productive sectors, public works, and city planning have involved the
implementation of policies with long-run local multiplier effects greater than those
undertaken in ordinary regions.
5. Empirical strategy and data
In a counterfactual framework, testing the hypothesis formulated in the previous section
requires comparison between FVG’s economic development, in the presence of the
region’s autonomy (i.e. the policy-intervention under investigation) and FVG’s economic
development in the absence of regional autonomy. To this end, I use real per capita GDP as
an outcome variable. More precisely, two outcomes have to be defined: Y1, referring to
real per capita GDP in the presence of FVG autonomy, and Y0, denoting real per capita
GDP in the absence of FVG autonomy. Accordingly, the yearly gap between Y1 and Y0
during the treatment period, namely the period from 1966 onward (see the previous
section), corresponds to the economic impact of the region’s autonomy. Hence, if the
yearly gap proves to be systematically positive (Y1>Y0), one may conclude that FVG’s
autonomy has produced a remarkable economic development. Specifically, if Y1 is
progressively higher than Y0, the public programs adopted in FVG have effectively
generated greater long-run economic growth than that achievable via public programs
adoptable in the absence of the region’s autonomy.
Nevertheless, since Y0 is obviously not observable, the counterfactual of FVG in
the absence of the region’s autonomy must be reproduced. As anticipated, the synthetic
control method has been employed for this objective. In particular, the synthetic FVG has
been reproduced as a weighted average of the available control Italian regions that
approximates the main characteristics of FVG prior to 1966. To this end, the 15 regioni a
statuto ordinario have formed the donor pool, i.e. the set of units which were not exposed
to the treatment (i.e. the region’s autonomy) and which, consequently, have constituted the
reservoir of potential comparison units. On the other hand, the remaining four autonomous
regions have been excluded from the donor pool because they were treated before of FVG
(see section 3). In more formal terms, the synthetic FVG has been constructed by
employing the following statistics:
(1) a set of observed covariates to use as predictors of real per capita GDP;
9
(2) some linear combinations of the pre-intervention outcome to control for
unobserved common factors whose effects vary over time. Basically, these may
correspond to the average of the outcome variable computed for a portion or the
entire pre-intervention period. Alternatively, single time points of the outcome pre-
intervention period can be used as predictors;
(3) a set of weights chosen to be positive and sum to one. Each weight then
represents one particular weighted average of the control units and therefore one
potential synthetic control unit. Consequently, the resulting synthetic FVG
coincides with the weighted average of those regions selected from the donor pool
because they are associated with positive weights.
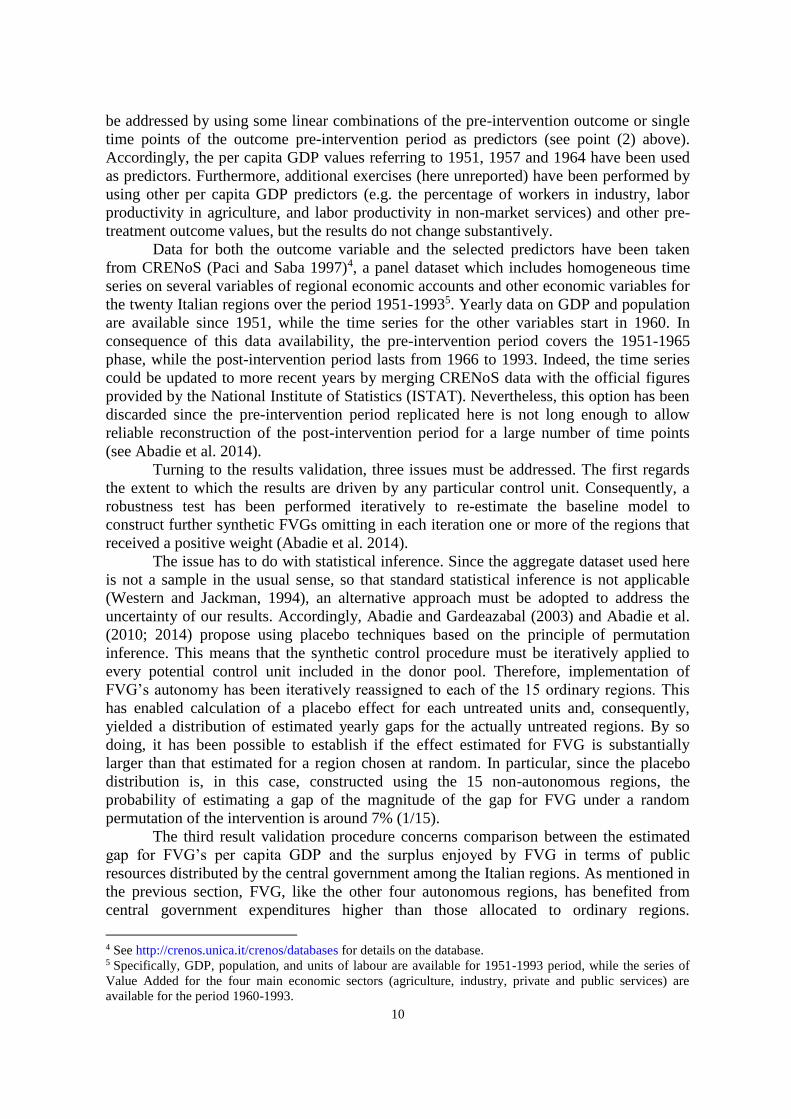
Mathematically, the weights W* are chosen so that the resulting synthetic control
unit best approximates the unit exposed to the intervention with respect to the outcome
predictors and the linear combinations of the pre-intervention outcome. More precisely, if
X1 is defined as a vector of pre-treatment variables for the units treated, and X0 is defined
as the corresponding matrix of these variables for the possible control units, the weight
matrix W is chosen to minimize
where V is a diagonal matrix introduced to allow different weights of the variables
in X0 and X1 depending on their predictive power on the outcome (for more details, see
Abadie and Gardeazabal, 2003; Abadie, Diamond and Hainmueller 2010; 2014).
Whilst the weights utilized to construct the synthetic FVG are presented in the next
section, some details must be provided here about points (1) and (2). In regard to point (1),
the literature on economic growth suggests that GDP increases in the long run as a
consequence of many variables, such as investment behavior, general capital accumulation,
human capital, technological development, productivity, and so on (Barro and Sala-i-
Martin, 2004). Accordingly, the set of observed covariates used as predictors of real per
capita GDP are the following3:
1) The percentage of workers in agriculture;
2) The percentage of workers in market services;
3) The percentage of workers in non-market services;
4) Labor productivity in industry;
5) Labor productivity in market services;
6) Gross domestic investment (% GDP);
7) Number of students enrolled at high school (% of population).
However, using such predictors does not make it possible to control for unobserved
confounders. In fact, during the sample period examined here, many if not all non-
autonomous regions experienced economic shocks and/or policy changes. Obviously, if not
controlled for, these confounders may bias the estimation. However, this complication can
3 Since in this exercise the outcome variable is the same as used in other synthetic control analyses, the
selected predictors have been chosen by referring to the same literature, and they are very similar to those
used in those works (Abadie and Gardeazabal 2003; Abadie, Diamond, and Hainmueller 2014; Barone and
Mocetti, 2014).
10
be addressed by using some linear combinations of the pre-intervention outcome or single
time points of the outcome pre-intervention period as predictors (see point (2) above).
Accordingly, the per capita GDP values referring to 1951, 1957 and 1964 have been used
as predictors. Furthermore, additional exercises (here unreported) have been performed by
using other per capita GDP predictors (e.g. the percentage of workers in industry, labor
productivity in agriculture, and labor productivity in non-market services) and other pre-
treatment outcome values, but the results do not change substantively.
Data for both the outcome variable and the selected predictors have been taken
from CRENoS (Paci and Saba 1997)4, a panel dataset which includes homogeneous time
series on several variables of regional economic accounts and other economic variables for
the twenty Italian regions over the period 1951-19935. Yearly data on GDP and population
are available since 1951, while the time series for the other variables start in 1960. In
consequence of this data availability, the pre-intervention period covers the 1951-1965
phase, while the post-intervention period lasts from 1966 to 1993. Indeed, the time series
could be updated to more recent years by merging CRENoS data with the official figures
provided by the National Institute of Statistics (ISTAT). Nevertheless, this option has been
discarded since the pre-intervention period replicated here is not long enough to allow
reliable reconstruction of the post-intervention period for a large number of time points
(see Abadie et al. 2014).
Turning to the results validation, three issues must be addressed. The first regards
the extent to which the results are driven by any particular control unit. Consequently, a
robustness test has been performed iteratively to re-estimate the baseline model to
construct further synthetic FVGs omitting in each iteration one or more of the regions that
received a positive weight (Abadie et al. 2014).
The issue has to do with statistical inference. Since the aggregate dataset used here
is not a sample in the usual sense, so that standard statistical inference is not applicable
(Western and Jackman, 1994), an alternative approach must be adopted to address the
uncertainty of our results. Accordingly, Abadie and Gardeazabal (2003) and Abadie et al.
(2010; 2014) propose using placebo techniques based on the principle of permutation
inference. This means that the synthetic control procedure must be iteratively applied to
every potential control unit included in the donor pool. Therefore, implementation of
FVG’s autonomy has been iteratively reassigned to each of the 15 ordinary regions. This
has enabled calculation of a placebo effect for each untreated units and, consequently,
yielded a distribution of estimated yearly gaps for the actually untreated regions. By so
doing, it has been possible to establish if the effect estimated for FVG is substantially
larger than that estimated for a region chosen at random. In particular, since the placebo
distribution is, in this case, constructed using the 15 non-autonomous regions, the
probability of estimating a gap of the magnitude of the gap for FVG under a random
permutation of the intervention is around 7% (1/15).
The third result validation procedure concerns comparison between the estimated
gap for FVG’s per capita GDP and the surplus enjoyed by FVG in terms of public
resources distributed by the central government among the Italian regions. As mentioned in
the previous section, FVG, like the other four autonomous regions, has benefited from
central government expenditures higher than those allocated to ordinary regions.
4 See http://crenos.unica.it/crenos/databases for details on the database. 5 Specifically, GDP, population, and units of labour are available for 1951-1993 period, while the series of
Value Added for the four main economic sectors (agriculture, industry, private and public services) are
available for the period 1960-1993.
11
Accordingly, in order to evaluate whether FVG’s autonomy has effectively produced a
significant effect on the regional long-run economic growth, the yearly estimated gap for
per capita GDP has necessarily to be greater than the above-mentioned public spending
surplus. Otherwise, the economic impact of FVG’s autonomy must be interpreted as a
mere accounting effect. In fact, the ‘extra central government expenditures’ allocated to
FVG contribute – like other GDP components – to additively generating the regional
economic output.
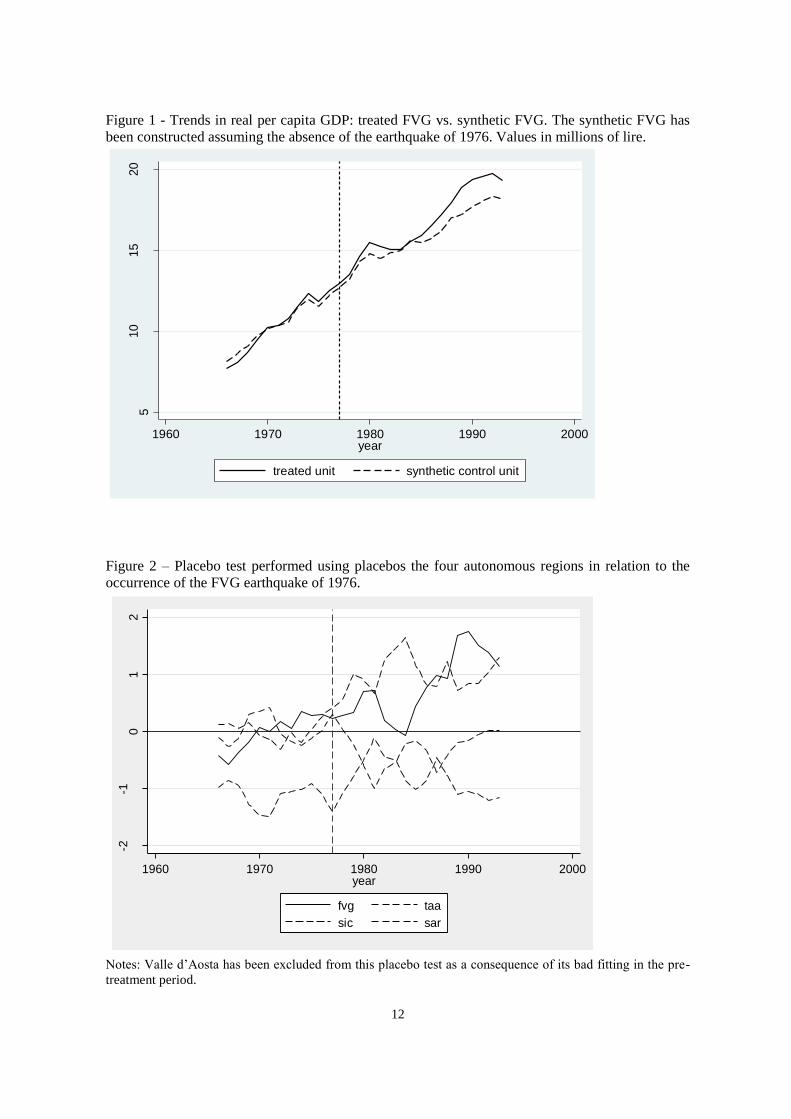
To conclude this methodological section, some notes are necessary on the trajectory
actually observed for the real per capita GDP after 1976. This is because a severe
earthquake occurred in FVG in that year. More precisely, the economic consequences of
that event must be taken into account in order to assess to what extent the regional GDP
was affected by that natural disaster and, thus, whether the impact evaluation of the FVG
autonomy is biased. Indeed, there is evidence that that shock did not produce a significant
effect on our outcome variable in the 1976-1993 period. Specifically, performing a
synthetic control analysis on the FVG earthquake, Barone and Mocetti (2014) argue that in
those years the FVG real per capita GDP was not de facto altered. This is essentially
because, although the natural disaster caused the instantaneous destruction of capital stock,
a huge amount of public resources were for several years transferred from the Italian
central government to the FVG region, compensating any depressing effect. Nevertheless,
since Barone and Mocetti (2014) did not consider that in 1976 FVG had been an
autonomous region for 10 years, a further synthetic control analysis of the FVG
earthquake’s economic impact has been carried out by myself. It has been performed by
including in the donor pool the remaining four autonomous regions only and by using the
same per capita predictors selected to construct a synthetic FVG in the absence of regional
autonomy (see above).6 As Figure 1 shows, the exercise confirms Barone and Mocetti’s
results: from 1977 to 1993 the actual and the synthetic line almost overlap. They slightly
diverge only in the last years. Moreover, as in Barone and Mocetti’s analysis, the yearly
distance between the two lines does not prove significant in relation to the pertinent
placebo test (see Figure 2). In consequences of these findings, the FVG real per capita
GDP actually observed for the 1976-1993 period – and more in general for the 1966-1993
period – can be reasonably used as an outcome variable to estimate the economic impact of
FVG’s autonomy.
6 The fact that the donor pool contains, in this case, only 4 regions should not be seen as a problem. As
Abadie et al (2010: 497) argue, the synthetic control method does not require a large number of comparison
units in the donor pool.
12
Figure 1 - Trends in real per capita GDP: treated FVG vs. synthetic FVG. The synthetic FVG has
been constructed assuming the absence of the earthquake of 1976. Values in millions of lire. 5
10
15
20
gd
pp
c
1960 1970 1980 1990 2000year
treated unit synthetic control unit
Figure 2 – Placebo test performed using placebos the four autonomous regions in relation to the
occurrence of the FVG earthquake of 1976.
-2-1
01
2
1960 1970 1980 1990 2000year
fvg taa
sic sar
Notes: Valle d’Aosta has been excluded from this placebo test as a consequence of its bad fitting in the pre-
treatment period.
13
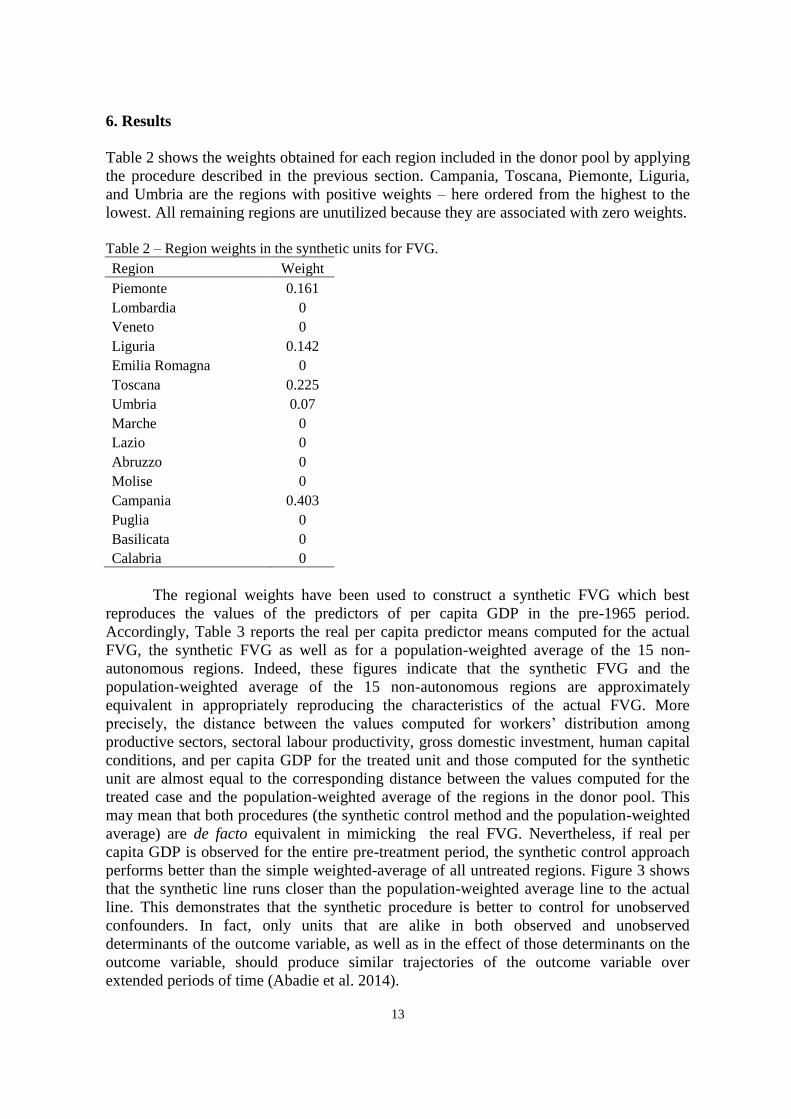
6. Results
Table 2 shows the weights obtained for each region included in the donor pool by applying
the procedure described in the previous section. Campania, Toscana, Piemonte, Liguria,
and Umbria are the regions with positive weights – here ordered from the highest to the
lowest. All remaining regions are unutilized because they are associated with zero weights.
Table 2 – Region weights in the synthetic units for FVG.
Region Weight
Piemonte 0.161
Lombardia 0
Veneto 0
Liguria 0.142
Emilia Romagna 0
Toscana 0.225
Umbria 0.07
Marche 0
Lazio 0
Abruzzo 0
Molise 0
Campania 0.403
Puglia 0
Basilicata 0
Calabria 0
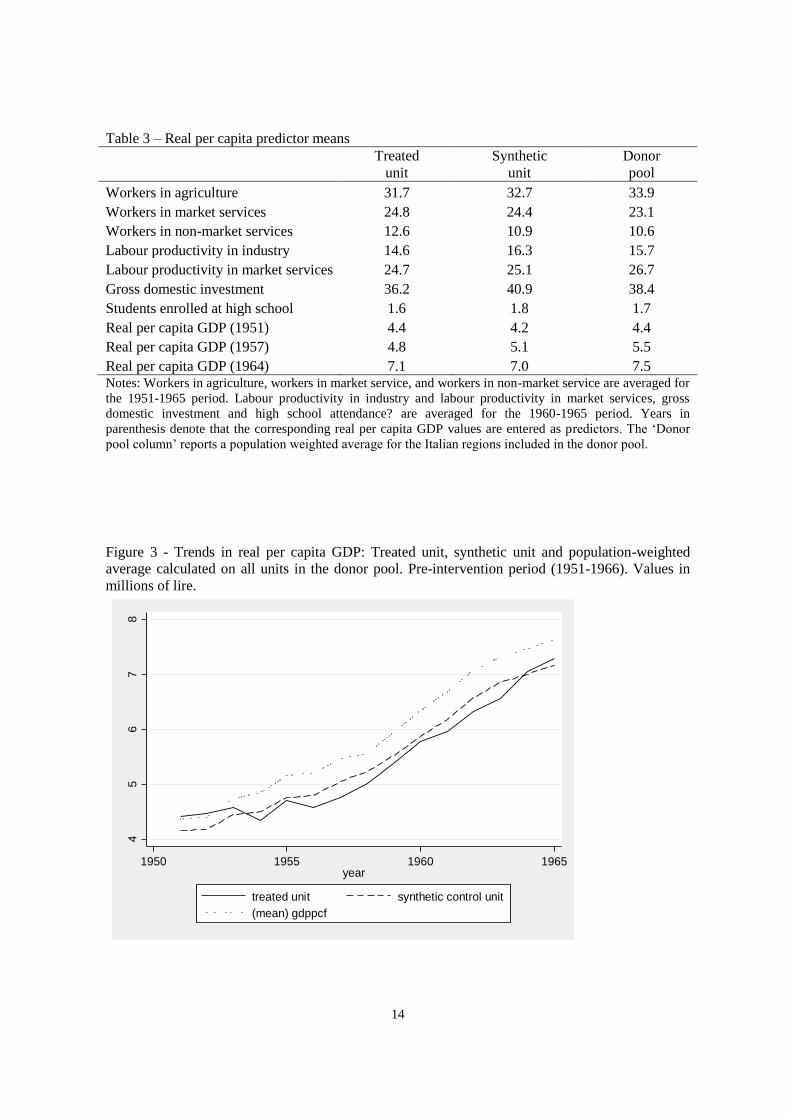
The regional weights have been used to construct a synthetic FVG which best
reproduces the values of the predictors of per capita GDP in the pre-1965 period.
Accordingly, Table 3 reports the real per capita predictor means computed for the actual
FVG, the synthetic FVG as well as for a population-weighted average of the 15 non-
autonomous regions. Indeed, these figures indicate that the synthetic FVG and the
population-weighted average of the 15 non-autonomous regions are approximately
equivalent in appropriately reproducing the characteristics of the actual FVG. More
precisely, the distance between the values computed for workers’ distribution among
productive sectors, sectoral labour productivity, gross domestic investment, human capital
conditions, and per capita GDP for the treated unit and those computed for the synthetic
unit are almost equal to the corresponding distance between the values computed for the
treated case and the population-weighted average of the regions in the donor pool. This
may mean that both procedures (the synthetic control method and the population-weighted
average) are de facto equivalent in mimicking the real FVG. Nevertheless, if real per
capita GDP is observed for the entire pre-treatment period, the synthetic control approach
performs better than the simple weighted-average of all untreated regions. Figure 3 shows
that the synthetic line runs closer than the population-weighted average line to the actual
line. This demonstrates that the synthetic procedure is better to control for unobserved
confounders. In fact, only units that are alike in both observed and unobserved
determinants of the outcome variable, as well as in the effect of those determinants on the
outcome variable, should produce similar trajectories of the outcome variable over
extended periods of time (Abadie et al. 2014).
14
Table 3 – Real per capita predictor means
Treated
unit
Synthetic
unit
Donor
pool
Workers in agriculture 31.7 32.7 33.9
Workers in market services 24.8 24.4 23.1
Workers in non-market services 12.6 10.9 10.6
Labour productivity in industry 14.6 16.3 15.7
Labour productivity in market services 24.7 25.1 26.7
Gross domestic investment 36.2 40.9 38.4
Students enrolled at high school 1.6 1.8 1.7
Real per capita GDP (1951) 4.4 4.2 4.4
Real per capita GDP (1957) 4.8 5.1 5.5
Real per capita GDP (1964) 7.1 7.0 7.5 Notes: Workers in agriculture, workers in market service, and workers in non-market service are averaged for
the 1951-1965 period. Labour productivity in industry and labour productivity in market services, gross
domestic investment and high school attendance? are averaged for the 1960-1965 period. Years in
parenthesis denote that the corresponding real per capita GDP values are entered as predictors. The ‘Donor
pool column’ reports a population weighted average for the Italian regions included in the donor pool.
Figure 3 - Trends in real per capita GDP: Treated unit, synthetic unit and population-weighted
average calculated on all units in the donor pool. Pre-intervention period (1951-1966). Values in
millions of lire.
45
67
8
1950 1955 1960 1965year
treated unit synthetic control unit
(mean) gdppcf
15
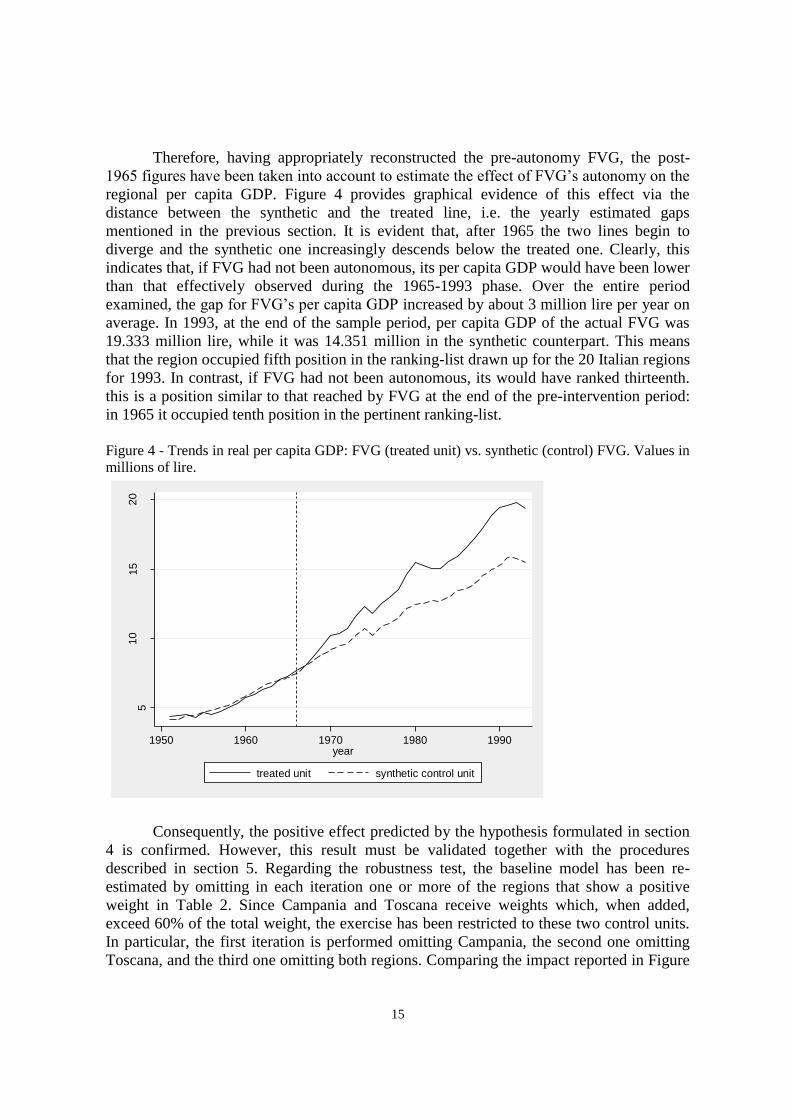
Therefore, having appropriately reconstructed the pre-autonomy FVG, the post-
1965 figures have been taken into account to estimate the effect of FVG’s autonomy on the
regional per capita GDP. Figure 4 provides graphical evidence of this effect via the
distance between the synthetic and the treated line, i.e. the yearly estimated gaps
mentioned in the previous section. It is evident that, after 1965 the two lines begin to
diverge and the synthetic one increasingly descends below the treated one. Clearly, this
indicates that, if FVG had not been autonomous, its per capita GDP would have been lower
than that effectively observed during the 1965-1993 phase. Over the entire period
examined, the gap for FVG’s per capita GDP increased by about 3 million lire per year on
average. In 1993, at the end of the sample period, per capita GDP of the actual FVG was
19.333 million lire, while it was 14.351 million in the synthetic counterpart. This means
that the region occupied fifth position in the ranking-list drawn up for the 20 Italian regions
for 1993. In contrast, if FVG had not been autonomous, its would have ranked thirteenth.
this is a position similar to that reached by FVG at the end of the pre-intervention period:
in 1965 it occupied tenth position in the pertinent ranking-list.
Figure 4 - Trends in real per capita GDP: FVG (treated unit) vs. synthetic (control) FVG. Values in
millions of lire.
51
01
52
0
gd
pp
c
1950 1960 1970 1980 1990year
treated unit synthetic control unit
Consequently, the positive effect predicted by the hypothesis formulated in section
4 is confirmed. However, this result must be validated together with the procedures
described in section 5. Regarding the robustness test, the baseline model has been re-
estimated by omitting in each iteration one or more of the regions that show a positive
weight in Table 2. Since Campania and Toscana receive weights which, when added,
exceed 60% of the total weight, the exercise has been restricted to these two control units.
In particular, the first iteration is performed omitting Campania, the second one omitting
Toscana, and the third one omitting both regions. Comparing the impact reported in Figure
16
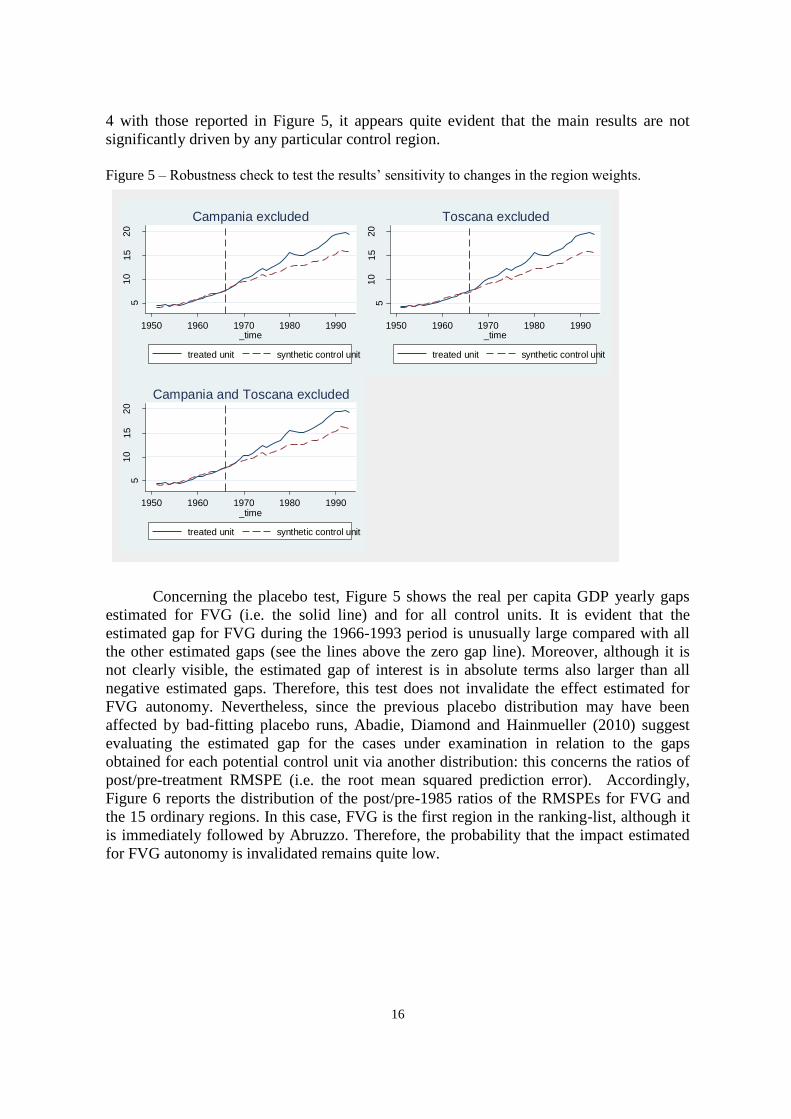
4 with those reported in Figure 5, it appears quite evident that the main results are not
significantly driven by any particular control region.
Figure 5 – Robustness check to test the results’ sensitivity to changes in the region weights.
510
15
20
1950 1960 1970 1980 1990_time
treated unit synthetic control unit
Campania excluded
510
15
20
1950 1960 1970 1980 1990_time
treated unit synthetic control unit
Toscana excluded
510
15
20
1950 1960 1970 1980 1990_time
treated unit synthetic control unit
Campania and Toscana excluded
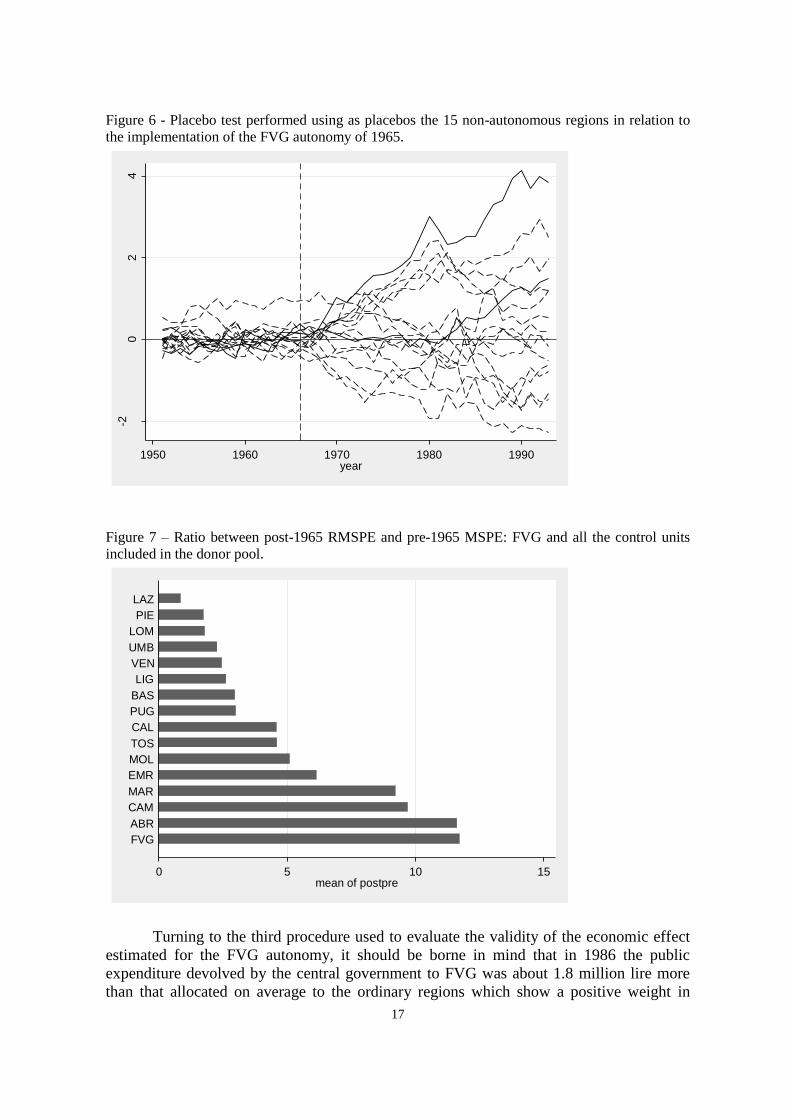
Concerning the placebo test, Figure 5 shows the real per capita GDP yearly gaps
estimated for FVG (i.e. the solid line) and for all control units. It is evident that the
estimated gap for FVG during the 1966-1993 period is unusually large compared with all
the other estimated gaps (see the lines above the zero gap line). Moreover, although it is
not clearly visible, the estimated gap of interest is in absolute terms also larger than all
negative estimated gaps. Therefore, this test does not invalidate the effect estimated for
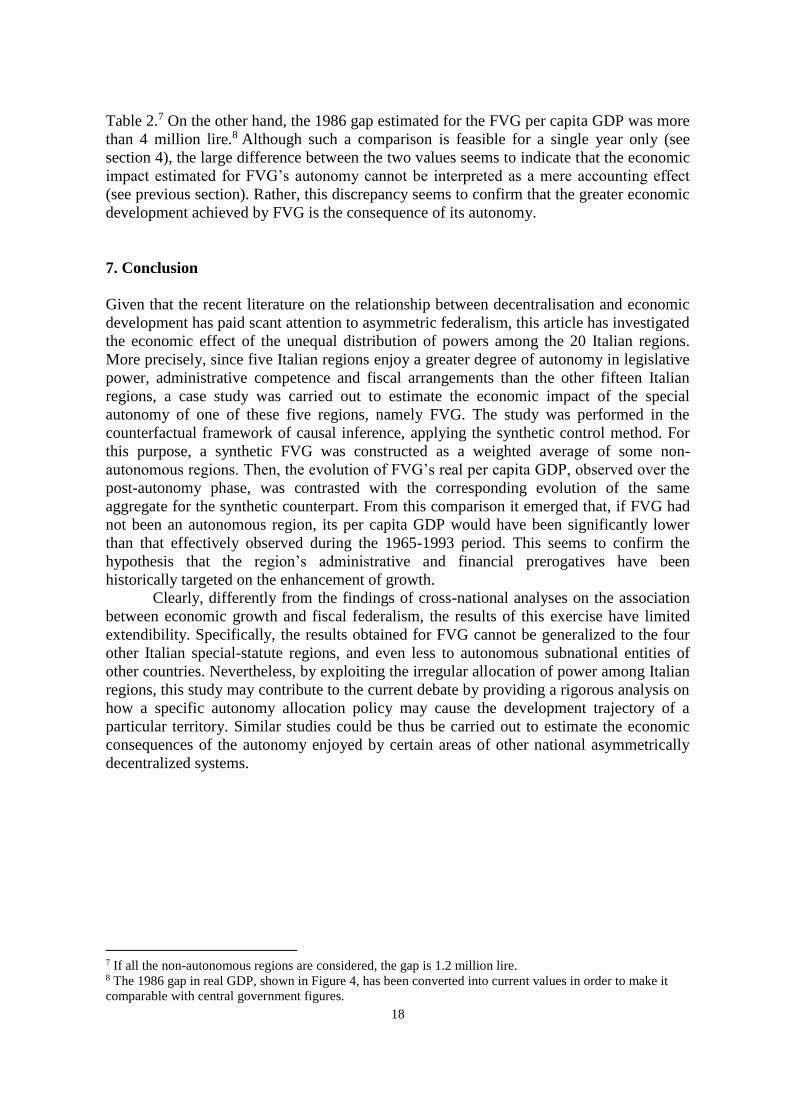
FVG autonomy. Nevertheless, since the previous placebo distribution may have been
affected by bad-fitting placebo runs, Abadie, Diamond and Hainmueller (2010) suggest
evaluating the estimated gap for the cases under examination in relation to the gaps
obtained for each potential control unit via another distribution: this concerns the ratios of
post/pre-treatment RMSPE (i.e. the root mean squared prediction error). Accordingly,
Figure 6 reports the distribution of the post/pre-1985 ratios of the RMSPEs for FVG and
the 15 ordinary regions. In this case, FVG is the first region in the ranking-list, although it
is immediately followed by Abruzzo. Therefore, the probability that the impact estimated
for FVG autonomy is invalidated remains quite low.
17
Figure 6 - Placebo test performed using as placebos the 15 non-autonomous regions in relation to
the implementation of the FVG autonomy of 1965.
-20
24
1950 1960 1970 1980 1990year
Figure 7 – Ratio between post-1965 RMSPE and pre-1965 MSPE: FVG and all the control units
included in the donor pool.
0 5 10 15mean of postpre
FVG
ABR
CAM
MAR
EMR
MOL
TOS
CAL
PUG
BAS
LIG
VEN
UMB
LOM
PIE
LAZ
Turning to the third procedure used to evaluate the validity of the economic effect
estimated for the FVG autonomy, it should be borne in mind that in 1986 the public
expenditure devolved by the central government to FVG was about 1.8 million lire more
than that allocated on average to the ordinary regions which show a positive weight in
18
Table 2.7 On the other hand, the 1986 gap estimated for the FVG per capita GDP was more
than 4 million lire.8 Although such a comparison is feasible for a single year only (see
section 4), the large difference between the two values seems to indicate that the economic
impact estimated for FVG’s autonomy cannot be interpreted as a mere accounting effect
(see previous section). Rather, this discrepancy seems to confirm that the greater economic
development achieved by FVG is the consequence of its autonomy.
7. Conclusion
Given that the recent literature on the relationship between decentralisation and economic
development has paid scant attention to asymmetric federalism, this article has investigated
the economic effect of the unequal distribution of powers among the 20 Italian regions.
More precisely, since five Italian regions enjoy a greater degree of autonomy in legislative
power, administrative competence and fiscal arrangements than the other fifteen Italian
regions, a case study was carried out to estimate the economic impact of the special
autonomy of one of these five regions, namely FVG. The study was performed in the
counterfactual framework of causal inference, applying the synthetic control method. For
this purpose, a synthetic FVG was constructed as a weighted average of some non-
autonomous regions. Then, the evolution of FVG’s real per capita GDP, observed over the
post-autonomy phase, was contrasted with the corresponding evolution of the same
aggregate for the synthetic counterpart. From this comparison it emerged that, if FVG had
not been an autonomous region, its per capita GDP would have been significantly lower
than that effectively observed during the 1965-1993 period. This seems to confirm the
hypothesis that the region’s administrative and financial prerogatives have been
historically targeted on the enhancement of growth.
Clearly, differently from the findings of cross-national analyses on the association
between economic growth and fiscal federalism, the results of this exercise have limited
extendibility. Specifically, the results obtained for FVG cannot be generalized to the four
other Italian special-statute regions, and even less to autonomous subnational entities of
other countries. Nevertheless, by exploiting the irregular allocation of power among Italian
regions, this study may contribute to the current debate by providing a rigorous analysis on
how a specific autonomy allocation policy may cause the development trajectory of a
particular territory. Similar studies could be thus be carried out to estimate the economic
consequences of the autonomy enjoyed by certain areas of other national asymmetrically
decentralized systems.
7 If all the non-autonomous regions are considered, the gap is 1.2 million lire. 8 The 1986 gap in real GDP, shown in Figure 4, has been converted into current values in order to make it
comparable with central government figures.
19
References
Abadie, A., A. Diamond, and J. Hainmueller, (2010). Synthetic control methods for
comparative case studies: Estimating the effect of California's tobacco control
program. Journal of the American Statistical Association 105(490): 493-505.
Abadie, A., A. Diamond, and J. Hainmueller, (2014) Comparative Politics and the
Synthetic Control Method. American Journal of Political Science, 00(0): 1–16.
Abadie, A. and J. Gardeazabal, (2003). The economic costs of conflict: A case study of the
Basque country. The American Economic Review. 93(1): 113-132.
Azfar, O., Kähkönen, S., Lanyi, A., Meagher, P. and Rutherford, D. (1999).
Decentralization, Governance and Public Services. The Impact of Institutional
Arrangements. A Review of the Literature. IRIS Center, University of Maryland.
Barone, G. and Mocetti, S. (2014) Natural disasters, growth and institutions: a tale of two
earthquakes. Bank of Italy. Temi di discussion, Number 949.
Barro, R. and X. Sala-i-Martin (2004). Economic Growth. MIT Press.
Baskaran, T., Feld, L.P. (2009) Fiscal decentralization and economic growth in OECD
countries: is there a relationship? CESIFO Working Paper No 2721.
Bilancia, P., Palermo, F. and Porchia, O. (2010) The European fitness of Italian Regions.
Perspectives on Federalism, Vol. 2, issue 2, 123-174.
Bird, R.М. (2001) Rationale and forms of fiscal decentralization”, in Bird and Staufner
book of Public Finances, Oxford University Press.
Bird, R.М. (2003) Asymmetric Fiscal decentralization: Glu or solvent?, Published as a part
of International Studies Program Papers, Andrew Young School of Policy Studies,
Georgia State University, U.S.
Bodman1, P., Heaton, K.A. and Hodge, A. (2009) Fiscal Decentralisation and Economic
Growth: A Bayesian Model Averaging Approach.
Cerea, G. (2012) Le autonomie speciali. L’altra versione del regionalismo, fra squilibri
finanziari e possibile equità. Milano. FrancoAngeli.
Cerea, G. (2013) Lo Stato e i territori: spesa, spesa standard e residui fiscali nelle regioni
italiane. Politica economica, 2013(1): 5-56.
Collier D and J. Mahoney. 1996. \Insights and pitfalls: selection bias in qualitative
research." World Politics. 49(1): 56-91.
Congleton, R.D. (2006) Asymmetric Federalism and the Political Economy of
Decentralization.
Crucq, P. and Hemminga, H-J. (2007) Decentralization and Economic Growth per capita in
Europe. Rijksuniversiteit Groningen Wetenschapswinkel Economie &
Bedrijfskunde, EC 178.
Davoodi, H., Zou, H. (1998) Fiscal decentralization and economic growth: a cross country
study. Journal of Urban Economics, 43: 244–257.
Freille, S., Haque, M.E., and Kneller, R. (2007). Decentralisation, Corruption and
Economic Development. Available at SSRN: http://ssrn.com/abstract=985638 or
http://dx.doi.org/10.2139/ssrn.985638
Garcia-Milà, T. and T.J. Mc-Gire, 2002, “Fiscal Decentralization in Spain: Asymmetric
Transition to Democracy.” Mimeo.
Geddes B. 2003. Paradigms and Sand Castles: Theory Building and Research Design in
Comparative Politics. Ann Arbor: Univ. Mich. Press.
20
Iimi, A. (2005), ‘Decentralization and Economic Growth Revisited: An Empirical Note’,
Journal of Urban Economics, Vol. 57, pp. 449-461.
King, G., R.O. Keohane, and S. Verba. 1994. Designing Social Inquiry: Scienti_c
Inference in Qualitative Research. Princeton, NJ: Princeton University Press.
Loughlin, J. (2000), ‘Regional Autonomy and State Paradigm Shifts in Western Europe’,
in: Regions and Regionalism in Europe, Cheltenham: Edward Elgar Publishing, pp.
656-680.
Manor, J. (1999). The political economy of democratic decentralization, World Bank.
Martinez-Vazquez, G. and McNab R.M. (2003) Fiscal Decentralization and Economic
Growth. World Development 31(9): 1597–1616.
Martinez-Vazquez, J. and McNab, R. (2005). Fiscal Decentralization,Macrostability, and
Growth, International Studies Program Working Paper Series at AYSPS, GSU, no.
0506, International Studies Program, Andrew Young School of Policy Studies,
Georgia State University.
Oates W. (1972), Fiscal federalism, New York, Harcourt Brace Jovanovich.
Oates, W. E. (1993). Fiscal Decentralization and Economic Development, National Tax
Journal, 46(2): 237-43.
Oates, W. (1999), An essay on fiscal federalism, in «Journal of Economic Literature», 37,
1120-1149.
Oates W. (2005), Toward A Second-Generation Theory of Fiscal Federalism: International
Tax and Public Finance, 12, 349–373.
Paci R. and Saba A. (1997), The empirics of regional economic growth in Italy. 1951-93,
Contributi di ricerca, CRENoS, 97/1
Ragin, C. (1987) The comparative Method.
Rodriguez-Pose, A. and A. Bwire (2003), ‘The Economic (In)Efficiency of Devolution’,
Department of Geography and Environment, London School of Economics.
Rodríguez-Pose, A. and Ezcurra, R., (2010), Is Fiscal Decentralization Harmful for
Economic Growth? Evidence from the OECD Countries, SERC Discussion Papers
0051, Spatial Economics Research Centre, LSE.
Thiefen, U. (2003), ‘Fiscal Decentralization and Economic Growth in High-Income OECD
Countries’, Fiscal Studies, Vol. 24, pp. 237-274.
Thornton, J. (2007) Fiscal decentralization and economic growth reconsidered. Journal of
Urban Economics, 61: 64–70.
Yilmaz, S. (1999). The impact of fiscal decentralization on macroeconomic performance.
National Tax Association, Proceedings: 251-260.
Western, B. and Jackman, S. (1994) Bayesian Inference for Comparative Re-search,
American Political Journal Review. 88: 412-423.
Woller, G.M., Phillips, K. (1998) Fiscal decentralization and IDC economic growth: an
empirical investigation. Journal of Development Studies, 34: 139–148.