Embed Size (px)
Citation preview

The Economic Impact of the Centre for Commercialization of Research
Prepared for
Centre for Commercialization of Research
Prepared by:
in association with
September 2012

Table of Contents
Executive Summary i
1. Introduction 1 1.1 Introduction 1 1.2 About the Centre for Commercialization of Research 1 1.3 Purpose of the report 2 1.4 Outline of Report 2
2. Background 3 2.1 The importance of innovation 3 2.2 Canada’s innovation strategy 4 2.3 The innovation gap: the importance of commercialization 5 2.4 The role of CCR 6
3. Analytical Framework and Methodology 9 3.1 Logic model 9 3.2 Data sources 10
3.2.1 Secondary research and data sources 10 3.2.2 Online survey 11 3.2.3 Interviews 11
3.3 Framework for economic impact analysis 11 3.3.1 Direct economic impact 12 3.3.2 Spin-off economic impact (indirect and induced impacts) 13 3.3.3 Spillover impacts 13
4. Profile of CCR-Supported Companies 15 4.1 Profile of company performance 15
4.1.1 Follow-on financing 15 4.1.2 Operating revenue 17 4.1.3 Export revenue 19 4.1.4 Employment 20 4.1.5 Highly qualified personnel 24 4.1.6 Research and development 25 4.1.7 Patents 26
4.2 Impact of CCR on client companies 27 4.2.1 Immediate impacts 27 4.2.2 Intermediate impact 29
5. Economic Impact of CCR 33 5.1 Gross output 33 5.2 Direct impact 34 5.3 Spin-off impact 36 5.4 Spillover impact 37 5.5 Summary of total economic impact 38 5.6 Attribution analysis 39

5.7 Benefit-Cost analysis 44 5.7.1 Economic value of CCR adminstration 44 5.7.2 Deadweight loss and net economic impact 45 5.7.3 Summary of net benefit 46 5.7.4 Net fiscal benefit 46
6. Best Practices Analyses 48 6.1 Innovation intermediaries in Canada and other countries 48 6.2 Best practices analysis 52 6.3 Potential areas of development in CCR’s commercialization support 55
7. Summary of Findings and Recommendations 56 7.1 The importance of commercialization support and role of CCR 56 7.2 Economic impact of CCR-supported companies 56 7.3 Economic impact of CCR 57 7.4 Benefit-cost analysis 58 7.5 Commercialization best practices 59 7.6 Recommendations for development of CCR’s commercialization support 59
References 60
Appendix A: Calculation of Spin-off Impact 61
Appendix A: Calculation of Spillover Impact 62

Economic Impact of the Centre for Commercialization of Research i
Executive Summary
Introduction
In 2012, the Centre for Commercialization of Research (CCR) sought to expand the scope of its impact analysis beyond an assessment of its effect on commercialization capacity and company performance to include the economic benefits that arise from its intervention. To this end, CCR engaged Nordicity and The Evidence Network (TEN) to update its annual impact analysis and assess the economic impact of CCR. The following report prepared by Nordicity and TEN:
provides an estimate of the financial and operating performance of CCR-supported companies;
summarizes the impact that CCR had on this performance;
estimates the contribution that CCR-supported companies made to the Canadian economy; and,
uses the results of the client survey and impact analysis to attribute part of this economic contribution to CCR and thereby also estimates CCR’s specific contribution to the Canadian economy.
Background: Canada’s innovation gap
In recent years, a large share of Canada’s economic prosperity has been tied to the extraction and export of natural resources. According to the federal government’s 2011 expert panel report, Innovation Canada: A Call to Action, however, in the long-run, growth in labour productivity– i.e., growth in the value of the goods and services produced by a given hour of labour – is the only way to ensure income growth and higher standards of living. Innovation is one route to this all-important productivity growth.
First and foremost, innovation requires a commitment to research and development (R&D). Indeed, the Canadian government has long recognized the importance of basic and applied R&D, and has responded by implementing a comprehensive set of funding programs and tax incentives. While the experimentation and discovery associated with R&D are vital to innovation, the emphasis placed on R&D by policymakers often ignores the fact that much of the economic benefit from innovation can only be realized through effective implementation of new products, processes or business models: that is commercialization.
Commercialization involves a host of businesses activities that must come together to convert a new product into a marketable product. Whereas R&D requires creativity and scientific rigour, commercialization requires skills or corporate capacities in financing, sales and marketing, networking, human resources and operational management, and intellectual property (IP) management, to name just a handful. Without support for commercialization, the federal government’s investments in R&D risks being effectively stranded.
CCR’s role in the innovation ecosystem
CCR plays a direct role in addressing Canada’s innovation gap by supporting the commercialization of publicly-supported R&D through a variety of intervention channels – ranging from business advisory support, to financing intermediation, to direct funding and financing.
The Ontario Centres of Excellence (OCE), in partnership with Canada’s tri-agency Networks of Centres of Excellence (NCE), created CCR in 2008. Since its founding, CCR’s mission has been to support Canadian entrepreneurs in the commercial introduction of leading-edge products, processes and services to various sectors. Today, CCR also aims to play a key role in building a Canada-wide commercialization network and in promoting a Canadian culture of entrepreneurship.
CCR offers Canada’s early-stage companies five key types of support: (i) Business Advisory Services, (ii) the New Entrepreneur Service, (iii) Commercialization Services, (iv) the Embedded Executive Service,

Economic Impact of the Centre for Commercialization of Research ii
and (v) the Facilitated Access to Capital Service. CCR also supports commercialization initiatives through partnerships with incubators and other innovation intermediaries across Canada.
CCR’s product offering is designed to provide globally-oriented entrepreneurs and early-stage companies with what they need to take publicly funded research from an institutional setting through to global markets. By focusing on commerce and bringing the customer in early, CCR helps early-stage companies transition to businesses, thereby increasing the success rate of spin-off and start-up companies emerging from Canadian academia.
By providing business advisory services on a wide range of issues, ranging from marketing strategy to product development to management of intellectual property, CCR helps innovative early-stage companies become investment ready and market ready. Since its founding, CCR has provided business advisory services to 992 Canadian companies; it has also directly funded the commercialization efforts of 86 early-stage companies.
Summary of CCR’s Economic Impact
When the value of the economic benefits generated by CCR are summed and compared to its level funding of $12.9 million, we find that every dollar of CCR funding yielded $3.26 in economic benefits (measured in terms of GDP) across the Canadian economy. CCR’s solid economic return on investment is a direct result of its economic impact. Between 2009-10 and 2011-12, CCR intervention generated 840 cumulative jobs1 in Canada and led to the creation of $42 million in gross domestic product (GDP).
1 We use the term cumulative job in this report to refer to the number of workers multiplied by the number of years that they have been employed. For example, one person employed for three years is equal to three cumulative jobs. Three persons each employed for one year is also equal to three cumulative jobs. A cumulative job could be a full-time or part-time job.

Economic Impact of the Centre for Commercialization of Research iii
Results of economic impact analysis: net economic benefits
Nordicity and TEN’s analysis used information gathered through the client survey to isolate the portion of overall economic contribution of CCR-supported companies that can be attributed back to CCR’s intervention. In this respect, the analysis can be considered more rigorous than similar analyses of other innovation intermediaries, which may not necessarily have directly addressed the issue of attribution.
Between 2009-10 and 2011-12, the financing and business advisory support provided by CCR to early-stage companies engaged in the commercialization of innovative products generated $42.0 million in incremental GDP for the Canadian economy (Exhibit 1). This total economic impact included $17.5 million in direct GDP generated by CCR-supported companies, $8.0 million in spin-off GDP generated by supplier companies in other industries and $16.5 million in GDP attributable to the spillover impacts of the innovative products and processes developed by CCR-supported companies.
Exhibit 1 Summary of net economic benefit of CCR, 2009-10 to 2011-12 (real 2011 dollars)
Source: Nordicity analysis based on data from TEN survey and Statistics Canada
In terms of total job creation, CCR’s support of Canadian companies generated a total of 840 cumulative jobs within the Canadian economy (Exhibit 2). This total included 320 direct cumulative jobs in the companies supported by CCR (and at CCR itself), 160 spin-off cumulative jobs in supplier industries and a further 360 cumulative spillover-impact jobs.
Exhibit 2 Total job creation attributable to CCR, 2009-10 to 2011-12
Source: Nordicity analysis based on data from TEN survey and Statistics Canada

Economic Impact of the Centre for Commercialization of Research iv
Fiscal benefit analysis
During the first three years of its operation, 2009-10 to 2011-12, CCR intervention yielded a fiscal benefit for federal and provincial governments in Canada. The economic activity generated by CCR support yielded an estimated $13.2 million in federal and provincial taxes, or $300,000 more than the $12.9 million in funding that CCR received during those three years. In other words, CCR generated 840 cumulative jobs and $42 million in GDP at no net cost to the taxpayer.
Financial and economic performance of CCR-supported companies
CCR-supported companies – including companies that received business advice and funding, and those that only received business advice but no direct funding –attracted an estimated $140 million in follow-on financing in 2011-12. Approximately one-half of CCR-supported companies were revenue-positive in 2011-12 (i.e., their most recent fiscal year). These companies earned an estimated $170 million in revenue in 2011-12, and $320 million in revenue since 2009-10.
Global markets and exports are vital to the long-term success of Canada’s small innovative companies. In 2011-12, 60% of CCR-supported companies (that were revenue-positive) recorded export sales. Approximately one-half of these exporting companies earned over three-quarters of their total revenues from export markets. In total, CCR-supported companies earned export sales of $81 million.
CCR-supported companies are also engines of job creation. In 2011-12, they employed an estimated 6,300 persons, of which 3,800 were full-time workers. Between 2009-10 and 2011-12, the commercialization activities of CCR’s client companies supported 11,000 cumulative jobs.
The vast majority of persons employed by CCR-supported companies are highly qualified personnel (HQP) with university degrees. In 2011-12, 85% of the jobs at CCR-supported companies, or 5,100 jobs, were HQP. Since 2009-10, CCR-supported companies have created employment for some 9,000 cumulative jobs for HQP.
Although CCR-supported companies are in the commercialization phase of their corporate development, they continue to make significant investments in R&D. In 2011-12, CCR-supported companies made an estimated $150 million in R&D expenditures; these expenditures accounted for approximately one-half of their total operating expenditures.
Impact of CCR on the financial and economic performance of client companies
The survey data indicate that CCR’s commercialization support has an effect on both immediate and intermediate outcomes at client companies, regardless of whether the companies received funding from CCR or whether they only received non-financial services. The effect is most significant for client companies that received some type of funding from CCR. Funded companies report that, on average, CCR has a significant impact on their financing outcomes and some impact on their R&D linkages, business linkages and information and advice.
Funded companies also report that CCR’s commercialization support has a significant impact on their job creation and helps speed up their time-to-market. They also report that CCR support has some impact on their investment prospects, and their ability to win new customers and generate revenues. Evidently, the market performance of companies – particularly funded companies – is markedly improved through the services received from CCR.
Recommendation for development of CCR commercialization support
To improve the effectiveness of its commercialization support, CCR should continue to (i) develop offerings that help companies secure lead customers, (ii) expand the global networking component of its offering, and (iii) adopt a network-centric approach to commercialization support, expanding its Embedded Executive and Facilitated Access to Capital Services through strategic partnerships with regional innovation partners.

Economic Impact of the Centre for Commercialization of Research v
About Nordicity
Nordicity is a boutique international consulting firm providing private and public sector clients with solutions for Strategy and Business, Policy and Regulation and Evaluation and Economic Analysis across four priority industries:
Arts, culture and heritage
Digital and creative media
Information and communications technologies (ICT), and innovation
Telecommunications and spectrum
Nordicity has a long history of research and analysis of the ICT, and science and technology (S&T) industries. It has prepared numerous studies related to the economic development of Canada’s ICT and S&T industries, including studies related to CANARIE, SchoolNet, Radarsat, photonics, medical devices, and advanced wireless services. Nordicity has also grown to become one of Canada’s leading economics consulting firms for public- and private-sector clients in the ICT, telecommunications, media/entertainment and culture/content industries.
Nordicity was founded in Ottawa in 1979. It now also has offices in Toronto, Vancouver, and London, UK; with clients across North and Central America, Europe, Africa, and Asia.
For more information about Nordicity, visit www.nordicity.com.
About The Evidence Network
The Evidence Network (TEN) provides assessments of the impact of innovation intermediaries on companies, drawing on its expertise in innovation intermediary management, technology commercialization, research on innovation intermediaries, and impact assessment. TEN entered the market in 2009 and has rapidly become known for its sound methodology and robust approach designed to determine the impact of intermediary services on the resources and capabilities of companies, and the impact on companies’ performance in the market.
For more information about The Evidence Network, visit www.theevidencenetwork.com.

Economic Impact of the Centre for Commercialization of Research 1
1. Introduction
1.1 Introduction
There is little dispute that the best way to ensure that Canada’s standard of living improves in the future is through continual improvement in productivity. In this increasingly competitive globalized marketplace, the productivity of the Canadian economy is inextricably tied to the ability of Canadian companies – and Canadians – to develop innovative products and processes that can be marketed around the world. For this reason, governments in Canada and other western economies have designed and implemented policies to foster innovation.
Bringing an idea or even a prototype to market is no trivial matter. The human and financial investment can be many times higher than the value of the R&D required to develop the product or service. What is more, the skills required to bring a product to market are often vastly different from the skills required to develop the product.
Commercialization is, in effect, the process of converting the output of R&D into products that can be exposed to consumer markets, aiming to increase their odds of capturing demand in those markets and thereby generating sales and revenue. The sales and distribution of these new innovative products ultimately generate economic benefits not only for the developers and marketers of the new products, but also the end user, and for the overall economy.
In 2011, the Federal Government’s Expert Panel on Review of Federal Support to Research and Development (the “Expert Panel”) called for a rebalancing of the R&D support regime. In particular, the Expert Panel’s findings and recommendations reflected the position within policymaking circles that Canada’s improved research activities may not be translating directly into long-term economic benefits for the Canadian economy, since there has been insufficient emphasis on the development side of the R&D equation. Indeed, the report of the Expert Panel recognized that rebalancing towards more support of commercialization is needed for Canada to translate its tremendous human capital into innovation and economic benefits.
The recommendations of the Expert Panel were put into practice in the 2012 federal budget, as the federal government announced a reorientation of its innovation support regime away from tax credits and towards direct funding of business-driven initiatives.
The Centre for the Commercialization of Research (CCR) is part of the federal government’s attempt to improve the rate of commercialization of innovative products and services. These improved rates of commercialization facilitated by CCR and other publicly supported organizations should ultimately mean that more ideas developed by Canadians will face the test of the global marketplace, leading to innovation, corporate development and economic benefits within Canada.
1.2 About the Centre for Commercialization of Research The Ontario Centres of Excellence (OCE), in partnership with Canada’s tri-agency Networks of Centres of Excellence (NCE) created CCR in 2008. The mission of CCR is to support Canadian entrepreneurs in the commercial introduction of leading-edge products, processes and services to various sectors. It also aims to play a key role in building a Canada-wide commercialization network and in promoting a Canadian culture of entrepreneurship.
The CCR’s innovation-intermediary activities include business advisory services, financial intermediation, financial assistance for retaining experienced executives and direct financing support. Since its founding, it has provided business advisory services to 992 Canadian companies. It also directly funded the commercialization efforts of 86 companies.

Economic Impact of the Centre for Commercialization of Research 2
1.3 Purpose of the report
In 2010, CCR commissioned The Evidence Network (TEN) to prepare a study of its impact. This study – which was repeated in 2011 – utilized a survey of CCR’s client companies to quantify and assess the effect that CCR had on those companies’ commercialization capacity and performance.
In 2012, CCR sought to expand the scope of its impact analysis beyond an assessment of its effect on commercialization capacity and company performance to include the economic benefits that arise from CCR’s intervention. To that end, CCR, engaged TEN and Nordicity Group Ltd. (“Nordicity”) to update its annual impact analysis and analyze the economic impact of CCR. This report provides the results of that economic impact analysis.
1.4 Outline of Report
This report has been organized into seven sections. Section 2 provides additional background on the innovation ecosystem and the role of CCR within that ecosystem. Section 3 outlines the analytical framework and methodologies used to quantify and assess CCR’s economic impact.
Section 4 summarizes the results of TEN’s analysis of CCR’s impact on its client companies’ commercialization capacity and performance. TEN’s full analysis can be found in the companion report, An Assessment of the Impact of the Centre for Commercialization of Research 2010-2012. In Section 5, we provide the results of the economic impact analysis.
Section 6 provides a best-practices analysis, which helps to position CCR’s service offering in relation to other innovation intermediaries around the world. Section 7 summarizes the key findings from our research and analysis, and offers recommendations for the future development of CCR’s commercialization support offering.

Economic Impact of the Centre for Commercialization of Research 3
2. Background
2.1 The importance of innovation
Innovation is at the core of economic development in western countries and vital to Canada’s economy in the long run Innovation is at the core of economic development for western countries. The development of new products that can be marketed globally contributes to continual improvement in productivity – the more efficient use of human and natural resources – and improvements in incomes and standards of living.
In recent years, a large share of Canada’s economic prosperity has been tied to the extraction and export of natural resources. Economic development based on natural resources is vulnerable to swings in international prices and resource exhaustion. In the long-run, growth in labour productivity– i.e., growth in the value of the goods and services produced by a given hour of labour – is the only way to ensure income growth and higher standards of living (Expert Panel on Review of Federal Support to Research and Development 2011, 2.1). Innovation is one route to productivity growth.
Innovation is distinct from invention, although the latter is a component of the former. Whereas invention results in the creation of a novel product or process, innovation is the
…implementation of a new or significantly improved product (good or service), or process, a new marketing method, or a new organizational method in business practices, workplace organization or external relations (Oslo Manual, OECD and Eurostat, 2005, p. 46)
As noted in this definition, innovation can take many forms. Product innovation is the most familiar. However, innovation can also arise from new ways of producing products (i.e., process innovation). New business models can also be a form of innovation. The reorganization of the manner in which human and other business inputs are utilized can generate organizational innovation. A fourth form of innovation is market innovation, whereby, companies use technology or other inputs to reach new customers or existing customers in a more efficient manner.
Innovation can be either incremental or radical. Incremental innovation is the continual and gradual improvement in existing products, processes and business practices. It often takes place within mature companies that already hold significant market share. Radical innovation is often associated with the concept of creative destruction first articulated by Schumpeter. Radical innovation can often have profound economic and social impacts. It can also threaten existing companies’ market positions; as such, radical innovation often originates in SMEs.
First and foremost, innovation requires a commitment to R&D. Governments can prioritize R&D investment through two main policy channels: (i) direct procurement and provision public facilities (including higher education; and (ii) incentives for private investment (tax incentives or R&D subsidies. However, it is important to not lose sight of the importance of implementation within the context of innovation. Implementation necessarily entails the commercialization of the new products, processes or business models that arise from R&D.

Economic Impact of the Centre for Commercialization of Research 4
2.2 Canada’s innovation strategy
Canadian governments have long been very supportive of R&D; the 2012 federal budget, however, signaled a shift in innovation strategy away from tax incentives and towards more directed business-driven investment The Canadian government – like many other western governments – has long recognized the importance of basic and applied R&D, and the market failure that can often prevent economies from reaching their potential. Furthermore, in the case of Canada, the paucity of home-grown multinational companies in many of the leading R&D-intensive sectors has meant a lower intensity of private sector R&D compared to other G7 countries. Additionally, the resource industry (while contributing a large share of GDP) has traditionally had a low rate of investment in R&D.
The Canadian government has responded to the general R&D market failure and Canada’s unique challenges by implementing a comprehensive set of funding programs and tax incentives to stimulate R&D spending and to reduce the financial risks associated with R&D activities. In 2011/12, the federal government invested an estimated $7.1 billion in R&D, with 64% of this amount flowing to extramural organizations and businesses.
Up until recently, the Scientific Research and Experimental Development Tax Credit (the “SR&ED”) had been the centrepiece of the federal government’s policy of supporting business expenditure on R&D (BERD). In 2010/11, the federal government provided over $3.5 billion in financial support for Canadian businesses through the SR&ED (Expert Panel on Review of Federal Support to Research and Development 2011, 3-3).
Canada’s continued poor– and deteriorating – performance in BERD led the Expert Panel to call for a rebalancing of the federal government’s R&D support regime. In particular, it called for a simplification of the SR&ED and a move away from refundable tax credits to more direct funding.
In response, the 2012 federal budget announced a rebalancing of the federal government’s support for innovation. It shifted its resources away from the indirect support of R&D through the SR&ED to more direct funding support through the Industrial Research Assistance Program (IRAP), NCE and other direct-support programs. The SR&ED was streamlined and reduced in scope. Meanwhile, funding through IRAP was doubled to over $100 million annually, as was the funding ($14 million) for the Industrial Research and Development Internship Program.
The federal government’s new innovation strategy also included funding: to help companies attract risk capital; for direct venture capital investments (through the Business Development Bank of Canada [BDC]); for forestry innovation and market development; for a refocus of the National Research Council on business-led, industry-relevant research; and to make the NCE permanent. The federal government also announced $95 million over three years and $40 million annually thereafter, to make the Canadian Innovation Commercialization Program (CICP) permanent.
Taken together, the initiatives outlined by the federal government in the 2012 federal budget signal a shift in innovation strategy away from activity-based tax incentives to place greater emphasis on directed and discretionary support that is business-driven and fosters deeper collaboration between the research community and businesses.

Economic Impact of the Centre for Commercialization of Research 5
2.3 The innovation gap: the importance of commercialization
Canada has its own unique innovation gap: it needs a better support and financing infrastructure for the commercialization of new products developed on the basis of public investment in R&D The emphasis placed on R&D by policymakers often ignores the fact that much of the economic benefit from innovation can only be realized through effective commercialization. Research and the development of a new product comprise only one-half of the innovation cycle. The other half entails the commercialization of those new products.
Commercialization involves a host of businesses activities that must come together to convert a new product into a marketable product. In some respects, the commercialization process can be complicated by the fact that it often calls for a very diverse set of skills and inputs, and these may be quite different from the traditional R&D skill set. Whereas R&D requires creativity and scientific rigour, commercialization requires skills or corporate capacities in financing, sales and marketing, networking, human resources and operational management, and intellectual property (IP) management, to name just a handful.
Commercialization is often a scaling-up process both in terms of production capacity and also general corporate capacity. Scaling-up usually entails a scaled-up cost structure. Without a source of revenue, this scaled-up cost structure requires risk capital. For that reason, outside financing is key to commercialization. Sufficient financing alone cannot ensure the commercialization of new products, however; companies must also assemble the skills portfolio and organizational practices that can make the most effective use of that financing capital.
Just as a market failure provides the basis for government intervention in R&D, so there is an economic basis for government intervention in commercialization. Without support for commercialization, the government’s investments in R&D are effectively stranded. Indeed, the economic benefits of that R&D could be potentially captured by companies outside of Canada that license or simply leverage that R&D to commercialize their own products.
Canada relies a great deal on small and medium-sized enterprises (SMEs) as the source of innovative products. SMEs often face financing challenges that larger companies, including multinationals, do not face. This SME financing gap provides the public policy basis for government intervention. This intervention can be direct – through direct funding or tax incentives to private investors – or it can be indirect through the facilitation of better-functioning financing markets for SMEs.
With a relatively small domestic economy compared to its G7 peers, there is also a good public policy rationale for supporting SMEs endeavours to expand their sales and marketing capacity, particularly with respect to international markets.
The report of the Expert Panel also recognized that a rebalancing towards more support of commercialization was needed for Canada to translate its R&D into innovation and economic benefits. With the 2012 announcement of increased funding for IRAP and permanent funding for CICP, the federal government gave an even greater emphasis on commercialization in its innovation strategy.
To implement its policy for commercialization support, the federal government has, through the NCE, established the Centres of Excellence for Commercialization and Research (CECR). The CECR are comprised of public-sector, not-for-profit or academic institutions that form non-for-profit corporations devoted to supporting the commercialization of new technologies by matching clusters of research expertise to the business community through knowledge sharing and other types of support.
Exhibit 3 lists the 22 CECR currently in operation across Canada. Most of these CECR have some type of sectoral focus; some have a regional focus.

Economic Impact of the Centre for Commercialization of Research 6
The federal government is also working closely with the private sector to accelerate its own commercialization activity. To that end, NCE provides funding to four Business-Led Networks of Centres of Excellence (BL-NCE). Together, the CECR – of which CCR is one – and the BL-NCE form part of the backbone of the federal government’s commercialization support and attempt to address the innovation gap in Canada.
Exhibit 3 List of Centres of Excellence for Commercialization and Research
Centres of Excellence for Commercialization and Research
Advanced Applied Physics Solutions Inc. Centre of Excellence in Personalized Medicine Bioindustrial Innovation Centre GreenCentre Canada Canadian Digital Media Network – CDMN Institute for Research in Immunology and Cancer –
Commercialization of Research Centre for Commercialization of Regenerative Medicine Leading Operational Observations and Knowledge for
the North Centre for Drug Research and Development MaRS Innovation Centre for Imaging Technology Commercialization MiQro Innovation Collaborative Centre Centre for Probe Development and Commercialization Oceans Networks Canada Centre for Enterprise and
Engagement Centre for Surgical Invention and Innovation Pan-Provincial Vaccine Enterprise Centre for the Commercialization of Research Tecterra Centre of Excellence for the Prevention of Organ Failure The Prostate Centre's Translational Research Initiative
for Accelerated Discovery and Development Centre of Excellence in Energy Efficiency Wavefront Source: Networks of Centres of Excellence
2.4 The role of CCR
CCR addresses the innovation gap through its business advisory services and investments in Canadian companies’ commercialization initiatives CCR plays a direct role in addressing the innovation gap in Canada by supporting the commercialization of publicly-supported R&D through a variety of intervention channels – ranging from business advisory support, to financing intermediation, to direct funding and financing.
CCR offers five key types of support to Canadian researchers and entrepreneurs. These offerings include: (i) Business Advisory Services, (ii) the New Entrepreneur Service, (iii) Commercialization Services, (iv) the Embedded Executive Service, and (v) the Facilitated Access to Capital Service. CCR also supports commercialization initiatives through partnerships with incubators and other innovation intermediaries.
While CCR will provide funding to companies – and will even make investments in companies in some cases – its primary intervention tool is business advice. By providing business advisory services on a wide range of issues, ranging from marketing strategy to product development to IP management, CCR is helping innovative Canadian SMEs become investment ready and market ready.
CCR’s product offering is designed to provide globally-oriented entrepreneurs with what they need to take publicly funded research from an institutional setting through to global markets. By focusing on commerce and bringing the customer in early, CCR helps early stage firms transition to businesses, thereby increasing the success rate of spin-off and start-up companies emerging from academia.
Throughout the business support cycle, CCR takes on the role of de-risking the commercialization opportunity and aggregating investments to help move early-stage firms to a position of market readiness. Once a firm is market ready, CCR’s international commercialization network – which it continues to expand and strengthen – can help support and accelerate Canada’s born global companies. These born global companies are globally focused from inception: their focus is almost entirely on

Economic Impact of the Centre for Commercialization of Research 7
identifying and exploiting global niches from the first day of operations (Rennie 1993). CCR’s international network can help its client companies identify customers, partners and suppliers outside of Canada.
CCR is particularly unique in terms of its de-risking role. By working with companies to put in place effective IP protection and an experienced management team (i.e., embedded executives), CCR moderates the areas of business risk, which make it difficult for angel investors and ventures capitals to assess financing opportunities. CCR’s international networks can also help its client companies identify international sales partners or even anchor customers outside Canada, which offer further comfort to investors.
Exhibit 4 CCR role in the innovation process
Financing – or attracting risk capital – is by far the most pressing challenge for SMEs trying to bring innovative products to market. CCR’s business advisory services help them develop the market research, business plans and IP-management plans that investors will need to make their investment decisions.
Market readiness goes hand-in-hand with investment readiness. CCR helps companies establish the domestic and international networks they need to generate interest in their products and forge the relationships vital to their supply chain and sales development.
For young entrepreneurs that are in the pre-incorporation or start-up phase, CCR’s support goes beyond business advisory services. Through CCR’s New Entrepreneur Service, it provides soft loans of up to $6,000 per project.
Once entrepreneurs have launched their companies and are looking to expand their commercialization capacity, they can tap into CCR’s Embedded Executive Service. Through the Embedded Executive Service, CCR provides loans of up to $50,000, so that SMEs can hire experienced entrepreneurs or business executives for a period of four to six months. The embedded executive is typically brought in for specific purpose: for example, raising financing or negotiating contracts.
Economic Impact of the Centre for Commercialization of Research 8
Through the Facilitated Access to Capital Service, CCR can broker financing deals with third parties; it can also make its own investments. CCR’s investments take the form of a convertible debenture and can be as much as $250,000 per company. Through its direct investments, CCR seeks financing leverage of at least 4:1.
As of March 31, 2012, CCR had provided business advisory services to a total of 992 companies (i.e., “companies served”) (Exhibit 5). Among these 992 companies, CCR made a total of 98 investments (loans or convertible debentures) to a total of 86 individual companies; 12 companies received more than one type of funding investment from CCR. These investments included loans made to companies through the New Entrepreneur Service, and funding made available through the Embedded Executive and Commercialization Resources Services. It also included convertible-debenture investments made in 20 companies over the three-year period. In total, CCR invested $6.5 million in 86 companies over the span of three years, 2009-10 to 2010-11.
Exhibit 5 Summary of CCR service activity and impacts 2009-10 2010-11 2011-12 Total to
date Number of client companies Companies served 382 351 259 992 Companies funded 33 42 23 98† Embedded Executive 18 15 5 38 Commercialization Resources 4 8 2 14 Access to Capital 4 8 8 20 New Entrepreneurs 8 11 8 27 Impact on client companies†† CCR investments ($M) 1.9 3.0 1.9 6.8 Co-investment leverage ($M) 10.2 8.7 9.5 28.4 Follow-on financing ($M) 42.7 35.9 70.6 149.2 Incremental sales ($M) 7.1 16.4 32.8 56.3 New jobs created 393 509 613 1,515Source: CCR † CCR made 98 investments in 86 distinct companies. †† Statistics are for CCR-investee companies only.
In Section 5 we provide additional analysis of the financial and operating performance of CCR client companies.

Economic Impact of the Centre for Commercialization of Research 9
3. Analytical Framework and Methodology
3.1 Logic model
Our assessment of the impact of CCR relies upon the logic model for innovation intermediaries, developed by TEN. The logic model (Exhibit 6) illustrates how organizations such as CCR work to fulfill their missions in support of company success. The logic model provides guidance to help understand the various processes that lead to intermediaries’ impact on client companies, and companies’ impact on the economy. Developed specifically for assessment of impact, it expresses the process logic that follows from intermediaries’ purposes, leading to economic and social impacts, capturing all elements of the intermediaries’ activities in support of commercialization and the growth of innovative companies.
As shown at the top-left of Exhibit 6, innovation intermediaries such as CCR express their purpose in terms of national competitiveness, regional economic development, industry strength, or viable new ventures. They also conduct activities to achieve immediate and intermediate impacts on the companies that are their members or clients, and long-term impacts in the form of socio-economic benefits. The immediate impacts of innovation intermediaries are improvements in the resources or capabilities of client or member companies, intermediate impacts are improvements in the performance of client or member companies, and long-term impacts affect communities, industries, economies, societies, and the environment.
Exhibit 6 Innovation intermediary logic model
Working backwards, from right to left, the logic model shows how different types of impacts are achieved. The achievement of long-term impact depends on the achievement of intermediate impact, which in turn depends on the achievement of immediate impact. So, for example, an innovation intermediary that seeks to create economic growth in a region does so by facilitating improvements in the performance of local

Economic Impact of the Centre for Commercialization of Research 10
companies (i.e., desired intermediate impact), either by facilitating company growth or the creation of new ventures, or by attracting new companies to the region. It facilitates company growth and the creation of new ventures by facilitating improvements in the resources and capabilities of local companies (i.e., its desired immediate impact). The fundamental logic is that innovation intermediaries achieve their desired intermediate and long-term impacts by affecting the resources and capabilities of the companies with which they work.
To achieve its specific purposes, CCR uses as inputs, human and financial capital, to effect changes in companies through activities that include financial offerings such as funding for commercialization support, embedded executives, and seed financing, as well as non-financial offerings such as mentoring, linkages to business services, and facilitation of funding. Through these offerings, companies benefit from an immediate impact attributable to CCR on their resources and capabilities. For example, companies gain access to CCR-provided financing, information and advice, and business and research linkages; enabling for example, improved business models or strategies, embedded executives, linkages to suppliers or channel partners, or access to technical services provided by other organizations.
With improved resources and capabilities, the logic is that companies will achieve superior market performance, for example, faster time to market and increased market share, revenues, investment, or valuation. It then follows that companies with improved market performance attributable to CCR will create impact on the economy that would not otherwise readily occur, helping to realize the ultimate policy impact: improved socio-economic conditions in Canada. The next section outlines a framework for identifying and measuring these socio-economic benefits.
3.2 Data sources
3.2.1 Secondary research and data sources
In addition to operational data and annual reports supplied by CCR, we consulted a large body of external literature, including reports from Statistics Canada, National Centres of Excellence, innovation intermediaries in other countries, OECD and previous TEN impact studies.
In particular, we determined the impact on company performance attributed to CCR by using the systematic and standardized methodology of TEN, implemented by surveying CCR’s client companies. Three such reports have been produced documenting CCR’s impact on companies:
An Assessment of the Impact of the Centre for Commercialization of Research 2009-2010
An Assessment of the Impact of the Centre for Commercialization of Research 2010-2011
An Assessment of the Impact of the Ontario Centres of Excellence Centre for Commercialization of Research on Companies 2011-2012 (a companion document to this report)
These reports, based upon data collected within a year of when services were provided, minimize retrospective bias because the recurring surveys result in relatively short lag times between the provision of the service and the administration of the survey.2
We also conducted secondary research of relevant academic articles. A complete list of the reports and academic articles used in the preparation of the economic impact analysis can be found in the References section at the end of the report.
2 The 2010-2011 report describes the impact of a sub-set of CCR clients that had received funding.

Economic Impact of the Centre for Commercialization of Research 11
3.2.2 Online survey
We used an online survey of CCR client companies to collect a variety of data needed for the economic impact analysis. We also drew upon data collected by TEN during previous surveys of client companies, which were conducted in 2011 and 2010.
Nordicity and TEN developed and administered the 2012 version of the online survey of CCR client companies. CCR’s Managing Director/Senior Vice-President of OCE distributed the 2012 version of the online survey to a total of 453 client companies that had received funding or business support from CCR since 2008. The online survey was in the field for the duration of the month of May 2012.
In total, 152 companies responded to the survey, including 66 companies that received some type of funding from CCR and 86 companies that only received business advisory support from CCR (i.e., “non-funded companies”) (Exhibit 7). The overall survey response rate was 34%. Among funded companies the response rate was 92%.
Exhibit 7 Response rates for 2012 online survey Funded
companies Non-funded companies
Total
Number of responses 66 86 152 Total number of potential respondents 72 381 453 Response rate 92% 23% 34% Total population 72 617 689 Population coverage rate 92% 14% 22% Source: TEN survey and CCR
Due to limitations in the availability of contact information for client companies (e.g., invalid email addresses), the number of companies that received the online survey invitation (453) was less than the estimated size of the client company population (689). As such the population coverage rate for non-funded companies was 14%, somewhat lower than the response rate of 34%.
3.2.3 Interviews
To collect additional background information, we also conducted 12 interviews with client companies and CCR’s seed-financing partners. We interviewed nine client companies, including companies that received financing from CCR, funding for the Embedded Executive Service or business advisory support. We also interviewed three seed-financing partners from within Canada’s venture capital ecosystem. In order to keep the interview information anonymous, we have not identified the interview participants.
3.3 Framework for economic impact analysis CCR support allows companies to bring their products to market (i.e., commercialization of products). These companies, in turn, generate demand for labour, particularly highly qualified personnel (HQP). This labour yields an economic impact within Canada. Part of this economic impact can be attributed to CCR, depending on the type and level of support provided by CCR.
Exhibit 8 depicts the various components of CCR’s economic impact and the economic modelling process. The context of CCR’s operations and intervention can be characterized through three layers of economic impacts: (i) direct economic impact, (ii) spin-off economic impact, and (iii) spillover impacts. In the remainder of Section 3.2, we discuss these impacts and describe how we can use economic models to estimate them.
The preparation of the analysis required a significant amount of economic modelling. The economic modelling entailed the development of approaches and calculations to estimate the gross output, GDP, wages, and jobs across the Canadian that could be attributed to CCR’s intervention. To estimate the latter, we also developed assumptions for average salary, based on the survey data.

Economic Impact of the Centre for Commercialization of Research 12
The estimation procedures largely relied on Statistics Canada’s Input-Output (I-O) tables. Statistics Canada’s I-O tables permit an analyst to trace how increased (or decreased) expenditures in a particular industry will affect the output, GDP and employment in other industries that supply inputs to the industry under analysis. We describe the assumptions incorporated into each model as we present them throughout the report.
Exhibit 8 Overview of stages of economic impact and estimation methodologies
3.3.1 Direct economic impact
The direct economic impact refers to the increase in GDP and employment within CCR clients’ own businesses and industries. When these client companies are in the pre-revenue phase, this economic impact largely consists of the wages paid to their employees and contractors. In the positive-revenue phase, the impact includes employee and contractor wages, as well as any operating surplus – i.e., returns to owners and shareholders.
The survey provided data on employment, labour income and attribution to CCR. These data were used in conjunction with Statistics Canada’s I-O tables and data on average salaries to derive the direct economic impact in terms of GDP, wages and employment.

Economic Impact of the Centre for Commercialization of Research 13
Meta-Analysis
Meta-analysis is a research technique whereby an analyst substitutes original empirical work with a review of existing empirical work, to develop a quantitative analysis. The quantitative relationships found in existing empirical work are then applied to the issue under analysis to derive an approximation of an empirical result. For example, a meta-analysis of several research studies may find that, on average, a 25% increase in patents leads to a 5% increase in per capita GDP. This empirical relationship could be applied to an academic institution’s record of patent creation to establish the economic impact of its research activities.
3.3.2 Spin-off economic impact (indirect and induced impacts)
As CCR-supported companies form and grow, they also generate a spin-off economic impact. The spin-off economic impact has two components: (i) the indirect economic impact and (ii) the induced economic impact.
The indirect economic impact arises from CCR-supported companies’ demand for (i.e., purchases of) inputs from other industries. These industries have differing levels of GDP and employment impacts within Canada. As such, the ultimate economic impact is a function of the type of inputs purchased. If the inputs are largely imports to the Canadian economy, the economic impact would be lower than it otherwise would have been. The induced economic impact stems from Canadian households that earn labour income at both the direct- and indirect-impact stages, as they spend that income throughout the economy.
To estimate the indirect impacts, the data from the online survey was used in conjunction with Statistics Canada’s I-O tables to derive an estimate of the indirect economic impact in terms of GDP, wages and employment. The magnitude of the induced impact was estimated using a multiplier that reflects the marginal propensity to consume and import across Canadian households.
3.3.3 Spillover impacts
All of the above represent the economic returns captured by the client companies and its inputs (workers and suppliers). However, one of the hallmarks of innovation is that it can also generate substantial spillover impacts. The commercialization and dissemination of innovative products and services also generates positive economic impacts (i.e., positive externalities) for downstream users and other sectors of the economy. These impacts are referred to as spillover impacts.
Some innovative products developed by CCR-supported companies reduce the production costs of downstream users: thereby permitting productivity growth for which the value is not captured by the innovating company. Innovative products can also have knowledge spillovers that lead to the development of other innovative products and services.
Other innovative products improve the lives of Canadians (e.g., medical technologies) or allow them to save time (and thereby have more leisure time). These types of socio-economic benefits may also not be captured in the market price of innovative products, and thereby yield an additional consumer surplus.
All of these spillover impacts are difficult to observe directly and quantify. However, several empirical studies have attempted to capture them by estimating the social returns. The methodology for this analysis will leverage this existing empirical work.
The social returns were estimated through two channels, both of which relied upon the results of meta-analysis research (see adjacent box).
Empirical research has found a strong relationship between the average years of education in the workforce and per-capita GDP across the economy. This increase in per-capita GDP reflects not only the benefits captured by the innovating companies, but also the spillover impacts captured by other sectors within an economy.
On the basis of this empirical work, CCR clients’

Economic Impact of the Centre for Commercialization of Research 14
contribution to the attraction and retention of HQP in Canada can be converted to forecasts of HQP, incremental changes in average levels of education, and contributions to higher per-capita GDP in Canada.

Economic Impact of the Centre for Commercialization of Research 15
4. Profile of CCR-Supported Companies
In this section we profile the characteristics and performance of CCR-supported companies. We begin with an analysis of these companies’ performance during their most recent fiscal year (i.e., 2011), as reported in the 2012 online survey. We then examine CCR-supported companies’ cumulative performance between 2009-10 and 2011-12; this analysis is based on data from the 2012 online survey as well as the 2010 and 2011 surveys conducted by TEN. Finally, we summarize the results of TEN’s analysis of the immediate and intermediate impacts of CCR on client companies.
4.1 Profile of company performance In this section we provide a profile of financial and economic performance of CCR-supported companies during 2011. As discussed in Section 2. 4, CCR’s history of industry support reaches back to 2010. As such, for certain performance measures we also use data from CCR and all three surveys conducted by TEN (in 2010, 2011 and 2012) to construct a profile of the cumulative performance of CCR-supported companies. The statistics in this section are based on the data collected through TEN’s surveys; however, they have been grossed up on a proportional basis to generate estimates of the overall universe of CCR-supported companies.3
4.1.1 Follow-on financing
Two-thirds of companies funded by CCR also raised follow-on financing; in total, CCR-supported companies raised $140 million in follow-on financing in 2011-12 Financing is absolutely vital to the commercialization objectives of emerging companies. Without external financing from angel investors, venture capital firms, Crown corporations (e.g., BDC) and other publicly funded investors, innovative companies are unable to test their products, scale up their operations or undertake additional R&D. For this reason, CCR takes an active role as both a direct investor and an investment aggregator.
Follow-on financing refers to the financing raised by CCR-supported companies in financing rounds following the receipt of investments or business advice from CCR. Two-thirds of funded companies – including companies funded by CCR in 2009, 2010 and 2011 – secured some type of follow-on financing in 2011-12 (Exhibit 9). In fact, one-half of the funded companies that did secure follow-on financing in 2011-12 obtained $500,000 or more in financing. In total, funded companies secured $16.2 million in follow-on financing in 2011-12.
In contrast, the majority of non-funded companies (60%) did not obtain follow-on financing in 2011-12. This does not rule out the possibility that they could have obtained follow-on financing in earlier years. Among non-funded companies, a much lower percentage (7%) secured $500,000 or more in follow-on financing. In total, non-funded companies raised an estimated $124.4 million in follow-on financing in 2011-12.
3 Given the survey response rates (see Section 3.2.2), data for funded companies were grossed up by a minimum factor of 1.14 (92% response rate), to estimate results for the total universe. The gross-up factor may have been higher for survey questions with a lower response rate. For non-funded companies, the gross-up factor was a minimum of 7.17 (14% response rate), depending on the response rates for particular questions.

Economic Impact of the Centre for Commercialization of Research 16
Exhibit 9 Share of companies by amount of follow-on financing raised in 2011-12
a. Funded companies b. Non-funded companies
Source: Nordicity analysis based on data from TEN survey
Cumulative performance
On a cumulative basis, funded companies have raised an estimated $23.2 million in follow-on financing since 2009-10 (Exhibit 10). However, this figure probably understates the actual level of follow-on financing because no data are available for the amount of follow-on financing raised by 2009-10 cohort companies in 2010-11. Non-funded companies have raised a cumulative total of $150.5 million in follow-on financing since 2009-10. Again this amount probably understates the true total, since no data were collected for non-funded companies in 2010-11.
Exhibit 10 Cumulative follow-on financing (real inflation-adjusted 2011 dollars)
a. Funded companies b. Non-funded companies
Source: Nordicity analysis based on data from TEN survey * Amount excludes any follow-on financing raised by 2009-10 cohort companies in 2010-11. ** Estimate based on per-company average of follow-on financing raised by non-funded companies in 2009-10 ($56 million). Amount excludes any follow-on financing raised by 2009-10 cohort companies in 2010-11.
Economic Impact of the Centre for Commercialization of Research 17
4.1.2 Operating revenue
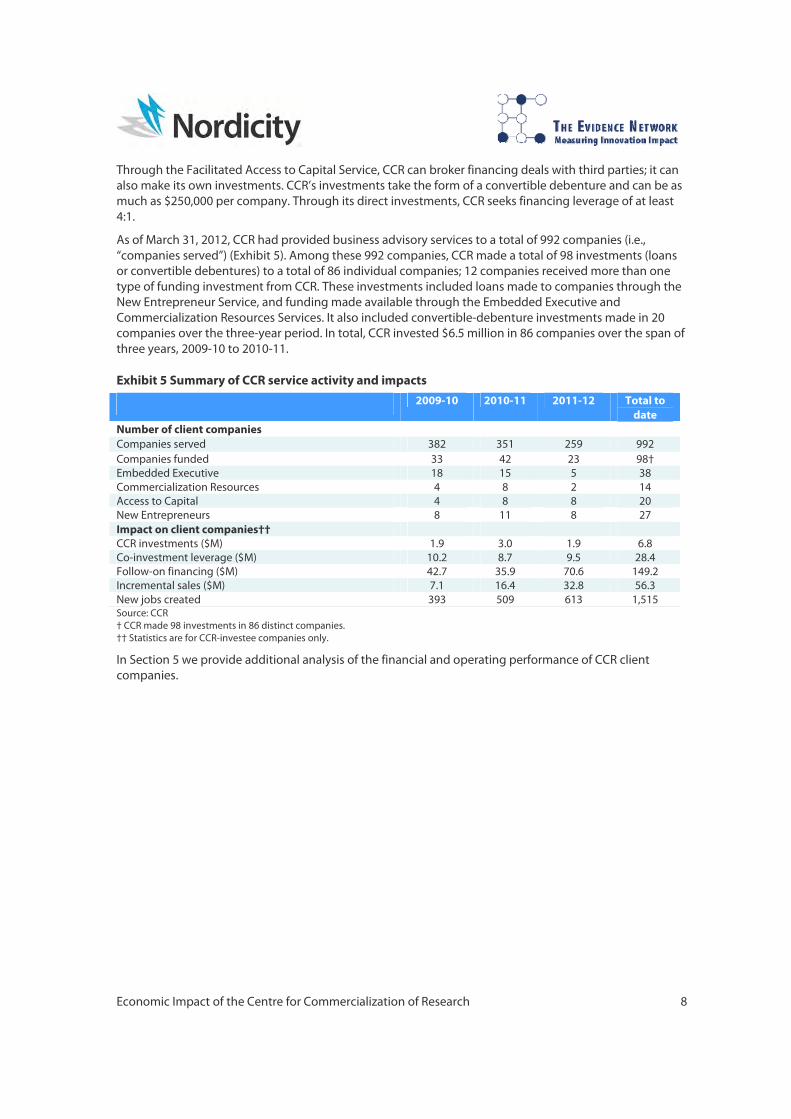
Over one-half of CCR-supported companies already earn revenue; they earned over $170 million in revenue in 2011 Given that CCR supports early-stage companies in their efforts to commercialize new products, it is not surprising that many supported companies are pre-revenue: i.e., they reported zero revenue in their most recent fiscal year. One-half of funded companies were pre-revenue in their most recent fiscal year (Exhibit 11). The share was somewhat lower among non-funded companies: 37% of companies were pre-revenue.
Exhibit 11 Share of companies by revenue range, 2011-12
a. Funded companies b. Non-funded companies
Source: Nordicity analysis based on data from TEN survey
Across those funded companies with positive revenue, we estimate revenue totaling $13.0 million in 2011 – an average of $362,000 per company (with positive revenue). Across non-funded companies, total revenue during 2011 is estimated to have been $158.6 million, or $407,000 per company (with positive revenue).
Exhibit 12 Average revenue per company Funded
companies Non-funded companies
Total
A. Estimated total revenue ($M) 13.0 158.6 172.3 B. Number of companies 72 617 689 C. Number of companies with positive revenue in the most recent fiscal year 36 389 425
D. Average revenue per company [A÷C] ($) 362,000 407,000 405,000 Source: Nordicity analysis based on data from TEN survey
Cumulative performance
Between 2009-10 and 2011-12, CCR-supported companies earned over $320 million in total revenue Using the survey data for the incidence of positive revenue and the estimated average revenue per company (with positive revenue), we estimated the annual and cumulative revenue earned by CCR-supported companies. All of the revenue amounts have been converted to real 2011 dollars using Statistics Canada’s consumer price inflation (CPI) index.
Economic Impact of the Centre for Commercialization of Research 18
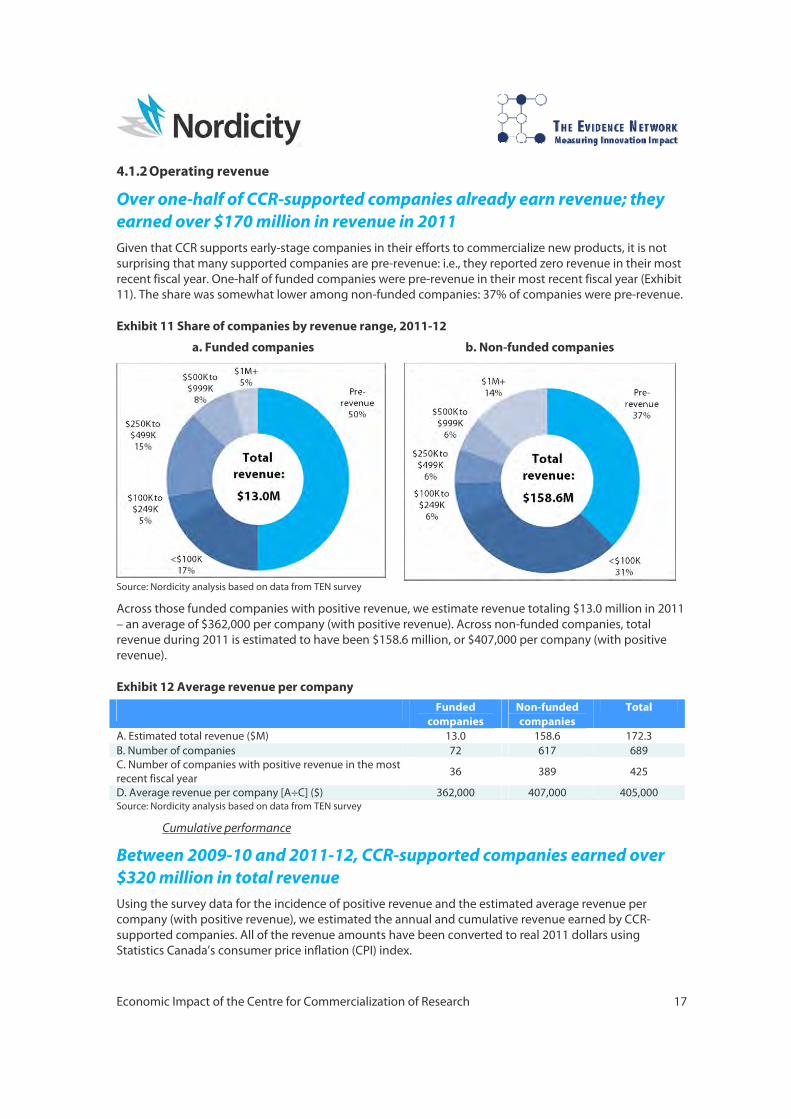
CellAegis Devices (Embedded Executive Service)
CellAegis Devices developed a medical device that activates the body’s self-defense mechanisms to protect heart muscles in case of a heart attack. The device was invented by a cardiologist at the Hospital for Sick Children in Toronto, and patented by the same institution. It has been tested in 85 clinical trials around the world.
The development of the medical device was initially financed by staff and cardiologists who believed in the validity of the idea. However, this committed team of medical professionals required a business plan and financing in order to move their invention to commercialization.
CCR provided funds for an embedded executive. CellAegis Device’s embedded executive helped it create a business plan, develop a market study, and compose a clear pitch to take to venture capital firms. The embedded executive also helped CellAegis Devices establish strategic alliances, develop an early prototype, and register the new device.
After CCR’s intervention, the company received an investment of $100,000 from OCE and was able to attract other venture capital investments. Further, CellAegis Devices proceeded to apply for additional patents, and hire full-time employees. CellAegis Devices currently employs three full-time staff, and supports additional employment at its Ontario-based manufacturer. CellAegis Devices expects to receive certification in the European Union and Canada in the near future. The US Food and Drug Administration is expected to start trials of CellAegis’ medical device in summer 2012.
Revenue at funded companies was an estimated $3.2 million in 2009-10 (Exhibit 13). As the number of funded companies increased in 2010-11, total revenue across all funded companies increased to $6.4 million. The share of companies with positive revenue dropped from 50% in 2009-10 to 34% in 2010-11. In 2011-12, the revenue across all cohorts of funded companies totalled $13.0 million. Over the three-year period, cumulative revenue across funded companies was $22.6 million.

Economic Impact of the Centre for Commercialization of Research 19
At non-funded companies, estimated revenue rose from $48.6 million in 2009-10 to $158.5 million in 2011-12, as did the number of supported companies in each year. Over the three-year period, cumulative revenue across non-funded companies was $298.6 million.
Exhibit 13 Cumulative revenue (real inflation-adjusted 2011 dollars)
a. Funded companies b. Non-funded companies
Source: Nordicity analysis based on data from TEN survey
4.1.3 Export revenue
Funded companies earned over 60% of their revenue in 2011 from export sales Exports are vitally important to Canadian companies’ long-term success; Canada’s domestic market is small and slow-growing by international standards. The long-term growth of small innovative SMEs depends, in large measure, on their ability to compete in global markets. The share of revenue from export markets, therefore, provides a good indicator of Canadian SMEs’ ability to break into international markets and establish the basis to compete globally.
Among funded companies with positive revenue, 39% reported no export revenue in 2011 (Exhibit 14); however, 42% of companies reported that more than 50% of their revenue came from exports. Funded companies’ export revenue in 2011 totalled an estimated $8.0 million, or 61% of total revenues.
Among non-funded companies with positive revenue, 37% reported no export revenue in 2011; 26% of companies reported that more than 50% of their revenue came from exports; and 14% reported by all of their revenue came from exports. Non-funded companies’ export revenue in 2011 totalled an estimated $73.0 million, or 46% of total revenue.

Economic Impact of the Centre for Commercialization of Research 20
Exhibit 14 Share of total revenue from export sales, 2011-12
a. Funded companies b. Non-funded companies
Source: Nordicity analysis based on data from TEN survey *Weighted average share of total revenue
CCR-supported companies’ high propensity to earn revenue from export markets – 61% among funded companies and 46% among non-funded companies – is highly pertinent to the economic impact analysis. The fact that such a large portion of revenue originates from outside of Canada underlines the incremental nature of the economic activity generated by CCR-supported companies (Vincett 2010). In large part, the current and future revenue of CCR-supported companies are net inflows to the Canadian economy, rather than simply redistributions of revenue from other companies.
What is more, the fact that CCR-supported companies are so export-intensive is not at all surprising, given CCR’s overall strategy of honing its commercialization-support offerings to meet the needs of born globals. Born globals – a concept first put forward by Michael Rennie in 1993 – are companies that eschew the idea that a stable domestic market position is necessary before pursuing global markets (Thomas 2012); instead, they put global market penetration ahead of domestic market penetration. For born globals, CCR can offer access to management and financing professionals with international experience (Thomas 2012). Through the International Commercialization Alliance (ICA), CCR can also offer access to its own global network of contacts with potential customers, partners and suppliers, as well as innovation intermediaries in other countries. One-third of CCR-supported companies are, in fact, born globals (Thomas 2012).
4.1.4 Employment
In Section 2.4 we noted that CCR-funded companies created 1,551 jobs between 2009-10 and 2011-12. In this section, we examine the current size of the employed workforce at CCR-supported companies.
According to the survey, funded companies employed an average of 8.8 persons as of May 2012 (Exhibit 15); employment at non-funded companies was 9.1 persons. Note that these employment figures are inclusive of owners/proprietors. Most companies –funded and non-funded – employed between three and five persons.
Economic Impact of the Centre for Commercialization of Research 21
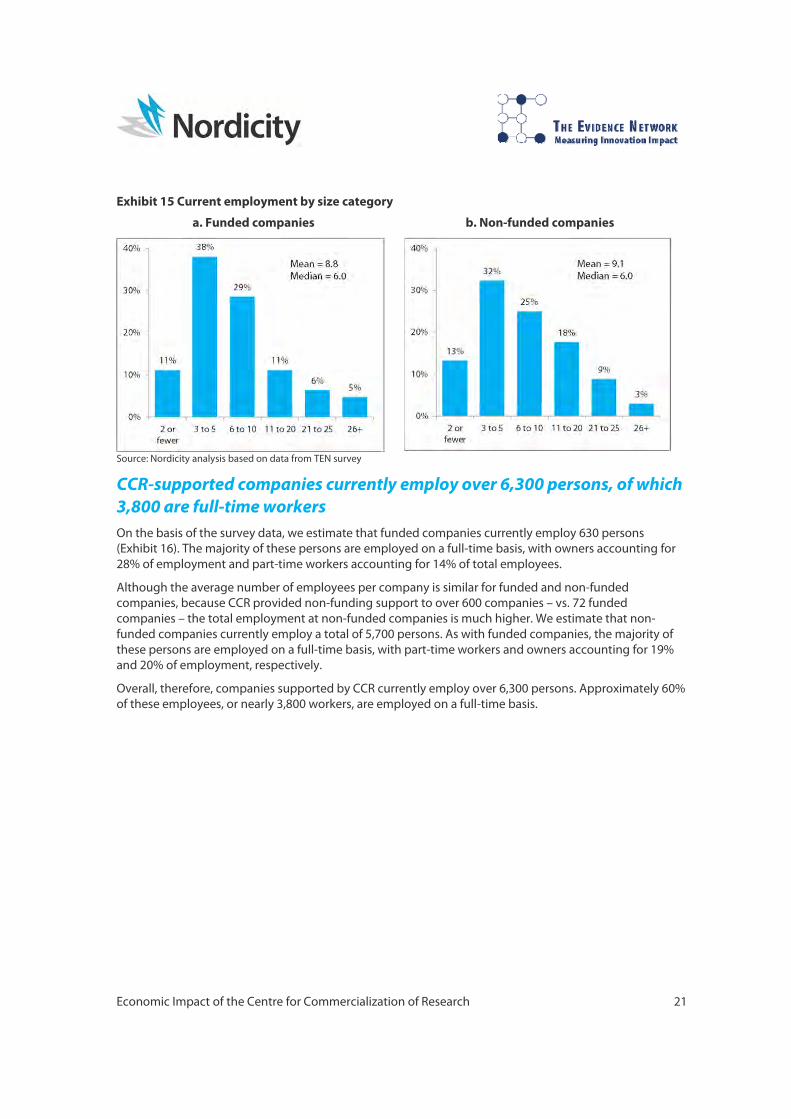
Exhibit 15 Current employment by size category
a. Funded companies b. Non-funded companies
Source: Nordicity analysis based on data from TEN survey
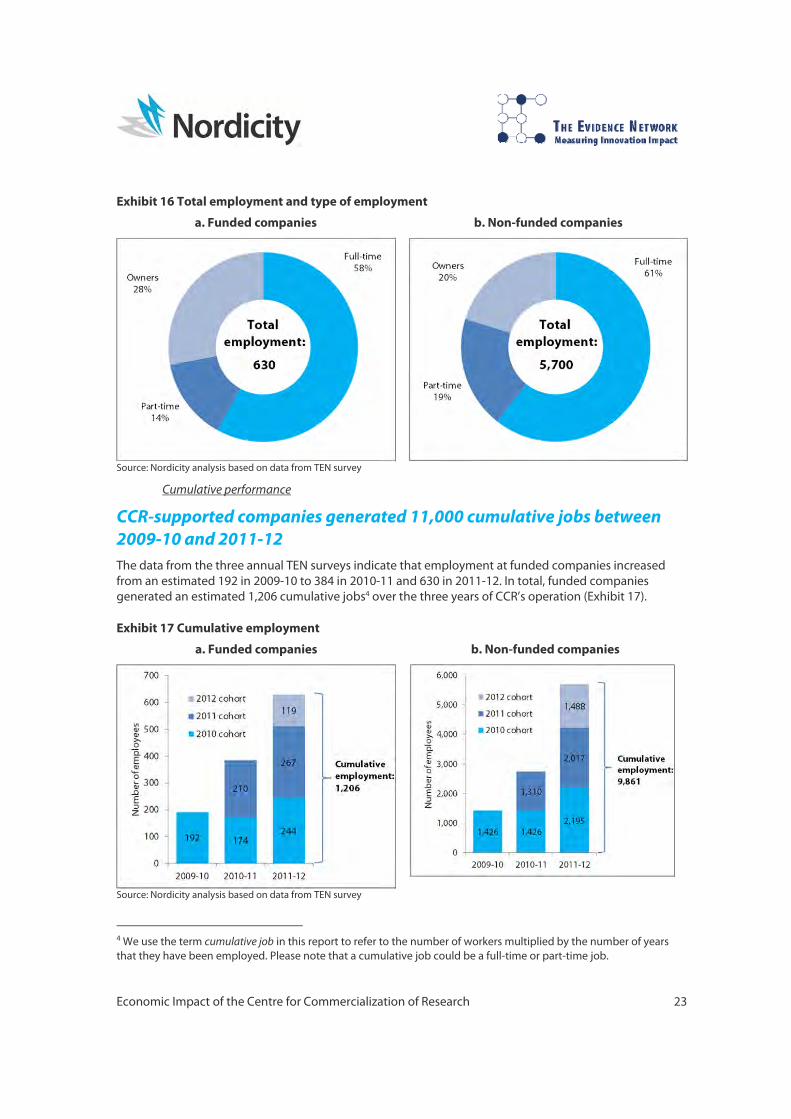
CCR-supported companies currently employ over 6,300 persons, of which 3,800 are full-time workers On the basis of the survey data, we estimate that funded companies currently employ 630 persons (Exhibit 16). The majority of these persons are employed on a full-time basis, with owners accounting for 28% of employment and part-time workers accounting for 14% of total employees.
Although the average number of employees per company is similar for funded and non-funded companies, because CCR provided non-funding support to over 600 companies – vs. 72 funded companies – the total employment at non-funded companies is much higher. We estimate that non-funded companies currently employ a total of 5,700 persons. As with funded companies, the majority of these persons are employed on a full-time basis, with part-time workers and owners accounting for 19% and 20% of employment, respectively.
Overall, therefore, companies supported by CCR currently employ over 6,300 persons. Approximately 60% of these employees, or nearly 3,800 workers, are employed on a full-time basis.
Economic Impact of the Centre for Commercialization of Research 22
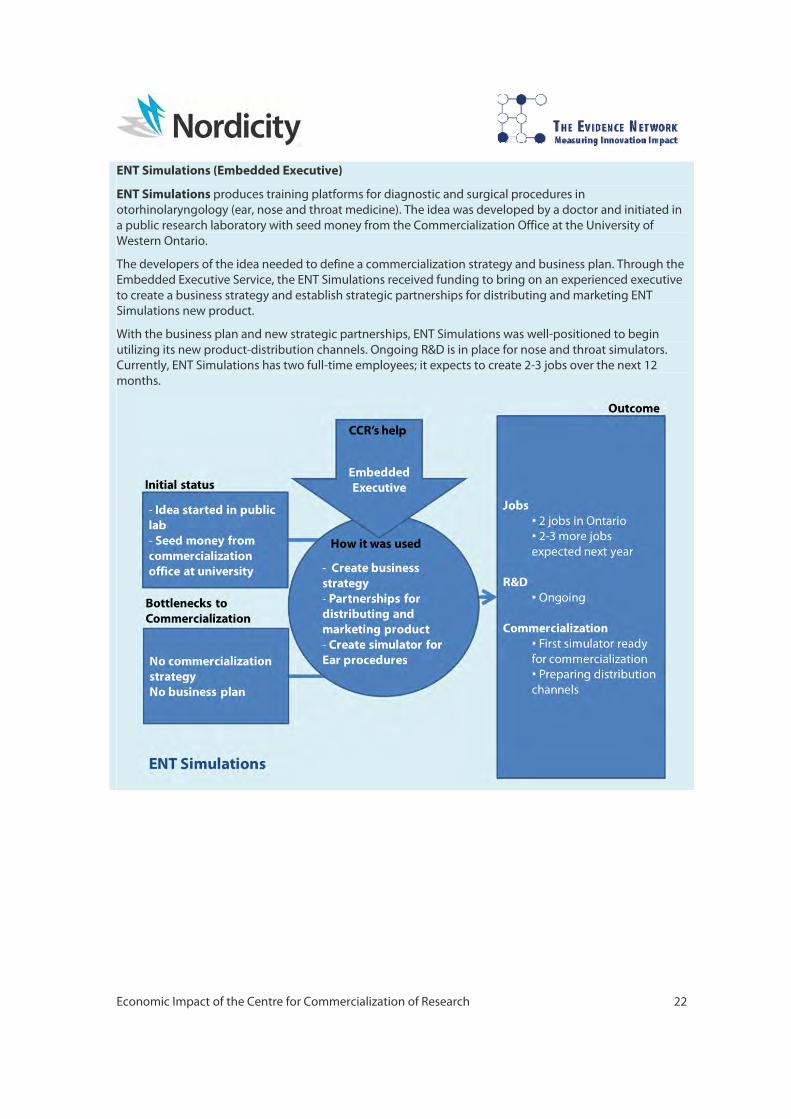
ENT Simulations (Embedded Executive)
ENT Simulations produces training platforms for diagnostic and surgical procedures in otorhinolaryngology (ear, nose and throat medicine). The idea was developed by a doctor and initiated in a public research laboratory with seed money from the Commercialization Office at the University of Western Ontario.
The developers of the idea needed to define a commercialization strategy and business plan. Through the Embedded Executive Service, the ENT Simulations received funding to bring on an experienced executive to create a business strategy and establish strategic partnerships for distributing and marketing ENT Simulations new product.
With the business plan and new strategic partnerships, ENT Simulations was well-positioned to begin utilizing its new product-distribution channels. Ongoing R&D is in place for nose and throat simulators. Currently, ENT Simulations has two full-time employees; it expects to create 2-3 jobs over the next 12 months.
Economic Impact of the Centre for Commercialization of Research 23
Exhibit 16 Total employment and type of employment
a. Funded companies b. Non-funded companies
Source: Nordicity analysis based on data from TEN survey
Cumulative performance
CCR-supported companies generated 11,000 cumulative jobs between 2009-10 and 2011-12 The data from the three annual TEN surveys indicate that employment at funded companies increased from an estimated 192 in 2009-10 to 384 in 2010-11 and 630 in 2011-12. In total, funded companies generated an estimated 1,206 cumulative jobs4 over the three years of CCR’s operation (Exhibit 17).
Exhibit 17 Cumulative employment
a. Funded companies b. Non-funded companies
Source: Nordicity analysis based on data from TEN survey
4 We use the term cumulative job in this report to refer to the number of workers multiplied by the number of years that they have been employed. Please note that a cumulative job could be a full-time or part-time job.
Economic Impact of the Centre for Commercialization of Research 24
Employment at non-funded companies grew from 1,426 in 2009-10 to 2,736 in 2010-11 and 5,700 in 2011-12. In total, funded companies generated an estimated 9,861 cumulative jobs over the three years of CCR’s operation.
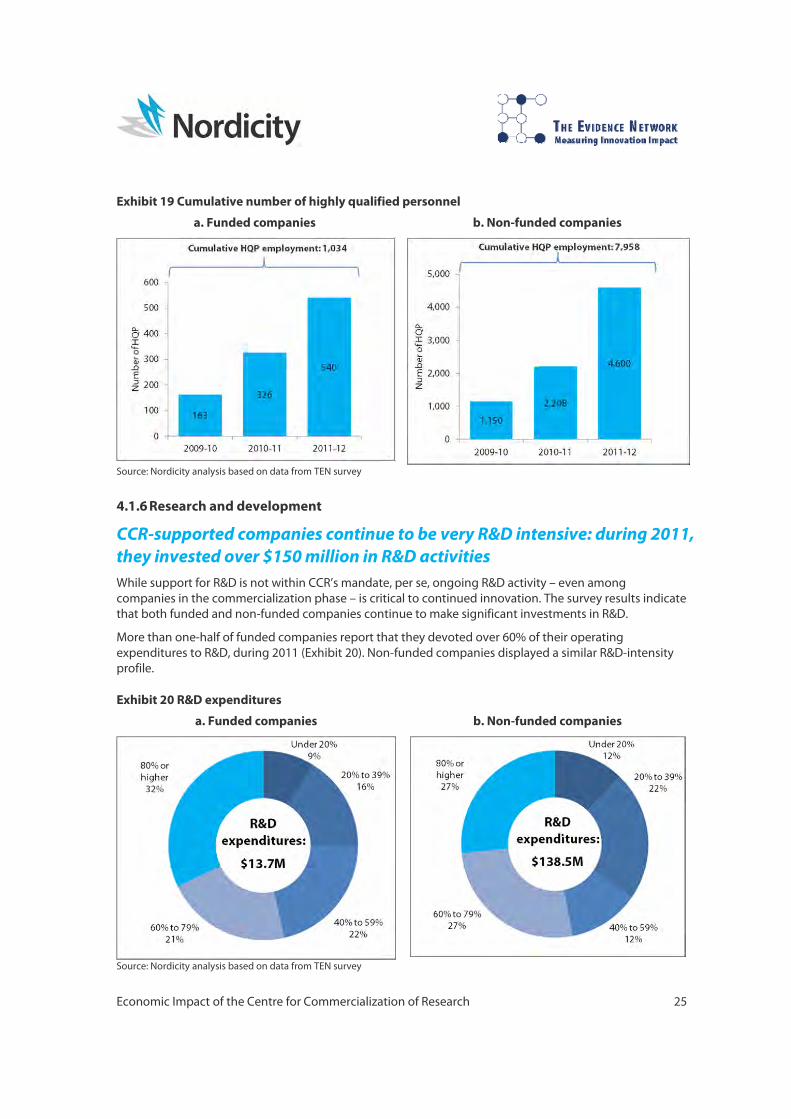
4.1.5 Highly qualified personnel
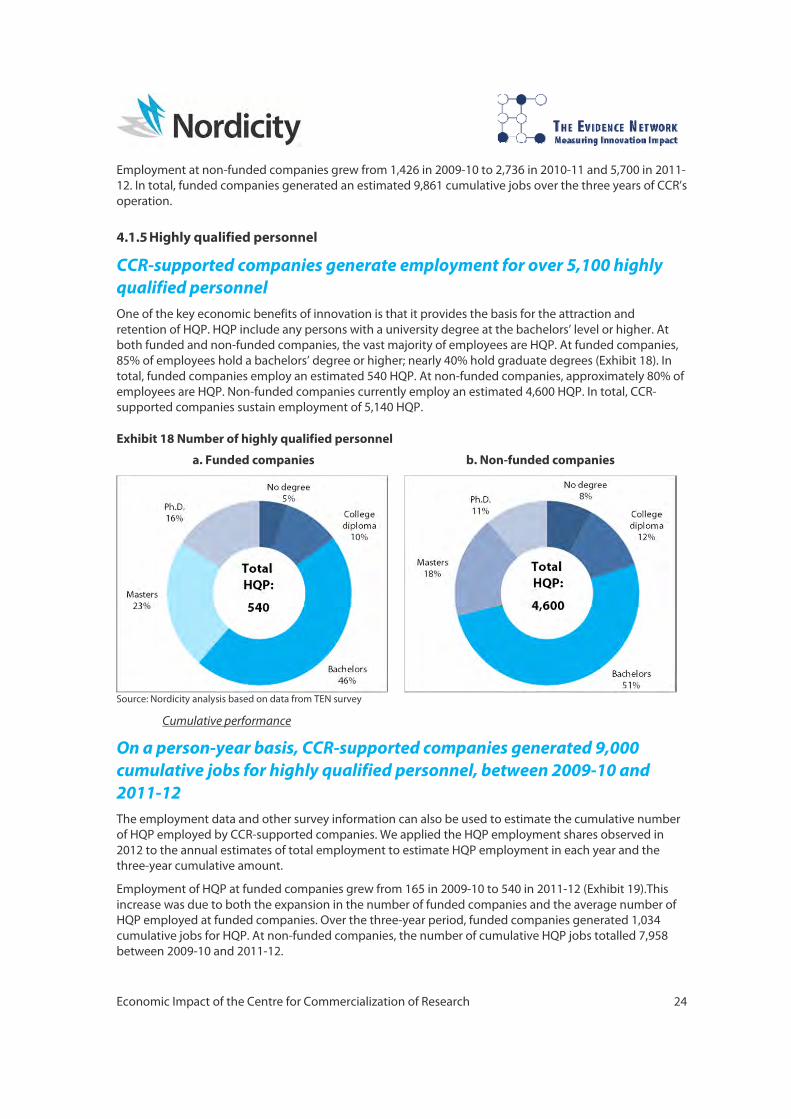
CCR-supported companies generate employment for over 5,100 highly qualified personnel One of the key economic benefits of innovation is that it provides the basis for the attraction and retention of HQP. HQP include any persons with a university degree at the bachelors’ level or higher. At both funded and non-funded companies, the vast majority of employees are HQP. At funded companies, 85% of employees hold a bachelors’ degree or higher; nearly 40% hold graduate degrees (Exhibit 18). In total, funded companies employ an estimated 540 HQP. At non-funded companies, approximately 80% of employees are HQP. Non-funded companies currently employ an estimated 4,600 HQP. In total, CCR-supported companies sustain employment of 5,140 HQP.
Exhibit 18 Number of highly qualified personnel
a. Funded companies b. Non-funded companies
Source: Nordicity analysis based on data from TEN survey
Cumulative performance
On a person-year basis, CCR-supported companies generated 9,000 cumulative jobs for highly qualified personnel, between 2009-10 and 2011-12 The employment data and other survey information can also be used to estimate the cumulative number of HQP employed by CCR-supported companies. We applied the HQP employment shares observed in 2012 to the annual estimates of total employment to estimate HQP employment in each year and the three-year cumulative amount.
Employment of HQP at funded companies grew from 165 in 2009-10 to 540 in 2011-12 (Exhibit 19).This increase was due to both the expansion in the number of funded companies and the average number of HQP employed at funded companies. Over the three-year period, funded companies generated 1,034 cumulative jobs for HQP. At non-funded companies, the number of cumulative HQP jobs totalled 7,958 between 2009-10 and 2011-12.
Economic Impact of the Centre for Commercialization of Research 25
Exhibit 19 Cumulative number of highly qualified personnel
a. Funded companies b. Non-funded companies
Source: Nordicity analysis based on data from TEN survey
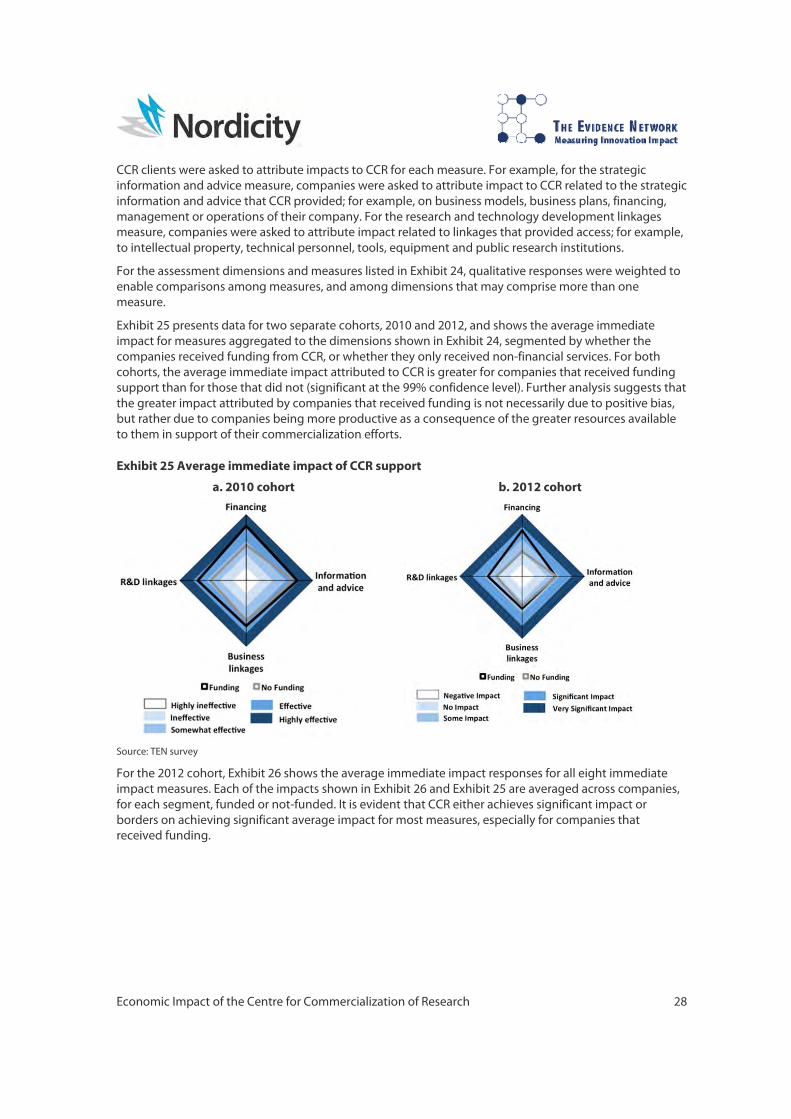
4.1.6 Research and development
CCR-supported companies continue to be very R&D intensive: during 2011, they invested over $150 million in R&D activities While support for R&D is not within CCR’s mandate, per se, ongoing R&D activity – even among companies in the commercialization phase – is critical to continued innovation. The survey results indicate that both funded and non-funded companies continue to make significant investments in R&D.
More than one-half of funded companies report that they devoted over 60% of their operating expenditures to R&D, during 2011 (Exhibit 20). Non-funded companies displayed a similar R&D-intensity profile.
Exhibit 20 R&D expenditures
a. Funded companies b. Non-funded companies
Source: Nordicity analysis based on data from TEN survey

Economic Impact of the Centre for Commercialization of Research 26
To estimate total R&D expenditures across CCR-supported companies, we multiplied each survey respondent’s R&D intensity by an estimate of its total operating expenditures. On the basis of this method, we estimate that funded companies made total R&D expenditures of $13.7 million during their most recent fiscal year – an average of $191,000 per company, or 49% of total operating expenditures (Exhibit 21).
Non-funded companies made total R&D expenditures of an estimated $138.5 million, or $225,000 per company. In total, CCR-supported companies accounted for $154.3 million in R&D expenditures during their most recent fiscal year.
Exhibit 21 R&D intensity Funded
companies Non-funded companies
Total
A. Total R&D expenditures ($M) 13.7 138.5 154.3 B. Number of companies 72 617 689 C. Average R&D expenditures per company ($) 191,000 224,000 -- D. Average total operating expenditures per company ($) 389,000 436,000 -- E. Average R&D intensity [C÷D] 49% 51% -- Source: Nordicity analysis based on data from TEN survey
4.1.7 Patents
Two-thirds of CCR-supported companies hold either a patent application or a granted patent Patents represent a measure of innovation output. Patent applications demonstrate that researchers, entrepreneurs and companies are generating inventions that could have economic value. Once the patent is granted, the holder can enjoy monopoly protection for her invention. The survey data indicate that funded companies hold an estimated 158 patent applications and 51 granted patents (Exhibit 22). Non-funded companies hold an estimated 2,040 patent applications and 340 granted patents.
Exhibit 22 Patents Funded
companies Non-funded companies
Total
Number of companies 72 617 689 Patent applications Estimated total number 158 2,040 2,198 Average number per company 2.2 3.3 3.2 Patents granted Estimated total number 51 340 391 Average number per company 0.7 0.6 0.6 Total patents – applications and granted Estimated total number 209 2,480 2,689 Average number per company 2.9 3.9 3.8 Source: Nordicity analysis based on data from TEN survey
Overall, CCR-supported companies have filed applications for an average of 3.2 patents per company, and hold an average of 0.6 patents per company. Indeed, the averages hide the fact that many companies do not hold any patent filings – applications or grants. Approximately 27% of funded companies hold no type of patent filing (Exhibit 23); similarly, 35% of non-funded companies reported that they hold no type of patent filing.

Economic Impact of the Centre for Commercialization of Research 27
Exhibit 23 Share of companies by number of total patents (applications and grants)
a. Funded companies b. Non-funded companies
Source: Nordicity analysis based on data from TEN survey
4.2 Impact of CCR on client companies In this sub-section, we provide a summary of the impacts on the resources and capabilities of the companies (i.e., immediate impact), and the impacts of CCR on the market performance of the companies (i.e., intermediate impact).
4.2.1 Immediate impacts
The immediate impact that CCR makes on companies is important because this is the only aspect of CCR’s work with companies over which CCR has direct influence and can affect interventions for improved impact of either itself or the companies it serves. It is also important because immediate impact includes the impact being made on pre-revenue companies that are not yet in the marketplace, before their own new products or services result in sales, revenues, and expenditures that are tied directly to economic impact.
Our determinations of immediate impact are guided by assessment dimensions identified in the logic model (see Section 3.1) represented by measures customized specifically for CCR. Exhibit 24 identifies immediate impact dimensions and measures used in our analysis.
Exhibit 24 Measures of immediate impact Immediate impact dimensions
Immediate impact measures
Information and advice
Strategic business information or advice Information or advice on technology application or markets Building of management capacity Changes in business approach
Business linkages Facilitation of new business linkages
Research linkages Facilitation of research or technology development linkages
Financing services Provision of funding Facilitation of financing by others
Source: TEN
Economic Impact of the Centre for Commercialization of Research 28
CCR clients were asked to attribute impacts to CCR for each measure. For example, for the strategic information and advice measure, companies were asked to attribute impact to CCR related to the strategic information and advice that CCR provided; for example, on business models, business plans, financing, management or operations of their company. For the research and technology development linkages measure, companies were asked to attribute impact related to linkages that provided access; for example, to intellectual property, technical personnel, tools, equipment and public research institutions.
For the assessment dimensions and measures listed in Exhibit 24, qualitative responses were weighted to enable comparisons among measures, and among dimensions that may comprise more than one measure.
Exhibit 25 presents data for two separate cohorts, 2010 and 2012, and shows the average immediate impact for measures aggregated to the dimensions shown in Exhibit 24, segmented by whether the companies received funding from CCR, or whether they only received non-financial services. For both cohorts, the average immediate impact attributed to CCR is greater for companies that received funding support than for those that did not (significant at the 99% confidence level). Further analysis suggests that the greater impact attributed by companies that received funding is not necessarily due to positive bias, but rather due to companies being more productive as a consequence of the greater resources available to them in support of their commercialization efforts.
Exhibit 25 Average immediate impact of CCR support
a. 2010 cohort b. 2012 cohort
Source: TEN survey
For the 2012 cohort, Exhibit 26 shows the average immediate impact responses for all eight immediate impact measures. Each of the impacts shown in Exhibit 26 and Exhibit 25 are averaged across companies, for each segment, funded or not-funded. It is evident that CCR either achieves significant impact or borders on achieving significant average impact for most measures, especially for companies that received funding.

Economic Impact of the Centre for Commercialization of Research 29
Exhibit 26 Average immediate impact of CCR support, all measures, 2012 cohort
Source: TEN survey
When we remove from the samples respondents that indicated specific measures were not applicable, we determined the percentage of companies that reported various types of impact to be significant or very significant (Exhibit 27). The relatively large percentage of companies reporting significant or very significant impact is noteworthy, particularly given the uncertain nature of small companies operating in the complex innovation ecosystem.
Exhibit 27 Share of companies reporting significant or very significant† impact, immediate impacts, by cohort year 2010 2011†† 2012
Provision of funding 72% 86% 76% Access to strategic information or advice 76% 63% 49% Facilitation of funding 65% 73% 48% Building of management capacity 78% 65% 37% Changes in business or operational approach 75% 56% 34% Source: TEN survey †For the 2010 cohort the impact terms used were ‘effective’ and ‘very effective’ ††Funded companies only n.a. not available
4.2.2 Intermediate impact
Intermediate impact provides evidence of the effect of intermediary services on company performance in terms of new products and services, employment or revenues. Measuring intermediate impact is important because it corresponds to the missions of intermediaries and provides the hard evidence of results that stakeholders seek, tied directly to companies’ impact on the economy.
That being said, company performance depends on a number of factors internal to the company as well as environmental factors that are often outside of the company’s control. Therefore, to assess
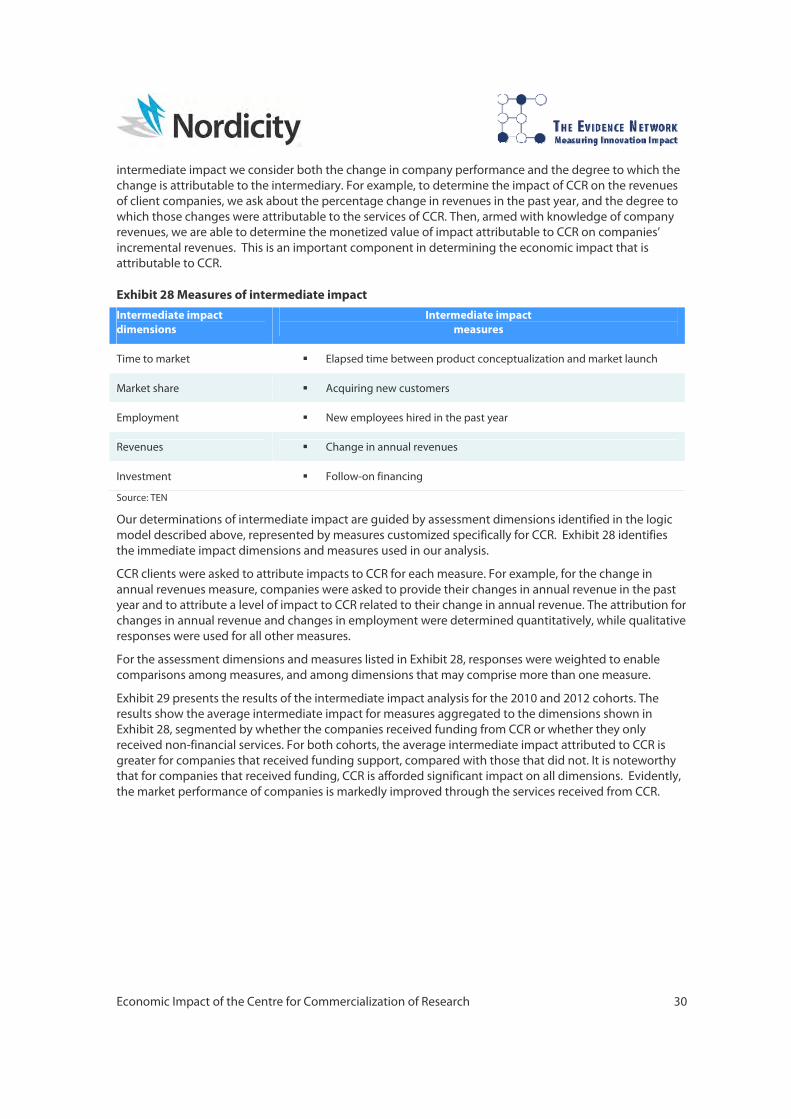
Economic Impact of the Centre for Commercialization of Research 30
intermediate impact we consider both the change in company performance and the degree to which the change is attributable to the intermediary. For example, to determine the impact of CCR on the revenues of client companies, we ask about the percentage change in revenues in the past year, and the degree to which those changes were attributable to the services of CCR. Then, armed with knowledge of company revenues, we are able to determine the monetized value of impact attributable to CCR on companies’ incremental revenues. This is an important component in determining the economic impact that is attributable to CCR.
Exhibit 28 Measures of intermediate impact Intermediate impact dimensions
Intermediate impactmeasures
Time to market Elapsed time between product conceptualization and market launch
Market share Acquiring new customers
Employment New employees hired in the past year
Revenues Change in annual revenues
Investment Follow-on financing
Source: TEN
Our determinations of intermediate impact are guided by assessment dimensions identified in the logic model described above, represented by measures customized specifically for CCR. Exhibit 28 identifies the immediate impact dimensions and measures used in our analysis.
CCR clients were asked to attribute impacts to CCR for each measure. For example, for the change in annual revenues measure, companies were asked to provide their changes in annual revenue in the past year and to attribute a level of impact to CCR related to their change in annual revenue. The attribution for changes in annual revenue and changes in employment were determined quantitatively, while qualitative responses were used for all other measures.
For the assessment dimensions and measures listed in Exhibit 28, responses were weighted to enable comparisons among measures, and among dimensions that may comprise more than one measure.
Exhibit 29 presents the results of the intermediate impact analysis for the 2010 and 2012 cohorts. The results show the average intermediate impact for measures aggregated to the dimensions shown in Exhibit 28, segmented by whether the companies received funding from CCR or whether they only received non-financial services. For both cohorts, the average intermediate impact attributed to CCR is greater for companies that received funding support, compared with those that did not. It is noteworthy that for companies that received funding, CCR is afforded significant impact on all dimensions. Evidently, the market performance of companies is markedly improved through the services received from CCR.

Economic Impact of the Centre for Commercialization of Research 31
C2C Link Corp – Embedded Executive
The founder of C2C Link Corp. spent ten years researching a low-cost technology to produce a microchip capable of driving a green laser. While red and blue lasers are already commercial available, green are not. With a low-cost commercially feasible green laser, the possibility of developing image projectors for mobile devices would also become commercially feasible. C2C Link Corp. was founded in 2004 and received seed financing through OCE’s Market Readiness and First Jobs funds.
While CSC Link Corp. had a compelling idea, it lacked a commercialization strategy and a path to full-scale production. In particular, it required additional funding to establish its chip production. Moreover, developing manufacturing facilities required high levels of financing.
Through the Embedded Executive Service, C2C Link received funding to engage an executive who was instrumental in helping the company secure financing and in negotiating the contract for a manufacturing joint venture. The embedded executive was also instrumental in helping C2C Link Corp develop a business strategy.
To date, C2C Link Corp. has raised $500,000 in direct financing as well as $10 million for its manufacturing joint ventures. It currently employs five persons in Ontario, and is waiting for the next cycle of large-scale mobile phone replacement to enter the market. It expects its sales to ramp up significantly within the next three to five years.

Economic Impact of the Centre for Commercialization of Research 32
Exhibit 29 Average intermediate impact
a. 2010 cohort b. 2012 cohort
Source: TEN survey
When we remove from the sample respondents that indicated specific measures were not applicable, we determined the percentage of companies that reported various types of impact to be significant or very significant (Exhibit 30). The relatively large percentage of companies reporting significant or very significant impact is noteworthy, particularly since many factors are involved in a company’s market performance, as described above. That being said, for the measures shown in most years, CCR is having significant or greater impact on companies’ market performance, broadly speaking, for over half the companies they serve; and an even greater impact for companies that received funding from CCR.
Exhibit 30 Share of companies reporting significant or very significant impact, intermediate impacts, by cohort year 2010 2011†† 2012
Provision of funding 61% 81% 47% Access to strategic information or advice 50% 63% 46% Facilitation of funding 38% 62% 54%† Building of management capacity 32% 58% 39% Changes in business or operational approach 36% 53% 29% Source: TEN survey † Refers to all hired employees ††Funded companies only n.a. not available
Economic Impact of the Centre for Commercialization of Research 33
5. Economic Impact of CCR
In Section 4, we detailed our estimates of the financial and operating performance of CCR-supported companies, and summarized the impact that CCR had on this performance. In this section, we estimate the contribution that CCR-supported companies made to the Canadian economy. Using the results of the survey and impact analysis, we attribute a portion of this this contribution to CCR support and thereby also estimate the CCR’s own contribution to the Canadian economy.
5.1 Gross output
As a first step in assessing the economic impact of CCR-supported companies, we estimate the gross output generated by those companies. Unlike GDP – which measures the net output of a company, industry or economy – gross output is basically the revenue of a company or industry. Approximately one-half of CCR-supported companies are in the pre-revenue phase – or more accurately, pre-sales phase.
Although many CCR-supported companies are in the pre-revenue phase they still generate gross output by virtue of their operating expenditures, which are largely funded by external financing or public funding. From this expenditure-based gross output, one can estimate the value added or GDP associated with CCR-companies’ product development and commercialization activity. Exhibit 31 depicts the process for calculating gross output for pre-revenue and positive-revenue companies.
Exhibit 31 Calculation of gross output for pre-revenue and positive-revenue companies
Pre-revenue companies
Positive-revenue companies
Gross output
Operating expenditures
Operating expenditures
× Operating margin
(Sales – operating expenditures)
Using the survey data and framework outlined in Exhibit 31, we prepared estimates of the annual gross output generated by CCR-supported companies. The gross output of funded companies increased from $9.0 million in 2009-10 to $28.0 million in 2011-12 (Exhibit 32). Across non-funded companies, gross output rose from $70.5 million in 2009-10 to $290.6 million. In preparing the estimates of gross output we only added an estimate for operating margin in 2011-12, since data on operating margins were not collected in the previous client surveys. On the basis of the survey data for 2011-12, we found that the operating margin amounts were very small.

Economic Impact of the Centre for Commercialization of Research 34
Exhibit 32 Gross output
a. Funded companies b. Non-funded companies
Source: Nordicity analysis based on data from TEN survey * Includes estimate for operating margin earned by positive-revenue companies (funded companies, $64,000; non-funded companies, $17.6 million).
5.2 Direct impact
CCR-supported companies generated direct GDP of over $300 million and over 11,000 cumulative jobs, between 2009-10 and 2011-12 As noted in Section 3, the direct impact refers to the change in economic activity within a particular company’s own industry. The gross output generated by a company yields valued added (i.e., GDP) within its own industry. This value added is often comprised largely of wages, which underpin an increase in employment in the industry.
The direct economic impact is typically within a single industry. However, in the case of CCR-supported companies, the economic impact is actually distributed across several industries: the industries within which the CCR-supported companies are active. To date, the majority of CCR-supported companies have come from the life sciences, energy and environment, materials and manufacturing, and information and communications technologies industries. As such, these are the industries that would experience the direct economic impact originating from CCR-supported companies.
As noted in Section 5.1, the vast majority of CCR-supported companies have earned very little operating margin to date. As such, with a single exception, the GDP generated by CCR-supported companies has been essentially equal to the wages paid to its employees.
Funded companies generated wages and GDP equal to $14.2 million in 2011-12, up from $4.5 million in 2009-10 (Exhibit 33). Non-funded companies generated wages of $147.7 million in 2011-12. When the operating surplus (i.e., operating margin) earned by these companies is added to the wage amount, we find that total GDP was $165.3 million in 2011-12.

Economic Impact of the Centre for Commercialization of Research 35
Exhibit 33 Direct GDP (real 2011 dollars)
a. Funded companies b. Non-funded companies
Source: Nordicity analysis based on data from TEN survey
We also used the survey data to derive estimates of direct employment at CCR-supported companies. As already noted in Section 4.1.4, funded companies generated 1,206 cumulative jobs5 (full-time and part-time) between 2009-10 and 2011-12 (Exhibit 34). Non-funded companies generated 9,862 cumulative jobs between in 2009-10 and 2011-12.
Exhibit 34 Direct jobs
a. Funded companies b. Non-funded companies
Source: Nordicity analysis based on data from TEN survey
In total, CCR-supported companies generated $303 million in GDP between 2009-10 and 2011-12 (Exhibit 35). They also paid out a total of $285.4 million in wages and generated 11,100 cumulative jobs.
5 One person employed for three years is equal to three cumulative jobs. Three persons each employed for one year is also equal to three cumulative jobs.

Economic Impact of the Centre for Commercialization of Research 36
Exhibit 35 Summary of cumulative direct economic impact, 2009-10 to 2011-12 (real 2011 dollars) Funded
companies Non-funded companies
Total
GDP ($M) 27.6 275.4 303.0 Wages ($M) 27.6 257.7 285.4 Cumulative jobs† ~1,210 ~9,860 ~11,070 Source: Nordicity analysis based on data from TEN survey † Figures have be rounded.
5.3 Spin-off impact
The spin-off effects generated by CCR-supported companies led to a further $150 million in GDP in the Canadian economy and to the creation of an additional 1,800 cumulative jobs The spin-off impact refers to the change in economic activity in supplier industries, which can be attributed back to companies supported by CCR. In general, this impact arises from two sources.
First, companies supported by CCR purchase inputs from other industries; these purchases raise output, GDP and wages in these supplier industries. This component of the spin-off impact is referred to as the indirect economic impact.
We estimated the indirect impact using Statistics Canada’s I-O tables. The results are summarized in Exhibit 36. Funded companies generated cumulative indirect GDP of $12.8 million between 2009-10 and 2010-11. Funded companies also generated indirect wages of $7.0 million, yielding 160 indirect cumulative jobs. Non-funded companies generated cumulative indirect GDP of $94.4 million between 2009-10 and 2010-11, and indirect wages of $50.0 million, thus yielding 1,110 indirect cumulative jobs.
In total, the indirect impact of CCR-supported companies generated $107.3 million in GDP, $57.1 million in wages and 1,270 cumulative jobs.
Exhibit 36 Indirect economic impact, 2009-10 to 2011-12 (real 2011 dollars) Funded
companies Non-funded companies
Total
GDP ($M) 12.8 94.4 107.3 Wage ($M) 7.0 50.0 57.1 Cumulative jobs 160 1,110 1,270 Source: Nordicity analysis based on data from TEN survey and Statistics Canada
The second component of the spin-off impact is referred to as the induced economic impact. It encompasses the effect on all industries in the economy that arises from the re-spending of wages earned by employees of CCR-supported companies (direct workers) and employees of supplier industries (indirect workers).
We estimated the induced economic impact using a custom multiplier based on Canadian households’ average propensity to consume and import (see Appendix A for methodology). The induced impact of funded companies generated $4.3 million in GDP, $2.3 million in wages and 50 cumulative jobs (Exhibit 37). The induced impact of non-funded companies generated $38.5 million in GDP, $20.8 million in wages and 460 cumulative jobs. In total, the induced impact associated with CCR-supported companies generated $42.8 million in GDP, $23.1 million in wages and 510 cumulative jobs.

Economic Impact of the Centre for Commercialization of Research 37
Social rate of return
The private rate of return refers to the relationship between the costs borne by private economic agents (e.g., a student or firm) and the benefits that these private economic agents accrue. The social rate of return refers to the relationship between the costs borne by society (i.e., citizens or taxpayers) and the benefits that society accrues from these costs. For example, the costs of post-secondary education are often shared between students (i.e., private economic agents) and taxpayers. Both parties share the benefits as well. Students earn higher incomes, while society benefits from a more productive workforce, educated electorate and potential lower rates of crime. All of these benefits – which can be expressed in monetary terms –comprise the social return.
Exhibit 37 Induced economic impact, 2009-10 to 2011-12 (real 2011 dollars) Funded
companies Non-funded companies
Total
GDP ($M) 4.3 38.5 42.8 Wage ($M) 2.3 20.8 23.1 Cumulative jobs 50 460 510 Source: Nordicity analysis based on data from TEN survey and Statistics Canada
We sum the indirect and induced economic impacts to arrive at an estimate of the spin-off economic impact (Exhibit 38). In total, the spin-off economic activity associated with CCR-supported companies generated an additional $150.1 million in GDP, $80.2 million in wages for Canadians, and 1,780 cumulative jobs.
Exhibit 38 Spin-off economic impact, 2009-10 to 2011-12 (real 2011 dollars) Funded
companies Non-funded companies
Total
GDP ($M) 17.2 132.9 150.1 Wage ($M) 9.3 70.9 80.2 Cumulative jobs 210 1,570 1,780 Source: Nordicity analysis based on data from TEN survey and Statistics Canada
5.4 Spillover impact
The spillover impact from CCR-supported innovation led to an additional $288 million in GDP within the Canadian economy and 3,500 cumulative jobs As discussed in Section 3.2.4, when it comes to innovation, the economic benefits are not confined to the companies that produce the innovations or even to the companies and industries that supply inputs. Innovation is characterized by spillover impacts.
The quantification of spillover impacts can be a challenge. They are not easily observable; and when they are, they can be difficult to measure. That being said, there is a well-established body of research related to the estimate of the social return from R&D. This social return essentially captures both the private returns that flow to the companies that commercialize innovative products (i.e., higher profits) and their workers (i.e., higher incomes); and also the positive economic spillovers (e.g., new products, higher sales, higher productivity, price decreases) that consumers and other companies enjoy as a result of the commercialization of an innovation.
Much of the body of empirical work related to the estimation of social return is based on indicators of innovation inputs and outputs,
such as R&D expenditures and patents. Existing academic research suggests that the social rate of return from R&D is in the range of 30% to 40%. Mansfield, (1991) estimated that the social rate of return from

Economic Impact of the Centre for Commercialization of Research 38
academic R&D in the US at 28% to 40%. Other studies have put it even higher. A long-term study of R&D and innovation by Martin (1998) found a social rate of return of 30% for Canadian university R&D.
Bassanini and Scarpetta (2002) investigated the relationship between average years of schooling in the workforce and per-worker-GDP. They found that every one year increase in the average years of schooling in a particular country’s workforce increased its real-GDP-per-worker by 6% (Bassanini and Scarpetta 2002, 403). More accurately, they found that their modelling results were consistent with other empirical work that found a 6% lift in real-GDP-per-worker for every one year increase in the average years of education in the workforce (Bassanini and Scarpetta 2002, 403).
Given that the data we possess for HQP employed by CCR-supported companies is much more reliable – and perhaps indicative of the commercialization phase – than the data we possess for R&D expenditures and patents, we developed a simple model to estimate spillover effects based on the results of the Bassanini & Scarpetta analysis.
This simple model essentially estimated the incremental lift in the average years of education in the Canadian workforce that could be attributed to employment of HQP at CCR-supported companies. We then converted this lift in the educational capital within the Canadian workforce to an estimate of higher GDP per capita, based on the Bassanini & Scarpetta model.
The detailed calculations of the spillover impact can be found in Appendix B. The results of spillover impact modelling are summarized in Exhibit 39. Our modelling indicates that that the value of spillover impact adds another $58.0 million to the GDP impact of funded companies and $230 million to the GDP impact of non-funded companies. In total, the spillover impact associated with CCR-supported companies generates an additional $288.0 million in GDP, $155.5 million in wages, and 3,460 cumulative jobs.
Exhibit 39 Spillover impact, estimated economic value, 2009-10 to 2011-12 (real 2011 dollars) Funded
companies Non-funded companies
Total
GDP ($M) 58.0 230.0 288.0 Wage ($M) 31.3 124.2 155.5 Cumulative jobs 700 2,760 3,460 Source: Nordicity analysis based on data from TEN survey and Statistics Canada
5.5 Summary of total economic impact
The innovation activity of CCR-supported companies contributed $738 million in GDP to the Canadian economy and generated over 16,000 cumulative jobs We sum the direct, spin-off and spillover impact to arrive at an estimate of the cumulative total economic impact of CCR-supported companies over the period, 2009-10 to 2011-12 (Exhibit 40). In total, CCR-supported companies generated an estimated $738.3 million in GDP. Their economic activity also yielded $519.0 million in total wages across the Canadian economy and created 16,300 cumulative jobs during the three-year period.

Economic Impact of the Centre for Commercialization of Research 39
Exhibit 40 Total economic impact, 2009-10 to 2011-12 (real 2011 dollars) Funded
companies Non-funded companies
Total
GDP ($M) Direct 27.5 275.6 303.1 Spin-off 17.1 133.0 150.1 Spillover 58.0 230.0 288.0 Total 102.6 638.6 741.2 Wages ($M) Direct 27.5 258.0 285.5 Spin-off 9.3 70.9 80.2 Spillover 31.3 124.2 155.5 Total 68.1 453.1 521.2 Cumulative jobs Direct 1,210 9,860 11,070 Spin-off 200 1,570 1,770 Spillover 700 2,760 3,460 Total 2,110 14,190 16,300Source: Nordicity analysis based on data from TEN survey and Statistics Canada
5.6 Attribution analysis Thus far in Section 5, we have estimated the economic impact of CCR-supported companies. In this section, we develop an attribution rate, so that we can isolate the portion of this overall economic that can be linked back to CCR itself.
Ideally, one would assess and quantify attribution to CCR through some type of experimental analysis, whereby the economic outcomes for a randomized control group of companies – similar in all respects to CCR-supported companies except for the fact that they were not exposed to CCR funding or services – would be compared to those of CCR clients. To our knowledge, however, such a randomized sample of comparable companies is not available.
That being the case, we opted to rely on what we refer to as a qualitative self-assessment approach to gauge and quantify attribution to CCR. Qualitative self-assessment entails asking client companies to directly rate the importance of CCR to various intermediate impacts. In other words, it involves obtaining performance data and judgments regarding the impact of innovation interventions directly from the firms involved.
To implement the qualitative self-assessment approach, we utilized attribution information collected from CCR's clients through the TEN surveys conducted in 2010, 2011 and 2012.6 To gauge attribution, TEN developed a two-part question. The first part of the question sought data to quantify the change in the company’s financial or economic performance in the year in which they received CCR support. The second part of the question then directly asked respondents to assess the portion of that change that could be attributed to CCR’s support. An example of the two-part question set can be found in Exhibit 41.
6 Since the data collected through these surveys was done within a year following the CCR support, any retrospective bias in the responses from companies would likely have been minimized.

Economic Impact of the Centre for Commercialization of Research 40
Exhibit 41 Attribution question set
2.5 Change in revenues
a. By how much did your company's annual revenues change in the past year?
Please choose one of the following responses: __ Increased by more than 100% __ Increased between 25% and 100% __ Increased by up to 25% __ No change in annual revenues __ Decreased __ We are pre-revenue
b. To what degree did the support of OCE-CCR impact your company’s ability to increase revenues?
Please choose one of the following responses: __ 50%-100% of revenue change due to the support of OCE-CCR __ 25%-50% of revenue change due to the support of OCE-CCR __ 5%-25% of revenue change due to the support of OCE-CCR __ Less than 5% of revenue change due to the support of OCE-CCR __ The support of OCE-CCR had a negative impact on the change in our company's revenues __ Not applicable
For the attribution analysis, we focused on the results from the question set for three performance indicators: (i) follow-on financing, (ii) revenue and (ii) job creation. Given that only a subset of the CCR-supported companies either raised follow-on financing in the past year or were positive-revenue in the past year, the inclusion of job creation performance in the attribution analysis gave us a gauge of attribution for a much larger of CCR-supported companies.
Follow-on financing
As discussed in Section 3, one of the key challenges facing companies trying to commercialize an innovation is raising external financing. While early-stage companies can often launch operations on the basis of funding from personal credit, friends and family, the scaling-up required to successfully emerge from commercialization requires significant amounts of financial capital. As such, external financing is critical. It also lays the foundation for future economic performance. Securing external financing has additional positive effects because it can signal to suppliers and customers that a company’s product has market potential and that the company producing it is committed to long-term growth.
The importance and powerful signalling effects associated with external financing provide the rationale for CCR to take an active role as an investment aggregator. It not only invests directly in certain companies, but also matches companies and investors within the financing community. The CCR role in affecting financing performance is borne out by the survey data.
Exhibit 42 depicts the attribution of follow-on financing to CCR’s intervention – either through its direct investments, funding for particular commercialization initiatives or general business advice. Funded companies report that an estimated 25% of the $16.2 million in total follow-on financing raised in 2011-12 could be attributed to support from CCR. Non-funded companies, meanwhile report that an estimated 6% of the $124.4 million in follow-on financing that they raised in 2011-12 could be attributed to support from CCR.

Economic Impact of the Centre for Commercialization of Research 41
Exhibit 42 Follow-on financing attribution analysis
a. Funded companies b. Non-funded companies
Source: Nordicity analysis based on data from TEN survey
Revenue
Exhibit 43 depicts the structure and results of our attribution analysis based on revenue. Our objective was to establish and attribution rate that could be applied to the total economic activity of CCR-supported companies. As such, we were interested not only in the contribution that CCR made to changes in economic activity, but also how this contribution relates to the overall economic resources of the supported companies.
The survey data indicate that funded companies experienced a $5.3 million revenue increase following their exposure to CCR support (Exhibit 43). That $5.3 million increase brought their total revenue from $8.4 million to $13.7 million. The funded companies report that approximately $2.0 million, or 38% of the increase, can be attributed to CCR support. In other words, following CCR support, 15% of funded companies’ revenue can be attributed to CCR support. Note that these amounts only apply to companies that recorded positive revenue in the most recent fiscal year.
We applied the same approach to the revenue increase experienced by non-funded companies. They reported that an estimated $800,000 of the $22.3 million revenue increase they experienced in 2011 could be attributed to CCR (Exhibit 43). In other words, 3.5% of the increase, or just under one percent of total revenue could be attributed to CCR support.
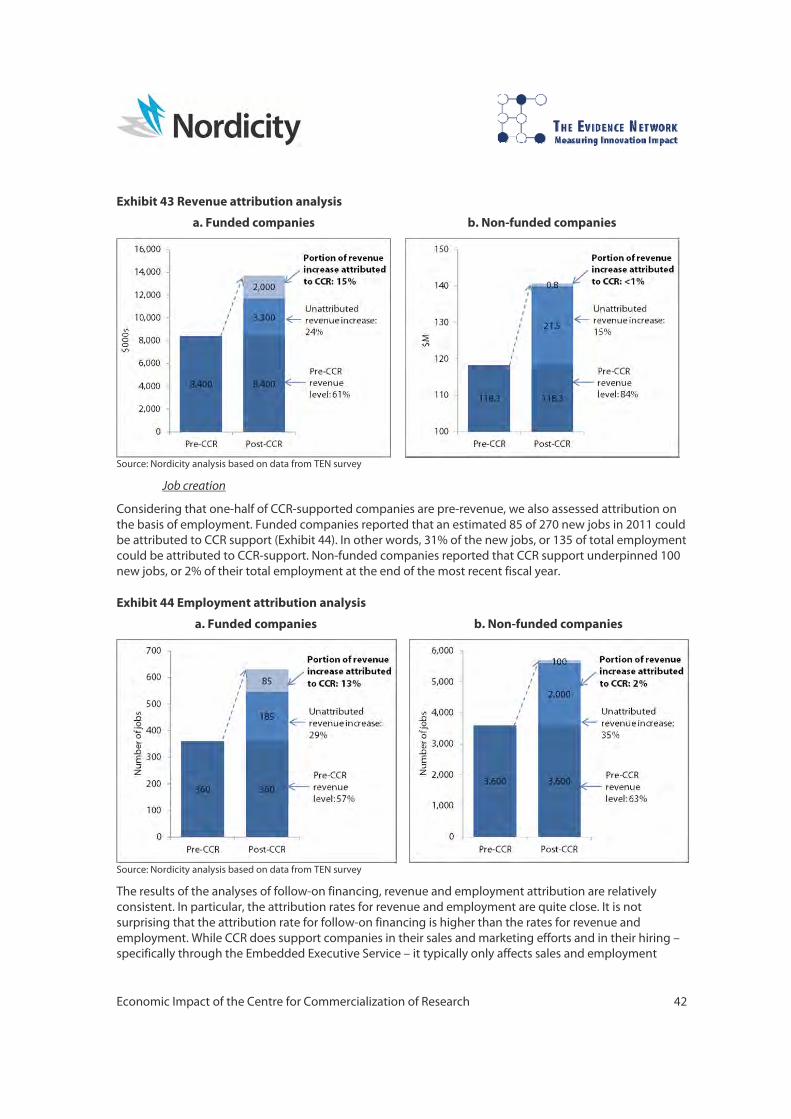
Economic Impact of the Centre for Commercialization of Research 42
Exhibit 43 Revenue attribution analysis
a. Funded companies b. Non-funded companies
Source: Nordicity analysis based on data from TEN survey
Job creation
Considering that one-half of CCR-supported companies are pre-revenue, we also assessed attribution on the basis of employment. Funded companies reported that an estimated 85 of 270 new jobs in 2011 could be attributed to CCR support (Exhibit 44). In other words, 31% of the new jobs, or 135 of total employment could be attributed to CCR-support. Non-funded companies reported that CCR support underpinned 100 new jobs, or 2% of their total employment at the end of the most recent fiscal year.
Exhibit 44 Employment attribution analysis
a. Funded companies b. Non-funded companies
Source: Nordicity analysis based on data from TEN survey
The results of the analyses of follow-on financing, revenue and employment attribution are relatively consistent. In particular, the attribution rates for revenue and employment are quite close. It is not surprising that the attribution rate for follow-on financing is higher than the rates for revenue and employment. While CCR does support companies in their sales and marketing efforts and in their hiring – specifically through the Embedded Executive Service – it typically only affects sales and employment

Economic Impact of the Centre for Commercialization of Research 43
decisions in an indirect manner. In the case of financing, however, CCR plays a very active and direct role. Not only does it directly invest in companies - it also facilitates third party investments.
Exhibit 45 Regression analysis of relationship between CCR offerings and immediate and intermediate impacts
Relationship between CCR offerings, immediate, and intermediate impacts:
Using regression analysis (see An Assessment of the Impact of the Ontario Centres of Excellence Centre for Commercialization of Research on Companies 2011-2012, A Companion Document) we found that there is a positive, strong and significant relationship between the immediate impact on company resources and capabilities, and the intermediate impacts on time to market, market share, employment and revenue growth, and follow-on financing.
The regression analysis shows that the importance of funding (provided through seed or other financing, embedded executives, the new entrepreneur initiative, or other commercialization support) is more predictive of intermediate impact than importance of advice (provided through mentoring, introductions to other sources of financing, or introductions to non-financial services).
However, when immediate impact factors comprised of advice and linkages measures, and funding and management measures are included in the regression analysis, they become the strongest predictors of intermediate impact, and importance of funding is no longer a significant predictor. The regression analysis also shows that growing companies attribute greater intermediate impact to CCR than companies that are not growing as rapidly.
Overall, the regression analyses show that immediate impacts are the strongest predictors of intermediate impacts, as predicted by TEN’s logic model for innovation intermediaries. In other words, CCR's offerings create immediate impacts on the resources and capabilities of companies, predicting improved market performance of the companies. And it is the attributed impact to CCR on improved market performance of companies that leads to the economic impact attributed to CCR.
Importance of CCR funding:
TEN also found that the average immediate impacts reported by companies that received services from CCR in 2011 or 2012, and that had received funding, were greater than for companies that had received services only (significant at the 99% confidence level). However, when we compared CCR's impact using all immediate impact measures, excluding the impact of provision of funding, we found that the impacts of CCR's business services are similar for companies whether or not they were funded.
The average intermediate impacts were reported to be greater by companies that received funding (significant at the 99% level overall, and for all measures except impact on change in revenues which was different at the 95% confidence level).
These results are consistent with those found using Statistics Canada data in an assessment of the impact of financing and consulting services of the BDC (BDC 2009). In that study, BDC found that “…combining both BDC financing and consulting services helps bolster revenues. BDC clients that use both financing and consulting services not only outperform non-BDC clients on the revenue growth front, but they also outperform other BDC clients that use only one of the two BDC Services. “ (BDC 2009)
When deriving an overall attribution rate from the three rates observed for follow-on financing, revenue and employment, it is important to keep in mind that financing probably has a stronger link to historical economic impact. One half of companies are pre-revenue, so they can only fund their expenditures – and thereby make an economic impact – through external financing. Positive-revenue companies often still require external financing in order to fund operating deficits during their early years of operation. In both regards, the financing secured by emerging companies provides the foundation for future economic impact through growing revenues and employment.
For these reasons, we give follow-on financing a 50% weighting when arriving at an overall attribution rate. With a 50% weighting assigned to follow-on financing and 25% weightings assigned to revenue and employment, the results indicate that an attribution rate of approximately 20% would be warranted for

Economic Impact of the Centre for Commercialization of Research 44
the analysis of the economic impact of funded companies (Exhibit 46). For non-funded companies, an attribution rate of 3% would be warranted.
Exhibit 46 Attribution rates Funded
companies Non-funded companies
Follow-on financing attribution rate 25% 6% Revenue attribution rate 15% <1% Employment attribution 13% 2% Attribution rate for economic impact analysis 20% 3% Source: Nordicity analysis based on data from TEN survey
When we apply these attribution rates to the overall economic impact of CCR-supported companies we arrive at an estimate of the economic benefits of CCR (Exhibit 47). We estimate that the financial and business advisory support provided by CCR generated $39.7 million in GDP. It also led to $27.2 million in wages and the creation of 850 cumulative jobs within Canada.
Exhibit 47 Attributed economic impact of CCR, 2009-10 to 2011-12 (real 2011 dollars) Funded
companies Non-funded companies
Total
GDP ($M) 20.5 19.2 39.7 Wage ($M) 13.6 13.6 27.2 Cumulative jobs 420 430 850 Source: Nordicity analysis based on data from TEN survey and Statistics Canada
5.7 Benefit-Cost analysis
CCR’s actions led to the creation of 740 cumulative jobs in the Canadian economy and generated over $42 million GDP In this section we compare the value of the attributed economic impact of CCR to the financial resources supplied by the federal government to deliver CCR. In order to be complete, this analysis adds the economic impact of CCR’s own administration and also takes into account the deadweight loss associated with raising tax revenue to fund CCR’s administration and funding.
5.7.1 Economic value of CCR adminstration
We estimate that the direct and spin-off impacts flowing from the administration between 2009-10 and 2011-12 generated GDP of $6.4 million and wages of $5.4 million. These wages yielded an estimated 60 cumulative jobs over the three-year period. When we add the economic impact of the CCR service administration to the attributed economic impact, we arrive at an estimate of the overall economic impact of CCR’s operations. CCR’s operations generated $46.1 million in GDP, $32.6 million in wages, and 910 cumulative jobs.
Exhibit 48 Economic impact of CCR’s operations, 2009-10 to 2011-12 (real 2011 dollars) Attributed economic
impact of CCR support Economic impact of CCR administration
Total economic impact of CCR’s
operations GDP ($M) 39.7 6.4 46.1 Wage ($M) 27.2 5.4 32.6 Cumulative jobs 850 60 910 Source: Nordicity analysis based on data from TEN survey and Statistics Canada

Economic Impact of the Centre for Commercialization of Research 45
5.7.2 Deadweight loss and net economic impact
Since CCR is funded by tax revenues, one must also take into account the cost that these tax revenues impose on the Canadian economy in order to arrive at an estimate of the net benefit to the Canadian economy. The collection of tax revenues not only diverts the amount of the tax revenue from private individuals and companies to government operations and programs, it also generates distortions in the economy by altering the incentives of economic agents and the allocation of resources within the economy. The sum of these distortions places additional costs on an economy and is referred to as the deadweight loss of taxation.
Deadweight loss
The imposition of a tax not only transfers income from private individuals and business to government programs and funding recipients, it can also generate a net loss to the economy. This net loss, referred to as the deadweight loss, arises when a tax alters the incentives of economic agents and leads to a reduction in output within the economy.
In the diagram (above) the shift in the supply curve (S) from S1 to S2 represents the effect of a tax within an economy. The price level (PL) rises from PL1 to PL2 and the government collects Area B (the shaded box) in the form of tax revenue. However, the tax also causes output within the economy to decrease from Q1 to Q2. The combination of the drop in output and increase in price level leads to a deadweight loss represented by the solid-shaded triangle A.
Baylor and Beauséjour (2004) estimated the deadweight loss of various types of taxation in Canada. For example, they found that each dollar of personal income tax reduces Canadian GDP by $0.32. Other types of taxes displayed higher rates of deadweight loss (i.e., the tax was more distortionary) or lower rates of deadweight loss. The deadweight loss rate for corporate income tax was $0.37 of GDP per incremental dollar of tax revenue; for consumption taxes the rate was $0.13 of GDP.
If we apply the deadweight loss rate of 0.32 to CCR’s total budget of $12.9 million between 2008-09 and 2011-12, it implies that deadweight loss or opportunity cost of the necessary taxation of Canadians was equal to $4.1 million in GDP.
After taking into account the deadweight loss associated with the taxation required to fund CCR, we conclude that the net economic impact of CCR (funding and business advisory services) was equal to $42.0 million in GDP. This GDP included $30.1 million in wages and yielded 840 cumulative jobs.
AB
S1
S2
Q2 Q1
PL1
PL2
E1
E2
Price Level
Output (Q)

Economic Impact of the Centre for Commercialization of Research 46
Exhibit 49 Economic impact of CCR’s operations, 2009-10 to 2011-12 (real 2011 dollars) Total economic
impact of CCR’s operations
Deadweight loss
Net economic impact
GDP ($M) 46.1 4.1 42.0 Wage ($M) 33.1 3.0 30.1 Cumulative jobs 910 70 840 Source: Nordicity analysis based on data from TEN survey and Statistics Canada
5.7.3 Summary of net benefit
Each dollar of commercialization support provide by CCR generated $3.25 in GDP in the Canadian economy Between 2009-10 and 2011-12, the financing and business advisory support provided by CCR to early-stage companies engaged in the commercialization of innovative products generated $41.9 million in incremental GDP for the Canadian economy. The economic activity stimulated by CCR and its industry support also generated $30.1 million in wages and 740 FTEs.
When the value of the economic benefits generated by CCR are summed and compared to its level funding of $12.9 million, we find that every dollar of CCR funding yields $3.26 in economic benefits (measured in terms of GDP) across the Canadian economy.
Exhibit 50 Summary of net economic benefit of CCR
Source: Nordicity analysis based on data from TEN survey and Statistics Canada
5.7.4 Net fiscal benefit
We can also analyze the net benefit of CCR intervention in terms of its net fiscal benefit: that is, the difference between the taxes collected on the basis of its net economic benefit and the financial costs to government of delivering the services.
Using a simple model based on effective average taxation ratios, we prepared estimates of the federal and provincial taxes collected as a function of the GDP and wages attributed to CCR support (Exhibit 51). The economic activity stimulated by CCR support led to an estimated $6.4 million in federal taxes. From the

Economic Impact of the Centre for Commercialization of Research 47
federal government’s perspective, CCR yields a fiscal loss of $6.8 million. However, given the federal-provincial split of Canada’s taxation system, a more complete fiscal analysis should also take into account provincial taxes.7 When the estimated total provincial taxes of $6.8 million are added to the federal taxes, the total net fiscal benefit is $13.2 million. Given that service costs summed to $12.9 million during the three-year period, the net fiscal benefit is $300,000, or $100,000. In other words, CCR generates a fiscal benefit, even after taking into account the deadweight loss of the taxation required to fund it.
Exhibit 51 Net fiscal benefit of CCR, 2009-10 to 2011-12 (real 2011 dollars) Federal
government Provincial and
local government Total
Personal income tax 4.2 2.7 6.9 Corporation income tax 0.9 0.5 1.4 Consumption taxes 1.2 1.8 3.1 Property and capital taxes 0.0 1.8 1.8 Total tax revenue 6.4 6.8 13.2 Service costs (12.9) Net fiscal benefit/(cost) 0.3 Source: Nordicity calculations based on data from Statistics Canada CANSIM matrices 384-0001, 384-0002, and 385-0002. See Appendix for additional data.
Although the fiscal benefit generated by CCR is small - $100,000 – it is important to keep in mind that the basis of this calculation is conservative. For example, it does not take into account any recoveries that CCR will make from the loans its makes to emerging Canadian companies. While some of these companies may be unable to pay back their loans to CCR, many will either pay back their loans or covert them to equity positions that CCR could liquidate at a future date for a profit. If one were to include the present value of these future loan recoveries and equity investments, the annual fiscal benefit associated with CCR’s first three years of operation would be even higher than $300,000.
7 While the federal and provincial governments in Canada possess their own taxation and spending powers, the federal government maintains a program of transfers to provincial governments for healthcare, education, social services or equalization. An increase in provincial tax revenue, therefore, indirectly alleviates the need for more federal transfers for healthcare, education, social services or equalization.
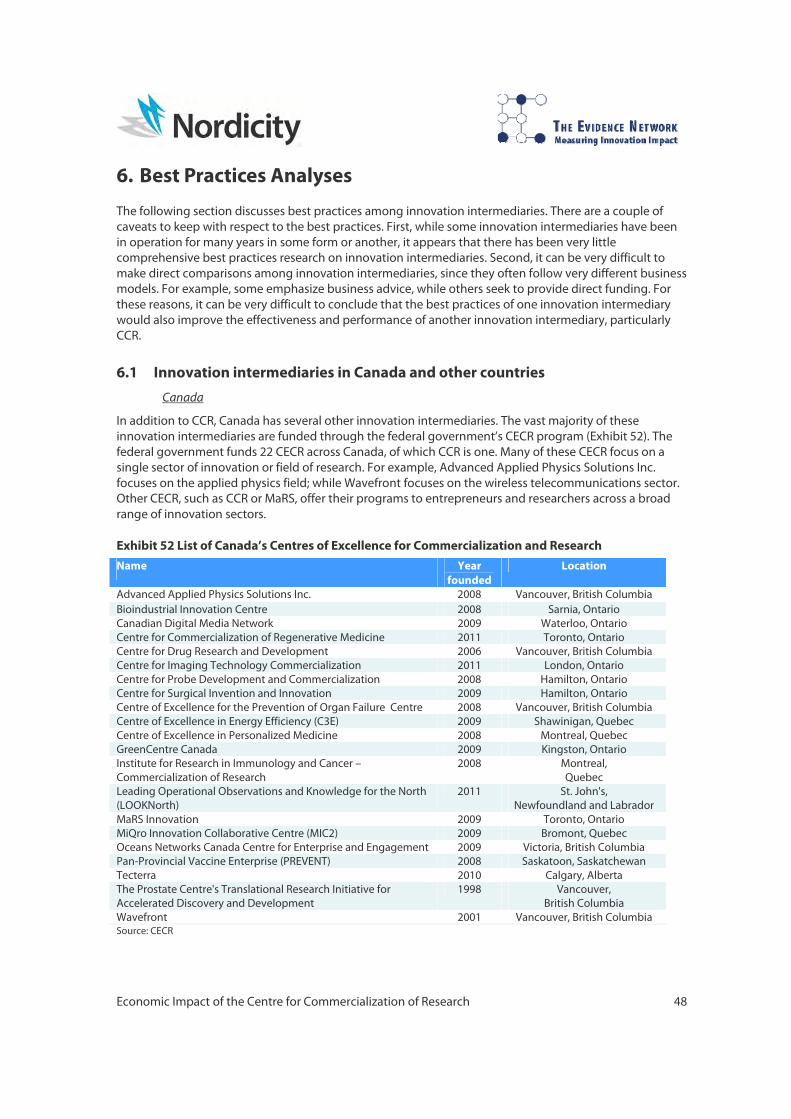
Economic Impact of the Centre for Commercialization of Research 48
6. Best Practices Analyses
The following section discusses best practices among innovation intermediaries. There are a couple of caveats to keep with respect to the best practices. First, while some innovation intermediaries have been in operation for many years in some form or another, it appears that there has been very little comprehensive best practices research on innovation intermediaries. Second, it can be very difficult to make direct comparisons among innovation intermediaries, since they often follow very different business models. For example, some emphasize business advice, while others seek to provide direct funding. For these reasons, it can be very difficult to conclude that the best practices of one innovation intermediary would also improve the effectiveness and performance of another innovation intermediary, particularly CCR.
6.1 Innovation intermediaries in Canada and other countries
Canada
In addition to CCR, Canada has several other innovation intermediaries. The vast majority of these innovation intermediaries are funded through the federal government’s CECR program (Exhibit 52). The federal government funds 22 CECR across Canada, of which CCR is one. Many of these CECR focus on a single sector of innovation or field of research. For example, Advanced Applied Physics Solutions Inc. focuses on the applied physics field; while Wavefront focuses on the wireless telecommunications sector. Other CECR, such as CCR or MaRS, offer their programs to entrepreneurs and researchers across a broad range of innovation sectors.
Exhibit 52 List of Canada’s Centres of Excellence for Commercialization and Research Name Year
founded Location
Advanced Applied Physics Solutions Inc. 2008 Vancouver, British Columbia Bioindustrial Innovation Centre 2008 Sarnia, Ontario Canadian Digital Media Network 2009 Waterloo, Ontario Centre for Commercialization of Regenerative Medicine 2011 Toronto, Ontario Centre for Drug Research and Development 2006 Vancouver, British Columbia Centre for Imaging Technology Commercialization 2011 London, Ontario Centre for Probe Development and Commercialization 2008 Hamilton, Ontario Centre for Surgical Invention and Innovation 2009 Hamilton, Ontario Centre of Excellence for the Prevention of Organ Failure Centre 2008 Vancouver, British Columbia Centre of Excellence in Energy Efficiency (C3E) 2009 Shawinigan, Quebec Centre of Excellence in Personalized Medicine 2008 Montreal, Quebec GreenCentre Canada 2009 Kingston, Ontario Institute for Research in Immunology and Cancer – Commercialization of Research
2008 Montreal, Quebec
Leading Operational Observations and Knowledge for the North (LOOKNorth)
2011 St. John's, Newfoundland and Labrador
MaRS Innovation 2009 Toronto, Ontario MiQro Innovation Collaborative Centre (MIC2) 2009 Bromont, Quebec Oceans Networks Canada Centre for Enterprise and Engagement 2009 Victoria, British Columbia Pan-Provincial Vaccine Enterprise (PREVENT) 2008 Saskatoon, Saskatchewan Tecterra 2010 Calgary, Alberta The Prostate Centre's Translational Research Initiative for Accelerated Discovery and Development
1998 Vancouver, British Columbia
Wavefront 2001 Vancouver, British Columbia Source: CECR

Economic Impact of the Centre for Commercialization of Research 49
RNA Diagnostics Inc. (Facilitated Access to Capital)
Approximately 25% of cancer patients who recover do so with chemotherapy. The remaining 75% of patients must be treated with other therapies, afterwards. This long treatment cycle can be onerous for the patient and costly to the healthcare system. In a clinical trial, a medical doctor discovered a molecular test that could evaluate if chemotherapy was effective in the early stages of the treatment. CCR put the medical doctor in touch with business people and RNA Diagnostics Inc. was born. The goal of the company was to commercialize and license the medical test.
CCR, together with Laurentian University and the company staff, put together the seed funds. Additionally, CCR contributed financing to match with other funds, connected the company with potential partners, and helped highlight gaps in its business plan.
Thanks to the financial contribution from CCR, investors’ confidence in the company increased. Today, RNA Diagnostics has raised approximately $2.5 million from private and public investors. The company now employs nine people full-time in Ontario and has already licensed its innovative medical test to some early adopters.
RNA Diagnostics projects that the potential market for its type of medical test could be worth as much as $500 million. It plans to address $100 million of this in the next 5-6 years.
Examples of innovation intermediaries in Canada operating outside the CECR program include Accelerate Okanagan, BC Immigrant Investment Fund Ltd., and BC Renaissance Capital Fund Ltd. These organizations assist companies in their development and commercialization efforts; however, they are not part of the CECR program.
There are also innovation intermediaries in Atlantic Canada that operate with a very regional focus. Tech South East is focused on promoting innovation and entrepreneurial initiatives in South East New

Economic Impact of the Centre for Commercialization of Research 50
Brunswick. OceansAdvance Inc., located in Newfoundland and Labrador, focuses on the ocean technology cluster. Prince Edward Island is home to BioAlliance, which provides support to the bioscience cluster.
Other countries
The field of innovation and commercialization intermediation is growing globally, particularly in OECD countries. In Exhibit 53, we have identified several of the leading innovation intermediaries around the world, their location and a brief description of their focus.
Exhibit 53 List of selected innovation intermediaries in other countries Name Location Description
LARTA Institute Los Angeles, CA, US
A private, non-profit offering global services that bridge the gap between the lab and market. Their firm offers several programs that help commercialize science and technology innovations and get in touch with industry contacts / funders so their R&D can break into the market. They offer consulting services, advice, training for event management, etc. and help establish partnerships within the market space.
Ben Franklin Southeast Pennsylvania
Philadelphia, PA, US
A non-profit, regional innovation intermediary that has four centers in PA. Their focus is on boosting the local economy through emerging technologies. Their programs include investments and funding, and business advice.
Cambridge Enterprises
Cambridge, UK
Specific to research from Cambridge University, it assists in commercializing their innovations. Their programs include three broad categories: “technology transfer services, consultancy services, and seed fund services” (website).
Australian Institute for Commercialisation
Brisbane, Australia
A non-profit organisation working at the national level helping businesses / organisations and government to achieve business and industry success as a result of commercialising their developments. Their programs include a “boot-camp” to explain the commercialisation steps, advice, and contact development / networking services.
i2E, Inc. (Innovation to Enterprise)
Oklahoma, OK, US
A not-for-profit and private corporation with a staff of 23 that foster businesses in Oklahoma and contribute to their success. Their programs include advisory services (i.e., mentoring, entrepreneur-in-residence, CFO-in-residence, and sales-exec-in-residence), access to capital (i.e., funding facilitation and seed funding) and entrepreneurial development (fellowships, etc.).
IC2 Institute University of Texas, Austin, TX, US
Their website describes the institute as a ‘think-tank’ that focuses on capitalization and ‘wealth creation’. As a branch of the University of Texas, they have several programs that run out of their “applied research laboratory” in the Austin Technology Incubator (ATI) and Bureau of Business Research. The focus remains on entrepreneurs at the university and on bridging the innovation gap to encourage economic development and commercialization in Texas.
Maryland Technology Enterprise Institute (Mtech)
University of Maryland, MD, US
This is a university-based intermediary that encourages the innovators/entrepreneurs regionally and at the university. They administer several programs including offering seed funding, holding business plan competitions, entrepreneurial courses and facilitating the connections between the academic and business world.
Technology Venture Development ("Tech Ventures")
University of Utah, UT, US
Operates as a commercialization branch of the University of Utah. University developments are commercialized using several programs including: competitions for producing innovative medical equipment, and providing advice/training for student entrepreneurs.
Source: Nordicity research
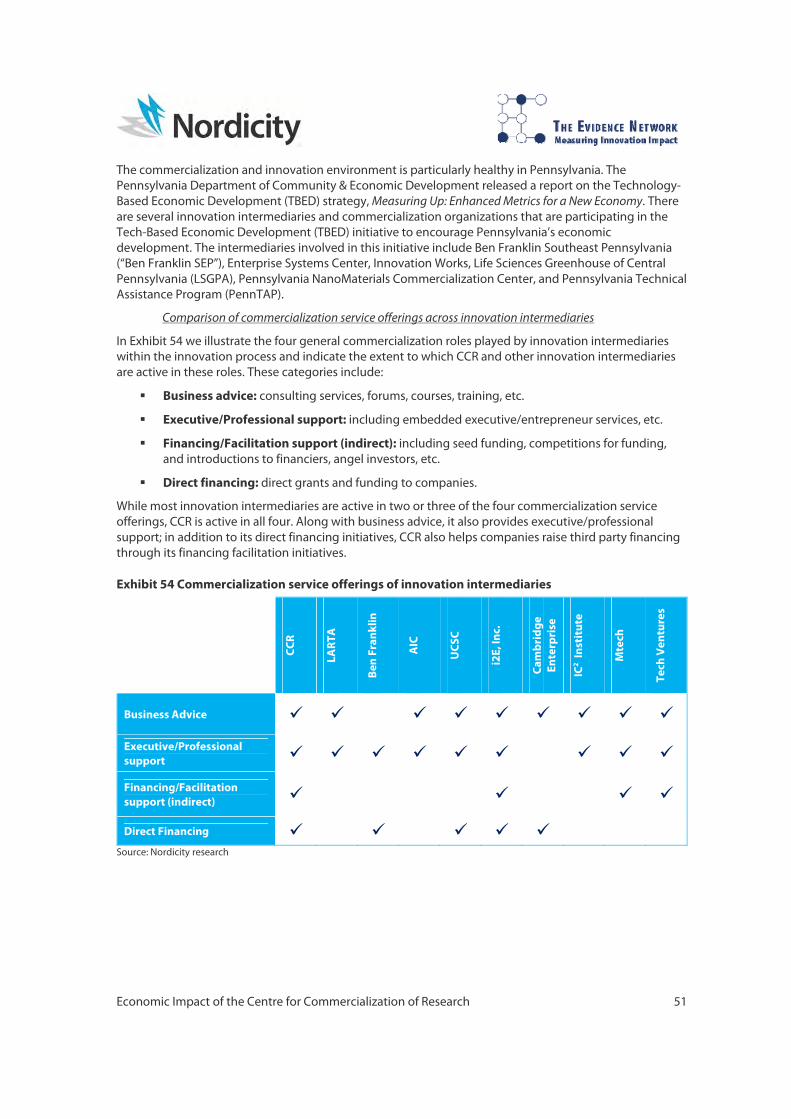
Economic Impact of the Centre for Commercialization of Research 51
The commercialization and innovation environment is particularly healthy in Pennsylvania. The Pennsylvania Department of Community & Economic Development released a report on the Technology-Based Economic Development (TBED) strategy, Measuring Up: Enhanced Metrics for a New Economy. There are several innovation intermediaries and commercialization organizations that are participating in the Tech-Based Economic Development (TBED) initiative to encourage Pennsylvania’s economic development. The intermediaries involved in this initiative include Ben Franklin Southeast Pennsylvania (“Ben Franklin SEP”), Enterprise Systems Center, Innovation Works, Life Sciences Greenhouse of Central Pennsylvania (LSGPA), Pennsylvania NanoMaterials Commercialization Center, and Pennsylvania Technical Assistance Program (PennTAP).
Comparison of commercialization service offerings across innovation intermediaries
In Exhibit 54 we illustrate the four general commercialization roles played by innovation intermediaries within the innovation process and indicate the extent to which CCR and other innovation intermediaries are active in these roles. These categories include:
Business advice: consulting services, forums, courses, training, etc.
Executive/Professional support: including embedded executive/entrepreneur services, etc.
Financing/Facilitation support (indirect): including seed funding, competitions for funding, and introductions to financiers, angel investors, etc.
Direct financing: direct grants and funding to companies.
While most innovation intermediaries are active in two or three of the four commercialization service offerings, CCR is active in all four. Along with business advice, it also provides executive/professional support; in addition to its direct financing initiatives, CCR also helps companies raise third party financing through its financing facilitation initiatives.
Exhibit 54 Commercialization service offerings of innovation intermediaries
CCR
LART
A
Ben
Fran
klin
AIC
UCS
C
i2E,
Inc.
Cam
brid
ge
Ente
rpri
se
IC2 I
nsti
tute
Mte
ch
Tech
Ven
ture
s
Business Advice
Executive/Professional support
Financing/Facilitation support (indirect)
Direct Financing Source: Nordicity research

Economic Impact of the Centre for Commercialization of Research 52
6.2 Best practices analysis
In this section we examine the best practices identified by international innovation intermediaries and compare the CCR’s performance statistics. Our research indicates that there are no standards or best practices that all innovation intermediaries agree are necessary for success. There has also been little empirical work done on statistics that might provide evidence of this success.
As a global phenomenon, innovation intermediaries have not been established for long enough to develop and agree upon best practices. Indeed, many of the best practices that have been identified were actually disseminated through the annual International Commercialization Alliance (ICA) Forum, of which CCR is the architect, acts as secretariat and provides leadership on strategic initiatives. As such, based on the proceedings of the 2012 ICA Forum, we have compiled the following list of five best practices that innovation intermediaries report as being important to their effectiveness.8
1. Provide links to lead customers
A first customer or lead customer is vital to any company seeking to introduce an innovative product. A lead customer can often serve as a ‘jumping off point’ for new connections and successful partnerships and marketing. If there is a lead customer or commercialization partner, investment and funding (both public and private) is more likely to follow. This means more confidence for more funders and investors.
Innovation intermediaries can have a profound effect on the commercialization rates of their client companies if they can play a direct role in helping companies secure a lead customer. For example, innovation intermediaries with strong links to government can facilitate some types of government procurement, so that government acts as a lead customer. This type of government procurement could even take place in lieu of offering tax credit support to innovative companies, and thereby limit the overall cost of innovation support to the government.
2. Effectively bridge the academic and commercial communities
The conversion of academic research into marketable products is at the core of the commercialization and innovation process. However, the academic and commercial environments can often be vastly different in terms of priorities and skills. The more effectively that an innovation intermediary can act as a bridge between these two communities, the more successful its commercialization efforts are likely to be. For example, there is a role for innovation intermediaries to play in simply acting as a translator between these two communities. Innovation intermediaries have to understand the balance between technology-push innovation and demand-pull innovation, and how that balance affects the priorities and practices of both communities. On an operational level, innovation intermediaries can support IP transfer and provide validation of concept services, which can promote faster and more effective migration of academic research into marketable products.
Globally, commercialization and innovation intermediaries often follow mixed models that include differing elements of industry and academic perspectives. Industry and the academic world must have an open communication and relationships: international and commercial input can drive success in raising money. Cambridge Enterprises, for example, has a successful model that assists Cambridge University’s commercialization of its innovations. Cambridge Enterprises can serve as a guide to best practices for connecting industry and academics.
8 The proceedings of the 2012 ICA Forum report a list of 19 best practices that several specific intermediaries have identified (ICA 2012, 10-13), however, to preclude repetition and unnecessary detail, we have outlined four best practices that will work across the majority of innovation intermediaries.
Economic Impact of the Centre for Commercialization of Research 53
3. Promote global networks
Commercialization and innovation can no longer occur entirely within domestic borders. This is particularly true for relatively small countries such as Canada. Innovating companies must be global-facing: they have to focus on global markets. They can no longer rely on achieving success in their domestic market first; they have to focus on international markets from the outset. Even R&D is becoming more globalized, as researchers at universities and institutions across different countries engage in more and more collaboration. Innovating companies have to seek financing from outside their domestic markets, develop global supply chains, and engage in collaboration with multinationals or smaller companies in other countries in order to support their sales and the ongoing process of innovation.
The importance of global markets and networks for innovating companies means that innovation intermediaries must also be global by design. They can no longer simply link their client companies to a domestic innovation ecosystem. Successful innovation intermediaries must be able to provide their client companies with international links to investors, R&D collaborators and sales channels. Indeed, many of the social and economic issues (e.g., climate change) that companies are seeking to address through their innovation are in fact global problems, which are best approached in a globally coordinated manner.
Information sharing among innovation intermediaries in different countries is one step towards building global networks. The ICA is one example of such international information-sharing. Indeed, the conferences and sessions organized by ICA can play an important role in fostering partnerships and helping intermediaries gather and share information, and in discussing new strategies to connect their clients and with each other. Innovation intermediaries must have an active and connected commercialization community. Forums, conferences, meetings and other types of personal interactions can increase productivity.
More formal partnerships between innovation intermediaries can also help establish global networks. Since commercialization success happens in an international market – as well as a domestic one – more international cooperation has a positive effect across all companies and intermediaries. In March 2012, CCR announced its partnership with LARTA (OCE 2012). This was a “cross-border agreement to accelerate commercial growth of innovative companies” (OCE 2012). CCR and LARTA are using this collaborative approach to ensure that the companies they provide services to can operate effectively across the Canada-US border and establish their portfolio nationally and internationally.
4. Adopt network-centric commercialization approaches
Intermediaries also need to be network-focused. That is, since the role of an intermediary is to connect ideas and businesses, and to foster the development of innovative products, it must not only support R&D, but also help academia and companies develop relationships with industry and investors.
Innovation intermediaries must see themselves as a hub within the innovation ecosystem; one which can bring together the financial and human capital to help companies move through each step of the commercialization and innovation process. Innovation intermediaries often may not be able to provide the required business support or advice themselves. To be successful, they have to be able to connect their client companies with the required skills, service or advice. CCR’s Embedded Executive Service is a good example of this network-centric approach. CCR does not directly provide the managerial advice; instead, it efficiently links its client companies to a resource that can provide the advice.
5. Be adaptable and agile
Above all, innovation intermediaries have to be adaptable and agile. Commercialization requires an innovative and ever-changing approach; one that is customized to fit the diverse needs of researchers and entrepreneurs alike. Innovation intermediaries must draw on specialized approaches for unique cases. The needs of innovating companies are constantly changing; innovation intermediaries’ support offerings must keep pace with this change. As such, innovation intermediaries need to have governance structures that permit them to change their offerings very quickly. They also need management structures that

Economic Impact of the Centre for Commercialization of Research 54
permit them to modify their offerings for specific needs of client companies Adaptability ultimately requires that innovation intermediaries have sustainable funding and can operate as independent organizations (from their funders).
Eve Medical (New Entrepreneur Service)
Eve Medical is a small enterprise devoted to the development and further production of HerSwabTM, a medical device intended to help women self-collect samples for screening sexually transmitted diseases, in an easy, private and comfortable way. HerSwabTM was invented by a student as part of her final-year project at OCAD University in Toronto. The enterprise is still in the presales stage, but it is moving forward to higher levels.
Initially, Eve Medical and its founder lacked the funding to file patent and develop a prototype. CCR’s help consisted in New Entrepreneur funds.
Through CCR’s New Entrepreneur Service, Eve Medical was able to obtain a loan to fund the costs of its patent filing. The company’s involvement in the New Entrepreneur Service has also helped it to exchange information with experts and peers through workshops.
With its IP on solid footing, Eve Medical was able to raise $200,000 in financing. This financing permitted it to establish a professional two-member core team and hire contractors as needed. This financing is also helping Eve Medical to fund production of advanced prototypes. The company is now transitioning into its first production run, for trial purposes. It expects to create 40 jobs by 2015.

Economic Impact of the Centre for Commercialization of Research 55
6.3 Potential areas of development in CCR’s commercialization support
From the best-practices analysis, as well as the primary research, a few observations came to light with respect to areas of development that could benefit CCR’s commercialization support. In this section we outline three potential areas where CCR could develop – or continue to develop – its commercialization support.
1. Provide support for securing lead customers
Some companies indicated the importance of a lead customer. That first customer is vital; however, lead customers frequently want to be compensated (in terms of lower pricing) for the risk they are taking. This runs counter to the financial needs of emerging companies: they need to book revenues to attract additional investment. CCR could have a more positive impact on companies if it could help to identify lead customers that are in position to take a risk – for example, public sector clients (i.e., government procurement) – or facilitate some of type of underwriting of the lead-customer sale. This insurance may allow the seller to book the revenues; while at the same time give the lead customer the comfort that they will be compensated if there are any problems with the transaction or product.
2. Continue to expand its global networking role
Global markets are vital. This is one area where CCR has already been very active and has taken a leadership role – both for its client companies and within the international innovation intermediary community. CCR should continue to spearhead and develop its international-facing initiatives. CCR’s international perspectives and networks are a valuable resource for its client companies, particularly the born globals. CCR should continue to expand its international information-sharing and partnerships, so that it can help establish effective links between Canadian companies and R&D collaborators, investors, supply-chain partners and sales channels in other countries.
3. Adopt more network-centric approaches
The Embedded Executive and Facilitated Access to Capital Servicesare two good examples of how CCR has adopted a network-centric approach to commercialization support. Rather than directly offering management support or financing capital, CCR acts as a hub within the innovation ecosystem: linking suppliers of expertise and capital with innovative companies. This network-centric approach gives CCR tremendous performance leverage, allowing it to maximize the number of companies that it can support. CCR should explore how it can adopt this network-centric approach in other areas of commercialization support, in order to further increase the leverage of its intervention in the innovation ecosystem.

Economic Impact of the Centre for Commercialization of Research 56
7. Summary of Findings and Recommendations
7.1 The importance of commercialization support and role of CCR
For Canada and other western countries, rising standards can only come through productivity growth underpinned by innovation. Economists and policymakers often emphasize the importance of R&D to innovation; however, R&D is only part of the innovation cycle. The commercialization phase of the innovation cycle is, arguably, just as important.
Up until recently, the federal government adhered to an innovation-support regime that was tilted towards R&D. In particular, SR&ED and IRAP featured prominently and accounted for a large share of financial resources. These and other support programs did not directly address the unique commercialization challenges faced by Canadian companies.
Canada relies upon SMEs to drive innovation and job growth. However, unlike innovative SMEs in the US and other G7 countries, Canadian SMEs face a relatively small domestic market and a less-developed venture capital ecosystem. Consequently, Canada’s innovation ecosystem is characterized by a lack of financing and the economies of scale that can often promote commercialization.
This has led to the emergence of an innovation gap. The federal government’s vast investments in R&D are at risk of being stranded or worse yet, captured by foreign companies. If Canadian innovative SMEs are unable to assemble the financing, management and sales skills needed to quickly commercialize and exploit global markets, companies in other countries will surpass them. In some cases, Canadian R&D is commercialized by non-Canadian companies; as a result, many of the economic benefits are lost to Canada.
Through NCE, the federal government has introduced 22 CECR across Canada. The CCR is among these CECR. CCR plays a direct role in addressing Canada’s innovation gap. Through its business advisory services, funding services and seed funding investments, CCR can help Canadian researchers and IP-holders to move from concept to prototype to full-scale production and global distribution.
CCR plays a de-risking role within the commercialization cycle; it also acts an investment aggregator. By helping early stage companies with their IP protection, formation of management team and identification of sales markets, CCR addresses many of the areas of uncertainty that impede external financing. In effect it conducts a rigorous due diligence exercise that many third party investors would have to do from scratch. By the same token, CCR’s relationship with the financing community in Canada ensures that its client companies have maximum exposure to potential investment capital.
Since its launch in 2008, CCR has provided business advice to some 992 Canadian companies. It has made a total of 98 funding investments worth $6.8 million in 86 companies. These funding investments, alone, have led to $149.2 million in follow-on financing, $56.3 million in incremental sales and the creation of 1,515 jobs.
7.2 Economic impact of CCR-supported companies The 992 companies served by CCR make a contribution to the Canadian economy in a number of ways. Regardless of whether companies are pre-revenue or positive-revenue, they employ many Canadians (particularly HQP) and create demand within their supplier industries. The innovation products that they develop and commercialize also yield significant spillover effects for downstream users, other companies and industries, and for Canadians’ general quality of life.
When the direct, spin-off (indirect and induced) and spillover impacts of CCR-supported companies were taken into account, the economic impact totaled $742.1 million in GDP (Exhibit 55). The overall economic impact yielded $521.5 million in wages and 16,300 cumulative jobs. Funded companies accounted for $103.8 million in GDP, $68.7 million in wages and the creation of 2,110 cumulative jobs.
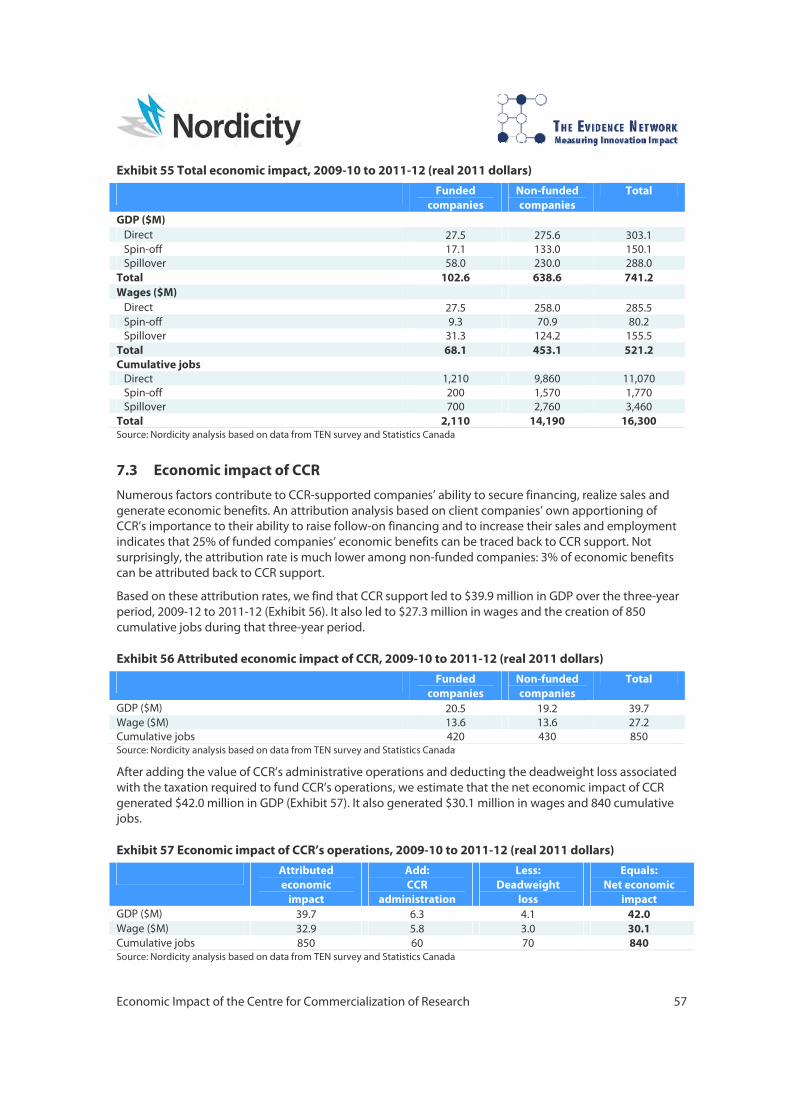
Economic Impact of the Centre for Commercialization of Research 57
Exhibit 55 Total economic impact, 2009-10 to 2011-12 (real 2011 dollars) Funded
companies Non-funded companies
Total
GDP ($M) Direct 27.5 275.6 303.1 Spin-off 17.1 133.0 150.1 Spillover 58.0 230.0 288.0 Total 102.6 638.6 741.2 Wages ($M) Direct 27.5 258.0 285.5 Spin-off 9.3 70.9 80.2 Spillover 31.3 124.2 155.5 Total 68.1 453.1 521.2 Cumulative jobs Direct 1,210 9,860 11,070 Spin-off 200 1,570 1,770 Spillover 700 2,760 3,460 Total 2,110 14,190 16,300Source: Nordicity analysis based on data from TEN survey and Statistics Canada
7.3 Economic impact of CCR Numerous factors contribute to CCR-supported companies’ ability to secure financing, realize sales and generate economic benefits. An attribution analysis based on client companies’ own apportioning of CCR’s importance to their ability to raise follow-on financing and to increase their sales and employment indicates that 25% of funded companies’ economic benefits can be traced back to CCR support. Not surprisingly, the attribution rate is much lower among non-funded companies: 3% of economic benefits can be attributed back to CCR support.
Based on these attribution rates, we find that CCR support led to $39.9 million in GDP over the three-year period, 2009-12 to 2011-12 (Exhibit 56). It also led to $27.3 million in wages and the creation of 850 cumulative jobs during that three-year period.
Exhibit 56 Attributed economic impact of CCR, 2009-10 to 2011-12 (real 2011 dollars) Funded
companies Non-funded companies
Total
GDP ($M) 20.5 19.2 39.7 Wage ($M) 13.6 13.6 27.2 Cumulative jobs 420 430 850 Source: Nordicity analysis based on data from TEN survey and Statistics Canada
After adding the value of CCR’s administrative operations and deducting the deadweight loss associated with the taxation required to fund CCR’s operations, we estimate that the net economic impact of CCR generated $42.0 million in GDP (Exhibit 57). It also generated $30.1 million in wages and 840 cumulative jobs.
Exhibit 57 Economic impact of CCR’s operations, 2009-10 to 2011-12 (real 2011 dollars) Attributed
economic impact
Add:CCR
administration
Less:Deadweight
loss
Equals:Net economic
impact GDP ($M) 39.7 6.3 4.1 42.0 Wage ($M) 32.9 5.8 3.0 30.1 Cumulative jobs 850 60 70 840 Source: Nordicity analysis based on data from TEN survey and Statistics Canada

Economic Impact of the Centre for Commercialization of Research 58
7.4 Benefit-cost analysis
The value of the economic benefits generated by CCR-supported companies that can be attributed back to CCR greatly exceeds the financial resources it required to deliver its services. Between 2008-09 and 2011-12, the level of funding for CCR (measured in real 2011 dollars) totalled $12.9 million. The economic benefits generated by CCR, however, amounted to an estimated $42.0 million. When the value of the economic benefits generated by CCR are summed and compared to its total funding of $12.9 million, we find that every dollar of CCR funding yielded $3.26 in economic benefits (measured in terms of GDP) across the Canadian economy.
Exhibit 58 Summary of net economic benefit of CCR
Source: Nordicity analysis based on data from TEN survey and Statistics Canada
CCR’s economic impact also generated a fiscal benefit for federal and provincial governments in Canada. The economic activity generated by CCR support yielded an estimated $13.2 million in federal and provincial taxes. Given that CCR funding totalled $12.9 million between 2009-10 and 2011-12, these tax revenues translated into a total fiscal benefit of $300,000, or $100,000 annually. And while this may sound like a modest amount, it is important to keep in mind that result does not take into account the present value of any loan recoveries or equity-investment profits that CCR may realize in the future from the investments it made between 2009-10 and 2011-12 in early-stage Canadian companies (Exhibit 59).
Exhibit 59 Net fiscal benefit of CCR, 2009-10 to 2011-12 (real 2011 dollars) Federal
government Provincial and
local government Total
Personal income tax 4.2 2.7 6.9 Corporation income tax 0.9 0.5 1.4 Consumption taxes 1.2 1.8 3.1 Property and capital taxes 0.0 1.8 1.8 Total tax revenue 6.4 6.8 13.2 Service costs (12.9) Net fiscal benefit/(cost) 0.3 Source; Nordicity calculations based on data from Statistics Canada CANSIM matrices 384-0001, 384-0002, and 385-0001. See Appendix for additional data.

Economic Impact of the Centre for Commercialization of Research 59
7.5 Commercialization best practices
While the field of innovation intermediation has not been established long enough to conduct rigorous best practices research, the proceedings from the 2012 ICA Forum provide some indication of the type of practices that innovation intermediaries believe have the potential to make their commercialization offerings more effective. Innovation intermediaries should provide links to lead customers, which are vital to any new company. Within the innovation ecosystem, innovation intermediaries need to act as an effective bridge between the academic and commercial communities, which often have very different priorities and skills. Innovation is increasingly global in nature; innovation intermediaries should promote global networks. By doing so, they can offer their client companies links with researchers, suppliers and customers outside of their domestic market.
Network-centric approaches to commercialization support can allow innovation intermediaries to increase their performance leverage, and thus reach the maximum number of companies. Innovation intermediaries must see themselves less as simple sources of funding and more as hubs for the exchange of information, skills and capital within the innovation ecosystem. Lastly, innovation intermediaries must be adaptable and agile. The commercialization-support needs of innovative companies are constantly evolving. Innovation intermediaries must have the financial resources, governance and management structures that will permit them to provide customized offerings to best suit the specific commercialization-support needs of their client companies.
7.6 Recommendations for development of CCR’s commercialization support Given the importance of lead customers, CCR should develop offerings that help companies to secure lead customers, whether they come from the public or private sectors. Assistance with government procurement could help in this regard. Given the importance of global markets, CCR should continue to expand the global networking component of its offering. To do this, CCR can build on its leadership role within ICA and continue its commitment to building born global firms. Lastly, CCR should continue to adopt a network-centric approach to commercialization support, expanding its Embedded Executive and Facilitated Access to Capital Services through strategic partnerships with regional innovation partners.

Economic Impact of the Centre for Commercialization of Research 60
References
Baldwin, John, and Amelie Lafrance. "Firm Turnover and Productivity Growth in Selected Canadian Services Industries, 2000 to 2007." Statistics Canada Economic Analysis Research Paper Series (Statistics Canada) Cat. no. 11F0027M, no. 072 (2011).
Bassanini, Andrea, and Stefano Scarpetta. "Does human capital matter for growth in OECD countries? A polled-mean group approach." Economics Letters 74 (2002): 399-405.
Baylor, Maxmillian, and Louis Beauséjour. "Taxation and Economic Efficiency: Results from a Canadian CGE Model." 2004.
BDC. "Economic Impact Study: BDC’s financing and consulting services." 2009. Expert Panel on Review of Federal Support to Research and Development. "Innovation Canada: A Call to
Action." 2011. ICA. "Proceedings of the Second International Commercialization Forum (March 20-21, 2012)." Toronto:
Ontario Centres of Excellence, 2012. Mansfield, Edwin. "Academic research and industrial innovation." Research Policy 20 (1991): 1-12. Martin, Fernand. "The economic impact of Canadian university R&D." Research Policy 27 (1998): 677-687. OCE. "OCE’s Centre for Commercialization of Research (CCR) and Larta Institute initiate cross-border
agreement to accelerate commercial growth of innovative companies." Toronto, March 27, 2012.
OECD and Eurostat. Oslo Manual. Paris: OECD, 2005. Rennie, Michael. "Born global." McKinsey Quarterly, November 1993. Thomas, Mario. "Born Globals." Madrid, 2012. Vincett, Paul S. "The eocnomic impacts of academic spin-off companies, and their implication for public
policy." Research Policy, 2010: 736-747.

Economic Impact of the Centre for Commercialization of Research 61
Appendix A: Calculation of Spin-off Impact
Induced economic impact multiplier
The induced economic impact arises when households that earn income at the direct and indirect impacts stages re-spend their income throughout the economy. While Statistics Canada’s input-output tables do provide the basis for calculating the indirect economic impact of an economic shock, they do not permit one to directly calculate the induced economic impact. In the absence of multipliers from Statistics Canada, we developed a simple approach for deriving an induced economic impact multiplier, which follows the general principle of induced economic impacts.
As noted, the induced economic impact arises from re-spending that occurs in the economy. This rate of re-spending is a function of the marginal propensity to consume (MPC) within an economy. That is, the percentage of total income that households spend on the purchase of goods and services. For example, if households’ MPC is 0.7 then they will spend 70% of their income on the purchase of goods and services. The recipients of the income from these purchases will then spend 70% of their income on the purchases of goods and services, and so on. The resulting mathematical series, 0.7×0.7×0.7×0.7×…, can be expressed as an infinite geometric sum that is equal to 1/(1-0.7), or approximately 3.33.
With an estimate of the MPC, one can derive an induced impact multiplier by using the following formula: 1/(1-MPC). We use this approach with an additional adjustment for the marginal propensity to import (MPM) to arrive at an induced impact multiplier for the Canadian economy.
Based on data from the Statistics Canada I-O tables, we determined that the MPC for Canada is 0.56 and the MPM is 0.36. Based on these data, we used the following formula to arrive at the induced impact multiplier of 1.25.
1
1
1
1 0.56 0.36
10.8
1.25
We applied this multiplier to the total wages generated at the direct and indirect stages of the economic impact to arrive at an estimate of the induced impact output. This induced impact output was then converted to GDP using the economy-wide GDP-to-output ratio (0.50) and converted to wages using the economy-wide wages-to-output ratio (0.27). Induced impact employment was estimated by dividing the estimate of total induced impact wages by an average salary of $45,000.
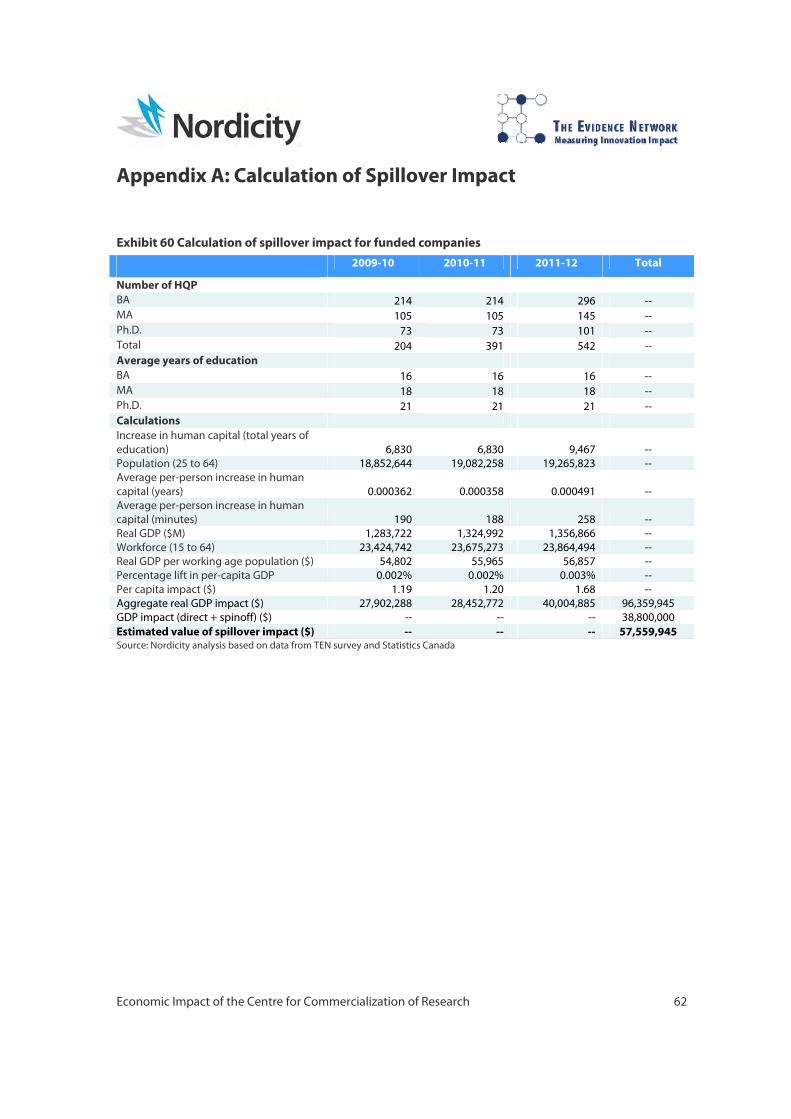
Economic Impact of the Centre for Commercialization of Research 62
Appendix A: Calculation of Spillover Impact
Exhibit 60 Calculation of spillover impact for funded companies 2009-10 2010-11 2011-12 Total
Number of HQP BA 214 214 296 -- MA 105 105 145 -- Ph.D. 73 73 101 -- Total 204 391 542 -- Average years of education BA 16 16 16 -- MA 18 18 18 -- Ph.D. 21 21 21 -- Calculations Increase in human capital (total years of education) 6,830 6,830 9,467 -- Population (25 to 64) 18,852,644 19,082,258 19,265,823 -- Average per-person increase in human capital (years) 0.000362 0.000358 0.000491 -- Average per-person increase in human capital (minutes) 190 188 258 -- Real GDP ($M) 1,283,722 1,324,992 1,356,866 -- Workforce (15 to 64) 23,424,742 23,675,273 23,864,494 -- Real GDP per working age population ($) 54,802 55,965 56,857 -- Percentage lift in per-capita GDP 0.002% 0.002% 0.003% -- Per capita impact ($) 1.19 1.20 1.68 -- Aggregate real GDP impact ($) 27,902,288 28,452,772 40,004,885 96,359,945 GDP impact (direct + spinoff) ($) -- -- -- 38,800,000 Estimated value of spillover impact ($) -- -- -- 57,559,945Source: Nordicity analysis based on data from TEN survey and Statistics Canada

Economic Impact of the Centre for Commercialization of Research 63
Exhibit 61 Calculation of spillover impact for non-funded companies 2009-10 2010-11 2011-12 Total
Number of HQP BA 1,408 1,408 2,907 -- MA 497 497 1,026 -- Ph.D. 304 304 627 -- Total 1,150 2,208 4,560 -- Average years of education BA 16 16 16 -- MA 18 18 18 -- Ph.D. 21 21 21 -- Calculations Increase in human capital (total years of education) 37,840 37,840 78,147 -- Population (25 to 64) 18,852,644 19,082,258 19,265,823 -- Average per-person increase in human capital (years) 0.002007 0.001983 0.004056 -- Average per-person increase in human capital (minutes) 1,055 1,042 2,132 -- Real GDP ($M) 1,283,722 1,324,992 1,356,866 -- Workforce (15 to 64) 23,424,742 23,675,273 23,864,494 -- Real GDP per working age population ($) 54,802 55,965 56,857 -- Percentage lift in per-capita GDP 0.012% 0.012% 0.024% -- Per capita impact ($) 6.60 6.66 13.84 -- Aggregate real GDP impact ($) 154,595,378 157,645,392 330,227,286 642,468,055 GDP impact (direct + spinoff) ($) -- -- -- 408,300,000 Estimated value of spillover impact ($) -- -- -- 234,168,055Source: Nordicity analysis based on data from TEN survey and Statistics Canada