Embed Size (px)
Citation preview

The Economic Impact of
St. Ambrose University
Prepared by
Strategic Economics Group
Des Moines, Iowa
February, 2013
www.economicsgroup.com

The Economic Impact of St. Ambrose University February, 2013
Strategic Economics Group Page 1
Executive Summary
The economic impact of St. Ambrose University on the economy of the Quad-Cities has been
substantial. The University enriches the cultural and social environment of the metro area. It
provides an opportunity for area workers to upgrade their skills and increase their productivity. It
provides developers with an asset to attract new residents and businesses. In addition to all of these
things, St. Ambrose hires workers, buys supplies, builds new facilities, attracts visitors and retains
alumni in the Quad Cities. Our mission in this report is to document and estimate the economic
impact of these operations and purchases, payrolls and programs, and, of course, to include the local
spending by its faculty, staff and students.
In this report you will see that:
In 2012, St. Ambrose University created $188 million in business spending, $73 million
additional personal income and the addition of 1,913 jobs in the Quad Cities.
$117 million of that business spending was the result of the operations of St. Ambrose.
Student spending during their year at St. Ambrose resulted in $46.5 million of that business
spending.
The nearly 82,000 visitors to sports, arts, cultural and special events at St. Ambrose during
2012 spent about $5.9 million. Once that money entered that spending stream, it resulted in
$9 million of the total new business spending.
Over the past 10 years, St. Ambrose invested $89 million in new construction and renovation
of its physical plant. As a result, the region saw an average yearly bump of nearly $15 million
in new business spending.
By 2017, the increase in business activity will grow to $206 million; the increase in personal
income will be $75 million and the workforce will contain 2,082 additional jobs each year
reflecting the impact of St. Ambrose University.

The Economic Impact of St. Ambrose University February, 2013
Strategic Economics Group Page 2
The addition of a $30 million proposed athletic complex during its construction period will
generate an additional $50 million in business activity, $19 million in income and 378 new
jobs. Once it is completed, there will be additional spending associated with the operation of
the complex and the spending by the additional visitors that it will draw to the Quad Cities.
In 2012, the spending of St. Ambrose’s operations, students, visitors and construction activity
directly and indirectly generated about $356,000 in local option sales tax for the Quad Cities
region (about $138,000 for Davenport). St. Ambrose was also responsible for adding $2.8
million in property tax to the region (about $671,000 to Davenport).
By 2017, the spending of St. Ambrose’s operations, students, visitors and construction activity
directly and indirectly will generate about $443,000 in local option sales tax for the Quad
Cities region (about $171,000 for Davenport). St. Ambrose will also be responsible for adding
$3.5 million in property tax to the region (about $835,000 will go to Davenport).
The construction phase of the proposed athletic complex will generate an additional $18.8
million in income in the region, an additional $5.5 million in Davenport. As a result, it will
provide the region with about $29,000 in additional local sales tax revenue and $228,000 in
additional property tax. The share for Davenport would be an additional $11,000 in local sales
tax and about $55,000 in property tax.
Ongoing civic engagement by St. Ambrose students resulted in 61,425 hours of community
service during the 2011-12 academic year. These impressive numbers, as well as St. Ambrose’s
support of volunteering, service-learning and civic engagement, placed the university on the
President’s Higher Education Community Service Honor Roll for the third straight year.
In addition to these financial benefits, St. Ambrose provides an educational opportunity for
residents of the Quad Cities who account for 39% of its enrollment. When they graduate, 38%
of those students take local jobs, raise families and stay in the Quad Cities.

The Economic Impact of St. Ambrose University February, 2013
Strategic Economics Group Page 3
Introduction
The purpose of this study is to identify benefits that St. Ambrose University brings to the citizens and
businesses of the Quad Cities metro area. Usually that requires identifying the dollar impact of
constructing and maintaining buildings, operating programs, employing people, buying goods and
services and attracting visitors to the area. Those tasks are easy to inventory and to measure in
dollars and cents. The current study will do that.
In addition, there are many benefits that St. Ambrose provides to the community that are not as easy
to quantify but are perhaps just as important. These include the role that St. Ambrose plays in making
the Quad Cities a more complete metropolitan community, the role that St. Ambrose plays in
providing customized training programs for local employers or the role that St. Ambrose plays in
providing cultural and arts events for the community.
Because St. Ambrose draws much of its enrollment from the Quad Cities population and generally
retains a large share of the graduates close to home, it continually reinvests in the human capital skill-
base of the region. Thus, St. Ambrose is a long-term asset that pays dividends to the communities and
businesses in the area. These benefits are important to the quality of life even if we cannot measure
them in dollars and cents. For that reason, we have also included that additional discussion in this
study.
St. Ambrose Operations – the University as an Enterprise and an Employer In addition to being an educational institution, St. Ambrose is a substantial employer and purchaser of
goods and services. In 2012, the University expenditure budget was nearly $88 million, $38 million of
which was for faculty and staff. The payroll included 207 full-time faculty, 192 part-time faculty and
other employees and 297 full-time staff (total payroll estimated at 600 full time equivalent positions).
The University spent nearly $8 million to maintain their physical plant, $3 million for office supplies
and to run their student bookstore and more than $10 million in administrative and program costs.
Most of those dollars were spent locally. Of the nearly $88 million, about $24 million was a pass

The Economic Impact of St. Ambrose University February, 2013
Strategic Economics Group Page 4
through of grants and scholarships. The remaining $63.5 million was the direct impact of the
operations of the University.
The University’s purchases from local vendors and payroll to local residents stimulate additional
spending in the Quad Cities economy. In order to estimate the economic impact of that stimulated
spending, we constructed a regional input-output model for the four counties in the metro area. This
model was built with components of the IMPLAN economic impact modeling system. We have
included a description of our methodology and of the IMPLAN system in Appendices A and B.
Based on the direct impact of the initial vender purchases and its compensation to local residents, the
economic effect on economic activity (output) was $117 million. Initially the impact on the business
community was $26.8 million in additional purchasing. That was then reflected in another $26.8
million in additional vendor purchases and payrolls as the money circulated through the local
economy as the consumer-related impact (Table 1).
The $63.5 million of direct spending generated a total of $117 million as a result of re-spending in the
local economy. That means the St. Ambrose University spending generated a multiplier effect of 1.84
when it circulated throughout the Quad Cities economy ($117 ÷ 63.5M = 1.84).
Table 1. Output Impact of St. Ambrose 2012 Operations Spending
Sectors Direct Impact
Business-Related Impact
Consumer-Related Impact
Total Impact
Agric & Mining $0 $219,076 $96,615 $315,690
Manufacturing $0 $1,925,359 $854,888 $2,780,247
Transportation/Utilities $0 $4,591,001 $1,065,321 $5,656,322
Whsle & Retail Trade $0 $1,383,914 $3,966,987 $5,350,900
Services $63,501,303 $14,796,433 $19,945,757 $98,243,493
Other $0 $3,915,535 $840,242 $4,755,777
Total $63,501,303 $26,831,318 $26,769,809 $117,102,430
A second way to look at the same economic impact is to follow the flow of personal income in Table 2.
The direct impact of $31.3 million will result in a total impact of $48.8 million of additional individual
income in the economy.

The Economic Impact of St. Ambrose University February, 2013
Strategic Economics Group Page 5
Table 2. Labor income Impact of St. Ambrose 2012 Operations Spending
Sectors Direct Impact
Business-Related Impact
Consumer-Related Impact
Total Impact
Agric & Mining $0 $34,984 $28,190 $63,174
Manufacturing $0 $299,294 $133,594 $432,888
Transportation/Utilities $0 $1,176,534 $315,765 $1,492,299
Whsle & Retail Trade $0 $612,935 $2,086,841 $2,699,776
Services $31,345,682 $4,424,008 $6,599,542 $42,369,231
Other $0 $1,426,105 $322,108 $1,748,213
Total $31,345,682 $7,973,860 $9,486,039 $48,805,581
A third way to look at the economic impact is to follow the growth of jobs. When people are
employed by St. Ambrose University, their paychecks create a direct demand for additional goods and
services in the local economy from vendors who will hire additional workers. Table 3 shows the jobs
impact and the sectors most affected.
Table 3. Jobs Impact of St. Ambrose 2012 Operations Spending
Sectors Direct Impact
Business-Related Impact
Consumer-Related Impact
Total Impact
Agric & Mining 0 1 1 2
Manufacturing 0 6 2 8
Transportation/Utilities 0 13 5 18
Whsle & Retail Trade 0 8 60 69
Services 600 157 178 935
Other 0 19 5 23
Total 600 203 252 1,054
These three tables reflect three different ways to track the impact of St. Ambrose University on the
four county Quad Cities metro area economy.
Table 4 and Chart 1 demonstrate the reason why the multiplier effect of the direct spending is so high
(1.84 times). It is because 47% of the goods and services purchased by St. Ambrose in 2012 were
from local vendors in the Quad Cities, keeping the re-spending local.

The Economic Impact of St. Ambrose University February, 2013
Strategic Economics Group Page 6
Table 4. St. Ambrose Vendor Purchases, 2012
Location of Vendor Vendor Purchases Share
Quad Cities Total $22,033,149 47%
Davenport $19,911,445 42%
Bettendorf $639,008 1%
Moline $536,552 1%
Rock Island $366,675 1%
Le Claire $175,411 0%
All Others $404,057 1%
Rest of Iowa $5,680,628 12%
Rest of Illinois $3,345,660 7%
Rest of the U.S. $16,141,402 34%
Total Purchases $47,200,838 100%
St. Ambrose University – From the Students to the Alumni
In 2012, St. Ambrose enrollment consisted of 3,671 students, 2,807 (76%) full-time and 864 (24%)
part-time, 2,794 (76%) undergraduates and 877 (24%) graduate students. The University
administration anticipates about a 10% increase in those numbers over the next ten years – with
Quad Cities Total 47%
Rest of Iowa 12%
Rest of Illinois
7%
Rest of the U.S. 34%
Chart 1. St. Ambrose Vendor Purchases, 2012

The Economic Impact of St. Ambrose University February, 2013
Strategic Economics Group Page 7
growth modestly weighted toward the full-time graduate students. Chart 2 shows the enrollment
trends for the past ten years and the ten-year projection.
During this same period of time, the total population base in the Quad Cities is expected to grow
modestly even as the college-age demographic is expected to show a slight decline (Tables 5 and 6).
The enrollment projection provided St. Ambrose is reasonable in light of the demographic growth
projection in their primary market.
St. Ambrose students are heavily drawn from the Quad Cities metro counties. Table 5 shows that 39%
of the current student body came from residents in the Quad Cities – 94% from Iowa and Illinois.
0
500
1,000
1,500
2,000
2,500
3,000
3,500
4,000
4,500
2003 2005 2007 2009 2011 2013 2015 2017 2019 2021
Chart 2. St. Ambrose Enrollment, Historical and Projected
Grad-PT
Grad-FT
Undergrad-PT
Undergrad-FT

The Economic Impact of St. Ambrose University February, 2013
Strategic Economics Group Page 8
Table 5. Residence of St. Ambrose Students, 2012
Origin of Students Count Share
Quad Cities Total 1,420 39%
Scott 998 27%
Rock Island 301 8%
Henry 95 3%
Mercer 26 1%
Rest of Iowa 754 21%
Rest of Illinois 1,252 34%
Rest of the U.S. 224 6%
Total Enrollment 3,650 100%
Table 6. Quad Cities Metro Area Population Projections
Year Total Pop 18-24 Pop Employment
2003 372,975 34,633 224,249
2004 372,740 34,583 227,982
2005 372,876 34,244 231,713
2006 373,762 33,516 232,178
2007 375,121 33,435 233,568
2008 376,467 33,200 234,237
2009 378,108 33,289 225,320
2010 380,222 33,160 226,748
2011 381,051 32,947 229,215
2012 382,032 32,613 231,344
Projections
2013 383,076 32,372 233,844
2014 384,159 31,858 236,378
2015 385,266 31,204 238,953
2016 386,393 30,816 241,556
2017 387,577 30,442 244,185
2018 388,778 30,207 246,862
2019 389,995 30,280 249,568
2020 391,234 30,434 252,314
2021 392,467 30,894 255,091
2022 393,723 31,216 257,913
2003-12 Chg 2.4% -5.8% 3.2%
2012-22 Chg 3.1% -4.3% 11.5%
Source: Woods & Poole Economics, Inc.
The Economic Impact of St. Ambrose University February, 2013
Strategic Economics Group Page 9
Charts 3 and 4 show that within Iowa and Illinois, most of the enrollment in 2012 came from only five
counties.
Scott 57%
Linn 6%
Dubuque 5%
Clinton 5%
Muscatine 5%
All Others 22%
Chart 3. Students from Iowa
Cook 23%
Rock Island 18%
Du Page 8%
Henry 6%
Will 5%
All Others 40%
Chart 4. Students from Illinois

The Economic Impact of St. Ambrose University February, 2013
Strategic Economics Group Page 10
Now let’s look at the other end of the pipeline. The St. Ambrose alumni database shows an interesting
picture of where those students settle after they have graduated. Of the 23,476 currently listed, 38%
reside in the Quad Cities counties - 74% live in Iowa or Illinois (Table 7). Of course, job opportunities
play a large part in determining where graduates locate, but a substantial share of St. Ambrose
students came from and chose to stay in the Quad Cities area.
Table 7. Residence of St. Ambrose Alumni, 2012
Location of Alumni Count Share
Quad Cities Total 8,925 38%
Scott 6,119 26%
Rock Island 2,283 10%
Henry 415 2%
Mercer 108 0%
Rest of Iowa 4,279 18%
Rest of Illinois 4,047 17%
Rest of the U.S. 6,110 26%
Foreign 115 0%
Total Alumni 23,476 100%
Charts 5 and 6 demonstrate that a major portion of the St. Ambrose graduates reside in the Quad
Cities counties.

The Economic Impact of St. Ambrose University February, 2013
Strategic Economics Group Page 11
Scott 59%
Clinton 6%
Polk 5%
Linn 5%
Muscatine 4%
Johnson 4%
All Others 17%
Chart 5. Iowa Alumni Residence
Rock Island 33%
Cook 15%
Du Page 6%
Henry 6% Peoria
5%
Lake 3%
All Others 32%
Chart 6. Illinois Alumni Residence

The Economic Impact of St. Ambrose University February, 2013
Strategic Economics Group Page 12
What does all of this show? It shows that while St. Ambrose does attract students from outside of the
region, it dominantly provides an educational opportunity for residents of the Quad Cities. And while
many of its graduates do leave the region, the largest portion of them take jobs, raise families and stay
in the Quad Cities – retaining the benefit of their training and human capital development in the Quad
Cities region.
St. Ambrose Students are a substantial purchasing market
College students are a lucrative market. According to National Retail Federation annual purchasing
survey author Kathy Grannis, “… average college student's family will spend $616.13 on new apparel,
furniture for dorms or apartments, school supplies and electronics.” 1
“The average family will shell out $236.94 on computers, cell phones, MP3 players, cameras and other
electronics; down from the $266.08 estimated last year when spending on electronics reached an all-
time high. Other expenditures include shoes ($62.20), collegiate branded gear or supplies ($36.26)
and school supplies ($62.91). College students will spend significantly more on dorm or apartment
furnishings this year, signaling a change from last year when more students lived at home to save their
family money. Families are expected to dish out an average of $96.94 on bedding, microwaves, small
refrigerators and chairs, up from $80.06 last year.”
Table 8 shows the result from a national survey of college student spending patterns conducted by the
Bureau of Labor Statistics2 and for which we have inflation-adjusted to 2012 and 2017 projected
numbers.
1 Kathy Grannis, “Back to School Sales Up As Parents Replenish Children's Needs, According to NRF.” National
Retail Federation, July 15, 2010. 2 Geoffrey D. Paulin, “Expenditures of College-Age Students and Nonstudents”, Monthly Labor Review, July,
2001.

The Economic Impact of St. Ambrose University February, 2013
Strategic Economics Group Page 13
Table 8. Average U.S. Student Expenditures, 2012 and 2017 Dollars
Expenditure Category Percent 2012 2017
Total expenditures 100.0% $14,806 $16,370
Food 17.8% $2,631 $2,909
Food - outside of dining hall 4.5% $722 $799
Housing 26.7% $3,949 $4,367
Apparel and services 6.7% $997 $1,103
Transportation 11.5% $1,702 $1,882
Entertainment 6.5% $963 $1,065
Education 16.1% $2,385 $2,636
Travel and vacation 4.7% $699 $773
Other 10.0% $1,479 $1,635
Chart 7 shows the national distribution of college student spending. We have used this national
pattern to estimate the consumer spending of current St. Ambrose students.
Students make an important financial contribution to the local economy. During the 2012 academic
year, about 39% of St. Ambrose University’s students resided in the four Quad Cities counties. The
Housing 27%
Food 18%
Transport. 11%
Education 16%
Apparel & Services 7%
Entertain-ment 7%
Travel & Vacation 5%
Other 10%
Chart 7. College Student Spending Pattern, 2012

The Economic Impact of St. Ambrose University February, 2013
Strategic Economics Group Page 14
remaining 61% came from outside of the metro area and brought purchasing power with them. In
addition, the 1,420 students who lived within the metro area or who commuted also represented and
continue to represent a market to the extent that, were it not for St. Ambrose University, they might
have attended college elsewhere. In 2012, 45% of the students lived on campus in University
residence facilities (Table 9).
Table 10 applies the national student spending norms to the number of St. Ambrose students in the
various housing arrangements to establish an estimated spending pattern for St. Ambrose students
during 2012. We have excluded educational costs as they are already accounted for in our estimate of
operations costs. Likewise, we have excluded housing and some food costs in order to avoid double
counting when the student is living in a University-owned housing facility3.
Table 10. Estimated Expenditures by St. Ambrose Students, 2012
Budget Category
Student Spending Estimate,
2012 On Campus
Students
Off Campus Students -
Home
Off Campus Students -
Rental Total
Spending
Education $2,385 Excluded Excluded Excluded Excluded
Housing $3,949 Excluded Excluded $3,583,036 $3,583,036
Food $2,631/$722 $1,199,242 $2,901,132 $2,387,178 $6,487,552
Transportation $1,702 $2,827,022 $1,876,749 $1,544,271 $6,248,042
Apparel and services $997 $1,656,017 $1,099,365 $904,605 $3,659,987
Entertainment $963 $1,599,543 $1,061,874 $873,756 $3,535,173
Travel and vacation $699 $1,161,039 $770,768 $634,222 $2,566,029
Other $1,480 $2,458,280 $1,631,955 $1,342,845 $5,433,080
Total expenditures $14,806 $10,901,143 $9,341,843 $11,269,913 $31,512,899
3 The costs of university-owned student housing and the food costs for on-campus students have already been
included in the operations spending of the University. On-campus student food costs are an estimate of the cost of food eaten outside of the dining hall from the Gregory Paulin study (cited on p. 11).
Table 9. St. Ambrose Student Housing Arrangement, 2012
On Campus Students 1,661 45%
Off Campus Students - Home 1,103 30%
Off Campus Students - Rental 907 25%
All Students, 2012 3,671 100%

The Economic Impact of St. Ambrose University February, 2013
Strategic Economics Group Page 15
Excluding the direct cost of education and housing (for students living on campus or at home), we
estimate that the 3,671 St. Ambrose students added about $31.5 million to the local economy in 2012.
Table 11 shows that the indirect effects of the $31.5 million in direct student spending in the local
economy generated a total estimated $46.5 million in economic activity, $15.6 million in personal
income and an additional 630 jobs in the region (For detail tables see Appendix C).
St. Ambrose Visitors Impact the Local Economy
Visitors to the campus are also contributors to the local economy and support the tourism and
hospitality industry as well as area retailers — important sectors of the local economy. St. Ambrose
University, its sponsored events and its employees and students attracted nearly 82,000 visits to the
campus in 2012. These visitors from out-of-town attended the events and also spent money locally on
dining, lodging and retail shopping in nearby stores and entertainment venues (Table 12).
Table 12. St. Ambrose Event Visitor Attendance, 2012
Category
Local Metro Area
Nearby Commuters
Rest of Iowa/Illinois
Out-of-State & Foreign
Total Visitors
Registration, orientation, and admissions 1,993 338 2,477 261 5,070
Special events 1,400 238 1,741 183 3,562
Rogalski Center events 12,014 4,005 0 0 16,019
Arts/cultural events 6,499 2,166 0 0 8,665
Other ticketed events 2,672 891 0 0 3,562
Athletic events 33,653 8,974 2,244 0 44,870
Faculty hiring 0 0 0 42 42
Total 58,231 16,611 6,462 487 81,790
Table 11. St. Ambrose Student Spending Impact in 2012
Student Spending Output Income Jobs
Direct Effect $31,512,899 $10,415,808 500
Business-Related Indirect Impact $6,156,244 $2,145,751 50
Consumer-Related Indirect Impact $8,864,243 $3,038,882 81
Total Impact $46,533,387 $15,600,441 630
The Economic Impact of St. Ambrose University February, 2013
Strategic Economics Group Page 16
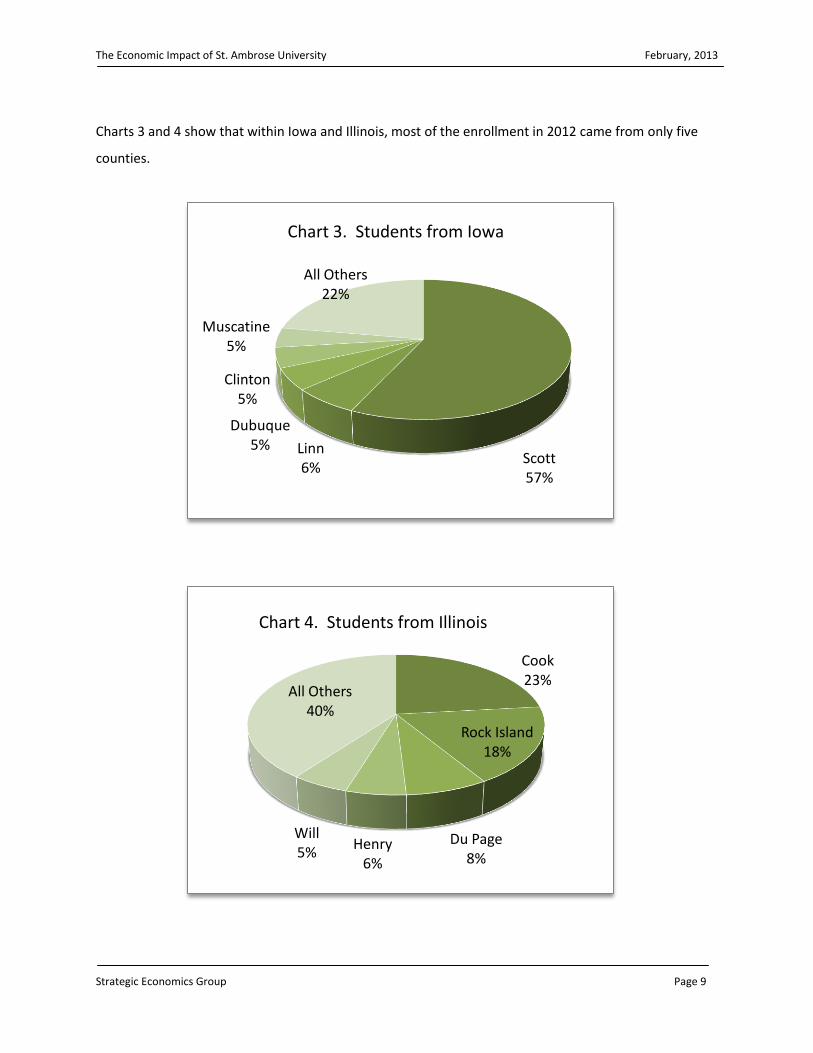
Table 13. St. Ambrose Visitor Spending Estimates by Event, 2012
Category Food
Spending Lodging
Spending Retail
Spending
Total Estimated Spending
Registration, orientation, and admissions $228,150 $285,082 $178,048 $691,280
Special events $160,290 $200,289 $115,919 $476,497
Rogalski Center events $720,855 $0 $256,304 $977,159
Arts/cultural events $389,925 $0 $138,640 $528,565
Other ticketed events $160,290 $0 $56,992 $217,282
Athletic events $2,019,150 $224,350 $794,199 $3,037,699
Faculty hiring $1,890 $4,200 $2,100 $8,190
Total $3,680,550 $713,921 $1,542,202 $5,936,673
In Table 13 we estimate that the total spending by visitors in the local economy in 2012 was more
than $5.9 million from the seven categories listed above.
Registration, orientation, admissions
11%
Special events
8%
RC events 17%
Arts/cultural events
9%
Other ticketed events
4%
Athletic events
51%
Faculty hiring 0%
Chart 8. St. Ambrose Visitor Spending

The Economic Impact of St. Ambrose University February, 2013
Strategic Economics Group Page 17
This direct spending generated secondary spending as the money continued to circulate in the local
economy, resulting in an increase of $8.9 million in economic activity, $2.7 million in wage and salary
income and an additional 110 local jobs. Those jobs were mostly in the services sectors in the area
economy. The detail tables showing the secondary impact can be found in Appendix C.
Table 14. St. Ambrose Visitor Spending Impact in 2012
Visitor Spending Output Income Jobs
Direct Effect $5,936,673 $1,667,057 85
Business-Related Indirect Impact $1,507,095 $522,517 12
Consumer-Related Indirect Impact $1,541,065 $527,612 14
Total Impact $8,984,832 $2,717,186 110
When asked for a few comments, Charlotte Doehler-Morrison, Vice President of Marketing and
Communications for the Quad Cities Convention and Visitors Bureau offered the following:
“St. Ambrose University is a valued partner of the Quad Cities Convention &
Visitors Bureau. Their arts and cultural offerings enrich our community for
visitors and residents alike.”
“Galvin Fine Arts Center brings nationally-recognized musical, dance and
theatrical performances that appeal to a variety of audiences. In turn, we
market these opportunities through our website, visitors guide, and email
campaigns. St. Ambrose University works to bring arts and culture to our
schools and works on collaborative projects with the Quad City Symphony.
These partnerships and collaborations build audiences and introduce people
to the wonderful opportunities to experience arts and culture here in the
Quad Cities.”

The Economic Impact of St. Ambrose University February, 2013
Strategic Economics Group Page 18
St. Ambrose Construction Spending is an Economic Stimulus
Since 2003, St. Ambrose University has invested more than $89 million in new buildings, renovation
and expansion of existing buildings, new equipment and furnishings and planned construction
projects.
Table 15. St. Ambrose Capital Investment in Buildings and Furnishings
Type
Historical From 2003 to
2012
Projected From 2013 to
2017
Building Construction/Purchase $51,928,235 $13,361,525
Renovation $11,501,388 $5,980,000
Other Building Additions/Improvements $2,009,670 $0
Furniture & Fixtures $3,764,446 $0
Other Equipment $6,045,156 $700,000
Land Acquisition $10,369,266 $1,500,000
Land Improvements $3,544,733 $1,400,000
Total $89,162,894 $22,941,525
The direct economic effect of this construction investment was a total of $89.2 million in spending in
the Metro area over the past decade - averaging nearly $9 million a year. The University
development plans indicate that an additional $22.9 million in new construction is on the drawing
board for the next five years (Table 15).
The construction during the past decade has stimulated additional economic activity in the
neighborhood of $15 million per year with income impacted by about $5.7 million per year. The
annual average increase in jobs was 118 per year over the past 10 years (Table 16).

The Economic Impact of St. Ambrose University February, 2013
Strategic Economics Group Page 19
The detail tables that show this component can be found in Appendix C.
St. Ambrose University – An Asset for Attracting Residents and Businesses
Through the arts, sports, education and community service – St. Ambrose University keeps the metro
area involved, brings world-renowned attractions to the region and is a contributor to the cultural
richness and the quality of life prized by local residents. St. Ambrose contributes to the cultural life of
the Quad Cities through performances, exhibitions, films, recitals and lectures by St. Ambrose faculty,
visiting lecturers, students and others. Theater, art, music and dance programs are offered to the
public throughout the school year.
$0
$2
$4
$6
$8
$10
$12
$14
$16
$18
$20
2003 2005 2007 2009 2011 2013 2015 2017
Mill
ion
s
Chart 9. St. Ambrose Capital Expenditures
Table 16. St. Ambrose Average Construction Spending Impact, 2003-2012
Construction Spending Output Income Jobs
Direct Effect $8,916,289 $3,592,650 68
Business-Related Indirect Impact $2,692,887 $1,039,316 20
Consumer-Related Indirect Impact $3,287,826 $1,126,405 30
Total Impact $14,897,002 $5,758,372 118

The Economic Impact of St. Ambrose University February, 2013
Strategic Economics Group Page 20
When asked for a few comments, Bill Martin, Senior Vice President – Economic Development for the
Quad Cities Chamber of Commerce had this to say:
“The economic impact of a university is significant, but there are, as you suggest, many
other unquantifiable advantages for a community. Here are a few ideas:
Administration, faculty and staff provide immeasurable value in their service on
the boards of local government, non-profit and charitable organizations. A
perfect example is Sister Joan Lescinski, President of St. Ambrose University,
who serves on many boards, including Quad Cities First, the business
recruitment arm of the Quad Cities Chamber of Commerce.
In addition to providing their expertise, these administrators, faculty and staff
provide significant financial contributions to local causes.
Classes often take on projects for local businesses or non-profits, providing real-
world learning experience for the students and tremendous research expertise
for the local entities.
Many local businesses, including the Quad Cities Chamber and Quad Cities First,
use interns from St. Ambrose for special, intensive projects that could not
otherwise be completed.
St. Ambrose provides customized training for many local organizations and
companies.
Many companies consider the availability of continuing education (advanced
degrees, etc.) for their employees an important factor in deciding where to
locate new facilities.
Students bring a certain vitality to a community, increasing the demand for
entertainment, cultural and recreational activities.”
The Economic Impact of St. Ambrose University February, 2013
Strategic Economics Group Page 21
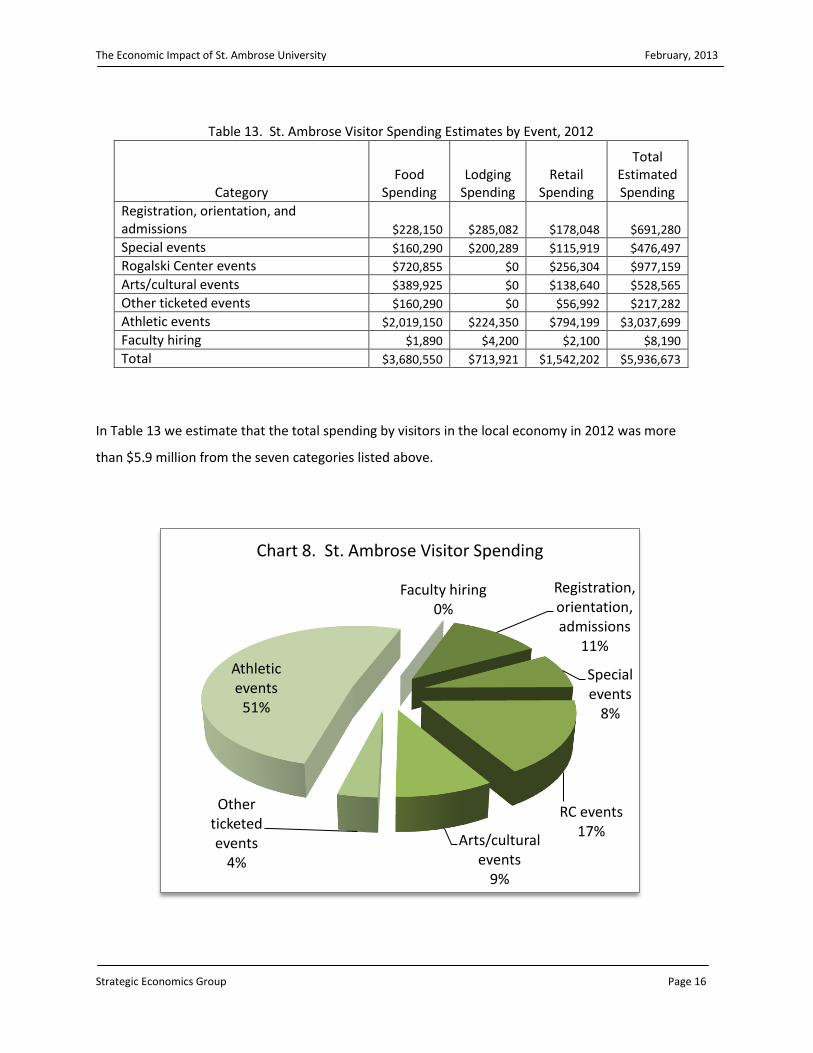
St. Ambrose University Enriches the Local Labor Market
St. Ambrose’s education programs are a durable asset for Quad Cities residents and employers. This
can be illustrated by comparing two tables and two figures. Table 17 shows the response from St.
Ambrose’s students recorded six months after their graduation. For those who responded to the
survey, nearly all of them were employed - some were also enrolled in graduate school. A large
portion of those indicated that their jobs are in the area of their major field (Table 17).
Table 17. Status of St. Ambrose Graduates After Six Months
Year Graduated
Survey Response
Attending Grad
School FT Currently Employed
Employed in Major
Field
2007 52.0% 16.0% 98.0% 90.0%
2008 50.0% 31.0% 99.0% 86.0%
2009 55.0% 30.0% 97.0% 84.0%
2010 48.0% 25.0% 99.0% 97.0%
2011 66.0% 21.0% 99.0% 83.0%
The St. Ambrose alumni database currently shows that the dominant fields employing alumni in the
Quad Cities area are business, sciences, education and public administration (Table 18).
Table 18. St. Ambrose Alumni Located in the Quad Cities
Major Occupation Count Share
Business, Economics, Finance and Management 3,955 44%
Science and Engineering 1,172 13%
Education 1,202 13%
Public Administration 908 10%
Mass Communication 353 4%
Nursing 334 4%
Information Technology 269 3%
Arts 245 3%
Languages 218 2%
Health and Fitness 202 2%
Pastoral 94 1%
Total 8,952 100%

The Economic Impact of St. Ambrose University February, 2013
Strategic Economics Group Page 22
This is also reflected in the customized training programs that St. Ambrose provides for many
employers in the metro area, including:
City of Bettendorf - Good to Great sessions
Diocese of Davenport - MBTI training
Hammond Henry Hospital - Teambuilding presentation
Kent Corporation - various
MetroLink- Workplace Harassment Training
MidAmerican Energy - Managing Across Generations
Mississippi Valley Regional Blood Center - Leaders/Supervisors Program
Modern Woodmen - Leadership Academy
Rock Island Arsenal - Arsenal Academy and Cost Benefit Analysis (world-wide
offerings)
Western Fraternal Life - Motivational training
St. Ambrose also pairs with more than 100 public and private sector employers to develop specialized
programs to build skills and provide continuing educational opportunities for the metro communities.
St. Ambrose is recognized for its niche programs including physical and occupational therapy, speech
language pathology, engineering, accounting and computer sciences.
Local economic development professionals have attested to the value that this service provides to a
community and how it helps to attract new businesses and new employees. While it is not possible to
quantify this benefit, we included it as one more valuable asset that St. Ambrose provides to the
region.
St. Ambrose University – A Look at the Economic Impact, 2017
By 2017, student enrollment will have grown by 6.6%, according to St. Ambrose officials. With that
growth St. Ambrose will need to increase its faculty and staff to maintain a comparable student-
teacher ratio4. Inflation will also increase the cost of all purchases by about 10.6% in that five-year
4 St. Ambrose University officials provided the student enrollment projections through 2022.

The Economic Impact of St. Ambrose University February, 2013
Strategic Economics Group Page 23
period.5 With these changes, we project that the cost of operations rise from $63.5 million in 2012 to
$72.8 million 2017 (Table 19).
Table 19. Growth Assumptions in the St. Ambrose Economic Impact Model
Component Actual 2012
Projected 2017 Difference
Percent Difference
Total Operating Expense $63,501,303 $72,798,995 $9,297,692 14.6%
Total Payroll Positions 600 678 78 13.0%
Fall Student Enrollment 3,671 3,914 243 6.6%
On Campus Students 1,661 1,771 110 6.6%
Off Campus Students - Home 1,103 1,176 73 6.6%
Off Campus Students - Rental 907 967 60 6.6%
Campus Visitors 81,790 87,202 5,412 6.6%
Campus Visitors Spending $5,936,673 $6,435,788 $499,115 8.4%
Construction Average Spending $8,916,289 $4,588,305 -$4,327,984 -48.5%
Student enrollment and construction spending projections for 2017 were provided by St. Ambrose
officials; the other projections were developed by the project staff. Table 21 and 22 summarize the
economic impact that we estimate for 2012 and the impact that we project for 2017, based on the
assumptions we identified. They include the same components and reflect the effect of the
multipliers generated by the IMPLAN model.
The University has plans for $22.9 million in capital expenditures through 2017 included in the 2013-
2017 construction impact. In addition, there is a proposed $30 million athletic complex that would
include a football/track stadium, softball complex and practice fields. Construction of this complex is
dependent on future fund raising. If the University is successful in raising the necessary funds, the
construction phase would have an additional nearly $50 million impact on the Quad City region,
adding $18.8 million in income and 378 new jobs. Of course, once built the additional visitor spending
associated with this complex will also have an impact on the local economy. Table 20 shows the
summary numbers for the construction of the complex. The detail tables can be found in Appendix C.
5 Inflation projections from 2012 to 2017 are based on the Budget of the U.S., Economic Assumptions, FY2013.

The Economic Impact of St. Ambrose University February, 2013
Strategic Economics Group Page 24
Tables 21 through 23 show the total 2012 and 2017 economic impact of St. Ambrose on the region –
not including the proposed athletic complex.
Table 21. Total Impact in the 2012 St. Ambrose Economic Impact Model
Component Output Income Jobs
Operations Spending $117,102,430 $48,805,581 1,054
Student Spending $46,533,387 $15,600,441 630
Visitors Spending $8,984,832 $2,717,186 110
Construction $14,897,002 $5,758,372 118
Total $187,517,651 $72,881,579 1,913
Table 22. Total Impact in the 2017 St. Ambrose Economic Impact Model
Component Output Income Jobs
Operations Spending $134,248,257 $51,217,465 1,192
Student Spending $53,607,624 $17,384,808 703
Visitors Spending $10,019,350 $3,155,115 126
Construction $7,657,539 $2,972,193 61
Total $205,532,770 $74,729,581 2,082
Table 20. Sports Complex Construction Spending Impact
Construction Spending Output Income Jobs
Direct Effect $30,000,000 $11,576,359 214
Business-Related Indirect Impact $9,142,115 $3,526,166 66
Consumer-Related Indirect Impact $10,721,577 $3,674,915 97
Total Impact $49,863,692 $18,777,441 378
Table 23. St. Ambrose Impact Difference between 2012 and 2017
Component Output Income Jobs
Operations Spending $17,145,827 $2,411,884 138
Student Spending $7,074,237 $1,784,367 73
Visitors Spending $1,034,518 $437,929 16
Construction -$7,239,462 -$2,786,179 -57
Total $18,015,119 $1,848,001 169

The Economic Impact of St. Ambrose University February, 2013
Strategic Economics Group Page 25
Table 23 shows the net difference between the 2012 economic impact and the impact projected for
2017. By 2017, the economic impact of St. Ambrose University in the Quad Cities area will increase by
$18 million, adding an additional $1.8 million to the personal income level of the community and
increasing the employment level in the region by another 169 jobs.
The addition of a new athletic complex produces the additional impact totals listed in Table 20
although we could not determine when the complex would be built.
St. Ambrose University – A Look at the Local Tax Impact
The IMPLAN model generated the estimates of personal income for the four component areas of this
study (operations, student, visitor and construction spending) and it also generated estimates of the
resulting state and local taxes associated with that spending. The sales and property taxes are
directly or indirectly related to the income and jobs provided by St. Ambrose.
Table 24. Tax Distribution Methodology
Personal Income, 2011 (apply to Scott County share)
Jurisdiction Value Share
Scott 7,748,606 48.2%
Henry 1,882,467 11.7%
Mercer 664,979 4.1%
Rock Island 5,774,185 35.9%
Total 16,070,237 100.0%
Population, 2011 (applied to Personal Income)
Scott County 167,095
Davenport city 100,802 60.33%
Taxable Retail Sales, 2012 (apply to Sales Tax)
Scott County 2,465,349,431
Davenport city 1,981,388,579 80.37%
Total Property Value, 2012 (apply to Property Tax)
Scott County 11,862,583,798
Davenport city 5,929,722,358 49.99%
Sources: Personal Income - U.S. Bureau of Labor Statistics, Population - Census Bureau, Taxable Retail Sales and Total Property Value - Iowa Department of Revenue

The Economic Impact of St. Ambrose University February, 2013
Strategic Economics Group Page 26
The Local Option Share (1/7) row refers to the fact that of the total sales taxes estimated in this
analysis, only 1/7 of the 7% tax goes to the city and county. The rest goes to the State.
Tables 25 and 26 include the taxes generated for the Quad Cities by each component in this study and
then break out the share associated with Scott County based upon Scott County’s share of the total
personal income for the four-county metro region. Table 24 provides the data that we used to break
out the tax revenue for the Quad Cities to the share that went to-, or will go to the City of Davenport.
Last, we allocated the Davenport share of the taxes collected in Scott County by the share of total
taxable retail sales (for sales tax) and share of total property value (for property tax).
Table 25. Tax Effect of St. Ambrose Economic Impact, 2012
Spending Component Total Income Sales Tax Property Tax
Operations $48,805,581 $1,202,545 $1,344,463
Student Spending $15,600,441 $936,401 $1,046,911
Visitor Spending $2,717,186 $182,506 $204,045
Construction $5,758,372 $170,178 $190,261
Total $72,881,579 $2,491,630 $2,785,680
Local Option Share (1/7) $355,947
Quad Cities Total $72,881,579 $355,947 $2,785,680
Scott County Share $35,128,921 $171,567 $1,342,698
Davenport Share $21,193,278 $137,888 $671,215
Table 26. Tax Effect of St. Ambrose Economic Impact, 2017
Spending Component Total Income Sales Tax Property Tax
Operations $51,217,465 $1,406,632 $1,572,636
Student Spending $17,384,808 $1,043,505 $1,166,656
Visitor Spending $3,155,115 $211,920 $236,931
Construction $2,972,193 $439,188 $491,017
Total $74,729,581 $3,101,245 $3,467,240
Local Option Share (1/7) $443,035
Quad Cities Total $74,729,581 $443,035 $3,467,240
Scott County Share $36,019,658 $213,543 $1,671,210
Davenport Share $21,730,660 $171,624 $835,438

The Economic Impact of St. Ambrose University February, 2013
Strategic Economics Group Page 27
Table 27 identifies the local tax impact of the proposed $30 million athletic complex. While the
numbers represent individual years and a growth curve can be drawn between the data for those two
years (although arguably only two points can hardly provide the basis for a trend line), the tax data for
the athletic complex could occur in one year or be spread over several. In either case it would not be
considered an on-going program with recurring spending. For that reason we did not add the
economic or the tax impact to the recurring construction spending.
Table 27. Tax Effect of St. Ambrose Economic Impact of Proposed Athletic Complex
Spending Component Total Income Sales Tax Property Tax
Athletic Complex $18,777,441 $203,582 $227,607
Total $18,777,441 $203,582 $227,607
Local Option Share (1/7) $29,083
Quad Cities Total $18,777,441 $29,083 $227,607
Scott County Share $9,050,726 $14,018 $109,707
Davenport Share $5,460,303 $11,266 $54,842
It is likely that once built and opened, the complex will require management and maintenance
spending and will most likely attract more visitors to the campus and the community. These will both
add to the economic impact of St. Ambrose University and its value to the region.

The Economic Impact of St. Ambrose University February, 2013
Strategic Economics Group Page 28
Summary In this study we examined four major components of spending in which St. Ambrose University affects
the Quad Cities economy: through its operations and purchases, through the spending pattern of its
students, through spending patterns of the visitors it attracts to the area for sports, arts, cultural and
educational events and through its capital expansion program. In 2012, St. Ambrose University
impacted $188 million in economic activity in the Quad Cities, resulting in a $73 million increase in the
personal income of residents and an increase of 1,913 local jobs.
Most of the jobs that St. Ambrose University affected in 2012 were in the professional and other
service sectors. Jobs in the retail and wholesale trade sector accounted for another 11% of the total.
Chart 10 shows the distribution of jobs in the Quad Cities economy that were affected by St. Ambrose
University in 2012. More details can be found in the IMPLAN tables in Appendix C.
We have shown in this study that St. Ambrose University primarily draws its students from the Quad
Cities counties. In 2012, those four counties were the source of 39% of the student body. Also, the
Quad Cities counties were the primary destination where St. Ambrose students located after they
Manufacturing 1%
Transportation/Utilities
8%
Whsle & Retail Trade 11%
Services 75%
Other 5%
Chart 10. Jobs Impacted by St. Ambrose, 2012

The Economic Impact of St. Ambrose University February, 2013
Strategic Economics Group Page 29
graduated. During 2012, 38% of the 23,476 St. Ambrose graduates listed in the alumni database listed
a current Quad Cities address. Thus, while St. Ambrose has a diverse enrollment, it substantially
serves a local market and its students generally keep that investment in human capital in the Quad
Cities. This study demonstrates that St. Ambrose University continues to have an important impact on
the metro area by increasing the pool of skilled workers that uniquely meet the needs of area
employers.
By 2017, the economic impact is expected to grow to $206 million, generating nearly $75 million in
personal income and creating 2,082 local jobs in the Quad Cities. With the construction of the
construction of a new athletic complex, those numbers will grow during the construction phase by
another 25% (tables 28-30).
Table 28. St. Ambrose Total Spending Impact in 2012
Total Spending Output Income Jobs
Direct Effect $109,867,164 $47,021,196 1,252
Business-Related Indirect Impact $37,187,544 $11,681,445 284
Consumer-Related Indirect Impact $40,462,943 $14,178,938 377
Total Impact $187,517,651 $72,881,579 1,913
Table 29. St. Ambrose Total Spending Impact in 2017
Total Spending Output Income Jobs
Direct Effect $120,410,935 $48,297,867 1,365
Business-Related Indirect Impact $41,069,099 $11,956,739 311
Consumer-Related Indirect Impact $44,052,736 $14,474,975 406
Total Impact $205,532,770 $74,729,581 2,082
Table 30. Sports Complex Construction Spending Impact
Construction Spending Output Income Jobs
Direct Effect $30,000,000 $11,576,359 214
Business-Related Indirect Impact $9,142,115 $3,526,166 66
Consumer-Related Indirect Impact $10,721,577 $3,674,915 97
Total Impact $49,863,692 $18,777,441 378

The Economic Impact of St. Ambrose University February, 2013
Strategic Economics Group Page 30
Table 31 shows the estimated tax receipts that would result from the activities of St. Ambrose
University 2012 and those for 2017 and for the construction of the athletic complex. The Davenport
share of the sales taxes that resulted from all of the spending associated with St. Ambrose University
in 2012 was $137,888. The property tax impact in Davenport was $671,215. Even though St. Ambrose
property and purchases are generally exempt from these taxes, Table 31 shows that the impact of its
spending in the Davenport generates-, and will continue to generate substantial taxes for the city, the
county and the metro region.
Table 31. Tax Effect of St. Ambrose Economic Impact
Tax Effect in Year 2012
Jurisdiction Total Income Sales Tax Property Tax
Quad Cities Total $72,881,579 $355,947 $2,785,680
Scott County Share $35,128,921 $171,567 $1,342,698
Davenport Share $21,193,278 $137,888 $671,215
Tax Effect in Year 2017
Quad Cities Total $74,729,581 $443,035 $3,467,240
Scott County Share $36,019,658 $213,543 $1,671,210
Davenport Share $21,730,660 $171,624 $835,438
Tax Effect of Construction of the Athletic Complex
Quad Cities Total $18,777,441 $29,083 $227,607
Scott County Share $9,050,726 $14,018 $109,707
Davenport Share $5,460,303 $11,266 $54,842

The Economic Impact of St. Ambrose University February, 2013
Strategic Economics Group Page 31
Appendix A: Methodology
This study is primarily concerned with analyzing the demand-side effects of the University on the local
economy. It investigates the University’s effects on the area based on the various goods and services
that St. Ambrose University and its employees, students, vendors and visitors purchase locally. Those
effects are quantifiable. Supply-side effects, or the effects that the University has on the area
economy based on the resources it offers are also important to evaluate, although more difficult to
quantify. For example, the presence of dedicated centers of academic concentration and highly skilled
labor attracts increased business activity to the region.
By providing access to libraries, noncredit courses, continuing education opportunities and cultural
and athletic events, St. Ambrose University enhances the quality of life for all citizens of the region.
Such unmeasured benefits are likely to be even greater than the measured ones.
The methodology employed in this study involved examining data for four aspects of the activities of
the University:
1. University Operations – including the management, classroom teaching, operations and
maintenance of the service delivery
2. Student Spending – including the incidental consumption spending by students and their
families at retail and service businesses in the area
3. Visitor Spending – including university arts, theatre and cultural programs, academic support
centers and institutes, athletic and extra-curricular events and activities, visits by family
members and use of University facilities for community, civic and business functions
4. Building Expansion and Renovation Spending – including the construction of new student
housing and the renovation and expansion of classroom facilities
For each of these components and for the total of all the components, the project staff examined the
impact on the area economies using three metrics or indicators:
1. Output Production – a measure of the increased value of all goods, services and labor within
the service area because of this economic activity. At the national and state levels, it is the

The Economic Impact of St. Ambrose University February, 2013
Strategic Economics Group Page 32
equivalent of the growth in the Gross Domestic Product. At the local level it is often identified
with the increase in the value of business production or business spending.
2. Income – the measure of increased personal income as a result of this economic activity.
Personal income will be realized as spendable income as well as an increase in the value of
personal assets.
3. Jobs – the estimate of the full-time equivalent job growth that this activity generated.
In each case – output, income and jobs – the total impact is the sum of the following factors:
1. Direct Effect – the initial economic activity of the University that drives the subsequent effect
on other sectors of the economy.
2. Secondary Effects – the resulting business-related effect on the vendors and employees of the
University and the consumer-related consequence of added payrolls and increased vendor
purchases on other vendors in the surrounding community as a result of the direct effect. This
is often described as the growth that resulted from the “multiplier effect”.
The project staff analyzed operational, student and visitor and construction data and built economic
impact models for each of these four economic areas, as measured by each of the three metrics or
indicators (output, income and jobs), identifying the direct economic effect and the secondary impact
of that direct spending. The numbers were then routed through the IMPLAN Input-Output Model for
the four counties that make up the Quad Cities metro area. (See Appendix B for a more detailed
description of the IMPLAN model).
Figure 1 illustrates the structure of the analysis.

The Economic Impact of St. Ambrose University February, 2013
Strategic Economics Group Page 33
Figure 1. Structure of the Analysis
Data Input
Impact Outputs
University Operations
Direct Effect
Output
Business-Related Effect
Student Spending
Consumer-Related Effect
Direct Effect
Income
Visitor Spending
Business-Related Effect
Consumer-Related Effect
Direct Effect
Jobs
Construction Spending
Business-Related Effect
Consumer-Related Effect

The Economic Impact of St. Ambrose University February, 2013
Strategic Economics Group Page 34
Appendix B – IMPLAN Input-Output Model
The traditional indicators which economists use for measuring the economic importance of an activity
include the size of its workforce and payroll, its capital investment and its local purchase of goods and
services. Economists call these the ’direct expenditures’ or ‘direct effects’.
Direct effects refer to the operational characteristics (employment, payroll, sales) of the activities that
we studied. The secondary effects include two components: indirect effects and induced effects.
Indirect effects measure the value of supplies and services that were purchased as inputs by the
University from businesses and firms within the region. Induced effects occurred when workers in the
direct and indirect industries spent their earnings on goods and services from other vendors and
businesses within the region. Induced effects are also often called ‘household effects’. The total
economic impact is the aggregate of the direct, indirect and induced effects. It is the total effect on
the economy of transactions that are attributable to the initial direct economic activity of St. Ambrose
University.
But the workers and the vendors who receive those indirect and induced expenditures don’t bury
them in a mattress. They will spend some of the money, save some of it and thus begins the journey
by which the dollars travel through many hands before they finally leave the economic region.
Economists call this phenomenon the ‘multiplier effect’. The multiplier factor is calculated by dividing
the sum of the direct, indirect and induced effects by the direct effect.
The multiplier effect for any economy or industry is examined using an ‘input-output analysis’. The
tool was devised by the 1973 Nobel Prize winning economist Wassily Leontief. It uses a matrix that
measures inter-industry relations in an economy and shows how the output (sales) of one industry
becomes the input (purchases) for another. The most widely used regional input-output economic
impact tool is the IMPLAN model developed and distributed by Minnesota IMPLAN Group, Inc. (MIG).
According to MIG, the model is currently in use by more than 1,000 public and private institutions.
The Economic Impact of St. Ambrose University February, 2013
Strategic Economics Group Page 35
The project staff for this study employed the latest version of the IMPLAN model to determine the
total impact of the direct expenditures made by St. Ambrose University in 2009 and projected to occur
in 2015. The total impact includes the direct, indirect and induced economic effects.
The project team started by developing the spending profile of the University, as identified in its
operating budget. The team used the University’s total cost of service delivery as the direct effect
variable for the modeling of output, total employment as the direct effect variable for the modeling of
jobs and total payroll as the direct effect variable for the modeling of income.
In addition to the direct employment and payroll effects, the overall operations of the University
generate secondary impacts within the community as services and supplies are purchased and payroll
dollars get spent in local businesses. The project staff applied the IMPLAN statewide regional
economic input-output model, modified by staff at Iowa State University to determine the magnitude
of these secondary impacts.
The results of this Input-Output analysis are presented in the various tables found throughout this
report and in Appendix C.

The Economic Impact of St. Ambrose University February, 2013
Strategic Economics Group Page 36
Appendix C – IMPLAN Tables
Total Impact Tables, 2012:
Table C1. Output Impact of St. Ambrose 2012 Total Spending
Sectors Direct Impact
Business-Related Indirect Impact
Consumer-Related Induced Impact
Total Impact
Agric & Mining $0 $348,352 $145,047 $493,399
Manufacturing $0 $3,073,721 $1,284,741 $4,358,462
Transportation/Utilities $6,476,269 $5,581,879 $1,607,676 $13,665,823
Whsle & Retail Trade $9,944,205 $2,292,499 $5,976,429 $18,213,133
Services $84,530,401 $21,455,554 $30,175,737 $136,161,692
Other $8,916,289 $4,435,539 $1,273,313 $14,625,142
Total $109,867,164 $37,187,544 $40,462,943 $187,517,651
Table C2. Labor income Impact of St. Ambrose 2012 Total Spending
Sectors Direct Impact
Business-Related Indirect Impact
Consumer-Related Induced Impact
Total Impact
Agric & Mining $0 $67,986 $42,096 $110,082
Manufacturing $0 $503,784 $199,403 $703,188
Transportation/Utilities $3,529,926 $1,474,763 $471,650 $5,476,338
Whsle & Retail Trade $2,150,475 $1,035,287 $3,121,581 $6,307,342
Services $37,748,146 $6,920,639 $9,862,786 $54,531,571
Other $3,592,650 $1,678,986 $481,422 $5,753,058
Total $47,021,196 $11,681,445 $14,178,938 $72,881,579
Table C3. Jobs Impact of St. Ambrose 2012 Total Spending
Sectors Direct Impact
Business-Related Indirect Impact
Consumer-Related Induced Impact
Total Impact
Agric & Mining 0 2 1 3
Manufacturing 0 9 4 13
Transportation/Utilities 151 17 8 176
Whsle & Retail Trade 106 17 90 213
Services 926 218 267 1,411
Other 68 22 7 97
Total 1,252 284 377 1,913

The Economic Impact of St. Ambrose University February, 2013
Strategic Economics Group Page 37
Operations Tables, 2012:
Table C4. Output Impact of St. Ambrose 2012 Operations Spending
Sectors Direct Impact
Business-Related Indirect Impact
Consumer-Related Induced Impact
Total Impact
Agric & Mining $0 $219,076 $96,615 $315,690
Manufacturing $0 $1,925,359 $854,888 $2,780,247
Transportation/Utilities $0 $4,591,001 $1,065,321 $5,656,322
Whsle & Retail Trade $0 $1,383,914 $3,966,987 $5,350,900
Services $63,501,303 $14,796,433 $19,945,757 $98,243,493
Other $0 $3,915,535 $840,242 $4,755,777
Total $63,501,303 $26,831,318 $26,769,809 $117,102,430
Table C5. Labor income Impact of St. Ambrose 2012 Operations Spending
Sectors Direct Impact
Business-Related Indirect Impact
Consumer-Related Induced Impact
Total Impact
Agric & Mining $0 $34,984 $28,190 $63,174
Manufacturing $0 $299,294 $133,594 $432,888
Transportation/Utilities $0 $1,176,534 $315,765 $1,492,299
Whsle & Retail Trade $0 $612,935 $2,086,841 $2,699,776
Services $31,345,682 $4,424,008 $6,599,542 $42,369,231
Other $0 $1,426,105 $322,108 $1,748,213
Total $31,345,682 $7,973,860 $9,486,039 $48,805,581
Table C6. Jobs Impact of St. Ambrose 2012 Operations Spending
Sectors Direct Impact
Business-Related Indirect Impact
Consumer-Related Induced Impact
Total Impact
Agric & Mining 0 1 1 2
Manufacturing 0 6 2 8
Transportation/Utilities 0 13 5 18
Whsle & Retail Trade 0 8 60 69
Services 600 157 178 935
Other 0 19 5 23
Total 600 203 252 1,054

The Economic Impact of St. Ambrose University February, 2013
Strategic Economics Group Page 38
Student Spending Tables, 2012:
Table C7. Output Impact of St Ambrose 2012 Student Spending
Sectors Direct Impact
Business-Related Indirect Impact
Consumer-Related Induced Impact
Total Impact
Agric & Mining $0 $34,706 $31,063 $65,768
Manufacturing $0 $439,863 $276,507 $716,370
Transportation/Utilities $6,476,269 $631,209 $350,854 $7,458,331
Whsle & Retail Trade $8,402,004 $409,024 $1,292,561 $10,103,589
Services $16,634,627 $4,271,920 $6,631,492 $27,538,039
Other $0 $369,522 $281,768 $651,290
Total $31,512,899 $6,156,244 $8,864,243 $46,533,387
Table C8. Labor income Impact of St. Ambrose 2012 Student Spending
Sectors Direct Impact
Business-Related Indirect Impact
Consumer-Related Induced Impact
Total Impact
Agric & Mining $0 $7,343 $9,009 $16,351
Manufacturing $0 $80,462 $42,639 $123,101
Transportation/Utilities $3,529,926 $188,383 $100,987 $3,819,296
Whsle & Retail Trade $1,922,696 $187,964 $670,095 $2,780,755
Services $4,963,187 $1,505,717 $2,112,947 $8,581,851
Other $0 $175,881 $103,204 $279,086
Total $10,415,808 $2,145,751 $3,038,882 $15,600,441
Table C9. Jobs Impact of St. Ambrose 2012 Student Spending
Sectors Direct Impact
Business-Related Indirect Impact
Consumer-Related Induced Impact
Total Impact
Agric & Mining 0 0 0 0
Manufacturing 0 1 1 2
Transportation/Utilities 151 3 2 156
Whsle & Retail Trade 98 3 19 120
Services 251 40 57 347
Other 0 2 2 4
Total 500 50 81 630

The Economic Impact of St. Ambrose University February, 2013
Strategic Economics Group Page 39
Visitor Spending Tables, 2012:
Table C10. Output Impact of St. Ambrose 2012 Visitors Spending
Sectors Direct Impact
Business-Related Indirect Impact
Consumer-Related Induced Impact
Total Impact
Agric & Mining $0 $14,151 $5,553 $19,704
Manufacturing $0 $189,941 $49,076 $239,017
Transportation/Utilities $0 $165,757 $61,226 $226,983
Whsle & Retail Trade $1,542,202 $144,491 $228,583 $1,915,276
Services $4,394,471 $882,655 $1,148,287 $6,425,413
Other $0 $110,100 $48,340 $158,440
Total $5,936,673 $1,507,095 $1,541,065 $8,984,832
Table C11. Labor income Impact of St. Ambrose 2012 Visitors Spending
Sectors Direct Impact
Business-Related Indirect Impact
Consumer-Related Induced Impact
Total Impact
Agric & Mining $0 $2,785 $1,566 $4,351
Manufacturing $0 $32,195 $7,414 $39,609
Transportation/Utilities $0 $45,780 $17,545 $63,324
Whsle & Retail Trade $227,779 $63,674 $116,239 $407,692
Services $1,439,278 $318,651 $366,933 $2,124,861
Other $0 $59,432 $17,917 $77,349
Total $1,667,057 $522,517 $527,612 $2,717,186
Table C12. Jobs Impact of St. Ambrose 2012 Visitors Spending
Sectors Direct Impact
Business-Related Indirect Impact
Consumer-Related Induced Impact
Total Impact
Agric & Mining 0 0 0 0
Manufacturing 0 1 0 1
Transportation/Utilities 0 1 0 1
Whsle & Retail Trade 9 1 3 13
Services 76 9 10 95
Other 0 1 0 1
Total 85 12 14 110

The Economic Impact of St. Ambrose University February, 2013
Strategic Economics Group Page 40
Construction Spending Tables – 10-Year Total 2003-12:
Table C13. Output Impact of St. Ambrose Total 2003-12 Construction Spending
Sectors Direct Impact
Business-Related Indirect Impact
Consumer-Related Induced Impact
Total Impact
Agric & Mining $0 $804,199 $118,170 $922,369
Manufacturing $0 $5,185,581 $1,042,701 $6,228,282
Transportation/Utilities $0 $1,939,115 $1,302,748 $3,241,863
Whsle & Retail Trade $0 $3,550,695 $4,882,987 $8,433,682
Services $0 $15,045,453 $24,502,017 $39,547,470
Other $89,162,894 $403,823 $1,029,632 $90,596,349
Total $89,162,894 $26,928,866 $32,878,256 $148,970,016
Table C14. Labor income Impact of St. Ambrose Total 2003-12 Construction Spending
Sectors Direct Impact
Business-Related Indirect Impact
Consumer-Related Induced Impact
Total Impact
Agric & Mining $0 $228,742 $33,315 $262,056
Manufacturing $0 $918,327 $157,567 $1,075,894
Transportation/Utilities $0 $640,657 $373,528 $1,014,185
Whsle & Retail Trade $0 $1,707,128 $2,484,070 $4,191,198
Services $0 $6,722,632 $7,833,642 $14,556,274
Other $35,926,498 $175,679 $381,932 $36,484,109
Total $35,926,498 $10,393,165 $11,264,054 $57,583,717
Table C15. Jobs Impact of St. Ambrose Total 2003-12 Construction Spending
Sectors Direct Impact
Business-Related Indirect Impact
Consumer-Related Induced Impact
Total Impact
Agric & Mining 0 3 1 4
Manufacturing 0 14 3 17
Transportation/Utilities 0 11 6 17
Whsle & Retail Trade 0 40 73 113
Services 0 130 214 344
Other 679 3 6 688
Total 679 201 303 1,184
The Economic Impact of St. Ambrose University February, 2013
Strategic Economics Group Page 41
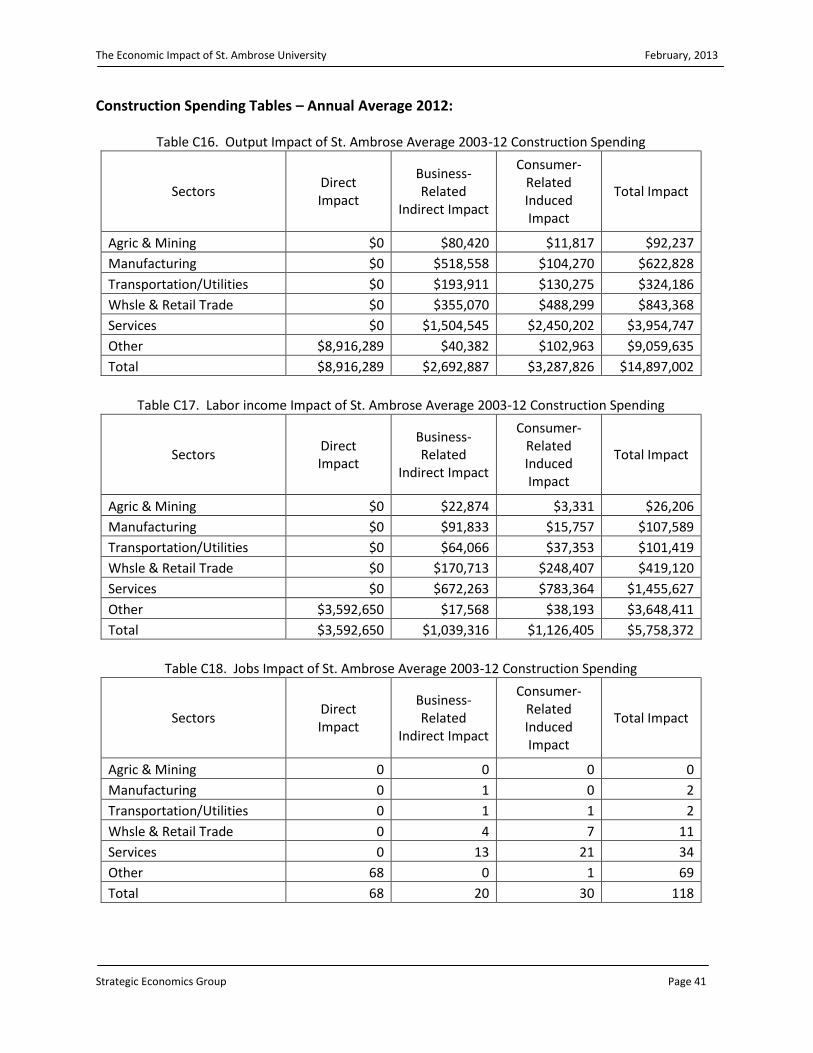
Construction Spending Tables – Annual Average 2012:
Table C16. Output Impact of St. Ambrose Average 2003-12 Construction Spending
Sectors Direct Impact
Business-Related
Indirect Impact
Consumer-Related Induced Impact
Total Impact
Agric & Mining $0 $80,420 $11,817 $92,237
Manufacturing $0 $518,558 $104,270 $622,828
Transportation/Utilities $0 $193,911 $130,275 $324,186
Whsle & Retail Trade $0 $355,070 $488,299 $843,368
Services $0 $1,504,545 $2,450,202 $3,954,747
Other $8,916,289 $40,382 $102,963 $9,059,635
Total $8,916,289 $2,692,887 $3,287,826 $14,897,002
Table C17. Labor income Impact of St. Ambrose Average 2003-12 Construction Spending
Sectors Direct Impact
Business-Related
Indirect Impact
Consumer-Related Induced Impact
Total Impact
Agric & Mining $0 $22,874 $3,331 $26,206
Manufacturing $0 $91,833 $15,757 $107,589
Transportation/Utilities $0 $64,066 $37,353 $101,419
Whsle & Retail Trade $0 $170,713 $248,407 $419,120
Services $0 $672,263 $783,364 $1,455,627
Other $3,592,650 $17,568 $38,193 $3,648,411
Total $3,592,650 $1,039,316 $1,126,405 $5,758,372
Table C18. Jobs Impact of St. Ambrose Average 2003-12 Construction Spending
Sectors Direct Impact
Business-Related
Indirect Impact
Consumer-Related Induced Impact
Total Impact
Agric & Mining 0 0 0 0
Manufacturing 0 1 0 2
Transportation/Utilities 0 1 1 2
Whsle & Retail Trade 0 4 7 11
Services 0 13 21 34
Other 68 0 1 69
Total 68 20 30 118

The Economic Impact of St. Ambrose University February, 2013
Strategic Economics Group Page 42
Total Impact Tables, 2017:
Table C19. Output Impact of St. Ambrose 2017 Total Spending
Sectors Direct Impact
Business-Related Indirect
Impact
Consumer-Related Induced
Impact Total Impact
Agric & Mining $0 $350,879 $157,747 $508,626
Manufacturing $0 $3,201,626 $1,397,864 $4,599,490
Transportation/Utilities $7,519,234 $6,290,107 $1,750,361 $15,559,702
Whsle & Retail Trade $10,878,222 $2,412,950 $6,500,894 $19,792,065
Services $97,425,175 $23,743,106 $32,858,603 $154,026,883
Other $4,588,305 $5,070,431 $1,387,267 $11,046,004
Total $120,410,935 $41,069,099 $44,052,736 $205,532,770
Table C20. Labor income Impact of St. Ambrose 2017 Total Spending
Sectors Direct Impact
Business-Related Indirect
Impact
Consumer-Related Induced
Impact Total Impact
Agric & Mining $0 $60,533 $42,980 $103,513
Manufacturing $0 $489,944 $203,600 $693,544
Transportation/Utilities $3,529,926 $1,532,574 $481,547 $5,544,047
Whsle & Retail Trade $2,420,064 $1,022,764 $3,186,648 $6,629,475
Services $40,486,530 $7,079,732 $10,068,696 $57,634,959
Other $1,861,347 $1,771,192 $491,503 $4,124,042
Total $48,297,867 $11,956,739 $14,474,975 $74,729,581
Table C21. Jobs Impact of St. Ambrose 2017 Total Spending
Sectors Direct Impact
Business-Related Indirect
Impact
Consumer-Related Induced
Impact Total Impact
Agric & Mining 0 2 1 3
Manufacturing 0 10 4 14
Transportation/Utilities 151 19 8 179
Whsle & Retail Trade 120 17 97 234
Services 1,058 240 288 1,586
Other 35 25 8 68
Total 1,365 311 406 2,082

The Economic Impact of St. Ambrose University February, 2013
Strategic Economics Group Page 43
Operations Tables, 2017:
Table C22. Output Impact of St Ambrose 2017 Operations Spending
Sectors Direct Impact
Business-Related Indirect Impact
Consumer-Related Induced Impact
Total Impact
Agric & Mining $0 $251,152 $110,761 $361,913
Manufacturing $0 $2,207,265 $980,059 $3,187,323
Transportation/Utilities $0 $5,263,203 $1,221,303 $6,484,506
Whsle & Retail Trade $0 $1,586,543 $4,547,822 $6,134,365
Services $72,798,995 $16,962,888 $22,866,162 $112,628,044
Other $0 $4,488,838 $963,268 $5,452,105
Total $72,798,995 $30,759,889 $30,689,374 $134,248,257
Table C23. Labor income Impact of St Ambrose 2017 Operations Spending
Sectors Direct Impact
Business-Related Indirect Impact
Consumer-Related Induced Impact
Total Impact
Agric & Mining $0 $36,489 $29,403 $65,891
Manufacturing $0 $312,166 $139,339 $451,505
Transportation/Utilities $0 $1,227,133 $329,345 $1,556,478
Whsle & Retail Trade $0 $639,296 $2,176,589 $2,815,885
Services $33,006,668 $4,614,271 $6,883,369 $44,504,307
Other $0 $1,487,438 $335,961 $1,823,398
Total $33,006,668 $8,316,792 $9,894,005 $51,217,465
Table C24. Jobs Impact of St Ambrose 2017 Operations Spending
Sectors Direct Impact
Business-Related Indirect Impact
Consumer-Related Induced Impact
Total Impact
Agric & Mining 0 1 1 2
Manufacturing 0 6 3 9
Transportation/Utilities 0 14 6 20
Whsle & Retail Trade 0 10 68 78
Services 678 177 202 1,057
Other 0 21 5 26
Total 678 229 284 1,192

The Economic Impact of St. Ambrose University February, 2013
Strategic Economics Group Page 44
Student Spending Tables, 2017:
Table C25. Output Impact of St Ambrose 3017 Student Spending
Sectors Direct Impact
Business-Related Indirect Impact
Consumer-Related Induced Impact
Total Impact
Agric & Mining $0 $40,131 $34,618 $74,749
Manufacturing $0 $508,038 $308,152 $816,190
Transportation/Utilities $7,519,234 $732,106 $391,019 $8,642,359
Whsle & Retail Trade $9,748,528 $472,921 $1,440,618 $11,662,067
Services $19,320,085 $4,958,287 $7,390,938 $31,669,310
Other $0 $428,917 $314,032 $742,949
Total $36,587,847 $7,140,400 $9,879,377 $53,607,624
Table C26. Labor income Impact of St. Ambrose 2017 Student Spending
Sectors Direct Impact
Business-Related Indirect Impact
Consumer-Related Induced Impact
Total Impact
Agric & Mining $0 $8,494 $10,040 $18,534
Manufacturing $0 $92,977 $47,520 $140,496
Transportation/Utilities $3,529,926 $218,450 $112,549 $3,860,925
Whsle & Retail Trade $2,230,811 $217,341 $746,856 $3,195,007
Services $5,748,838 $1,747,196 $2,354,891 $9,850,924
Other $0 $203,899 $115,023 $318,922
Total $11,509,574 $2,488,356 $3,386,878 $17,384,808
Table C27. Jobs Impact of St. Ambrose 2017 Student Spending
Sectors Direct Impact
Business-Related Indirect Impact
Consumer-Related Induced Impact
Total Impact
Agric & Mining 0 0 0 0
Manufacturing 0 2 1 3
Transportation/Utilities 151 3 2 157
Whsle & Retail Trade 113 4 22 139
Services 291 46 64 401
Other 0 3 2 5
Total 556 58 90 703

The Economic Impact of St. Ambrose University February, 2013
Strategic Economics Group Page 45
Visitor Spending Tables, 2017:
Table C28. Output Impact of St. Ambrose 2017 Visitors Spending
Sectors Direct Impact
Business-Related Indirect Impact
Consumer-Related Induced Impact
Total Impact
Agric & Mining $0 $16,538 $6,269 $22,807
Manufacturing $0 $224,076 $55,840 $279,916
Transportation/Utilities $0 $194,901 $70,809 $265,709
Whsle & Retail Trade $1,129,694 $166,986 $260,483 $1,557,163
Services $5,306,094 $1,061,562 $1,337,112 $7,704,768
Other $0 $132,153 $56,834 $188,986
Total $6,435,788 $1,796,215 $1,787,347 $10,019,350
Table C29. Labor income Impact of St. Ambrose 2017 Visitors Spending
Sectors Direct Impact
Business-Related Indirect Impact
Consumer-Related Induced Impact
Total Impact
Agric & Mining $0 $3,340 $1,818 $5,158
Manufacturing $0 $38,567 $8,610 $47,177
Transportation/Utilities $0 $53,979 $20,377 $74,355
Whsle & Retail Trade $189,253 $76,057 $135,022 $400,331
Services $1,731,025 $379,176 $426,183 $2,536,384
Other $0 $70,899 $20,811 $91,710
Total $1,920,278 $622,017 $612,820 $3,155,115
Table C30. Jobs Impact of St. Ambrose 2017 Visitors Spending
Sectors Direct Impact
Business-Related Indirect Impact
Consumer-Related Induced Impact
Total Impact
Agric & Mining 0 0 0 0
Manufacturing 0 1 0 1
Transportation/Utilities 0 1 0 1
Whsle & Retail Trade 7 1 4 12
Services 89 10 12 111
Other 0 1 0 1
Total 97 14 16 126

The Economic Impact of St. Ambrose University February, 2013
Strategic Economics Group Page 46
Construction Spending Tables – 10-Year Total 2013-17:
Table C31. Output Impact of St. Ambrose 2013-17 Construction Spending
Sectors Direct Impact
Business-Related Indirect Impact
Consumer-Related Induced Impact
Total Impact
Agric & Mining $0 $215,291 $30,492 $245,783
Manufacturing $0 $1,311,235 $269,067 $1,580,302
Transportation/Utilities $0 $499,484 $336,156 $835,640
Whsle & Retail Trade $0 $932,501 $1,259,852 $2,192,354
Services $0 $3,801,845 $6,321,956 $10,123,801
Other $22,941,525 $102,621 $265,671 $23,309,817
Total $22,941,525 $6,862,977 $8,483,193 $38,287,696
Table C32. Labor income Impact of St. Ambrose 2013-17 Construction Spending
Sectors Direct Impact
Business-Related Indirect Impact
Consumer-Related Induced Impact
Total Impact
Agric & Mining $0 $61,058 $8,596 $69,654
Manufacturing $0 $231,172 $40,659 $271,831
Transportation/Utilities $0 $165,062 $96,382 $261,444
Whsle & Retail Trade $0 $450,351 $640,904 $1,091,255
Services $0 $1,695,446 $2,021,272 $3,716,718
Other $9,306,735 $44,780 $98,546 $9,450,062
Total $9,306,735 $2,647,869 $2,906,359 $14,860,963
Table C33. Jobs Impact of St. Ambrose 2013-17 Construction Spending
Sectors Direct Impact
Business-Related Indirect Impact
Consumer-Related Induced Impact
Total Impact
Agric & Mining 0 1 0 1
Manufacturing 0 4 1 4
Transportation/Utilities 0 3 2 5
Whsle & Retail Trade 0 11 19 30
Services 0 33 55 88
Other 176 1 2 178
Total 176 51 78 306

The Economic Impact of St. Ambrose University February, 2013
Strategic Economics Group Page 47
Construction Spending Tables – Annual Average 2017:
Table C34. Output Impact of St. Ambrose Average 2017 Construction Spending
Sectors Direct Impact
Business-Related Indirect Impact
Consumer-Related Induced Impact
Total Impact
Agric & Mining $0 $43,058 $6,098 $49,157
Manufacturing $0 $262,247 $53,813 $316,060
Transportation/Utilities $0 $99,897 $67,231 $167,128
Whsle & Retail Trade $0 $186,500 $251,970 $438,471
Services $0 $760,369 $1,264,391 $2,024,760
Other $4,588,305 $20,524 $53,134 $4,661,963
Total $4,588,305 $1,372,595 $1,696,639 $7,657,539
Table C35. Labor income Impact of St. Ambrose Average 2017 Construction Spending
Sectors Direct Impact
Business-Related Indirect Impact
Consumer-Related Induced Impact
Total Impact
Agric & Mining $0 $12,212 $1,719 $13,931
Manufacturing $0 $46,234 $8,132 $54,366
Transportation/Utilities $0 $33,012 $19,276 $52,289
Whsle & Retail Trade $0 $90,070 $128,181 $218,251
Services $0 $339,089 $404,254 $743,344
Other $1,861,347 $8,956 $19,709 $1,890,012
$1,861,347 $529,574 $581,272 $2,972,193
Table C36. Jobs Impact of St. Ambrose Average 2017 Construction Spending
Sectors Direct Impact
Business-Related Indirect Impact
Consumer-Related Induced Impact
Total Impact
Agric & Mining 0 0 0 0
Manufacturing 0 1 0 1
Transportation/Utilities 0 1 0 1
Whsle & Retail Trade 0 2 4 6
Services 0 7 11 18
Other 35 0 0 36
Total 35 10 16 61

The Economic Impact of St. Ambrose University February, 2013
Strategic Economics Group Page 48
Construction Spending Tables – Proposed Athletic Complex:
Table C37. Output Impact of Athletic Complex Construction Spending
Sectors Direct Impact
Business-Related Indirect Impact
Consumer-Related Induced Impact
Total Impact
Agric & Mining $0 $225,111 $37,515 $262,626
Manufacturing $0 $1,793,684 $333,608 $2,127,293
Transportation/Utilities $0 $636,266 $423,750 $1,060,016
Whsle & Retail Trade $0 $1,064,364 $1,564,773 $2,629,138
Services $0 $5,282,992 $8,021,308 $13,304,300
Other $30,000,000 $139,697 $340,623 $30,480,320
Total $30,000,000 $9,142,115 $10,721,577 $49,863,692
Table C38. Labor income Impact of Athletic Complex Construction Spending
Sectors Direct Impact
Business-Related Indirect Impact
Consumer-Related Induced Impact
Total Impact
Agric & Mining $0 $66,562 $10,879 $77,441
Manufacturing $0 $322,576 $51,457 $374,033
Transportation/Utilities $0 $210,074 $122,010 $332,083
Whsle & Retail Trade $0 $517,933 $811,403 $1,329,335
Services $0 $2,349,448 $2,554,351 $4,903,799
Other $11,576,359 $59,574 $124,815 $11,760,749
Total $11,576,359 $3,526,166 $3,674,915 $18,777,441
Table C39. Jobs Impact of Athletic Complex Construction Spending
Sectors Direct Impact
Business-Related Indirect Impact
Consumer-Related Induced Impact
Total Impact
Agric & Mining 0 1 0 1
Manufacturing 0 5 1 6
Transportation/Utilities 0 4 2 6
Whsle & Retail Trade 0 11 24 35
Services 0 44 69 114
Other 214 1 2 217
Total 214 66 97 378

The Economic Impact of St. Ambrose University February, 2013
Strategic Economics Group Page 49
Appendix D - About the Research Team
Strategic Economics Group (SEG) is the region’s only locally- owned economic research consulting
firm. It has served businesses and government clients in Iowa and the Midwest since 2001. It was
founded by the former State Economist of Iowa, Harvey Siegelman. He assembled a team of some of
the sharpest and most able economists in the region. The SEG team develops economic impact
studies, cost-benefit models, management information systems and forensic projections.
SEG’s government clients include the Federal Reserve Bank of Chicago, U.S. Department of
Agriculture, U.S. Small Business Administration, Iowa Legislature, Iowa Department of Agriculture and
Land Stewardship, Iowa Department of Economic Development, Iowa Workforce Development and
the Treasurer of Iowa.
The list of SEG business clients include Iowa Farm Bureau Federation, Iowa Area Development Group,
Iowa Association of Business and Industry, Iowa Association of Realtors, Hubbell Realty, Iowa District
Export Council, Service Corps of Retired Executives, Urban Caucus, Chamber Alliance, Greater Dallas
County Development Alliance, Greater Des Moines Partnership, Iowa Association of Electric
Cooperatives, Iowa Utility Association, Alliant Energy, Mid-American Energy, Principal Financial,
American Home Mortgage Corporation, Iowa Credit Union League, Iowa Treasury Management
Association, Catholic Health Initiative, Iowans for a Better Future, Iowa Gaming Association,
Mediacom Communications, StrategicAmerica, Flynn Wright Advertising, Iowa Off-Highway Vehicle
Association and the West Metro Regional Airport Authority.
SEG’s academic clients include Drake University, Des Moines Area Community College, Iowa
Association of Community College Presidents, Iowa Association of Community College Trustees and
the Iowa Student Loan Liquidity Corporation.
Harvey Siegelman is the President and Senior Economic Analyst with Strategic Economics Group. Prior
to forming this research-based consulting firm, Mr. Siegelman was Iowa’s longest-serving State
Economist. He also served as Adjunct Professor of Economics at Drake University. His specialties
include project management, strategic planning and development and analysis of state and local
government finances. Siegelman earned his Master of Arts in Economics degree from Wichita State

The Economic Impact of St. Ambrose University February, 2013
Strategic Economics Group Page 50
University. Prior to his appointment as State Economist, he was a professor of economics at
University of Wisconsin-Whitewater Campus and Findlay University (Ohio). He also was a visiting
professor of economics at Wichita State University. From 1973-74, he was an economic advisor in the
Finance Ministry of the Government of Israel.
Daniel Otto is a Senior Economic Analyst with Strategic Economics Group. Otto is also Retired
Professor of Economics at Iowa State University in Ames, Iowa. He received his doctorate in
economics from Virginia Polytechnic Institute in 1981 and joined Iowa State University that same year
as an Associate Professor and Extension Economist. His research areas include Community and
Regional Economic Modeling and Policy Analysis, Economic and Fiscal Impact Analysis and Project
Evaluation. He has also worked with developing databases, economic forecasting and input-output
modeling activities.
Michael Lipsman is a Senior Economic Analyst with Strategic Economics Group. Lipsman has earned a
Masters in Community and Regional Planning and a Doctorate in Economics from Iowa State
University. Over the course of a 31 year professional career in Iowa State government he has worked
as a transportation planner, legislative analyst, and tax research analyst and manager.
For additional information contact:
Harvey Siegelman -- 515-246-0764
Visit us at:
www.economicsgroup.com