Embed Size (px)
Citation preview
The Economic Impact of QbD and other Considerations on Formulation Development
Ken Seufert Managing Director
MEGGLE USA, Inc. White Plains, NY 10606

R&D: new excipients/formulations for difficult drugs, complex drug combinations and release profiles
Technology Transfer from R&D to Manufacturing: more predictable product scale-up, early commitments to final formulation and process
Manufacturing & QC: process economies, improved quality, rationalization of plant and equipment, analysis and benchmarking
Regulatory: increased scrutiny of CMC sections, pre-approval inspection report cards
Clinical Development: compressed development and regulatory approval timelines, especially 505(b)2 filings

Reduce reliance on “processing” of formulations – Granulations can often be avoided
• Densification and increased particle size for flow • Achieve content uniformity through dry blending
Reduce excipient numbers – Simplify DOE – QA/QC benefits – Simplify stability trials – Streamline inventory management
Increased production rates, throughput, and yields – Lower cost of production leads to improved access to
medicine.

Mfg
Marketing
IT
Maintenance
Regulatory
Energy
Quality
Labor
API
R&D
Equipment
Process
Excipients

Pharma industry globally is roughly $1 Trillion industry.
USA is the world’s biggest consumer of prescription drugs, ~$340B – Followed by EU, then Japan
Only 15% (3 out of 20) of approved drugs produce enough revenue to cover development costs.
You need a big success, the “blockbuster” in order to survive. – Strategy is changing from high volume, endemic focus to
higher value, niche markets (cancer, lifestyle, etc.)
At the end of the day, pharma is a business and must be treated as such.

Branded drugs must get to market quickly. – Patent clock starts ticking as an NME
– Sacrifice in sales revenue comes at maturity
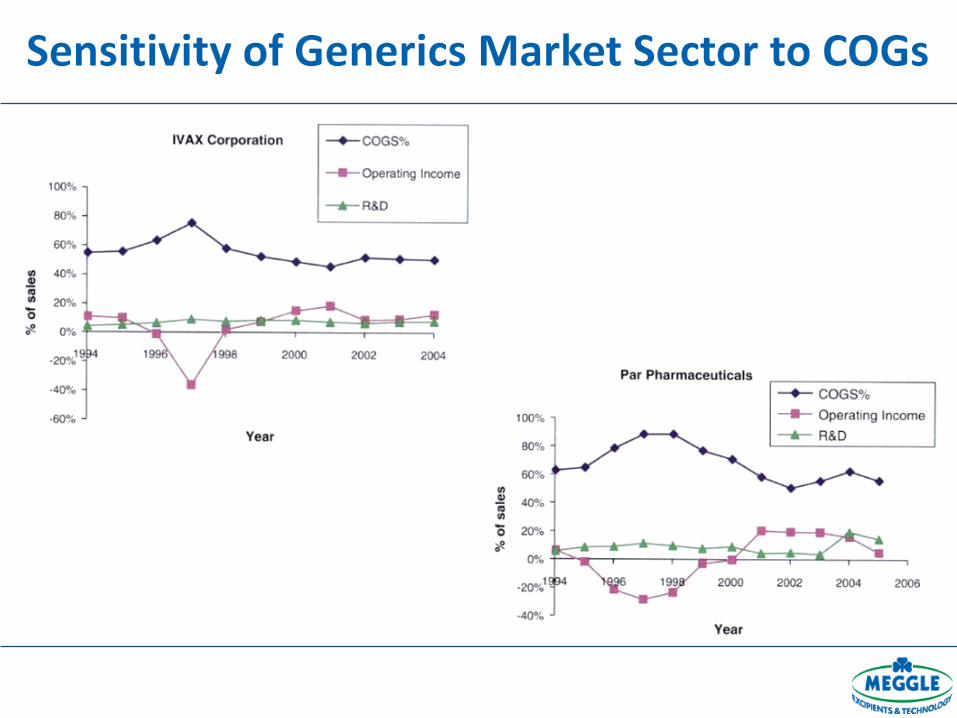
Generic drugs must control COGs – Every penny is valuable to the generics producer
Biologics – High R&D costs
– Low COGs
– Highly profitable

How does excipient selection affect revenue?
Actives dictate excipients. Excipients dictate processes.
Processes dictate COGs. COGs impact revenue.
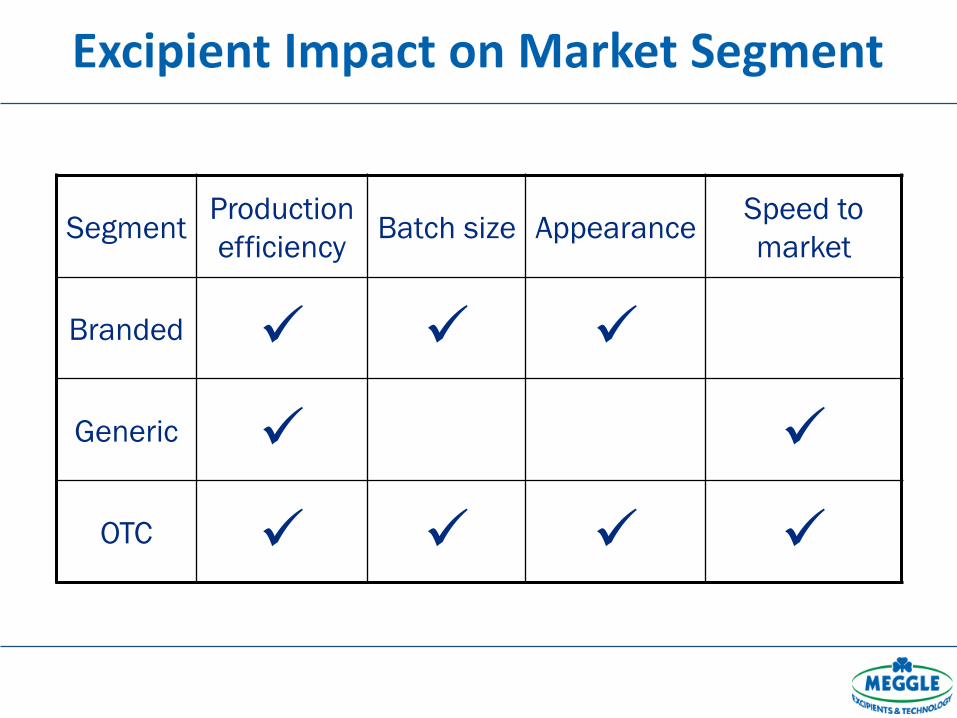
Segment Production
efficiency Batch size Appearance
Speed to
market
Branded
Generic
OTC

API
Mill
Blend
Blend
Dry Screen
Wet Screen
Intra-granular Excipients
Granulating Fluid
Granulator
Drying
Extra-granular Excipients Compaction
Tablet

API
Mill
Dry Screen
Compaction
Tablet Blend
Excipients
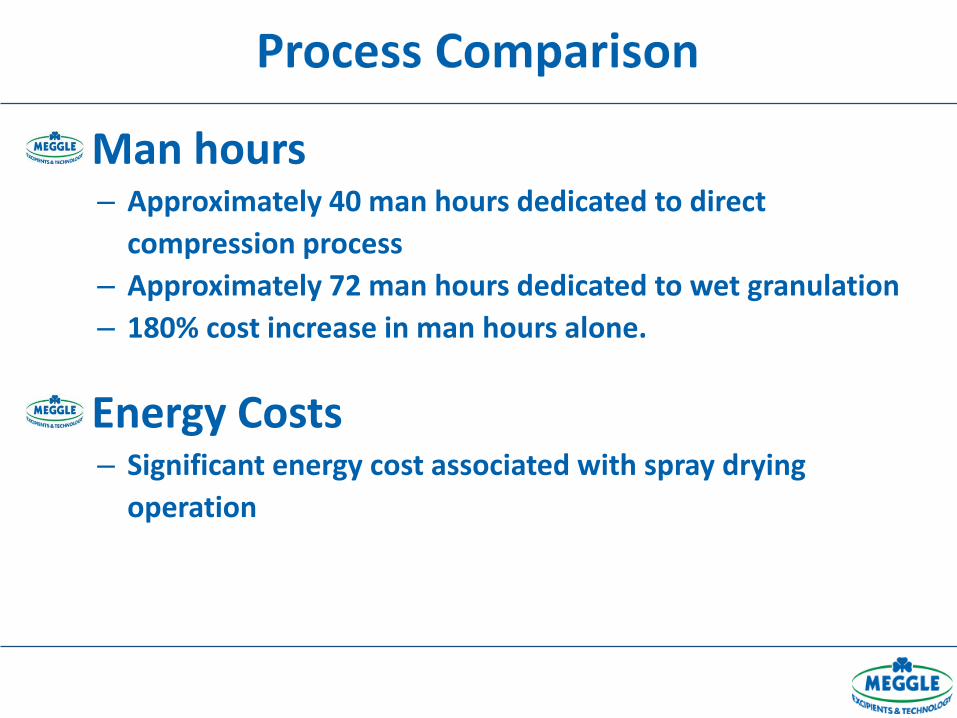
Man hours – Approximately 40 man hours dedicated to direct
compression process
– Approximately 72 man hours dedicated to wet granulation
– 180% cost increase in man hours alone.
Energy Costs – Significant energy cost associated with spray drying
operation

Process Relative Production
Cost/Batch
Direct compression blending and
tableting 1
Fluidized bed granulation and
tableting 1.5
High shear granulation and
tableting 2.2
Hot melt extrusion or other
complex process 2.4 +
* Based on typical cost of 0.5 million tablet batch. Processing costs vary with batch
size, equipment and formulation characteristics.
41%
36%
16%
7%
0%
10%
20%
30%
40%
50%
60%
70%
80%
90%
100%
Taxes
R&D
COGS
S&GA
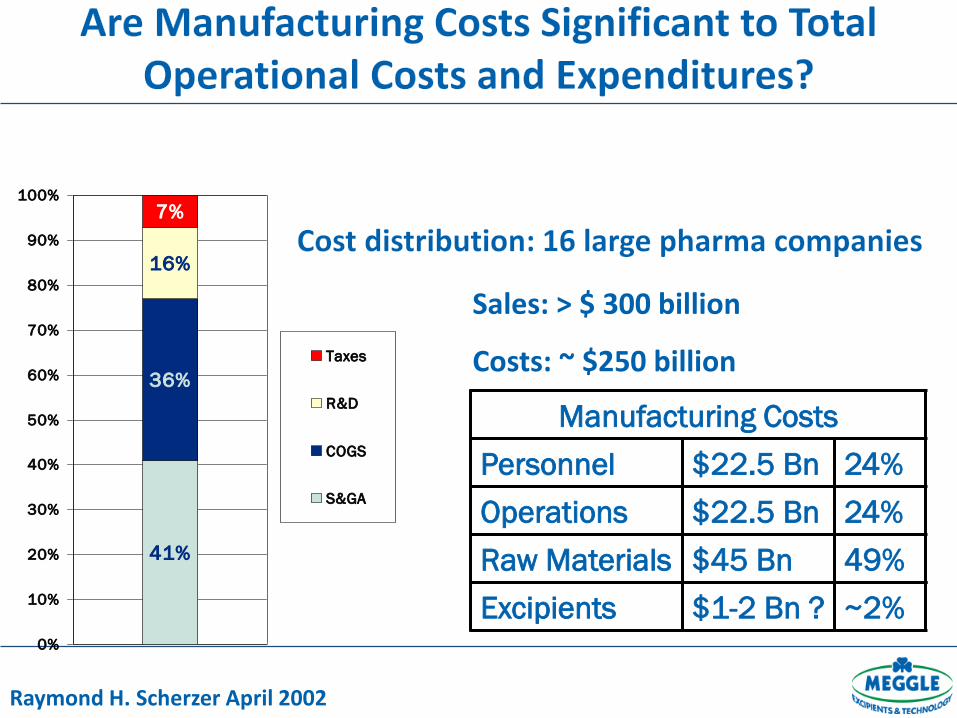
Raymond H. Scherzer April 2002
Sales: > $ 300 billion
Costs: ~ $250 billion
Manufacturing Costs
Personnel $22.5 Bn 24%
Operations $22.5 Bn 24%
Raw Materials $45 Bn 49%
Excipients $1-2 Bn ? ~2%

Developed software program that analyzed cost of formulation and process
Inputs for type of process, ingredients, labor, packaging, batch size, etc.
Considered conversion to DC formula with high functionality ingredients.
Output of savings: – Packaging size reduction + “trickle down effect” – Batch size improvement – Labor, energy savings – QA/QC costs – Speed

Customer used high functionality excipients to switch from wet granulation to direct compression. – Granulation and numerous blending steps eliminated
Saved over $1M
Energy, labor?
Where was the savings?
Tyvek
Bottom line – streamline your processes.

The formulator’s customer is manufacturing.
Focus on the process. – Excipients are cheap. – Labor can only be cut if you fire someone. – The process is ~50% of the COGs component.
Minimizing equipment, steps, and components in a process minimizes total cost.
Simple, but robust. Therefore there is a need for QbD.

Pharmaceutical industry lags in Quality Systems behind other industries
As of 2008, only 20 submissions included QbD elements (<10%)
By 2011, submissions with QbD increased to 50.
QbD is being thrust into the pharmaceutical landscape.
Does it have an ROI?
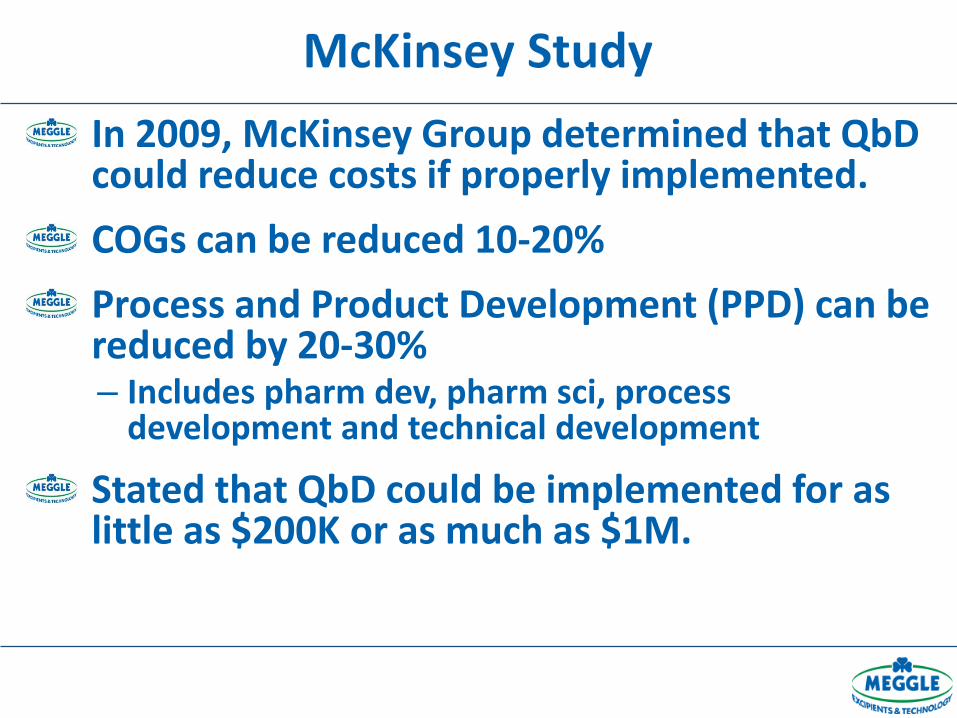
In 2009, McKinsey Group determined that QbD could reduce costs if properly implemented.
COGs can be reduced 10-20%
Process and Product Development (PPD) can be reduced by 20-30% – Includes pharm dev, pharm sci, process
development and technical development
Stated that QbD could be implemented for as little as $200K or as much as $1M.

Compiled all financial figures by analyzing 2012 Annual Reports – Revenues, earnings, Sales and General Admin
(SGA), COGs, R&D Costs, Taxes
Broke them out into market sectors – Branded, generic, biotech
Determined that PPD is approximately 15% of R&D costs
Only one generics company was in top 12 so searched out three others.

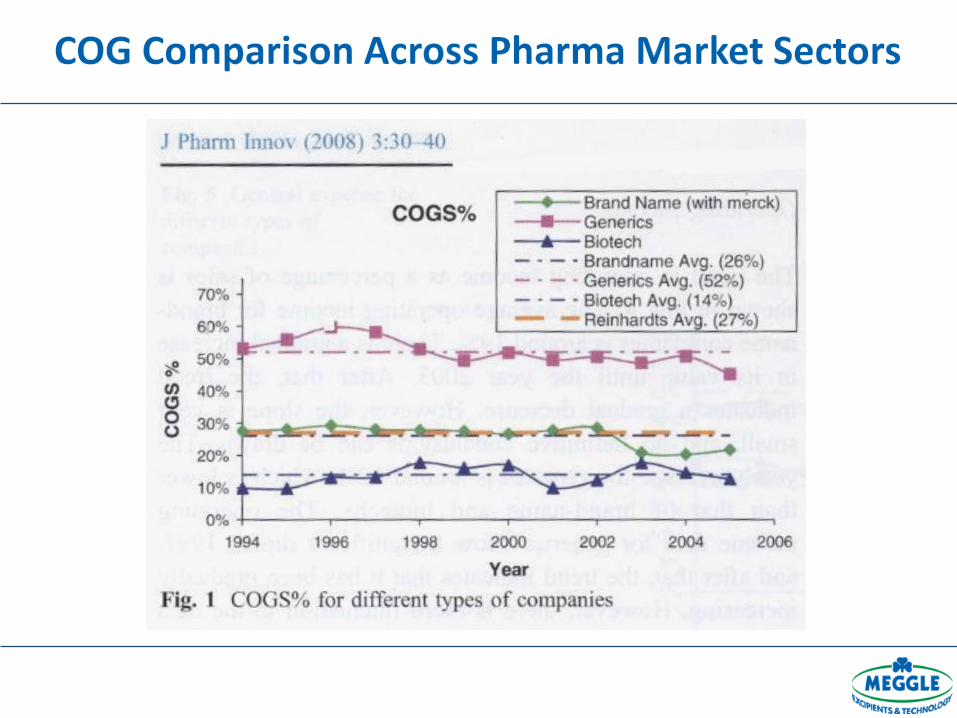
Re-established COGs as percent of revenue – Branded pharma – 26% – Generic – 50% – Biotech – 14%
Re-establish R&D Cost as percent of revenue – Branded Pharma – 19% – Generic – 7% – Biotech – 22%
From R&D, we can determine PPD
Applied McKinsey model to this information.

Top 12 pharma revenue: $241B Top 12 pharma COG: $60B Top 12 pharma R&D: $43B
Saving 10% on COG: $6B Saving 20% on PPD (which is 15% of R&D): $1.3B
Total Savings is 3% ($7.3/$241) What about the cost? What about the market?

Interviewed QbD experts from industry.
Few could quantify costs – Generally agreed with savings proposal by McKinsey – CMC sections grow appreciably
• FDA reviewers have to review additional data • Delays can ensue causing significant losses downstream
Some companies now have QbD Departments
Additional experimentation is required
Many adopt a ‘wait and see’ approach
Use QbD elements at critical stages – Have to consider the high cost of high failure rates – Wait until Phase IIb

Determining cost is difficult and highly varied.
Labor allocation has to be increased.
Other areas impacted – Process re-design – Design space – Control strategies – Process strategies – PAT implementation
Able to quantify a number of FTE (full time employee) hours
Able to quantify some additional equipment cost – Whether lab or production

Existing products face no additional QbD cost – Don’t touch what the FDA has already approved – Generics already have high COGs
• Any changes are immediately scrutinized.
QbD aspects will only be applied to existing products if – There is a compelling reason – IT IS BROKEN! – Scheduled re-design, re-location, revision…
Otherwise the approach is SUPAC.
Newer products will receive QbD throughout the product life cycle.
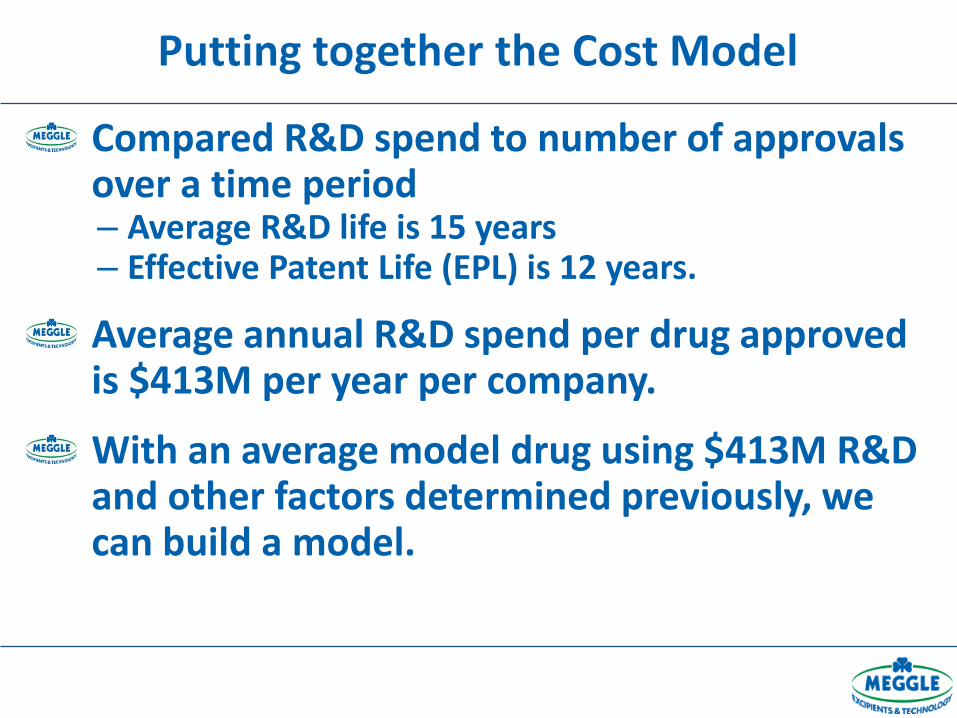
Compared R&D spend to number of approvals over a time period – Average R&D life is 15 years – Effective Patent Life (EPL) is 12 years.
Average annual R&D spend per drug approved is $413M per year per company.
With an average model drug using $413M R&D and other factors determined previously, we can build a model.

Average R&D cost: $413M
Average COGs: $578M
Product revenue at peak sales: $2,197M
Peak Sales Curve Factor: 75% – Accounts for starting sales at 0, ramp up in sales to
maturity.
Potential regulatory delay: 4 months
Additional employees: 5 at $100K each
Equipment cost: $800K
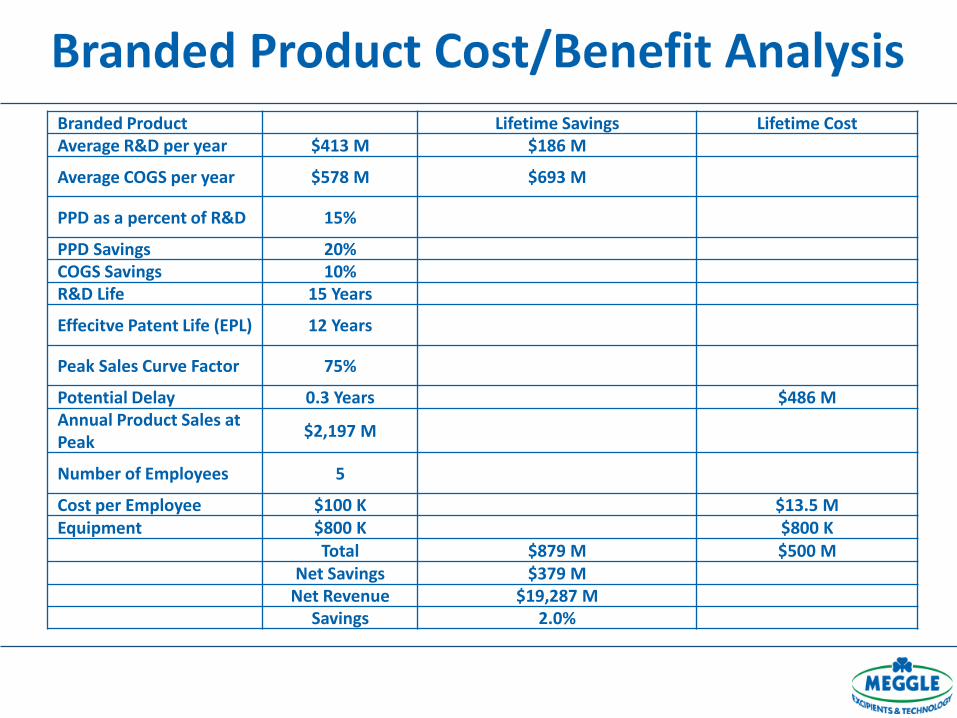
Branded Product Lifetime Savings Lifetime Cost Average R&D per year $413 M $186 M
Average COGS per year $578 M $693 M
PPD as a percent of R&D 15%
PPD Savings 20% COGS Savings 10% R&D Life 15 Years
Effecitve Patent Life (EPL) 12 Years
Peak Sales Curve Factor 75%
Potential Delay 0.3 Years $486 M Annual Product Sales at Peak
$2,197 M
Number of Employees 5
Cost per Employee $100 K $13.5 M Equipment $800 K $800 K
Total $879 M $500 M Net Savings $379 M
Net Revenue $19,287 M Savings 2.0%

Delays turned out to be the most critical component regarding return on investment in QbD. – Delays exceeding 5.25 months resulting in a loss. – Doubling labor from 5 employees to 10 only
resulted in a 0.1% reduction in ROI. – Capital equipment investment has no impact.
Bottom line – time to market is paramount for branded products.

Lifetime R&D support for generic products drops precipitously, only $1M per year per company.
R&D lifetime also drops to 5 years as companies want to invest as little as possible.
However, drug life span increases to 20 years.
Revenue may only be $15M per product due to increase competition and dilution of the market.
Fewer FTEs required. – Reduced to 2 FTEs.

Generic Product Lifetime Savings Lifetime Cost
Average R&D per year $1.0 M $150 K
Average COGS per year $7.5 M $15 M
PPD as a percent of R&D 15%
PPD Savings 20%
COGS Savings 10%
R&D Life 5 Years
Product Life Expectancy 20 Years
Annual Product Sales at Peak
$14.9 M
Number of Employees 2
Cost per Employee $100 K $5 M
Equipment $500 K $500 K
Total $15.1 M $5.5 M
Net Savings $9.6 M
Net Revenue $298 M
Savings 3.2%
COGs turned out to be the overall driving factor for generics – Reducing COG savings from 10% to 5% resulted in an
overall drop to 0.7% in total savings – Must achieve 3.5% savings in COGs to break even
PPD savings had little impact due to significant reduction in R&D costs.
Labor component had much bigger impact. – Increasing to 5 FTE’s, savings reduced to 0.7%
Equipment now impacts the equation.
Bottom line – “Cost is King” in generics
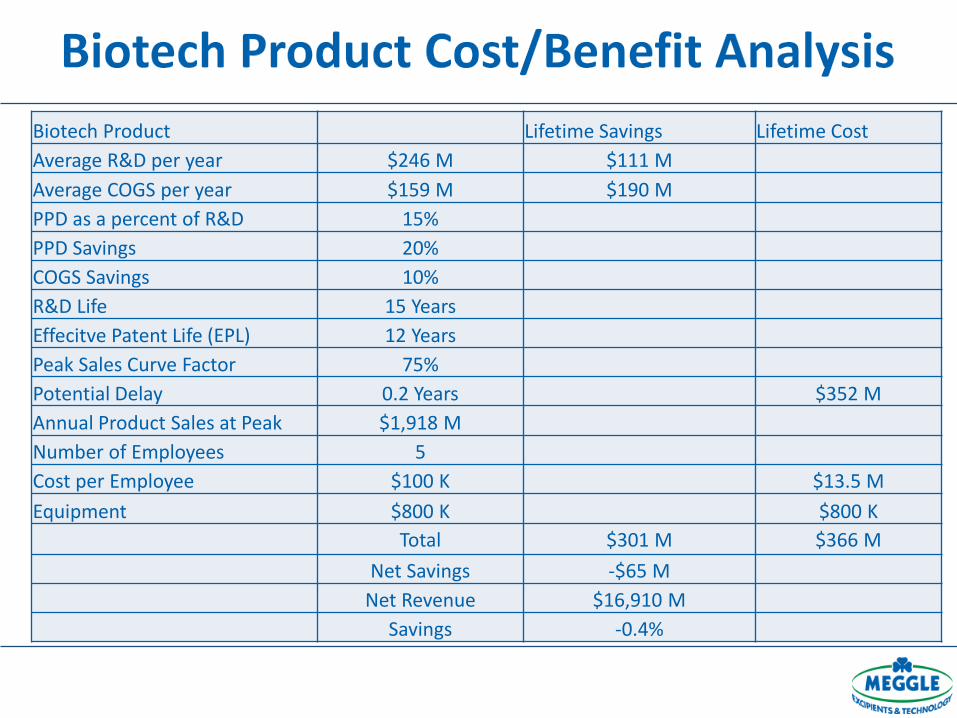
Biotech Product Lifetime Savings Lifetime Cost
Average R&D per year $246 M $111 M
Average COGS per year $159 M $190 M
PPD as a percent of R&D 15%
PPD Savings 20%
COGS Savings 10%
R&D Life 15 Years
Effecitve Patent Life (EPL) 12 Years
Peak Sales Curve Factor 75%
Potential Delay 0.2 Years $352 M
Annual Product Sales at Peak $1,918 M
Number of Employees 5
Cost per Employee $100 K $13.5 M
Equipment $800 K $800 K
Total $301 M $366 M
Net Savings -$65 M
Net Revenue $16,910 M
Savings -0.4%
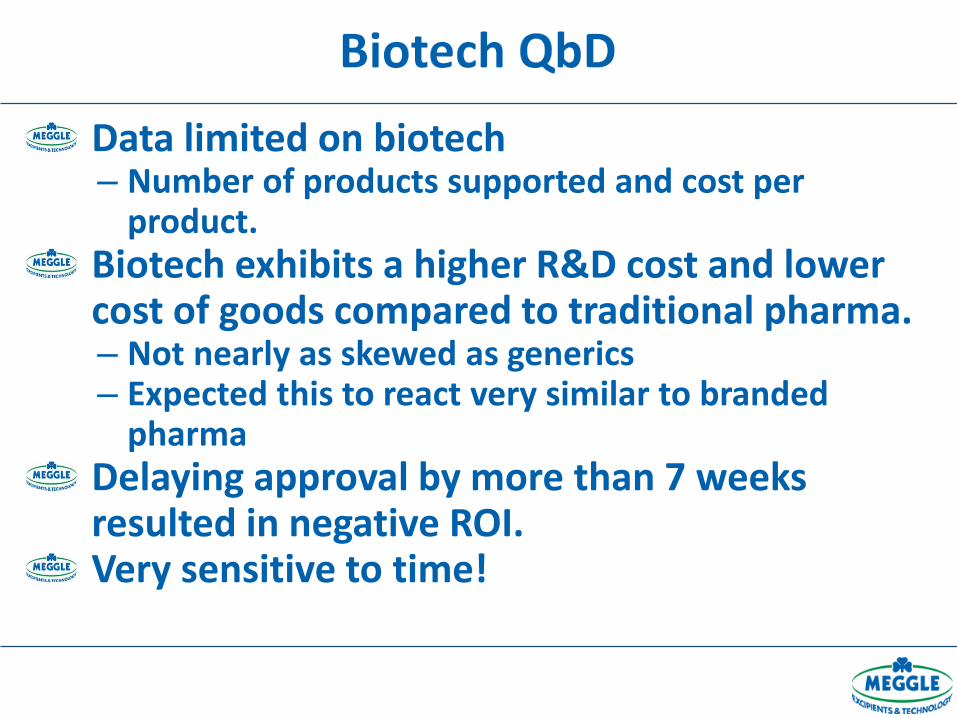
Data limited on biotech – Number of products supported and cost per
product. Biotech exhibits a higher R&D cost and lower cost of goods compared to traditional pharma. – Not nearly as skewed as generics – Expected this to react very similar to branded
pharma Delaying approval by more than 7 weeks resulted in negative ROI. Very sensitive to time!
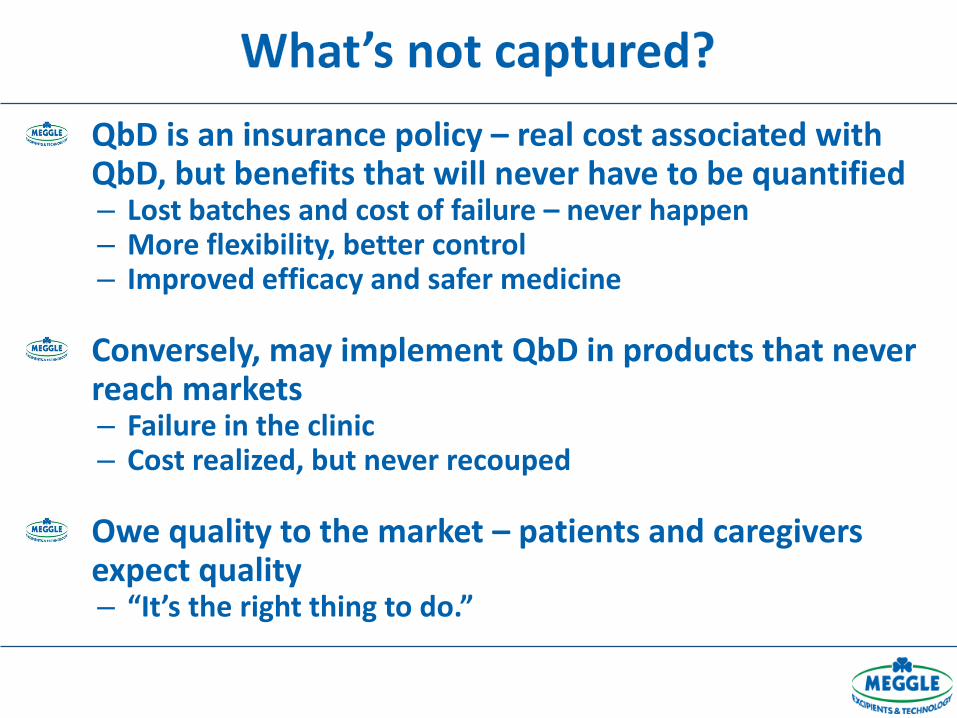
QbD is an insurance policy – real cost associated with QbD, but benefits that will never have to be quantified – Lost batches and cost of failure – never happen – More flexibility, better control – Improved efficacy and safer medicine
Conversely, may implement QbD in products that never reach markets – Failure in the clinic – Cost realized, but never recouped
Owe quality to the market – patients and caregivers expect quality – “It’s the right thing to do.”

Considering the economics of formulation – Process is largest consumer of COGs
• Labor and energy are secondary • Excipients mean nothing
– Simplicity in numbers saves money
QbD economics – Needs to be evaluated in Phase II – For branded and biotech, do everything possible to
minimize regulatory delay – For generic products, COGs savings is critical.
• Nimble and flexible products to keep costs low.