Embed Size (px)
Citation preview

The Economic Impact of Immigration on St. Louis
Jack Strauss
Simon Chair of Economics
Director of the Simon Center for Regional Forecasting
Saint Louis University
June 2012
Acknowledgments: The author benefitted from useful discussions with Anna Crosslin, Bob Duffy, Bob Fox and Mahendra R. Gupta. Steve Fazzari from the Murray Weidenbaum Center of Washington University also provided
valuable comments. The study was funded by The William T. Kemper Foundation, Commerce Bank Trustee.

2
Fact Sheet of the Economic Impact of Immigrants to the St. Louis Region
The St. Louis Metro has approximately 126,500 immigrants, and immigrants comprise 4.5%
of the region’s population. Other metros in the top 20 average four to five times the number
of foreign-born residents.
The region’s relative scarcity of immigrants largely explains our poor economic growth, and
the St. Louis metro’s fall from the 10th largest MSA in 1970 in the U.S. to 18th in population
and 20th in economic output in 2010. Other metros in the top 20 averaged 40% faster
economic growth over the past decade. This report statistically demonstrates that a lack of
immigration explains a considerable portion of the region’s slow income growth.
If St. Louis had experienced inflows of immigrants similar to other large metros, income
growth would have been 4-7% greater, and the region’s income would be 7-11% larger.
Encouraging an inflow of foreign-born to match other large metros would increase job growth
4-5%; thus, the region’s lack of immigration explains in large part its poor job creation engine.
Immigration is responsible for raising average wages by $600 in the region over the past
decade; however, average immigration patterns imply wages should have risen by $2800.
Increasing inflows of immigrants to St. Louis would markedly lower housing vacancies and
boost housing prices. If St. Louis had matched the immigration inflow of other large metros,
housing prices would be 26% higher in St. Louis City and 20% in St. Louis County over the last
decade.
The foreign-born community in the region is highly educated, with predominantly white collar
jobs. They earn $83,000, 25% more than the average American born. Immigrants are three
times more likely to be high-skilled than unskilled, one of the highest ratios in the country.
The foreign-born tend to be scientists, professionals and managers, and are 44% more likely
to have at least a college education and 130% more likely to have an advance degree.
The foreign-born in St. Louis have higher labor force participation rates, and substantially
lower unemployment rates than native-born in the region.
Immigrants are 60% more likely to be entrepreneurs in the region, and therefore, the relative
lack of immigrants is a major factor in explaining the region’s shortage of new business
startups.
The region’s poor immigrants are less likely to received food stamps and cash assistance;
thus, they are not a burden to the system.
Encouraging immigration can lower both the White and African-American unemployment rate
by approximately 2%.

3
Executive Summary
Look at photographs of downtown St. Louis in the first decades of the 20th
century and you’ll see a bustling metropolis, a scene of economic prosperity that began
in the years of the Civil War and continued, in spite of the Great Depression, to prosper
well into the middle years of the 1900s. After 1950, however, the economic climate
began to change. The economy of the region has performed poorly in recent decades,
lagging significantly behind most major metros in employment, income and wage
growth as well as entrepreneurial activity, an important driver of economic activity.
At the same time, the metro’s population and percentage of foreign-born
residents have both considerably trailed other large metropolitan areas.1 Outward
migration from the region and a surfeit of aging baby boomers indicate that the metro’s
workforce will shrink over the next decade. Without a plan to entice new workers to
the region, our tax base, businesses and employment opportunities will decline. This
report statistically demonstrates that the St. Louis economy and our demographic
profile are intimately related. It shows that there is one clear and specific way to
simultaneously redress the region’s population stagnation, output slump, tepid
employment growth, housing weakness and deficit in entrepreneurship - Immigration.
This report provides considerable economic evidence and statistical analysis using U.S.
Census data that increasing immigration will significantly raise employment and
income growth as well as boost real wages in the St. Louis region. An influx of foreign-
born could reverse the region’s housing prices declines and lower unemployment rates
for both whites and African Americans in our region.
A profile of the foreign-born in St. Louis reveals a highly trained workforce.
More than 50% of immigrant occupations in the region are high paying white-collar
jobs, and the number of high-skilled foreign-born workers outnumbers low-skilled by
three to one. The foreign-born in the region are significantly more likely to have
graduated college than native-born Americans, and twice as likely to hold advanced
degrees, particularly as medical doctors and scientists. As a result of higher pay and
1 The St. Louis region or metro (MSA, Metropolitan Statistical Area) includes 9 counties in Missouri and 8 counties
in Illinois.

4
labor force participation rates, the average foreign-born contributes 29% more to the
region’s income than the average native-born in St. Louis; further, the foreign born
possess substantially lower rates of unemployment, receive less food stamps and cash
assistance and pay far more taxes than the average St. Louis worker. Further, a
Brookings Report (Hall et al., 2011) shows the high educational levels of immigrants in
St. Louis are compensating for the brain drain of native-born Americans due to
negative net-migration. Influxes of immigrants hence are critical in maintaining
advanced skill levels, which are critical to our premier companies and institutions.
Both economic theory and statistical analyses demonstrate that immigration
expands a region’s productive capacity by stimulating investment and promoting
specialization. This in turn leads to efficiency gains, higher profits and raises wages for
all workers. Economists have shown that American economic sectors with high
exposure to immigration fared better in employment growth than more insulated
sectors, even for low-skilled labor. One reason is that hiring immigrants can reverse
off-shoring, which pulls away not only low-wage jobs but also many related
occupations that include high-skilled managers, tech repairmen and others. Thus, by
hiring immigrants, we make it more likely that a company will remain in the region
than move overseas.
It is shortsighted in a globalized economy to expect we can fill all of our labor
needs with a homegrown workforce from the St. Louis region or neighboring states.
Increased globalization and changes in technology imply skill sets are substantially
changing and companies need to hire world-wide to compete in a global market. For
instance, a prominent 2011 study by Deloitte finds that 67% of more than 1,100
manufacturers report a moderate to severe shortage of available, qualified workers:
“skilled production jobs – machinists, operators, craft workers, distributors,
technicians, and more – are taking their toll on manufacturers’ ability to expand
operations, drive innovation, and improve productivity.” Overall, nationwide 600,000
jobs, or 5% of manufacturing jobs, remain unfilled due to a lack of qualified candidates.

5
Hiring immigrants with specific skills supplement existing hiring over the entire
skill spectrum from managers to office workers and janitors, and does not lead to
higher unemployment. When hiring immigrants, companies have to register them with
the Department of Labor and indicate no qualified U.S. applicant exists for H1 and H2
guest workers. This means the applicant has particular qualifications lacking in the
local job market and the company is paying an appropriate wage. Companies that are
hiring foreign-born workers then are not hiring them because they are cheaper. Rather
firms are hiring immigrants due to particular expertise that is sometimes lacking in
U.S. born individuals.
If St. Louis wishes to further cultivate clusters of biotech, financial services,
healthcare or information systems, it must also attract the best talents to complement
our existing workforce. Business location theory posits that the number one factor in
establishing and promoting a successful cluster is a highly trained work force. Because
immigrants often have technical and scientific skills in these areas, they should be part
of the region’s strategy to build on our strengths in these occupations. For example,
Sigma Aldrich hires in bioinformatics, a highly specific profession that requires
advanced knowledge of both biology and IT. This expertise is difficult to find in native
St. Louis graduates, so the company must look elsewhere, often overseas to find the
best qualified applicant. In this search process, the company, like all companies, has an
obligation to both their customers and stockholders, to hire the most qualified.
The St. Louis Cardinals are the 2011 World Champions, not because their
recruitment focuses on St. Louis. On the contrary, they recruit the best talent from
everywhere, not just the local metropolitan area. This often includes players from Latin
America, an area full of baseball talent such as Albert Pujols, Jaime Garcia, Fernando
Salas, Eduardo Sanchez and Rafael Furcal. Without attracting the best players in the
world to this region, it is unlikely the Cardinals would be World Champions.
This argument also extends to our businesses and educational institutions. For
instance, Washington University’s Business and Medical schools are world renowned
as they hire the best possible faculty. Approximately half of the business school’s

6
tenure-track faculty and its medical school’s bioengineering, genetics and biostatistics
departments are prominent foreign-born scholars.
A study by the University of Washington’s Economic Policy Research Center
shows that every job that Microsoft creates, supported 5.81 jobs elsewhere in the
region – from bakers to butchers. A large multiplier also exists for high-skilled St. Louis
firms such as Boeing, Sigma Aldrich, the Danforth Plant Science Center, Novus
International, Monsanto, Washington University and Saint Louis University. Hiring
immigrants has a multiplier effect on the economy, because these individuals spend
their money in the region, which in turn leads to more local economic activity and
supports jobs for native-born Americans in St. Louis retail shops and other service
businesses.
St. Louis benefits not just from foreign-born doctors and scientists from India
and China, information technology experts from Russia, and engineers from Latin
America, but also from middle and low skilled immigrants arriving in our region.
Skilled foreign-born electricians and plumbers make it easier for both businesses and
consumers to build and maintain their properties, while low-skilled lawn workers save
St. Louis consumers money, inexpensive high school janitors save the community tax
revenue and cheap cleaning workers save businesses cash, boost their profits and
encourage them to expand locally. Further, attracting immigrants of all skills is critical,
as 2nd generation immigrants, including the children of low-skilled workers, have a
long tradition of success in this region. For example, George Paz, the CEO of Express
Scripts, is the son a blue-collar Mexican immigrant.
Foreign-born workers employed by St. Louis firms such as Monsanto expand
export opportunities and commercial contacts as they possess strong business and
social networks with the rest of the world, making it easier for Monsanto to trade with
India, Brazil and other countries, which multiply business and employment
opportunities for the region. The region, therefore, should recognize these individuals
have the knowledge, experience, connections and drive to help St. Louis companies
compete in the global marketplace.
7
The foreign-born have earned an entrepreneurial reputation, since we often
attract both the risk-takers and the best these countries have to offer. To immigrant
and to succeed, they have to pass through hurdles that only the most motivated and
experienced can achieve. The foreign-born workers and their children have become
successful small businesses owners here, and have created hundreds of other jobs for
native-born Americans. These include dozens of small Bosnian and Chinese restaurants
to the CEOs of Monsanto, Sigma Aldrich, Express Scripts and the local head of Citibank.
The Horatio Alger stories of the American dream have prospered among foreign-born
immigrants and include companies that are home-grown with millions in revenue,
including the head of Rose International and Nextgen.
The St. Louis region had a good track record of integrating Bosnian immigrants
in the 1990s into our region’s social fabric. They revitalized parts of South St. Louis
City and South St. Louis County by moving into older neighborhoods, opening
businesses and rehabbing housing. Bosnians opened many thriving small businesses
including bakeries, butcher shops, coffee shops, construction and heating and cooling
companies, insurance companies and a truck-driving institute, and continue to be a key
source of high skilled production work. The region in the 1990s also welcomed tens of
thousands of Chinese, Russians and Indians who have integrated and prospered. St.
Louis needs to build on these experiences as this influx was more than a decade ago,
and now encourage a new wave of immigrants into our urban core.
While some regions are passing laws aimed at restricting immigration, the
National League of Cities reports cities such as Boulder, Chattanooga, Columbus,
Indianapolis, Louisville, Los Angeles, New York City, Philadelphia, Princeton, and
Richmond have initiated innovative municipal polices to encourage immigrant
integration. If St. Louis wishes to advance in future decades, it must take its cue from
cities that are devising targeted welcoming strategies to attract immigrants through
economic and social policies that embrace, rather than drive away, this vital workforce.
What are these best practices? The most effective strategies include several simple
components: a central organization that serves an information clearinghouse, a
welcoming mat network, and business/government partnerships.

8
The central organization in Louisville, for instance, help integrate immigrants
and refugees by connecting them with government and nongovernmental resources,
and providing them with services such as a community language bank, interpreters and
translators as well as social services including resettlement agencies, English as a
second language classes, and career and leadership opportunities. Philadelphia has a
nine-member commission on immigrant affairs that encourages the development and
implementation of effective policies and strategies that facilitate immigration’s role in
regional population growth, neighborhood revitalization, and economic development.
The National Conference of State Legislatures reports that Lowell, Nashville and
Portland have effective central coalitions that coordinate immigration through
government, NGOs and private partnerships. They recommend that a central
organization implement immigrant integration policies that include: “English-language
training; Credential recognition and assistance with meeting professional and trade
licensing requirements; Strong vocational/professional skills development; Higher
education opportunities; and upgrading courses; Youth-training and development
services; Civic-participation training and opportunities for involvement in the wider
community; Health care; and Adequate and affordable housing.”
A welcoming campaign that creates “Welcoming Committees” is critical to
engage local chambers of commerce, drive home the message that immigration can
create opportunities through new businesses and create networks for immigrants to
feel welcomed, facilitate their transition and become engaged in the local community.
Many metros have adopted regional cultural ambassador programs such as G.L.I.P.
(Greater Louisville International Professionals) that work to increase awareness of the
international community’s contributions to the region as well as provides international
community and business connections. Philadelphia’s Welcoming Center for New
Pennsylvanians connects immigrants, employers, & communities and is designed to
attract international talent by recruiting skilled immigrant professionals. This
initiative is less about dollars, than a change in mind-set of our local business leaders
and public: the region needs to view immigration as an opportunity, not as a threat - a
chance to hire the best. We need clear messaging that immigration is a positive force

9
for economic development, and that local talent can be supplemented by hard-working,
entrepreneurial individuals.
Many metros have created a range of government and business partnerships
that help recruit immigrants to their regions. These include an EB5 Investor Visa
program that can attract international investment and foreign talent; efforts in St.
Louis should initially concentrate in promoting clusters in biotech, health science and
IT, since the Brookings Institution reports that immigrants tend to cluster in these
sectors due to having advanced scientific degrees. The metro should further promote
initiatives to attract and retain foreign students at St. Louis and Missouri colleges and
universities by providing mentors and internships that create incentives for retention.
The region should expand its initiatives to organize small business mentorship and
community bank funding for both domestic and foreign-born residents.
The region has much of the infrastructure in place to implement effective
immigration strategies. These organizations include the International Institute of St.
Louis, MIRA (Missouri Immigrants and Refugee Advocates), the World Trade Center
and the Urban League. To facilitate these transitions, they need only moderate
increases in core funding, and backing from both public and business leaders.
St. Louis has many positive attributes and resources to attract hard working,
immigrants. We have affordable housing as well as some excellent public, private and
Charter schools and Universities. Immigrants in St. Louis already have more than
twice the small business success rate, and hence building on this achievement should
not be difficult. St. Louis has premier companies in healthcare, biotech, engineering,
finance and IT that should be allowed to attract the best so they flourish in a global
environment. Globalization and economic development include attracting the foreign-
born as well as foreign companies to our region.

10
The Economic Impact of Immigration on St. Louis
I. Introduction
The Saint Louis Metropolitan Area’s Economy has struggled over the last decade. From
2001 to 2011, the region bled nearly 45,000 jobs, or more than 3.3% of its workforce --
compared to 2% gains in other large metro areas. Output in the region further has
grown 40% slower than the nation, and wages have increased 14% less than other
large metros. The St. Louis economy clearly has been stagnating for some time. Over
the past two decades, the metropolitan area has expanded approximately 30% slower
than the rest of the country, and over the past 5 years, output has been 40% below
other metro areas.
The region’s entrepreneurial activities ranked until recently far below the
national average, and our housing sector has taken a significant hit as well, despite the
absence of a housing bubble. The region’s population growth over the last decade is
54% less than the nation’s metropolitan areas, and over the past two decades, 60%
less. To some extent, our economic foibles are well known to our elected officials and
the public. The closings of several car plants over the last decade led to a crippling
blow to manufacturing that had devastating multiplier effects through the region. Less
clear, however is how the region’s economy can recover to more “normal” growth.
This report provides considerable statistical evidence that immigration can
reverse this region’s population stagnation, and address weaknesses in output,
employment growth, housing and entrepreneurship. It is a detailed economic study of
the economic impact of immigrants on St. Louis, and a first step in informing the
region’s elected officials, civic leaders and public of the economic benefits of
immigration to the St. Louis MSA (Metropolitan Statistical Area). The report details the
academic work by prominent labor economists such as David Card (2007), who finds
“In the past 25 years immigration has re-emerged as a driving force in the size and
composition of U.S. cities.” His work demonstrates that immigrants by positively
affecting population growth, economic demand and skill sets, then raise a region’s
wages, housing prices, rents and cultural diversity.

11
Most economically and culturally vibrant communities in the U.S. including the
Midwest metros of Chicago, Columbus, and Minneapolis are characterized by rising
shares of immigrant populations. David Card reports that the 17 largest metro cities
have an average share of foreign-born of approximately 27% – twice the U.S. average
and more than five times St. Louis’ immigrant share. In this study, we show that a low
immigrant influx explains the poor economic performance in the St. Louis region
compared to most large Metro areas.
In most cities, immigration, not migration, is a leading driver of population
increases, and is closely tied to economic performance. St. Louis’ has the 2nd lowest
population growth and the lowest immigration growth among the top 20 cities.2 The
number of foreign-born in St. Louis dropped from 26th in the nation in 1970, to 42nd in
2010, approximately tied with Kansas City, but behind Columbus, Raleigh and Salt Lake
City, which are much smaller cities. The latest 2011 Census reports that St. Louis
population rank fell again, to 19th, as Tampa surpassed St. Louis due to a faster rate of
immigration and both St. Louis County and City lost thousands in population. The fall
in population and economic rank is important as larger cities benefit from
agglomeration economies (Krugman, 1991; Glaeser and Gottlieb, 2009). Higher
densities encourage economic dynamism through idea creation and lower transit costs,
which ultimately lead to higher wages.
St. Louis like many Midwestern and Eastern cities is experiencing significant
domestic out-migration patterns; immigrants can counter this trend and help revitalize
neighborhoods by investing in homes and businesses. A Brookings Institution report
by Wilson and Singer finds that immigration can reverse population losses, expand the
workforce, and thereby boosts home values and reduce most vacancy and foreclosures
problems. Increasing immigration can further strengthen a city’s educational systems
and lower African-American unemployment, which is particularly relevant for St. Louis
2Only Detroit has lost more people over the last decade. The Motor City has been unable to compensate by immigrant inflows as it possesses the 2nd lowest amount of immigration among large metros. Recent efforts by their city, however have attempted to redress these issues.

12
City, as it is suffering from both declining enrollment and high black unemployment
rates.
If demographics determine destiny, the St. Louis economy faces a long and
difficult road ahead. There are three basic sources of population growth that drive
demographic movements – immigration, migration spurred by job seekers, and
migration due to retirement to sunnier climates. St. Louis is experiencing problems
with all three engines of growth. Over the past decade, the MSA attracted only 31,000
immigrants and lost 44,000 native-born Americans through domestic migration;
further, over the next two decades, St. Louis is projected to lose more than a quarter of
its workforce to retirement (aging baby boomers). Immigrants, however tend to be
younger, employed and pay taxes; thus, they can rejuvenate an aging, slow growing
region, reverse population declines spurred by domestic migration, and improve the
tax base.
Immigration is credited with rejuvenating neighborhood vitality in cities
including Boston, Chicago, Philadelphia and New York. In Massachusetts, immigrants
accounted for 82% of the growth in the state’s labor force. Two decades ago, Boston,
similar to St. Louis, was struggling, having lost nearly 200,000 people in prior years,
and so was Philadelphia which lost 120,000. Today, both cities are growing faster than
St. Louis, and influxes of foreign-born have played a major part in their revitalization;
in contrast to St. Louis, both Boston and Philadelphia have concentrated on attracting
talented people to their region.
Immigrants tend to possess more entrepreneurial energy than domestic
residents and the lack of immigrants is a prime reason this region lacks small
businesses and entrepreneurship. The Kauffmann Foundation (Fairlie, 2011) reports
that immigrants are responsible for a disproportionate number of successful high-
growth companies including cutting edge U.S. industries in Silicon Valley, where over
50% of the startups had at least one key foreign-born founder (West, 2011).
Immigrants founded Google, Intel, eBay, Sun Microsystems, Yahoo!, Hotmail,
PayPal, U.S. Steel, Dow Chemical, Dupont, Pfizer, Procter and Gamble, Bank of America
and Carnival Cruises, as well as thousands of other companies that are driving

13
America’s economic future by creating millions of American jobs. Immigrants have
played a critical role in U.S. economic development and include business titans Levi
Strauss, Andrew Carnegie, Andre Grove, Charles Wang, Sergey Brin, Jerry Yang, Liz
Claiborne, scientists such as Enrico Fermi, Albert Einstein, Alexander Graham Bell,
Hyman Rickover and Jonas Salk and many others. One quarter of American Nobel
Prize winners since 1901 and 40% of the Ph.D. scientists currently working in the U.S.
are foreign-born.
As policymakers search for approaches to revive moribund local economies,
thereby replenishing government coffers with tax revenue, they should evoke a simple
truth embraced by many economists and public policy experts: immigration is a key
source of long-term economic vitality, particularly in urban areas. In MSAs
experiencing urban decline due to population loss from negative migration and
growing numbers of retirees, immigrants are a crucial source of new labor, business
formation, tax revenue, revitalization, and economic development.
This policy paper will consist of five parts. Section II presents the demographic
and immigrant profile in St. Louis. Section III considers prior academic literature on
the topic. Section IV evaluates the statistical impact of immigration on employment,
income, wages and unemployment. It presents estimates of how St. Louis’ economy
would be different if the region had immigration inflows similar to other cities in the
top 20. Section V reviews best practices in other cities, and what St. Louis can do next
to advance an immigration agenda.

14
II. St. Louis Immigrants: Who they are and What they Do.
The Region’s Demographic Problems
Population growth drives employment and income growth as well as housing
prices. Larger cities attract businesses because of manufacturing hub effects, local
demand effects, and idea creation synergies that create clusters of positive reinforcing
economic activity (Glaeser and Gottlieb, 2009). This section discusses the
demographics of St. Louis and profiles the ethnicity and occupations of the foreign-
born in the region.
The population of St. Louis City today is at its lowest level since 1880, after
having declined to 320,000, representing a loss of 8.3% since 2000. This compares to
over 450,000 in 1890, 575,000 in 1900 (when it ranked 4th largest in the country) and
850,000 by 1950, when it was the eighth largest city in the U.S. Over the last decade, St.
Louis County’s population fell by 1.7% and the overall metropolitan region has grown
only 4.2%, largely buoyed by population growth in adjacent St. Charles County. This
falls significantly short of the 9.7% growth in the U.S. population and 10.7% growth
for the 50 largest metro areas.
Table I presents the demographic growth of the St. Louis Metro Area, the three
largest counties in the St. Louis MSA, Missouri and the U.S. It also presents four other
cities with similar economic makeup -- older industrial cities. The most important
columns are on the right-hand side of the table, detailing how our region has grown
over the last decade and how it is forecasted to fare over the next ten years. Table I
shows that St. Louis County and City lost population over the past decade and these
losses are forecasted to continue over the next ten years. The latest population figures
released in April 2012, for instance, again revealed that both St. Louis County and City
lost population last year.
In contrast, the United States as well as most urban areas have been growing
steadily and are projected to continue to grow faster than the St. Louis region. In large
part, we show this is attributable to substantially higher rates of immigration in these
other metro areas. For instance, similar to St. Louis, cities such as Baltimore,

15
Cincinnati, Columbus and Minneapolis are all experiencing negative net migration
flows; however, in contrast to St. Louis, these cities are experiencing faster population
growth spurred by larger inflows of immigrants.
Table I
Demographics of our Region
2000 2010 2011 2020F 2000-2010 2000-10 2010-20F
USA 282171957 309418049 312097820 337084112 9.7% 27246092 8.94%
Missouri 5,595,211 5,922,078 6,034,597 6,199,882 7.0% 390752 4.69%
STL Metro 2701634 2815567 2826277 2924541 4.2% 113933 3.87%
St. Charles 286171 361944 367786 421767 26.5% 75773 16.53%
St. Louis County 1016364 998934 998855 996872 -1.7% -17430 -0.21%
St. Louis City 346904 319181 318743 314109 -8.0% -27723 -1.59%
Minneapolis 2981616 3288069 3320904 3623487 10.3% 306453 10.20%
Baltimore 2557501 2713525 2725778 2833608 6.1% 156024 4.43%
Columbus 1619514 1842055 1864228 2066801 13.7% 222541 12.20%
Cincinnati 2014665 2133384 2146257 2262254 5.9% 118719 6.04%
http://proximityone.com/demographics2020.htm 2020F and 2010-20F are the forecasted population for
this period.
Figures I, III and IV illustrate population growth in St. Louis City, St. Louis
metro area and U.S. Figures I shows that most of St. Louis City, particularly its north
and south regions, is experiencing sizeable population losses, which contribute to
housing price declines (See page 29). The area from Downtown to the Central West
End and University City are notable exceptions. Figure II presents the foreign-born as
a percentage of population and illustrates sizeable number of immigrants living in
areas from Downtown to the Central West End, including near Saint Louis University,
the Barnes-Jewish Hospital medical complex, Washington University, and the cities of
University City and Olivette. Comparison between Figures I and II presents a strong
visual relationship between immigration flows and population changes. It is clear that
localities that are not experiencing an influx of immigrants are losing substantial
population, while immigration is driving population increases throughout the central
corridor of the city.
Figure III shows that St. Charles County and counties across the Mississippi in
Illinois are experiencing population gains, albeit from a lower base. Most of St. Louis
County is losing population, except for Creve Coeur, Town and Country, part of

16
Maryland heights, Olivette and the northern half of Chesterfield. Figure IV illustrates
the immigrant pattern for most of the western section of the St. Louis metro area.
Large parts of St. Louis County, particular the wealthy regions of Clayton, Creve Coeur,
Town and Country as well as North Chesterfield, Maryland Heights and Olivette have
relatively high immigrant shares. These are the same areas experiencing population
increases. Both Figures III and IV also depict that neighborhoods without immigration
inflows are losing population. Hence, although immigration inflows are relatively
limited in the St. Louis MSA, they are closely related to population growth in many
neighborhoods; further, it is also clear that without immigration, these regions would
be suffering from population declines. Additionally, St. Louis County appears well
diversified in terms of where immigrants have settled, particularly compared to St.
Louis City. St. Charles is the one area gaining population not due to immigration.
Figure V illustrates that most of the urban areas in the U.S. are gaining
population, particularly the coastal regions. Rural areas, including the Great Plains,
interior South and Great Lakes regions, are losing population due to the decline of
family farms, limited economic opportunities and sparse immigration, highlighted by
Figure VI. Comparison between Figures V and VI once again present a strong visual
connection between immigration flows and population.
Profile of Region’s Immigrants
The U.S. currently is experiencing its second major wave of immigration. This
influx began in the 1970s, and then accelerated in the late 1980s. Prior to this,
immigrant flows had peaked around 1900, and then fell sharply during the 1920s and
1930s, when the country largely closed its borders. In contrast to European
immigrants in prior decades (e.g., in 1960, Italian-born immigrants comprised 13.0%
of all immigrants, followed by immigrants born in Germany and Canada which
accounted for 10.2% and 9.8%, respectively), the new immigrants are largely from
Latin America and Asia with an annual net in-migration of over one million individuals.

17
The combined Hispanic and Asian population currently represents about one-
fifth of the population, compared to one-ninth in 1990. Although many metro areas are
experiencing increased immigration inflows, Figure VI indicates, not all areas of the
country experienced this wave identically. There is a tendency for immigrants to
cluster in a small number of areas, which is consistent with immigration preference
laws that favor family reunification. Earlier research indicates that kinship ties give
rise to chain migration that link family members and friends to common destinations
(Massey, et al, 1994; Pedraza and Rumbaut, 1996).
St. Louis has a more distinctive immigrant cohort than many parts of the U.S.
The foreign-born in the St. Louis MSA tend to be from diverse countries. No country of
origin exceeds .4% of the population. St. Louis is known for the largest number of
Bosnians of any U.S. metro, but this group comprises a relatively small portion of total
U.S immigrants and is the third largest ethnic cohort in the metro, behind immigrants
from India and Mexico.3 Compared to Missouri and the United States, the region’s
Hispanic population is relatively small. Overall, 44% of the foreign-born entered over
the last decade and 29% between 1990-2000, a pattern fairly similar to most of the U.S.
Table II Origins of Foreign-born (2010 Census)
STL % of
Population MO % of
Population US
% of Population
Total 126,513 4.49% 216,698 3.87% 39,955,673 14.16%
Europe 30,177 1.12% 49,200 0.88% 4,817,437 1.71%
Bosnia and Herzegovina 8,491 0.31% 9,002 0.16% 125,793 0.04%
Russia & CIS economies 4,909 0.18% 8,472 0.15% 800,424 0.28%
China 7,557 0.28% 14,424 0.26% 2,166,526 0.77%
Korea 4,555 0.17% 8,261 0.15% 1,100,422 0.39%
India 10,420 0.39% 14,490 0.26% 1,780,322 0.63%
Philippines 3,443 0.13% 7,559 0.14% 1,777,588 0.63%
Vietnam 5,202 0.19% 10,811 0.19% 1,240,542 0.44%
Mexico 10,539 0.39% 44,584 0.80% 11,711,103 4.15%
3The Census numbers however may substantially underreport the number of Bosnians in the metro area; the 2005
Census for instance reports 14,484 Bosnians. The International Institute and Fontbonne University report that there
are 50-60,000 Bosnians in the area; this number however may include Bosnians from other former Yugoslavian
countries as well as children of Bosnian immigrants who identify as Bosnian Americans, but are born in the U.S.

18
Profile of the St. Louis Immigrants: Occupational Profiles
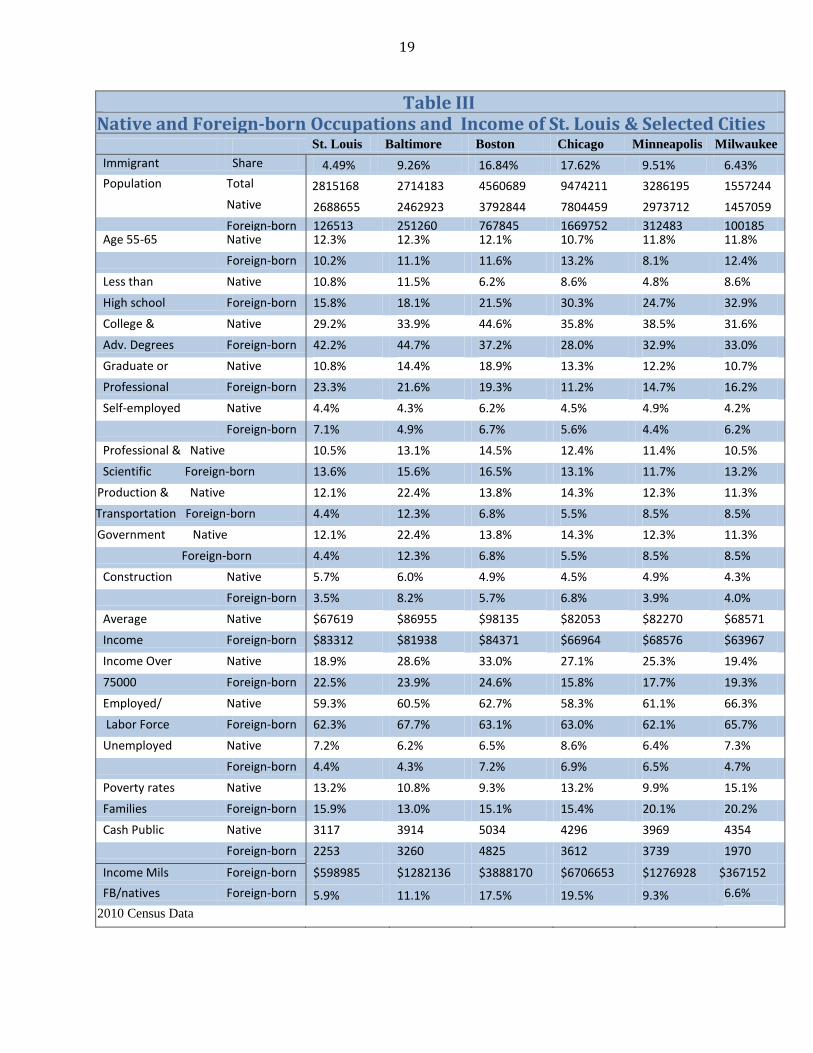
Table III presents the occupational profiles of immigrants living in St. Louis, as
well as in similar old industrial cities, such as Boston, Baltimore, Chicago, Minneapolis
and Milwaukee. Native-born Americans are more likely than the foreign-born to be
aging Baby Boomers, and thus more likely to retire over the next 10 to 15 years.
The foreign-born in St. Louis as well as other cities have different educational and
occupation profiles than native-born Americans. Since Adam Smith, specialization is a
driving force of capitalism and a source of efficiency gains. Peri (2008) shows that the
different skill sets imply that immigrants complement rather than compete with
native-born American workers; e.g., having more chefs implies you need more waiters,
and this pushes up their wage. Different skill sets imply that immigration can increase
both employment and wages, and not lead to unemployment as the foreign and native-
born are often not in direct competition.
In St. Louis and elsewhere, immigrant groups tend to be both less educated (no
high school degree) and better educated than native-born Americans (having college
and advanced degrees). Hence, the perception that immigrants are predominantly
uneducated, poorer individuals is incorrect and a misconception arising perhaps from
decades old prejudices. For instance, “In 1980, there were more than twice as many
low-skilled immigrants residing in the United States as high-skilled ones, and their
respective shares of the working-age immigrant population differed by 20 percentage
points (Hall et. al, 2011).” However, over recent years, the share of immigrants with
college degrees has been increasing and the share without a high school education,
declining. As a result, the low-skilled immigrant share dropped by more than 10
percentage points, while the high-skilled share increased by more than 10 percentage
points. Those with “middle” skills (a high school diploma, some college, or an associate’s
degree) grew in absolute terms. The Figure below (Hall et. al.) illustrates these trends.
19
Table III Native and Foreign-born Occupations and Income of St. Louis & Selected Cities Selected Cities St. Louis Baltimore Boston Chicago Minneapolis Milwaukee
Immigrant Share 4.49% 9.26% 16.84% 17.62% 9.51% 6.43%
Population Total 2815168 2714183 4560689 9474211 3286195 1557244
Native 2688655 2462923 3792844 7804459 2973712 1457059
Foreign-born 126513 251260 767845 1669752 312483 100185 Age 55-65 Native 12.3% 12.3% 12.1% 10.7% 11.8% 11.8%
Foreign-born 10.2% 11.1% 11.6% 13.2% 8.1% 12.4%
Less than Native 10.8% 11.5% 6.2% 8.6% 4.8% 8.6%
High school Foreign-born 15.8% 18.1% 21.5% 30.3% 24.7% 32.9%
College & Native 29.2% 33.9% 44.6% 35.8% 38.5% 31.6%
Adv. Degrees Foreign-born 42.2% 44.7% 37.2% 28.0% 32.9% 33.0%
Graduate or Native 10.8% 14.4% 18.9% 13.3% 12.2% 10.7%
Professional Foreign-born 23.3% 21.6% 19.3% 11.2% 14.7% 16.2%
Self-employed Native 4.4% 4.3% 6.2% 4.5% 4.9% 4.2%
Foreign-born 7.1% 4.9% 6.7% 5.6% 4.4% 6.2%
Professional & Native 10.5% 13.1% 14.5% 12.4% 11.4% 10.5%
Scientific Foreign-born 13.6% 15.6% 16.5% 13.1% 11.7% 13.2%
Production & Native 12.1% 22.4% 13.8% 14.3% 12.3% 11.3%
Transportation Foreign-born 4.4% 12.3% 6.8% 5.5% 8.5% 8.5%
Government Native 12.1% 22.4% 13.8% 14.3% 12.3% 11.3%
Foreign-born 4.4% 12.3% 6.8% 5.5% 8.5% 8.5%
Construction Native 5.7% 6.0% 4.9% 4.5% 4.9% 4.3%
Foreign-born 3.5% 8.2% 5.7% 6.8% 3.9% 4.0%
Average Native $67619 $86955 $98135 $82053 $82270 $68571
Income Foreign-born $83312 $81938 $84371 $66964 $68576 $63967
Income Over Native 18.9% 28.6% 33.0% 27.1% 25.3% 19.4%
75000 Foreign-born 22.5% 23.9% 24.6% 15.8% 17.7% 19.3%
Employed/ Native 59.3% 60.5% 62.7% 58.3% 61.1% 66.3%
Labor Force Foreign-born 62.3% 67.7% 63.1% 63.0% 62.1% 65.7%
Unemployed Native 7.2% 6.2% 6.5% 8.6% 6.4% 7.3%
Foreign-born 4.4% 4.3% 7.2% 6.9% 6.5% 4.7%
Poverty rates Native 13.2% 10.8% 9.3% 13.2% 9.9% 15.1%
Families Foreign-born 15.9% 13.0% 15.1% 15.4% 20.1% 20.2%
Cash Public Native 3117 3914 5034 4296 3969 4354
Foreign-born 2253 3260 4825 3612 3739 1970
Income Mils Foreign-born $598985 $1282136 $3888170 $6706653 $1276928 $367152
FB/natives Foreign-born 5.9% 11.1% 17.5% 19.5% 9.3% 6.6%
2010 Census Data

20
St. Louis, along with Baltimore, Milwaukee, Buffalo, Cleveland, Detroit and
Pittsburgh, possesses a high skill pattern that is even more accentuated than this figure
illustrates. These largely older industrial metro areas have the most highly skilled
immigrant populations in the country, with a median skill ratio of 166, implying that
immigrants with college degrees outnumber those without high school diplomas by
66%. In St. Louis, this ratio is even larger, as there is a 3 to 1 ratio between high -
skilled (college degree and above) and unskilled (no high school diploma). Further,

21
these ‘former gateway cities’, including St. Louis, are experiencing substantial native
out-migration—particularly among adults with high levels of education. Immigration
then has compensated for the ‘brain drain’ in these metropolitan areas (Frey, 1995).
For instance, Table III shows that immigrants in St. Louis similar to other large
metros are 25%-30% more likely to be professionals, scientists and managers
compared to native-born workers (13.6% vs. 10.5%), and 50% more likely to be
production workers (16.6% vs. 10.9%). Further, the foreign-born in the St. Louis
region as well as elsewhere are substantially less likely to work in sales and office
occupations (15.4% of foreign-born vs. 26.6% for native-born) as well as government
(4.4% of immigrants compared to 12.2% for native workers). One difference between
immigrants in St. Louis and most cities is that the foreign-born in other metros are
50% more likely than native-born Americans to work in construction - this pattern is
reversed in St. Louis. These different specialty patterns are important, and support the
academic literature in the next section.
The foreign-born in St. Louis further are 60% more likely to be small business
entrepreneurs than native-born in the region. This is consistent with a Kauffman
Foundation report (Fairlie, 2010) that finds the foreign-born start significantly more
new business ventures than native-born Americans. Further, while new business
startups rates have been declining for native-born Americans, startup rates for
immigrants have been increasing steadily. As a result, in 1996, immigrants comprised
14% of new businesses but this has risen to 29.5% by 2010, nearly twice their share of
population. As a result of low immigration, St. Louis has a relative paucity of
entrepreneurs or self-employed. If St. Louis had the same immigration share as other
cities in the top 20, we would have roughly 25,000 foreign-born entrepreneurs,
increasing the total share of entrepreneurs from 4.7% to 5.7% of the workforce. Since
the U.S. average is 6.3%, higher immigration could eliminate more than half the
region’s entrepreneurial shortage.
Due to their high skill and education levels, immigrants in the St. Louis region
earn $15,000 more than native-born Americans ($83,312 compared to $67,619). Their

22
labor force participation rates are higher, and their unemployment rates lower than
native-born Americans. Further, while a higher percentage is poor, immigrants receive
less cash assistance from the government.
Additionally, the last two rows document that immigrant earnings in St. Louis
total $6 billion dollars or 6.4% of the region’s income. Since they comprise 4.5% of the
population, they contribute 29% more to the region’s income than the average native-
born American. If St. Louis had the same immigrant share as other cities in the top 20,
its income would be $24 billion higher in the region. This implies substantially greater
spending on products produced by St. Louis businesses would have occurred if the
region had more foreign-born. Overall, the Census data presents a very positive
picture of the economic contribution of immigrants in the St. Louis region, and they
contribute more to the system then they receive in benefits.
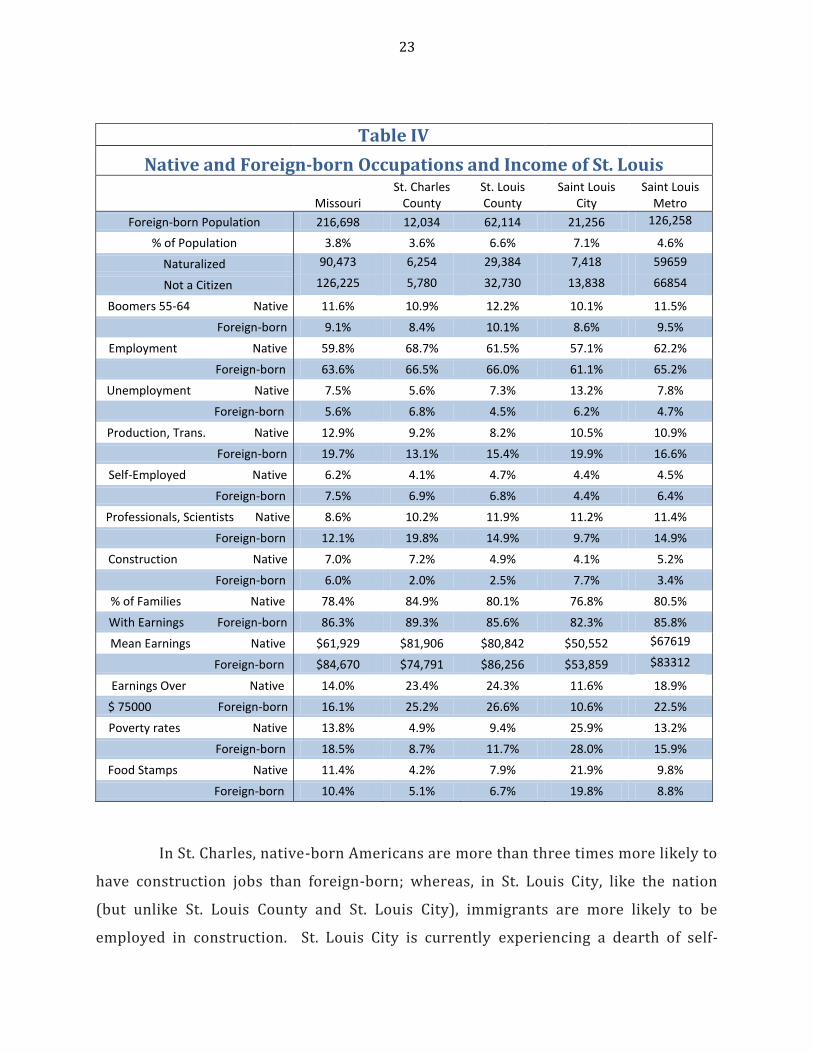
Table IV details the economic contribution of immigrants to Missouri and the
three largest counties in the region. Immigrants are a higher percentage in St. Louis
City and County than the rest of the metro area or Missouri. Immigrants in all regions
tend to be production workers, and have families whose members work with earnings.
They are less likely to be aging baby boomers.
Immigrant patterns however tend to differ in several ways throughout the
region. The ratio of naturalized to non-citizens for both the U.S and the overall St. Louis
MSA is 40%-45%, but in St. Charles, it is 53% and only 35% in St. Louis City.
Naturalization implies the foreign-born have become United States citizens and have
all the rights and privileges of native-born Americans including the right to vote. It is
highly related to when immigrants arrive in the U.S., and indicates that St. Louis City
has relatively new arrivals compared to the rest of the region. Naturalized citizens in
the St. Louis County and metro area tend to be fairly well off, with an average income
exceeding $100,000. Further, 37.1% of St. Louis County’s naturalized citizens,
compared to 23.5% of its native-born, exceed $75,000, and provides convincing
evidence that the foreign-born in St. Louis have succeeded and are significantly and
positively contributing to the metro’s business environment.
23
Table IV
Native and Foreign-born Occupations and Income of St. Louis
Missouri St. Charles
County St. Louis County
Saint Louis City
Saint Louis Metro
Foreign-born Population 216,698 12,034 62,114 21,256 126,258
% of Population 3.8% 3.6% 6.6% 7.1% 4.6%
Naturalized 90,473 6,254 29,384 7,418 59659
Not a Citizen 126,225 5,780 32,730 13,838 66854
Boomers 55-64 Native 11.6% 10.9% 12.2% 10.1% 11.5%
Foreign-born 9.1% 8.4% 10.1% 8.6% 9.5%
Employment Native 59.8% 68.7% 61.5% 57.1% 62.2%
Foreign-born 63.6% 66.5% 66.0% 61.1% 65.2%
Unemployment Native 7.5% 5.6% 7.3% 13.2% 7.8%
Foreign-born 5.6% 6.8% 4.5% 6.2% 4.7%
Production, Trans. Native 12.9% 9.2% 8.2% 10.5% 10.9%
Foreign-born 19.7% 13.1% 15.4% 19.9% 16.6%
Self-Employed Native 6.2% 4.1% 4.7% 4.4% 4.5%
Foreign-born 7.5% 6.9% 6.8% 4.4% 6.4%
Professionals, Scientists Native 8.6% 10.2% 11.9% 11.2% 11.4%
Foreign-born 12.1% 19.8% 14.9% 9.7% 14.9%
Construction Native 7.0% 7.2% 4.9% 4.1% 5.2%
Foreign-born 6.0% 2.0% 2.5% 7.7% 3.4%
% of Families Native 78.4% 84.9% 80.1% 76.8% 80.5%
With Earnings Foreign-born 86.3% 89.3% 85.6% 82.3% 85.8%
Mean Earnings Native $61,929 $81,906 $80,842 $50,552 $67619
Foreign-born $84,670 $74,791 $86,256 $53,859 $83312
Earnings Over Native 14.0% 23.4% 24.3% 11.6% 18.9%
$ 75000 Foreign-born 16.1% 25.2% 26.6% 10.6% 22.5%
Poverty rates Native 13.8% 4.9% 9.4% 25.9% 13.2%
Foreign-born 18.5% 8.7% 11.7% 28.0% 15.9%
Food Stamps Native 11.4% 4.2% 7.9% 21.9% 9.8%
Foreign-born 10.4% 5.1% 6.7% 19.8% 8.8%
In St. Charles, native-born Americans are more than three times more likely to
have construction jobs than foreign-born; whereas, in St. Louis City, like the nation
(but unlike St. Louis County and St. Louis City), immigrants are more likely to be
employed in construction. St. Louis City is currently experiencing a dearth of self-

24
employed among both foreign and native-born Americans. It further has a relative
shortage of foreign-born professionals, scientists and managers and less immigrants
earning over $75,000 than native-born Americans. In St. Charles, the foreign-born are
relatively scarce, tend to have lower incomes and are more likely to be unemployed.
III. Economic Research
The academic literature has focused on the impact of immigration on wages,
unemployment, entrepreneurship and housing. As a result of specialization
encouraging different skill patterns, most works -- including Card and DiNardo (2000),
Card (2001, 2007), Card and Lewis (2005), Toussaint-Comeau (2006) and Shierhotz
(2010) -- find either positive effects of immigration on wages or little impact of
immigration on less educated workers, and contradict the work of Borjas (2003) and
Lawrence F. Katz (2007).
David Card (2007) finds that immigration’s influence on wages depends on skill
level, and that overall, there are modest positive effects. Card and Dinardo show “our
point estimates suggest that, if anything, increases in immigrant population in specific
skill groups lead to small increases in the population of native-born individuals of the
same skill group. Indeed, we find that immigration has had quite significant impacts on
the skill distribution of various MSA’s.” West (2011) reports that immigration has
created wage gains for “90 percent of native-born Americans with at least a high-
school diploma.”
Immigrants increase both the supply of labor, which tends to depress wages for
workers with similar skill profiles, and also increases the demand of workers as they
consume goods and services, which creates more jobs and increases wages. Ultimately,
the effect of immigration therefore depends on which is greater, increases in supply or
demand. Note, both increases in supply and demand for labor boost income and job
creation for the region.
Ottaviano and Peri (2006, 2008), Peri (2007, 2009) Peri and Sparber (2009)
show that the demand effect dominates, as the increased supply’s impact on lower

25
wages tends to be relatively modest. This occurs because of an important phenomenon,
the presence of what are known as “complementary” workers, namely those who add
value to the work of others. Immigrants tend to be complementary workers since they
tend to be low-skilled or high-skilled, and as a result do not compete for the same jobs.
Peri finds that low-skilled immigrants usually fill gaps in American labor markets and
generally enhance domestic business prospects rather than destroy jobs. For example,
an immigrant will often take a job as a construction worker, a drywall installer or a taxi
driver, for example, while a native-born worker may wind up being promoted to
supervisor. The less educated foreign-born workers specialize in occupations intensive
in manual physical labor skills while natives pursue jobs more intensive in
communication-language tasks. This pattern of production versus sales/office work is
also observed in the St. Louis region. In contrast, the demand effect of immigrants
tends to be large, as they work and consume their income largely in the local region;
the demand effect often has multiplier effects, which means the immigrant’s purchase
of pizza at the local restaurant, leads to jobs for cooks, and other service employees
throughout the region. As a result, the evidence demonstrates that increases in
immigration leads to higher wages for all employees in the region.
A recent study by Brookings Institution (2012) using new Census data confirms
these arguments:
Immigrants and native-born workers tend to work in different jobs within both high- and low-
skilled industries.
In the healthcare industry, immigrants are nearly twice as likely as native-born workers to work as
physicians and surgeons (7.7% and 4.0%, respectively), but also nearly twice as likely as native-
born workers to work as home health aides. (19.0% and 10.3%, respectively)
In construction, immigrant workers are most likely to work as laborers (25.6% of all immigrants)
while native-born workers are most likely to work as managers. (14.3% of all native-born)
In the food service industry, immigrants are more than twice as likely as native-born workers to
work as cooks (31.5% and 14.2%, respectively), but more than 40 percent less likely than native-
born workers to work as waiters or waitresses. (15.7% and 24.5%, respectively)
In the life sciences industry, immigrant workers are most likely to work as medical scientists
(18.5% of all immigrants) while native-born workers are most likely to work as managers. (10.2%
of all native-born)

26
In the accommodations sector, immigrant workers are nearly three times as likely as native-born
workers to work as maids and housekeeping cleaners. (39.7% and 15.9%, respectively)
Immigrants and native-born workers have different levels of education.
In the high-skilled sectors studied, immigrants are slightly more educated than native-born workers,
including in the information technology industry, where 87.2% of immigrant workers have a
bachelor’s degree or higher, compared with 72.5% of native-born workers.
In the low-skilled sectors studied, immigrants are less educated than native-born workers, including
in the agriculture industry, where 74.6% of immigrant workers lack a high school diploma,
compared with 30.1% of native-born workers.
Overall, immigrants are far more likely to lack a high school diploma, with 28.9% of immigrants
lacking a high school diploma compared with 7.4% of the native-born, and they are equally likely
to have a graduate degree, with 11.0% of immigrants and 10.7% of native born holding graduate
degrees.

27
St. Louis has a comparative advantage in both health care and life sciences, and
wants to further develop these sectors into large-scale clusters. As Brookings shows,
immigrants cluster in these industries. To encourage companies to move here, then it
is clear, we have to attract manpower, which includes foreign-born workers.
Card and Dinardo (2000) reject the “demographic balkanization” theory that
immigrant inflows lead to native outflows. This work contrasts earlier findings by Frey
(1995, 1996) as well as Borjas, Katz and Freeman (1997) who report a strong
correlation between immigrant inflows and native outflows. Wright et al., (1997) also
reexamine Frey’s specifications and conclude that native outflows from large
metropolitan areas are unrelated to immigrant inflows. Likewise, Kristin F. Butcher
and Card (1991) find no evidence that native population flows are related to
immigration inflows. The next section also provides more recent evidence of this lack
of causation – as a result, immigration increases population growth.
The Kauffman Institute (Fairlie, 2011) finds that immigrants tend to be more
entrepreneurial and start their own businesses at nearly twice the rate of other
Americans. Recent work at the Brookings Institution (Greenstone and Looney, 2010)
shows that “on average, immigrants raise the overall standard of living of American
workers by boosting wages and lowering prices” , and that on average, “Immigrants are
both better and worse educated than U.S.-born citizens. At one end of the spectrum,
more than 11% of foreign-born workers have advanced degrees —slightly above the

28
fraction of Americans with post-college degrees. Even more striking, more than 1.9% of
immigrants have Ph.D.s almost twice the share of U.S.-born citizens with doctorates
(1.1%). At the other end of the spectrum, however, immigrants are much more likely
than U.S.-born citizens to have less than a high school education.” As we discussed
earlier, St. Louis displays this similar pattern: foreign-born workers tend to either
possess college/advanced degrees or no high school diploma.
Hunt and Gauthier-Loiselle (2010) determine that skilled immigrants increase
innovation in the United States. Immigrants patent at double the native rate, due to
their disproportionately high share of science and engineering degrees. Using a 1940–
2000 state panel, they find that a 1% increase in the share of immigrants with college
degrees increases patents per capita by 9–18%. They also offer some tantalizing facts
on the importance of these effects for the United States: 50% of all new Ph.Ds. in
engineering; 45% of all new Ph.Ds. in life sciences, physical sciences, and computer
sciences, and 40% of all new master’s degrees in computer sciences, physical sciences,
and engineering are awarded nationally to foreign-born students. Immigrants in the
U.S. were twice as likely to have received Nobel prizes from 1990–2000 (Peri, 2007), to
be physicians (Hunt and Gauthier-Loiselle, 2010), or to be founders of public venture-
backed companies in 1990–2005 period (Anderson and Platzer, 2006), or to be
entrepreneurs of new high-tech companies with sales exceeding $1 million (Vivek
Wadhwa et al., 2007). Immigrants are further heavily over-represented among
members of the National Academy of Sciences and the National Academy of
Engineering, among authors of highly cited science and engineering journal articles,
and among founders of biotech companies (Stephan and Levin, 2001).
An American Enterprise Institute study (2011) finds that immigrants with
advanced degrees boost employment for native-born Americans. This effect is most
dramatic for immigrants with advanced degrees from U.S. universities working in
science, technology, engineering, and mathematics (STEM) fields . An additional 100
foreign-born workers in STEM fields with advanced degrees from U.S. universities is
associated with an additional 262 jobs among U.S. native-born. Temporary foreign-
born workers—both skilled and less skilled—boost U.S. employment. States with
greater numbers of temporary workers in the H-1B program for skilled workers and H-

29
2B program for less-skilled nonagricultural workers had higher employment among
U.S. native-born. Specifically: adding 100 H-1B workers results in an additional 183 for
U.S. native-born, and adding 100-H-2B workers leads to 463 jobs for native-born
workers.
Additionally, highly educated immigrants pay far more in taxes than they
receive in benefits. In 2009, the average foreign-born adult with an advanced degree
paid over $22,500 in federal, state, and FICA (Social Security and Medicare) taxes,
while their families received benefits one-tenth that size through government transfer
programs like cash welfare, unemployment benefits, and Medicaid.
Immigration boosts housing prices in all metro areas (Saiz, 2003, 2006; Greulich
et al., 2004). Follain (2010) shows that home prices decline sharply in markets that
suffer substantial and persistent decreases in population or employment. Such
decreases in population and employment trigger declines in the demand for housing ,
and because people are more mobile than houses, it takes many years for supply and
demand to become balanced again, and for house prices to return to prior levels.
Follain estimates a 1% decrease in population reduces home prices by 4.32%
over a three-year period, whereas a 1% increase in population leads to 1.8% higher
home prices. Using these estimates, if the St. Louis region experiences immigrant
inflows similar to other cities in the top 20, it would over the next three years
eliminate more than half the vacancies in the region, and over five years most
vacancies would be occupied. Overall, this increased immigration inflow would not
only reverse the housing slide, but over a decade lead to housing prices rising 26% in
St. Louis city and 20% in St. Louis County relative to no immigration flows.
Glaeser and Gottlieb (2009) offer an extensive literature survey and new
empirical evidence that emphasize the critical role agglomeration economies play in a
city’s economic development. “The largest body of evidence supports the view that
cities succeed by spurring the transfer of information”, and thus bigger cities tend to
attract big companies, and a well-educated highly trained work force. Paul Krugman,
who won the 2008 Nobel Prize in Economics, argues that cities thrive on density, and
that agglomeration economies are an important driver of regional economic growth

30
and decline. Population decline in one city can lead to a substantial and irreversible
shift from the previous ’king’ city to the new one.”
Work by Fennelly and Huart (2010) highlights the economic impact of
immigrants in a number of regions. The foreign-born contribute $331 million in net
income to Minnesota in 2010, $37 billion to the U.S., $940 million in positive net fiscal
impact to Arizona, $1.4 billion to Arkansas and billions of federal, state and social
security taxes to California. Further, in Florida, immigrants contribute a net sum (taxes
– benefits) of $1500, fueled $1.6 billion in total production in Nebraska and $229
billion in New York. Undocumented workers in Texas contributed $17.7 billion and
paid more than 25% in taxes than they received in payments, while in Chicago,
undocumented workers contributed more than $5 billion to the local economy.
The sharp loss of population in St. Louis City and the decline of population in the
County thus has strong implications for the economic vitality of the region; in the next
section, we clearly show that the lack of immigration and population growth in St.
Louis leads to lower wages for everyone.

31
IV. Economic Impact of Immigration
What is the economic impact of immigrants on a city?
We answer this question by first examining demographic changes, including net
immigration and migration flows over the last decade for the largest 50 cities, and then
proceed to statistically analyze the relationship between immigration and economic
activity. The top 50 cities comprise 166 million people, including 30 million
immigrants, which represents 75% of immigrants in the U.S.
The Fiscal Policy Institute of Brookings (2009) reports that between 1990 and
2006, the metropolitan areas with the fastest economic growth were also the areas
with the greatest increase in immigrant share of the labor force. The economies of
Phoenix, Dallas, and Houston, for instance, experienced the fastest growth in
immigration and averaged economic growth substantially above par during these
years. By contrast, the metro areas of Cleveland, Detroit, Pittsburgh and St. Louis
experienced the slowest economic growth among large metros and relatively low
inflows of immigrants. Note, these examples do not provide evidence that immigration
causes economic growth; however, they do suggest that healthy economies are
characterized by or associated with influxes of immigrants. To provide statistical
evidence of causation (e.g., that an increase in immigration leads to more job creation
or higher wages), a regression needs to be estimated that controls for both domestic
migration flows and simultaneity; we perform this statistical analysis in equations (1)-
(16).
Table V presents the Data, and utilizes decennial Census data that represent
changes over the decade, 2000-2010. Economists frequently use decennial data to
examine immigration. Although most studies have examined the period 1980-1990 or
1990-2000, this study represents one of the first to use the new 2010 Census data.
Employment data are from the U.S. government’s BLS and income data from the BEA.
Immigrants in the 50 largest metropolitan areas increased more than 25% over the
decade from 2000-2010. St. Louis increase of 31,000 was less than one-fourth the
average of large metros; that is, the average top 25 or 50 city experienced influxes of

32
Table V Largest 50 Metro Areas 2000-2010
Net
Change Pop
Birth-Death
s
Net Foreign
Born
Net Migration
Population % Change
Change for. born
eign-born
ornnB change
Jobs created
Income Increase
Atlanta 1227192
458467
214608
428620 28.9% 5.1% 85971 4248021 Austin 455329 15755
4 68321 234239 36.4% 5.5% 129116 1249746
Baltimore 137864 106184
45803 -36407 5.4% 1.8% 4950 2553022 Birmingham 79770 38250 14898 26934 7.6% 1.4% -44898 1051300 Boston 196331 18995
8 19746
2 -235915 4.5% 4.5% -47497 4392349
Buffalo -46305 5905 10092 -55162 -4.0% 0.9% -24037 1170109 Charlotte 414972 12274
2 49984 248379 31.2% 3.8% 51732 1330552
Chicago 481937 661726
377959
-561670 5.3% 4.2% -179928 9098630 Cincinnati 162245 10939
4 23125 -17648 8.1% 1.2% 1290 2009651
Cleveland -56731 48854 28922 -136943 -2.6% 1.3% -1355 2148017 Columbus 189005 12015
1 40896 34204 11.7% 2.5% 29352 1612843
Dallas 1286078
611141
335202
317062 24.9% 6.5% 203653 5161537 Denver 372852 21458
9 97814 66269 17.1% 4.5% 45249 2179343
Detroit -49121 179971
96955 -366790 -1.1% 2.2% -410463 4452558 Hartford 47376 32917 31312 -9349 4.1% 2.7% 11459 1148622 Houston 115207
2 55206
7 29963
5 243567 24.4% 6.4% 366999 4715417
Indianapolis 218555 117725
28606 72517 14.3% 1.9% 6477 1525103 Jacksonville 205394 68191 15968 126766 18.3% 1.4% 40606 1122750 Kansas City 231160 12682
4 35669 31747 12.6% 1.9% -23128 1836425
Las Vegas 527096 134844
88439 311463 38.3% 6.4% 127664 1375738 Los Angeles 509169 11041
29 83267
9 -1365120 4.1% 6.7% -162048 1236562
8 Louisville 96163 48692 17024 34381 8.3% 1.5% -16939 1162414 Memphis 99730 85501 20490 -8583 8.3% 1.7% -22417 1205196 Miami 539059 21142
9 52200
9 -287135 10.8% 10.4% 157033 5007992
Milwaukee 58924 79960 27832 -74453 3.9% 1.9% -53409 1500743 Minneapolis 301002 24826
9 87393 -19731 10.1% 2.9% 5105 2968812
Nashville 270475 92538 37656 123199 20.6% 2.9% 50860 1311789 New Orleans -126531 50577 14730 -301731 -9.6% 1.1% -92538 1316512 NY-NJ 746357 10674
18 11161
51 -1962055 4.1% 6.1% 102616 1832343
9 Oklahoma City
131856 72812 24686 41082 12.0% 2.3% -6128 1095422 Orlando 437863 11876
2 98233 225259 26.6% 6.0% 126188 1644558
Philadelphia 281094 207749
127055
-115890 4.9% 2.2% -46370 5687158 Phoenix 111220
6 35622
5 22045
6 543409 34.2% 6.8% 320850 3251888
Pittsburgh -76129 -28994 19792 -52028 -3.1% 0.8% -24324 2431086 Portland 313958 12942
6 73697 121957 16.3% 3.8% 35497 1927883
Providence 17645 40116 36178 -49168 1.1% 2.3% -15592 1582997 Raleigh-Cary 328717 91627 38323 194361 41.2% 4.8% 70264 797110 Richmond 141243 53649 17712 75886 12.9% 1.6% 51295 1096944 Riverside 888296 34081
1 94356 469093 27.3% 2.9% 165058 3254817
Sacramento 330503 132100
66774 141117 18.4% 3.7% 39730 1796852 St. Louis 130326 10567
2 31067 -43750 4.8% 1.2% -79687 2698664
Salt Lake City 161410 136542
42771 -34428 16.7% 4.4% -197772 968883 San Antonio 360412 15944
6 33261 177447 21.1% 1.9% 130999 1711716
San Diego 239959 241828
103448
-126860 8.5% 3.7% 71622 2813834 San Francisco 194108 25134
2 26651
9 -347375 4.7% 6.5% -197772 4123745
San Jose 103882 174434
176435
-240012 6.0% 10.2% -139219 1735818 Seattle-Tacoma
363951 196790
131366
40741 12.0% 4.3% 137619 3043897 Tampa-St. Pete
351258 27635 76592 260333 14.7% 3.2% -14309 2396014 Virginia Beach
97573 107040
2013 -20005 6.2% 0.1% 60909 1576925 Washington DC
680167 441100
320474
-107305 14.2% 6.7% 276626 4796074 AVERAGE 326354 20804
2
13557
7
-39710 12.9% 3.7% 22139 2999531

33
approximately 225,000 or 136,000 immigrants, respectively.
A significant 49% correlation exists between increases in immigration and
increases in population (columns 2 and 4), but a fairly weak, 15% relationship occurs
between migration and population changes (columns 2 and 5). Many of the nation’s
largest cities, including New York, Los Angeles, Chicago and Philadelphia, suffered from
negative migration, but still gained people, largely due to immigration.
St. Louis’s increase of 130,000 residents --including 31000 immigrants, which
represented 1.2% of the population -- was relatively small. Cities that lost population:
Buffalo, Cleveland, Detroit, Pittsburgh and New Orleans all received relatively few
immigrants as a share of population. Columbus, Kansas City and Nashville, with
populations substantially smaller than St. Louis, experienced net changes in population
approximately double St. Louis. All three cities also had larger influxes of immigration.
A number of cities including Indianapolis, Louisville and Nashville doubled their
foreign-born over the decade, and passed 100,000 for the first time.
Job Impact of Immigration
Immigration increases Employment
The statistical evidence shown below in equations (1A)-(1D) establish that both
domestic migration (MIG) and immigration (IMG) changes are very significant factors
in explaining job creation (EMP) over the last decade. Equation (1A) implies that an
increase of 1000 immigrants leads to 660 jobs in a city, and equation (1B) shows that a
1% increase in immigration leads to a .76% increase in job creation.
Immigration Effect on Employment
EMP = -47259 + .66 IMG + .37 MIG Adj. R2=52% (1A)
(17621) (0.11) (0.07)
% EMP = -.023 + .76% IMG + .70% MIG Adj. R2=62% (1B)
(0.01) (0.13) (0.08)
The regression results support the observation that a central reason for
lackluster employment growth in St. Louis over the past decade is due to low
immigration inflows. Average immigration for other large cities (in the top 20) is 5.3%
34
over this period. If St. Louis had received immigrants at this rate, the region would
have experienced an influx of 144,000 immigrants. In this case, the regions’
employment growth rate is estimated to have grown 91-95000 using (1A) or (1C);
employment growth would have increased 4%-7.4% using (IB) or (ID).4 Instead, over
the past decade, employment growth for St. Louis was -3.2% compared to +2% for the
country. Therefore, below average immigration significantly explains the low
employment growth in the region.
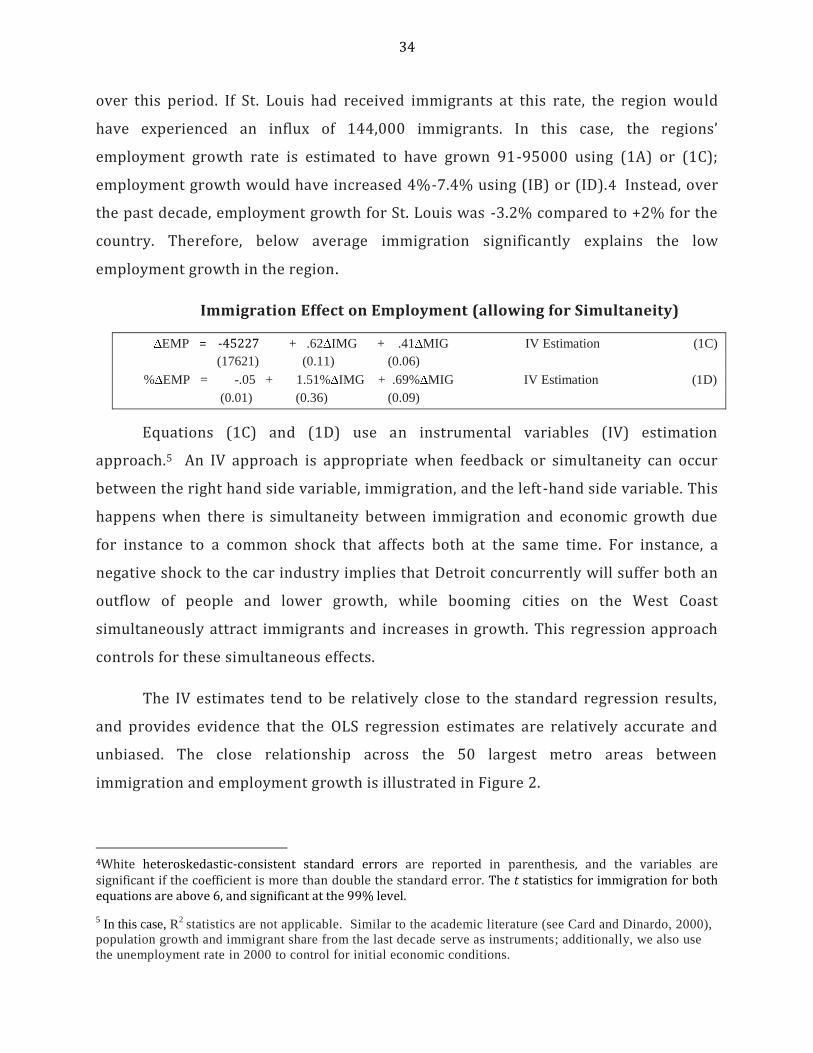
Immigration Effect on Employment (allowing for Simultaneity)
EMP = -45227 + .62 IMG + .41 MIG IV Estimation (1C)
(17621) (0.11) (0.06)
% EMP = -.05 + 1.51% IMG + .69% MIG IV Estimation (1D)
(0.01) (0.36) (0.09)
Equations (1C) and (1D) use an instrumental variables (IV) estimation
approach.5 An IV approach is appropriate when feedback or simultaneity can occur
between the right hand side variable, immigration, and the left-hand side variable. This
happens when there is simultaneity between immigration and economic growth due
for instance to a common shock that affects both at the same time. For instance, a
negative shock to the car industry implies that Detroit concurrently will suffer both an
outflow of people and lower growth, while booming cities on the West Coast
simultaneously attract immigrants and increases in growth. This regression approach
controls for these simultaneous effects.
The IV estimates tend to be relatively close to the standard regression results,
and provides evidence that the OLS regression estimates are relatively accurate and
unbiased. The close relationship across the 50 largest metro areas between
immigration and employment growth is illustrated in Figure 2.
4White heteroskedastic-consistent standard errors are reported in parenthesis, and the variables are significant if the coefficient is more than double the standard error. The t statistics for immigration for both equations are above 6, and significant at the 99% level.
5 In this case, R
2 statistics are not applicable. Similar to the academic literature (see Card and Dinardo, 2000),
population growth and immigrant share from the last decade serve as instruments; additionally, we also use
the unemployment rate in 2000 to control for initial economic conditions.

35
Figure 2 Figure 3 Relationship between Immigration Relationship between Immigration
and Employment Growth and Income Growth
Correlation=43% Correlation=45%
Immigration increases Income Growth of a Metro
Equations (2A)-(2D) present the relationship between immigration and income
(INC). A 1000 person increase in immigration raises the personal income of a metro area
by $11,570 (income is in 1000s). The coefficient estimates are very significant and the
adjusted R2 statistics high, indicating that immigration and migration changes are closely
related to changes in income.
The IV estimates again are very close to the standard regression estimates, and
support the robustness of the findings. If St. Louis experiences immigrant inflows
equivalent to other cities in the top 20, our income would increase by $1.7 billion due
to immigration. A 1% increase in immigration implies a .8% increase in personal
income. An immigration growth comparable to other large metros indicates that St.
Louis income would be 4% higher over the decade. This would close approximately
20% of the gap between the region’s slow income growth and the rest of the country.
Figure 3 illustrates the strong positive relationship between income and immigration
growth.
Immigration Effect on Income
INC = 1366489 + 11.57 IMG - 1.62 MIG Adj. R2=91% (2A)
(17621) (0.99) (0.52)
% INC = -.046 + .82% IMG + .57% MIG Adj. R2=52% (2B)
(0.014) (0.34) (0.084)
-.3
-.2
-.1
.0
.1
.2
.00 .02 .04 .06 .08 .10 .12
Immigrant Growth
Em
ploy
men
t Gro
wth
-.20
-.16
-.12
-.08
-.04
.00
.04
.08
.12
.16
.00 .02 .04 .06 .08 .10 .12
Immigrant Growth
Inco
me
Gro
wth

36
INC = 1685128 + 9.96 IMG - 1.61 MIG IV (2C)
(22613) (1.66) (0.68)
% INC = -.041 + .77% IMG + .61% MIG IV (2D)
(0.015) (0.39) (0.08)
Immigration increases Jobs and Lower Unemployment for African Africans
Equations (3A)-(3D) delineate the relationship between immigration and African-
American economic welfare. Due to data availability, we have 31 cities and report only
percent changes. Equations (3A) and (3C) as well as Figure 4 show that a significant
positive relationship exists between immigration and employment growth for African
Americans.
Immigration Effects on African American Economic Prospects
% AAEMP = .50 + 1 .18% IMG + .08% MIG Adj. R2=17% (3A)
(0.02) (0.36) (0.08)
% AAUN = .17 + -.45% IMG - .03% MIG Adj. R2=4% (3B)
(0.02) (0.22) (0.06)
% AAEMP = .48 + 1 .59% IMG + .08% MIG IV (3C)
(0.02) (0.44) (0.11)
% AAUN = .18 + -.63% IMG - .04% MIG IV (3D)
(0.01) (0.31) (0.06)
Figure 4 Figure 5 African-American Job Growth African-American Unemployment and Immigration Growth and Immigration Growth
Correlation=44% Correlation=-22%
.40
.44
.48
.52
.56
.60
.64
.68
.72
.00 .02 .04 .06 .08 .10 .12
Immigrant Growth
Afri
can
Am
eric
an E
mpl
oym
ent G
row
th
.08
.12
.16
.20
.24
.28
.00 .02 .04 .06 .08 .10 .12
Immigrant Growth
Afri
can
Am
eric
an U
nem
ploy
men
t

37
Equations (3B) and (3D) along with Figure 5 illustrate that immigration decreases
unemployment in the African American community. Expanding immigration by 4%
(typical of most large cities) can lower the unemployment rate for African Americans
by a significant 2.5% in St. Louis.
Additional Economic Impact The economic effects of immigration are further explored with two larger
samples. We present these two additional datasets for several reasons. The second
dataset uses 134 cities and represents more than 85% of all immigrants in the U.S. This
larger sample allows for more accurate estimation, but data are not available on
domestic migration flows. The BLS provides data on wages, unemployment and labor
force participation rates. The third dataset considers a much larger annual dataset of
363 cities from 2005-2010, and for 198 cities from 2000-2010. This dataset has 1960
observations and its advantages are that it uses annual data, has migration information
and is substantially larger. Very few academic studies have employed a sample of
cities this large, and none have used recent annual data as the Census only began
reporting annual immigration flows in 2000 for some cities, and most metros by 2005.
Equations (4A)-(4B) demonstrate a significant, positive and economically large
impact of immigration on employment. An increase of 1000 workers creates 1970 jobs;
according, if St. Louis had immigration of 144,000 (not 31,000), our region is estimated
to have created 262,000 more jobs over the decade. If St. Louis had more typical
immigration patterns, it would have experienced an 3-5% increase in job creation.
Figure 6 illustrates this positive significant relationship across cities. Equations (5A)
and (5B) and Figure 7 demonstrate that increases in immigration raises the labor force
participation rate considerably, and implies that immigration leads to more jobs for
native-born Americans.
Immigration Effects on Employment and Labor Force Participation
EMP = 532425 + 1.97 IMG Adj. R2=53% (4A)
(64640) (0.15)
% EMP = -.03 + .61% IMG Adj. R2=12% (4B)
(.01) (0.27)
EMP = 217422 + 5.26 IMG IV (4C)

38
(16919) (2.28)
% EMP = -.06 + 1.31% IMG IV (4D)
(.01) (0.34)
DLFP = -.002 + . 62% IMG Adj. R2=13% (5A)
(.001) (0.26)
DLFP = -.024 + 1.07% IMG IV (5B)
(.001) (0.32)
Figure 6 Figure 7
Employment Growth Labor Force Participation Growth and Immigration Growth and Immigration Growth
Correlation=43% Correlation=19%
Equations (6A)-(6D) indicate that an increase in immigration significantly
augments income. The coefficient estimates show that an increase in immigration
increases a cities GDP by $30,700-74,240 person. These estimates are larger than 2A-
2D and are more consistent with the data, as average immigrant earnings approximate
these estimates. A 1% increase in immigration increases income by .7%, implying that
if St. Louis had an immigration rate of other large cities, its income over the past
decade would be 7% higher (using the IV estimates in 6D) and income would be $11.4
billion higher (using the IV estimates in 6C). These are economically substantial
estimates, and imply that immigration has very sizeable positive effects on a metro’s
output.
-.3
-.2
-.1
.0
.1
.2
.3
.4
-1.00 -0.75 -0.50 -0.25 0.00 0.25 0.50 0.75 1.00
Immigrant Growth
Em
ploy
men
t Gro
wth
.82
.84
.86
.88
.90
.92
.94
.96
-1.00 -0.75 -0.50 -0.25 0.00 0.25 0.50 0.75 1.00
Immigrant Growth
Labo
r For
ce P
artic
ipat
ion

39
Immigration Impact on Income
INC = 5947530 + 30.70 IMG Adj. R2=59% (6A)
(839583) (3.22)
% INC = .27 + . 70% IMG Adj. R2=7% (6B)
(.01) (0.20)
INC = 1774619 + 74.24 IMG IV (6C)
(21691) (34.01)
% INC = .23 + 1.52% IMG IV (6D)
(.02) (0.04)
Immigration Increases Wages
Consistent with the academic literature, we also find that immigration has
modest positive effects on wages. An increase in 1000 immigrants will raise the wage
rate by $20. Low immigrant inflows over the last decade in St. Louis led to an increase
of $600 per person. However, given comparable immigration rates of other large
metros, wages would have increased by $2800; a very significant sizeable amount of
money. Equation (7B) and (7C) shows that cities with a higher immigrant share in
2000 had greater wage increases from 2000-2010; e.g., (7C) finds that if St. Louis had
an immigrant share equal to other large cities, its wage increases would be 14% higher.
Impact of increasing immigration Impact on Wages and Labor Force
WAGE = 11286 + . 02 IMG Adj. R2=6% (7A)
(216 ) (0.006)
WAGE = 11286 + 7104IMG2000/POP2000 Adj. R2=3% (7B)
(315 ) (2810)
Log(Wage2010) = 10.62 + .46IMG2000/POP2000 Adj. R2=8% (7C)
(.02) (.22)
DLFP = -.002 + . 62% IMG Adj. R2=13% (7D)
(.001) (0.26)
Figures 8 and 9 illustrate the positive relationship between immigration and
wages; higher immigration is strongly correlated with higher wage growth, and more
immigrants in a city are significantly related to higher wages. Lastly, higher
immigration growth leads to higher labor force participation rates, which means
higher employment for everyone. For conciseness, we do not report the IV results.

40
Figure 8 Figure 9 Income Growth and Wages in 2010 and Immigration Growth Immigration share of Population
Correlation=45% Correlation =32%
Results further highlight that metros with higher immigrant shares in 2000 had
higher employment and income growth over the next decade, implying that cities with
plenty of immigrants are more likely to grow faster than other cities. This relationship
is significant and shown in Figures 9 and 10, and Equations: (8A)-(9B). The
relationship further is not subject to endogeneity problems as IV estimation (not
shown for conciseness) also reveals a significant relationship between employment,
income and immigration.
Impact of Rising Immigration Share on Income
EMP= 38849 + 659505IMG2000/POP2000 Adj. R2=23% (8A)
(13560) (104460)
EMP = -.030 + . 27 IMG2000/POP2000 Adj. R2=5% (8B)
(.01) (0.10)
INC= -1059581 + 96110752 IMG2000/POP2000 Adj. R2=22% (9A)
(2008953) (15475558)
INC = .27 + . 37%% IMG2000/POP2000 Adj. R2=4% (9B)
(.02) (0.14)
-.1
.0
.1
.2
.3
.4
.5
.6
.7
-1.00 -0.75 -0.50 -0.25 0.00 0.25 0.50 0.75 1.00
Immigrant Growth
Inco
me
Gro
wth
20,000
30,000
40,000
50,000
60,000
70,000
80,000
90,000
.0 .1 .2 .3 .4 .5 .6
Immigration/Population 2010
Wag
e 20
10

41
Figure 9 Figure 10 Employment Growth Income Growth and Immigration Share and Immigration Share
Correlation = .32 Correlation = .21
Immigration Lowers Unemployment
Increases in immigration further lead to lower unemployment rates, and hence
that data supports the hypothesis that St. Louis can lower both its white and African
American unemployment rates by encouraging more immigration. This result is
consistent with the literature that finds that immigrants through their spending
patterns and their entrepreneurship lead to additional employment and lower
unemployment for individuals born in the U.S. Figures 11 and 12 clearly illustrate the
negative relationship between immigration and unemployment, and significantly
refutes the myth that immigration increases unemployment rates.
Immigration impact on Unemployment
%UNEMP = 10.2 - 1.60% IMG Adj. R2=3% (10A)
(.26) (.63)
UNEMP = 6.11 - 1.09% IMG Adj. R2=2% (10B)
(.22) (.53)
-.3
-.2
-.1
.0
.1
.2
.3
.4
.0 .1 .2 .3 .4
Immigrant Share
Em
plo
ym
en
t G
row
th
-.1
.0
.1
.2
.3
.4
.5
.6
.7
.0 .1 .2 .3 .4
Immigrant Share
Inco
me
Gro
wth

42
Figure 11 Figure 12
Unemployment Rate Change in Unemployment Rate
and Immigration Growth and Immigration Growth
Correlation = -19% Correlation = -15%
Next, we turn to the annual database, and for conciseness report only the IV
results as endogeneity between annual economic flows could be high. We control for
initial population, initial immigration share, and economic conditions (unemployment
and low wages). Results in equations (11)-(12) show that a 1% increase in
immigration over two years significantly increases employment by .8%. New
immigrants lead to sizeable employment gains over a two year period; e.g., an increase
of 20,000 immigrants to St. Louis, or 0.0074% of our population, would over two years
lead to an increase in employment of 21,600 workers. If this were repeated over a
decade, St. Louis’ immigrant share would climb to 386,000 or 12% (still less than most
metros in the top 25), and the region would create more than 200,000 jobs over 10
years. These results again confirm the importance of immigration in generating job
growth, and the reason for our region’s job losses over the last several years or decade.
Income estimates indicate that an inflow of 20,000 immigrations leads to .75%
rise in income over two years. Over a decade, higher immigration could boost income
by 7% in the region. This is equivalent to $8 billion of spending, and similar to our
estimates in equation (5). Immigration further has significant positive effects on labor
4
6
8
10
12
14
16
18
-1.00 -0.75 -0.50 -0.25 0.00 0.25 0.50 0.75 1.00
Immigrant Growth
Un
em
plo
ym
en
t
0
2
4
6
8
10
12
-1.00 -0.75 -0.50 -0.25 0.00 0.25 0.50 0.75 1.00
Immigrant Growth
Ch
an
ge
s in
Un
em
plo
ym
en
t

43
force participation rates and wages, and also leads to significant reductions in
unemployment. The statistical evidence indicates that immigration affects economic
activity not only over a decade, but also on a yearly basis.
Lastly, (16) shows that increases of immigration have positive effects on
migration flows not negative; hence, it supports the work of Card and Dinardo (2000)
among others that indicate that immigration does not induce negative domestic
migration. Overall, the statistical analyses paint a very clear picture:
Immigration significantly and substantially increases Jobs, Income & Wages.
Immigration reduces for Unemployment for both Whites and African-Americans.
Annual Immigration Impact on Employment, Income, Labor Force & Unemployment
EMPt = -4912 + .42 IMGt + 0.66 IMGt-1 -1.45 MIGt - .20 MIGt-1 (11A)
(.002) (.08) (.12) (.46) (.10)
EMPt = -0.02 + 0.14% IMGt + 0.66% IMGt-1 -1.45% MIGt - .20% MIGt-1 (11B)
(.002) (.08) (.12) (.46) (.10)
INCt = -.01 + 318 IMGt + 335 IMGt-1 -3.2 MIGt + 6.8 MIGt-1 (12A)
(.002) (80) (82) (4.2) (1.09)
INCt = -.01 + 0.64% IMGt + 0.34% IMGt-1 +0.03% MIGt + .04% MIGt-1 (12B)
(.002) (.06) (.03) (.02) (.05)
EMP/ LFt = -0.03 + 0.27% IMGt + 0.50% IMGt-1 -0.70% MIGt - .07 MIGt-1 (13)
(.002) (.04) (.07) (.30) (.07)
Waget = 0.1 + 0.23% IMGt + 0.12% IMGt-1 + 0.01% MIGt + .01 MIGt-1 (14)
(.002) (.02) (.01) (.01) (.01)
UNt = 2.81 - 25.2% IMGt - 45.9% IMGt-1 + 65.4% MIGt - 6.7 MIGt-1 (15)
(.26) (4.04) (7.06) (27.53) (6.3)
% MIGt = -.001 + .23% IMGt-1 - .14% MIGt-1 + .001 UNt (16)
(.004) (.05) (.04) (.001)

44
V Best Practices to Promote Immigration: What Can St. Louis Do?
Across the country, dozens of metropolitan areas are initiating plans to improve
opportunities for all immigrants by creating networks that link immigrants to each
other and employers, hiring interpreters and translators, making important documents
available in foreign languages, and streamlining business processes. Many metros
efforts are promoting economic development through initiatives aim at attracting both
foreign companies and workers. Local leaders hold the key by setting a welcoming
environment for immigrants through successfully integrating them in neighborhoods,
schools and the local economy. The local chambers of commerce should be engaged in
setting up networks to connect the foreign-born to other immigrants, local businesses,
possible mentors and community banks to facilitate funding.
Nashville has half the population of St. Louis, but the same number of
immigrants, most of them relatively new arrivals. Hence, unlike St. Louis over the last
decade, Nashville has experienced both significant job growth and a sharp influx of
immigrants. To encourage and accommodate the foreign-born, Nashville has
introduced the “New American Coalition” that promotes the “two-way integration of
foreign-born and native-born Nashville communities and institutions.” The Coalition is
sponsored by the Greater Nashville Regional Community Foundation in partnership
with a range of local immigration resource service providers, and offers primary
leadership on integration processes. Coalition efforts include promoting citizenship
and civic engagement, training immigrants in strategic communications and nonprofit
management, and developing the area workforce through tactics including advocating
for needed vocational classes.
According to the National League of Cities, Louisville has also been successful in
integrating immigrants. Louisville’s Office of International Affairs (OIA) works to create a
multicultural community and to serve all members of the community, particularly new
residents. The OIA works to integrate immigrants and refugees into Louisville by
connecting them to governmental and non-governmental resources and by serving as an
information clearinghouse. Greater Louisville International Professional (GLIP) expedites
connections between international professionals, their peers and local business leaders.

45
These relationships help navigation through the assimilation process, mentor progress,
open new lines of communication and celebrate success. Louisville also hosts an annual
two-day WorldFest every Labor Day weekend that is the largest collection of local ethnic
restaurants, vendors and exhibitors at any one event in the state of Kentucky. The
Louisville plan targets four groups to increase the pool of immigrant professionals: (i)
foreign-born students studying in local colleges and universities, (ii) foreign-born
students eager to come to study in Louisville, (iii) foreign professionals living in the
U.S., and (iv) professionals living abroad, but interested in coming to work in the U .S.
One suggestion by Dean Gupta of the Olin Business School at Washington
University is to build housing solely for foreign-born students, and encourage them to
attend our region’s universities by making it easy for them to obtain unpaid, but for
credit internships in our local area businesses. After graduation, these students would
be encouraged to remain in St. Louis by providing them with jobs. This strategy
benefits everyone. The region has already invested in them, by providing both
education and skills, and the students can enjoy the fruits of their past hard work, and
reinvest in St. Louis with their human and physical capital.
Columbus’s immigrant initiative focuses on improving access to education,
housing and healthcare by limiting language barriers. Princeton residents issue ID
cards that can be used as forms of identification by check cashing companies, banks,
retail stores and other establishments.
The National League of Cities (NLC) is partnering with the city of Indianapolis
and the International Center of Indianapolis to promote immigrant integration
throughout the city of Indianapolis. It reports that policy actions of the mayor’s office
have led to a cohesive community that boosts business and international trade. The
city is working together to improve public safety and better access to city services,
including Spanish translation, a welcome center, ESL programs, public transportation
information, bilingual tax preparation assistance and lists of city regulations. It
coordinates activities with the business community through private and public
initiatives that strengthened Mexico-U.S. trade relations in Indianapolis, neighborhood
beautification programs and city-wide recreational and cultural events.

46
Here are some examples that the NLC reports (Gambetta and Gedrimaite, 2010)
as effective practices in promoting immigration:
• Cooperate with municipal agencies. As a part of their local immigrant integration plan, cities should develop a comprehensive cross-sectional immigrant integration strategy among local government and municipal agencies and make sure that their city’s strategy for immigrant integration is compatible with its broader social inclusion plan. • Engage the host community. Cities should engage the host community, including immigrant organizations, faith-based organizations and the business sector, in establishing key partnerships regarding immigrant integration programs and initiatives. • Establish mayoral advisory boards and immigrant affairs offices. Cities should consider the establishment of mayoral immigrant advisory commissions and Immigrant affairs offices to address local immigrant integration challenges in addition to designating a senior city official to lead and coordinate city and community efforts to improve communication between the local government and the immigrant community. • Recognize immigrant contributions to the economy. Cities should maximize the contributions of the immigrant community to their local economies while facilitating their integration into the civic and political life of their communities by developing a strategy to encourage civic engagement and naturalization among their local immigrant population. • Eliminate language barriers. Language barriers are significant obstacles in the life of immigrant residents, and cities should develop a strategy to eliminate these barriers as well as promote adult literacy in their communities.
For instance, the NLC reports that Richmond’s Hispanic Liaison Office offers multiple
essential services including oral interpretation assistance for city departments and services
and translation of written documents and forms, a network system of contacts for
everything from medical clinics to legal assistance to cultural groups, and information on
educational classes such as English classes or Spanish classes. Richmond’s office “also
provides free tax assistance programs and supports new Americans in obtaining passports
and identification documents. In addition, this office sponsors the Imagine Festival, which
highlights Richmond’s diverse community and promotes public safety among minority
communities.”
Additionally, Cleveland, Detroit, Louisville, Minneapolis and Philadelphia have
published interesting policy papers that detail the important contributions that
immigrants make to the community, and suggestions that their cities can implement to

47
improve immigration. Cities such as Dayton recently have unanimously approved
plans to help immigrants navigate the system and to establish themselves in the
community. The Dayton plan includes recommendations to create an international
marketplace and to increase language services and English classes. Detroit and
Cleveland, furthermore are jumpstarting campaigns to combat their population and
economic declines by encouraging immigration.
For instance, Cleveland’s plan (Gaylord, 2010) includes seven concrete steps to
support immigrants and their families, to ease immigrant’s transition into the economy
and link public and private partners. Cleveland’s welcome strategy calls for art and
cultural initiatives, minority and immigrant regional business alliances, mentor
program/network for international business people, increasing the EB-5 Investor Visa
Program, Coordinating Foreign Investment and Trade Missions and Micro-Loans and
Technical help for immigrant, minority-owned business. A Cleveland Plus International
Economy Center is planned, and designed to increase networking opportunities by
bringing together business people from local and international chambers of commerce
and ethnic and minority business groups. Cleveland further plans Urban Youth
Knowledge Initiatives, similar to Philadelphia, manned largely by local volunteers that
help immigrant children in school.
Detroit’s blueprint (Global Detroit, 2010) is designed to encourage the
untapped potential immigrants possess for revitalizing regional populations and
economies, including more entrepreneurship, diversity and multi-national
connectivity. Their plan includes efforts to make the region friendlier to both
immigrants and the international community, which would then attract international
investment and businesses to the region. Global Detroit embraces eleven initiatives
including attracting and retaining foreign students at local universit ies along with
implementing an EB-5 investor visa program. The EB-B program allows foreign
investors who invest $1 million in an American business that creates 10 jobs to receive
permanent legal residency for themselves and their immediate family.
Detroit has further created a regional cultural ambassadors program that serves
as a “Welcome Mat” to help integrate foreign-born workers and their families. This

48
initiative relies on volunteer “teams” of business people, students, expatriates, and
those doing business with different foreign cultures. The Welcome Mat committee
recruits and trains individuals to do public engagement and maintains contact with the
growing number of supporters it has identified in its community. Their function is to
communicate to the public the successes of immigrants. This strategy centers on
engaging members of the U.S.-born community in venues that are convenient and
comfortable for them. Some examples include places of worship, community centers,
civic clubs, local schools, and universities. Ideal presentations and dialogue sessions
are facilitated by at least one native-born resident and one recent immigrant from the
community. Individuals who facilitate such conversations are called “welcoming
ambassadors,” and are trained by local Welcoming affiliates or Welcoming Committee .
Philadelphia’s Welcoming Center for New Pennsylvanians is an immigration
resource center committed to raising awareness and advancing public policy on the
contribution of immigrants in creating a prosperous Philadelphia. The Welcoming
Center advocates for strategies that facilitate immigration’s role in regional population
growth, neighborhood revitalization, and economic development. They have produced
an interesting report that lists best practices that highlights innovations and
achievements from around the nation for assisting immigrants to better assimilate and
contribute to urban civic life. Their document includes practices of other cities and
includes a long list of recommendations.
Overall, many cities have shown the positive economic effects of immigration on
their community and have concrete plans or are in the process of initiating strategies
to welcome immigrants as a way to rebuild downturn and improve their economy. A
successful immigration strategy is less about dollars, than reducing bureaucratic
hurdles plus a change in mind-set of our local business leaders and public. Licenses to
open small businesses should be easy to obtain, a single window counter with simple
rules. The region should campaign against hurdles such as strict language
requirements for driver’s licenses.
St. Louis has survived for decades with low immigrant inflows, and is often
known as the smallest big town in America. Inertia is a powerful force. To overcome

49
this lethargy and reverse our poor job creation prospects, companies should not be
encouraged to hire immigrants, but be “immigrant agnostic” – not care about the
birthplace of their applicant. The public should not view immigrants with suspicion,
but realize they contribute tax revenue to the community. A successful immigrant
strategy can build on itself through social-based media. Once immigrants find that St.
Louis is providing a welcoming, pro-business environment regardless of origin, news
will spread and St. Louis can expect more more-qualified workers, consumers and
taxpayers.
Immigration is about people. To grow and thrive, cities, like companies, need
both workers and customers to produce and consume their products. Given aging
demographics and outward migration, St. Louis population, both its workforce and
consumers, are shrinking. The economic and statistical evidence clearly shows that for
St. Louis to reverse its decade of job losses and poor economic progress, it needs to
promote immigration as an important part of a pro-growth economic agenda.
Immigrants improve our local economy by working here, pay taxes and spending on
local business, thereby enlarging the economic base for everyone, both native and
foreign-born. Immigration can jumpstart St. Louis’ job engine, encourage large
companies to expand or relocate here and fuel new small business formation.

50
References
American Enterprise Institute, (2011). “Immigration and American jobs”. http://kamerican.com/GNC/new/secondary_contents.php?article_no=13&no=1844
Anderson, Stuart and Michaela Platzer, (2006). “American Made: The Impact of Immigrant Entrepreneurs and Professionals on U.S. Competitiveness.” National Foundation for American Policy. http://www.nvca.org/
Borjas, G., (2003). “The Labor Demand Curve is Downward Sloping: Re-examining the Impact of Immigration on the Labor Market.” Quarterly Journal of Economics 118, 1335-1374.
Borjas, George, Richard B. Freeman and Lawrence F. Katz, (1997). “How Much Do Immigration and Trade Affect Labor Market Outcomes?” Brookings Papers on Economic Activity, 1-90.
Brookings Institution, (2012). “Immigrant Workers in the U.S. Labor Force.”
http://www.renewoureconomy.org/brookings
Butcher, Kristin F. and David Card, (1991). “Immigration and Wages: Evidence from the 1980's.” American Economic Review 81 (2), 292--296.
Card, David, (2001). “Immigrant Inflows, Native Outflows, and the Local Labor Market Impacts of Higher Immigration.” Journal of Labor Economics 19(1), pp. 22–64.
Card, David, (2005), “Is the New Immigration Really so Bad?” Economic Journal, Vol 115, 57, F300-
323, November.
Card, David, (2007). “How Immigration Affects U.S. Cities.” University College London, Centre for Research and Analysis of Migration Discussion Paper 11/07.
Card, David, (2009). “Immigration and Inequality”. American Economic Review Papers and
Proceedings, (99):1-21.
Card, David and John Dinardo, (2000). “Do Immigrant Inflows Lead to Native Outflows?” American
Economic Review, 90, 2 360-367, May.
Card, D. & E. G. Lewis, (2005). “The Diffusion of Mexican Immigrants during the 1990s: Explanations and Implications.” NBER Working Paper 11552. http://www.cream-migration.org/publ_uploads/CDP_04_05.pdf
CNN, (2011) “Against the grain, Dayton, Ohio, embraces immigrants.” By Mariano Castillo, October 8. http://www.cnn.com/2011/10/08/us/ohio-dayton-pro-immigrant/index.html?iphoneemail
Deloitte, (2011). “Boing point? The skills gap in U.S. manufacturing.” http://www.deloitte.com/assets/Dcom-UnitedStates/Local%20Assets/Documents/AD/us_PIP_2011SkillsGapReport_01142011.pdf

51
Fairlie, Richard, (2011). “Kaufman Index of Entrepreneurial Activity 1996-2010.” Kaufman
Foundation .
Fennelly, Katherine and Anne Huart, (2010). “The Economic Impact of Immigrants in Minnesota.” Report to the Minnesota Business Immigration Reform Coalition. Fiscal Policy Institute, (2009). “Immigrants and the Economic Contribution of Immigrant Workers to the Country’s 25 Largest Metropolitan Areas.” http://www.fiscalpolicy.org/ImmigrantsIn25MetroAreas_20091130.pdf Follain, James, (2010). “A Study of Real Estate Markets in Declining Cities.” Research Institute for Housing America special report. Mortgage Bankers Association. http://www.housingamerica.org/RIHA/RIHA/Publications/75154_10296_Research_RIHA_ShrinkingCities_Report.pdf Friedberg, Rachel H. and Jennifer Hunt, (1995). “The Impact of Immigrants on Host Country Wages, Employment, and Growth.” Journal of Economic Perspectives, 1995, 9, 23-44. Frey, William H., (1995). “Immigration and Internal Migration Flight: A California Case Study.” Population and Environment, 16 (4), 353--375. Frey, William H. (1996). “Immigration, Domestic Migration, and Demographic Balkanization in America: New Evidence for the 1990s, Population and Development Review, 22 (4), 741-763. William H. Frey, (2005). “Immigration and Domestic Migration in U.S. Metro Areas: 2000 and 1990 Census Findings by Education and Race.” Research Report 05-572, Population Studies Center, University of Michigan, http://www.psc.isr.umich.edu/pubs/pdf/rr05-572.pdf Gambetta, Ricardo and Zivile Gedrimaite, (2010). “Municipal Innovations in Immigrant Integration
20 Cities, 20 Good Practices.” National League of Cities memo.
Gaylord, Becky, (2010). “Cleveland Needs Immigrants Why and How to Welcome More Foreign-born Residents.” http://www.jewishcleveland.org/local_includes/downloads/42033.pdf Glaeser, Edward and Joshua Gottlieb, (2009) The Wealth of Cities: Agglomeration Economies and Spatial Equilibrium in the United States. http://www.economics.harvard.edu/faculty/glaeser/papers_glaeser “Global Detroit” (2010). http://www.thecenterformichigan.net/wp-
content/uploads/2010/05/GLOBAL_DETROIT.pdf
Greenstone, Michael and Adam Looney, (2010). “Ten Facts about Immigration.” The Hamilton
Project, Brookings. www.hamiltonproject.org/papers/ten_economic_facts_about_immigration/
Gruelich, Erica, John M. Quigley and Steven Raphael, (2004). “The Anatomy of Rent Burdens: Immigration, Growth and Rental Housing.” Brookings Papers on Urban Affairs 149-187. Hall, Mathew, Audrey Singer, Gordon F. De Jong, and Deborah Roempke Graefe, (2011).“The Geography of Immigrant Skills: Educational Profiles of Metropolitan Areas” Brookings. http://www.brookings.edu/papers/2011/06_immigrants_singer.aspx

52
Hunt, Jennifer and Marjolaine Gauthier-Loiselle, (2010). “How Much Does Immigration Boost
Innovation?” American Economic Journal: Macroeconomics 2, April : 31–56.
Izyumov, Alexei, Babu Nahata and Paul Coomes, (2001). “Attracting Immigrant Talent to the
Louisville Metropolitan Area: Recommendations.”
http://monitor.louisville.edu/immigration/immigrant.htm
Krugman, Paul, (1991a). “Increasing Returns and Economic Geography.” Journal of Political
Economy, 99(3):483-499.
Krugman, Paul, (1991b). Geography and Trade. Cambridge: MIT Press.
National Conference of State Legislatures (2004) , “Building the New American Community.” http://www.migrationpolicy.org/news/BNAC_REPT_SUM.pdf Massey, Douglas S., Luin P. Goldring, and Jorge Durand, (1994). “Continuities in Transnational Migration: An Analysis of 19 Mexican Communities.” American Journal of Sociology 99:1492-1533. Ottaviano, Gianmarco and Giovanni Peri, (2006). “Rethinking the Effects of Immigration on Wages.” NBER Working Paper #12497. Cambridge: NBER.
Ottaviano, Gianmarco I.P. and Giovani Peri, (2008). “Immigration and National Wages: Clarifying the Theory and the Empirics.” NBER Working Paper No. 14188. Cambridge, Mass.
Peri, Giovanni, and Chad Sparber, (2009). “Task Specialization, Immigration, and Wages.” American Economic Journal: Applied Economics 1(3), pp. 135–169.
Peri, Giovanni, (2007). “Immigrants Complementarities and Native Wages: Evidence from California.”
NBER Working Paper #12956. Cambridge: NBER.
Peri, Giovanni, (2009). “The Effect of Immigration on Productivity: Evidence from U.S. States.” NBER Working Paper 15507.
Pedraza, Silvia and Ruben Rumbaut, (1996). Origins and Destinies: Immigration, Race, and Ethnicity
in American History. ISBN: 0534214444
Saiz, Albert, (2003). “Room in the Kitchen for the Melting Pot: Immigration and Rental Prices.” Review of Economics and Statistics 85. 502-521. Saiz, Albert, (2007). “Immigration and housing rents in American cities,” Journal of Urban Economics
61 345–371
Shierholz, Heidi, (2010). “Immigration and Wages: Methodological advancements confirm modest gains for native workers.” Economic Policy Institute. www.epi.org/publication/bp255/
Stephen, Paula and Sharon Levin, (2001). “Exceptional contributions to U.S. science by the foreign-
born and foreign-educated.” Population Research and Policy Review, 20, 1-2, 59-79.

53
Thorp, Evangeline, (2004). “Immigration and Urban Revitalization in Philadelphia: Immigrant Entrepreneurship and improving opportunity in the local economy.” Toussaint-Comeau, Maude, (2006). “The Occupational Assimilation of Hispanic Immigrants: Evidence from Panel Data,” International Migration Review, Vol 40 (6). Wadhwa, Vivek, Guillermina Jasso, Ben Rissing, Gary Gereffi and Richard Freeman, (2007). “Intellectual Property, the Immigration Backlog and a Reverse Brain Drain” Kauffman Foundation.
West, Darrell, (2011). “Creating a "Brain Gain" for U.S. Employers: The Role of Immigration” Brookings Policy Brief #178. http://www.brookings.edu/papers/2011/01_immigration_west.aspx
Wilson, Jill and Audrey Singer, (2011). “ Immigrants in 2010 Metropolitan America: A Decade of Change. Brookings, State of Metropolitan American, 42.
Wright, R., M. Ellis, and M. Reibel, (1997). The linkage between immigration and internal migration in large metropolitan areas in the United States, Economic Geography, 73 (2), 234-253.

Figure I Population G
rowth in St. Louis City

Figure II Imm
igration Grow
th in St. Loius City

Figure III Population Grow
th in St. Louis Metro Area

Figure IV Imm
igration Grow
th in St. Louis Metro Area

V. Population Growth in the U
nited States

Figure VI Imm
igration Grow
th in the United States