Embed Size (px)
Citation preview
1
Michael J. Chow
NFIB Research Foundation
Washington, DC
January 13, 2016
The Economic Impact of H.R. 932 and Mandatory Paid
Sick Leave on U.S. Small Businesses
This report analyzes the potential economic impact of H.R. 932, also known as the Healthy
Families Act, on U.S. employers, workers, and economy. H.R. 932 would establish a minimum
time-off standard for paid sick leave by requiring employers with 15 or more employees to provide
workers with up to 56 hours of paid leave during each year. Paid sick time could be used to tend
to an injury or medical condition, care for family members, or, in the event an employee or family
member is a victim of domestic violence, to seek medical attention, assist the victim, seek
relocation, or take legal action. The mandate covers both full-time and part-time employees.
To estimate the economic impact of H.R. 932, the NFIB Business Size Insight Module
(BSIM), a dynamic, multi-region model based on the Regional Economic Models, Inc. (REMI)
structural economic forecasting and policy analysis model which integrates input-output,
computable general equilibrium, econometric, and economic geography methodologies.i The
underlying mechanics of the REMI model are based on decades of peer-reviewed literature.ii The
model is used by numerous clients in both the private and public sectors.iii By comparing
simulation results for scenarios which include proposed or yet-to-be-implemented policy changes
with the model’s baseline forecast, the REMI model is able to obtain estimates of how these policy
changes might impact businesses and their workers. Unique among large-scale econometric
forecasting models, the BSIM has the ability to forecast the economic impact of public policy and
proposed legislation on different categories of U.S. businesses differentiated by employee-size-of-
firm.
The paid sick leave mandate outlined in H.R. 932 would impose new costs on U.S. employers
that would lead to reduced profitability, lost sales and production, and lost jobs. Assuming passage
and implementation of H.R. 932 in 2016, the BSIM forecasts that the paid sick leave mandate
could result in 430,000 jobs lost over a ten-year period spanning 2016 to 2025. The cumulative
real output lost during this period is estimated to be $652 billion. Job losses at small firms would
account for 58 percent of all jobs lost, and small firms would bear 50 percent of lost output.
2
Description of New Employer Costs Generated by the Healthy Families Act
H.R. 932 would establish a minimum time-off standard for paid sick leave by requiring
employers with 15 or more employees to provide workers with up to 56 hours of paid leave
during each year. This mandate would impose three major costs on employers:
compensation costs associated with paying more workers taking paid time off, lost
production due to more workers taking leave, and paperwork and recordkeeping costs
incurred by complying with a new employer mandate. These three costs, and our attempts
to model them, are discussed in detail below.
A. Employee Compensation
A major cost to employers from this legislation is a “compensation cost” in the form of
compensation (both wages and benefits) transferred from employers to employees during
their additional paid time off. H.R. 932 would require employers at firms with 15 or more
employees to allow workers to accrue up to 56 hours of earned paid sick time at a given
time. Paid sick time could be used to tend to an injury or medical condition, care for family
members, or, in the event an employee or family member is a victim of domestic violence,
to seek medical attention, assist the victim, seek relocation, or take legal action. The
mandate covers both full-time and part-time employees. Workers would be entitled to
begin earning paid sick time at the commencement of their employment and could use it
starting on their 60th day of employment.
The size of employer compensation costs will depend on the amount of additional
paid time off that employees take, either for sick leave or to deal with the impact of
domestic violence in their lives. This study assumes that employees with newfound access
to paid sick leave will take an average of five paid sick days per year, or roughly 71 percent
of their newly available paid sick leave time.iv Workers already with access to paid sick
leave are assumed to not change the amount of paid leave they take after H.R. 932 is
implemented due to having to tend to injuries, medical conditions, or caring for family
members. The paid sick leave these workers have access to is also assumed to be
sufficiently generous that it satisfies the requirements of H.R. 932.
Compensation costs were estimated using data and assumptions regarding [1] the
number of U.S. employees newly eligible for paid sick leave under H.R. 932, [2] the
quantity of additional paid sick leave taken by employees if H.R. 932 passes, and [3] the
compensation of these employees. To estimate [1], industry-level estimates of the
percentage of workers without paid sick leave were multiplied by the number of workers
in those industries. This calculation produces an estimate of the number of employees with
no paid sick days—the set of employees newly eligible for paid sick leave if H.R. 932 were
implemented. The percent estimates of workers ineligible for paid sick leave are provided
by the U.S. Bureau of Labor Statistics and the Department of Agriculture. Industry-level
data on the number of private sector employees were obtained from the Census Bureau.
For illustrative purposes, estimates for the number of Ohio employees without paid sick
days are presented below in Table 1, by industry (right-most column).v
3
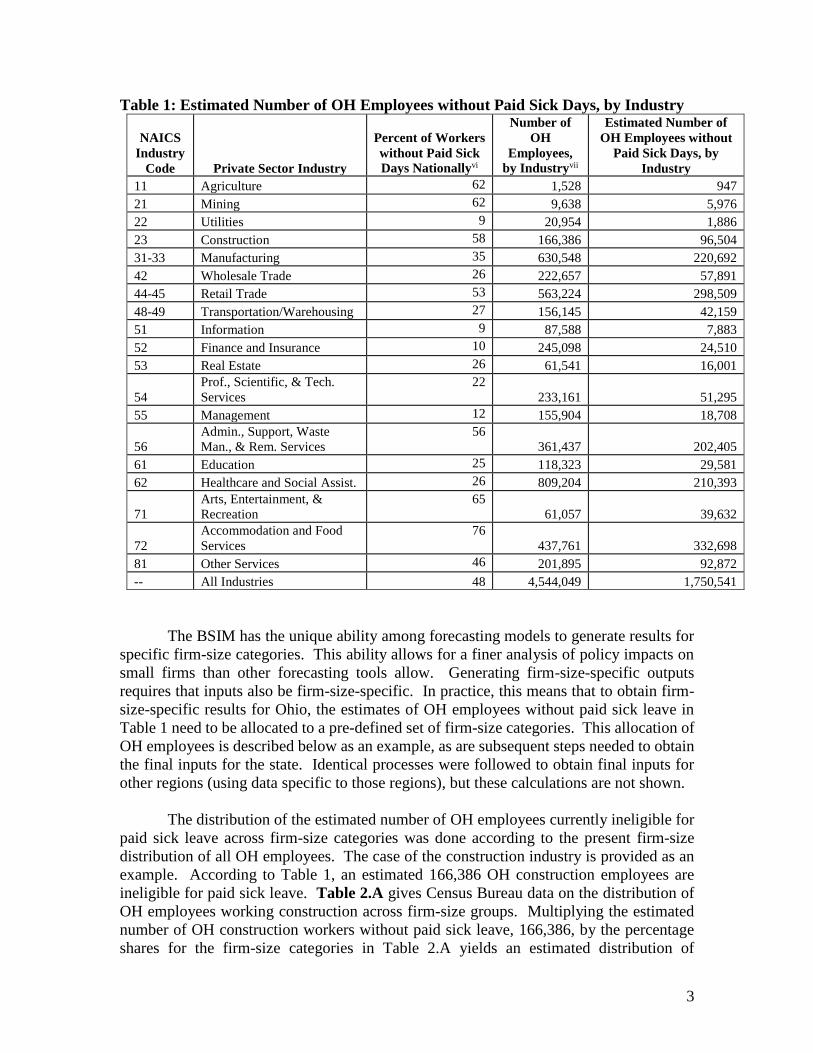
Table 1: Estimated Number of OH Employees without Paid Sick Days, by Industry
NAICS
Industry
Code Private Sector Industry
Percent of Workers
without Paid Sick
Days Nationallyvi
Number of
OH
Employees,
by Industryvii
Estimated Number of
OH Employees without
Paid Sick Days, by
Industry
11 Agriculture 62 1,528 947
21 Mining 62 9,638 5,976
22 Utilities 9 20,954 1,886
23 Construction 58 166,386 96,504
31-33 Manufacturing 35 630,548 220,692
42 Wholesale Trade 26 222,657 57,891
44-45 Retail Trade 53 563,224 298,509
48-49 Transportation/Warehousing 27 156,145 42,159
51 Information 9 87,588 7,883
52 Finance and Insurance 10 245,098 24,510
53 Real Estate 26 61,541 16,001
54
Prof., Scientific, & Tech.
Services
22
233,161 51,295
55 Management 12 155,904 18,708
56
Admin., Support, Waste
Man., & Rem. Services
56
361,437 202,405
61 Education 25 118,323 29,581
62 Healthcare and Social Assist. 26 809,204 210,393
71
Arts, Entertainment, &
Recreation
65
61,057 39,632
72
Accommodation and Food
Services
76
437,761 332,698
81 Other Services 46 201,895 92,872
-- All Industries 48 4,544,049 1,750,541
The BSIM has the unique ability among forecasting models to generate results for
specific firm-size categories. This ability allows for a finer analysis of policy impacts on
small firms than other forecasting tools allow. Generating firm-size-specific outputs
requires that inputs also be firm-size-specific. In practice, this means that to obtain firm-
size-specific results for Ohio, the estimates of OH employees without paid sick leave in
Table 1 need to be allocated to a pre-defined set of firm-size categories. This allocation of
OH employees is described below as an example, as are subsequent steps needed to obtain
the final inputs for the state. Identical processes were followed to obtain final inputs for
other regions (using data specific to those regions), but these calculations are not shown.
The distribution of the estimated number of OH employees currently ineligible for
paid sick leave across firm-size categories was done according to the present firm-size
distribution of all OH employees. The case of the construction industry is provided as an
example. According to Table 1, an estimated 166,386 OH construction employees are
ineligible for paid sick leave. Table 2.A gives Census Bureau data on the distribution of
OH employees working construction across firm-size groups. Multiplying the estimated
number of OH construction workers without paid sick leave, 166,386, by the percentage
shares for the firm-size categories in Table 2.A yields an estimated distribution of

4
construction employees without paid sick leave across firm-size categories (Table 2.B).
This process was repeated for most 2-digit NAICS industry categories to obtain a matrix
of estimated OH employees without paid sick leave by firm-size category and major
industry (Table 2.C), completing the estimation of [1].
Table 2.A: Distribution of OH Construction Employees, 2012
All Construction
Employees
No. of Employees per Firm
1-4 5-9 10-19 20-99 100-499 500+
No. of Employees 166,386 20,378 21,204 24,818 47,878 15,659 26,449
% of Employees 100.0% 12.2% 12.7% 14.9% 28.8% 15.4% 15.9%
Source: Census Bureau, Statistics of U.S. Businesses
Table 2.B: Estimated Distribution of OH Construction Employees without Paid Sick
Leave
All Construction
Employees without
Paid Sick Leave
No. of Employees per Firm
1-4 5-9 10-19 20-99 100-499 500+
No. of Employees 96,504 11,819 12,298 14,394 27,769 14,882 15,340
% of Employees 100.00% 7.5% 8.9% 12.1% 31.6% 22.8% 17.0%
Table 2.C: Estimated Number of OH Employees without Paid Sick Leave, by Firm
Size and Industry
Industry
No. of Employees per Firm
1-4 5-9 10-19 20-99 100-499 500+
Agriculture 192 109 109 244 186 109
Mining 334 461 574 926 983 2,699
Utilities 8 16 19 163 105 1,575
Construction 11,819 12,298 14,394 27,769 14,882 15,340
Manufacturing 2,917 5,534 9,562 39,025 45,909 117,745
Wholesale Trade 2,366 3,159 4,807 12,847 11,382 23,330
Retail Trade 11,868 15,642 16,269 34,406 20,766 199,557
Transportation/Warehousing 1,297 1,401 2,259 5,543 4,348 27,312
Information 109 146 237 791 760 5,840
Finance and Insurance 1,035 765 630 1,922 1,558 18,599
Real Estate 2,032 1,471 1,442 2,610 2,489 5,957
Prof., Scientific, & Tech. Services 5,113 4,608 5,491 10,270 8,263 17,550
Management 13 12 28 321 1,486 16,849
Admin., Support, Waste Man., &
Rem. Services 5,426 6,334 8,398 21,810 30,143 130,294
Education 451 746 1,205 5,958 4,873 16,348
Healthcare and Social Assistance 4,285 8,493 10,707 28,981 39,441 118,487
Arts, Entertainment., & Recreation 1,857 2,363 3,801 11,474 8,518 11,619
Accommodation and Food
Services 7,548 16,990 34,100 94,476 44,990 134,595
Other Services 13,461 17,078 16,138 24,809 9,888 11,499

5
Regarding [2], the quantity of additional paid leave taken under H.R. 932 will be
the sum of additional time off taken by newly eligible workers either for traditional family
and medical leave reasons or to deal with the impact of domestic violence in their lives.
As was mentioned earlier, for the former set, it is assumed that newly eligible employees
will each year use approximately 71 percent of the maximum amount of paid sick time they
can accrue each year under H.R. 932, or five days per year, for traditional family and
medical leave reasons. This assumption is based on statistics provided by the Institute for
Women’s Policy Research (IWPR).
The assumed quantity of paid time off that would be taken by the second set of
workers—those taking time off to deal with domestic violence—is based on statistics from
the Justice Department’s most recent statistics on criminal victimization. According to the
2013 National Crime Victimization Survey, published DOJ’s Bureau of Justice Statistics,
the rate intimate partner violence (which includes victimizations committed by current or
former spouses, boyfriends, or girlfriends) averaged approximately 2.8 in both 2012 and
2013.viii The rate of domestic violence, which includes both crimes committed by intimate
partners as well as other family members, averaged approximately four percent in 2012
and 2013. According to the Justice Department, from 2003 to 2012, the rate of intimate
partner violence for women was 6.2 for women and 1.4 for men. Using these figures as a
benchmark, for modeling purposes, one might reasonably assume that 0.3 percent of
workers suffer from domestic violence each year. Given the gravity of domestic violence
cases, one might also reasonably assume that workers who are victims of domestic violence
will avail themselves of a meaningful amount of any available paid leave time to seek
medical attention, ensure their personal safety, or take legal action. It would therefore be
reasonable to expect that workers covered by H.R. 932 who are victims of domestic
violence to take the maximum amount of paid time off from work each year (56 hours).
While this is a reasonable assumption, the practical effect of this assumption on BSIM
inputs and outputs will be negligible due to the very small portion of the private sector
workforce that would comprise this subpopulation. For simplicity, additional paid leave
taken by newly eligible workers for reasons of domestic violence are left out of the model,
the net effect being that any forecast employment or output losses will be more
conservative than if this additional paid time off were accounted for in the model.
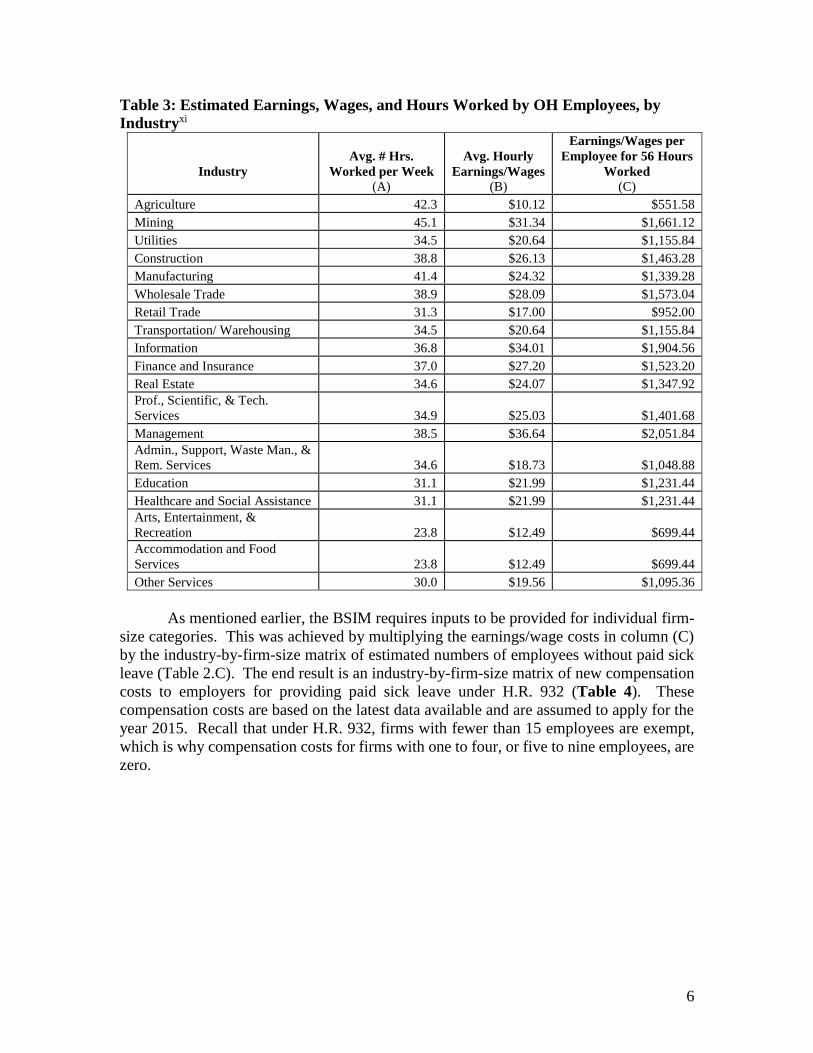
Estimates for [3], employee compensation, were derived using industry-level data
on the average workweek lengths of employees and average hourly earningsix or wages of
employees. Data on average workweek lengths of employees are from the Bureau of Labor
Statistics’ Current Employment Statistics database, as are data on average hourly earnings
for non-agricultural employees. For agricultural employees, wage data from the
Department of Agriculture’s National Agricultural Statistics Service were used. The BLS
and DOA workweek length and earnings/wage data are given in columns (A) and (B) in
Table 3. The average hourly earnings/wages per worker data in Column (B) are adjusted
for overtime compensation.x The values in column (C) are the maximum possible
earnings/wage cost per employee per year (56 hours) given the values in column (B).
6
Table 3: Estimated Earnings, Wages, and Hours Worked by OH Employees, by
Industryxi
Industry
Avg. # Hrs.
Worked per Week
(A)
Avg. Hourly
Earnings/Wages
(B)
Earnings/Wages per
Employee for 56 Hours
Worked
(C)
Agriculture 42.3 $10.12 $551.58
Mining 45.1 $31.34 $1,661.12
Utilities 34.5 $20.64 $1,155.84
Construction 38.8 $26.13 $1,463.28
Manufacturing 41.4 $24.32 $1,339.28
Wholesale Trade 38.9 $28.09 $1,573.04
Retail Trade 31.3 $17.00 $952.00
Transportation/ Warehousing 34.5 $20.64 $1,155.84
Information 36.8 $34.01 $1,904.56
Finance and Insurance 37.0 $27.20 $1,523.20
Real Estate 34.6 $24.07 $1,347.92
Prof., Scientific, & Tech.
Services 34.9 $25.03 $1,401.68
Management 38.5 $36.64 $2,051.84
Admin., Support, Waste Man., &
Rem. Services 34.6 $18.73 $1,048.88
Education 31.1 $21.99 $1,231.44
Healthcare and Social Assistance 31.1 $21.99 $1,231.44
Arts, Entertainment, &
Recreation 23.8 $12.49 $699.44
Accommodation and Food
Services 23.8 $12.49 $699.44
Other Services 30.0 $19.56 $1,095.36
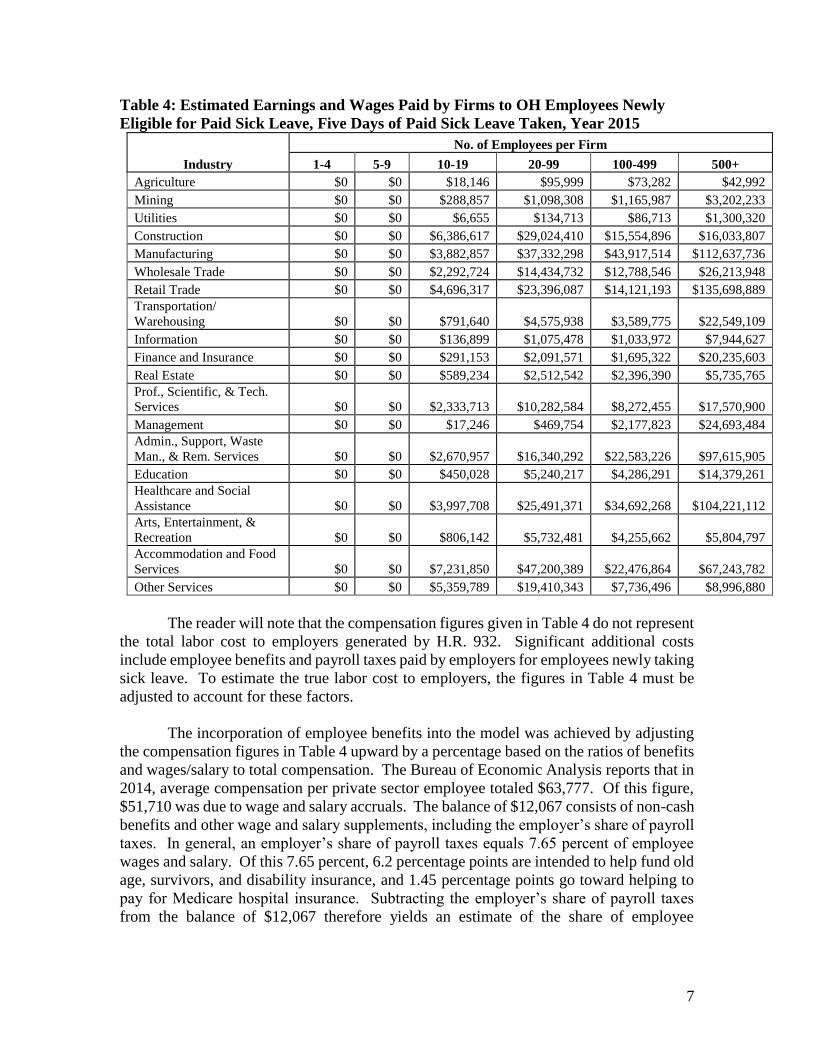
As mentioned earlier, the BSIM requires inputs to be provided for individual firm-
size categories. This was achieved by multiplying the earnings/wage costs in column (C)
by the industry-by-firm-size matrix of estimated numbers of employees without paid sick
leave (Table 2.C). The end result is an industry-by-firm-size matrix of new compensation
costs to employers for providing paid sick leave under H.R. 932 (Table 4). These
compensation costs are based on the latest data available and are assumed to apply for the
year 2015. Recall that under H.R. 932, firms with fewer than 15 employees are exempt,
which is why compensation costs for firms with one to four, or five to nine employees, are
zero.
7
Table 4: Estimated Earnings and Wages Paid by Firms to OH Employees Newly
Eligible for Paid Sick Leave, Five Days of Paid Sick Leave Taken, Year 2015
Industry
No. of Employees per Firm
1-4 5-9 10-19 20-99 100-499 500+
Agriculture $0 $0 $18,146 $95,999 $73,282 $42,992
Mining $0 $0 $288,857 $1,098,308 $1,165,987 $3,202,233
Utilities $0 $0 $6,655 $134,713 $86,713 $1,300,320
Construction $0 $0 $6,386,617 $29,024,410 $15,554,896 $16,033,807
Manufacturing $0 $0 $3,882,857 $37,332,298 $43,917,514 $112,637,736
Wholesale Trade $0 $0 $2,292,724 $14,434,732 $12,788,546 $26,213,948
Retail Trade $0 $0 $4,696,317 $23,396,087 $14,121,193 $135,698,889
Transportation/
Warehousing $0 $0 $791,640 $4,575,938 $3,589,775 $22,549,109
Information $0 $0 $136,899 $1,075,478 $1,033,972 $7,944,627
Finance and Insurance $0 $0 $291,153 $2,091,571 $1,695,322 $20,235,603
Real Estate $0 $0 $589,234 $2,512,542 $2,396,390 $5,735,765
Prof., Scientific, & Tech.
Services $0 $0 $2,333,713 $10,282,584 $8,272,455 $17,570,900
Management $0 $0 $17,246 $469,754 $2,177,823 $24,693,484
Admin., Support, Waste
Man., & Rem. Services $0 $0 $2,670,957 $16,340,292 $22,583,226 $97,615,905
Education $0 $0 $450,028 $5,240,217 $4,286,291 $14,379,261
Healthcare and Social
Assistance $0 $0 $3,997,708 $25,491,371 $34,692,268 $104,221,112
Arts, Entertainment, &
Recreation $0 $0 $806,142 $5,732,481 $4,255,662 $5,804,797
Accommodation and Food
Services $0 $0 $7,231,850 $47,200,389 $22,476,864 $67,243,782
Other Services $0 $0 $5,359,789 $19,410,343 $7,736,496 $8,996,880
The reader will note that the compensation figures given in Table 4 do not represent
the total labor cost to employers generated by H.R. 932. Significant additional costs
include employee benefits and payroll taxes paid by employers for employees newly taking
sick leave. To estimate the true labor cost to employers, the figures in Table 4 must be
adjusted to account for these factors.
The incorporation of employee benefits into the model was achieved by adjusting
the compensation figures in Table 4 upward by a percentage based on the ratios of benefits
and wages/salary to total compensation. The Bureau of Economic Analysis reports that in
2014, average compensation per private sector employee totaled $63,777. Of this figure,
$51,710 was due to wage and salary accruals. The balance of $12,067 consists of non-cash
benefits and other wage and salary supplements, including the employer’s share of payroll
taxes. In general, an employer’s share of payroll taxes equals 7.65 percent of employee
wages and salary. Of this 7.65 percent, 6.2 percentage points are intended to help fund old
age, survivors, and disability insurance, and 1.45 percentage points go toward helping to
pay for Medicare hospital insurance. Subtracting the employer’s share of payroll taxes
from the balance of $12,067 therefore yields an estimate of the share of employee
8
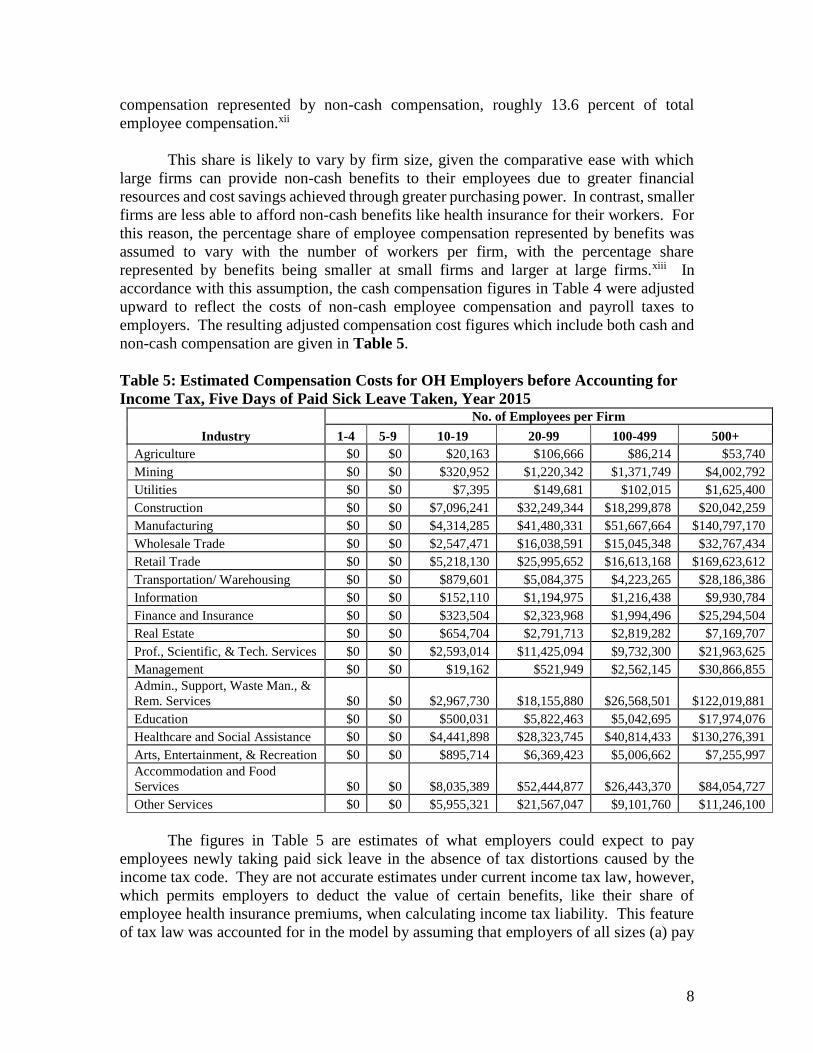
compensation represented by non-cash compensation, roughly 13.6 percent of total
employee compensation.xii
This share is likely to vary by firm size, given the comparative ease with which
large firms can provide non-cash benefits to their employees due to greater financial
resources and cost savings achieved through greater purchasing power. In contrast, smaller
firms are less able to afford non-cash benefits like health insurance for their workers. For
this reason, the percentage share of employee compensation represented by benefits was
assumed to vary with the number of workers per firm, with the percentage share
represented by benefits being smaller at small firms and larger at large firms.xiii In
accordance with this assumption, the cash compensation figures in Table 4 were adjusted
upward to reflect the costs of non-cash employee compensation and payroll taxes to
employers. The resulting adjusted compensation cost figures which include both cash and
non-cash compensation are given in Table 5.
Table 5: Estimated Compensation Costs for OH Employers before Accounting for
Income Tax, Five Days of Paid Sick Leave Taken, Year 2015
Industry
No. of Employees per Firm
1-4 5-9 10-19 20-99 100-499 500+
Agriculture $0 $0 $20,163 $106,666 $86,214 $53,740
Mining $0 $0 $320,952 $1,220,342 $1,371,749 $4,002,792
Utilities $0 $0 $7,395 $149,681 $102,015 $1,625,400
Construction $0 $0 $7,096,241 $32,249,344 $18,299,878 $20,042,259
Manufacturing $0 $0 $4,314,285 $41,480,331 $51,667,664 $140,797,170
Wholesale Trade $0 $0 $2,547,471 $16,038,591 $15,045,348 $32,767,434
Retail Trade $0 $0 $5,218,130 $25,995,652 $16,613,168 $169,623,612
Transportation/ Warehousing $0 $0 $879,601 $5,084,375 $4,223,265 $28,186,386
Information $0 $0 $152,110 $1,194,975 $1,216,438 $9,930,784
Finance and Insurance $0 $0 $323,504 $2,323,968 $1,994,496 $25,294,504
Real Estate $0 $0 $654,704 $2,791,713 $2,819,282 $7,169,707
Prof., Scientific, & Tech. Services $0 $0 $2,593,014 $11,425,094 $9,732,300 $21,963,625
Management $0 $0 $19,162 $521,949 $2,562,145 $30,866,855
Admin., Support, Waste Man., &
Rem. Services $0 $0 $2,967,730 $18,155,880 $26,568,501 $122,019,881
Education $0 $0 $500,031 $5,822,463 $5,042,695 $17,974,076
Healthcare and Social Assistance $0 $0 $4,441,898 $28,323,745 $40,814,433 $130,276,391
Arts, Entertainment, & Recreation $0 $0 $895,714 $6,369,423 $5,006,662 $7,255,997
Accommodation and Food
Services $0 $0 $8,035,389 $52,444,877 $26,443,370 $84,054,727
Other Services $0 $0 $5,955,321 $21,567,047 $9,101,760 $11,246,100
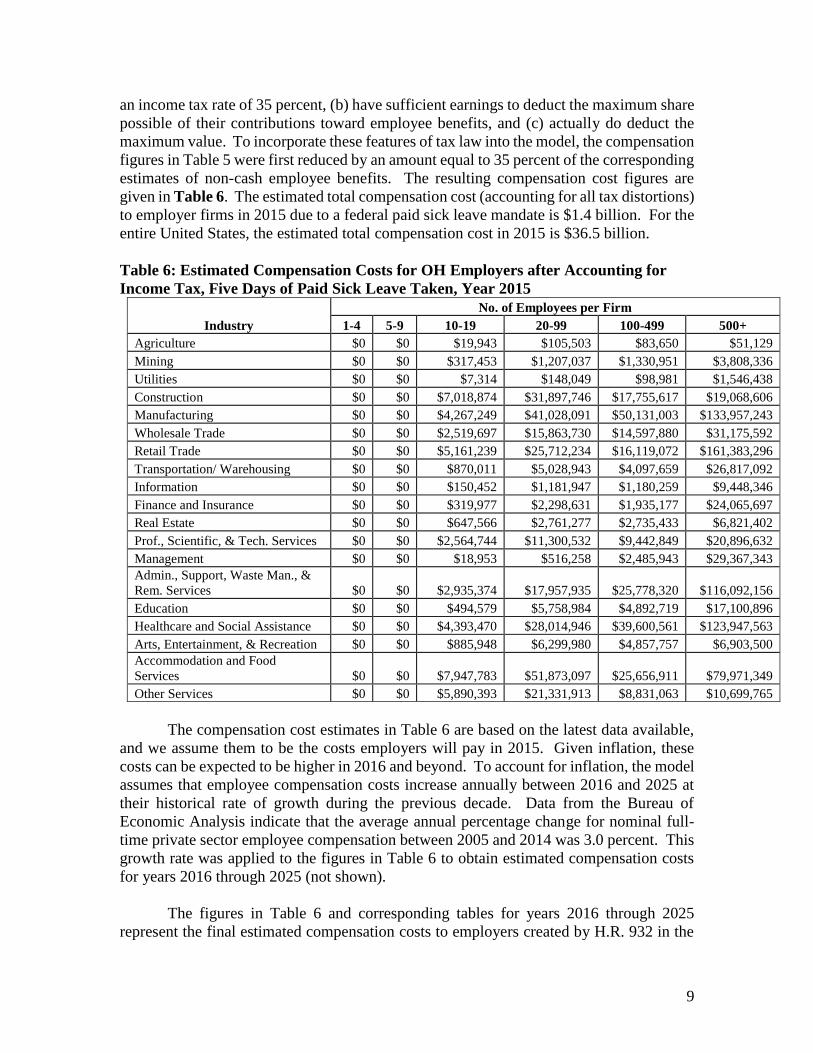
The figures in Table 5 are estimates of what employers could expect to pay
employees newly taking paid sick leave in the absence of tax distortions caused by the
income tax code. They are not accurate estimates under current income tax law, however,
which permits employers to deduct the value of certain benefits, like their share of
employee health insurance premiums, when calculating income tax liability. This feature
of tax law was accounted for in the model by assuming that employers of all sizes (a) pay
9
an income tax rate of 35 percent, (b) have sufficient earnings to deduct the maximum share
possible of their contributions toward employee benefits, and (c) actually do deduct the
maximum value. To incorporate these features of tax law into the model, the compensation
figures in Table 5 were first reduced by an amount equal to 35 percent of the corresponding
estimates of non-cash employee benefits. The resulting compensation cost figures are
given in Table 6. The estimated total compensation cost (accounting for all tax distortions)
to employer firms in 2015 due to a federal paid sick leave mandate is $1.4 billion. For the
entire United States, the estimated total compensation cost in 2015 is $36.5 billion.
Table 6: Estimated Compensation Costs for OH Employers after Accounting for
Income Tax, Five Days of Paid Sick Leave Taken, Year 2015
Industry
No. of Employees per Firm
1-4 5-9 10-19 20-99 100-499 500+
Agriculture $0 $0 $19,943 $105,503 $83,650 $51,129
Mining $0 $0 $317,453 $1,207,037 $1,330,951 $3,808,336
Utilities $0 $0 $7,314 $148,049 $98,981 $1,546,438
Construction $0 $0 $7,018,874 $31,897,746 $17,755,617 $19,068,606
Manufacturing $0 $0 $4,267,249 $41,028,091 $50,131,003 $133,957,243
Wholesale Trade $0 $0 $2,519,697 $15,863,730 $14,597,880 $31,175,592
Retail Trade $0 $0 $5,161,239 $25,712,234 $16,119,072 $161,383,296
Transportation/ Warehousing $0 $0 $870,011 $5,028,943 $4,097,659 $26,817,092
Information $0 $0 $150,452 $1,181,947 $1,180,259 $9,448,346
Finance and Insurance $0 $0 $319,977 $2,298,631 $1,935,177 $24,065,697
Real Estate $0 $0 $647,566 $2,761,277 $2,735,433 $6,821,402
Prof., Scientific, & Tech. Services $0 $0 $2,564,744 $11,300,532 $9,442,849 $20,896,632
Management $0 $0 $18,953 $516,258 $2,485,943 $29,367,343
Admin., Support, Waste Man., &
Rem. Services $0 $0 $2,935,374 $17,957,935 $25,778,320 $116,092,156
Education $0 $0 $494,579 $5,758,984 $4,892,719 $17,100,896
Healthcare and Social Assistance $0 $0 $4,393,470 $28,014,946 $39,600,561 $123,947,563
Arts, Entertainment, & Recreation $0 $0 $885,948 $6,299,980 $4,857,757 $6,903,500
Accommodation and Food
Services $0 $0 $7,947,783 $51,873,097 $25,656,911 $79,971,349
Other Services $0 $0 $5,890,393 $21,331,913 $8,831,063 $10,699,765
The compensation cost estimates in Table 6 are based on the latest data available,
and we assume them to be the costs employers will pay in 2015. Given inflation, these
costs can be expected to be higher in 2016 and beyond. To account for inflation, the model
assumes that employee compensation costs increase annually between 2016 and 2025 at
their historical rate of growth during the previous decade. Data from the Bureau of
Economic Analysis indicate that the average annual percentage change for nominal full-
time private sector employee compensation between 2005 and 2014 was 3.0 percent. This
growth rate was applied to the figures in Table 6 to obtain estimated compensation costs
for years 2016 through 2025 (not shown).
The figures in Table 6 and corresponding tables for years 2016 through 2025
represent the final estimated compensation costs to employers created by H.R. 932 in the

10
medium term. It should be noted that these estimates rely upon a key assumption regarding
employer behavior, namely that no preemptive action is taken by employers in anticipation
of the implementation of H.R. 932. According to the economic theory of rational
expectations, rational agents will take actions in the present that optimize the value of
expected present and future outcomes. When future expectations change, agents will adjust
their behavior in the present accordingly. Hypothetically, it is possible that some
employers will seek to offset some of the expected future costs generated by H.R. 932 by
immediately lowering employee compensation, reducing the number of workers employed,
or decreasing other business spending. No such effects were included in the modeling.
B. Lost Production Due to Absent Workers The absence of workers from work causes employers to suffer lost production. Absent
workers are unable to produce the goods and services that businesses sell. Given demand,
this translates into lost sales which hurt business earnings and profit. A mandated paid sick
leave policy will increase the number of work days missed by employees. The financial
loss from this increase can be material and is an important consequence of the proposed
legislation.
One should take care to note that the “cost” of lost production is separate and
different from the compensation cost described earlier. With a paid sick leave mandate,
workers are paid compensation whether they are present and healthy or absent and sick.
The compensation costs accrue during occasions of worker absence. During these
occasions of worker absence, the business is also not producing as many goods and services
as it otherwise would. This should translate into lower revenue (and maybe profits) for the
firm assuming that the market for the firm’s products is not oversupplied and if prices are
relatively constant.xiv In the real world, these two assumptions need not hold: sometimes
there is too much product available for too little demand, and prices can and often do
change. The impact of lost production on firm revenue and profitability is therefore less
certain (insofar as modeling is concerned) than the cost of compensating an employee for
a given period of time.
Despite the importance of this cost, exogenous production losses were not included
in the BSIM forecast for technical reasons. First, there is a lack of available data necessary
to estimate the magnitude and distribution of these production losses across industries.
Labor productivity varies by industry, and labor productivity data only exist or are publicly
available for select industries. Modeling and simulating the impact of an industry-neutral
policy shock (such as the proposed paid sick leave mandate) using the BSIM, however,
requires input for all major NAICS industry codes. Including production losses in the
model would therefore require the estimation of labor productivity for industries with
missing data values, creating a potentially large source of error. Second, the BSIM is not
constructed to accept exogenous changes in production levels as input. Rather, the module
is designed to receive input in the form of nominal costs to employers or employees, from
which it subsequently computes forecasts for production, employment, and other macro
variables.
11
These obstacles prevented the inclusion of exogenous production losses due to
increased worker absences to the analysis. However, we should point out that if one
actually had a model capable of accepting such production losses and were capable of
measuring them with a reasonable degree of accuracy, it is important to avoid double-
counting in the sense that such a model might not also accept as input compensation costs
like the ones described above in the same way that the BSIM does. The main point from
the preceding discussion is that to the extent that such production losses are absent from
the model, any forecast job and output losses associated with the implementation of a
federal paid sick leave mandate contained herein may be low.
One final note concerning production effects due to a paid sick leave mandate:
Some contend that a paid sick leave mandate will increase labor productivity among
workers, the argument being that sick workers are less productive than healthy workers
and spread their germs to co-workers, further reducing firm-wide productivity. While
some research has suggested that improved health status among workers might lead to
higher productivity growth, the results of other studies urge caution with regard to claims
that better health outcomes lead to greater growth. The Congressional Budget Office’s
official position on this matter is one of agnosticism.xv Lacking a sufficient body of
evidence to sway us from a state of uncertainty, we assume that a paid sick leave mandate
would neither increase nor decrease labor productivity.
C. Paperwork and Recordkeeping Costs The proposed mandate would also impose costs on employers in the form of additional
paperwork and recordkeeping. Small business owners frequently handle such paperwork
and recordkeeping themselves, allocating valuable time and energy to these administrative
tasks that could be spent acquiring new customers, making business decisions, or otherwise
operating and growing their businesses. According to a 2003 NFIB National Small
Business Poll on paperwork and recordkeeping, 39.3 percent of small business
owners/managers surveyed indicated that they personally handled their businesses’
personnel paperwork and recordkeeping.xvi In that same survey, small business
owners/managers responded that they felt $40 (approximately) was a fair per-hour amount
to claim for the time and effort they spent doing paperwork and recordkeeping required by
government.xvii
H.R. 932 requires employers to “make, keep, and preserve records pertaining to
compliance with this Act in accordance with . . . the Fair Labor Standards Act . . . and in
accordance with regulations prescribed by the Secretary [of Labor].” To account for this
burden, an employer newly providing paid sick leave under H.R. 932 is assumed to face a
new paperwork and recordkeeping cost of 10 person-hours per year. At $40 per hour, the
paperwork and recordkeeping costs for employers newly offering paid sick leave translates
to $400 per year per employer.
Effects of H.R. 932 on Private Sector Demand Employees newly eligible for paid sick leave who use it can be expected to increase
demand for healthcare-related goods and services. Employees may, for example, spend
12
their paid sick leave time visiting the doctor’s office, going to the dentist, or purchasing
and taking medication for an illness. All these activities represent increases in the
consumption of healthcare-related goods and services. To account for this effect, it is
assumed that demand for private sector healthcare goods and services produced in Ohio
will increase by a dollar amount equal to the increase in OH employer costs
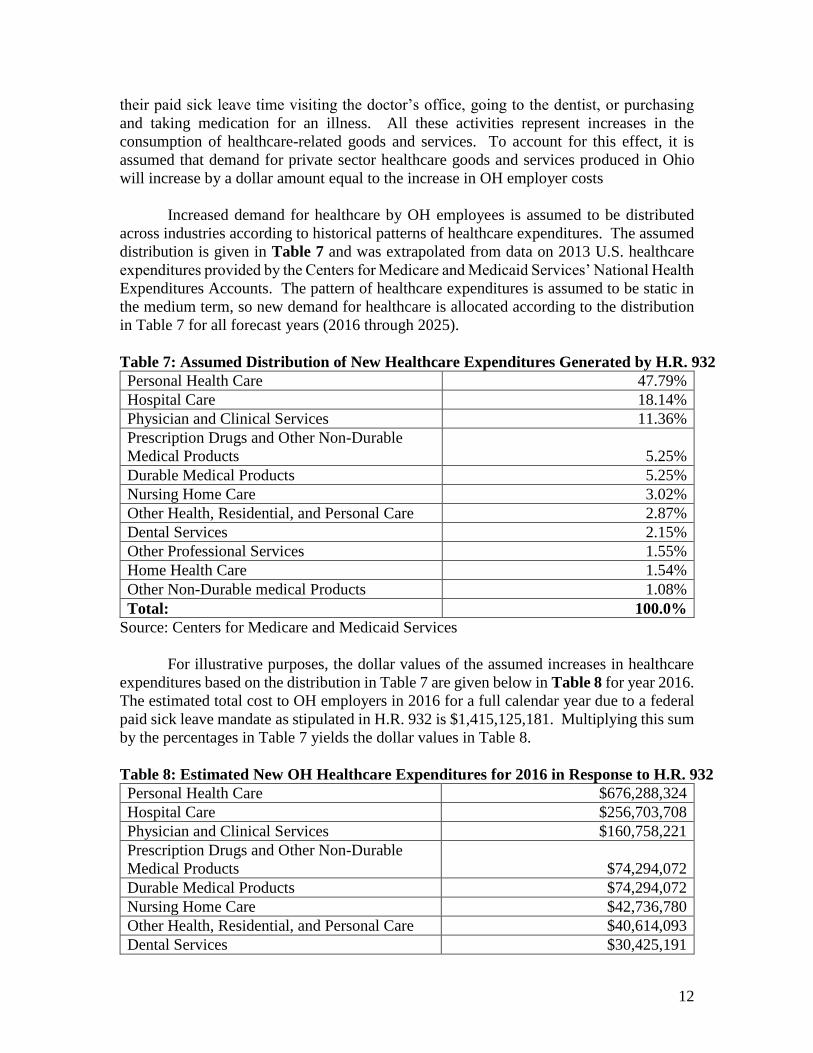
Increased demand for healthcare by OH employees is assumed to be distributed
across industries according to historical patterns of healthcare expenditures. The assumed
distribution is given in Table 7 and was extrapolated from data on 2013 U.S. healthcare
expenditures provided by the Centers for Medicare and Medicaid Services’ National Health
Expenditures Accounts. The pattern of healthcare expenditures is assumed to be static in
the medium term, so new demand for healthcare is allocated according to the distribution
in Table 7 for all forecast years (2016 through 2025).
Table 7: Assumed Distribution of New Healthcare Expenditures Generated by H.R. 932
Personal Health Care 47.79%
Hospital Care 18.14%
Physician and Clinical Services 11.36%
Prescription Drugs and Other Non-Durable
Medical Products 5.25%
Durable Medical Products 5.25%
Nursing Home Care 3.02%
Other Health, Residential, and Personal Care 2.87%
Dental Services 2.15%
Other Professional Services 1.55%
Home Health Care 1.54%
Other Non-Durable medical Products 1.08%
Total: 100.0%
Source: Centers for Medicare and Medicaid Services
For illustrative purposes, the dollar values of the assumed increases in healthcare
expenditures based on the distribution in Table 7 are given below in Table 8 for year 2016.
The estimated total cost to OH employers in 2016 for a full calendar year due to a federal
paid sick leave mandate as stipulated in H.R. 932 is $1,415,125,181. Multiplying this sum
by the percentages in Table 7 yields the dollar values in Table 8.
Table 8: Estimated New OH Healthcare Expenditures for 2016 in Response to H.R. 932
Personal Health Care $676,288,324
Hospital Care $256,703,708
Physician and Clinical Services $160,758,221
Prescription Drugs and Other Non-Durable
Medical Products $74,294,072
Durable Medical Products $74,294,072
Nursing Home Care $42,736,780
Other Health, Residential, and Personal Care $40,614,093
Dental Services $30,425,191
13
Other Professional Services $21,934,440
Home Health Care $21,792,928
Other Non-Durable medical Products $15,283,352
Total: $1,415,125,181
Effects of H.R. 932 on Government Demand H.R. 932 will create new responsibilities for government, which must administer and
enforce the mandate. The Department of Labor is directed to investigate and attempt to
resolve any complaints of violations of H.R. 932 and may pursue the recovery of damages
in court on behalf of plaintiffs. Government tools for administrating and enforcing similar
mandates already exist in the Department of Labor’s Wage and Hour Division (WHD),
which is responsible for ensuring compliance with the minimum standards for wages and
working conditions in the United States. WHD is already responsible for administering
and enforcing the Family and Medical Leave Act (FMLA), which entitles eligible
employees of covered employers to take up to a total of twelve weeks of unpaid leave per
year for health reasons or to care for a family member. Administration and enforcement
of a new paid sick leave mandate could be achieved by expanding existing tools used to
oversee the FMLA, making any new administrative costs to the government minor.
The bill also requires the collection of data on paid sick time by the government.
The Bureau of Labor Statistics is ordered to compile annual statistics on the amount of paid
and unpaid sick time available to employees by occupation and type of employment
establishment and an estimate of the average sick time used by employees according to
occupation and the type of employment establishment. Additionally, the Government
Accountability Office is ordered to conduct a study not later than five years after
implementation of the mandate investigating employees’ access to paid sick time and other
information. Existing data collection methods on paid leave in the form of the Bureau of
Labor Statistics’ National Compensation Survey suggests that any new costs associated
with data collection on paid sick time by BLS will be negligible. As for potential new costs
for GAO, the GAO already issues (usually) over 900 separate products (primarily reports)
per year.xviii One can reasonable assume that the envisioned future GAO study on
mandated paid sick leave will simply be one of the 900 or so reports issued in the fifth year
after the mandate’s implementation with a net additional cost of zero. But even if one were
to assume that the GAO study would impose new net positive costs on the government,
relative to the aggregate employer costs described above, any new government costs would
be negligible.xix For simplicity then, no new government costs were included in the
modeling.
14
Results: Forecast Economic Impact of H.R. 932
The BSIM results suggest that implementation of a federal paid sick leave mandate as
stipulated in H.R. 932 could cause substantial job loss and outputxx loss in the private
sector. Based on the assumptions described above, the BSIM forecasts that if H.R. 932 is
implemented:
Over 430,000 private sector jobs will be lost by 2020.
U.S. real GDP will be $72.1 billion less in 2021 than if H.R. 932 had not been
implemented.
Cumulatively, $652 billion in real output will be lost between 2016 and 2025.
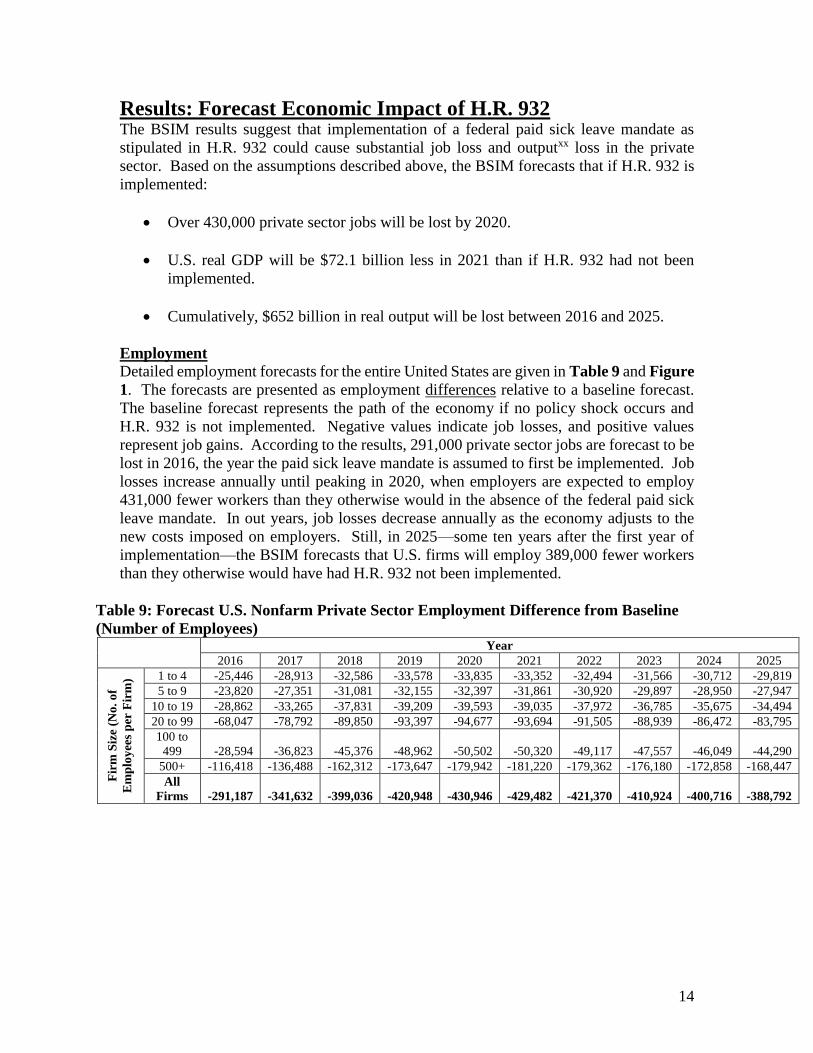
Employment
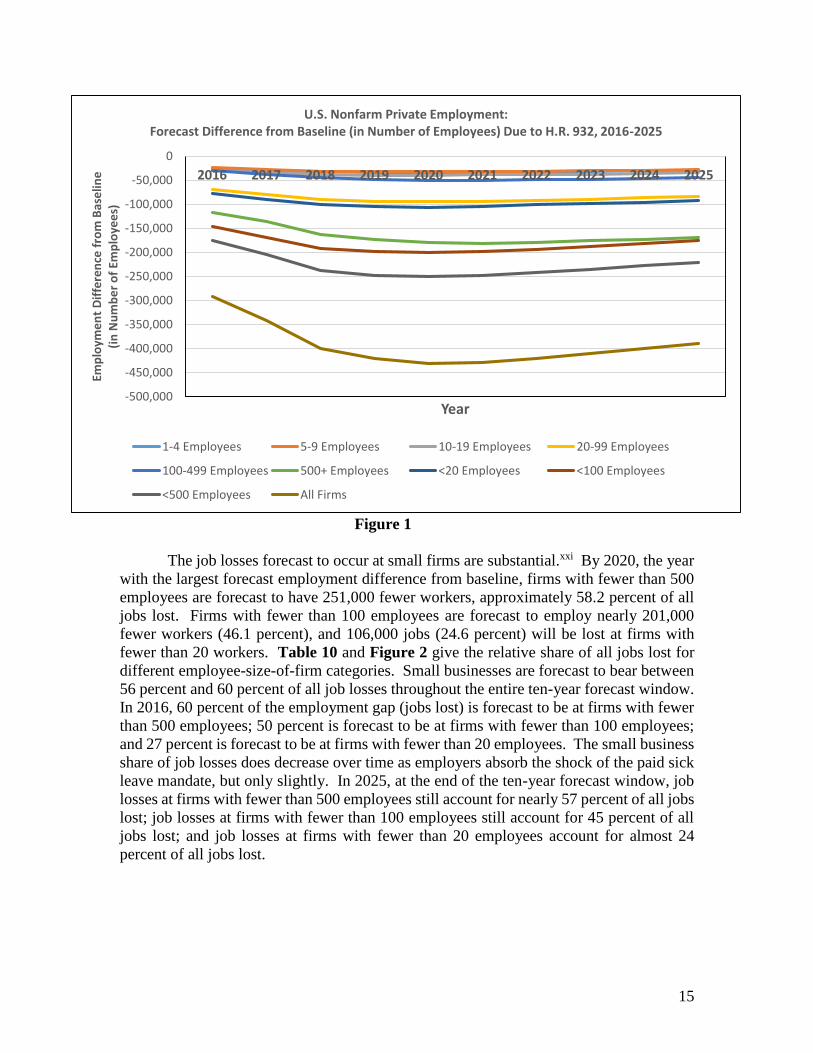
Detailed employment forecasts for the entire United States are given in Table 9 and Figure
1. The forecasts are presented as employment differences relative to a baseline forecast.
The baseline forecast represents the path of the economy if no policy shock occurs and
H.R. 932 is not implemented. Negative values indicate job losses, and positive values
represent job gains. According to the results, 291,000 private sector jobs are forecast to be
lost in 2016, the year the paid sick leave mandate is assumed to first be implemented. Job
losses increase annually until peaking in 2020, when employers are expected to employ
431,000 fewer workers than they otherwise would in the absence of the federal paid sick
leave mandate. In out years, job losses decrease annually as the economy adjusts to the
new costs imposed on employers. Still, in 2025—some ten years after the first year of
implementation—the BSIM forecasts that U.S. firms will employ 389,000 fewer workers
than they otherwise would have had H.R. 932 not been implemented.
Table 9: Forecast U.S. Nonfarm Private Sector Employment Difference from Baseline
(Number of Employees) Year
2016 2017 2018 2019 2020 2021 2022 2023 2024 2025
Fir
m S
ize
(No
. o
f
Em
plo
yee
s p
er F
irm
) 1 to 4 -25,446 -28,913 -32,586 -33,578 -33,835 -33,352 -32,494 -31,566 -30,712 -29,819
5 to 9 -23,820 -27,351 -31,081 -32,155 -32,397 -31,861 -30,920 -29,897 -28,950 -27,947
10 to 19 -28,862 -33,265 -37,831 -39,209 -39,593 -39,035 -37,972 -36,785 -35,675 -34,494
20 to 99 -68,047 -78,792 -89,850 -93,397 -94,677 -93,694 -91,505 -88,939 -86,472 -83,795
100 to
499 -28,594 -36,823 -45,376 -48,962 -50,502 -50,320 -49,117 -47,557 -46,049 -44,290
500+ -116,418 -136,488 -162,312 -173,647 -179,942 -181,220 -179,362 -176,180 -172,858 -168,447
All
Firms -291,187 -341,632 -399,036 -420,948 -430,946 -429,482 -421,370 -410,924 -400,716 -388,792
15
Figure 1
The job losses forecast to occur at small firms are substantial.xxi By 2020, the year
with the largest forecast employment difference from baseline, firms with fewer than 500
employees are forecast to have 251,000 fewer workers, approximately 58.2 percent of all
jobs lost. Firms with fewer than 100 employees are forecast to employ nearly 201,000
fewer workers (46.1 percent), and 106,000 jobs (24.6 percent) will be lost at firms with
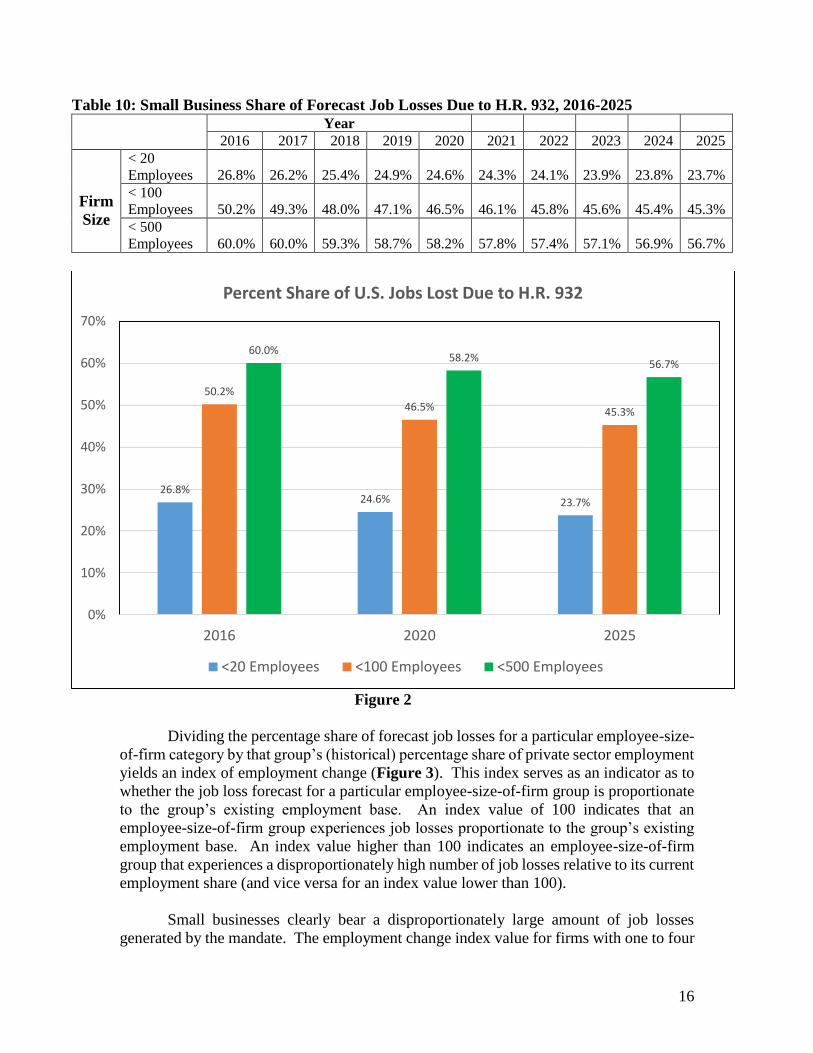
fewer than 20 workers. Table 10 and Figure 2 give the relative share of all jobs lost for
different employee-size-of-firm categories. Small businesses are forecast to bear between
56 percent and 60 percent of all job losses throughout the entire ten-year forecast window.
In 2016, 60 percent of the employment gap (jobs lost) is forecast to be at firms with fewer
than 500 employees; 50 percent is forecast to be at firms with fewer than 100 employees;
and 27 percent is forecast to be at firms with fewer than 20 employees. The small business
share of job losses does decrease over time as employers absorb the shock of the paid sick
leave mandate, but only slightly. In 2025, at the end of the ten-year forecast window, job
losses at firms with fewer than 500 employees still account for nearly 57 percent of all jobs
lost; job losses at firms with fewer than 100 employees still account for 45 percent of all
jobs lost; and job losses at firms with fewer than 20 employees account for almost 24
percent of all jobs lost.
-500,000
-450,000
-400,000
-350,000
-300,000
-250,000
-200,000
-150,000
-100,000
-50,000
0
2016 2017 2018 2019 2020 2021 2022 2023 2024 2025
Emp
loym
en
t D
iffe
ren
ce f
rom
Bas
elin
e
(in
Nu
mb
er
of
Emp
loye
es)
Year
U.S. Nonfarm Private Employment: Forecast Difference from Baseline (in Number of Employees) Due to H.R. 932, 2016-2025
1-4 Employees 5-9 Employees 10-19 Employees 20-99 Employees
100-499 Employees 500+ Employees <20 Employees <100 Employees
<500 Employees All Firms
16
Table 10: Small Business Share of Forecast Job Losses Due to H.R. 932, 2016-2025 Year
2016 2017 2018 2019 2020 2021 2022 2023 2024 2025
Firm
Size
< 20
Employees 26.8% 26.2% 25.4% 24.9% 24.6% 24.3% 24.1% 23.9% 23.8% 23.7%
< 100
Employees 50.2% 49.3% 48.0% 47.1% 46.5% 46.1% 45.8% 45.6% 45.4% 45.3%
< 500
Employees 60.0% 60.0% 59.3% 58.7% 58.2% 57.8% 57.4% 57.1% 56.9% 56.7%
Figure 2
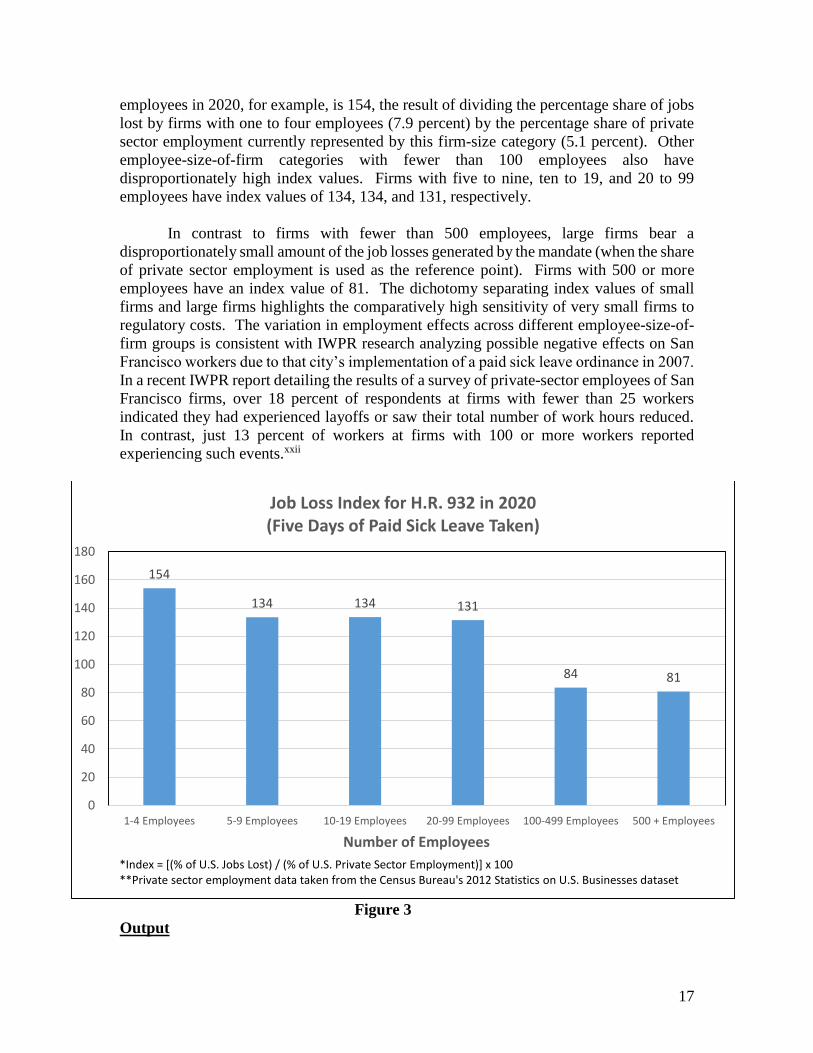
Dividing the percentage share of forecast job losses for a particular employee-size-
of-firm category by that group’s (historical) percentage share of private sector employment
yields an index of employment change (Figure 3). This index serves as an indicator as to
whether the job loss forecast for a particular employee-size-of-firm group is proportionate
to the group’s existing employment base. An index value of 100 indicates that an
employee-size-of-firm group experiences job losses proportionate to the group’s existing
employment base. An index value higher than 100 indicates an employee-size-of-firm
group that experiences a disproportionately high number of job losses relative to its current
employment share (and vice versa for an index value lower than 100).
Small businesses clearly bear a disproportionately large amount of job losses
generated by the mandate. The employment change index value for firms with one to four
26.8%24.6% 23.7%
50.2%
46.5% 45.3%
60.0%58.2%
56.7%
0%
10%
20%
30%
40%
50%
60%
70%
2016 2020 2025
Percent Share of U.S. Jobs Lost Due to H.R. 932
<20 Employees <100 Employees <500 Employees
17
employees in 2020, for example, is 154, the result of dividing the percentage share of jobs
lost by firms with one to four employees (7.9 percent) by the percentage share of private
sector employment currently represented by this firm-size category (5.1 percent). Other
employee-size-of-firm categories with fewer than 100 employees also have
disproportionately high index values. Firms with five to nine, ten to 19, and 20 to 99
employees have index values of 134, 134, and 131, respectively.
In contrast to firms with fewer than 500 employees, large firms bear a
disproportionately small amount of the job losses generated by the mandate (when the share
of private sector employment is used as the reference point). Firms with 500 or more
employees have an index value of 81. The dichotomy separating index values of small
firms and large firms highlights the comparatively high sensitivity of very small firms to
regulatory costs. The variation in employment effects across different employee-size-of-
firm groups is consistent with IWPR research analyzing possible negative effects on San
Francisco workers due to that city’s implementation of a paid sick leave ordinance in 2007.
In a recent IWPR report detailing the results of a survey of private-sector employees of San
Francisco firms, over 18 percent of respondents at firms with fewer than 25 workers
indicated they had experienced layoffs or saw their total number of work hours reduced.
In contrast, just 13 percent of workers at firms with 100 or more workers reported
experiencing such events.xxii
Figure 3
Output
154
134 134 131
84 81
0
20
40
60
80
100
120
140
160
180
1-4 Employees 5-9 Employees 10-19 Employees 20-99 Employees 100-499 Employees 500 + Employees
Number of Employees
Job Loss Index for H.R. 932 in 2020 (Five Days of Paid Sick Leave Taken)
*Index = [(% of U.S. Jobs Lost) / (% of U.S. Private Sector Employment)] x 100**Private sector employment data taken from the Census Bureau's 2012 Statistics on U.S. Businesses dataset

18
Detailed forecasts for real output losses are given in Table 11 and Figure 4. As with
employment, the output forecasts are presented as differences relative to a baseline forecast
representing the path of the economy if H.R. 932 is not implemented. The output gap is
forecast to total approximately $42.4 billion in 2016 and is expected to grow in the medium
term, peaking at approximately $72.1 billion in 2021. As with the employment gap, the
output gap is also forecast to shrink in out years as the economy absorbs the costs of the
paid sick leave mandate. However, in 2025 the output gap is still expected to total
approximately $69.9 billion.
Table 11: Forecast U.S. Real Output Difference from Baseline (in Billions of 2009 $s) Year
2016 2017 2018 2019 2020 2021 2022 2023 2024 2025
Fir
m S
ize
(No
. o
f
Em
plo
yee
s p
er F
irm
) 1 to 4 -$3.1B -$3.6B -$4.1B -$4.3B -$4.4B -$4.3B -$4.2B -$4.0B -$3.9B -$3.8B
5 to 9 -$2.5B -$3.0B -$3.6B -$3.8B -$3.9B -$3.8B -$3.7B -$3.6B -$3.5B -$3.4B
10 to 19 -$3.1B -$3.8B -$4.4B -$4.7B -$4.9B -$4.9B -$4.8B -$4.7B -$4.6B -$4.4B
20 to 99 -$8.1B -$9.9B -$11.8B -$12.6B -$13.1B -$13.3B -$13.2B -$13.0B -$12.8B -$12.5B
100 to
499 -$5.0B -$6.5B -$8.1B -$9.0B -$9.5B -$9.7B -$9.7B -$9.6B -$9.5B -$9.4B
500+ -$20.7B -$25.0B -$30.3B -$33.2B -$35.1B -$36.2B -$36.6B -$36.6B -$36.6B -$36.4B
All
Firms -$42.4B -$51.8B -$62.4B -$67.6B -$70.9B -$72.1B -$72.1B -$71.6B -$70.9B -$69.9B
Figure 4
-$80
-$70
-$60
-$50
-$40
-$30
-$20
-$10
$0
2016 2017 2018 2019 2020 2021 2022 2023 2024 2025
U.S
. R
eal
Ou
tpu
t Lo
st (
Bill
ion
s o
f 2
00
9 $
s)
Year
U.S. Real Output:Forecast Difference from Basline (in Billions of 2009 $s) Due to H.R. 932, 2016-2025
1-4 Employees 5-9 Employees 10-19 Employees 20-99 Employees
100-499 Employees 500+ Employees <20 Employees <100 Employees
<500 Employees All Firms
19
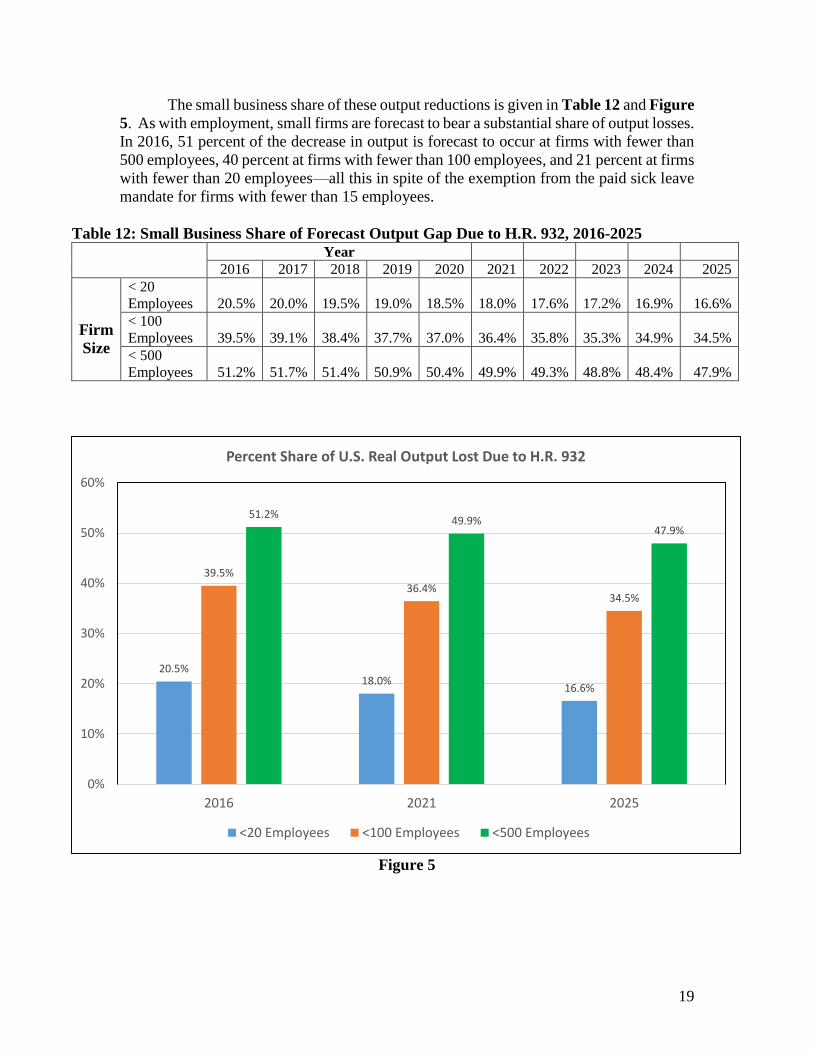
The small business share of these output reductions is given in Table 12 and Figure
5. As with employment, small firms are forecast to bear a substantial share of output losses.
In 2016, 51 percent of the decrease in output is forecast to occur at firms with fewer than
500 employees, 40 percent at firms with fewer than 100 employees, and 21 percent at firms
with fewer than 20 employees—all this in spite of the exemption from the paid sick leave
mandate for firms with fewer than 15 employees.
Table 12: Small Business Share of Forecast Output Gap Due to H.R. 932, 2016-2025 Year
2016 2017 2018 2019 2020 2021 2022 2023 2024 2025
Firm
Size
< 20
Employees 20.5% 20.0% 19.5% 19.0% 18.5% 18.0% 17.6% 17.2% 16.9% 16.6%
< 100
Employees 39.5% 39.1% 38.4% 37.7% 37.0% 36.4% 35.8% 35.3% 34.9% 34.5%
< 500
Employees 51.2% 51.7% 51.4% 50.9% 50.4% 49.9% 49.3% 48.8% 48.4% 47.9%
Figure 5
20.5%18.0%
16.6%
39.5%
36.4%34.5%
51.2%49.9%
47.9%
0%
10%
20%
30%
40%
50%
60%
2016 2021 2025
Percent Share of U.S. Real Output Lost Due to H.R. 932
<20 Employees <100 Employees <500 Employees
20
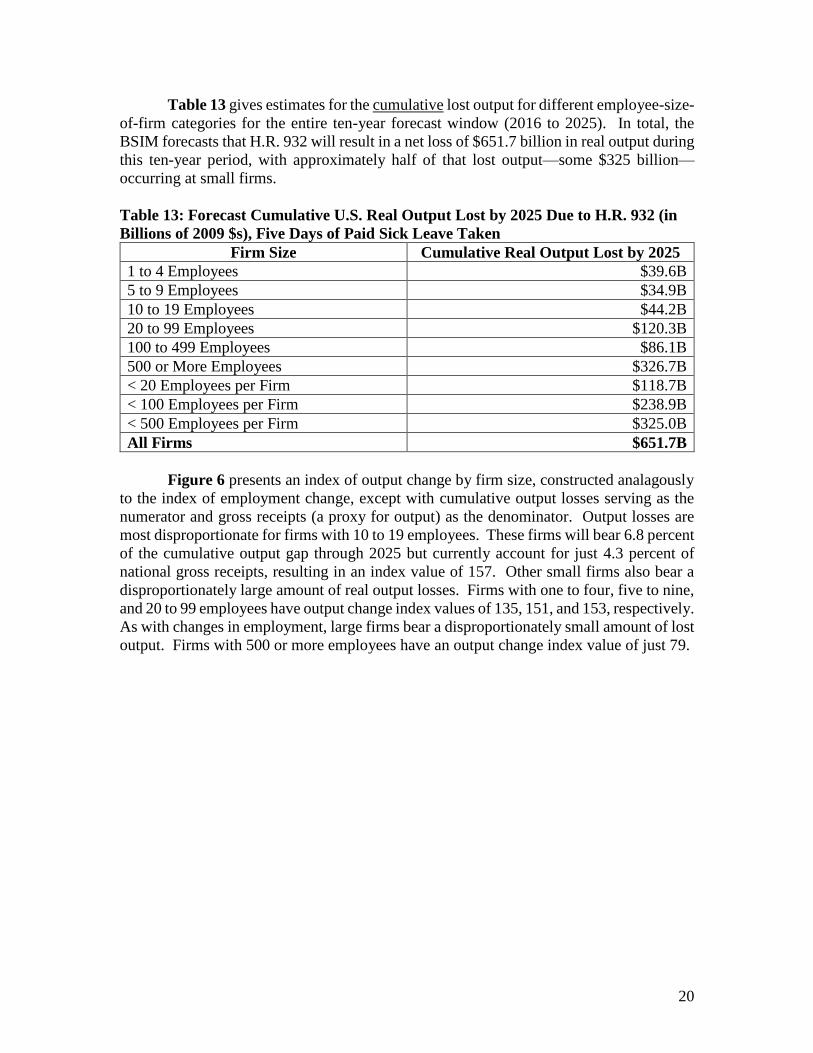
Table 13 gives estimates for the cumulative lost output for different employee-size-
of-firm categories for the entire ten-year forecast window (2016 to 2025). In total, the
BSIM forecasts that H.R. 932 will result in a net loss of $651.7 billion in real output during
this ten-year period, with approximately half of that lost output—some $325 billion—
occurring at small firms.
Table 13: Forecast Cumulative U.S. Real Output Lost by 2025 Due to H.R. 932 (in
Billions of 2009 $s), Five Days of Paid Sick Leave Taken
Firm Size Cumulative Real Output Lost by 2025
1 to 4 Employees $39.6B
5 to 9 Employees $34.9B
10 to 19 Employees $44.2B
20 to 99 Employees $120.3B
100 to 499 Employees $86.1B
500 or More Employees $326.7B
< 20 Employees per Firm $118.7B
< 100 Employees per Firm $238.9B
< 500 Employees per Firm $325.0B
All Firms $651.7B
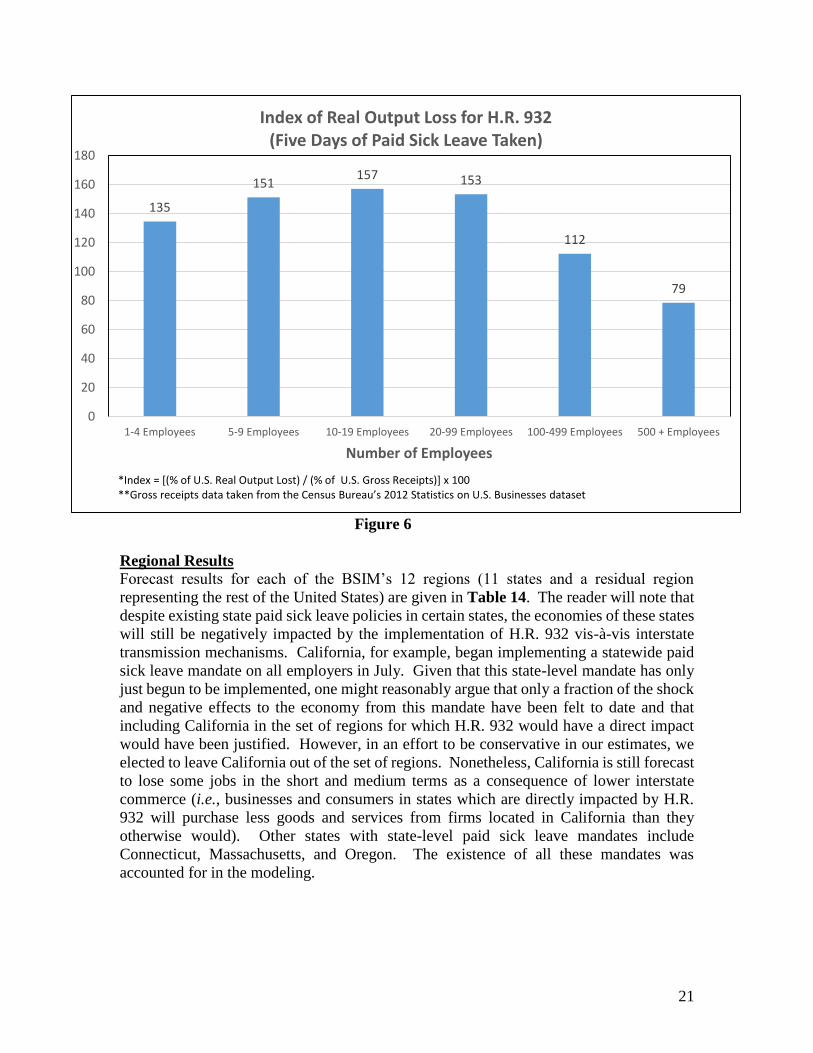
Figure 6 presents an index of output change by firm size, constructed analagously
to the index of employment change, except with cumulative output losses serving as the
numerator and gross receipts (a proxy for output) as the denominator. Output losses are
most disproportionate for firms with 10 to 19 employees. These firms will bear 6.8 percent
of the cumulative output gap through 2025 but currently account for just 4.3 percent of
national gross receipts, resulting in an index value of 157. Other small firms also bear a
disproportionately large amount of real output losses. Firms with one to four, five to nine,
and 20 to 99 employees have output change index values of 135, 151, and 153, respectively.
As with changes in employment, large firms bear a disproportionately small amount of lost
output. Firms with 500 or more employees have an output change index value of just 79.
21
Figure 6
Regional Results
Forecast results for each of the BSIM’s 12 regions (11 states and a residual region
representing the rest of the United States) are given in Table 14. The reader will note that
despite existing state paid sick leave policies in certain states, the economies of these states
will still be negatively impacted by the implementation of H.R. 932 vis-à-vis interstate
transmission mechanisms. California, for example, began implementing a statewide paid
sick leave mandate on all employers in July. Given that this state-level mandate has only
just begun to be implemented, one might reasonably argue that only a fraction of the shock
and negative effects to the economy from this mandate have been felt to date and that
including California in the set of regions for which H.R. 932 would have a direct impact
would have been justified. However, in an effort to be conservative in our estimates, we
elected to leave California out of the set of regions. Nonetheless, California is still forecast
to lose some jobs in the short and medium terms as a consequence of lower interstate
commerce (i.e., businesses and consumers in states which are directly impacted by H.R.
932 will purchase less goods and services from firms located in California than they
otherwise would). Other states with state-level paid sick leave mandates include
Connecticut, Massachusetts, and Oregon. The existence of all these mandates was
accounted for in the modeling.
135
151157 153
112
79
0
20
40
60
80
100
120
140
160
180
1-4 Employees 5-9 Employees 10-19 Employees 20-99 Employees 100-499 Employees 500 + Employees
Number of Employees
Index of Real Output Loss for H.R. 932(Five Days of Paid Sick Leave Taken)
*Index = [(% of U.S. Real Output Lost) / (% of U.S. Gross Receipts)] x 100**Gross receipts data taken from the Census Bureau’s 2012 Statistics on U.S. Businesses dataset

22
Table 14: Forecast Employment Gap and Real Output Gap for All Firms by Region,
Select Years
Employment Gap
(Number of Employees)
Real Output Gap
(Billions of 2009 $s)
Region 2016 2020 2025 2016 2020 2025
California -2,836 -1,518 314 -$6.3B -$5.1B -$1.9B
Colorado -758 -1,110 -1,019 -$1.1B -$1.9B -$1.9B
Illinois -13,223 -21,719 -21,859 -$2.0B -$3.7B -$4.0B
Kentucky -3,356 -5,958 -6,312 -$0.5B -$0.9B -$1.0B
Massachusetts -5,248 -754 4,323 -$0.9B -$0.5B -$0.2B
New Jersey -3,330 -5,026 -5,354 -$0.6B -$1.1B -$1.2B
New York -14,211 -21,039 -19,142 -$2.6B -$4.0B -$3.9B
Ohio -6,802 -15,235 -16,489 -$1.3B -$2.8B -$3.1B
Pennsylvania -7,893 -15,916 -16,455 -$1.1B -$2.5B -$2.8B
Virginia -8,843 -14766 -13,397 -$1.1B -$1.9B -$1.8B
Washington -9,536 -13,235 -12,319 -$1.3B -$2.0B -$2.0B
Rest of U.S. -169,122 -282,791 -273,063 -$23.7B -$44.5B -$46.5B
Summary The federal paid sick leave mandate proposed in H.R. 932 would impose new costs on
employers in the forms of compensation costs associated with paying more workers taking
paid leave, lost production due to absent workers, and new paperwork and recordkeeping
costs associated with complying with the mandate. The NFIB Research Foundation used
the Business Size Insight Module, a dynamic, multi-region model based on the Regional
Economic Models, Inc. (REMI) structural economic forecasting and policy analysis model
which integrates input-output, computable general equilibrium, econometric, and
economic geography methodologies, to estimate the impact the federal paid sick leave
mandate would have on the U.S. economy. Assuming implementation of H.R. 932 in 2016,
the BSIM model forecasts that the federal paid sick leave mandate could result in 430,000
jobs lost over a ten-year period spanning 2016 to 2025. The cumulative real output lost
during this period is estimated to be $652 billion. Job losses at small firms would account
for 58 percent of all jobs lost, and small firms would bear 50 percent of lost output.

23
i The REMI model is used by a diverse group of clients spanning academia, private consulting firms, local
and regional governments, and nonprofits, to name a few categories. A sample of clients includes the
Massachusetts Institute of Technology, the AARP, the Urban Institute, and the Florida legislature. ii A list of the peer-reviewed literature is available at
http://www.remi.com/download/documentation/pi+/pi+_version_1.6/PI+_v1.6_Model_Equations.pdf. The
list of references includes articles published in the American Economic Review and The Review of
Economics and Statistics. iii A list of clients that use the REMI model is available at http://www.remi.com/clients. The list includes
consultancies like Boston Consulting Group and Ernst and Young, educational institutions like the
Massachusetts Institute of Technology, nonprofit institutions like AARP and the Urban Institute, and
federal, regional, and local government agencies. iv This assumption is based on statistics provided by the Institute for Women’s Policy Research (IWPR).
According to IWPR, workers covered by paid sick days policies “miss an average of 3.9 days of work per
year for their own illness and injury (excluding maternity leave)” and “need 1.3 days of paid sick time per
year to care for family members” (on average). See Hartmann, Heidi I., “The Healthy Families Act:
Impacts on Workers, Businesses, the Economy, and Public Health,” Testimony before the U.S. Senate
Committee on Health, Education, Labor, and Pensions, February 13, 2007. v The use of Ohio as an example (instead of other regions in the model) is arbitrary. Identical data analysis
and estimation methods were used for all other regions. vi Except for agriculture, industry-level paid sick leave coverage rates are taken from the BLS March 2014
Employee Benefits Survey. The coverage rate for agricultural workers is taken from the BLS March 2014
National Compensation Survey. vii Estimates of the number of OH employees by industry are taken from the Census Bureau’s 2012
Statistics of U.S. Businesses dataset. viii The victimization rate for a specified population over a certain time period is defined as the number of
victimizations experienced by the specified population during the time period divided by the number of
persons in the specified population, the quotient of which is then multiplied by 1,000. ix Average hourly earnings reported by BLS reflect the actual return to a worker for a stated period and are
different from wage rates, which are the amounts stipulated for given units of work or time. BLS earnings
do not measure the level of total labor costs on the part of employers since they exclude items like benefits,
irregular bonuses, retroactive items, and the employer’s share of payroll taxes. x For industries where the average workweek length exceeded 40 hours, non-overtime hourly
earnings/wages were imputed for use in calculating compensation costs due to the paid sick leave mandate.
Overtime pay was assumed to equal 1.5 times regular pay for the relevant industries. Non-overtime
earnings/wages were estimated using the equation: Average Weekly Earnings/Wages = (40 Hours) x (Non-
Overtime Earnings/Wage Rate) + (Avg. Workweek Length in Hours – 40) x (Overtime Earnings/Wage
Rate). xi With the exception of Agriculture, all dollar values in Table 3 represent or are derived from 2014
earnings data taken from the Bureau of Labor Statistics’ Current Employment Statistics (CES) dataset.
When available, state-specific earnings data was used. In the absence of state-specific earnings data,
national-level data was used. No earnings data for agriculture was available, so 2014 wage data from the
Department of Agriculture’s National Agricultural Statistics Service was used instead. xii The balance of $12,067 includes the employer’s share of payroll taxes. Under current law, the
employer’s share of payroll taxes is 7.65 percent of employee wage and salary. On average, this amounts
to 0.0765 x $51,710, or $3,956 per employee. Subtracting this figure from estimated wage and salary
supplements yields $8,111, roughly 13.6 percent of reported per-employee compensation (not including the
employer’s share of payroll taxes).
Note that the subtraction of the employer’s share of payroll taxes here is done solely to calculate
the ratio of non-cash compensation received directly by employees to total compensation received directly
by the employee. Payroll taxes are not ignored as an employer cost in this analysis and are introduced at a
later stage of the modeling process. xiii The ratio of non-cash compensation to overall compensation and employers’ share of payroll taxes for
all firms in a particular industry was adopted as the ratio for firms with 100 to 499 employees in that
industry. For firms with fewer than 100 employees, this ratio less five percentage points was adopted. For
firms with 500 or more employees, this ratio plus five percentage points was adopted. xiv If supply outstrips demand, adding more goods and services to the market may not generate more
revenue. Instead, the additional product might just sit on the shelf as unsold inventory.
24
xv When assessing potential productivity effects due to changes in the health insurance system during the
national healthcare reform debate, the Congressional Budget Office issued a report part of which concerns
evaluations of the claim that improved health status among workers increases economic output and
productivity. The CBO performed a thorough literature review including studies that link healthier workers
to higher wages and countries with better health outcomes to higher economic growth. The CBO
questioned the direction of causation in these studies, noting, for example, that increased income may
contribute to better health outcomes. Ultimately, the CBO concluded that “[b]ecause the impact on health
outcomes from major changes to the health care system is uncertain, it is not clear whether such changes
would have a substantial impact on overall economic output or productivity.” See Congressional Budget
Office, “Key Issues in Analyzing Major Health Insurance Proposals” (December 2008). xvi See William J. Dennis, Jr., “Paperwork and Record-keeping,” NFIB National Small Business Poll,
Volume 3, Issue 5, 2003. xvii The poll asked respondents whether they thought government should compensate them for dealing with
the added paperwork and recordkeeping it required of their businesses. Respondents who answered “Yes”
were then asked: “What do you think would be a fair per hour amount to claim for your time and efforts?”
The average response was $43.30. Respondents who answered “No” were asked: “If the decision were
made to reimburse you, what do you think would be a fair per hour amount to claim for your time and
effort?” Their average response was $40.72. xviii “About GAO Reports,” U.S. Government Accountability Office,
http://www.gao.gov/about/products/about-gao-reports.html. xix The GAO reports that its budgetary resources for fiscal year 2014 were $534.6 million. Assuming the
GAO issues 900 reports per year and that all GAO budgetary resources are allocated toward research, the
average cost per GAO report is ($534.6 million / 900 reports) = $594,000 per report. Information on the
GAO’s budgetary resources are available in “GAO at a Glance,” accessible at
http://www.gao.gov/about/gglance.html. xx The term “output” refers to the aggregate output of the U.S. economy (the country’s gross domestic
product (GDP)). GDP has three possible definitions: (1) the value of final goods and services produced in
an economy during a given period (as opposed to raw materials or intermediate goods which are produced
or sourced earlier in the production process), (2) the sum of value added during a given period, or (3) the
sum of incomes in the economy during a given period. It is a technical term whose significance may be
better understood by the reader if she considers that because of the first definition, output serves as a rough
proxy for sales. xxi This analysis adopts the Small Business Administration’s size-of-business threshold of 500 employees to
distinguish between small businesses and large businesses. The 500-employee threshold is frequently used
by researchers to delineate the small business sector when working with firm-size data. xxii Drago, Robert and Vicky Lovell, “San Francisco’s Paid Sick Leave Ordinance: Outcomes for
Employers and Employees,” Institute for Women’s Policy Research, February 2011.