Embed Size (px)
Citation preview
The Economic Impact of For-Profit Arts and
Culture and Heritage-Related Businesses in the Leon County Area
Final Report by: The Florida State University Center for Economic
Forecasting and Analysis (FSU CEFA)
Julie Harrington, PhD
Martijn Niekus, Drs.
Brooke Dinwiddie
Glencora Haskins
July 31, 2017
1
Table of Contents
Executive Summary .............................................................................................................................. 3
Introduction ............................................................................................................................................ 7
Literature Review ................................................................................................................................. 8
Arts & Economic Prosperity V ...................................................................................................................... 8
Measuring the Economic and Social Impact of the Arts ................................................................... 11
Latest Economic Data Tracks Arts and Cultural Jobs per State ..................................................... 14
Statement on Arts, Jobs, and the Economy ............................................................................................ 18
Survey Methodology ........................................................................................................................... 19
Database Measures ........................................................................................................................................ 32
Economic Impact Analyses .............................................................................................................. 39
Economic Impact Model Input Data ........................................................................................................ 39
Economic Impact Results ............................................................................................................................ 40
Conclusions ........................................................................................................................................... 42
References ............................................................................................................................................. 45
Appendices ............................................................................................................................................ 47
Appendix A-1. For-Profit Arts & Culture and Heritage-Related Businesses Survey .............. 47
Appendix A-2. Statistical Results for the For-Profit Arts & Culture Survey ............................. 51
Appendix B. Americans for the Arts Example Survey for 2017 .................................................... 59
Appendix C. OEV List of For-Profit Arts & Culture and Heritage-Related Businesses (or
Creative Economy) Codes ............................................................................................................................ 60
Appendix C. OEV List of Arts & Culture and Heritage-Related Business (or Creative
Economy) Codes, Cont. ................................................................................................................................. 61

2
“Arts are the Heart of Society”1
1 Dr. S.J. Trienekens, from the Hogeschool of Amsterdam, 2009. “Kunst in het hart van de samenleving over brugerschap en culturele dynamiek.”

3
Executive Summary
In July 2016, the Council on Culture & Arts (COCA)2 contracted with the Florida State
University Center for Economic Forecasting and Analysis (FSU CEFA)3 to conduct an
economic impact analysis of individual artists and for-profit arts, cultural, and heritage-
related businesses in Leon County. The economic impact study is based in part on client
survey data collected by the COCA. The survey was implemented in June with final data
provided to FSU CEFA in July 2017, by COCA. In addition, and separate from the survey, FSU
CEFA performed analyses using three different databases; the National Establishment Time-
Series (NETS) database of businesses, the Enterprise Florida’s online business Data Center,
and the YourEconomy Time-Series (YTS) database administered by the University of
Wisconsin-Extension’s Division for Business & Entrepreneurship.4 All previous
aforementioned databases were further filtered by the appropriate arts and culture-specific
NAICS5 codes, based on similar arts and culture and heritage-based businesses codes used
by the Tallahassee-Leon county Office of Economic Vitality (OEV)).
COCA has been serving the Leon-County area since 1985, when it was created by a joint
resolubiont of the City of Tallahassee and Leon County governments, as the designated local
arts agency. The capital area’s only umbrella agency for arts and culture, COCA works with
and for those who produce, invest in, and experience the arts and culture in our area. COCA
is not a government entity, but works hand-in-hand with the city, county, state, and local
school district as their cultural industry partner. The City and County contract with COCA to
access their expertise and provide specific services that benefit the community at large.6
The purpose of this study is to provide an economic impact analysis of for-profit arts and
culture in Leon County. This is the first study of its kind to solely measure the economic
impact of the for-profit arts and cultural businesses and independent artists in Leon County.
This study serves as a counterpart to the recently released study “Arts and Economic
2 The Council on Culture & Arts (COCA): see: http://coca.tallahasseearts.org 3 See: http://www.cefa.fsu.edu 4 FSU CEFA is serving as a beta tester for business data provided by YTS. 5 North American Industry Classification System (NAICS) 6 From: http://coca.tallahasseearts.org/about-coca

4
Prosperity 5(AEP5), The Economic Impact of Nonprofit Arts and Culture Organizations and
Their Audiences in Leon County, Fl.” conducted by the Americans for the Arts.7
The survey data received by FSU CEFA tallied 275 responses to the survey questionnaire.8
However, it is noted that many respondents only partially filled out the survey, with many
missing responses related to financial data. Hence, the survey results were used to provide
general information regarding the overall for-profits arts and culture population.9 Using the
available databases mentioned, and selecting on Tallahassee area and the NAICS codes
provided by the OEV characterized as “creative economy” industries10, there were 3,327 for-
profit arts and culture and heritage-related establishments that were used for the following
economic impact analyses.
The survey results revealed that for-profit arts & culture and heritage-related businesses
were about 61 percent female, with about one-third of the respondents being 61 years or
greater. The for-profits arts & culture and heritage-related businesses are a highly educated
group: about 78 percent of the respondents were college graduate, post-graduate, or
professional degree earners. Thirty-six percent of the survey respondents were arts
educators in the community. Over two-thirds of businesses were locally owned and
operated, with one location. Just over one quarter of the responses identified their business
as being in the “Independent Artists, Writers and Performers” category, with 11 percent of
respondents providing “Graphics Design Services.” Forty-six percent of the respondents’
stated their annual gross income was less than $20,000, and 19 percent listed between
$20,000 and $50,000; whereas about 35 percent earned over $50,000. On average, about 36
7 Americans for the Arts (2017), Arts & Economic Prosperity V (5): The Economic Impact of Nonprofit Arts and Culture Organizations and Their Audiences in Leon County, FL. For summary see: http://www.americansforthearts.org/sites/default/files/pdf/2017/by_program/reports_and_data/aep5/map/FL_LeonCounty_AEP5_OnePageSummary.pdf 8 The survey responses represented a 95% confidence interval (5% level of significance) with a 5% margin of error. 9 As the survey responses relating to financial data were well below being statistically valid in order to conduct the economic analyses, the research team needed to use the business database(s) relating to for-profit arts and culture financial data. 10 For a list of creative economy industries, see Appendix. For the purpose of this study, the creative economy industries include only for-profit arts and culture businesses.

5
percent of their annual gross income is not related to for-profit arts & culture and heritage-
related work. Over ¾ of the respondents’ stated that the annual wages of their employees
were $35,000 or less. According to the respondents, their in-state clients comprised about
80 percent, and out-of-state clients were 20 percent of their total clientele. Regarding their
perception on the arts & culture and heritage-related businesses customer base over the last
ten years, almost 60 percent responded that they perceived an increase in customers over
time, whereas the remainder 40 percent saw either no change or a worsening, in equal
proportions of 20 percent, respectively.
The total economic impacts of the for-profit arts & culture and heritage-related businesses
in Leon County, including regional economic multiplier effects arising from supply chain
activity (indirect effects) and employee household spending (induced effects) for new final
demand generated by for-profit arts & culture and heritage-related business sales, are
summarized in Table ES1. The industry output impacts were estimated at $526.2 million,
representing the sales revenues received for goods and services sold to the for-profit arts &
culture and heritage-related businesses. The total employment impacts were estimated at
5,731 fulltime and part-time jobs11, representing approximately 3.9 percent of the Leon
County workforce. The total value added impact of $276.7 million represents the net value
of total economic activity generated, and is also equivalent to 2 percent of the Leon County
Gross Domestic Product (GDP). Labor income impacts of $205.6 million represented wages,
salaries and benefits received by employees and business owners, or 1.8 percent of the Leon
County labor income.12 In summary, the for-profit arts & culture and heritage-related
businesses are an important contributor to Leon County’s economy, both directly and
indirectly through business sales and revenues.
11 Based on the survey results relating to the for-profit arts & culture businesses, the expectation is that businesses are comprised of about 60 percent, and 40 percent, full time and part time employees, respectively. Thus, it is estimated that the breakout would be about 3,439 FT, and 2,292 PT, employees. 12 Note that these economic measures are independent and should not be summed together.

6
Table ES1. Summary of Economic Impacts, by Economic Activity, of the For-Profit Arts & Culture and Heritage-Related Businesses in Leon County
Values in June, 2017 dollars. Sources: FSU CEFA master database of arts & culture and heritage-related businesses.; IMPLAN software and most recent Leon county data (2015).
Economic Impacts Direct Indirect Induced Total
Output $312,199,849 $105,419,392 $108,587,337 $526,206,578
Employment 4,045 825 861 5,731
Labor Income $135,891,320 $35,684,804 $34,058,384 $205,634,508
Value Added $156,485,189 $56,549,469 $63,622,414 $276,657,072
For Profit Arts & Culture Businesses in Leon County

7
Introduction
The Council on Culture & Arts (COCA) engaged the Florida State University Center for
Economic Forecasting and Analysis (FSU CEFA) to conduct an economic analysis of relevant
data and produce a report that estimates the overall economic impact of both individual
artists and for-profit arts, cultural, and heritage-related businesses working and/or
operating within the Leon County in Florida. COCA is presenting FSU CEFA’s final report in
conjunction with the data collected through the Americans for the Arts “Arts and Economic
Prosperity”5 study in order to announce the overall economic impact of the arts, culture and
heritage industries in the Leon County area, in September 2017.
In order to conduct the economic analysis for COCA, the FSU CEFA research team conducted
the following project tasks:
Survey instrument development – created a baseline survey instrument which
captured the necessary, relevant economic impact data for individual artists and for-
profit arts, cultural, and heritage-related businesses in the area. FSU CEFA informed
COCA of the survey collection criteria and statistical results. In addition, FSU CEFA
compiled and further enhanced the “COCA baseline” database of arts and culture and
heritage-based businesses, with additional sources of business data from their
existing local databases.
Economic impact analyses were based on the collected data (including the master
database).
The draft and final report(s) included economic impact estimates of both individual
artists and for-profit arts, cultural, and heritage-related businesses working and/or
operating within Leon County.
The Council on Culture & Arts (COCA) conducted the following tasks:
Provided CEFA with an initial list of eligible artists and for-profit businesses to
include in the study.
8
Provided additional survey questions to the survey questionnaire,13 and managed
the survey distribution and data collection (electronically, via email) related to the
study.
Managed the questions and correspondence related to the study from study
partners, community members and media.
Literature Review
This section highlights some of the existing literature on the subject of the economic impact
of arts and culture, primarily through the use of the following reports: (i) Arts & Economic
Prosperity III conducted by Americans for the Arts; (ii) Measuring the Economic and Social
Impact of the Arts: a Review by Michelle Reeves, and; (iiii) How the Arts Impact Communities:
an Introduction to the Literature on Arts Impact Studies by Joshua Guetzkow.
The first two studies are based on survey data analyses while the third and fourth studies
were based primarily on data from existing literature, or “benefits transfer” analysis. These
reports all illustrate the existing state of knowledge on the topic of the economic impact of
arts and culture, including a discussion of the data limitations.
Arts & Economic Prosperity V Americans for the Arts conducted the Arts & Economic Prosperity V study in order to estimate
the economic impact of nonprofit arts and culture for all states in the United States, including
the District of Columbia. COCA also recently commissioned the Americans for the Arts to
focus a study on the economic impact of nonprofit arts and culture in Leon County, Florida.
14 The two methods used in Americans for the Arts’ study were: a written survey distributed
to patrons of the arts following their participation in various local events, and; an online
survey sent to various organizations in the arts and culture industry. The survey questions
related to general demographic information as well as how much money was spent directly
and indirectly through the event(s); e.g., entrance fees, and associated travel expenses (see
13 see Appendix A for a copy of the survey instrument. 14 See: http://www.americansforthearts.org/by-program/reports-and-data/research-studies-publications/creative-industries/view-the-reports/reports-by-state/florida Or: http://aftadc.brinkster.net/Florida/county/FL_Leon_County.pdf
9
Appendix B). One of the most difficult issues that all these studies encountered was how to
measure not just the direct costs of the arts and culture industry on local areas, but also their
associated indirect costs. Americans for the Arts address this issue by analyzing their survey
data using input/output analysis (which is a mathematical method that can be used to
estimate economic impact and monetary value). According to the report, this technique “…
enables economists to track how many times a dollar is “re-spent” within the local economy,
and the economic impact generated by each round of spending” (Americans for the Arts,
2017). Through a customized input/output model, this study is able to better estimate the
full economic impact of the arts and culture industry and include findings by industry
categories, including direct, indirect, and total economic impacts. The Arts and Economic
Prosperity V study estimates the economic impact of nonprofit arts and culture in Leon
County through total monetary value, number of jobs, and local and state government
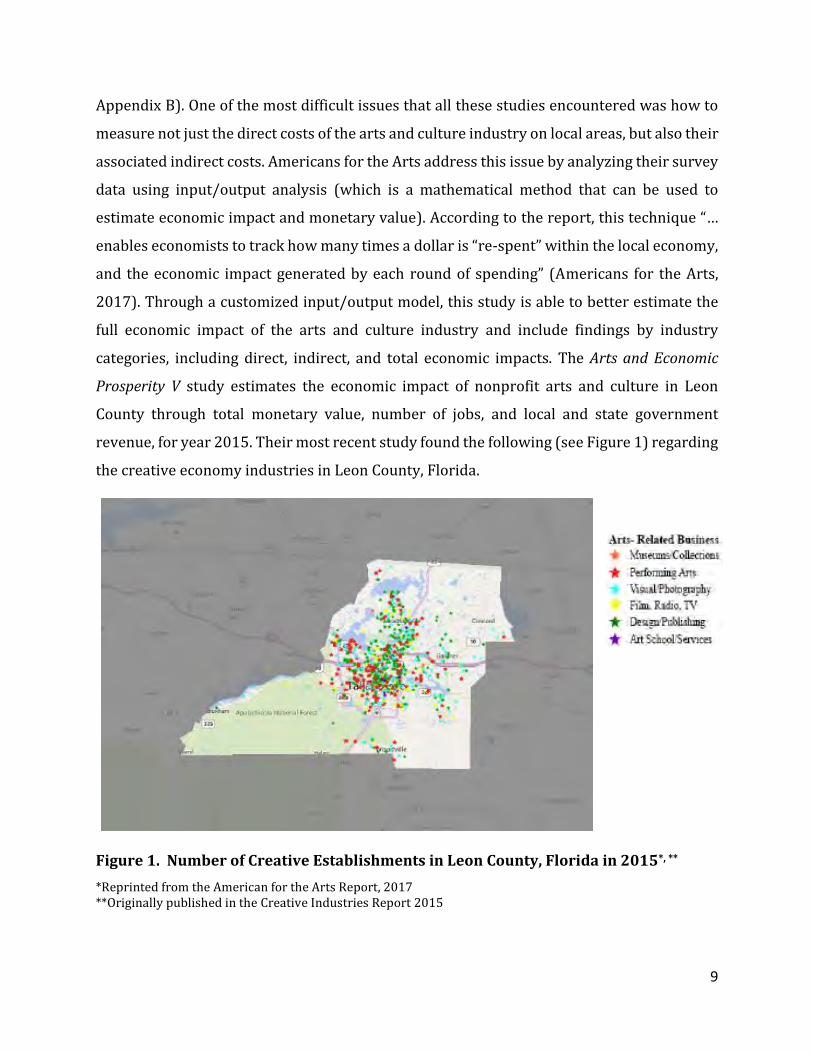
revenue, for year 2015. Their most recent study found the following (see Figure 1) regarding
the creative economy industries in Leon County, Florida.
Figure 1. Number of Creative Establishments in Leon County, Florida in 2015*, **
*Reprinted from the American for the Arts Report, 2017 **Originally published in the Creative Industries Report 2015
10
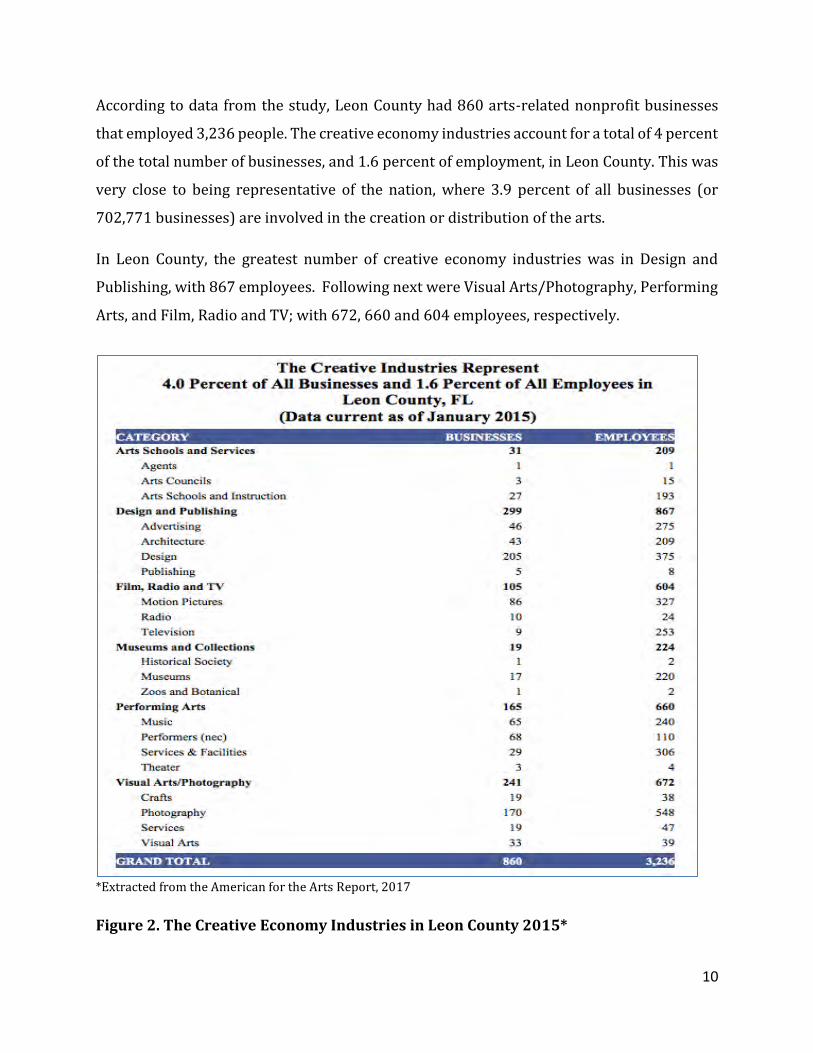
According to data from the study, Leon County had 860 arts-related nonprofit businesses
that employed 3,236 people. The creative economy industries account for a total of 4 percent
of the total number of businesses, and 1.6 percent of employment, in Leon County. This was
very close to being representative of the nation, where 3.9 percent of all businesses (or
702,771 businesses) are involved in the creation or distribution of the arts.
In Leon County, the greatest number of creative economy industries was in Design and
Publishing, with 867 employees. Following next were Visual Arts/Photography, Performing
Arts, and Film, Radio and TV; with 672, 660 and 604 employees, respectively.
*Extracted from the American for the Arts Report, 2017
Figure 2. The Creative Economy Industries in Leon County 2015*

11
Measuring the Economic and Social Impact of the Arts
The purpose of Michelle Reeves’ study outlined in “Measuring the Economic and Social Impact
of the Arts” was to gather existing research on the economic and social impact of the arts in
the UK and to discuss key issues and possible methods to address them. This study was
almost entirely literature-based so any numeric data collected was from outside sources.
Reeves examined the history of arts impact research in the UK, clearly defined impact and
value, and reviewed the pros and cons of models that have been used in different studies.
Significant issues brought up in this report were: the need for common definitions in this
field of study and more systematic and robust estimation methodologies. Reeves also
mentioned that the majority of the studies in this sector only capture impact in one time
period. A more thorough and systematic data collection of art and culture industries could
potentially lead to data showing growth and other changes over time which could assist in
more efficient data analysis in the future.
Reeves categorizes the impact of arts and culture on local, state, and national economies into
typical direct and indirect impact evaluations. The direct impact of the arts on the economy
includes any value-added by arts-related goods and services, employment and Gross
Domestic Product growth, money multipliers, and investment potential. The indirect impact
of the arts on the economy includes cultural credit added to a region, which may attract
sponsors, collectors, or miscellaneous visitors that spend money in that region; this
generates indirect economic impact through advertising and growth in the tourism industry.
A 1995 impact study on the arts and culture industry (O’Brien 1995) indicated that 648,900
individuals are employed within the arts and culture sector in the United Kingdom, with
creative economy industries defined as follows, non-inclusive of related markets within the
tourism and hospitality industries:
o Entertainment o Architects o Librarians o Archivists o Authors o Artists
o Industrial Design o Clothing Design o Acting/Stage Direction o Musicians o Photography o Printing

12
o Film production o Radio and Television
o Museums/Galleries
The study ranked the characteristics of local cultural economics on a scale of one to three on
a “Creative City Development” scale. A score of one indicates that the economy displays basic
activity with minimal support in which the cultural economy has little visibility and no
public-sector encouragement. A score of two or three indicates that the economy has some
visibility and public-sector encouragement but industry facilitators have to strategy with
which to bolster the economy. A score of two or three indicates that there is minimal division
of labor within the economy, therefore indicating that production is minimal and inefficient.
A score of four indicates that the market has expanded and facilities have improved, while a
five and six indicate that the market is becoming autonomous and is attracting inward
movement, reversing leakages from earlier stages. A score of a seven or eight indicates that
the industry is known as locally important, the location is attractive, and wealth generated
by the industry is retained. A score of nine represents a cultural economy in which facilities
are self-sufficient, whereas a score of ten represents a relatively prefect manifestation of a
cultural industry; a level ten cultural economy will compete internationally, attract talent,
minimize leakage and attract leakage from other economies, and maximize value added.
Additionally, local cultural economies may be evaluated through quantitative analysis, which
measures different characteristics of the economy. However, these analyses do not strictly
provide economic impact and are most effective in providing descriptions of key
characteristics of the economy as a whole, rather than providing detailed analysis of factors
within the arts and culture sector.
In addition to the Creative City Development Scale, Reeves presents a twelve-facet evaluation
method for assessing cultural impact economically and socially. These facets are holistically
evaluated and contribute to the Creative City Development Scale, and include:
o Organization of art form and activities o Contributed income, including grants,
donations, sales, fees, and memberships
o Outgoing costs, such as wages, travel, and marketing
o Capital Improvements, including income and expenditures

13
o Attendances of cultural events o Staffing and employment growth,
including employees and board members o Facilities development o Cultural benefits and impact
o Social capital o Community development o Public awareness o Human capital
How the Arts Impact Communities
Joshua Guetzkow’s report for the Princeton University Center for Arts and Cultural Policy
Studies entitled How the Arts Impact Communities, is another study that discusses current
research on the impact of the arts. Guetzkow underscores the issues with many broad claims
that researchers have made on this subject that are not always backed up in the data. A major
weakness in research involving the arts and culture sector is that many of the results are
speculation. Since there is still a lack of formal approach or even a sense of standardization
with respect to methodologies, it is even more important to effectively define the community
of relevant respondents and make distinctions between direct and indirect values.
To determine the mechanisms of the impact of the arts, Guetzkow evaluates impacts based
on measurement of material and health benefits, cognitive and psychological benefits,
interpersonal benefits, and community benefits; economic, cultural, and social. Directly, the
economic impact due to the arts and culture industry is quantified based on the wages paid
to employees within the industry. Additionally, tourists and visitors spend money on
businesses and organizations within the industry and generate indirect economic impacts
due to multipliers.
The arts and culture industry is defined in this study as an export industry; though it
generates economic impact on its own, its impact can be extended to its effect on related
industries. The arts industry attracts visitors for events, bolstering the tourism industry
through local visitor spending at restaurants, shops, and lodging. The impact generated
through this additional visitor spending is characterized in economic impact analyses as the
indirect economic impact of the arts industry. In addition to visitors, the arts and culture
industry attracts semi-permanent or permanent residents who will spend in the economy,
as well as either generate economic impact through employment or through starting their
own business within the arts industry. The economic expansion produced through industry
growth and spending increases the likelihood of investment in that community; a strong

14
economy, specifically due to the presence of the arts, and further incentivizes people to move
to the region and increase bank lending for property within the region.
Latest Economic Data Tracks Arts and Cultural Jobs per State
A recent article by Victoria Hutter, Latest Economic Data Tracks Arts and Cultural Jobs per
State, published on the National Endowment for the Art’s website, has released findings from
the Arts and Cultural Production Satellite Account (ACPSA), which was a collaborative effort
between the National Endowment for the Arts and the U.S. Department of Commerce’s
Bureau of Economic Analysis (BEA). Hutter described the ASPSA as “the first federal effort
to provide in-depth analysis of the arts and cultural sector’s contributions to the U.S.
economy.” The latest ACPSA data found that the arts and cultural sector contributed 4.2
percent to the U.S. economy in 2014, and that this contribution to U.S. GDP has grown 35.1
percent between 1998 and 2014. The ACPSA measures the impact of the arts and culture
sectors through data on 35 major industries that they define as being in the arts and culture
sectors (including non-profit and for-profit businesses). Further, because this data was
gathered on both the national and state level(s), the National Assembly of State Arts Agencies
was able to use this information to produce an interactive website that shows a breakdown
of major statistics and trends for each individual state in the U.S (see Figure 3).

15
Figure 3. The Creative Economy Work Force in Florida in 2015*,**
*Reprinted from the National Assembly of State Arts Agencies **Originally published by the National Assembly of State Arts Agencies
The National Endowment for the Arts and the Department of Commerce report that the
Creative Economy contributed $729.6 billion in value-added to the national economy in
2014; this indicates that the arts and culture industry, both for-profit and non-profit,
comprised 4.2 percent of the total U.S Gross Domestic Product. In addition, the arts and
culture economic sector achieved a trade surplus of $26.4 billion with continuous upward
growth between 2006 and 2014; this surplus is primarily due to the mass-production of
cinema from Hollywood ($16.4 billion), as well as software and advertising from Silicon
Valley ($9.1 billion and $8.0 billion, respectively). Of the total economic impact of the
Creative Economy, approximately half was generated by the arts ($453 billion) in 2014.

16
Nationally, the U.S Creative Economy generated $355,213,442 in 2014 in compensation and
wages. Top-compensation states included Washington ($17,256,865), California
($73,836,609), Texas ($21,230,376), Florida ($14,034,044), Georgia ($8,749,400),
Massachusetts ($10,778,001), New York (45,515,233), New Jersey ($10,867,194),
Pennsylvania ($10,676,812), Ohio ($9,549,728), and Illinois ($13,474,662). Additionally, the
U.S Creative Economic generated 4,802,813 jobs in 2014. States with the highest
compensation rates additionally generated the highest employment. Washington State
generated 154,230 jobs, California: 674,865 jobs, Texas: 350,643 jobs, Florida: 236,557 jobs,
Georgia: 126,519 jobs, Massachusetts: 128,349 jobs, New York: 259,942 jobs, New Jersey:
130,603 jobs, Pennsylvania: 169,761 jobs, Ohio: 171,902 jobs, and Illinois: 202,397 jobs.
*Reprinted from the National Endowment for the Arts
Figure 4. The Arts and Culture Employment and Compensation Trends for Florida
2004-2014*
Overall, New York and Wyoming exceeded the national per-worker index for the arts and
culture industry by 28 to 47 percent. Wyoming surveyed to have the highest numbers of arts
and culture-related construction, despite not having the highest employment rates or value-
added in the arts and culture industry. This is partially due to the inclusion of nature parks
in the arts and culture industry. Alaska, California, Colorado, Massachusetts, Oregon, Rhode

17
Island, and Utah exceeded the national average rate of arts and culture employment by nine
to seventeen percent, with Utah producing the highest amount of jewelry manufacturing and
design services nationally. Nevada compensated employees within the performing arts
sector an average rate 500 percent higher than the national average for performing arts
employees. In addition to Nevada; Rhode Island, and Hawaii produces the most performing
arts employees. Hawaii’s museums, zoos, and gardens contribute to its high museum
employment, which is 500 percent higher than the national average for museum
employment.
Nationally, the arts and culture industry increased consistently from 2006 to 2014. In the
2013-14 fiscal year, employment growth in the sector only decreased by over one percent in
twelve states, while growth in employment exceeded the national rate in seventeen states.
*Reprinted from the National Endowment for the Arts
Figure 5. The Total Arts and Culture Businesses in Florida*
As shown in Figure 5, the percent of total state compensation for arts and culture in Florida
was three percent, which is lower than the national total of 3.8 percent. The percent of total
state employment in Florida was 2.8 percent, which is again, lower than the national total of

18
3.3 percent. The upward trends in the arts and culture industry were in general, following
that of the rest of the Florida economy.
Statement on Arts, Jobs, and the Economy
Another article published by Americans for the Arts titled: (Statement on Arts, Jobs, and the
Economy), outlined the oft-overlooked importance of arts in the current economy as a means
to job creation and overall monetary benefits. As stated in the article, “Research by the U.S.
Bureau of Economic Analysis (BEA) shows that the nonprofit and for-profit arts is a $730
billion industry that directly employees 4.8 million arts workers. This represents 4.2 percent
of the nation’s GDP – a larger share of the economy than transportation, tourism, and
agriculture” (Americans for the Arts). The arts also generate and drive trade both nationally,
and internationally, which is especially beneficial for the U.S., as it consistently has a very
high trade deficit. Finally, the arts promote tourism which attracts visitor spending and
benefits local businesses.

19
Survey Methodology
A survey of for-profit arts and culture and heritage-related businesses was conducted by
COCA, using the master for-profit arts & culture database (described earlier in the narrative)
in conjunction with COCA’s Artist Directory. COCA utilized their Constant Contact email list
for the distribution of the survey, during the timeframe from June 5 to July 10, 2017 (see
Appendix A, for a copy of the survey). Approximately 3,327 surveys were distributed, with
follow up/reminders provided during that time period by COCA staff. The overall response
rates were low, and although a total of 275 respondents responded to the survey, about 75
percent of the respondents only partially filled out the survey. The descriptive analyses
below reflect some of the results, but these results did not meet statistical validity for the
majority of the questions.
All respondents (N=275) gave a description of their business. Over two-thirds categorized
their business as “locally owned and operated, with one location.” Apart from the category
“none of the above”, the second category: “locally owned and operated, with more than one
location” received five percent of feedback from the respondents. About a quarter of
respondents marked the question with “none of the above”. The research team theorizes
that they most likely were individual artists, not business owners.
Figure 6. Relative Distribution of Description of Business from Survey
Branch or division of a regional, national, or
international company2%
Franchise0%
None of the above24%
Locally owned and operated,
with one location
68%
Locally owned and operated, with more than one location
5%
20
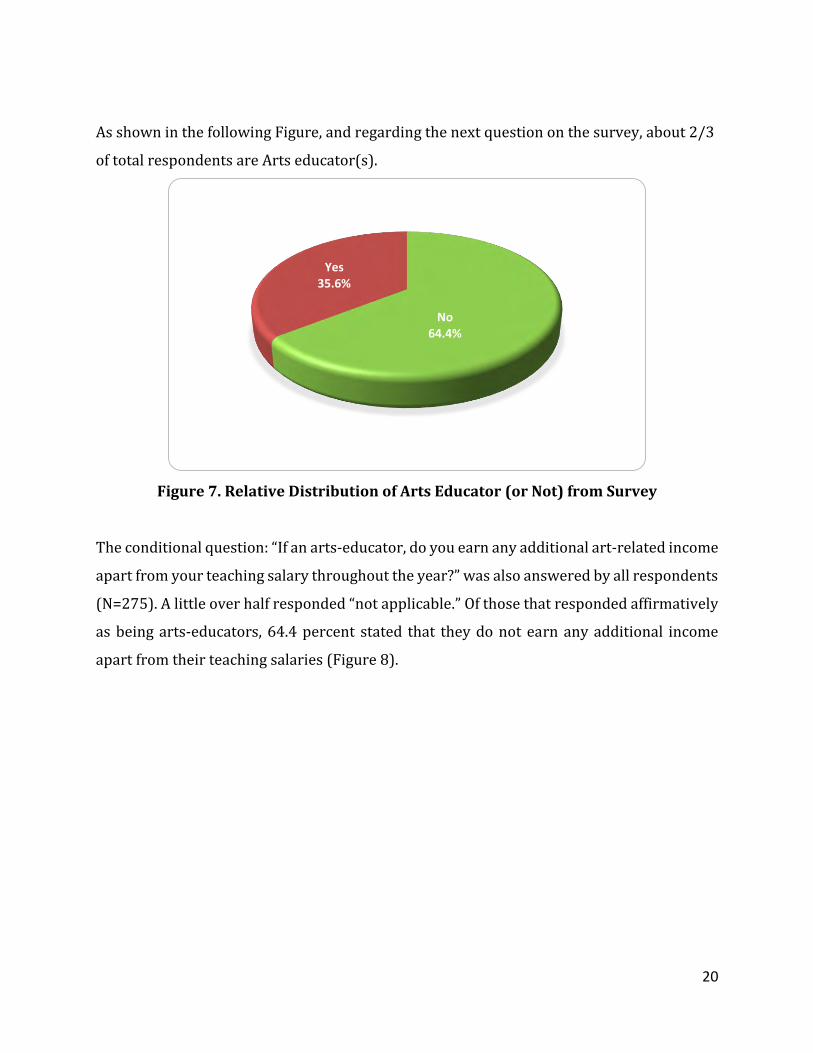
As shown in the following Figure, and regarding the next question on the survey, about 2/3
of total respondents are Arts educator(s).
Figure 7. Relative Distribution of Arts Educator (or Not) from Survey
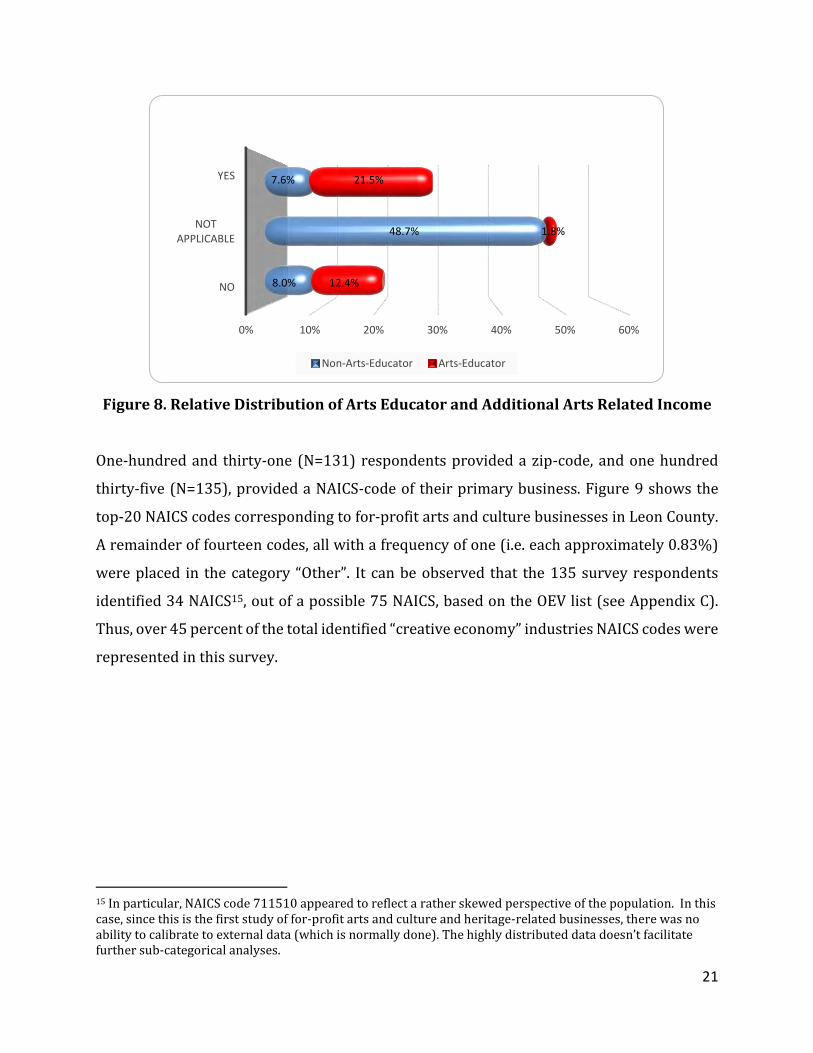
The conditional question: “If an arts-educator, do you earn any additional art-related income
apart from your teaching salary throughout the year?” was also answered by all respondents
(N=275). A little over half responded “not applicable.” Of those that responded affirmatively
as being arts-educators, 64.4 percent stated that they do not earn any additional income
apart from their teaching salaries (Figure 8).
No64.4%
Yes35.6%
21
Figure 8. Relative Distribution of Arts Educator and Additional Arts Related Income
One-hundred and thirty-one (N=131) respondents provided a zip-code, and one hundred
thirty-five (N=135), provided a NAICS-code of their primary business. Figure 9 shows the
top-20 NAICS codes corresponding to for-profit arts and culture businesses in Leon County.
A remainder of fourteen codes, all with a frequency of one (i.e. each approximately 0.83%)
were placed in the category “Other”. It can be observed that the 135 survey respondents
identified 34 NAICS15, out of a possible 75 NAICS, based on the OEV list (see Appendix C).
Thus, over 45 percent of the total identified “creative economy” industries NAICS codes were
represented in this survey.
15 In particular, NAICS code 711510 appeared to reflect a rather skewed perspective of the population. In this case, since this is the first study of for-profit arts and culture and heritage-related businesses, there was no ability to calibrate to external data (which is normally done). The highly distributed data doesn’t facilitate further sub-categorical analyses.
0% 10% 20% 30% 40% 50% 60%
NO
NOT APPLICABLE
YES
8.0%
48.7%
7.6%
12.4%
1.8%
21.5%
Non-Arts-Educator Arts-Educator

22
Figure 9. Relative Distribution of Relevant NAICS from Survey
In the survey, the respondents (N=118) provided the year that their business was
established. Figure 10 shows the relative frequencies in five-year categories recursive to the
present. Many businesses are relatively young, with almost 60 percent being established in
the last fifteen years or so.
0%
5%
10%
15%
20%
25%
30% 26
.4%
10
.7%
7.4
%5
.0%
5.0
%4
.1%
3.3
%3
.3%
3.3
%2
.5%
2.5
%1
.7%
1.7
%1
.7%
1.7
%1
.7%
1.7
%1
.7%
1.7
%1
.7%
11
.6%

23
Figure 10. Relative Distribution of Year Established from Survey
Figure 11 shows the relative frequencies of annual gross incomes by categories, based on
136 responses. The annual gross incomes of for-profit arts & culture businesses were 46
percent earning less than $20,000, and 19 percent earning between $20,000 and $49,000,
for a total of 65 percent. About 35 percent earned between $50,000 and over $250,000.
Figure 11. Relative Distribution of Annual Gross Income from Survey
0%
5%
10%
15%
20%
25%
30%
5.1
%
0.8
%
8.5
%
3.4
% 5.9
% 8.5
%
8.5
%
16
.9%
16
.1%
26
.3%
0%
10%
20%
30%
40%
50%46%
19%
11%7% 9% 9%

24
Relating to Annual Company Sales, there were only 59 valid responses. As depicted in Figure
12, Company Sales showed the following relative distribution(s) per log-scale categories.16
Figure 12. Relative Distribution of Annual Company Sales from Survey
There is clearly a double peaked distribution; one at approximately $10,000, and another at
a little over $50,000.17 The first peak may be interpreted as “non-self-sustainable”
establishment endeavors with other activities likely “on the side”, and the second peak may
be interpreted more as self-sustaining businesses. However, in combination with the
average gross income data, mentioned earlier in Figure 11, the level of company sales
appears to be at the lower end of the distribution. Thus, only a relative small percentage of
establishments appear to be able to sustain both owner/proprietor and one or more
(FTE/PTE) employees, concurrently. It should also be noted that the average annual wage of
16 The horizontal axis shows class midpoints e.g. $10,150 is the midpoint between $8,287 and $12,431, and $51,382 is the midpoint of the category from $41,954 to $62,930. 17 This study excluded the categories below $2,005 and over $1,316,872. The survey response data included $0 (i.e., 198 responses) in the less than $2,005 category.
0%
2%
4%
6%
8%
10%
12%
14%
16%
18% 17
.2%
3.1
% 4.7
% 6.3
%
10
.9%
7.8
%
7.8
%
1.6
%
10
.9%
6.3
%
6.3
%
6.3
%
3.1
%
1.6
%
4.7
%
1.6
%

25
employees, as shown in Figure 13, the majority of respondents reported earning “less than
$35,000” (77% of respondents; N=135).18
Figure 13. Relative Distribution of Average Annual Wage of Employees from Survey
Concerning the previous survey question relating to the annual gross income of the
respondent, the following two questions, with corresponding analyses, will provide
additional clarification.
Q1: If you are an individual practicing artist/arts educator, what percentage of your annual
gross income is independent from work you do with local arts or cultural non-profits,
government, or schools/universities?
Concerning this question, which included 79 responses, results showed that the average
percentage was 11.1 percent of annual gross income is independent from other work with
18 Both questions on full-time and part-time employment numbers are not further discussed for reasons that responses left open the issue whether the proprietor is, or is not, included in employment. There are some survey comments with regard to this question, thus the research team made a decision to invalidate this response. In principle, if the combined cost components relative to sales would be in place, an interpretation by the research team could give some recourse on which response to adjust. However, neither part-time is defined (in terms of FTE equivalence, e.g. two PTEs are assumed equal to one FTE), nor are the other financial responses statistically valid.
0%
20%
40%
60%
80%
77
.2%
12
.5%
5.9
%
0.7
%
3.7
%

26
non-profits, government or schools/universities. In other words, about 88.9 percent of
individual practicing artist/arts educators derive their gross income from for-profit arts and
culture and heritage-related businesses.
Q2: If you are an individual practicing artist, what percentage of your annual gross income is NOT related to arts/cultural work? (For example, if you work full-time as an attorney, but you receive 20% of your annual income from your band, your answer here would be 20%. If you are an arts teacher, you should consider your teaching income under the category of "practicing artist".)
Relating to the second question, the first part of the question directly contradicts the
example. Thus, the responses to this question were inconsistent, and could therefore not be
used for further survey analyses. If stated properly, it would have provided an essential part
of information for the analyses. If the research team were confident in these responses, there
would have been seventy-one respondents that answered with an average of 35.86 percent
of their annual gross income as “not related to arts/cultural work.”
The next batch of questions starting with: “How much do you pay yearly in income taxes?”
and ending with: “How much do you spend on other miscellaneous expenses?” was not
further analyzed as the research team is in doubt with the respondent’s interpretation of the
questions. The research team was unclear whether the respondent’s answered from a
personal or for-profit business perspective, based on some comments from the survey.
Relating to income, the general perception should be:
𝑇𝑜𝑡𝑎𝑙 𝐼𝑛𝑐𝑜𝑚𝑒 = 𝐼𝑛𝑐𝑜𝑚𝑒 𝑝𝑟𝑜𝑝𝑟𝑖𝑒𝑡𝑜𝑟 + 𝑎𝑣𝑒𝑟𝑎𝑔𝑒 𝑤𝑎𝑔𝑒 𝑒𝑚𝑝𝑙𝑜𝑦𝑒𝑒𝑠 𝑥
𝑎𝑣𝑒𝑟𝑎𝑔𝑒 𝑛𝑢𝑚𝑏𝑒𝑟 𝑜𝑓 𝑒𝑚𝑝𝑙𝑜𝑦𝑒𝑒𝑠 (1)
Since wages of employees were expressed in broad categories, only a rough adjustment can
be made for bringing full-time and part-time employees to a standard equivalent.
There are additional survey questions relating to the demographics of the for-profit arts &
culture and heritage-related business respondents, including: level of education, age, and

27
gender. Figure 14 displays the relative distribution on the highest level of education of the
respondent (N=136). The for-profit arts & culture community is highly educated, with about
78 percent of respondents being college graduate, post graduate or professional degree
earners.
Figure 14. Relative Distribution of Highest Level of Education from Survey
Figure 15 shows the relative age distribution of respondents. About two-thirds of
respondents fall within the ages of lifetime earners; from 21 to 60 years old. The remaining
third were in the category of 61 to 70 years; near- or current retirees, or pensioners. Hence,
the responses illustrate a “graying” status for-profit arts & culture and heritage-related
establishments.

28
Figure 15. Relative Age Distribution from Survey
As depicted in Figure 16 concerning gender, the survey respondents (N=136) were 61
percent female, and 39 percent male.
Figure 16. Relative Gender Distribution from Survey
0%
5%
10%
15%
20%
25%
30%
35%
3% 4%
15
%
21
%
21
%
33
%
4%
Female61%
Male39%
29
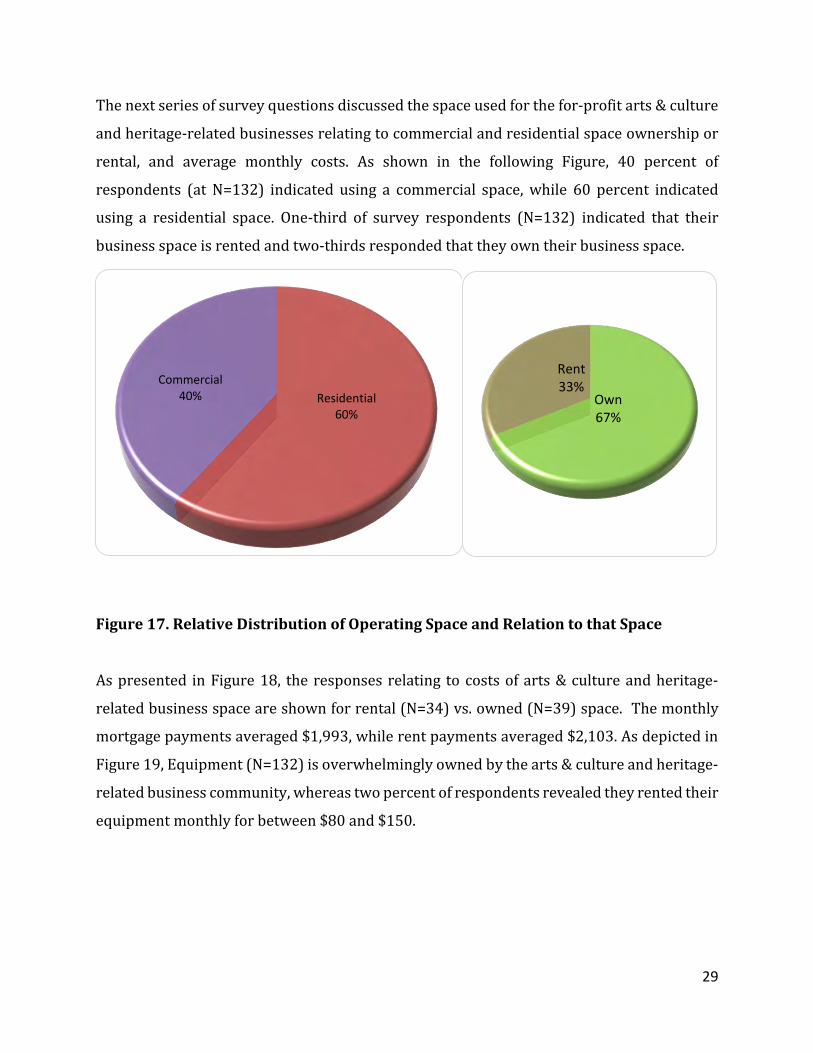
The next series of survey questions discussed the space used for the for-profit arts & culture
and heritage-related businesses relating to commercial and residential space ownership or
rental, and average monthly costs. As shown in the following Figure, 40 percent of
respondents (at N=132) indicated using a commercial space, while 60 percent indicated
using a residential space. One-third of survey respondents (N=132) indicated that their
business space is rented and two-thirds responded that they own their business space.
Figure 17. Relative Distribution of Operating Space and Relation to that Space
As presented in Figure 18, the responses relating to costs of arts & culture and heritage-
related business space are shown for rental (N=34) vs. owned (N=39) space. The monthly
mortgage payments averaged $1,993, while rent payments averaged $2,103. As depicted in
Figure 19, Equipment (N=132) is overwhelmingly owned by the arts & culture and heritage-
related business community, whereas two percent of respondents revealed they rented their
equipment monthly for between $80 and $150.
Residential60%
Commercial40% Own
67%
Rent33%

30
Figure 18. Relative Distribution of Average Monthly Mortgage or Rent from Survey
Figure 19. Relative Distribution Ownership or Rental of Equipment from Survey
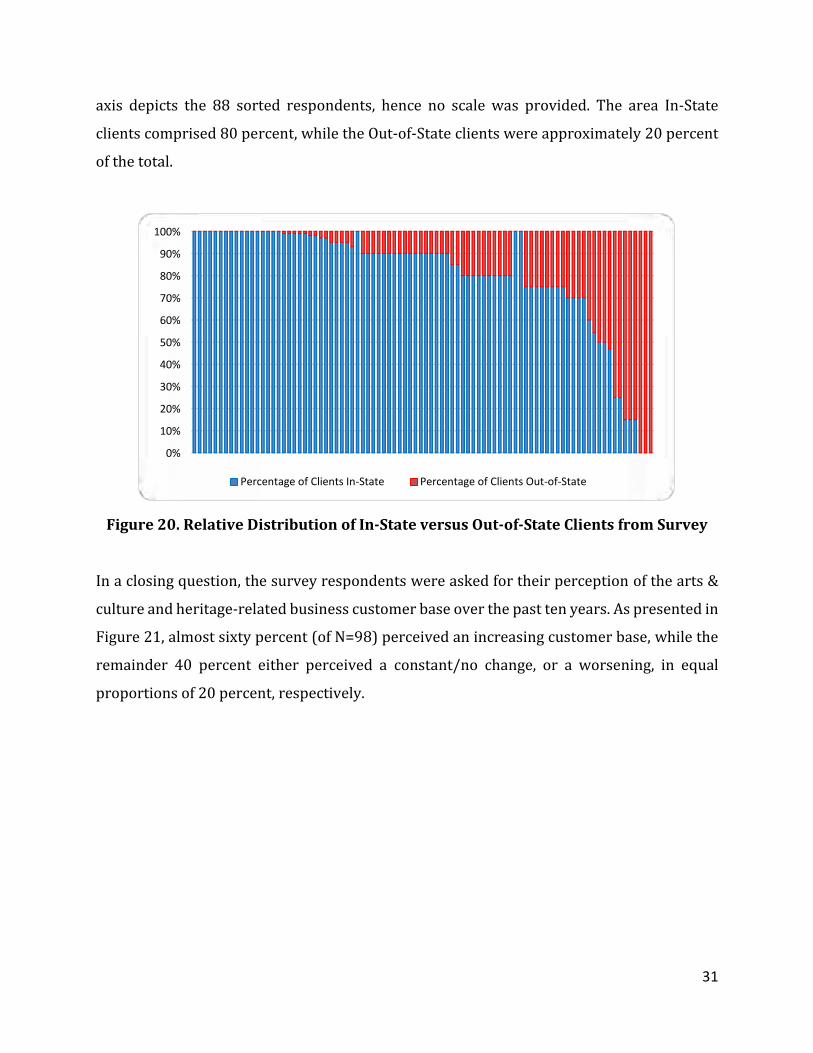
There were 187 survey responses with “zero’s” on all four survey questions concerning the
geographic location of clientele. The highest frequencies were shown to be in Leon County.
Figure 20 shows the sorted overall outcomes in percentages per category. The horizontal
Not applicable8%
Own89%
Rent/lease2%
31
axis depicts the 88 sorted respondents, hence no scale was provided. The area In-State
clients comprised 80 percent, while the Out-of-State clients were approximately 20 percent
of the total.
Figure 20. Relative Distribution of In-State versus Out-of-State Clients from Survey
In a closing question, the survey respondents were asked for their perception of the arts &
culture and heritage-related business customer base over the past ten years. As presented in
Figure 21, almost sixty percent (of N=98) perceived an increasing customer base, while the
remainder 40 percent either perceived a constant/no change, or a worsening, in equal
proportions of 20 percent, respectively.
0%
10%
20%
30%
40%
50%
60%
70%
80%
90%
100%
Percentage of Clients In-State Percentage of Clients Out-of-State

32
Figure 21. Distribution on How the Arts & Culture Customer Base is Perceived
The following section provides a description of the research team’s arts & culture and
heritage-related business master database ultimately used for the economic impact analysis.
As expressed previously, the research team was unable to conduct the economic impact
analysis using data collected from the survey results, due to the incomplete financial, or
economic data extracted the survey. A few advantages of the research team’s master
database are that it provides a listing of a large number of arts & culture and heritage-related
businesses, and includes at least 20 years of business data; e.g., sales/revenues, number of
employees, among other for-profit arts & culture-specific data .
Database Measures The FSU research team compiled three existing databases into a master database, based on
selected “creative economy” industries NAICS codes in Leon County (see Appendix C). The
three databases were the National Establishment Time Series (NETS) database,19 the
19 The National Establishment Time-Series (NETS) Database is a Walls & Associates database. They convert Dun and Bradstreet (D&B) archival establishment data into a time-series database of establishment information. The NETS Database provides longitudinal data on various dynamics of the U.S. economy that include establishment job creation and destruction, sales growth performance, survivability of business startups, mobility patterns, changes in primary markets, corporate affiliations that highlight M&A, and historical D&B credit and payment ratings. The NETS database covers businesses, non-profit and government
Constant / no change20.4%
Worsening20.4%
Improving59.2%

33
Enterprise Florida (e-Florida) database,20 and the YourEconomy Time-Series (YTS) database
from the University of Wisconsin-Extension’s Division for Business & Entrepreneurship.21
Three years of data were used (2012, 2013 and 2014) in order to have solid data on
employment, and sales & revenues, for further analyses. The compiled dataset was un-
duplicated, which required the research team to use some subjective interpretation on
naming conventions.22 In a second round, a dozen or so initially perceived duplicates were
un-duplicated again based on non-matching of the first three digits of the NAICS codes.23 The
reason for using the three first digits of NAICS codes was that the NAICS codes associated
with NETS are self-selected by establishments. Hence, an estimate was sought between first
order errors on name and second order errors on NAICS. Under no circumstance was a
double entry un-duped if they originated from the same source. There were some cases of a
clear flip, or change, in NAICS code over time. In this case, the more recent self-assigned
NAICS was used. Finally, some non-profits were selected in consultation with COCA, and
removed from the list. In total, 3,726 initial establishments were found, while some 3,327
establishments remained after the process of un-duplication. On the 3,327 identified
establishments; 3,213 had information on Employment, while 3,146 had information on
Sales, and 3,213 had information on NAICS codes. The 3,327 uniquely identified
establishments were assumed to be representative of the Leon County area for-profit arts &
culture and heritage-related businesses, and were used further analyses.
establishments, as well as sole proprietors, and contains data on over 44.2 million unique business, non-profit and government establishments, from 1990 onwards. Walls & Associates, 1700 Trestle Glen Road, Oakland, CA 94610-1846. 20 Data retrieved from its online Data Center: see http://www.enterpriseflorida.com/data-center/florida-companies/company-search/ 21 YTS is a new establishment time series being developed by Business Dynamics Research Consortium and University of Wisconsin-Extension. YourEconomy.org (YTS or YE) is a longitudinal establishment-level online information tool that allows users to analyze business activity from the community level, to the state level, and across the country. YTS or “YE” tracks the performance of more than 61 million U.S. businesses from 2016 back through 1997, providing detailed information about jobs, sales and establishments. The specific data was received upon request: see http://exceptionalgrowth.org/our-databases.iegc and http://business.uwex.edu/about-us/ 22 Further checks on address or Duns number were not possible in YTS as these variables were not available. 23 No address data was available from the YTS database, NETS uses DUNS-numbers, whereas YTS uses ABI numbers. In short, no other comparable variables were available.

34
Regarding the master database, the research team selected the variables Employment and
Sales, and calculated a three-year average on the data points. It should be noted that no
correction was made for establishment start-ups or those closing business within the three
year timeframe. In addition, the variable “Employees” also included proprietor, in the master
database. The research team decided to use the business “Sales” data as input data for the
economic impact analysis. Figure 22 provides a Small-Business24 perspective of the
unadjusted master database.
Figure 22. Subset of For-Profit Arts & Culture Establishments in Leon County
Approximately 93 percent of the master database is represented within the boundaries of
the above Figure. The color coding represents the businesses frequency distribution in 3-D
perspective. It can be observed that for-profit arts & culture and heritage-related businesses
are rather small operations. Slightly over 26 percent are one-person companies with less
than $100,000 in sales. Likewise, slightly over 53 percent fall within the one to two-person
24 Small Business is defined by businesses with less than 25 employees and less than $1,5 million annual sales.
$-
$100,000
$200,000
$300,000
$400,000
$500,000
$600,000
$700,000
$800,000
$900,000
$1,000,000
$1,100,000
$1,200,000
$1,300,000
$1,400,000
$1,500,000
0102030405060708090100110120130140150160170180190200210220230240250260270280290300310320330340350360370380390400410420430440450460470480490500510520530540550560570580590600610620630640650660670680690700710720730740750760770
1 2 3 4 5 6 7 8 9 10 11 12 13 14 15 16 17 18 19 20 21 22 23 24 25
An
nu
al
Sale
s
Employment

35
and less than $200,000 sales category. Almost two-thirds fall within the one to three-person,
and less than $300,000 in sales, category.
One issue that often arises is the degree to which a selected NAICS is representative of arts
& culture and heritage-related businesses. There are some broad-based NAICS codes that
could be only partly attributed to a for-profit arts & culture and heritage-related business.
Thus, a second screening key, the Standard Occupation Codes (SOC; as shown in Appendix
C) was also used. First, the SOC were selected with respect to its share in total employment
in the Tallahassee Community College service area.25 Likewise, it was used in calculating the
arts & culture and heritage-related business share in total employment in the Tallahassee
geographical area (Metropolitan Area), according to the Bureau of Labor Statistics.26 The
combined share resulted in a 2.12 percent share (or arts & culture and heritage-related
businesses) of total employment in the area.27 Assuming that the same percentage holds for
variables as Gross Domestic Product (GDP) for Leon County, and for income, the three
measures28 were used to calculate the arts & culture and heritage-related businesses
economic value, resulting in a final sales value of $313.5 million. Next, the same SOC
information was used to calculate the respective weights of key NAICS-SOC combinations.29
As only a few fields contain sufficient data to obtain a level of confidence per subset, the
available job totals were recalibrated, or redistributed, using a double weighting
methodology, across both NAICS and SOC. The distribution per NAICS code was
subsequently scaled up and used to determine NAICS breakouts to be used in the economic
impact analyses. In short, the two aforementioned steps were completed in order to provide
25 The TCC service area consists of Gadsden, Leon, and Wakulla counties, using the most granular SOC employment data available from the DEO Employment Projections (2015 and 2023), using the 2015 or current year data. 26 May 2016 Data retrieved from: https://data.bls.gov/oes/#/geoOcc/Multiple%20occupations%20for%20one%20geographical%20area 27 In terms of the Arts & Culture SOCs, the average total wages (employment frequency times the average wage per SOC) expressed in the Tallahassee area total average wages; the percentage came out at 2.2246%. This percentage however is not used in the percentage calculation, as it is one of the measures used to calculate total arts value. 28 All Industries Tallahassee GDP (BEA), Compensation (BEA) and Wages (BLS). 29 Performed at the 3-digit level NAICS and SOC, and for five sectors only (namely NAICS 511 Publishing Industries (except Internet), 541 Professional, Scientific, and Technical Services, 561 Administrative and Support Services, 711 Performing Arts, Spectator Sports, and Related Industries, and 722 Food Services and Drinking Places) as further detail or additional business sectors produced too many gaps in the data.
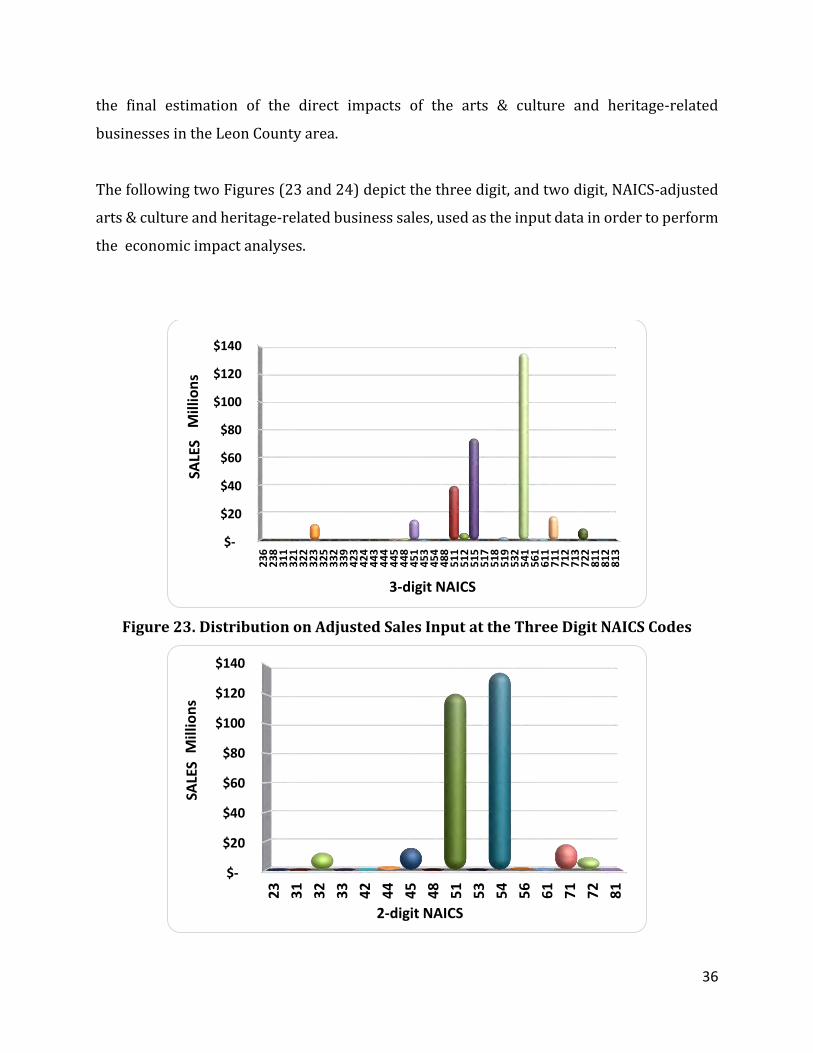
36
the final estimation of the direct impacts of the arts & culture and heritage-related
businesses in the Leon County area.
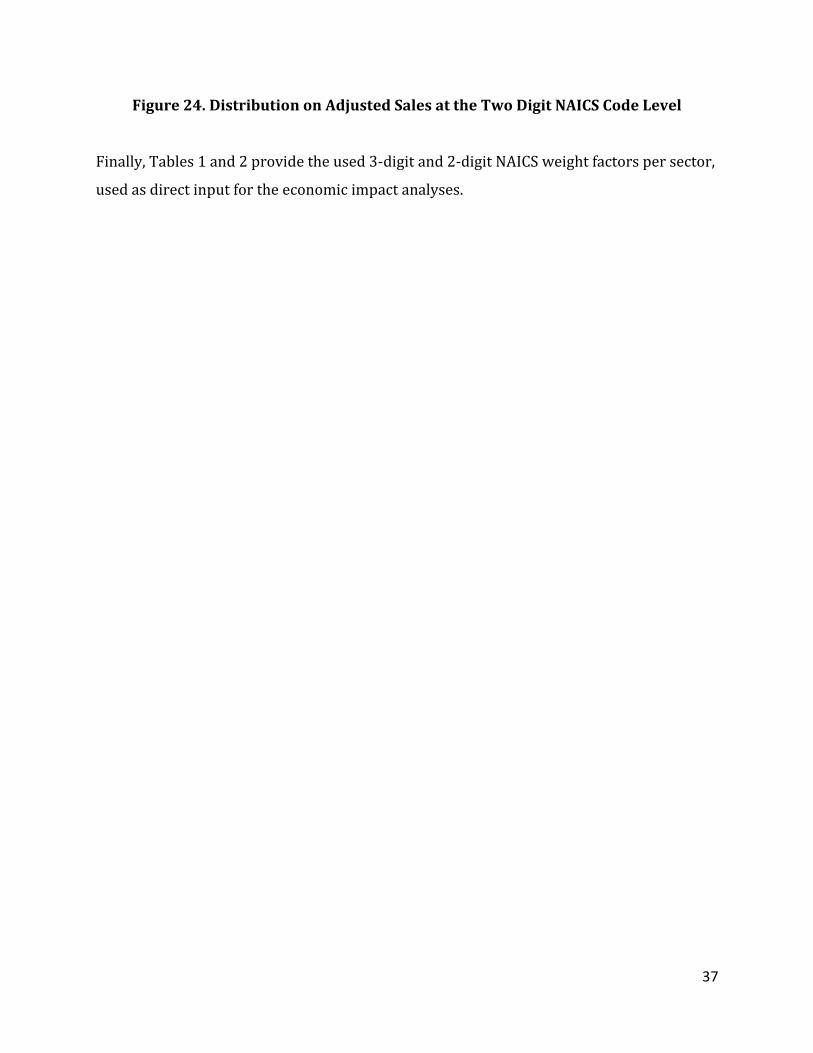
The following two Figures (23 and 24) depict the three digit, and two digit, NAICS-adjusted
arts & culture and heritage-related business sales, used as the input data in order to perform
the economic impact analyses.
Figure 23. Distribution on Adjusted Sales Input at the Three Digit NAICS Codes
$-
$20
$40
$60
$80
$100
$120
$140
23
62
38
31
13
21
32
23
23
32
53
32
33
94
23
42
44
43
44
44
45
44
84
51
45
34
54
48
85
11
51
25
15
51
75
18
51
95
32
54
15
61
61
17
11
71
27
13
72
28
11
81
28
13
SALE
SM
illio
ns
3-digit NAICS
$-
$20
$40
$60
$80
$100
$120
$140
23
31
32
33
42
44
45
48
51
53
54
56
61
71
72
81
SALE
SM
illio
ns
2-digit NAICS
37
Figure 24. Distribution on Adjusted Sales at the Two Digit NAICS Code Level
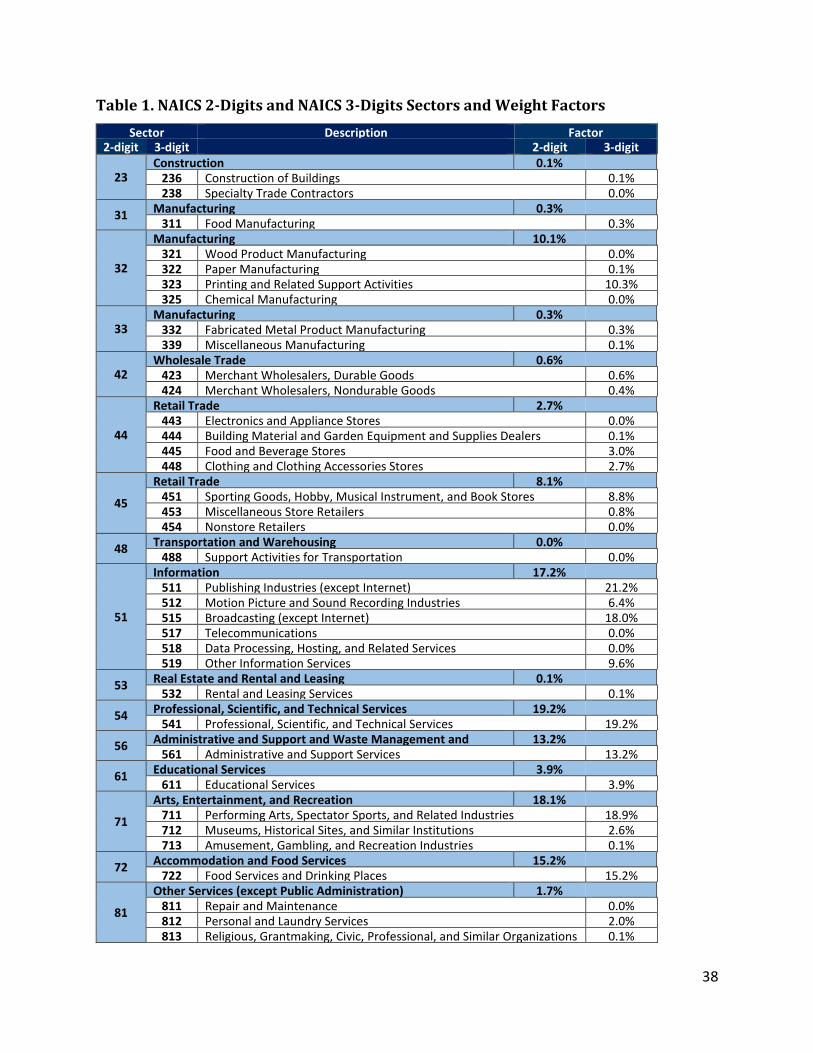
Finally, Tables 1 and 2 provide the used 3-digit and 2-digit NAICS weight factors per sector,
used as direct input for the economic impact analyses.
38
Table 1. NAICS 2-Digits and NAICS 3-Digits Sectors and Weight Factors
Sector Description Factor 2-digit 3-digit 2-digit 3-digit
23 Construction 0.1%
236 Construction of Buildings 0.1% 238 Specialty Trade Contractors 0.0%
31 Manufacturing 0.3%
311 Food Manufacturing 0.3%
32
Manufacturing 10.1% 321 Wood Product Manufacturing 0.0% 322 Paper Manufacturing 0.1% 323 Printing and Related Support Activities 10.3% 325 Chemical Manufacturing 0.0%
33 Manufacturing 0.3%
332 Fabricated Metal Product Manufacturing 0.3% 339 Miscellaneous Manufacturing 0.1%
42 Wholesale Trade 0.6%
423 Merchant Wholesalers, Durable Goods 0.6% 424 Merchant Wholesalers, Nondurable Goods 0.4%
44
Retail Trade 2.7% 443 Electronics and Appliance Stores 0.0% 444 Building Material and Garden Equipment and Supplies Dealers 0.1% 445 Food and Beverage Stores 3.0% 448 Clothing and Clothing Accessories Stores 2.7%
45
Retail Trade 8.1% 451 Sporting Goods, Hobby, Musical Instrument, and Book Stores 8.8% 453 Miscellaneous Store Retailers 0.8% 454 Nonstore Retailers 0.0%
48 Transportation and Warehousing 0.0%
488 Support Activities for Transportation 0.0%
51
Information 17.2% 511 Publishing Industries (except Internet) 21.2% 512 Motion Picture and Sound Recording Industries 6.4% 515 Broadcasting (except Internet) 18.0% 517 Telecommunications 0.0% 518 Data Processing, Hosting, and Related Services 0.0% 519 Other Information Services 9.6%
53 Real Estate and Rental and Leasing 0.1%
532 Rental and Leasing Services 0.1%
54 Professional, Scientific, and Technical Services 19.2%
541 Professional, Scientific, and Technical Services 19.2%
56 Administrative and Support and Waste Management and Remediation Services
13.2% 561 Administrative and Support Services 13.2%
61 Educational Services 3.9%
611 Educational Services 3.9%
71
Arts, Entertainment, and Recreation 18.1% 711 Performing Arts, Spectator Sports, and Related Industries 18.9% 712 Museums, Historical Sites, and Similar Institutions 2.6% 713 Amusement, Gambling, and Recreation Industries 0.1%
72 Accommodation and Food Services 15.2%
722 Food Services and Drinking Places 15.2%
81
Other Services (except Public Administration) 1.7% 811 Repair and Maintenance 0.0% 812 Personal and Laundry Services 2.0% 813 Religious, Grantmaking, Civic, Professional, and Similar Organizations 0.1%

39
Economic Impact Analyses
The total economic impacts of for-profit arts & culture and heritage-related business
spending was estimated with multipliers generated using a regional economic input-output
model for the State of Florida constructed with the IMPLAN economic impact modeling
system (IMPLAN Group, LLC, 2015). IMPLAN is a widely accepted integrated input-output
model, used extensively by state and local government agencies to measure proposed
legislative and other program and policy economic impacts across the private and public
sectors. There are several advantages to using IMPLAN:
It is calibrated to local conditions using a relatively large amount of local county level
and state of Florida specific data;
It is based on a strong theoretical foundation, and;
It uses a well-researched and accepted applied economics impact assessment
methodology supported by many years of use across all regions of the U.S.
The economic impact model used for this analysis was specifically developed for the counties
of Florida (specifically, Leon County), and includes 536 business sectors (based on the North
American Industrial Classification System, or NAICS) and latest dataset – year 2015 data.
IMPLAN’s principal advantage is that it may be used to estimate direct, indirect and induced
economic impacts for any static (point-in-time) economic stimulus. Through the estimation
of economic multipliers, the “ripple” effects of supply chain spending for input purchases are
captured (indirect effects), and household spending by employees (induced effects) for new
final demand to the regional economy, as well as direct spending and employment. Economic
multipliers for each business sector and household income category are used to estimate the
following economic impacts: economic output or revenue, employment (fulltime and part-
time jobs), value added, labor-income, among other economic impacts.
Economic Impact Model Input Data
As mentioned previously in the report, the approach taken to this economic impact analysis
was based on input data from the for-profit arts & culture and heritage-related business
master database. This methodology is a viable approach given that the research team was
unable to extract any useful or statistically valid input data from the survey instrument

40
(which is typically the standard approach). One advantage to using the master database is
that the research team had comprehensive, and representative, data from the area’s 3,327
for-profit arts & culture and heritage-related businesses. The input data used for the
economic impact analysis was described earlier in the section on “database measures”;
including sales, number of business establishments, number of employees, and type (NAICS
code) of business. The respective sales data were assigned to appropriate industry sector
categories using NAICS, and further translated into IMPLAN-specific industry sectors in the
economic impact model. The share of spending inside Leon County was based on Leon
County’s average percentage of total purchases of each particular good or service. These
shares are known as regional purchase coefficients, which were econometrically estimated
by the IMPLAN software based on the balance of supply and demand in Leon County for each
product or service.
Economic Impact Results The total economic impacts of the for-profit arts & culture and heritage-related businesses
in Leon County, including regional economic multiplier effects arising from supply chain
activity (indirect effects) and employee household spending (induced effects) for new final
demand generated by for-profit arts & culture and heritage-related business sales, are
summarized in Table 2. The industry output impacts were estimated at $526.2 million,
representing the sales revenues received for goods and services sold to the for-profit arts &
culture and heritage-related businesses. The total employment impacts were estimated at
5,731 fulltime and part-time jobs,30 representing approximately 3.9 percent of the Leon
County workforce. The total value added impact of $276.7 million represents the net value
of total economic activity generated, and is also equivalent to 2 percent of the Leon County
Gross Domestic Product (GDP). Labor income impacts of $205.6 million represented wages,
30 Based on the survey results relating to the for-profit arts & culture businesses, the expectation is that businesses are comprised of about 60 percent, and 40 percent, full time and part time employees, respectively. Thus, it is estimated that the breakout would be about 3,439 FT, and 2,292 PT, employees.

41
salaries and benefits received by employees and business owners, or 1.8 percent of the Leon
County labor income.31
Table 2. Summary of Economic Impacts, by Economic Activity, of the For-Profit Arts &
Culture and Heritage-Related Businesses in Leon County
Values in June, 2017 dollars. Sources: FSU CEFA master database of arts & culture and heritage-related businesses.; IMPLAN software and most recent Leon county data (2015).
In summary, the arts & culture and heritage-related businesses are an important contributor
to Leon County’s economy both directly and indirectly through business sales and revenues.
As of June 2017, the total economic impacts of the for-profit arts and culture and heritage-
related businesses were estimated at $526.2 million (or over $0.5 billion) in output or
revenues, $205.6 million in labor income, $276.7 million in value added (GDP), and 5,731
jobs.
31 Note that these economic measures are independent and should not be summed together.
Economic Impacts Direct Indirect Induced Total
Output $312,199,849 $105,419,392 $108,587,337 $526,206,578
Employment 4,045 825 861 5,731
Labor Income $135,891,320 $35,684,804 $34,058,384 $205,634,508
Value Added $156,485,189 $56,549,469 $63,622,414 $276,657,072
For Profit Arts & Culture Businesses in Leon County
42
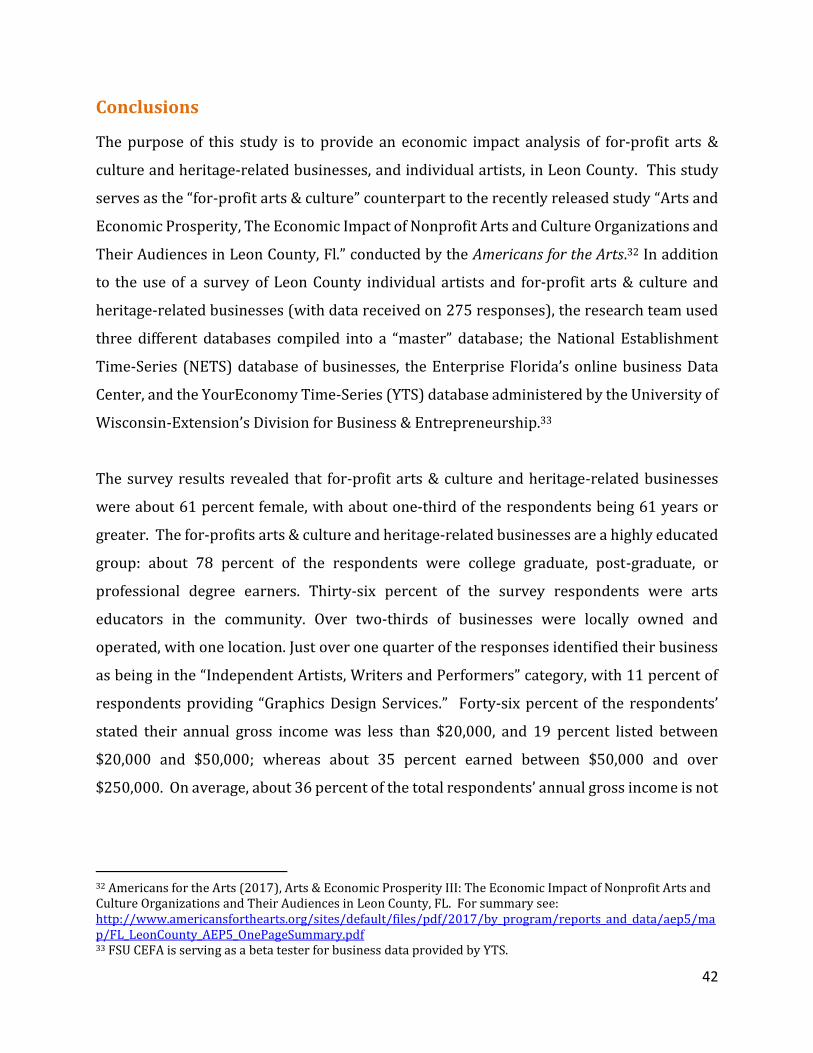
Conclusions
The purpose of this study is to provide an economic impact analysis of for-profit arts &
culture and heritage-related businesses, and individual artists, in Leon County. This study
serves as the “for-profit arts & culture” counterpart to the recently released study “Arts and
Economic Prosperity, The Economic Impact of Nonprofit Arts and Culture Organizations and
Their Audiences in Leon County, Fl.” conducted by the Americans for the Arts.32 In addition
to the use of a survey of Leon County individual artists and for-profit arts & culture and
heritage-related businesses (with data received on 275 responses), the research team used
three different databases compiled into a “master” database; the National Establishment
Time-Series (NETS) database of businesses, the Enterprise Florida’s online business Data
Center, and the YourEconomy Time-Series (YTS) database administered by the University of
Wisconsin-Extension’s Division for Business & Entrepreneurship.33
The survey results revealed that for-profit arts & culture and heritage-related businesses
were about 61 percent female, with about one-third of the respondents being 61 years or
greater. The for-profits arts & culture and heritage-related businesses are a highly educated
group: about 78 percent of the respondents were college graduate, post-graduate, or
professional degree earners. Thirty-six percent of the survey respondents were arts
educators in the community. Over two-thirds of businesses were locally owned and
operated, with one location. Just over one quarter of the responses identified their business
as being in the “Independent Artists, Writers and Performers” category, with 11 percent of
respondents providing “Graphics Design Services.” Forty-six percent of the respondents’
stated their annual gross income was less than $20,000, and 19 percent listed between
$20,000 and $50,000; whereas about 35 percent earned between $50,000 and over
$250,000. On average, about 36 percent of the total respondents’ annual gross income is not
32 Americans for the Arts (2017), Arts & Economic Prosperity III: The Economic Impact of Nonprofit Arts and Culture Organizations and Their Audiences in Leon County, FL. For summary see: http://www.americansforthearts.org/sites/default/files/pdf/2017/by_program/reports_and_data/aep5/map/FL_LeonCounty_AEP5_OnePageSummary.pdf 33 FSU CEFA is serving as a beta tester for business data provided by YTS.

43
related to for-profit arts & culture and heritage-related work. Over ¾ of the respondents’
stated that the annual wages of their employees were $35,000 or less.
According to the respondents, their in-state clients comprised about 80 percent, and out-of-
state clients were 20 percent of their total clientele. Regarding their perception on the arts
& culture and heritage-related businesses customer base over the last ten years, almost 60
percent responded that they perceived an increase in customers over time, whereas the
remainder 40 percent saw either no change or a worsening, in equal proportions of 20
percent, respectively.
Using the for-profit arts & culture and heritage-related business master database, the
research team identified 3,327 for-profit arts & culture and heritage-related establishments
in the Tallahassee area. In addition to using supplemental data from the Bureau of Labor
Statistics (BLS) and Florida Department of Economic Opportunity (DEO) Workforce Data,
the research team estimated that for-profit arts & culture and heritage-related businesses
represented 2.2 percent of the local economy in 2016. In direct terms, this constituted
approximately $313.5 million in sales/revenues in arts & culture and heritage-related
businesses in the area. As the next step, in order to perform the economic impact analysis,
the research team used the IMPLAN software, based on the sales data in the master for-profit
arts & culture and heritage-related business database.
The total economic impacts of the for-profit arts & culture and heritage-related businesses
in Leon County, including regional economic multiplier effects arising from supply chain
activity (indirect effects) and employee household spending (induced effects) for new final
demand generated by for-profit arts & culture and heritage-related business sales, are
summarized in the following Table. The industry output impacts were estimated at $526.2
million, representing the sales revenues received for goods and services sold to the for-profit
arts & culture and heritage-related businesses. The total employment impacts were
estimated at 5,731 fulltime and part-time jobs, representing approximately 3.9 percent of
the Leon County workforce. The total value added impact of $276.7 million represents the
net value of total economic activity generated, and is also equivalent to 2 percent of the Leon

44
County Gross Domestic Product (GDP). Labor income impacts of $205.6 million represented
wages, salaries and benefits received by employees and business owners, or 1.8 percent of
the Leon County labor income.34
Table 3. Summary of Economic Impacts, by Economic Activity, of the For-Profit Arts &
Culture and Heritage-Related Businesses in Leon County
Values in June, 2017 dollars. Sources: FSU CEFA master database of arts & culture and heritage-related businesses.; IMPLAN software and most recent Leon county data (2015).
In summary, the arts & culture and heritage-related businesses are an important contributor
to Leon County’s economy both directly and indirectly through business sales and revenues.
As of June 2017, the total economic impacts of the for-profit arts and culture and heritage-
related businesses were estimated at $526.2 million (or over $0.5 billion) in output or
revenues, $205.6 million in labor income, $276.6 million in value added (GDP), and 5,731
jobs.
34 Note that these economic measures are independent and should not be summed together.
Economic Impacts Direct Indirect Induced Total
Output $312,199,849 $105,419,392 $108,587,337 $526,206,578
Employment 4,045 825 861 5,731
Labor Income $135,891,320 $35,684,804 $34,058,384 $205,634,508
Value Added $156,485,189 $56,549,469 $63,622,414 $276,657,072
COCA For Profit Arts & Culture Businesses

45
References
Americans for the Arts. (2009). Arts & Economic Prosperity III: The Economic Impact of
Nonprofit Arts and Culture Organizations and Their Audiences in Leon County, FL.
See: http://www.americansforthearts.org/by-program/reports-and-data/research-studies-
publications/arts-economic-prosperity-iv/arts-economic-prosperity-iii
Americans for the Arts. (2017). Arts & Economic Prosperity V: The Eonomic Impact of
Nonprofit Arts and Culture Organizations and Their Audiences in Leon County, FL.
See: http://www.americansforthearts.org/by-program/reports-and-data/research-studies-
publications/arts-economic-prosperity-5/use/download-the-report
Americans for the Arts. (2017). Statement on Arts, Jobs, and the Economy. See:
http://www.americansforthearts.org/news-room/arts-mobilization-center/statement-on-
arts-jobs-and-the-economy
Guetzkow, J. (2002). How the Arts Impact Communities: An Introduction to the Literature on Arts Impact Studies. Center for Arts and Culture Policy Studies. Princeton University. See: https://www.princeton.edu/~artspol/workpap/WP20%20-
%20Guetzkow.pdf
Hutter, V. (2017). Latest Economic Data Tracks Arts and Cultural Jobs per State: Bureau of
Economic Analysis & National Endowment for the Arts Release Research. Office of
Research and Analysis. National Endowment for the Arts. See:
https://www.arts.gov/news/2017/latest-economic-data-tracks-arts-and-cultural-jobs-state
Institute for Nonprofit Innovation and Excellence. (2017). Sector Forward: Impact and
Opportunity of Nonprofits in Leon County and Florida’s Big Bend. See:
http://www.theinstitutefornonprofits.org/assets/Sector%20Forward%20Report%202017.p
df
Lynch, T. (2007). Economic Assessment of the Leon County Charitable Not for Profit
Organizations and Impact Contributions to the Tallahassee and Leon County
Economy. United Partners for Human Services. Florida State University Center for
Economic Forecasting and Analysis. See:
http://www.uphsfl.org/docs/Entire%20Knight%20highres.pdf
National Assembly of State Arts Agencies (2017). Creative Work Force State Profiles.See:
https://nasaa-arts.org/nasaa_research/creative-work-force-state-profiles/
46
Reeves, M. (n.d.). Measuring the Economic and Social Impact of the Arts: A Review. The Arts Council of England. See: https://artshealthnetwork.ca/resources/measuring-economic-
and-social-impact-arts-review
WealthEngine. (2010). 2010 Arts & Culture Report: Best Practices in Arts & Culture
Fundraising. See: http://info.wealthengine.com/arts-culture-best-practices-pr.html
47
Appendices
Appendix A-1. For-Profit Arts & Culture and Heritage-Related Businesses Survey Dear Arts and Cultural Leaders,
Please take a few minutes to answer the following questions. This
survey is part of a study to measure the economic impact of the for-
profit, creative economy in Leon County, Florida. Your answers
are anonymous and will be held strictly confidential. Please
answer each question completely and return the survey by May
31st, 2017, to the attached Survey Monkey web link. Thank you!
1. What is the zip code of your primary business?
2. What is your type of business (NAICS35 code)?
3. What year did your business startup?
4. What is your annual gross income (please circle)?
a. Under $20,000
b. $20,000-$49,999
c. $50,000-$79,999
d. $80,000-$99,999
e. $100,000-$249,999
f. Over $250,000
5. If you are an individual practicing artist/arts educator, what percentage of your annual
gross income is independent from work you do with local arts or cultural non-profits or
government?
6. If you are an individual practicing artist, what percentage of your annual gross income is
NOT related to arts/cultural work? ___________________
(For example, if you work full-time as an attorney, but you receive 20% of your annual
income from your band, your answer here would be answer 20%). If you are an arts
teacher, you should consider your teaching income under the category of “practicing
artist”).
7. What is your education level (please circle)?
35 See: https://www.census.gov/eos/www/naics/
48
a. Some High School
b. High School Grad
c. Technical School
d. Some College
e. College Associate’s Degree
f. College Graduate
g. Post-Graduate
h. Professional
8. What is your age (please circle)?
a. Under 16 years
b. 16-20 years
c. 21-30 years
d. 31-40 years
e. 41-50 years
f. 51-60 years
g. 61-70 years
h. Over 71+ years
9. What gender do you identify with (please circle)?
a. Female
b. Male
c. Other
10. Do you operate in a commercial or residential space (please circle)?
a. Commercial
b. Residential
11. Do you own or rent that space? (please circle).
a. Own
b. Rent/Lease
12. If you own, do you have a mortgage?
a. No
b. Yes (and provide estimated monthly mortgage)
13. If you rent, what is your total estimated monthly rent/lease?
14. Do you own or rent your business equipment (please circle)?
a. Own
b. Rent/Lease
c. Not applicable
15. If you own your equipment, do you have a loan?

49
a. No
b. Yes (and provide estimated monthly loan amount)
16. If you rent/lease your equipment, what is your estimated monthly amount?
17. How many paid employees do you have in your business, and of those, how many are full-
and part-time?
Full-Time Part-Time a. One or fewer
b. 2-5
c. 6-10
d. 11-50
e. Greater than 50
18. Taxes: How much do you pay yearly in:
a. Property Taxes
b. Income Taxes
c. Other Taxes (please specify)
Relating to your Arts-Related Business and on a Monthly Basis:
19. How much do you spend on eating/drinking?
20. How much do you spend on transportation36 expenses?
21. How much do you spend on lodging expenses?
22. How much do you spend on arts-related supplies?
23. How much do you spend on arts-related marketing? __________________________
24. How much do you spend on entertainment?
25. How much do you spend on personal shopping/retail?
26. How much do you spend on other misc. expenses?
27. What percentage of your clients are:
a. Local (Leon County) %
b. Out-of-State %
c. In-State %
36 Transportation: e.g., car rental, car payment, plane, bus, and other transportation mode(s)

50
d. International __________________%
28. In your perception, over the last ten years, is the arts & culture customer base (select one):
a. Increasing
b. Decreasing
c. Constant/No Change
29. Thank you for your time; please provide any further comments in the comment box below.

51
Appendix A-2. Statistical Results for the For-Profit Arts & Culture Survey Number of observations: 275 General Demographic Information (Unconditional) Gender:
Gender Male Female N.A. Total
Number of obs. & percentage
53 83 139 275
19% 30% 51% 100%
Age:
Age Under
16 21-30
31-40
41-50
51-60
61-70
Over 71
N.A. Total
Number of obs. & percentage
4 6 20 28 28 45 5 139 275
1% 2% 7% 10% 10% 16% 2% 51% 100%
Highest level of education completed:
Education Number of obs. & percentage
College associate’s degree 12 4%
College graduate 59 21%
High school grad. 2 1%
Post graduate 26 9%
Professional degree 22 8%
Some college 9 3%
Some high school 4 1%
Technical school 2 1%
N.A. 139 51%
Total 275 100%
Annual gross income:
Annual gross income Number of obs. & percentage
Less than $20,000 62 23%
$20,000-$49,999 26 9%
$50,000-$79,999 15 5%
$80,000-$99,999 9 3%
$100,000-$250,000 12 4%
Greater than $250,000 12 4%
N.A. 139 51%
Total 275 100%

52
Business Type Description:
Best description Number of obs. & percentage Branch or division of a regional, national, or international company
6 2.00%
Franchise 1 0.36%
Locally owned and operated, with more than one location
15 5.00%
Locally owned and operated, with one location
187 68.00%
None of the above 66 24.00%
Total 275 100.00%
Arts educator and additional annual art-related income from the teaching salary:
Arts educator or
not
Number of obs. & percentage
Additional annual art-
related income
from the teaching
salary
Number of obs. & percentage
Yes 98 36%
Yes 59 21%
No 34 12%
Not applicable
5 2%
No 177 64%
Yes 21 8%
No 22 8%
Not applicable
134 49%
Total 275 100% Total 275 100%

53
Individual artist:
Percentage
Individual artist educator’s annual gross
income, independent from non-profit
organizations (frequency)
Individual artist’s annual gross income, not related to art work (frequency)
0% 14 28
1%-24% 16 14 25%-49% 0 3
50%-74% 10 7 75%-100% 31 22
N.A. 204 201
Total 275 275 NAICS code:
NAICS code Number of obs. & percentage 323111 - Commercial Printing (except Screen and Books)
2 0.73%
323115 - Digital Printing 1 0.36%
323121 - Trade binding and Related Work 1 0.36%
339911 - Jewelry, Except Costume, Manufacturing 2 0.73%
339914 - Costume Jewelry and Novelty Manufacturing
1 0.36%
445299 - All Other Specialty Food Stores 1 0.36%
451140 - Musical Instrument and Supplies Stores 1 0.36%
451211 - Book Stores 1 0.36%
453920 - Art Dealers 2 0.73%
512110 - Motion Picture and Video Production 3 1.09%
512199 - Other Motion Picture and Video Industries 1 0.36%
512230 - Music Publishers 1 0.36%
512240 - Sound Recording Studios 1 0.36%
515120 - Television Broadcasting 2 0.73%
516110 - Internet Publishing and Broadcasting 2 0.73%
541310 - Architectural Services 2 0.73%
541410 - Interior Design Services 1 0.36%
541430 - Graphic Design Services 13 4.73%
541490 - Other Specialized Design Services 4 1.45%
541810 - Advertising Agencies 1 0.36%
541820 - Public Relations Agencies 1 0.36%
541890 - Other Services Related to Advertising 2 0.73%
541921 - Photography Studios, Portrait 5 1.82%
541922 - Commercial Photography 6 2.18%

54
611610 - Fine Arts Schools 4 1.45%
711120 - Dance Companies 4 1.45%
711130 - Musical Groups and Artists 9 3.27%
711190 - Other Performing Arts Companies 6 2.18%
711310 - Promoters of Performing Arts, Sports, and Similar Events with Facilities
3 1.09%
711410 - Agents and Managers for Artists, Athletes, Entertainers, and Other Public Figures
1 0.36%
711510 - Independent Artists, Writers, and Performers
32 11.64%
712110 - Museums 3 1.09%
722320 - Caterers 2 0.73%
Please select from the choices below: 15 5.45%
N.A. 139 50.55%
Total 275 100.00%
Creation time of business:
Time Number of obs. & percentage
Before 1949 2 0.73%
1950-1959 1 0.36%
1960-1969 1 0.36%
1970-1979 9 3.27%
1980-1989 11 4.00%
1990-1999 19 6.91%
2000-2009 32 11.64%
After 2010 44 16.00%
N.A. 156 56.73%
Total 275 100.00%
Business revenue and cost Revenue Annual sales (same scale with annual gross income):
Annual sale Number of obs. & percentage
Less than $20,000 36 13.09%
$20,000-$49,999 10 3.64%
$50,000-$79,999 7 2.55%
$80,000-$99,999 3 1.09% $100,000-$250,000 10 3.64%
Greater than $250,000 8 2.91% N.A. 201 73.09%
Total 275 100.00%

55
Costs Employment:
Average annual wage of employees
Annual wage Number of obs. & percentage
Less than $35,000 105 38.18%
$35,000-$49,999 17 6.18%
$50,000-$74,999 8 2.91%
$75,000-$100,000 1 0.36%
Greater than $100,000 5 1.82%
N.A. 139 50.55%
Total 275 100.00%
Employee type
Employee type Employee Number Number of obs. & percentage
Full time
0 17.45% 17.45%
1 12.73% 12.73%
2 1.45% 1.45%
3 1.09% 1.09%
4 1.45% 1.45%
5 1.09% 1.09%
6 0.36% 0.36%
Above 6 1.82% 1.82%
N.A. 62.55% 62.55%
Total 275 100.00%
Part time
0 21.82% 21.82%
1 5.82% 5.82%
2 1.82% 1.82%
3 1.09% 1.09%
4 1.09% 1.09%
5 0.36% 0.36%
6 0.73% 0.73%
Above 6 2.18% 2.18%
N.A. 65.09% 65.09%
Total 275 100.00%

56
Primary operation place:
Location Type Number of obs. &
percentage Ownership
Number of obs. & percentage
Commercial 53 19% Rent 28 11%
Own 25 9%
Residential 79 29% Rent 15 5%
Own 64 23%
N.A. 143 52% N.A. 143 52%
Total 275 100% Total 275 100%
Amount Monthly Mortgage
Frequency Monthly Rent Lease
Frequency
$0 93 98
$1-$999 13 18 $1,000-$1,999 16 13
$2,000-$2,999 3 1 $3,000-$3,999 4 1
Above $4,000 3 1
N.A. 143 143 Total 275 275
Business equipment:
Own or rent Number of obs. &
percentage Loan or
rent/lease Number of obs. &
percentage
Own 116 42%
Yes 3 1.00%
No 111 40.00%
N.A. 2 1.00%
Rent 3 1% $0 2 1.00%
$1-100 1 0.36%
Both own and rent
2 1%
Yes & $1-$100
1 0.36%
Yes & Above $ 100
1 0.36%
N.A. 154 56% N.A. 154 56.00%
Total 275 100% Total 275 100.00%

57
Taxes:
Annual income
taxes
Number of obs. & percentage
Annual property
taxes
Number of obs. & percentage
$0 231 84.00% $0 229 83.27%
$1-$1,999 3 1.09% $1-$1,999 21 7.64%
$2,000-$3,999
15 5.45% $2,000-$3,999
11 4.00%
$4,000-$5,999
5 1.82% $4,000-$5,999
7 2.55%
$6,000-$7,999
2 0.73% $6,000-$7,999
2 0.73%
$8,000-$9,999
2 0.73% $8,000-$9,999
1 0.36%
Above $10,000
17 6.18% Above $10,000
4 1.45%
Total 275 100.00% Total 275 100.00%
Annual other
taxes Amount Number of obs. & percentage
Other taxes (Sales taxes)
$0 12 4.36%
$1-$1,999 6 2.18% $2,000-$3,999 3 1.09%
$4,000-$5,999 1 0.36%
$6,000-$7,999 0 0.00% $8,000-$9,999 0 0.00%
Above $10,000 5 1.82% N.A. 5 1.82%
N.A. 243 88.36%
Total 275 100.00%

58
Other Expenses:
Other expenses including eating/drinking,
transportation, lodging, supplies, entertainment,
marketing, shopping/retail, and other
miscellaneous items
Number of obs. & percentage
$0 198 72%
$1-$1,999 53 19%
$2,000-$3,999 9 3%
$4,000-$5,999 5 2%
$6,000-$7,999 2 1%
$8,000-$9,999 2 1%
Above $10,000 6 2%
Total 275 100%
Clients
Range Leon county In--state Out-state International Client type percentage
Number of obs. & percentage
Number of obs. & percentage
Number of obs. & percentage
Number of obs. & percentage
0% 193 70.18% 195 70.91% 207 75.27% 253 92.00%
1%-19% 7 2.55% 5 1.82% 35 12.73% 20 7.27%
20%-39% 1 0.36% 3 1.09% 20 7.27% 1 0.36%
40%-59% 11 4.00% 4 1.45% 5 1.82% 1 0.36%
60%-79% 15 5.45% 13 4.73% 2 0.73% 0 0.00%
80%-99% 38 13.82% 42 15.27% 3 1.09% 0 0.00%
100% 10 3.64% 13 4.73% 3 1.09% 0 0.00%
Total 275 100.00% 275 100.00% 275 100.00% 275 100.00%

59
Appendix B. Americans for the Arts Example Survey for 2017

60
Appendix C. OEV List of For-Profit Arts & Culture and Heritage-Related Businesses (or Creative Economy) Codes

61
Appendix C. OEV List of Arts & Culture and Heritage-Related Business (or Creative Economy) Codes, Cont. Creative Enterprises by NAICS Code Creative Occupations
Culinary Arts Artists 445291 Baked goods stores 27-1011 Art directors 445292 Confectionery and nut stores 27-1012 Craft artists
445299 All other specialty food stores 27-1013 Fine artists, including painters, sculptors and illustrators
722320 Caterers 27-1014 Multi-media artists and animators Design 27-1019 Artists and related workers, all other 332323 Ornamental and architectural metal work manufacturing
27-2011 Actors
337212 Custom architectural woodwork and millwork 27-2012 Producers and directors 541310 Architectural services 27-2031 Dancers 541320 Landscape architectural services 27-2032 Choreographers 541340 Drafting services 27-2041 Music directors and composers 541410 Interior design services 27-2042 Musicians and singers
541420 Industrial design services 27-2099 Entertainers and performers, sports and related workers, all others
541430 Graphic design services 27-3043 Writers and authors
541490 Other specialized design services 51-9071 Jewelers and precious stone and metal workers
541810 Advertising agencies Culinary Artists 541820 Public relations agencies 35-1011 Chefs and head cooks 541830 Media buying agencies 51-3011 Bakers 541840 Media representatives Cultural 541850 Display advertising 25-4011 Archivists 541860 Direct mail advertising 25-4012 Curators 541890 Other services related to advertising 25-4013 Museum technicians and
conservators 541922 Commercial photography 25-4021 Librarians Film & Media 25-4031 Library technicians 512110 Motion picture and video production 25-9011 Audio-visual collections specialists 512120 Motion picture and video distribution Designers 512131 Motion picture theaters, except drive-ins 17-1011 Architects, except landscape and
naval 512132 Drive-in motion picture theaters 17-1012 Landscape architects 512191 Teleproduction and postproduction services 17-3011 Architectural and civil drafters 512199 Other motion picture and video industries 27-1021 Commercial and industrial designers 512210 Record production 27-1022 Fashion designers 512220 Integrated record production and distribution 27-1023 Floral designers 512230 Music publishers 27-1024 Graphic designers 512240 Sound recording studios 27-1025 Interior designers 512290 Other sound recording industries 27-1027 Set and exhibit designers 515111 Radio networks 27-1029 Designers, all other 515112 Radio stations Media 515120 Television broadcasting 11-2011 Advertising and promotions
managers 515210 Cable and other subscription programming 11-2021 Marketing managers 516110 Internet publishing and broadcasting 11-2031 Public relations managers

62
517510 Cable and other program distribution 13-1011 Agents and business managers of artists, performers, and athletes
519110 News syndicates 27-3011 Radio and television announcers 711410 Agents and managers for public figures 27-3021 Broadcast news analysts Cultural Heritage 27-3022 Reporters and correspondents 712110 Museums 27-3031 Public relations specialists 712120 Historical sites 27-3041 Editors 712130 Zoos and botanical gardens 27-3042 Technical writers
Literary Arts & Publishing 27-3099 Media and communication workers, all other
323110 Commercial lithographic printing 27-4011 Audio and video equipment technicians
323111 Commercial gravure printing 27-4012 Broadcast technicians 323112 Commercial flexographic printing 27-4013 Radio operators 323113 Commercial screen printing 27-4014 Sound engineering technicians 323115 Digital printing 27-4021 Photographers
323117 Books printing 27-4031 Camera operators, television, video, and motion picture
323119 Other commercial printing 27-4032 Film and video editors
323121 Tradebinding and related work 27-4099 Media and communication equipment workers, all other
323122 Prepress services
424920 Book and periodical merchant wholesalers
451211 Bookstores
451212 News dealers and newsstands
511110 Newspaper publishers
511120 Periodical publishers
511130 Book publishers
511199 All other publishers
519120 Libraries and archives
Performing and Visual Arts
339911 Jewelry, except costume, manufacturing
339914 Costume jewelry and novelty manufacturing
339992 Musical instrument manufacturing
423940 Jewelry merchant wholesalers
448310 Jewelry stores
451140 Musical instrument and supplies stores 453920 Art dealers 541921 Photography studios, portrait
611610 Fine arts schools *Distributed throughout.
Theater companies and dinner theaters Source: NAICS RTS 711120 Dance companies Note: The NAICS codes and occupations reflected in the chart below should be considered a starting point.
711130 Musical groups and artists 711190 Other performing arts companies 711310 Promoters with facilities 711320 Promoters without facilities 711510 Independent artists, writers, and performers*