Embed Size (px)
Citation preview
April 2008
The Economic Impact of Cerebral Palsy in Australia in 2007
Report by Access Economics Pty Limited for
Cerebral Palsy Australia
The Economic Impact of Cerebral Palsy in Australia in 2007
i
CONTENTS
Glossary of acronyms............................... ..........................................................................iv
Acknowledgements................................... ...........................................................................v
Executive summary.................................. ...........................................................................vi
1. Prevalence and epidemiology ........................ ............................................................1 1.1 Definition ..............................................................................................................................1 1.2 Types of CP .........................................................................................................................2 1.3 Severity of CP ......................................................................................................................4 1.4 Aetiology ..............................................................................................................................6 1.5 Associated risks ...................................................................................................................9
1.5.1 Musculoskeletal deformities ......................................................................................9 1.5.2 Intellectual impairment...............................................................................................9 1.5.3 Speech impairment..................................................................................................10 1.5.4 Visual impairment ....................................................................................................10 1.5.5 Hearing impairments................................................................................................10 1.5.6 Feeding and nutrition ...............................................................................................11 1.5.7 Urogenital impairments............................................................................................11 1.5.8 Epilepsy ...................................................................................................................11
1.6 Mortality and survival rates ................................................................................................12 1.7 Incidence and prevalence ..................................................................................................15
1.7.1 Baseline prevalence estimates................................................................................17 1.7.2 Projections of future prevalence ..............................................................................18
1.8 Managing cerebral palsy....................................................................................................19 1.8.1 Coordinated management .......................................................................................19 1.8.2 Treatments...............................................................................................................22
2. Health costs....................................... ........................................................................25 2.1 BEACH data for CP ...........................................................................................................26
2.1.1 GP costs ..................................................................................................................26 2.1.2 Pharmaceutical costs...............................................................................................28 2.1.3 Pathology costs .......................................................................................................28 2.1.4 Specialist costs ........................................................................................................29 2.1.5 Imaging costs...........................................................................................................29 2.1.6 Hospital inpatient costs............................................................................................29
2.2 Summary of CP health costs, 2007 ...................................................................................30 2.3 Total health system expenditure by bearer........................................................................30
3. Other financial costs.............................. ...................................................................31 3.1 Productivity losses .............................................................................................................31
3.1.1 Employment participation ........................................................................................32 3.1.2 Absenteeism from paid and unpaid work ................................................................33 3.1.3 Presenteeism...........................................................................................................33 3.1.4 Premature death ......................................................................................................33 3.1.5 Lost taxation revenue ..............................................................................................34
3.2 Carer costs.........................................................................................................................35
The Economic Impact of Cerebral Palsy in Australia in 2007
ii
3.2.1 Methodology ............................................................................................................36 3.2.2 Informal and community care costs.........................................................................36
3.3 Direct program services costs............................................................................................37 3.4 Aids and home modifications .............................................................................................39 3.5 Funeral costs......................................................................................................................40 3.6 Deadweight losses from transfers......................................................................................41
3.6.1 Welfare and income support payments ...................................................................41 3.6.2 Deadweight losses...................................................................................................41
3.7 Summary of other financial costs.......................................................................................43
4. Burden of disease .................................. ...................................................................44 4.1 Methodology – valuing life and health ...............................................................................44
4.1.1 Disability Adjusted Life Years (DALYs) and Quality Adjusted Life Years (QALYs) ...................................................................................................................45
4.1.2 Discount rates..........................................................................................................47 4.2 Burden of disease due to CP.............................................................................................48
4.2.1 Disability weights .....................................................................................................48 4.2.2 Years of life lost due to disability .............................................................................49 4.2.3 Years of life due to premature death .......................................................................49 4.2.4 Total DALYs due to CP............................................................................................49 4.2.5 Net value of healthy life lost.....................................................................................50
5. Cost summary, comparisons and challenges........... ..............................................51 5.1 Cost summary....................................................................................................................51 5.2 Comparisons ......................................................................................................................53
5.2.1 Prevalence comparisons .........................................................................................53 5.2.2 Cost comparisons ....................................................................................................53 5.2.3 Burden of disease comparisons ..............................................................................54
5.3 Future directions ................................................................................................................55
References......................................... .................................................................................59
FIGURES
Figure 1-1: Areas of the body affected in spastic cerebral palsy 3 Figure 1-2: Distribution of CP in WA (% of all CP) 3 Figure 1-3: Severity rates of CP in WA over 20 years (% of all CP) 4 Figure 1-4: Rates of intellectual impairment in people with CP (% total) 10 Figure 1-5: Prevalence of CP, Australia, 2007 (people) 18 Figure 3-1: CP, costs of premature mortality by age and gender ($ million) 34 Figure 3-2: DWL of Taxation 42 Figure 4-1: Loss of wellbeing due to CP (DALYs), by age and gender, 2007 50 Figure 5-1: Financial costs of CP, by type of cost (% total) 52 Figure 5-2: Financial costs of CP, by bearer (% total) 52
The Economic Impact of Cerebral Palsy in Australia in 2007
iii
TABLES
Table 1–1: Distribution of CP types, children born in Victoria between 1990 and 1992 4 Table 1–2: CP - comparisons of activity limitations, Australia, 2003 6 Table 1–3: Prevalence of impairments among people with cerebral palsy (SCPE) 12 Table 1–4: Estimated survival percentages, conditional on being alive at age 20 years
(UK study) 13 Table 1–5: Crude and standardised mortality rates per 1,000 person years by age (WA,
1956-1994) 14 Table 1–6: CP deaths in children aged 0-14 years, 1991-2003 15 Table 1–7: People with a disability who had CP, by age and type of special dwelling,
Australia, 2003 16 Table 1–8: CP - comparisons of main disability groups, 2003 17 Table 1–9: CP, projected prevalence to 2050, Australia (people) 19 Table 2–1: CP GP costs 27 Table 2–2: CP pharmaceutical costs 28 Table 2–3: CP specialist referrals by type 29 Table 2–4: Total CP health system expenditure, 2007 30 Table 2–5: Distribution of CP health costs, 2007 30 Table 3–1: Lost earnings and taxation due to CP, 2007 35 Table 3–2: Expenditure on direct services for clients with CP, 2007 38 Table 3–3: CP, aids and equipment prices, estimated product life and total costs, 2007 40 Table 3–4: Summary of other financial costs of CP, 2007 43 Table 4–1: International estimates of VSL, various years 47 Table 4–2:CP, combined disability weight 49 Table 4–3: Estimated years of healthy life lost due to disability (YLD), 2007 (DALYs) 49 Table 4–4: Years of life lost due to premature death (YLL) due to CP, 2007 49 Table 4–5: Net cost of lost wellbeing, $million, 2007 50 Table 5–1: CP, total costs by type of cost and bearer, Australia, 2005 ($ million) 51 Table 5–2: CP, costs by type of cost and bearer, Australia, 2005 ($ per capita) 51 Table 5–3: CP, prevalence comparisons with other conditions 53 Table 5–4: CP, total cost comparisons with other conditions ($ billion) 54 Table 5–5: CP, disability weight comparisons with other conditions 54
The Economic Impact of Cerebral Palsy in Australia in 2007
iv
GLOSSARY OF ACRONYMS
ABS Australian Bureau of Statistics
ADHD Attention Deficit Disorder with Hyperactivity
AGPSCC Australian General Practice Statistics and Classification Centre
AIHW Australian Institute of Health and Welfare
AMA Australian Medical Association
ART assisted reproduction therapies
AWE Average Weekly Earnings
BEACH Bettering the Evaluation and Care of Health
BT-A botulinum toxin
BTE Bureau of Transport Economics
CP cerebral palsy
CSDA Commonwealth State Disability Agreement
DALY Disability Adjusted Life Year
DSP Disability Support Pension
DWL deadweight loss
GDP Gross Domestic Product
GMFCS Gross Motor Function Classification Scheme
GORD Gastro-oesophageal reflux disease
GP general practitioner
IQ Intelligence Quotient
IUGR intrauterine growth restriction
MBS Medicare Benefits Schedule
NHPA National Health Priority Area
NOHSC National Occupational Health and Safety Commission
OECD Organization for Economic Cooperation and Development
PPP purchasing power parity
QALY Quality Adjusted Life Year
SCPE Surveillance of Cerebral Palsy in Europe
SDAC Survey of Disability, Ageing and Carers (ABS)
SES socioeconomic status
SWS Supported Wage System
UK United Kingdom
VSL(Y) Value of a Statistical Life (Year)
WA Western Australia
YLD Years of healthy life Lost due to Disability
YLL Years of Life Lost due to premature death

The Economic Impact of Cerebral Palsy in Australia in 2007
v
ACKNOWLEDGEMENTS
Access Economics acknowledges with gratitude the comments and expert input from:
Michael Bink Head of Research and Community Development, Scope
Eve Blair Associate Professor, Cerebral Palsy Studies, Telethon Institute for Child Health Research
Robyn Cummins Manager Information Services, The Spastic Centre, New South Wales
Anita Ghose General Manager, Corporate Development, The Centre for Cerebral Palsy, Western Australia
Deborah Hoffman General Manager, Strategy, Research and Planning, The Spastic Centre, New South Wales
John Knowles President, CP Australia
Sarah McIntyre Sargents Research Fellow, CP Institute
Iona Novak Head of Research, CP Institute
Linda Watson Manager, WA Cerebral Palsy Register, Telethon Institute for Child Health Research
Rob White Chief Executive Officer, The Spastic Centre, New South Wales
The Economic Impact of Cerebral Palsy in Australia in 2007
vi
EXECUTIVE SUMMARY
Cerebral palsy (CP) refers to a range of motor disorders arising from a non-progressive defect or damage to the developing brain in a baby or infant. CP is associated with many perinatal factors (such as maternal iodine deficiency, rubella or cytomegalovirus infection), preterm birth, intrauterine growth restriction, birth asphyxia, multiple pregnancy and occasionally with postneonatal factors such as head trauma or cerebral infections.
Motor disability ranges from minimal to profound, and there are increased risks of intellectual, speech, vision, hearing, endocrine and urogenital impairments and epilepsy, which can greatly contribute to overall disability. There is no pre-birth test for CP, and there is no cure.
CP in Australia
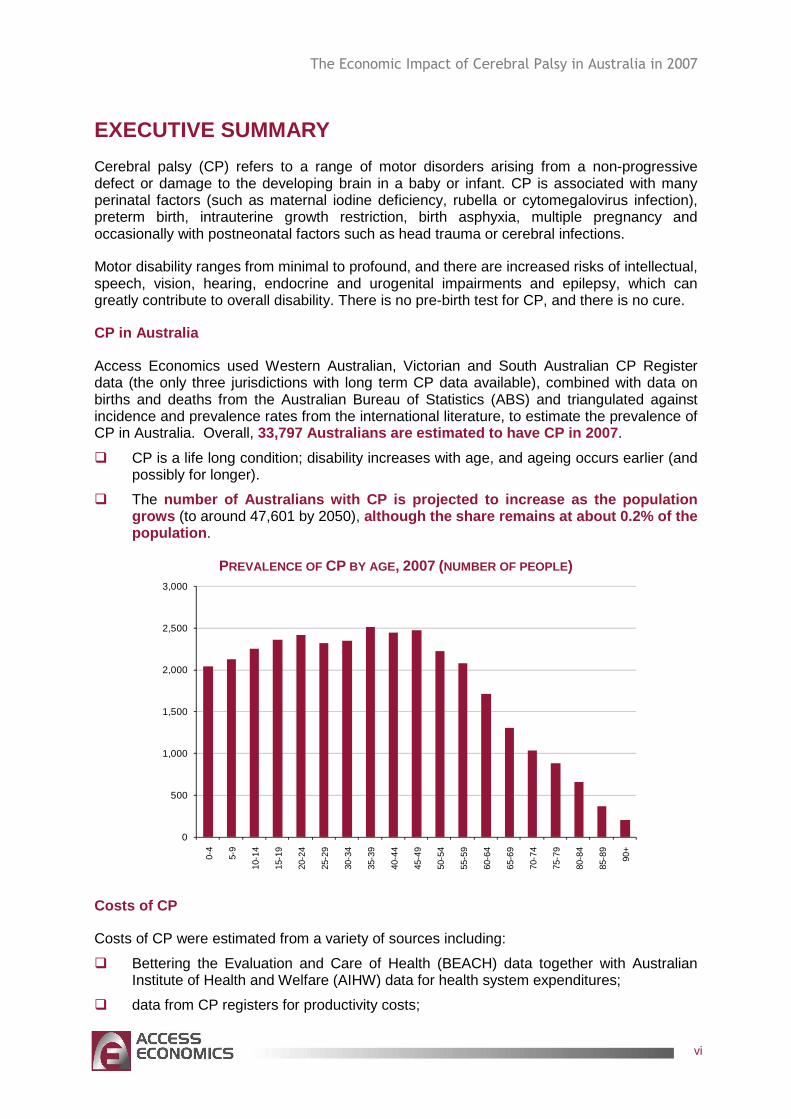
Access Economics used Western Australian, Victorian and South Australian CP Register data (the only three jurisdictions with long term CP data available), combined with data on births and deaths from the Australian Bureau of Statistics (ABS) and triangulated against incidence and prevalence rates from the international literature, to estimate the prevalence of CP in Australia. Overall, 33,797 Australians are estimated to have CP in 2007 .
� CP is a life long condition; disability increases with age, and ageing occurs earlier (and possibly for longer).
� The number of Australians with CP is projected to incre ase as the population grows (to around 47,601 by 2050), although the share remains at about 0.2% of the population .
PREVALENCE OF CP BY AGE , 2007 (NUMBER OF PEOPLE)
0
500
1,000
1,500
2,000
2,500
3,000
0-4
5-9
10-1
4
15-1
9
20-2
4
25-2
9
30-3
4
35-3
9
40-4
4
45-4
9
50-5
4
55-5
9
60-6
4
65-6
9
70-7
4
75-7
9
80-8
4
85-8
9
90+
Costs of CP
Costs of CP were estimated from a variety of sources including:
� Bettering the Evaluation and Care of Health (BEACH) data together with Australian Institute of Health and Welfare (AIHW) data for health system expenditures;
� data from CP registers for productivity costs;
The Economic Impact of Cerebral Palsy in Australia in 2007
vii
� data from ABS Survey of Disability, Ageing and Carers (SDAC) to estimate the cost of informal care, aids and equipment;
� Centrelink data to estimate welfare expenditures.
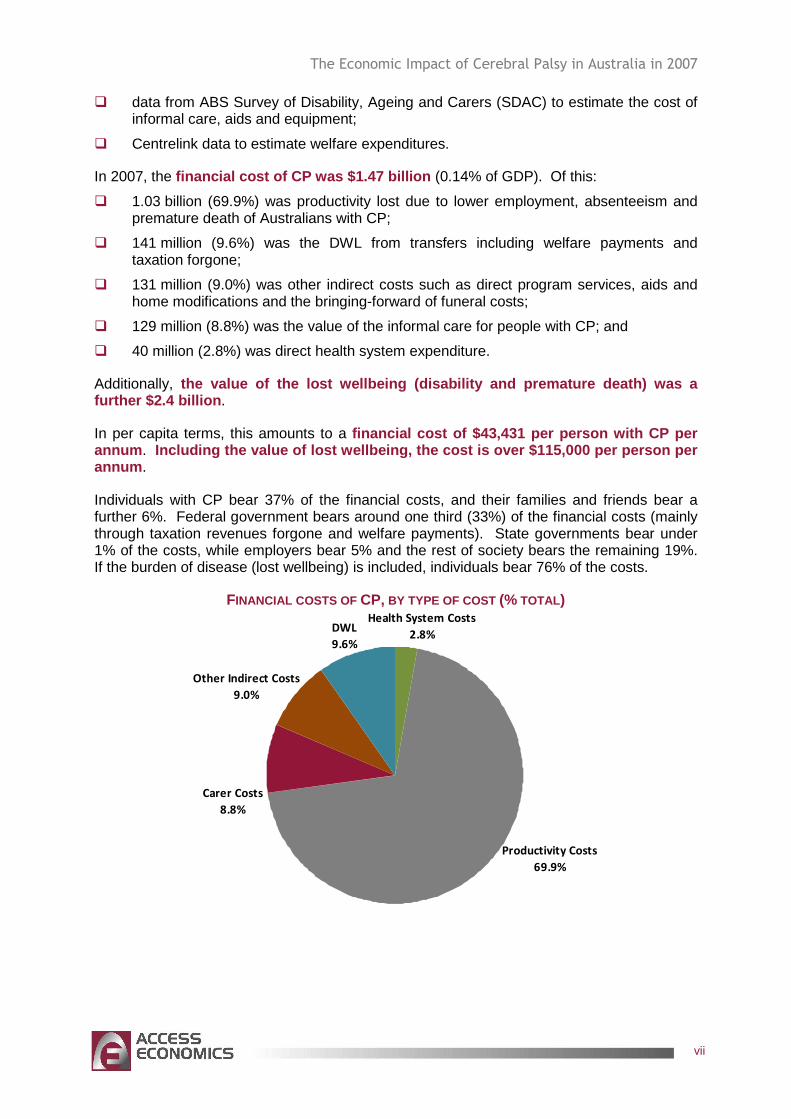
In 2007, the financial cost of CP was $1.47 billion (0.14% of GDP). Of this:
� 1.03 billion (69.9%) was productivity lost due to lower employment, absenteeism and premature death of Australians with CP;
� 141 million (9.6%) was the DWL from transfers including welfare payments and taxation forgone;
� 131 million (9.0%) was other indirect costs such as direct program services, aids and home modifications and the bringing-forward of funeral costs;
� 129 million (8.8%) was the value of the informal care for people with CP; and
� 40 million (2.8%) was direct health system expenditure.
Additionally, the value of the lost wellbeing (disability and pre mature death) was a further $2.4 billion .
In per capita terms, this amounts to a financial cost of $43,431 per person with CP per annum . Including the value of lost wellbeing, the cost is over $115,000 per person per annum .
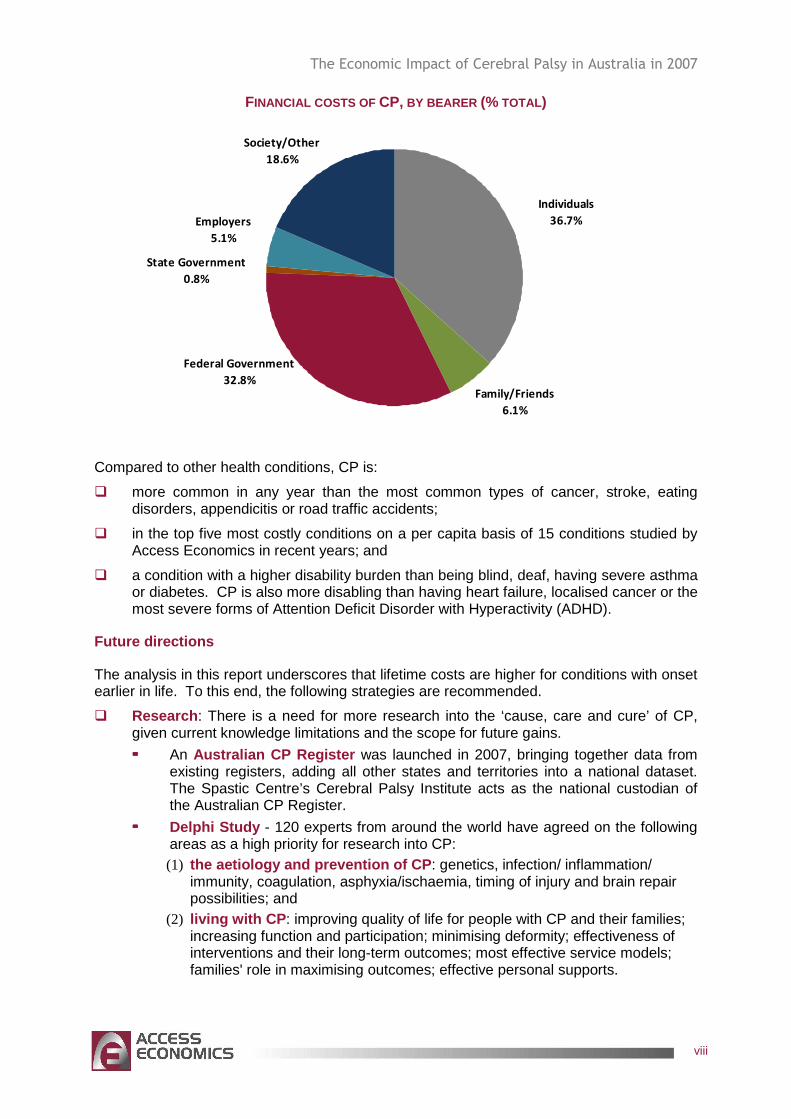
Individuals with CP bear 37% of the financial costs, and their families and friends bear a further 6%. Federal government bears around one third (33%) of the financial costs (mainly through taxation revenues forgone and welfare payments). State governments bear under 1% of the costs, while employers bear 5% and the rest of society bears the remaining 19%. If the burden of disease (lost wellbeing) is included, individuals bear 76% of the costs.
FINANCIAL COSTS OF CP, BY TYPE OF COST (% TOTAL) Health System Costs
2.8%
Productivity Costs
69.9%
Carer Costs
8.8%
Other Indirect Costs
9.0%
DWL
9.6%
The Economic Impact of Cerebral Palsy in Australia in 2007
viii
FINANCIAL COSTS OF CP, BY BEARER (% TOTAL)
Family/Friends
6.1%
State Government
0.8%
Employers
5.1%
Society/Other
18.6%
Individuals
36.7%
Federal Government
32.8%
Compared to other health conditions, CP is:
� more common in any year than the most common types of cancer, stroke, eating disorders, appendicitis or road traffic accidents;
� in the top five most costly conditions on a per capita basis of 15 conditions studied by Access Economics in recent years; and
� a condition with a higher disability burden than being blind, deaf, having severe asthma or diabetes. CP is also more disabling than having heart failure, localised cancer or the most severe forms of Attention Deficit Disorder with Hyperactivity (ADHD).
Future directions
The analysis in this report underscores that lifetime costs are higher for conditions with onset earlier in life. To this end, the following strategies are recommended.
� Research : There is a need for more research into the ‘cause, care and cure’ of CP, given current knowledge limitations and the scope for future gains.
���� An Australian CP Register was launched in 2007, bringing together data from existing registers, adding all other states and territories into a national dataset. The Spastic Centre’s Cerebral Palsy Institute acts as the national custodian of the Australian CP Register.
���� Delphi Study - 120 experts from around the world have agreed on the following areas as a high priority for research into CP: (1) the aetiology and prevention of CP : genetics, infection/ inflammation/
immunity, coagulation, asphyxia/ischaemia, timing of injury and brain repair possibilities; and
(2) living with CP : improving quality of life for people with CP and their families; increasing function and participation; minimising deformity; effectiveness of interventions and their long-term outcomes; most effective service models; families' role in maximising outcomes; effective personal supports.
The Economic Impact of Cerebral Palsy in Australia in 2007
ix
� Diagnosis and early intervention : Education and support programs for mainstream primary care, peri and post-natal services are important to assist with earlier differential diagnosis, to reduce misdiagnosis and to reduce the long lags between onset of symptoms and treatment with provision of intervention services.
� Health service delivery issues : There is a need to better address the complications of CP and develop coordinated management strategies. Other core issues to address are:
���� ongoing, timely access to appropriate medications, including for pain management, muscle relaxation and seizure control;
���� timely access to surgical procedures in public hospitals – in particular, minimum acceptable wait times for anatomical correction surgeries;
���� timely access to allied health professionals, counselling, orthotic and related services (including associated medical aids and equipment such as wheelchairs) through public hospital outpatient departments and other community programs; and
���� workforce training and infrastructure development to ensure service provider capacity across Australia in government, non government and private sectors in specialist and generic services.
� Employment initiatives : Employment programs are required to enhance employment opportunities, retention and adaptation of existing jobs for people with CP, including innovative strategies such as extension of employer incentive schemes, job restructuring or tailoring, part-time and flexible work-from-home options, and transport assistance, as appropriate, together with awareness strategies to counter workplace misperceptions and discrimination.
� Policies to assist carers : Design and delivery of extended relevant support, education and respite services to assist the large proportion of people with CP who are profoundly disabled and live at home, with informal care provided by parents and other family members, and an emphasis on employment continuity for carers.
� Appropriate accommodation : There is a shortage of age-appropriate day care and longer term disability housing for young people with CP. Alternative and better coordinated models of care need to be established across the Commonwealth and State jurisdictions to result in more seamless, flexible and multidisciplinary care and age-appropriate accommodation services.
� Transport, equipment and home modifications : People with CP and their families and carers frequently require assistance with mobility, communication and transport. Wheelchairs, walkers and splints, ramps, showering and bathing aids are still financed largely out of pocket by people with CP and their families and carers. Better access to assistance in these areas is necessary to address the unmet need and to provide reimbursement for large items in a timely manner. Innovative new practices could be developed to improve access to mainstream leisure and recreational services as well as activities of daily life (shopping, attending appointments, going to work).
� Financing reforms : Consideration needs to be given in the next election cycle (2007-2010) to methods for long term financing of health and disability care needs; in particular, to devise ways of channelling private sector resources more effectively to enhance care and outcomes, including through purpose specific savings programs (such as Health Savings Accounts), access to preserved superannuation lump sums for younger people with disabilities, and Disability Trusts to fund accommodation and support services through public-private partnerships.
� Disadvantaged groups : It is recommended that CP services reflect the different needs of different groups of people, in particular people who live in rural and remote

The Economic Impact of Cerebral Palsy in Australia in 2007
x
regions of Australia and/or who are indigenous Australians or are from culturally and linguistically diverse backgrounds.
Access Economics April 2008
The Economic Impact of Cerebral Palsy in Australia in 2007
1
1. PREVALENCE AND EPIDEMIOLOGY
Cerebral palsy (CP) is the most common physical dis ability in childhood, with around 600 to 700 infants being born with CP in Australia each year . The rate of 2-2.5 cases of CP per 1,000 live births has remained relatively stable over the last 60 years. This is despite a significant increase in medical intervention throughout pregnancy and childbirth having led to reduced stillbirth and neonatal death rates. While much is known about the risk factors associated with CP, in many cases its underlying causes remain unknown. The disorder manifests early in life and is a permanent condition.
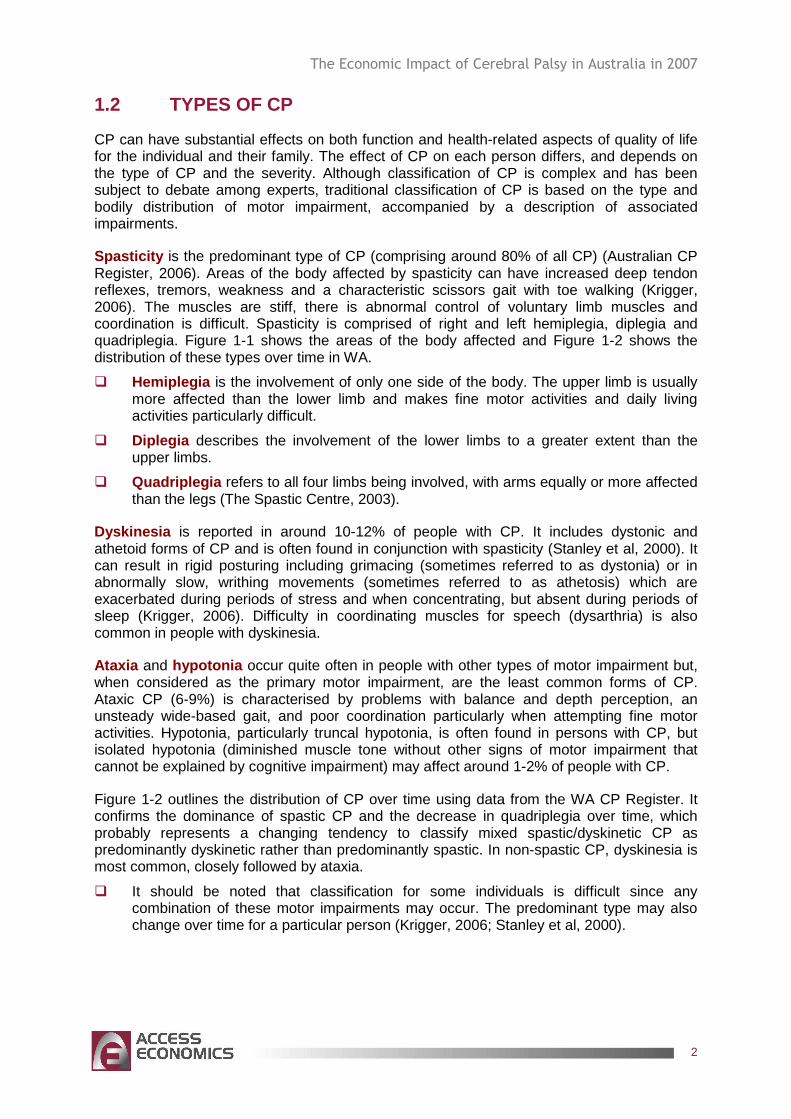
1.1 DEFINITION
CP has traditionally been difficult to define, although there are five key elements that any definition should include. CP is (1) an umbrella term (2) for a group of disorders of movement and/or posture, which is (3) permanent but not unchanging, (4) due to a non-progressive defect or lesion (5) in the developing immature brain (Surveillance of Cerebral Palsy in Europe1, 2000). ‘Cerebral’ refers to the brain and ‘palsy’ means weakness or lack of muscle control.
A recent definition, used in this report, is:
“CP describes a group of disorders of the development of movement and posture, causing activity limitation, that are attributed to non-progressive disturbances that occurred in the developing foetal or infant brain. The motor disorders of CP are often accompanied by disturbances of sensation, cognition, communication, perception, and/or behaviour, and/or by a seizure disorder” (Bax et al, 2005).
The definition encompasses the conceptualisation of disability in the International Classification of Functioning, Disability and Health, where activity limitation is conceived as a component of disability. The definition also expands the notion of CP by recognising other associated impairments (eg, sensory and cognitive) often experienced alongside motor impairment. The definition has been published for consideration by a wide range of CP specialists and builds upon the work of earlier definitions. The severity of disability associated with CP is highly variable, depending on the area of the body that is affected and the type and severity of impairments.
In most cases the precise cause of this injury is unknown. Physical disability can range from minimal (eg, weakness in one hand without discernible effects on activities of daily living) to profound (eg, permanently restricted to a wheelchair and unable to eat or speak independently, requiring 24 hour care). Associated impairments occur for many people with CP and increase the complexity of management for the family, carers and the multidisciplinary teams involved in minimising disability and maximising quality of life. CP can be a complex and debilitating disability. There is no pre-birth test, and there is no cure (The Spastic Centre, 2007).
1 The Surveillance of Cerebral Palsy in Europe (SCPE) is a study of CP across six different European Union countries.
The Economic Impact of Cerebral Palsy in Australia in 2007
2
1.2 TYPES OF CP
CP can have substantial effects on both function and health-related aspects of quality of life for the individual and their family. The effect of CP on each person differs, and depends on the type of CP and the severity. Although classification of CP is complex and has been subject to debate among experts, traditional classification of CP is based on the type and bodily distribution of motor impairment, accompanied by a description of associated impairments.
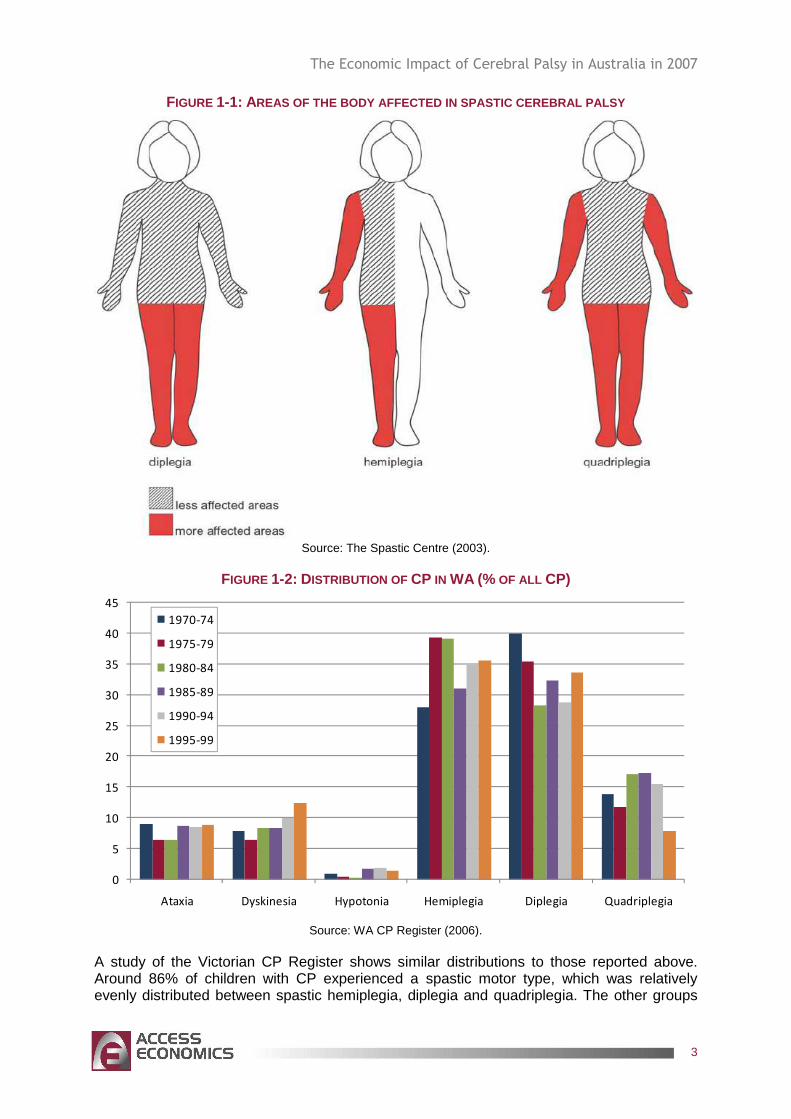
Spasticity is the predominant type of CP (comprising around 80% of all CP) (Australian CP Register, 2006). Areas of the body affected by spasticity can have increased deep tendon reflexes, tremors, weakness and a characteristic scissors gait with toe walking (Krigger, 2006). The muscles are stiff, there is abnormal control of voluntary limb muscles and coordination is difficult. Spasticity is comprised of right and left hemiplegia, diplegia and quadriplegia. Figure 1-1 shows the areas of the body affected and Figure 1-2 shows the distribution of these types over time in WA.
� Hemiplegia is the involvement of only one side of the body. The upper limb is usually more affected than the lower limb and makes fine motor activities and daily living activities particularly difficult.
� Diplegia describes the involvement of the lower limbs to a greater extent than the upper limbs.
� Quadriplegia refers to all four limbs being involved, with arms equally or more affected than the legs (The Spastic Centre, 2003).
Dyskinesia is reported in around 10-12% of people with CP. It includes dystonic and athetoid forms of CP and is often found in conjunction with spasticity (Stanley et al, 2000). It can result in rigid posturing including grimacing (sometimes referred to as dystonia) or in abnormally slow, writhing movements (sometimes referred to as athetosis) which are exacerbated during periods of stress and when concentrating, but absent during periods of sleep (Krigger, 2006). Difficulty in coordinating muscles for speech (dysarthria) is also common in people with dyskinesia.
Ataxia and hypotonia occur quite often in people with other types of motor impairment but, when considered as the primary motor impairment, are the least common forms of CP. Ataxic CP (6-9%) is characterised by problems with balance and depth perception, an unsteady wide-based gait, and poor coordination particularly when attempting fine motor activities. Hypotonia, particularly truncal hypotonia, is often found in persons with CP, but isolated hypotonia (diminished muscle tone without other signs of motor impairment that cannot be explained by cognitive impairment) may affect around 1-2% of people with CP.
Figure 1-2 outlines the distribution of CP over time using data from the WA CP Register. It confirms the dominance of spastic CP and the decrease in quadriplegia over time, which probably represents a changing tendency to classify mixed spastic/dyskinetic CP as predominantly dyskinetic rather than predominantly spastic. In non-spastic CP, dyskinesia is most common, closely followed by ataxia.
� It should be noted that classification for some individuals is difficult since any combination of these motor impairments may occur. The predominant type may also change over time for a particular person (Krigger, 2006; Stanley et al, 2000).
The Economic Impact of Cerebral Palsy in Australia in 2007
3
FIGURE 1-1: AREAS OF THE BODY AFFECTED IN SPASTIC CEREBRAL PALSY
Source: The Spastic Centre (2003).
FIGURE 1-2: DISTRIBUTION OF CP IN WA (% OF ALL CP)
0
5
10
15
20
25
30
35
40
45
Ataxia Dyskinesia Hypotonia Hemiplegia Diplegia Quadriplegia
1970-74
1975-79
1980-84
1985-89
1990-94
1995-99
Source: WA CP Register (2006).
A study of the Victorian CP Register shows similar distributions to those reported above. Around 86% of children with CP experienced a spastic motor type, which was relatively evenly distributed between spastic hemiplegia, diplegia and quadriplegia. The other groups
The Economic Impact of Cerebral Palsy in Australia in 2007
4
were dyskinesia and mixed, which together accounted for 8% of cases, while the remaining motor types (ataxic, hypotonic) represented 5.6% of the total (Table 1–1) (Howard et al, 2005).
TABLE 1–1: DISTRIBUTION OF CP TYPES, CHILDREN BORN IN VICTORIA BETWEEN 1990 AND 1992 Number %
Spastic
Hemiplegia 98 30.3%
Diplegia 78 24.1%
Quadriplegia 103 31.9%
Total spastic 279 86.4%
Dyskinesia 5 1.5%
Mixed 21 6.5%
Ataxia 9 2.8%
Hypotonia 9 2.8%
Total cohort 323 100.0%
Source: Howard et al (2005).
1.3 SEVERITY OF CP
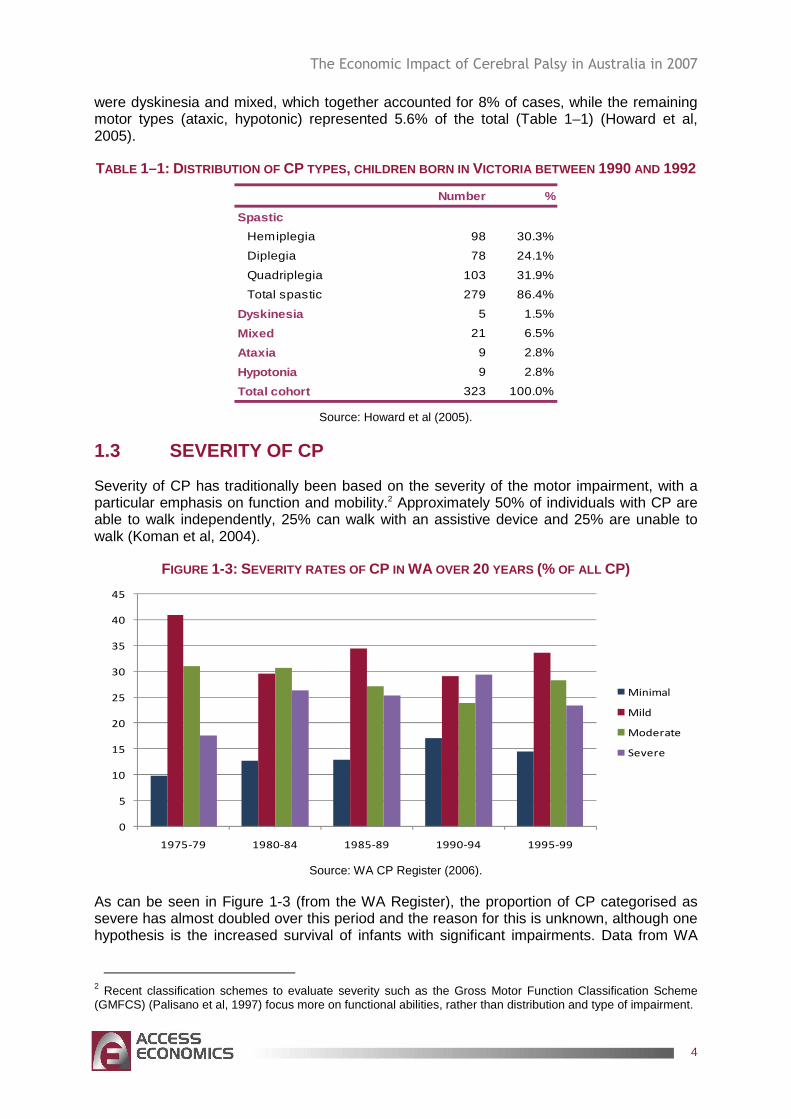
Severity of CP has traditionally been based on the severity of the motor impairment, with a particular emphasis on function and mobility.2 Approximately 50% of individuals with CP are able to walk independently, 25% can walk with an assistive device and 25% are unable to walk (Koman et al, 2004).
FIGURE 1-3: SEVERITY RATES OF CP IN WA OVER 20 YEARS (% OF ALL CP)
0
5
10
15
20
25
30
35
40
45
1975-79 1980-84 1985-89 1990-94 1995-99
Minimal
Mild
Moderate
Severe
Source: WA CP Register (2006).
As can be seen in Figure 1-3 (from the WA Register), the proportion of CP categorised as severe has almost doubled over this period and the reason for this is unknown, although one hypothesis is the increased survival of infants with significant impairments. Data from WA
2 Recent classification schemes to evaluate severity such as the Gross Motor Function Classification Scheme (GMFCS) (Palisano et al, 1997) focus more on functional abilities, rather than distribution and type of impairment.
The Economic Impact of Cerebral Palsy in Australia in 2007
5
and other registers throughout the world have found the increase in severity to be in the group born at term (37-42 weeks). The greater the severity of CP, the greater the risk of associated impairments.
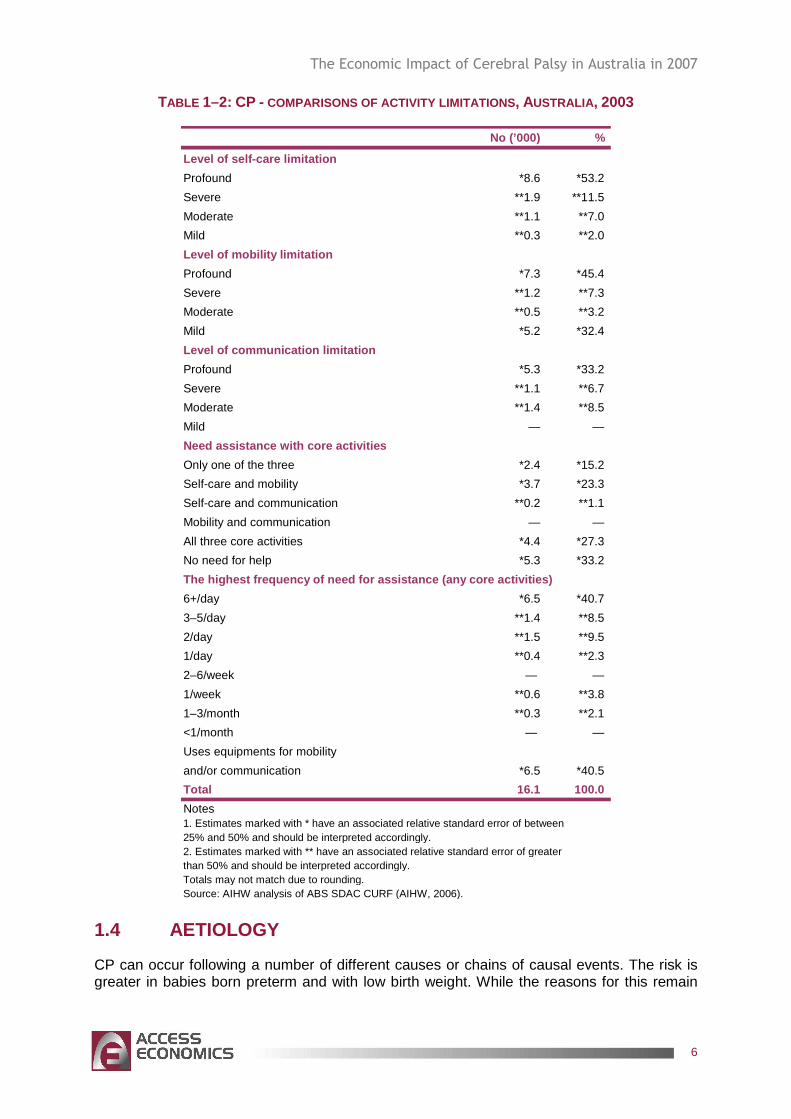
Similarly, AIHW (2005) reported that most people surveyed with CP had severe and profound levels of disability (Table 1–2). Corresponding to a high proportion of comorbidities and multiple disabilities, more than half of people with CP needed help with at least two core activities. For people with CP, more than half had a severe or profound limitation either with self-care or mobility or both, and about 40% had that limitation with communication. Over 40% of people with CP were also using aids or equipment for mobility or communication activities.
The Economic Impact of Cerebral Palsy in Australia in 2007
6
TABLE 1–2: CP - COMPARISONS OF ACTIVITY LIMITATIONS , AUSTRALIA , 2003
No (’000) %
Level of self-care limitation
Profound *8.6 *53.2
Severe **1.9 **11.5
Moderate **1.1 **7.0
Mild **0.3 **2.0
Level of mobility limitation
Profound *7.3 *45.4
Severe **1.2 **7.3
Moderate **0.5 **3.2
Mild *5.2 *32.4
Level of communication limitation
Profound *5.3 *33.2
Severe **1.1 **6.7
Moderate **1.4 **8.5
Mild — —
Need assistance with core activities
Only one of the three *2.4 *15.2
Self-care and mobility *3.7 *23.3
Self-care and communication **0.2 **1.1
Mobility and communication — —
All three core activities *4.4 *27.3
No need for help *5.3 *33.2
The highest frequency of need for assistance (any c ore activities)
6+/day *6.5 *40.7
3–5/day **1.4 **8.5
2/day **1.5 **9.5
1/day **0.4 **2.3
2–6/week — —
1/week **0.6 **3.8
1–3/month **0.3 **2.1
<1/month — —
Uses equipments for mobility
and/or communication *6.5 *40.5
Total 16.1 100.0
Notes1. Estimates marked with * have an associated relative standard error of between25% and 50% and should be interpreted accordingly.2. Estimates marked with ** have an associated relative standard error of greater than 50% and should be interpreted accordingly.Totals may not match due to rounding.Source: AIHW analysis of ABS SDAC CURF (AIHW, 2006).
1.4 AETIOLOGY
CP can occur following a number of different causes or chains of causal events. The risk is greater in babies born preterm and with low birth weight. While the reasons for this remain
The Economic Impact of Cerebral Palsy in Australia in 2007
7
unclear, CP may occur as a result of problems associated with preterm birth or may indicate an injury has occurred during the pregnancy that has caused the baby to be born early.
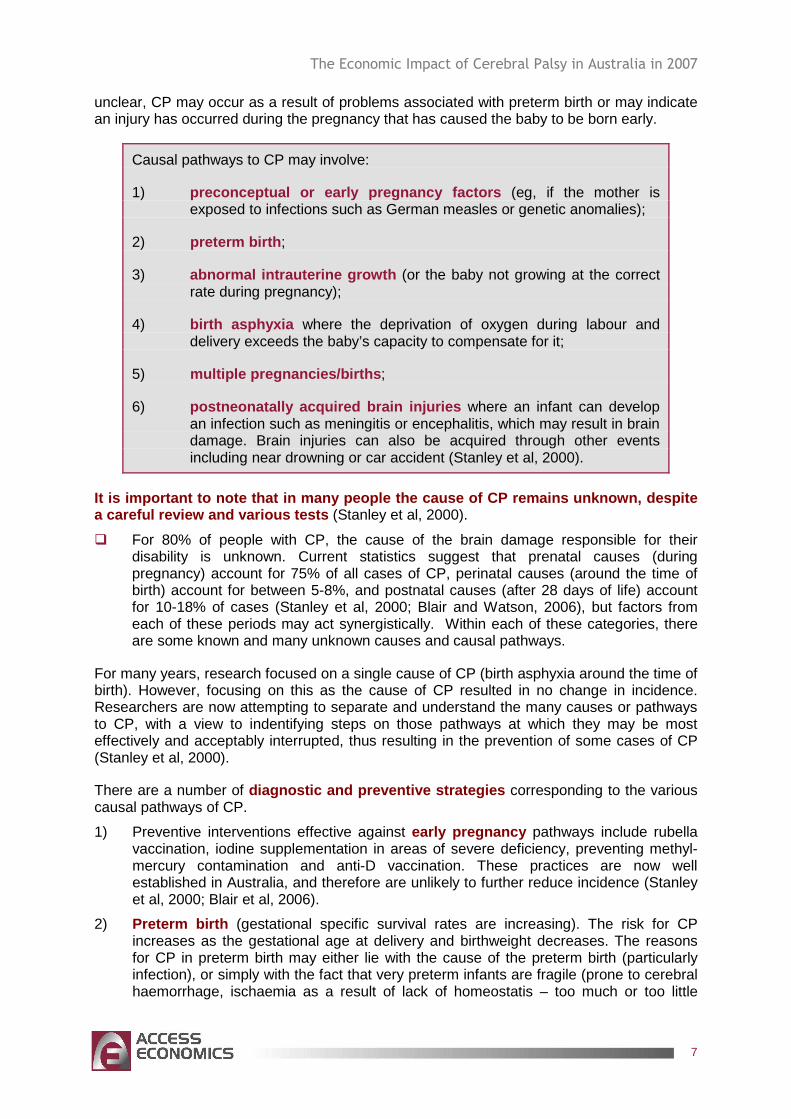
Causal pathways to CP may involve:
1) preconceptual or early pregnancy factors (eg, if the mother is exposed to infections such as German measles or genetic anomalies);
2) preterm birth ;
3) abnormal intrauterine growth (or the baby not growing at the correct rate during pregnancy);
4) birth asphyxia where the deprivation of oxygen during labour and delivery exceeds the baby’s capacity to compensate for it;
5) multiple pregnancies/births ;
6) postneonatally acquired brain injuries where an infant can develop an infection such as meningitis or encephalitis, which may result in brain damage. Brain injuries can also be acquired through other events including near drowning or car accident (Stanley et al, 2000).
It is important to note that in many people the cau se of CP remains unknown, despite a careful review and various tests (Stanley et al, 2000).
� For 80% of people with CP, the cause of the brain damage responsible for their disability is unknown. Current statistics suggest that prenatal causes (during pregnancy) account for 75% of all cases of CP, perinatal causes (around the time of birth) account for between 5-8%, and postnatal causes (after 28 days of life) account for 10-18% of cases (Stanley et al, 2000; Blair and Watson, 2006), but factors from each of these periods may act synergistically. Within each of these categories, there are some known and many unknown causes and causal pathways.
For many years, research focused on a single cause of CP (birth asphyxia around the time of birth). However, focusing on this as the cause of CP resulted in no change in incidence. Researchers are now attempting to separate and understand the many causes or pathways to CP, with a view to indentifying steps on those pathways at which they may be most effectively and acceptably interrupted, thus resulting in the prevention of some cases of CP (Stanley et al, 2000).
There are a number of diagnostic and preventive strategies corresponding to the various causal pathways of CP.
1) Preventive interventions effective against early pregnancy pathways include rubella vaccination, iodine supplementation in areas of severe deficiency, preventing methyl-mercury contamination and anti-D vaccination. These practices are now well established in Australia, and therefore are unlikely to further reduce incidence (Stanley et al, 2000; Blair et al, 2006).
2) Preterm birth (gestational specific survival rates are increasing). The risk for CP increases as the gestational age at delivery and birthweight decreases. The reasons for CP in preterm birth may either lie with the cause of the preterm birth (particularly infection), or simply with the fact that very preterm infants are fragile (prone to cerebral haemorrhage, ischaemia as a result of lack of homeostatis – too much or too little
The Economic Impact of Cerebral Palsy in Australia in 2007
8
oxygen, too much or too little carbon dioxide, too much vibration, and so on – or neonatally acquired infections). Anything that increases survival, increases the possibility that brain damage acquired for any reason will become apparent as CP. Postnatal steroids may damage the brain directly (directly increasing the CP rate) but may also increase survival (with the potential to increase CP rates indirectly). In contrast, lung surfactant does not damage the brain directly, but does increase survival.
3) For an infant to have intrauterine growth restriction (IUGR) some pathological factor must have restricted its growth. This is difficult to identify and growth restriction is usually inferred from the newborn being smaller than would be expected, given non-pathological determinants of newborn size.3
IUGR has been associated with an increase in the risk of CP, particularly for moderately preterm (32–36 weeks gestation) (Yanney and Marlow, 2004) and term infants (Jacobsson and Hagberg, 2004). Infants who have IUGR are four to six times more likely to develop CP than infants without IUGR (Stanley et al, 2000).
4) Birth asphyxia was for a long time the presumed cause of most CP. As a result, research focussed on the time of birth as the point at which to medically intervene to reduce incidence of CP. Electronic foetal monitoring was introduced and it was thought that by monitoring babies’ heart rates obstetricians would be able to intervene when the baby became distressed prior to the occurrence of irreversible brain damage. This did not occur; instead caesarean section rates rose and CP rates stayed the same (Nelson, 2003). Research now suggests that birth asphyxia accounts for 5-8% of those who have CP. For birth asphyxia to be diagnosed there must be evidence of hypoxia (lack of oxygen), a decompensatory response by the infant and neonatal encephalopathy with no other obvious cause (Stanley et al, 2000).
5) Multiple births account for approximately 5-10% of all cases of CP. The risk of CP increases with the number of babies in any one pregnancy. Twins are six times and triplets are 18 times more likely to develop CP than singletons. If a co-twin dies at any point throughout the pregnancy the surviving twin is 100 times more likely to have CP than a singleton. Multiple births tend to have a shorter gestation period, are more likely to have IUGR and are at risk of twin-twin transfusion syndrome. Multiple births are becoming an increasing issue as maternal age and use of assisted reproduction therapies (ARTs) increase4 (Nelson, 2003; Blair et al, 2006).
6) Postneonatally acquired CP is difficult to define, although it is usually described as occurring after 28 days of life in an infant who was thought to be neurologically normal. There must also be a definite event that can be linked to brain damage and considered to be the cause. In population research in developed countries the percentage of people with postneonatally acquired CP varies from approximately 5% in Scandinavian countries to 11-18% in Australia, the United Kingdom and the United States (Stanley et al, 2000).
There is still much to learn about the complex biological mechanisms and causal pathways to CP. Known pathways only account for a proportion of CP; there are many unknown causal pathways and steps on known pathways still to be identified. There might also be links between pathways.
3 It is important that gestational age is accurate so that ‘prematurity’ and ‘small for gestational age’ can be differentiated. With the increase of ultrasound dating, gestational age estimates are becoming more reliable (Stanley et al, 2000). 4 ARTs have a higher likelihood of multiple births and, after age 35, women are more likely to naturally conceive twins.
The Economic Impact of Cerebral Palsy in Australia in 2007
9
1.5 ASSOCIATED RISKS
The likelihood and severity of associated impairments increases with the severity of motor impairment. It has been reported that for individuals with a severe motor impairment up to 70% will have epilepsy, 50% will have a severe intellectual impairment, 55% will be non-verbal, 25% will be blind and 3% will be deaf (Stanley et al, 2000; Watson et al, 1999; Odding et al, 2006). Many will have a number of these impairments, and their presence complicates therapy, decreases health status and quality of life for the individual and their family, and increases costs for the family and society.
1.5.1 MUSCULOSKELETAL DEFORMITIES
A primary motor impairment, especially spasticity, may lead to secondary impairments of the musculoskeletal system. For example, a recent study using Victorian data has shown that the prevalence of hip migration is dependent on severity of functional impairment, and is found in about 90% of the most severely affected (GMFCS=V) reducing rapidly in frequency (to none in GMFCS=I). Other common musculoskeletal impairments found in this population include contractures, scoliosis and accompanying pain.
1.5.2 INTELLECTUAL IMPAIRMENT
Intellectual impairment is characterised by low general intellectual functioning (measured by IQ scores) combined with adaptive behaviour difficulties, with these problems manifesting before the age of 18 (AIHW, 2002). CP Registers usually accept that an IQ below 70 represents intellectual impairment, with IQ between 70-85 being classified as borderline. Practically, this means that people with an intellectual impairment have difficulty with activities such as reasoning, remembering, learning new skills, attending and organising information. This in turn makes communicating, learning self-care, social and personal safety skills difficult. The more severe the impairment, the less likely an individual will attain social outcomes such as securing a job, getting married, having children and participating in adult education (Hall et al, 2005).
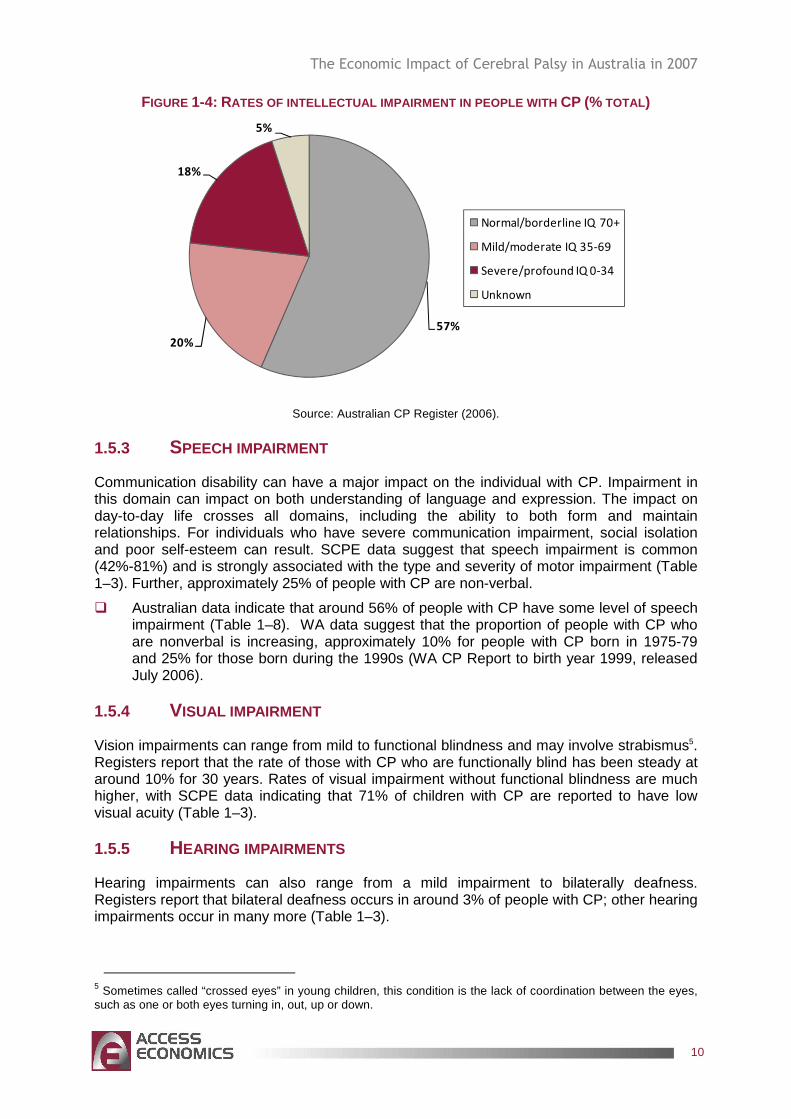
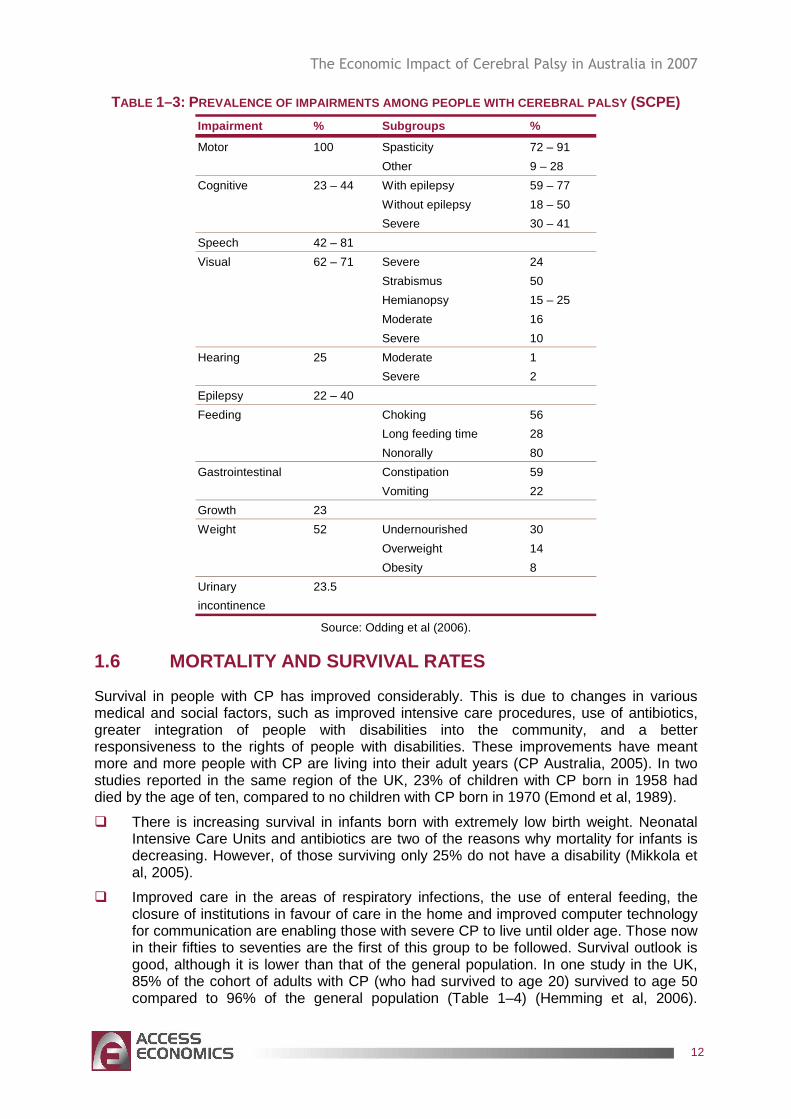
� SCPE data suggest that between 23% to 44% of people with CP have cognitive difficulties including mental retardation and behavioural problems such as hyperactivity (Table 1–3) (Odding et al, 2006). Australian data have similar findings which consistently put the number at around 40% (noting that Table 1–8 in section 1.7 shows 59%). Figure 1-4 presents the estimated distribution of intellectual impairment in people with CP in Australia.
The Economic Impact of Cerebral Palsy in Australia in 2007
10
FIGURE 1-4: RATES OF INTELLECTUAL IMPAIRMENT IN PEOPLE WITH CP (% TOTAL)
57%
20%
18%
5%
Normal/borderline IQ 70+
Mild/moderate IQ 35-69
Severe/profound IQ 0-34
Unknown
Source: Australian CP Register (2006).
1.5.3 SPEECH IMPAIRMENT
Communication disability can have a major impact on the individual with CP. Impairment in this domain can impact on both understanding of language and expression. The impact on day-to-day life crosses all domains, including the ability to both form and maintain relationships. For individuals who have severe communication impairment, social isolation and poor self-esteem can result. SCPE data suggest that speech impairment is common (42%-81%) and is strongly associated with the type and severity of motor impairment (Table 1–3). Further, approximately 25% of people with CP are non-verbal.
� Australian data indicate that around 56% of people with CP have some level of speech impairment (Table 1–8). WA data suggest that the proportion of people with CP who are nonverbal is increasing, approximately 10% for people with CP born in 1975-79 and 25% for those born during the 1990s (WA CP Report to birth year 1999, released July 2006).
1.5.4 VISUAL IMPAIRMENT
Vision impairments can range from mild to functional blindness and may involve strabismus5. Registers report that the rate of those with CP who are functionally blind has been steady at around 10% for 30 years. Rates of visual impairment without functional blindness are much higher, with SCPE data indicating that 71% of children with CP are reported to have low visual acuity (Table 1–3).
1.5.5 HEARING IMPAIRMENTS
Hearing impairments can also range from a mild impairment to bilaterally deafness. Registers report that bilateral deafness occurs in around 3% of people with CP; other hearing impairments occur in many more (Table 1–3).
5 Sometimes called “crossed eyes” in young children, this condition is the lack of coordination between the eyes, such as one or both eyes turning in, out, up or down.
The Economic Impact of Cerebral Palsy in Australia in 2007
11
1.5.6 FEEDING AND NUTRITION
A large proportion of people with CP have difficulties in relation to both feeding and nutrition. For many infants with CP, problems with sucking and swallowing in the first 12 months of life are common and often precede the diagnosis of CP. Some studies have noted rates as high as 56% of infants having sucking problems and 28% experiencing swallowing difficulties (Reilly et al, 1996). For children with CP who have dyphagia, silent aspiration occurs at a high frequency (estimated in some studies to be as much as 97%) making detection more difficult and increasing the likelihood of respiratory problems in this population (Rogers et al, 1994). Gastro-intestinal impairments (gastroesophageal reflux and constipation) are common for children and adults with CP and it is thought to effect an estimated 70% of this population (Sullivan et al, 2001; Reyes et al, 1993). Almost a quarter of CP children have stunted growth. Finally, bone mineral density in children and adolescents with spastic CP varies greatly but averages one standard deviation below the age-matched normal averages. Table 1–3 shows prevalence rates of feeding growth and weight problems.
1.5.7 UROGENITAL IMPAIRMENTS
Almost 25% of children and adolescents with CP have primary urinary incontinence (Table 1–3). Quadriplegia and low intellectual capacity are the most important determinants.
1.5.8 EPILEPSY
It has been reported that epilepsy occurs in up to 40% of people with CP (Table 1–3). For some, epilepsy may have resolved by the age of five years. Epilepsy is defined by recurrent seizures. Seizures are the result of a disruption to the normal electrical activity of the brain (Epilepsy Association of Australia, 2006). This can occur after a brain injury or brain malformation, which may also be the cause of CP. Although medications may control seizures relatively well in the general population, they may be more difficult to control in individuals with CP, thus complicating treatment. The added presence of epilepsy in people with CP has the potential to severely limit quality of life as well as being potentially life threatening.
The Economic Impact of Cerebral Palsy in Australia in 2007
12
TABLE 1–3: PREVALENCE OF IMPAIRMENTS AMONG PEOPLE WITH CEREBRAL PALSY (SCPE)
Impairment % Subgroups %
Motor 100 Spasticity 72 – 91
Other 9 – 28
Cognitive 23 – 44 With epilepsy 59 – 77
Without epilepsy 18 – 50
Severe 30 – 41
Speech 42 – 81
Visual 62 – 71 Severe 24
Strabismus 50
Hemianopsy 15 – 25
Moderate 16
Severe 10
Hearing 25 Moderate 1
Severe 2
Epilepsy 22 – 40
Feeding Choking 56
Long feeding time 28
Nonorally 80
Gastrointestinal Constipation 59
Vomiting 22
Growth 23
Weight 52 Undernourished 30
Overweight 14
Obesity 8
Urinary 23.5
incontinence
Source: Odding et al (2006).
1.6 MORTALITY AND SURVIVAL RATES
Survival in people with CP has improved considerably. This is due to changes in various medical and social factors, such as improved intensive care procedures, use of antibiotics, greater integration of people with disabilities into the community, and a better responsiveness to the rights of people with disabilities. These improvements have meant more and more people with CP are living into their adult years (CP Australia, 2005). In two studies reported in the same region of the UK, 23% of children with CP born in 1958 had died by the age of ten, compared to no children with CP born in 1970 (Emond et al, 1989).
� There is increasing survival in infants born with extremely low birth weight. Neonatal Intensive Care Units and antibiotics are two of the reasons why mortality for infants is decreasing. However, of those surviving only 25% do not have a disability (Mikkola et al, 2005).
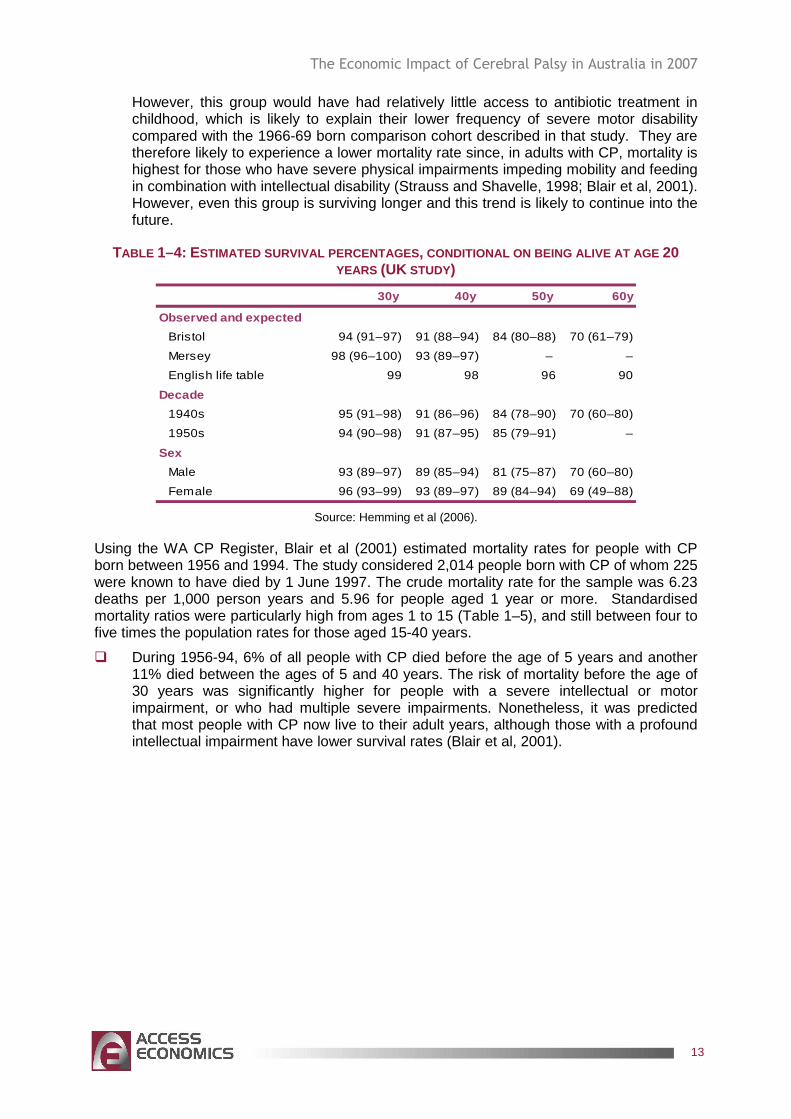
� Improved care in the areas of respiratory infections, the use of enteral feeding, the closure of institutions in favour of care in the home and improved computer technology for communication are enabling those with severe CP to live until older age. Those now in their fifties to seventies are the first of this group to be followed. Survival outlook is good, although it is lower than that of the general population. In one study in the UK, 85% of the cohort of adults with CP (who had survived to age 20) survived to age 50 compared to 96% of the general population (Table 1–4) (Hemming et al, 2006).
The Economic Impact of Cerebral Palsy in Australia in 2007
13
However, this group would have had relatively little access to antibiotic treatment in childhood, which is likely to explain their lower frequency of severe motor disability compared with the 1966-69 born comparison cohort described in that study. They are therefore likely to experience a lower mortality rate since, in adults with CP, mortality is highest for those who have severe physical impairments impeding mobility and feeding in combination with intellectual disability (Strauss and Shavelle, 1998; Blair et al, 2001). However, even this group is surviving longer and this trend is likely to continue into the future.
TABLE 1–4: ESTIMATED SURVIVAL PERCENTAGES , CONDITIONAL ON BEING ALIVE AT AGE 20 YEARS (UK STUDY)
30y 40y 50y 60y
Observed and expected
Bristol 94 (91–97) 91 (88–94) 84 (80–88) 70 (61–79)
Mersey 98 (96–100) 93 (89–97) – –
English life table 99 98 96 90
Decade
1940s 95 (91–98) 91 (86–96) 84 (78–90) 70 (60–80)
1950s 94 (90–98) 91 (87–95) 85 (79–91) –
Sex
Male 93 (89–97) 89 (85–94) 81 (75–87) 70 (60–80)
Female 96 (93–99) 93 (89–97) 89 (84–94) 69 (49–88)
Source: Hemming et al (2006).
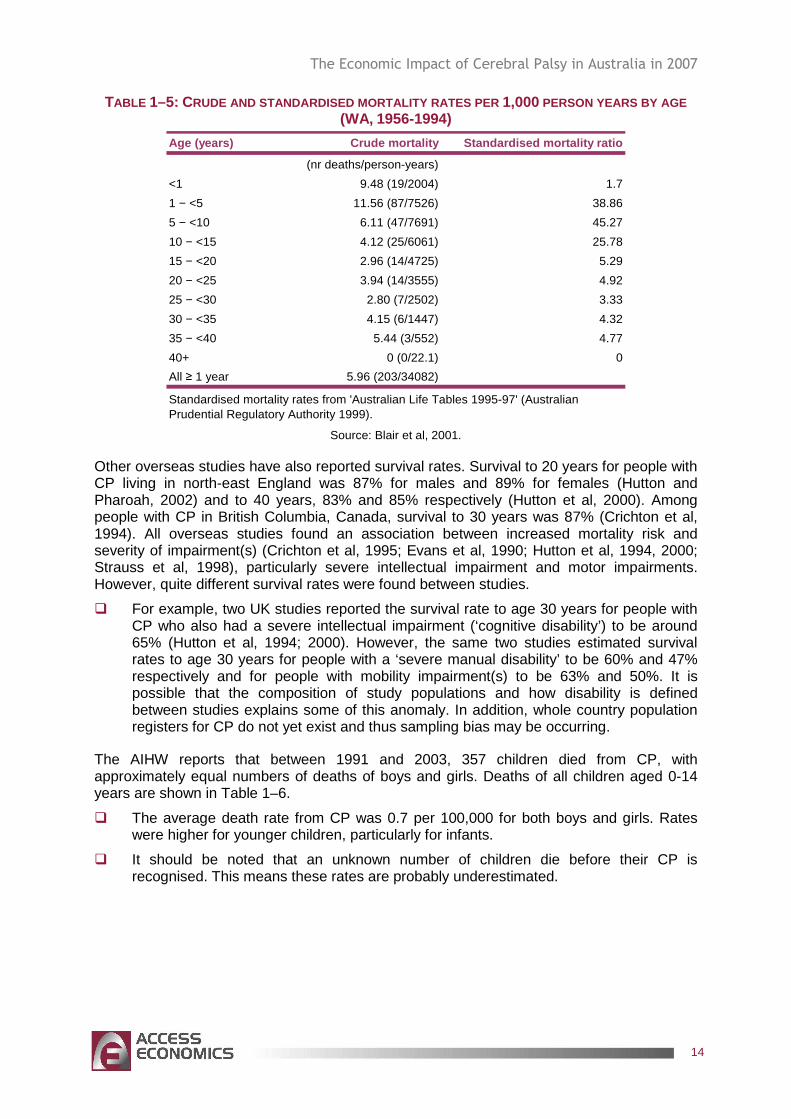
Using the WA CP Register, Blair et al (2001) estimated mortality rates for people with CP born between 1956 and 1994. The study considered 2,014 people born with CP of whom 225 were known to have died by 1 June 1997. The crude mortality rate for the sample was 6.23 deaths per 1,000 person years and 5.96 for people aged 1 year or more. Standardised mortality ratios were particularly high from ages 1 to 15 (Table 1–5), and still between four to five times the population rates for those aged 15-40 years.
� During 1956-94, 6% of all people with CP died before the age of 5 years and another 11% died between the ages of 5 and 40 years. The risk of mortality before the age of 30 years was significantly higher for people with a severe intellectual or motor impairment, or who had multiple severe impairments. Nonetheless, it was predicted that most people with CP now live to their adult years, although those with a profound intellectual impairment have lower survival rates (Blair et al, 2001).
The Economic Impact of Cerebral Palsy in Australia in 2007
14
TABLE 1–5: CRUDE AND STANDARDISED MORTALITY RATES PER 1,000 PERSON YEARS BY AGE (WA, 1956-1994)
Age (years) Crude mortality Standardised mortality ra tio
(nr deaths/person-years)
<1 9.48 (19/2004) 1.7
1 − <5 11.56 (87/7526) 38.86
5 − <10 6.11 (47/7691) 45.27
10 − <15 4.12 (25/6061) 25.78
15 − <20 2.96 (14/4725) 5.29
20 − <25 3.94 (14/3555) 4.92
25 − <30 2.80 (7/2502) 3.33
30 − <35 4.15 (6/1447) 4.32
35 − <40 5.44 (3/552) 4.77
40+ 0 (0/22.1) 0
All ≥ 1 year 5.96 (203/34082)
Standardised mortality rates from 'Australian Life Tables 1995-97' (Australian Prudential Regulatory Authority 1999).
Source: Blair et al, 2001.
Other overseas studies have also reported survival rates. Survival to 20 years for people with CP living in north-east England was 87% for males and 89% for females (Hutton and Pharoah, 2002) and to 40 years, 83% and 85% respectively (Hutton et al, 2000). Among people with CP in British Columbia, Canada, survival to 30 years was 87% (Crichton et al, 1994). All overseas studies found an association between increased mortality risk and severity of impairment(s) (Crichton et al, 1995; Evans et al, 1990; Hutton et al, 1994, 2000; Strauss et al, 1998), particularly severe intellectual impairment and motor impairments. However, quite different survival rates were found between studies.
� For example, two UK studies reported the survival rate to age 30 years for people with CP who also had a severe intellectual impairment (‘cognitive disability’) to be around 65% (Hutton et al, 1994; 2000). However, the same two studies estimated survival rates to age 30 years for people with a ‘severe manual disability’ to be 60% and 47% respectively and for people with mobility impairment(s) to be 63% and 50%. It is possible that the composition of study populations and how disability is defined between studies explains some of this anomaly. In addition, whole country population registers for CP do not yet exist and thus sampling bias may be occurring.
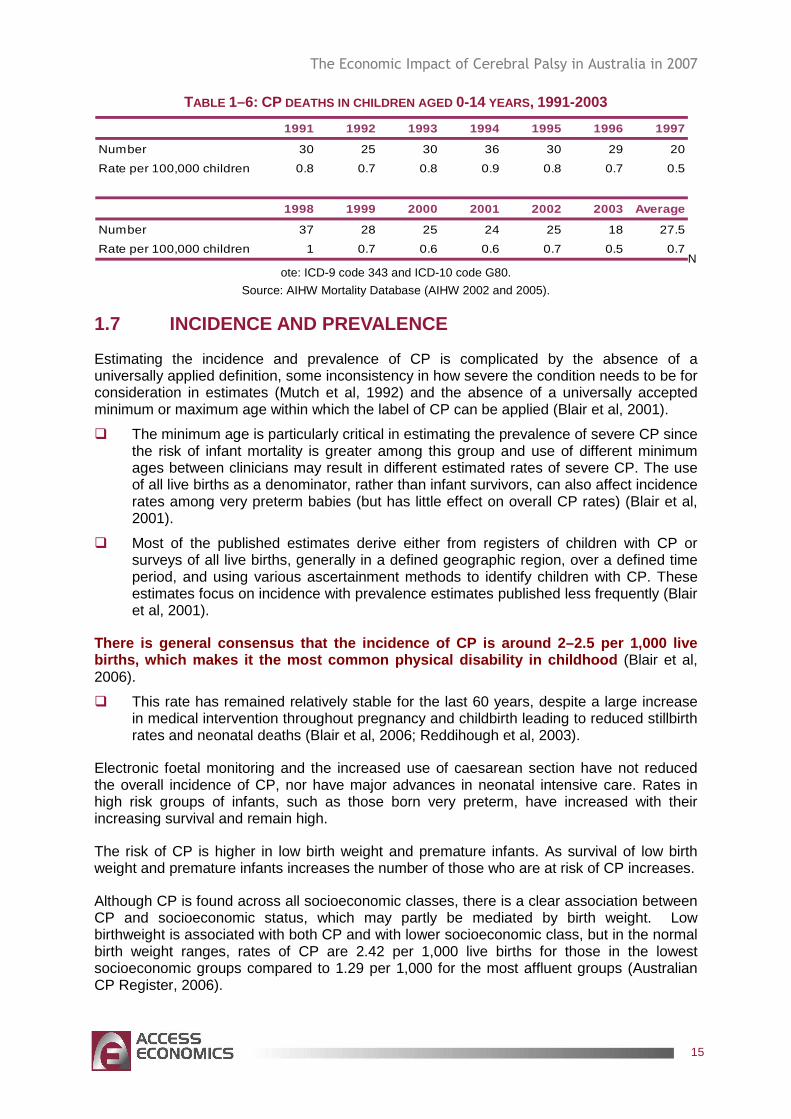
The AIHW reports that between 1991 and 2003, 357 children died from CP, with approximately equal numbers of deaths of boys and girls. Deaths of all children aged 0-14 years are shown in Table 1–6.
� The average death rate from CP was 0.7 per 100,000 for both boys and girls. Rates were higher for younger children, particularly for infants.
� It should be noted that an unknown number of children die before their CP is recognised. This means these rates are probably underestimated.
The Economic Impact of Cerebral Palsy in Australia in 2007
15
TABLE 1–6: CP DEATHS IN CHILDREN AGED 0-14 YEARS, 1991-2003 1991 1992 1993 1994 1995 1996 1997
Number 30 25 30 36 30 29 20
Rate per 100,000 children 0.8 0.7 0.8 0.9 0.8 0.7 0.5
1998 1999 2000 2001 2002 2003 Average
Number 37 28 25 24 25 18 27.5
Rate per 100,000 children 1 0.7 0.6 0.6 0.7 0.5 0.7N
ote: ICD-9 code 343 and ICD-10 code G80.
Source: AIHW Mortality Database (AIHW 2002 and 2005).
1.7 INCIDENCE AND PREVALENCE
Estimating the incidence and prevalence of CP is complicated by the absence of a universally applied definition, some inconsistency in how severe the condition needs to be for consideration in estimates (Mutch et al, 1992) and the absence of a universally accepted minimum or maximum age within which the label of CP can be applied (Blair et al, 2001).
� The minimum age is particularly critical in estimating the prevalence of severe CP since the risk of infant mortality is greater among this group and use of different minimum ages between clinicians may result in different estimated rates of severe CP. The use of all live births as a denominator, rather than infant survivors, can also affect incidence rates among very preterm babies (but has little effect on overall CP rates) (Blair et al, 2001).
� Most of the published estimates derive either from registers of children with CP or surveys of all live births, generally in a defined geographic region, over a defined time period, and using various ascertainment methods to identify children with CP. These estimates focus on incidence with prevalence estimates published less frequently (Blair et al, 2001).
There is general consensus that the incidence of CP is around 2–2.5 per 1,000 live births, which makes it the most common physical dis ability in childhood (Blair et al, 2006).
� This rate has remained relatively stable for the last 60 years, despite a large increase in medical intervention throughout pregnancy and childbirth leading to reduced stillbirth rates and neonatal deaths (Blair et al, 2006; Reddihough et al, 2003).
Electronic foetal monitoring and the increased use of caesarean section have not reduced the overall incidence of CP, nor have major advances in neonatal intensive care. Rates in high risk groups of infants, such as those born very preterm, have increased with their increasing survival and remain high.
The risk of CP is higher in low birth weight and premature infants. As survival of low birth weight and premature infants increases the number of those who are at risk of CP increases.
Although CP is found across all socioeconomic classes, there is a clear association between CP and socioeconomic status, which may partly be mediated by birth weight. Low birthweight is associated with both CP and with lower socioeconomic class, but in the normal birth weight ranges, rates of CP are 2.42 per 1,000 live births for those in the lowest socioeconomic groups compared to 1.29 per 1,000 for the most affluent groups (Australian CP Register, 2006).
The Economic Impact of Cerebral Palsy in Australia in 2007
16
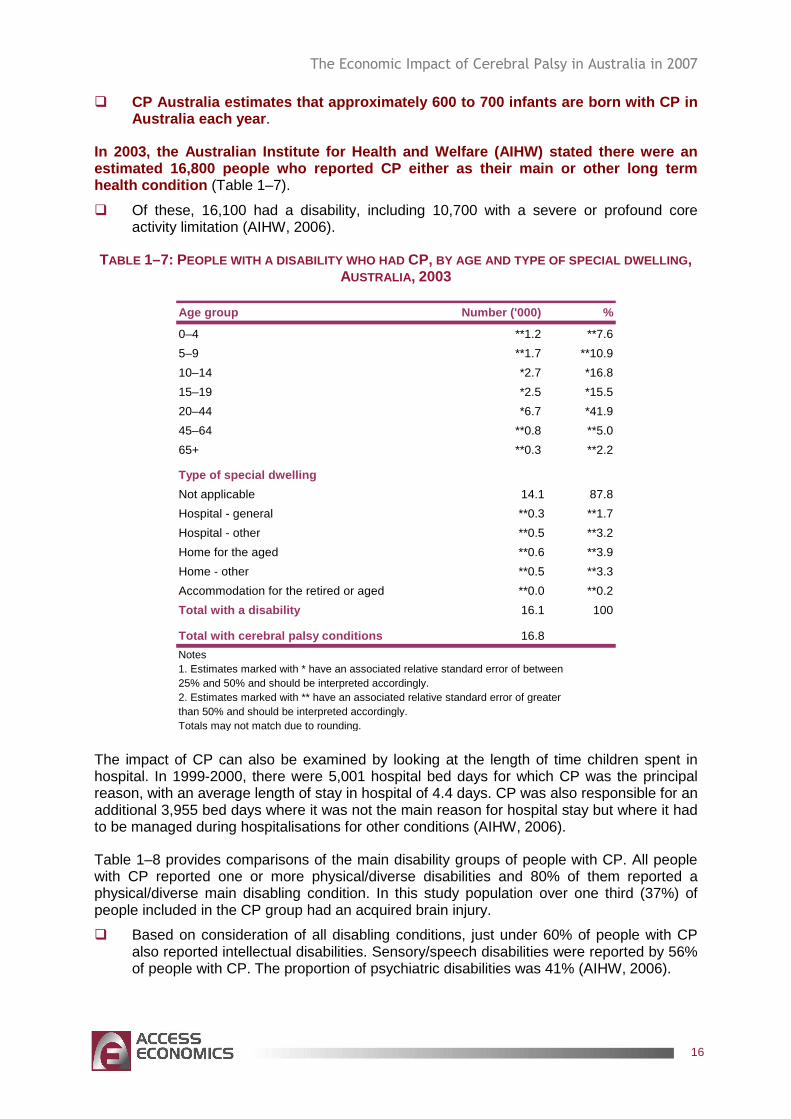
� CP Australia estimates that approximately 600 to 70 0 infants are born with CP in Australia each year .
In 2003, the Australian Institute for Health and We lfare (AIHW) stated there were an estimated 16,800 people who reported CP either as t heir main or other long term health condition (Table 1–7).
� Of these, 16,100 had a disability, including 10,700 with a severe or profound core activity limitation (AIHW, 2006).
TABLE 1–7: PEOPLE WITH A DISABILITY WHO HAD CP, BY AGE AND TYPE OF SPECIAL DWELLING , AUSTRALIA , 2003
Age group Number ('000) %
0–4 **1.2 **7.6
5–9 **1.7 **10.9
10–14 *2.7 *16.8
15–19 *2.5 *15.5
20–44 *6.7 *41.9
45–64 **0.8 **5.0
65+ **0.3 **2.2
Type of special dwelling
Not applicable 14.1 87.8
Hospital - general **0.3 **1.7
Hospital - other **0.5 **3.2
Home for the aged **0.6 **3.9
Home - other **0.5 **3.3
Accommodation for the retired or aged **0.0 **0.2
Total with a disability 16.1 100
Total with cerebral palsy conditions 16.8
Notes1. Estimates marked with * have an associated relative standard error of between25% and 50% and should be interpreted accordingly.2. Estimates marked with ** have an associated relative standard error of greater than 50% and should be interpreted accordingly.Totals may not match due to rounding.
The impact of CP can also be examined by looking at the length of time children spent in hospital. In 1999-2000, there were 5,001 hospital bed days for which CP was the principal reason, with an average length of stay in hospital of 4.4 days. CP was also responsible for an additional 3,955 bed days where it was not the main reason for hospital stay but where it had to be managed during hospitalisations for other conditions (AIHW, 2006).
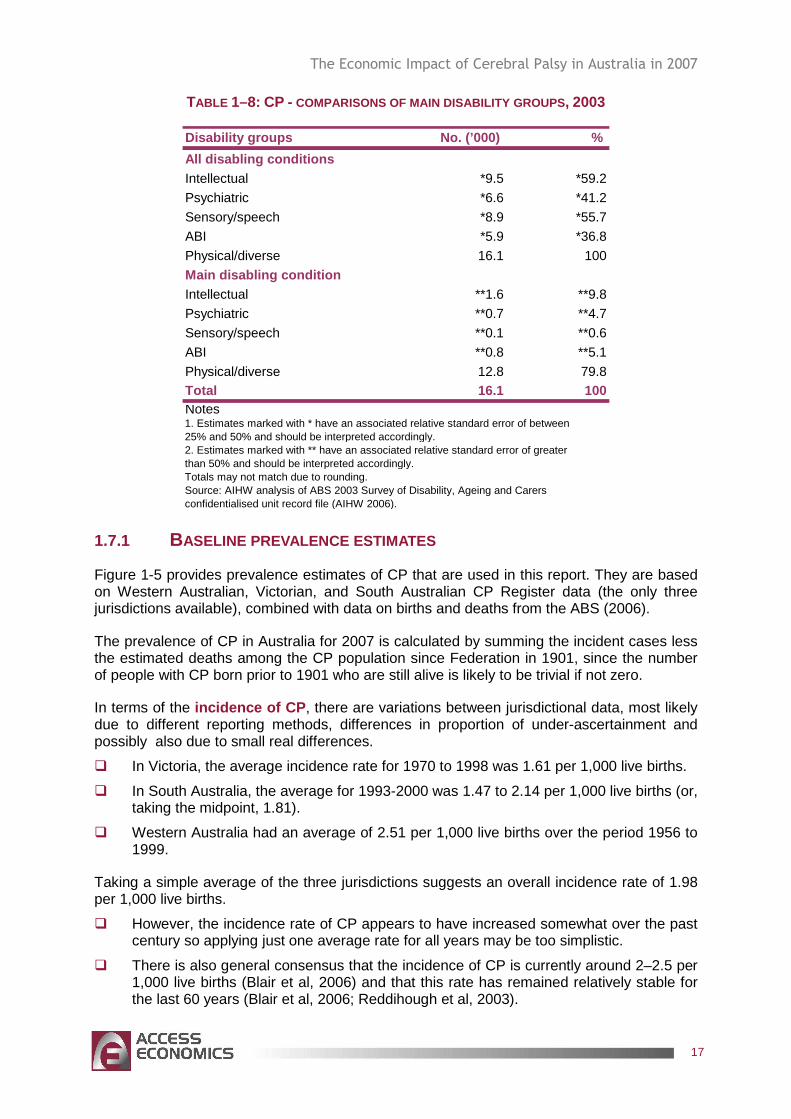
Table 1–8 provides comparisons of the main disability groups of people with CP. All people with CP reported one or more physical/diverse disabilities and 80% of them reported a physical/diverse main disabling condition. In this study population over one third (37%) of people included in the CP group had an acquired brain injury.
� Based on consideration of all disabling conditions, just under 60% of people with CP also reported intellectual disabilities. Sensory/speech disabilities were reported by 56% of people with CP. The proportion of psychiatric disabilities was 41% (AIHW, 2006).
The Economic Impact of Cerebral Palsy in Australia in 2007
17
TABLE 1–8: CP - COMPARISONS OF MAIN DISABILITY GROUPS , 2003
Disability groups No. (’000) %
All disabling conditionsIntellectual *9.5 *59.2
Psychiatric *6.6 *41.2
Sensory/speech *8.9 *55.7
ABI *5.9 *36.8
Physical/diverse 16.1 100
Main disabling conditionIntellectual **1.6 **9.8
Psychiatric **0.7 **4.7
Sensory/speech **0.1 **0.6
ABI **0.8 **5.1
Physical/diverse 12.8 79.8Total 16.1 100Notes1. Estimates marked with * have an associated relative standard error of between25% and 50% and should be interpreted accordingly.2. Estimates marked with ** have an associated relative standard error of greater than 50% and should be interpreted accordingly.Totals may not match due to rounding.Source: AIHW analysis of ABS 2003 Survey of Disability, Ageing and Carers confidentialised unit record file (AIHW 2006).
1.7.1 BASELINE PREVALENCE ESTIMATES
Figure 1-5 provides prevalence estimates of CP that are used in this report. They are based on Western Australian, Victorian, and South Australian CP Register data (the only three jurisdictions available), combined with data on births and deaths from the ABS (2006).
The prevalence of CP in Australia for 2007 is calculated by summing the incident cases less the estimated deaths among the CP population since Federation in 1901, since the number of people with CP born prior to 1901 who are still alive is likely to be trivial if not zero.
In terms of the incidence of CP , there are variations between jurisdictional data, most likely due to different reporting methods, differences in proportion of under-ascertainment and possibly also due to small real differences.
� In Victoria, the average incidence rate for 1970 to 1998 was 1.61 per 1,000 live births.
� In South Australia, the average for 1993-2000 was 1.47 to 2.14 per 1,000 live births (or, taking the midpoint, 1.81).
� Western Australia had an average of 2.51 per 1,000 live births over the period 1956 to 1999.
Taking a simple average of the three jurisdictions suggests an overall incidence rate of 1.98 per 1,000 live births.
� However, the incidence rate of CP appears to have increased somewhat over the past century so applying just one average rate for all years may be too simplistic.
� There is also general consensus that the incidence of CP is currently around 2–2.5 per 1,000 live births (Blair et al, 2006) and that this rate has remained relatively stable for the last 60 years (Blair et al, 2006; Reddihough et al, 2003).
The Economic Impact of Cerebral Palsy in Australia in 2007
18
To reflect both pieces of information, an incidence rate of 2.25 per 1,000 live births (the midpoint between 2.0 and 2.5) was used from 1945 onwards (the last 60 years) with the lower incidence rate of 1.98 applied from 1901 to 1944.
Mortality data for CP were derived from the WA data published in Blair et al (2001) as reported in Section 1.6 (crude mortality of 9.48 prior to age 1 and 5.96 after age 1), triangulated against overall population mortality obtained from ABS (2006).
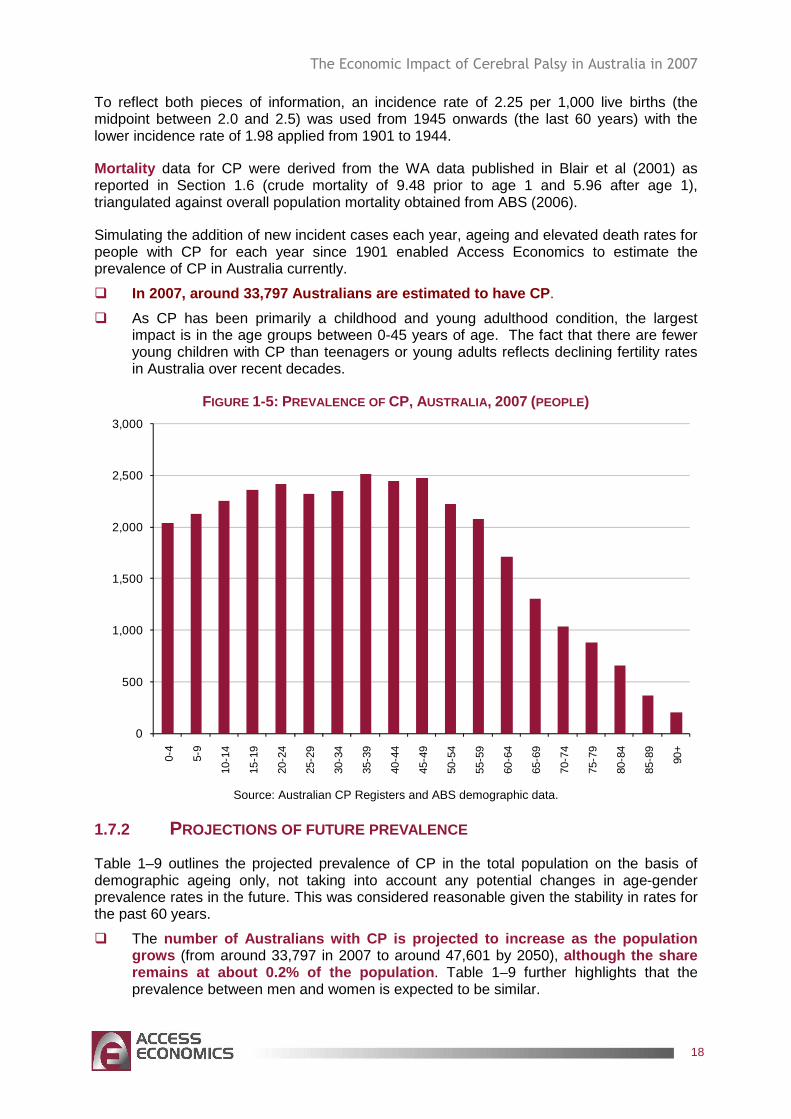
Simulating the addition of new incident cases each year, ageing and elevated death rates for people with CP for each year since 1901 enabled Access Economics to estimate the prevalence of CP in Australia currently.
� In 2007, around 33,797 Australians are estimated to have CP .
� As CP has been primarily a childhood and young adulthood condition, the largest impact is in the age groups between 0-45 years of age. The fact that there are fewer young children with CP than teenagers or young adults reflects declining fertility rates in Australia over recent decades.
FIGURE 1-5: PREVALENCE OF CP, AUSTRALIA , 2007 (PEOPLE)
0
500
1,000
1,500
2,000
2,500
3,000
0-4
5-9
10-1
4
15-1
9
20-2
4
25-2
9
30-3
4
35-3
9
40-4
4
45-4
9
50-5
4
55-5
9
60-6
4
65-6
9
70-7
4
75-7
9
80-8
4
85-8
9
90+
Source: Australian CP Registers and ABS demographic data.
1.7.2 PROJECTIONS OF FUTURE PREVALENCE
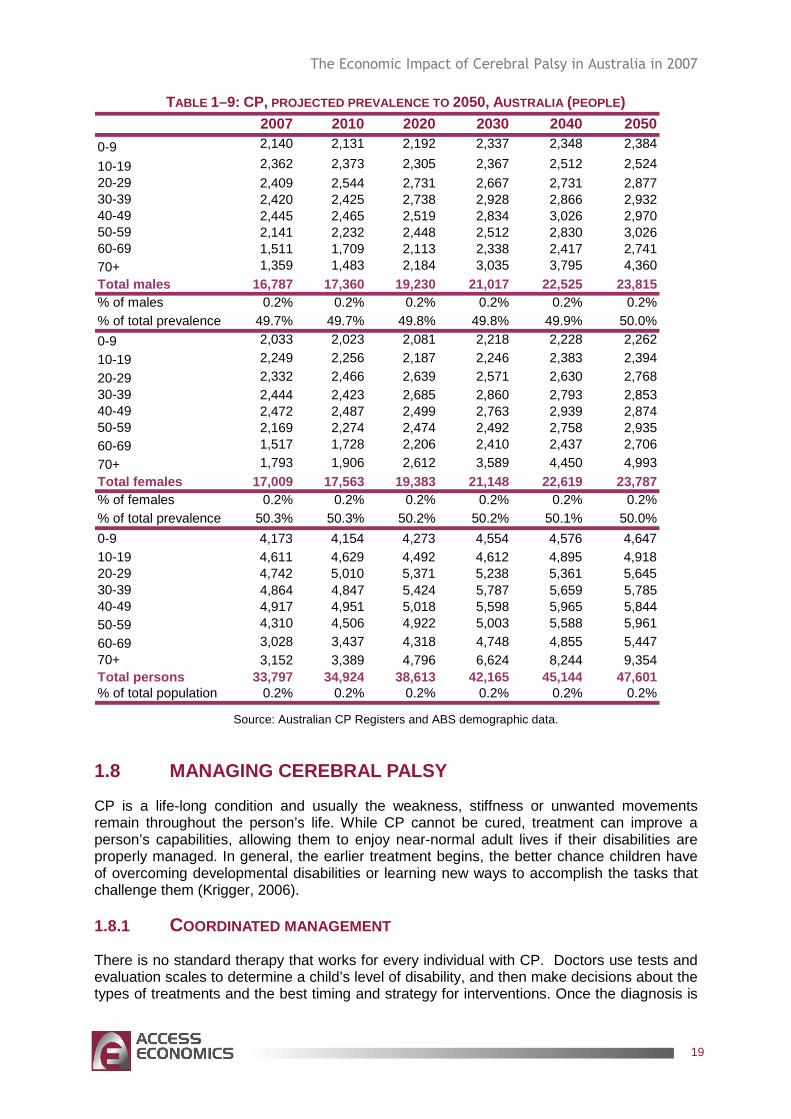
Table 1–9 outlines the projected prevalence of CP in the total population on the basis of demographic ageing only, not taking into account any potential changes in age-gender prevalence rates in the future. This was considered reasonable given the stability in rates for the past 60 years.
� The number of Australians with CP is projected to incre ase as the population grows (from around 33,797 in 2007 to around 47,601 by 2050), although the share remains at about 0.2% of the population . Table 1–9 further highlights that the prevalence between men and women is expected to be similar.
The Economic Impact of Cerebral Palsy in Australia in 2007
19
TABLE 1–9: CP, PROJECTED PREVALENCE TO 2050, AUSTRALIA (PEOPLE) 2007 2010 2020 2030 2040 2050
0-9 2,140 2,131 2,192 2,337 2,348 2,384
10-19 2,362 2,373 2,305 2,367 2,512 2,52420-29 2,409 2,544 2,731 2,667 2,731 2,87730-39 2,420 2,425 2,738 2,928 2,866 2,93240-49 2,445 2,465 2,519 2,834 3,026 2,97050-59 2,141 2,232 2,448 2,512 2,830 3,02660-69 1,511 1,709 2,113 2,338 2,417 2,74170+ 1,359 1,483 2,184 3,035 3,795 4,360Total males 16,787 17,360 19,230 21,017 22,525 23,815% of males 0.2% 0.2% 0.2% 0.2% 0.2% 0.2%% of total prevalence 49.7% 49.7% 49.8% 49.8% 49.9% 50.0%
0-9 2,033 2,023 2,081 2,218 2,228 2,262
10-19 2,249 2,256 2,187 2,246 2,383 2,394
20-29 2,332 2,466 2,639 2,571 2,630 2,76830-39 2,444 2,423 2,685 2,860 2,793 2,85340-49 2,472 2,487 2,499 2,763 2,939 2,87450-59 2,169 2,274 2,474 2,492 2,758 2,93560-69 1,517 1,728 2,206 2,410 2,437 2,706
70+ 1,793 1,906 2,612 3,589 4,450 4,993Total females 17,009 17,563 19,383 21,148 22,619 23,787% of females 0.2% 0.2% 0.2% 0.2% 0.2% 0.2%% of total prevalence 50.3% 50.3% 50.2% 50.2% 50.1% 50.0%
0-9 4,173 4,154 4,273 4,554 4,576 4,64710-19 4,611 4,629 4,492 4,612 4,895 4,91820-29 4,742 5,010 5,371 5,238 5,361 5,64530-39 4,864 4,847 5,424 5,787 5,659 5,78540-49 4,917 4,951 5,018 5,598 5,965 5,84450-59 4,310 4,506 4,922 5,003 5,588 5,961
60-69 3,028 3,437 4,318 4,748 4,855 5,44770+ 3,152 3,389 4,796 6,624 8,244 9,354Total persons 33,797 34,924 38,613 42,165 45,144 47,601% of total population 0.2% 0.2% 0.2% 0.2% 0.2% 0.2%
Source: Australian CP Registers and ABS demographic data.
1.8 MANAGING CEREBRAL PALSY
CP is a life-long condition and usually the weakness, stiffness or unwanted movements remain throughout the person’s life. While CP cannot be cured, treatment can improve a person’s capabilities, allowing them to enjoy near-normal adult lives if their disabilities are properly managed. In general, the earlier treatment begins, the better chance children have of overcoming developmental disabilities or learning new ways to accomplish the tasks that challenge them (Krigger, 2006).
1.8.1 COORDINATED MANAGEMENT
There is no standard therapy that works for every individual with CP. Doctors use tests and evaluation scales to determine a child’s level of disability, and then make decisions about the types of treatments and the best timing and strategy for interventions. Once the diagnosis is
The Economic Impact of Cerebral Palsy in Australia in 2007
20
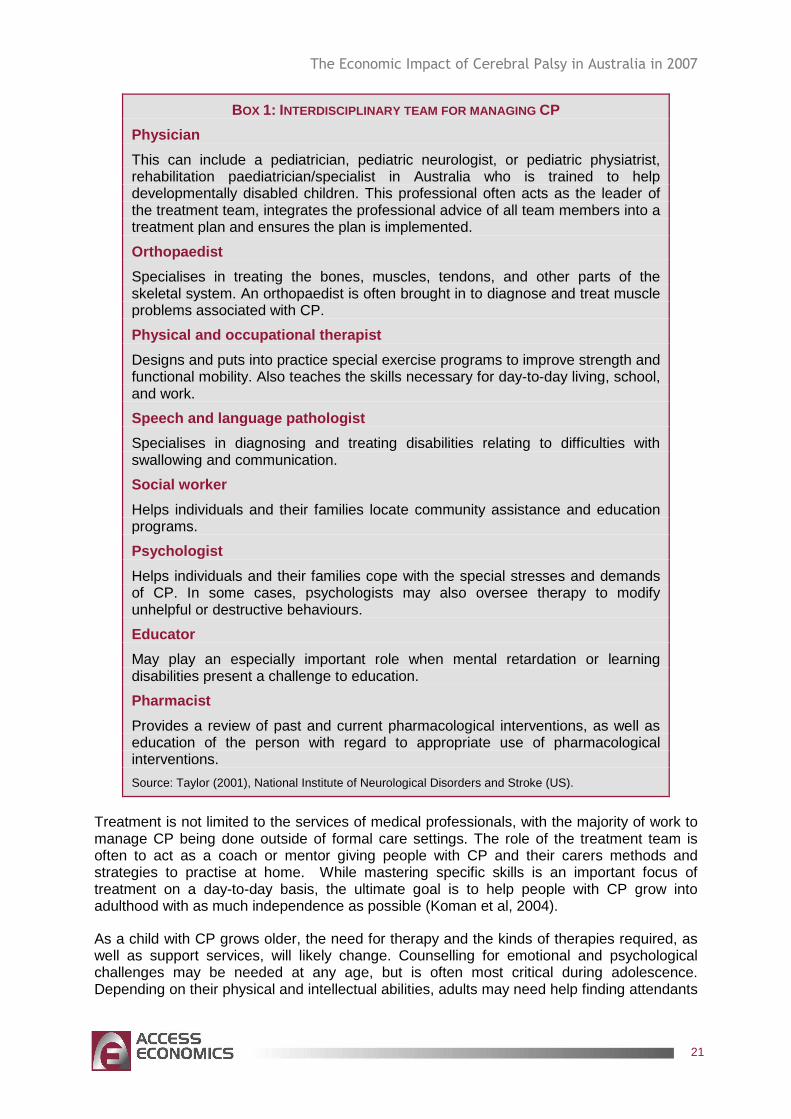
made, and the type of CP is determined, a team of health care professionals (see Box 1, based on the US) will work with a person and his or her carers to identify specific impairments and needs, and then develop an appropriate plan to tackle the core disabilities that affect the person’s quality of life.
A coordinated CP management plan will combine the services of various health professionals with experience in the following areas:
� physical therapy aimed at improving the functioning of muscles, walking and gait, and preventing deformities;
� occupational therapy to develop methods for participating in activities such as dressing, going to school, work and participating in day-to-day activities;
� speech therapy to address swallowing disorders, speech impediments and other obstacles to communication;
� counselling and behavioural therapy to address emotional and psychological needs;
� drugs to control seizures, relax muscle spasms and alleviate any pain;
� surgery to correct anatomical abnormalities or release tight muscles;
� braces and other orthotic devices to compensate for muscle imbalance, improve posture and walking and increase independent mobility;
� mechanical aids such as wheelchairs and rolling walkers for individuals who are not independently mobile; and
� communication aids such as computers, voice synthesizers, or symbol boards to allow severely impaired individuals to communicate with others (Taylor, 2001).
The Economic Impact of Cerebral Palsy in Australia in 2007
21
BOX 1: INTERDISCIPLINARY TEAM FOR MANAGING CP
Physician
This can include a pediatrician, pediatric neurologist, or pediatric physiatrist, rehabilitation paediatrician/specialist in Australia who is trained to help developmentally disabled children. This professional often acts as the leader of the treatment team, integrates the professional advice of all team members into a treatment plan and ensures the plan is implemented.
Orthopaedist
Specialises in treating the bones, muscles, tendons, and other parts of the skeletal system. An orthopaedist is often brought in to diagnose and treat muscle problems associated with CP.
Physical and occupational therapist
Designs and puts into practice special exercise programs to improve strength and functional mobility. Also teaches the skills necessary for day-to-day living, school, and work.
Speech and language pathologist
Specialises in diagnosing and treating disabilities relating to difficulties with swallowing and communication.
Social worker
Helps individuals and their families locate community assistance and education programs.
Psychologist
Helps individuals and their families cope with the special stresses and demands of CP. In some cases, psychologists may also oversee therapy to modify unhelpful or destructive behaviours.
Educator
May play an especially important role when mental retardation or learning disabilities present a challenge to education.
Pharmacist
Provides a review of past and current pharmacological interventions, as well as education of the person with regard to appropriate use of pharmacological interventions.
Source: Taylor (2001), National Institute of Neurological Disorders and Stroke (US).
Treatment is not limited to the services of medical professionals, with the majority of work to manage CP being done outside of formal care settings. The role of the treatment team is often to act as a coach or mentor giving people with CP and their carers methods and strategies to practise at home. While mastering specific skills is an important focus of treatment on a day-to-day basis, the ultimate goal is to help people with CP grow into adulthood with as much independence as possible (Koman et al, 2004).
As a child with CP grows older, the need for therapy and the kinds of therapies required, as well as support services, will likely change. Counselling for emotional and psychological challenges may be needed at any age, but is often most critical during adolescence. Depending on their physical and intellectual abilities, adults may need help finding attendants
The Economic Impact of Cerebral Palsy in Australia in 2007
22
to care for them, a place to live, a job, and a way to get to their place of employment (Krigger, 2006).
1.8.2 TREATMENTS
The specific treatments for CP depend on the patient’s condition and can range from physical therapy to the use of medication and surgery.
1.8.2.1 PHYSICAL THERAPY
Physical therapy, usually begun in the first few years of life or soon after the diagnosis is made, is one of the main treatments for CP. Physical therapy programs implement specific sets of exercises and activities to work toward two important goals: preventing weakening or deterioration in the muscles that are not being used (disuse atrophy), and keeping muscles from becoming fixed in a rigid, abnormal position (contracture).
Resistive exercise programs (also called strength training) and other types of exercise are often used to increase muscle performance, especially in children and adolescents with mild CP. Daily bouts of exercise keep muscles that are not normally used moving and active and less prone to wasting away. Exercise also reduces the risk of contracture, one of the most common and serious complications of CP.
Physical therapy, especially when combined with special braces (called orthotic devices) assists in preventing contracture by stretching spastic muscles. Muscle contracture can occur in children with CP as a result of muscles not growing fast enough to keep pace with their lengthening bones (Taylor, 2001).
1.8.2.2 OCCUPATIONAL AND RECREATIONAL THERAPY
This treatment focuses on optimising upper body function, improving posture, and making the most of a person’s mobility. An occupational therapist helps a child master the basic activities of daily living, such as eating, dressing, and using the bathroom alone. Fostering this kind of independence boosts self-reliance and self-esteem, and also helps reduce demands on caregivers.
Recreational therapies, such as therapeutic horseback riding (also called hippotherapy), are sometimes used with mildly impaired children to improve gross motor skills. Parents of children who participate in recreational therapies usually notice an improvement in their child’s speech, self-esteem, and emotional wellbeing (Krigger, 2006).
1.8.2.3 SPEECH AND LANGUAGE THERAPY
As mentioned above, around 25% of children with CP are unable to produce intelligible speech. They also experience challenges in other areas of communication, such as hand gestures and facial expressions, and they have difficulty participating in the basic give and take of a normal conversation. These challenges will last throughout their lives.
Speech and language therapists (also known as speech therapists or speech-language pathologists) observe, diagnose, and treat the communication disorders associated with CP. They use a program of exercises to teach children how to overcome specific communication difficulties.
Systems that support other forms of communications are also used. These systems are known as augmentative and alternative communication systems that can range from low/light
The Economic Impact of Cerebral Palsy in Australia in 2007
23
technology systems such as signing or use of alphabet charts to high technology systems such as speech generating devices (Krigger, 2006).
1.8.2.4 TREATMENTS FOR PROBLEMS WITH EATING AND DROOLING
Children with CP may have difficulty eating and drinking because they have little control over the muscles that move their mouth, jaw and tongue. They are also at risk for breathing food or fluid into the lungs. Some children develop gastro-oesophageal reflux disease (GORD) as a weak diaphragm cannot keep stomach acids from spilling into the oesophagus. The irritation of the acid can cause bleeding and pain and can lead to other serious complications such as Barrett’s Oesophagus and adeno-carcinoma of the oesophagus (Access Economics, 2007c).
Individuals with CP are also at risk for malnutrition, recurrent lung infections, and progressive lung disease. The individuals most at risk for these problems are those with spastic quadriplegia.
People with CP are initially assessed for their swallowing ability, which is usually done with a modified barium swallow study. Recommendations regarding diet modifications will be derived from the results of this study. In severe cases where swallowing problems are causing malnutrition, a doctor may recommend tube feeding, in which a tube delivers food and nutrients down the throat and into the stomach, or gastrostomy, in which a surgical opening allows a tube to be placed directly into the stomach (Taylor, 2001).
1.8.2.5 DRUG TREATMENTS
Oral medications such as diazepam, baclofen, dantrolene sodium, and tizanidine are usually used as the first line of treatment to relax stiff, contracted, or overactive muscles. These drugs are easy to use, except that dosages high enough to be effective often have side effects, among them drowsiness, upset stomach, high blood pressure, and possible liver damage with long term use. Oral medications are most appropriate for children who need only mild reduction in muscle tone or who have widespread spasticity.
The availability of new and more precise methods to deliver antispasmodic medications is moving treatment for spasticity toward chemodenervation, in which injected drugs are used to target and relax muscles (Taylor, 2001).
Botulinum toxin (BT-A) , injected intramuscularly, has become a standard treatment for overactive muscles in children with spastic movement disorders such as CP. BT-A relaxes contracted muscles by keeping nerve cells from over-activating muscle. A number of studies have shown that it reduces spasticity and increases the range of motion of the muscles it targets (Koman et al, 2004).
The relaxing effect of a BT-A injection lasts approximately three months. Undesirable side effects are mild and short-lived, consisting of pain upon injection and occasionally mild flu-like symptoms. BT-A injections are most effective when followed by a stretching program including physical therapy and splinting. BT-A injections work best for people with CP who have some control over their motor movements and have a limited number of muscles to treat, none of which is fixed or rigid (Taylor, 2001).
Intrathecal baclofen therapy uses an implantable pump to deliver baclofen, a muscle relaxant, into the fluid surrounding the spinal cord. Baclofen works by decreasing the excitability of nerve cells in the spinal cord, which then reduces muscle spasticity throughout the body. Because it is delivered directly into the nervous system, the intrathecal dose of
The Economic Impact of Cerebral Palsy in Australia in 2007
24
baclofen can be as low as one one-hundredth of the oral dose. Studies have shown it reduces spasticity and pain and improves sleep.
The baclofen pump carries a small but significant risk of serious complications if it fails or is programmed incorrectly, if the catheter becomes twisted or kinked, or if the insertion site becomes infected. Undesirable, but infrequent, side effects include overrelaxation of the muscles, sleepiness, headache, nausea, vomiting, dizziness, and constipation. As a muscle-relaxing therapy, the baclofen pump is most appropriate for individuals with chronic, severe stiffness or uncontrolled muscle movement throughout the body (Taylor, 2001).
1.8.2.6 SURGERY
Orthopedic surgery is designed to lengthen contracted muscles, balance joint forces, transfer motor power, fuse unstable joints, correct bone deformity to improve biomechanical alignment, reduce joint subluxation and dislocation to improve joint congruency, diminish painful spasticity, and maintain, restore, or stabilise spinal deformity (Koman et al, 2004).
It is often recommended when spasticity and stiffness are severe enough to make walking and moving about difficult or painful. For many people with CP, improving the appearance of how they walk – their gait – is also important. A more upright gait with smoother transitions and foot placements is the primary goal for many children and young adults (Taylor, 2001).
Selective dorsal rhizotomy is a surgical procedure recommended only for cases of severe spasticity when all of the more conservative treatments – physical therapy, oral medications, and intrathecal baclofen – have failed to reduce spasticity or cerebral palsy. In the procedure, a surgeon locates and selectively severs overactivated nerves at the base of the spinal column.
Because it reduces the amount of stimulation that reaches muscles via the nerves, selective dorsal rhizotomy is most commonly used to relax muscles and decrease cerebral palsy in one or both of the lower or upper limbs. It is also sometimes used to correct an overactive bladder. Potential side effects include sensory loss, numbness, or uncomfortable sensations in limb areas once supplied by the severed nerve (Krigger, 2006).
1.8.2.7 ORTHOTIC DEVICES
Orthotic devices – such as braces and splints – use external force to correct muscle abnormalities. The technology of orthotics has advanced over the past 30 years from metal rods that hooked up to bulky orthopaedic shoes, to appliances that are individually molded from high-temperature plastics for a precise fit. Ankle-foot orthoses are frequently prescribed for children with spastic diplegia to prevent muscle contracture and to improve gait. Splints are also used to correct spasticity in the hand muscles (Taylor, 2001).
1.8.2.8 OTHER ASSISTIVE TECHNOLOGY
Devices that help individuals move about more easily and communicate successfully at home, at school, or in the workplace can help a child or adult with CP overcome physical and communication limitations. There are a number of devices that help individuals stand straight and walk, such as postural support or seating systems, open-front walkers, quadrapedal canes (lightweight metal canes with four feet) and gait poles. Electric wheelchairs let more severely impaired adults and children move about successfully (Taylor, 2001).
The Economic Impact of Cerebral Palsy in Australia in 2007
25
2. HEALTH COSTS
Direct financial costs to the Australian health system comprise the costs of running hospitals and nursing homes (buildings, care, consumables), GP and specialist services reimbursed through Medicare and private funds, the cost of prescribed and over-the-counter pharmaceuticals (Pharmaceutical Benefits Scheme and private), allied health services, research and ‘other’ direct costs (such as health administration).
There are essentially two ways of estimating cost elements for each group.
� Top-down: Data may be able to provide the total costs of a program element and then allocate those costs by disease. The AIHW estimates health system expenditure by disease or disease group, eg nervous system disorders of which CP is a component.
� Bottom-up: Data may be available for the number of people with a disease who experience a cost impact from the disease (‘n’) and the average cost impact. The product is the total cost eg, the number of medical specialist visits to treat CP in a year multiplied by the average cost of a specialist visit.6
It is generally more desirable to use top-down national datasets in order to derive national cost estimates, rather than extrapolate bottom-up data from smaller partial datasets.
However, using top-down estimates can be problematic for CP as data are very limited. Instead, available data on CP from the AIHW has been combined with bottom-up data sourced from the Australian General Practice Statistics and Classification Centre (AGPSCC) and its Bettering the Evaluation and Care of Health (BEACH) dataset.
Available Australian data on diseases and injuries and their associated costs are subject to considerable uncertainties, with a number of these detailed below.
���� Surveys:
���� lack of consensus about definitions;
���� variations in survey methodology eg, clinic or population focused;
���� gaps and consistency in data collections eg, different timeframes;
���� reluctance to report disease;
���� limited population size and representativeness of the sample; and
���� survey limitations eg, the wording of questions may affect the answers given.
���� Costs:
���� patchy administrative information on what proportion of costs are attributable to different types of diseases;
���� focus on other aspects of diseases (such as treatment outcomes), rather than on costs;
���� comorbidities: there may be another disease that is responsible for part (or all) of the costs (such as the presence of another chronic disease having a large impact on costs);
6 The bottom-up approach is also used to estimate some indirect cost items such as productivity losses from absenteeism, where the average wage rate is multiplied by the average number of days off due to CP for the number of people to whom this applies. The top-down approach can often be used for program payments such as Centrelink payments, which are allocable by disease.
The Economic Impact of Cerebral Palsy in Australia in 2007
26
���� two-way correlation or causation between variables eg, low socioeconomic status (SES) predisposing to illness and illness in turn also reducing income/SES;
���� factor X: there may be another underlying cause of both a disease and the resulting cost, which makes them look like one is caused by the other (for example, cigarette smoking resulting in both asthma and greater medical visits).
These issues are addressed by controlling for other factors where possible.
Section 1.7.1 developed a total prevalence estimate for CP, which was then applied to changing demographic cohorts to project prevalence in future years. A similar approach is adopted in this chapter for health costs. Total health costs for CP are developed and then divided by the CP prevalence rate to find the average health expenditure per person with CP. Demographic changes are then applied to this per capita rate to find total expenditure in 2007.
2.1 BEACH DATA FOR CP
Apart from hospital inpatient costs, health expenditure estimates for CP had to be derived bottom-up from BEACH data (AGPSCC, 2007) – Cerebral Palsy managed in General Practice: April 2000-March 2007 – which surveyed 151 people over seven years who visited their GP with CP as the main reason for the visit.
A total of 151 visits over seven years translates to an average of 22 GP visits for CP (as the main reason) per year in the survey. Given the total BEACH sample size was 91,805 visits in 2007 (for all conditions) and Australians made 102.8 million visits to their GP that year, applying the population to sample size relativity to surveyed CP visits results in a total estimate for all of Australia of 24,155 encounters for CP per year. This means that each of the estimated 33,797 people with CP in 2007 would have had an average of 0.7 GP encounters with CP per year. However, at each visit, although CP was the main reason for the visit, an average of 1.06 other (non-CP) problems were also dealt with. This means that effectively only 48.6% of the cost of each encounter can be allocated to the cost of CP.
All Medicare Benefits Schedule (MBS) fees and Australian Medical Association (AMA) fees in the estimates below were current as at November 2007.
2.1.1 GP COSTS
Standard GP consultation costs
While people with CP often had non-CP issues that they wanted treated at the same visit, according to the BEACH data none wanted treatment for more than one CP-related problem in the same visit. Although the same person may have two CP-related conditions, to treat these conditions would usually require two visits by this person. As the number of CP problems treated was only one per encounter, costs per visit are treated as synonymous with costs per person. Average costs per person are then multiplied by total cases in 2007 to derive total medical and pharmaceutical expenditure.
The BEACH report does not provide data on the length of consultations, but as the overwhelming majority of total Medicare claims are for Level B consultations (less than
The Economic Impact of Cerebral Palsy in Australia in 2007
27
20 minutes), this is assumed to be the case for CP too. Taking into account bulk-billing rates and AMA recommended fees7, the average cost per encounter is $38.60 (Table 2–1).
TABLE 2–1: CP GP COSTS
GP Costs Cost per encounter
Bulk billing rate (%)
Standard Consultation of 20 minutes (MBS item 23) $32.80 77 Private fee $58.00 23 Average cost $38.60
Source: Medical Benefits Schedule Online: http://www.health.gov.au/internet/mbsonline/publishing.nsf/Content/Medicare-Benefits-Schedule-MBS-1.
The estimated 24,155 GP encounters for CP in 2007 c ost $452,654 (after allocating GP fees between CP and other problems dealt with at the same encounter).
Longer consultation costs
The most common therapy category, reported by BEACH for GPs consulting people with CP, was ‘at least one other treatment’, which refers to clinical and procedural treatments provided by the GP. In total there were 49 of these treatments (representing 26% of encounters). Nine times out of ten, where the GP provided further treatment, this was clinical in the form of advice, education and counselling, and the treatments and medications necessary to ameliorate it. Where GPs specify that they have provided ‘at least one other (clinical) treatment’, these are modelled as MBS Level C consultations, for which the recommended public and AMA fees are $62.30 and $106.00 respectively. Using the same bulk-billing rates as for general consultations, this yields an average fee of $72.35. However, as BEACH only provides point-in-time snapshots rather than patient histories, these encounters are modelled as being the same ones already costed in Table 2–1 above, so only the difference between a Level B and Level C consultation ($33.76) is used in these cases.
It is estimated that, of the 24,155 GP encounters, 5,599 were longer (Lev el C) consultations to deal with more complicated CP cases. To account for other conditions managed at the same encounter, as with short consultations, only 48.6% of the cost of these has been attributed to CP. Since the cost of the short consultation (Level B) has already been included, these long consultations add a further $115,355 towards the total GP cost of CP.
Procedures provided by GPs
There were also five procedural treatments provided by GPs (3% of all CP encounters):
� local injection/infiltration; and
� physical medicine/rehabilitation.
The model uses a GP rehabilitation consultation (MBS item 880) - as a cost proxy for these procedural treatments. The MBS fee for this service is $43.90 and the AMA fee $66.00, which on a bulk-billing rate of 77% yields an average fee of $48.98.
7 All bulk-billing percentages are from Medicare Online Statistics for the last quarter covered by the BEACH report (March 2006) - http://www.health.gov.au/internet/wcms/publishing.nsf/Content/medstat-mar06-tables-b.
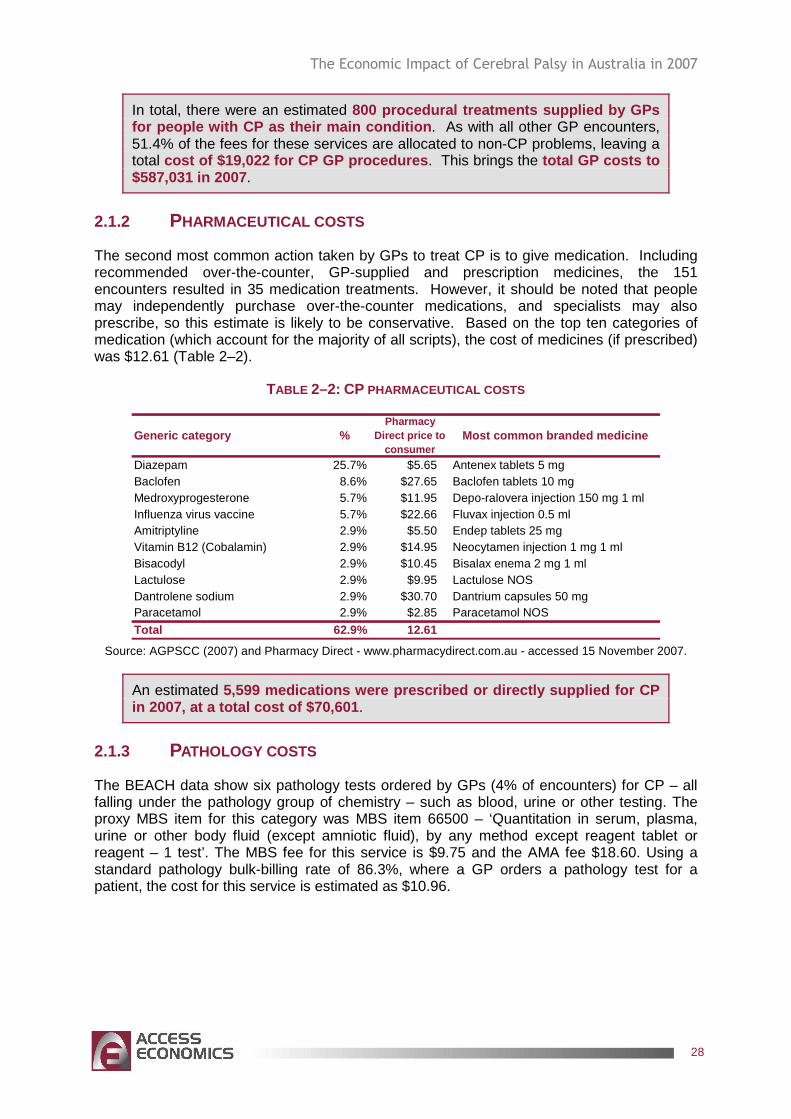
The Economic Impact of Cerebral Palsy in Australia in 2007
28
In total, there were an estimated 800 procedural treatments supplied by GPs for people with CP as their main condition . As with all other GP encounters, 51.4% of the fees for these services are allocated to non-CP problems, leaving a total cost of $19,022 for CP GP procedures . This brings the total GP costs to $587,031 in 2007 .
2.1.2 PHARMACEUTICAL COSTS
The second most common action taken by GPs to treat CP is to give medication. Including recommended over-the-counter, GP-supplied and prescription medicines, the 151 encounters resulted in 35 medication treatments. However, it should be noted that people may independently purchase over-the-counter medications, and specialists may also prescribe, so this estimate is likely to be conservative. Based on the top ten categories of medication (which account for the majority of all scripts), the cost of medicines (if prescribed) was $12.61 (Table 2–2).
TABLE 2–2: CP PHARMACEUTICAL COSTS
Generic category %Pharmacy
Direct price to consumer
Most common branded medicine
Diazepam 25.7% $5.65 Antenex tablets 5 mgBaclofen 8.6% $27.65 Baclofen tablets 10 mgMedroxyprogesterone 5.7% $11.95 Depo-ralovera injection 150 mg 1 mlInfluenza virus vaccine 5.7% $22.66 Fluvax injection 0.5 mlAmitriptyline 2.9% $5.50 Endep tablets 25 mg Vitamin B12 (Cobalamin) 2.9% $14.95 Neocytamen injection 1 mg 1 mlBisacodyl 2.9% $10.45 Bisalax enema 2 mg 1 mlLactulose 2.9% $9.95 Lactulose NOSDantrolene sodium 2.9% $30.70 Dantrium capsules 50 mgParacetamol 2.9% $2.85 Paracetamol NOS
Total 62.9% 12.61 Source: AGPSCC (2007) and Pharmacy Direct - www.pharmacydirect.com.au - accessed 15 November 2007.
An estimated 5,599 medications were prescribed or directly suppl ied for CP in 2007, at a total cost of $70,601 .
2.1.3 PATHOLOGY COSTS
The BEACH data show six pathology tests ordered by GPs (4% of encounters) for CP – all falling under the pathology group of chemistry – such as blood, urine or other testing. The proxy MBS item for this category was MBS item 66500 – ‘Quantitation in serum, plasma, urine or other body fluid (except amniotic fluid), by any method except reagent tablet or reagent – 1 test’. The MBS fee for this service is $9.75 and the AMA fee $18.60. Using a standard pathology bulk-billing rate of 86.3%, where a GP orders a pathology test for a patient, the cost for this service is estimated as $10.96.
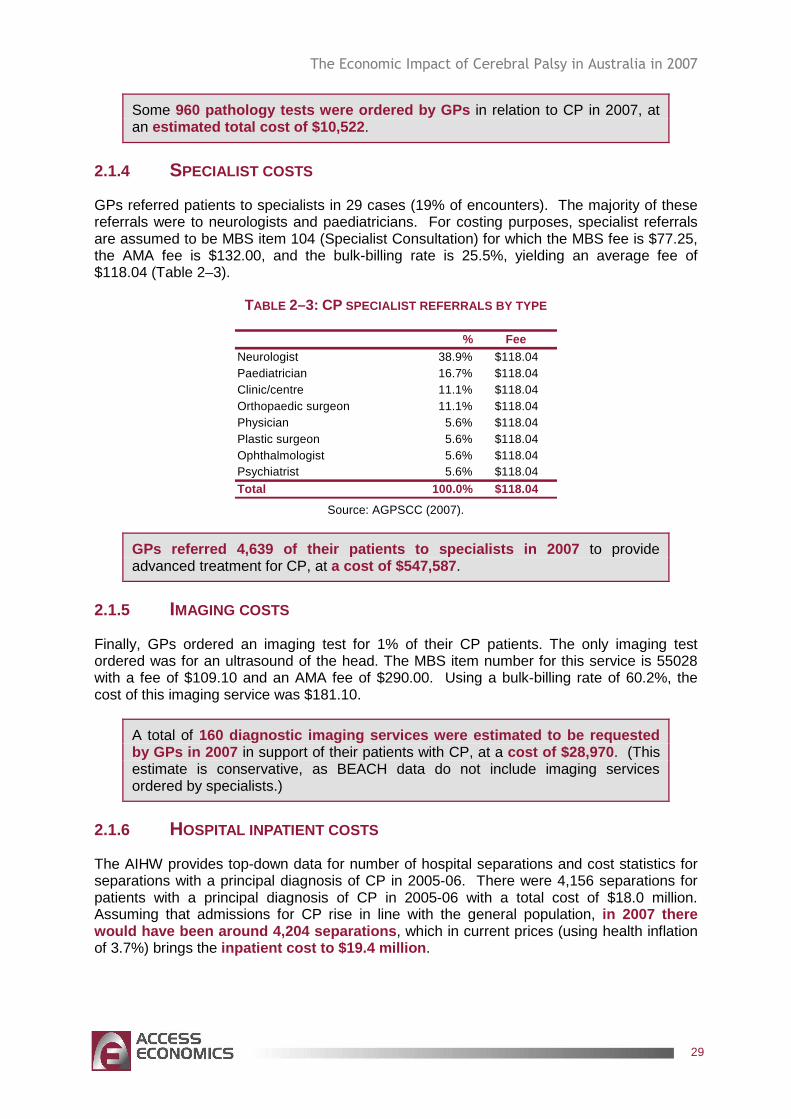
The Economic Impact of Cerebral Palsy in Australia in 2007
29
Some 960 pathology tests were ordered by GPs in relation to CP in 2007, at an estimated total cost of $10,522 .
2.1.4 SPECIALIST COSTS
GPs referred patients to specialists in 29 cases (19% of encounters). The majority of these referrals were to neurologists and paediatricians. For costing purposes, specialist referrals are assumed to be MBS item 104 (Specialist Consultation) for which the MBS fee is $77.25, the AMA fee is $132.00, and the bulk-billing rate is 25.5%, yielding an average fee of $118.04 (Table 2–3).
TABLE 2–3: CP SPECIALIST REFERRALS BY TYPE
% FeeNeurologist 38.9% $118.04Paediatrician 16.7% $118.04Clinic/centre 11.1% $118.04Orthopaedic surgeon 11.1% $118.04Physician 5.6% $118.04Plastic surgeon 5.6% $118.04Ophthalmologist 5.6% $118.04Psychiatrist 5.6% $118.04
Total 100.0% $118.04 Source: AGPSCC (2007).
GPs referred 4,639 of their patients to specialists in 2007 to provide advanced treatment for CP, at a cost of $547,587 .
2.1.5 IMAGING COSTS
Finally, GPs ordered an imaging test for 1% of their CP patients. The only imaging test ordered was for an ultrasound of the head. The MBS item number for this service is 55028 with a fee of $109.10 and an AMA fee of $290.00. Using a bulk-billing rate of 60.2%, the cost of this imaging service was $181.10.
A total of 160 diagnostic imaging services were estimated to b e requested by GPs in 2007 in support of their patients with CP, at a cost of $28,970 . (This estimate is conservative, as BEACH data do not include imaging services ordered by specialists.)
2.1.6 HOSPITAL INPATIENT COSTS
The AIHW provides top-down data for number of hospital separations and cost statistics for separations with a principal diagnosis of CP in 2005-06. There were 4,156 separations for patients with a principal diagnosis of CP in 2005-06 with a total cost of $18.0 million. Assuming that admissions for CP rise in line with the general population, in 2007 there would have been around 4,204 separations , which in current prices (using health inflation of 3.7%) brings the inpatient cost to $19.4 million .
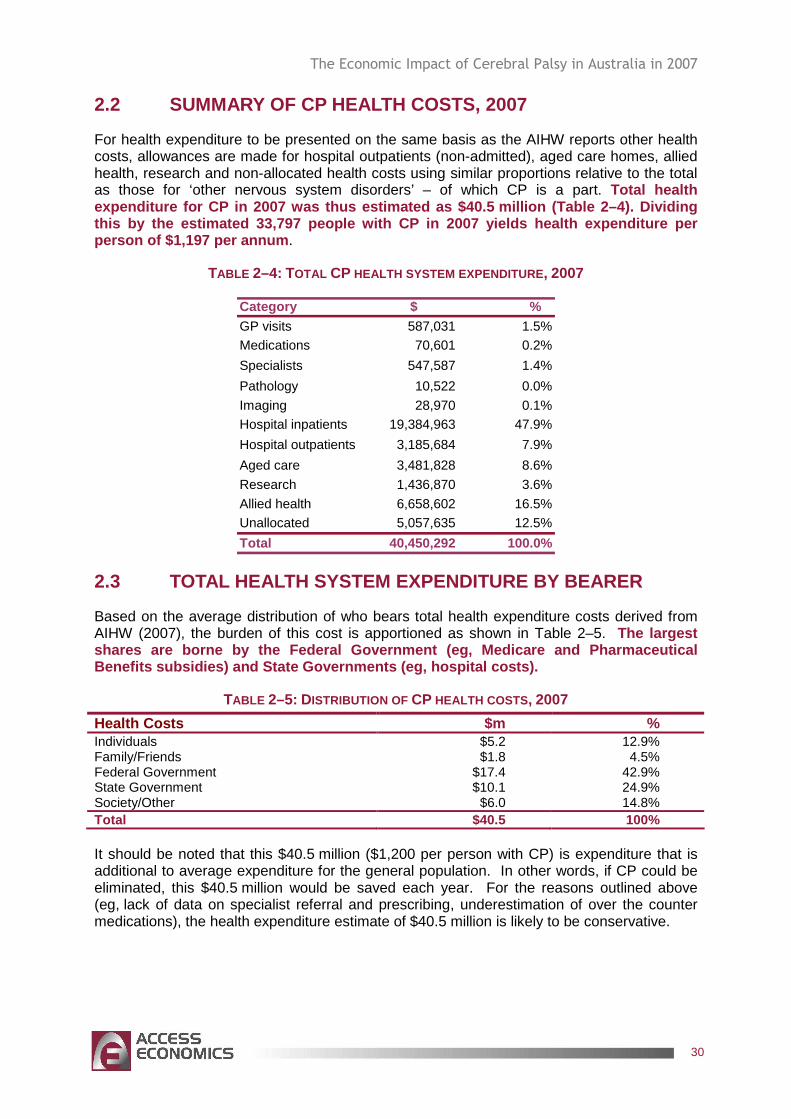
The Economic Impact of Cerebral Palsy in Australia in 2007
30
2.2 SUMMARY OF CP HEALTH COSTS, 2007
For health expenditure to be presented on the same basis as the AIHW reports other health costs, allowances are made for hospital outpatients (non-admitted), aged care homes, allied health, research and non-allocated health costs using similar proportions relative to the total as those for ‘other nervous system disorders’ – of which CP is a part. Total health expenditure for CP in 2007 was thus estimated as $4 0.5 million (Table 2–4). Dividing this by the estimated 33,797 people with CP in 2007 yields health expenditure per person of $1,197 per annum .
TABLE 2–4: TOTAL CP HEALTH SYSTEM EXPENDITURE , 2007
Category $ %GP visits 587,031 1.5%Medications 70,601 0.2%
Specialists 547,587 1.4%
Pathology 10,522 0.0%
Imaging 28,970 0.1%Hospital inpatients 19,384,963 47.9%
Hospital outpatients 3,185,684 7.9%
Aged care 3,481,828 8.6%
Research 1,436,870 3.6%
Allied health 6,658,602 16.5%Unallocated 5,057,635 12.5%
Total 40,450,292 100.0%
2.3 TOTAL HEALTH SYSTEM EXPENDITURE BY BEARER
Based on the average distribution of who bears total health expenditure costs derived from AIHW (2007), the burden of this cost is apportioned as shown in Table 2–5. The largest shares are borne by the Federal Government (eg, Med icare and Pharmaceutical Benefits subsidies) and State Governments (eg, hosp ital costs).
TABLE 2–5: DISTRIBUTION OF CP HEALTH COSTS , 2007
Health Costs $m % Individuals $5.2 12.9% Family/Friends $1.8 4.5% Federal Government $17.4 42.9% State Government $10.1 24.9% Society/Other $6.0 14.8% Total $40.5 100%
It should be noted that this $40.5 million ($1,200 per person with CP) is expenditure that is additional to average expenditure for the general population. In other words, if CP could be eliminated, this $40.5 million would be saved each year. For the reasons outlined above (eg, lack of data on specialist referral and prescribing, underestimation of over the counter medications), the health expenditure estimate of $40.5 million is likely to be conservative.
The Economic Impact of Cerebral Palsy in Australia in 2007
31
3. OTHER FINANCIAL COSTS
In addition to health system costs, CP also imposes a number of other important financial costs on society and the economy, including the following.
� Productivity losses of people with CP comprise those from lower employment participation, absenteeism and/or premature mortality.
� Carer costs comprise the value of care services provided in the community primarily by informal carers and not captured in health system costs.
� Other costs comprise the cost of aids, home modifications and other pertinent financial costs not captured elsewhere.
� Transfer costs comprise the DWL associated with government transfers such as taxation revenue forgone, welfare and disability payments.
It is important to make the economic distinction between real and transfer costs.
� Real costs use up real resources, such as capital or labour, or reduce the economy’s overall capacity to produce goods and services.
� Transfer payments involve payments from one economic agent to another that do not use up real resources eg, a disability support pension or taxation revenue.
Data on other financial costs are drawn from a variety of sources eg, the literature (focusing on Australian literature but sometimes supplemented by international material), SDAC data, ABS data on Average Weekly Earnings (AWE) and so on.
In general, adults with CP who have high support needs have well under half the workforce participation rate of the general population. As the Disability Support Pension (DSP) is set at 25% of the average wage, a person receiving the pension is earning 75% less than the average working person, yet personal care needs are substantially higher than for the general population. Continence aids are expensive and not fully funded. Participation in employment, recreation and community life involves greater transport, equipment and personal care costs. Many adults with CP must use taxis for transport and even at the subsidised half fare they are still significantly more expensive than public transport. The cost of living is likely to be higher than for the general population because there are fewer accessible outlets from which to choose, fewer opportunities to ‘shop for bargains’, and an inability to substitute ‘do-it-yourself’ goods for assembled and/or customised goods and services. Moreover, people with CP generally do not have lifetime savings to draw upon to subsidise the pension payment.
3.1 PRODUCTIVITY LOSSES
Productivity losses are the cost of production that is lost when people with CP are unable to work because of the condition. They may work less than they otherwise would (either being employed less, being absent more often or being less productive while at work) or they may die prematurely. Access Economics adopts a human capital approach to measurement of productivity losses in developed countries.
Data for productivity costs was obtained from various CP Australia member organisations, covering people with CP who are either engaged in open employment or in supported employment arrangements.
The Economic Impact of Cerebral Palsy in Australia in 2007
32
� Open employment means people with CP having jobs in the open employment market or being self-employed, while supported employment occurs when commercial organisations mostly employ people with disabilities and provide assistance to employment in the businesses they run.
� Some form of employment data was collected for 137 people with CP – covering ages from 15-64. The overwhelming majority (93%) were engaged in supported employment. These data were then compared against available Australian and international literature regarding the employment impact of CP.
3.1.1 EMPLOYMENT PARTICIPATION
CP can affect a person’s ability to work. Adults with CP who have high support needs have well under half the workforce participation rate of the general population8. If employment rates are lower for people with CP, this loss in productivity represents a real cost to the economy.
Findings from the Australian CP Register are corroborated by international studies on the employment impact of CP.
� Michelsen et al (2005) studied a representative sample of 819 participants with CP born between 1965 and 1978 in the Danish Cerebral Palsy Registry, compared with 4,406 controls without CP born between 1965 and 1978, and found that only 29% of people with CP were competitively employed compared to 82% in the control population. This represented a 53 percentage point difference in employment participation (with participants in the study being aged between 21-35 years) ie, a 64.6% reduction.
� Similarly, Dussen et al (2001), studying a smaller sample of 80 people with CP aged between 21-31 years in the Netherlands, found that only 36% of people with CP were competitively employed, compared to 73% in the general population. This represented a 37 percentage point reduction in employment participation.
� Finally, Martin et al (1965) found that only 28% of people with CP aged between 17-25 years participating in the Canadian Rehabilitation Council for the Disabled were employed or potentially employable.
Ultimately, the findings of Michelsen et al (2005) were applied to the Australian population since the participation rate of the control group matches the current participation rate of the general population in Australia aged between 20-34 years. Moreover, its findings are consistent with the research cited above that adults with CP can have well under half the workforce participation rate of the general population. As a result, it is assumed that people with CP experience a reduction of employment of around 64.6% in each age-gender group, relative to the general population.
This result was then combined with AWE and employment rates for each respective age-gender group to calculate the lost earnings due to reduced employment. AWE for each age-gender group, the lost work effectiveness (or lost productivity) can then be calculated.
8 Australian CP Register, McIntyre S (2006).
The Economic Impact of Cerebral Palsy in Australia in 2007
33
The annual cost of lost earnings due to reduced employment is estimate d at around $531.3 million in 2007.
3.1.2 ABSENTEEISM FROM PAID AND UNPAID WORK
CP can adversely affect work performance through absence from work due to the condition. Absenteeism is measured by looking at the number of work days missed by people with CP over a 12 month period. Data for absenteeism were sourced from various CP Australia member organisations. Data for total absenteeism (including annual and sick leave) were available for 98 people with CP, who averaged 35.8 days away from work per year due to their CP.
The same number of days is estimated to be lost, for those who do not work, from their household productivity, which is valued at 30% of the average wage rate.
Based on these parameters and the AWE for each age-gender group, Access Economics estimates that in 2007, the total cost of absenteeism due to CP is $167.2 million . This includes around $132.7 million due to absenteeism for people in paid work and around $34.6 million in lost household productivity for those in unpaid work.
3.1.3 PRESENTEEISM
CP can also affect a person’s ability to work effectively while at work. Presenteeism can be estimated by multiplying the number of days worked with CP by the percentage reduction in effectiveness on days worked with CP.
Data for presenteeism were sourced from various CP Australia member organisations, based on the Supported Wage System (SWS) measure of productivity. This system incorporates a process of productivity-based wage assessment. For example, if a person involved in SWS is assessed as having a productivity level of 70% compared to co-workers performing the same duties, the worker and the employer can agree to ongoing employment at a pay rate of 70% of the normal rate. In other words, there would be a 30% reduction in productivity (or presenteeism).
Data for SWS productivity levels was available for 137 people with CP, who averaged a productivity level of 19%. This represented a loss of productivity (or presenteeism) of around 81%.
Such a very low level of productivity highlights the significant impact of CP on employment outcomes.
Given these results, Access Economics estimates that in 2007, the total cost of ‘presenteeism’ (lower productivity while at work) d ue to CP is $235.2 million .
3.1.4 PREMATURE DEATH
From the calculations in Section 1.7, there are an estimated 226 deaths due to CP in 2007 (130 males and 86 females). Based on this case mortality risk, and incorporating employment rates and estimates of average lifetime earnings for different age groups, the
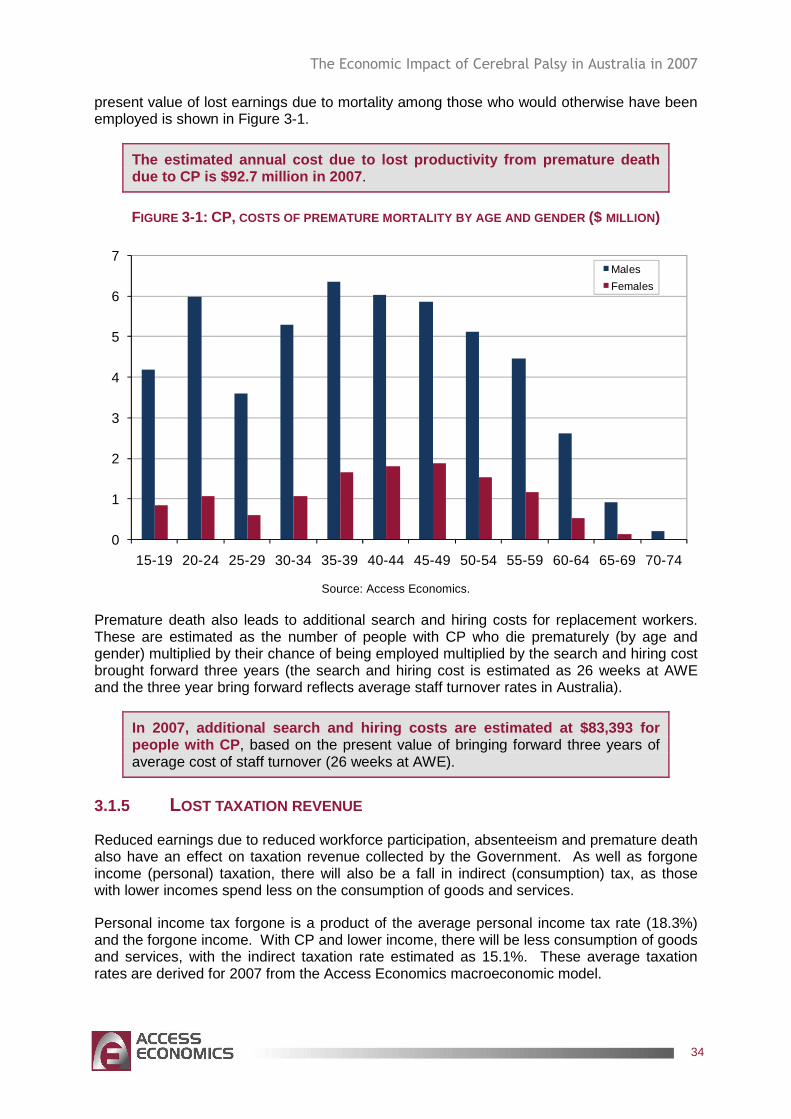
The Economic Impact of Cerebral Palsy in Australia in 2007
34
present value of lost earnings due to mortality among those who would otherwise have been employed is shown in Figure 3-1.
The estimated annual cost due to lost productivity from premature death due to CP is $92.7 million in 2007 .
FIGURE 3-1: CP, COSTS OF PREMATURE MORTALITY BY AGE AND GENDER ($ MILLION)
0
1
2
3
4
5
6
7
15-19 20-24 25-29 30-34 35-39 40-44 45-49 50-54 55-59 60-64 65-69 70-74
Males
Females
Source: Access Economics.
Premature death also leads to additional search and hiring costs for replacement workers. These are estimated as the number of people with CP who die prematurely (by age and gender) multiplied by their chance of being employed multiplied by the search and hiring cost brought forward three years (the search and hiring cost is estimated as 26 weeks at AWE and the three year bring forward reflects average staff turnover rates in Australia).
In 2007, additional search and hiring costs are est imated at $83,393 for people with CP , based on the present value of bringing forward three years of average cost of staff turnover (26 weeks at AWE).
3.1.5 LOST TAXATION REVENUE
Reduced earnings due to reduced workforce participation, absenteeism and premature death also have an effect on taxation revenue collected by the Government. As well as forgone income (personal) taxation, there will also be a fall in indirect (consumption) tax, as those with lower incomes spend less on the consumption of goods and services.
Personal income tax forgone is a product of the average personal income tax rate (18.3%) and the forgone income. With CP and lower income, there will be less consumption of goods and services, with the indirect taxation rate estimated as 15.1%. These average taxation rates are derived for 2007 from the Access Economics macroeconomic model.
The Economic Impact of Cerebral Palsy in Australia in 2007
35
Around $331 million in lost potential tax revenue i s estimated to be incurred in 2007 , due to the reduced productivity of people with CP.
Lost taxation revenue is considered a transfer payment, rather than an economic cost per se. However, raising additional taxation revenues does impose real efficiency costs on the Australian economy, known as deadweight losses (DWLs) . Administration of the taxation system costs around 1.25% of revenue raised (derived from total amounts spent and revenue raised in 2000-01, relative to Commonwealth department running costs). Even larger DWLs arise from the distortionary impact of taxes on workers’ work and consumption choices. These distortionary impacts are estimated to be 27.5% of each tax dollar collected (Lattimore, 1997 and used in Productivity Commission, 2003:6.15-6.16, with rationale). Altogether the DWL is 28.75% of the value of the taxation forgone (Section 3.6).
Access Economics estimates that around $95 million in deadweight loss is incurred in 2007 , due to the additional taxation required to replace that forgone due to lost productivity of people with CP (Table 3-1).
TABLE 3–1: LOST EARNINGS AND TAXATION DUE TO CP, 2007 Average personal income tax rate* 18.3%
Potential personal income tax lost $182 million
Average indirect tax rate* 15.1%
Potential indirect tax lost $150 million
Total potential tax revenue lost $331 million
Deadweight loss from additional taxation $95 millio n
* Source: Access Economics macroeconomic model (2007).
Welfare payments made to people who are no longer working must, in a budget-neutral setting, also be funded by additional taxation. The DWLs associated with welfare transfers are calculated in Section 3.6, where the nature of DWLs is explained in more detail.
3.2 CARER COSTS
Carers are people who provide informal care to others in need of assistance or support. Most informal carers are family or friends of the person receiving care. Carers may take time off work to accompany people with CP to medical appointments, stay with them in hospital, or care for them at home. Carers may also take time off work to undertake many of the unpaid tasks that the person with CP would do if they did not have CP and were able to do these tasks.
Informal care is distinguished from services provided by people employed in the health and community sectors (formal care) because the care is generally provided free of charge to the recipient and is not regulated by the government.
While informal care is provided free of charge, it is not free in an economic sense, as time spent caring is time that cannot be directed to other activities such as paid work, unpaid work (such as housework or yard work) or leisure. As such, informal care is a use of economic resources.
The Economic Impact of Cerebral Palsy in Australia in 2007
36
3.2.1 METHODOLOGY
There are three potential methodologies that can be used to place a dollar value on the informal care provided.
� Opportunity cost is the value of lost wages forgone by the carer.
� Replacement valuation is the cost of buying a similar amount of services from the formal care sector.
� Self-valuation is what carers themselves feel they should be paid.
Access Economics has adopted the opportunity cost method in this report as it provides the most accurate estimate of carer costs and sufficient demographic data on providers of care for people with CP are available.
3.2.2 INFORMAL AND COMMUNITY CARE COSTS
Informal care costs are the value of the care provided by informal friends or family carers. This report analyses the available epidemiological data (from Australia and overseas) together with SDAC data (ABS, 2003), to gain estimates of the total number of hours of care provided to people with CP in 2007, and the average unit cost of that care.
Community care costs include those costs associated with CP that are not captured in formal health sector costs. Examples include the cost of services provided to assist with rehabilitation, mobility or independent living, the costs of aids and modifications to the homes of people with CP, and travel to health services. Estimates of these costs for 2007 are based on investigation of the available data and literature on useage rates and on unit costs.
SDAC data sourced specifically for this report identified around 13,400 carers who cared for people with CP as their main condition.
However, it is important to avoid double counting the people with CP who would have received care anyway. As such it is necessary to identify the ‘excess’ amount of care provided to people with CP by calculating the usage rates of informal care for people with CP (41.5% of people with CP have a carer, where CP is the main condition) and comparing them to informal care usage rates for the general Australian population (2.4% of the general population have a carer, with very little difference in the age-gender distribution of the respective populations).
The difference was 39.1% or 13,216 people with CP in 2007 who had a carer, who are estimated would not have had one in the absence of the CP.
Assuming that the split between primary and non-primary carers is the same as for the population as a whole, there were an estimated 2,440 primary and 10,776 non-primary carers in 2007 for people with CP. Based on the demographic characteristics of carers from the SDAC data, of these carers 1,468 and 6,482 respectively are estimated to be employed.
SDAC data were also available for the average number of hours of care provided by primary carers. Of primary carers, 20.2% provided less than 20 hours of care per week on average, 9.9% provided between 20 and 40 hours and 66.0% provided more than 40 hours (with the remaining 3.9% not stating the number of care hours provided). Using these data, Access Economics conservatively calculated there was a weighted average of 31.4 hours of informal care per week provided by primary carers for people with CP. For non-primary carers, an estimate of five hours per week was made, in line with previous studies (eg, Access Economics, 2005).
The Economic Impact of Cerebral Palsy in Australia in 2007
37
Based on these findings and incorporating age-gender AWE in Australia, Access Economics estimates that in 2007 the total opportun ity cost of care informal for people with CP is around $128.6 millio n. This equates to $3,806 per person with CP in 2007, and includes $43 million in taxation revenue forgone.
3.3 DIRECT PROGRAM SERVICES COSTS
In addition to care provided by informal carers, various organisations provide direct service support to people with CP and their families. These services include accommodation support, community support, therapy (eg, services such as early childhood intervention and case management), community access (eg, continuing education/independent living training/adult training centre, post-school options/social, day centres and community support/community access), respite and employment services.
Data for direct program services costs in the most recent year were sourced from various CP Australia member organisations, complied by R Cummins, Manager Information Services, The Spastic Centre, in March 2008, with findings presented in Table 3–2. Data were collected by type where available and represent a conservative estimate as not all providers were able to provide data.
The total direct program services costs estimated f or 2007 for Australians with CP were $124.1 million.
� These costs are treated as being borne by the ‘society/other’ group.
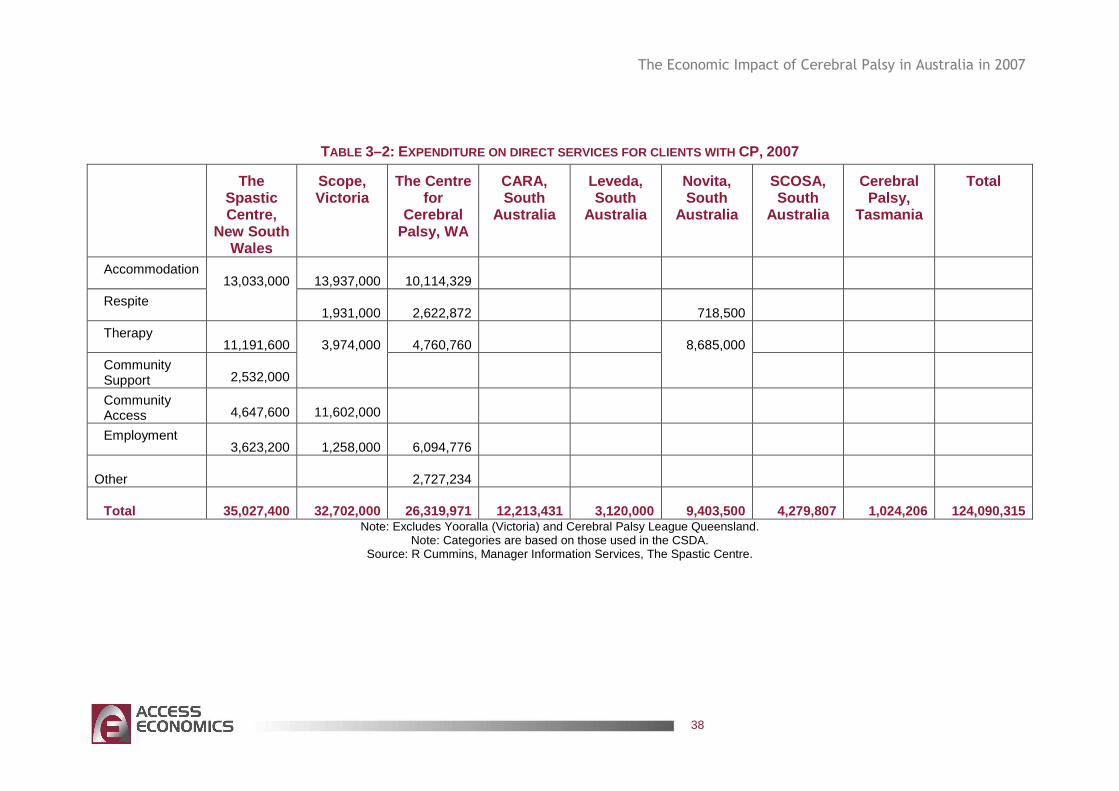
The Economic Impact of Cerebral Palsy in Australia in 2007
38
TABLE 3–2: EXPENDITURE ON DIRECT SERVICES FOR CLIENTS WITH CP, 2007
The Spastic Centre,
New South Wales
Scope, Victoria
The Centre for
Cerebral Palsy, WA
CARA, South
Australia
Leveda, South
Australia
Novita, South
Australia
SCOSA, South
Australia
Cerebral Palsy,
Tasmania
Total
Accommodation 13,937,000 10,114,329
Respite
13,033,000
1,931,000 2,622,872 718,500
Therapy 11,191,600 4,760,760
Community Support 2,532,000
3,974,000
8,685,000
Community Access 4,647,600 11,602,000
Employment 3,623,200 1,258,000 6,094,776
Other 2,727,234
Total 35,027,400 32,702,000 26,319,971 12,213,431 3,120,000 9,403,500 4,279,807 1,024,206 124,090,315 Note: Excludes Yooralla (Victoria) and Cerebral Palsy League Queensland.
Note: Categories are based on those used in the CSDA. Source: R Cummins, Manager Information Services, The Spastic Centre.
The Economic Impact of Cerebral Palsy in Australia in 2007
39
3.4 AIDS AND HOME MODIFICATIONS
Many children with CP have extensive health needs that cost a family in terms of time, money and emotional stress. Expensive equipment is often needed to increase independence and quality of life, which children outgrow, adding to parental and government expenses. Provision of essential equipment such as home modifications, wheelchairs and communication devices can take up to three years on a waiting list before funding is approved through government agencies.
Aids and home modifications are those not captured in formal health sector or disability services costs that include equipment and technology in order to assist with daily living. Estimates of aids and modifications costs are based on data from the ABS SDAC for people with CP as their main condition. These data are then compared to utilisation rates of aids and modifications for the rest of the SDAC survey population to estimate the ‘excess’ aids and modifications used by people with CP, relative to people without CP.
Results from SDAC show that of those who reported CP as their main condition:
� 58.4% used at least one type of self care aid compared to 48.3% without;
� 32.6% used some type of communication aid compared to 22.8% without;
� 48.1% used mobility aids compared to 12.8% without; and
� 31.9% made modifications to their home compared to 10.9% without.
Cost estimates for various products are based on prices provided by the Independent Living Centre NSW, the Victorian Aids and Equipment Program and previous studies undertaken by Access Economics, inflated to 2007 prices. While some equipment and modifications require large outlays but are depreciated over a number of years, other devices need to be replaced more regularly. It was assumed that devices in heavy use (eating, dressing, continence aids and batteries) need to be replaced after one to two years – with an average cost of $293 per annum for people with CP who used these, while most other devices (most mobility aids such as canes, crutches, walking sticks and frames) – have a lifespan of three years (average expenditure on these by people with CP who used them was $214 per annum). Home modifications tend to be one-off investments (costing around $7,995 on average for people with CP who modified their homes), so their lifespan was assumed to be 20 years (Table 3–3) ie, an annual cost of $410 per annum.
Overall, the cost for aids and equipment for people with CP was estimated at around $6.4 million in 2007 – or $189 on average across all people with CP.
As it is not known how much of this cost is subsidised by governments, paid for by the person with CP or their family and friends, or paid for through community programs, the amount is allocated in four equal portions to the Federal Government, State and Territory governments, family/friends and society/other.
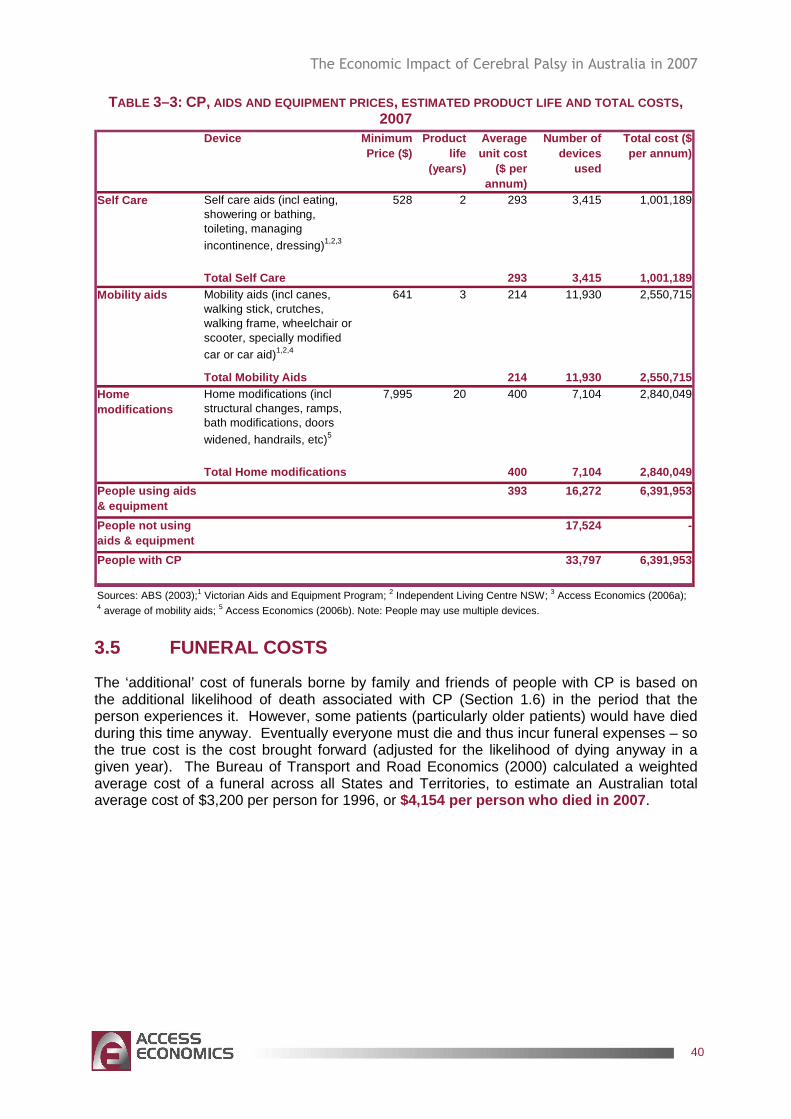
The Economic Impact of Cerebral Palsy in Australia in 2007
40
TABLE 3–3: CP, AIDS AND EQUIPMENT PRICES , ESTIMATED PRODUCT LIFE AND TOTAL COSTS , 2007
Device Minimum Price ($)
Product life
(years)
Average unit cost
($ per annum)
Number of devices
used
Total cost ($ per annum)
Self Care Self care aids (incl eating, showering or bathing, toileting, managing
incontinence, dressing)1,2,3
528 2 293 3,415 1,001,189
Total Self Care 293 3,415 1,001,189 Mobility aids Mobility aids (incl canes,
walking stick, crutches, walking frame, wheelchair or scooter, specially modified car or car aid)1,2,4
641 3 214 11,930 2,550,715
Total Mobility Aids 214 11,930 2,550,715 Home modifications
Home modifications (incl structural changes, ramps, bath modifications, doors
widened, handrails, etc)5
7,995 20 400 7,104 2,840,049
Total Home modifications 400 7, 104 2,840,049
People using aids & equipment
393 16,272 6,391,953
People not using aids & equipment
17,524 -
People with CP 33,797 6,391,953
Sources: ABS (2003);1 Victorian Aids and Equipment Program; 2 Independent Living Centre NSW; 3 Access Economics (2006a); 4 average of mobility aids; 5 Access Economics (2006b). Note: People may use multiple devices.
3.5 FUNERAL COSTS
The ‘additional’ cost of funerals borne by family and friends of people with CP is based on the additional likelihood of death associated with CP (Section 1.6) in the period that the person experiences it. However, some patients (particularly older patients) would have died during this time anyway. Eventually everyone must die and thus incur funeral expenses – so the true cost is the cost brought forward (adjusted for the likelihood of dying anyway in a given year). The Bureau of Transport and Road Economics (2000) calculated a weighted average cost of a funeral across all States and Territories, to estimate an Australian total average cost of $3,200 per person for 1996, or $4,154 per person who died in 2007 .
The Economic Impact of Cerebral Palsy in Australia in 2007
41
The bring forward of funeral costs associated with premature death for people with CP is estimated at around $0.9 million in 2007.
3.6 DEADWEIGHT LOSSES FROM TRANSFERS
3.6.1 WELFARE AND INCOME SUPPORT PAYMENTS
Transfer payments represent a shift of resources from one economic entity to another. The act of taxation and redistribution creates distortions and inefficiencies in the economy, so transfers also involve real net costs to the economy.
Data regarding the number of people on income support payments were sourced from Centrelink Australia, specifically for this report. The most commonly received Centrelink work related benefit was the DSP, which Access Economics conservatively estimates was received by 8,514 people due to their CP in June 2007. There were also an estimated 48 people with CP receiving NewStart Allowance and 46 people receiving Sickness Allowance, due to their CP.
The value of these payments in 2007 is estimated to be around $99.9 million9. However, some of these people would have ordinarily received welfare payments which must be netted out to estimate the additional welfare payments due to CP, using a Melbourne University study (Tseng and Wilkins, 2002) about the ‘reliance’ of the general population (aged 15-64 years) on income support of around 12%. Factoring down the $99.9 million by this 12% gives a cost of welfare reliance on DSP, NewStart Allowance and Sickness Allowance due to CP of around $87.9 million per annum in 2007 .
3.6.2 DEADWEIGHT LOSSES
The welfare payments calculated immediately above are, like taxation revenue losses, not themselves economic costs but rather a financial transfer from taxpayers to the income support recipients. The real resource cost of these transfer payments is only the associated DWL.
DWLs refer to the costs of administering welfare pensions and raising additional taxation revenues. Although invalid and sickness benefits and forgone taxation are transfers, not real costs (so should not be included in the estimation of total costs), it is still worthwhile estimating them as that helps us understand how the total costs of CP are shared between the taxpayer, the individual and other financiers.
There are two sources of lost tax revenue that result from the lower earnings – the potential income tax forgone and the potential indirect (consumption) tax forgone. The latter is lost because, as income falls, so does consumption of goods and services. The average personal income tax rate used is 18.3% and the average indirect taxation rate used is 15.1%, based on parameters for 2007 from the Access Economics macroeconomic model.
Transfer payments (Government payments/services and taxes) are not a net cost to society as they represent a shift of consumption power from one group of individuals to another in society. If the act of taxation did not create distortions and inefficiencies in the economy,
9 Based on a payment of $446.60 per fortnight for DSP and $429.80 for NewStart Allowance and Sickness Allowance.
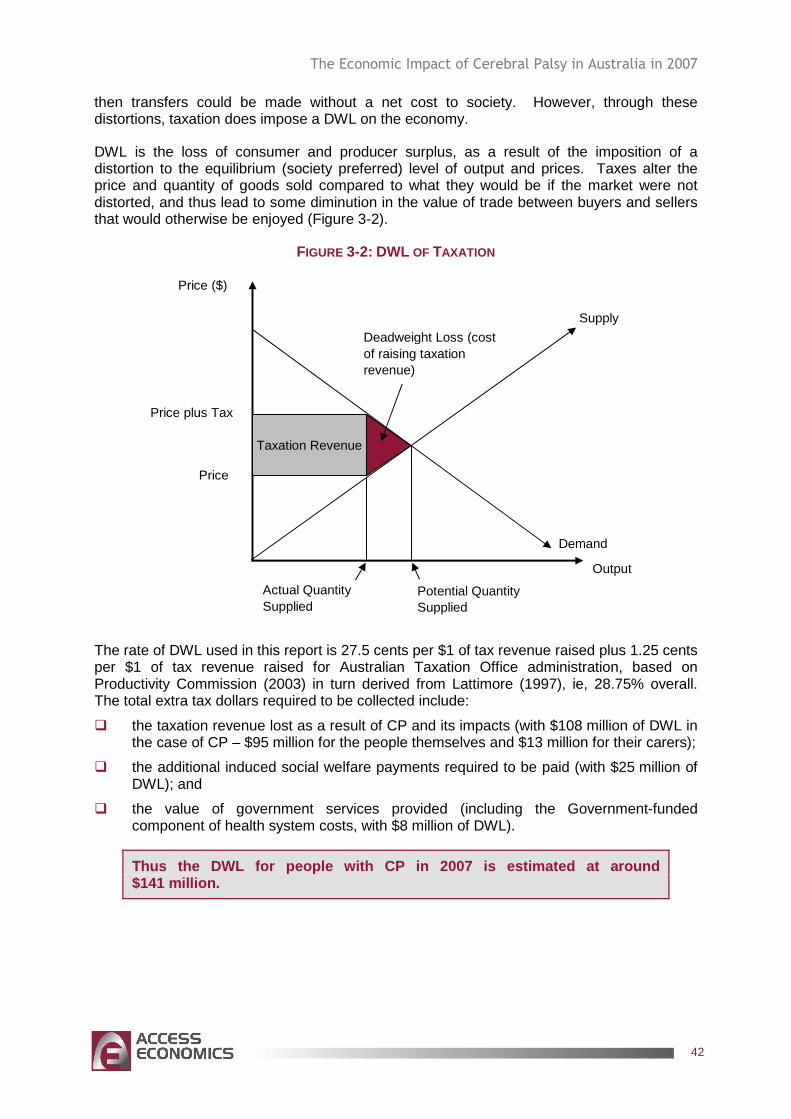
The Economic Impact of Cerebral Palsy in Australia in 2007
42
then transfers could be made without a net cost to society. However, through these distortions, taxation does impose a DWL on the economy.
DWL is the loss of consumer and producer surplus, as a result of the imposition of a distortion to the equilibrium (society preferred) level of output and prices. Taxes alter the price and quantity of goods sold compared to what they would be if the market were not distorted, and thus lead to some diminution in the value of trade between buyers and sellers that would otherwise be enjoyed (Figure 3-2).
FIGURE 3-2: DWL OF TAXATION
Price ($)
Output
Supply
Demand
Price plus Tax
Price
Taxation Revenue
Actual Quantity Supplied
Potential Quantity Supplied
Deadweight Loss (cost of raising taxation revenue)
The rate of DWL used in this report is 27.5 cents per $1 of tax revenue raised plus 1.25 cents per $1 of tax revenue raised for Australian Taxation Office administration, based on Productivity Commission (2003) in turn derived from Lattimore (1997), ie, 28.75% overall. The total extra tax dollars required to be collected include:
� the taxation revenue lost as a result of CP and its impacts (with $108 million of DWL in the case of CP – $95 million for the people themselves and $13 million for their carers);
� the additional induced social welfare payments required to be paid (with $25 million of DWL); and
� the value of government services provided (including the Government-funded component of health system costs, with $8 million of DWL).
Thus the DWL for people with CP in 2007 is estimate d at around $141 million.
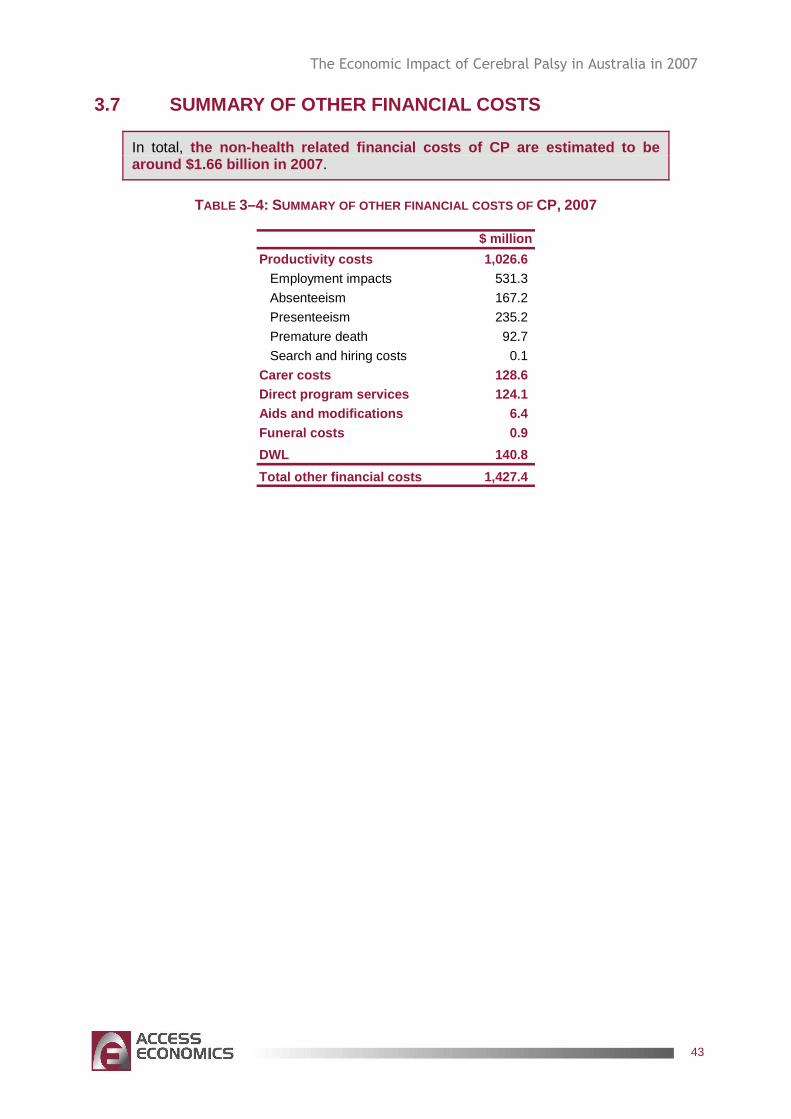
The Economic Impact of Cerebral Palsy in Australia in 2007
43
3.7 SUMMARY OF OTHER FINANCIAL COSTS
In total, the non-health related financial costs of CP are es timated to be around $1.66 billion in 2007 .
TABLE 3–4: SUMMARY OF OTHER FINANCIAL COSTS OF CP, 2007
$ million
Productivity costs 1,026.6 Employment impacts 531.3
Absenteeism 167.2
Presenteeism 235.2
Premature death 92.7
Search and hiring costs 0.1
Carer costs 128.6 Direct program services 124.1 Aids and modifications 6.4 Funeral costs 0.9
DWL 140.8
Total other financial costs 1,427.4
The Economic Impact of Cerebral Palsy in Australia in 2007
44
4. BURDEN OF DISEASE
The disability, loss of wellbeing and premature death that result from CP are more difficult to measure, but have been analysed in this chapter terms of the years of healthy life lost, both quantitatively and qualitatively, known as the ‘burden of disease’, with an imputed value of a statistical life year (VSLY) so as to compare these costs with financial costs of CP.
4.1 METHODOLOGY – VALUING LIFE AND HEALTH
Since Schelling’s (1968) discussion of the economics of life saving, the economic literature has properly focused on willingness to pay (willingness to accept) measures of mortality and morbidity risk. Using evidence of market trade-offs between risk and money, including numerous labour market and other studies (such as installing smoke detectors, wearing seatbelts or bike helmets etc), economists have developed estimates of the Value of a ‘Statistical’ Life (VSL).
The willingness to pay approach estimates the value of life in terms of the amounts that individuals are prepared to pay to reduce risks to their lives. It uses stated or revealed preferences to ascertain the value people place on reducing risk to life and reflects the value of intangible elements such as quality of life, health and leisure. While it overcomes the theoretical difficulties of the human capital approach, it involves more empirical difficulties in measurement (BTE, 2000:20-21).
Viscusi and Aldy (2002) summarise the extensive literature in this field, most of which has used econometric analysis to value mortality risk and the ‘hedonic wage’ by estimating compensating differentials for on-the-job risk exposure in labour markets. In other words, determining what dollar amount would be accepted by an individual to induce him/her to increase the possibility of death or morbidity by a given percentage. Viscusi and Aldy (2002) find the VSL ranges between US$4 million and US$9 million with a median of US$7 million (in year 2000 US dollars), similar but marginally higher than the VSL derived from US product and housing markets, and also marginally higher than non-US studies (although all in the same order of magnitude). They also review a parallel literature on the implicit value of the risk of non-fatal injuries.
A particular life may be regarded as priceless, yet relatively low implicit values may be assigned to life because of the distinction between identified and anonymous (or ‘statistical’) lives. When a ‘value of life’ estimate is derived, it is not any particular person’s life that is valued, but that of an unknown or statistical individual (Bureau of Transport and Regional Economics, 2002:19).
Weaknesses in this approach, as with human capital, are that there can be substantial variation between individuals. Extraneous influences in labour markets such as imperfect information, income/wealth or power asymmetries can cause difficulty in correctly perceiving the risk or in negotiating an acceptably higher wage.
Viscusi and Aldy (2002) include some Australian studies in their meta-analysis, notably Kniesner and Leeth (1991) of the ABS with VSL of US2000 $4.2 million and Miller et al (1997) of the National Occupational Health and Safety Commission (NOHSC) with quite a high VSL of US2000 $11.3m-19.1 million (Viscusi and Aldy, 2002:92-93). Since there are relatively few Australian studies, there is also the issue of converting foreign (US) data to
The Economic Impact of Cerebral Palsy in Australia in 2007
45
Australian dollars using either exchange rates or purchasing power parity and choosing a period.
Access Economics (2003) presents outcomes of studies from Yale University (Nordhaus, 1999) – where VSL is estimated as $US2.66m; University of Chicago (Murphy and Topel, 1999) – US$5m; Cutler and Richardson (1998) – who model a common range from US$3m to US$7m, noting a literature range of $US0.6m to $US13.5m per fatality prevented (1998 US dollars). These eminent researchers apply discount rates of 0% and 3% (favouring 3%) to the common range to derive an equivalent of $US 75,000 to $US 150,000 for a year of life gained.
4.1.1 DISABILITY ADJUSTED LIFE YEARS (DALYS) AND QUALITY ADJUSTED LIFE YEARS (QALYS)
In an attempt to overcome some of the issues in relation to placing a dollar value on a human life, in the last decade an alternative approach to valuing human life has been derived. The approach is non-financial, where CP, suffering and premature mortality are measured in terms of DALYs, with 0 representing a year of perfect health and 1 representing death (the converse of a QALY where 1 represents perfect health). This approach was developed by the World Health Organization, the World Bank and Harvard University and provides a comprehensive assessment of mortality and disability from diseases, injuries and risk factors in 1990, projected to 2020 (Murray and Lopez, 1996). Methods and data sources are detailed further in Murray et al (2001).
The DALY approach has been adopted and applied in Australia by the AIHW with a separate comprehensive application in Victoria. Mathers et al (1999) from the AIHW estimate the burden of disease and injury in 1996, including separate identification of premature mortality; Years of Life Lost due to Premature Mortality (YLL), and morbidity; Years of Healthy Life Lost due to Disability (YLD) components. In any year, the disability weight of a disease (eg, 0.18 for a broken wrist) reflects a relative health state. In this example, 0.18 would represent losing 18% of a year of healthy life because of the inflicted injury.
The DALY approach has been successful in avoiding the subjectivity of individual valuation and is capable of overcoming the problem of comparability between individuals and between nations, although nations have subsequently adopted variations in weighting systems. For example, in some countries DALYs are age-weighted for older people although in Australia the minority approach is adopted – valuing a DALY equally for people of all ages.
The main problem with the DALY approach is that it is not financial and is thus not directly comparable with most other cost measures. In public policy making, therefore, there is always the temptation to re-apply a financial measure conversion to ascertain the cost of an injury or fatality or the value of a preventive health intervention. Such financial conversions tend to utilise ‘willingness to pay’ or risk-based labour market studies described above.
The Department of Health and Ageing (based on work by Applied Economics) adopted a very conservative approach to this issue, placing the value of a human life year at around A$60,000 per annum, which is lower than most international lower bounds on the estimate.
“In order to convert DALYs into economic benefits, a dollar value per DALY is required. In this study, we follow the standard approach in the economics literature and derive the value of a healthy year from the value of life. For example, if the estimated value of life is A$2 million, the average loss of healthy
The Economic Impact of Cerebral Palsy in Australia in 2007
46
life is 40 years, and the discount rate is 5% per annum, the value of a healthy year would be $118,000.10 Tolley, Kenkel and Fabian (1994) review the literature on valuing life and life years and conclude that a range of US$70,000 to US$175,000 per life year is reasonable. In a major study of the value of health of the US population, Cutler and Richardson (1997) adopt an average value of US$100,000 in 1990 dollars for a healthy year.
Although there is an extensive international literature on the value of life (Viscusi, 1993), there is little Australian research on this subject. As the Bureau of Transport Economics (BTE) (in BTE, 2000) notes, international research using willingness to pay values usually places the value of life at somewhere between A$1.8 and A$4.3 million. On the other hand, values of life that reflect the present value of output lost (the human capital approach) are usually under $1 million.
The BTE (2000) adopts estimates of $1 million to $1.4 million per fatality, reflecting a 7% and 4% discount rate respectively. The higher figure of $1.4 million is made up of loss of workforce productivity of $540,000, loss of household productivity of $500,000 and loss of quality of life of $319,000. This is an unusual approach that combines human capital and willingness to pay concepts and adds household output to workforce output.
For this study, a value of $1 million and an equivalent value of $60,000 for a healthy year are assumed.11 In other words, the cost of a DALY is $60,000. This represents a conservative valuation of the estimated willingness to pay values for human life that are used most often in similar studies.12” (DoHA, 2003, pp11-12).
As the citation concludes, the estimate of $60,000 per DALY is very low. The Viscusi (1993) meta-analysis referred to reviewed 24 studies with values of a human life ranging between $US 0.5 million and $US 16m, all in pre-1993 US dollars. Even the lowest of these converted to 2003 Australian dollars at current exchange rates, exceeds the estimate adopted ($1m) by nearly 25%. The BTE study tends to disregard the literature at the higher end and also adopts a range (A$1-$1.4m) below the lower bound of the international range that it identifies (A$1.8-$4.3m).
The rationale for adopting these very low estimates is not provided explicitly. Certainly it is in the interests of fiscal restraint to present as low an estimate as possible.
In contrast, the majority of the literature as detailed above appears to support a higher estimate for VSL, as presented in Table 4–1, which Access Economics believes is important to consider in disease costing applications and decisions. The US dollar values of the lower bound, midrange and upper bound are shown. The ‘average’ estimate is the average of the range excluding the high NOHSC outlier. Equal weightings are used for each study as the:
� Viscusi and Aldy meta-analysis summarises 60 recent studies;
� ABS study is Australian; and
10 In round numbers, $2,000,000 = $118,000/1.05 + $118,000/(1.05)2 + … + $118,000/(1.05)40. [Access Economics comment: The actual value should be $116,556, not $118,000 even in round numbers.] 11 The equivalent value of $60,000 assumes, in broad terms, 40 years of lost life and a discount rate of 5%. [Access Economics comment: More accurately the figure should be $58,278.] 12 In addition to the cited references in the text, see for example Murphy and Topel’s study (1999) on the economic value of medical research. [Access Economics comment: Identical reference to ‘our’ Murphy and Topel (1999).]
The Economic Impact of Cerebral Palsy in Australia in 2007
47
� Yale and Harvard studies are based on the conclusions of eminent researchers in the field after conducting literature analysis.
Where there is no low or high US dollar estimate for a study, the midrange estimate is used to calculate the average. The midrange estimates are converted to Australian dollars at purchasing power parity (as this is less volatile than exchange rates) of USD=0.7281AUD for 2003 as estimated by the Organisation for Economic Co-operation and Development (OECD).
Access Economics concludes the VSL range in Australia lies between $3.7m and $9.6m13, with a mid-range estimate of $6.5m. These estimates have conservatively not been inflated to 2007 prices, given the uncertainty levels.
TABLE 4–1: INTERNATIONAL ESTIMATES OF VSL, VARIOUS YEARS
US$m A$m Lower Midrange Upper 0.7281
Viscusi and Aldy meta-analysis 2002
4 7 9 9.6
Australian: ABS 1991 4.2 5.8 NOHSC 1997 11.3 19.1 Yale (Nordhaus) 1999 2.66 3.7 Harvard (Cutler and Richardson) 1998
0.6 5 13.7 6.9
Average* 2.9 4.7 7.4 6.5
* Average of range excluding high NOHSC outlier, using midrange if no data; conservatively not inflated
A$m conversions are at the OECD 2003 PPP rate
4.1.2 DISCOUNT RATES
A discount rate is used to convert future income or a cost stream into the equivalent value in today’s dollars.
Choosing an appropriate discount rate for present valuations in cost analysis is a subject of some debate, and can vary depending on what type of future income or cost stream is being considered. There is a substantial body of literature, which often provides conflicting advice, on the appropriate mechanism by which costs should be discounted over time, properly taking into account risks, inflation, positive time preference and expected productivity gains.
The absolute minimum option that one can adopt in discounting future income and costs is to set future values in current day dollar terms on the basis of a risk free assessment about the future (that is, assume the future flows are similar to the certain flows attaching to a long term Government bond).
Wages should be assumed to grow in dollar terms according to best estimates for inflation and productivity growth. In selecting discount rates for this project, we have thus settled upon the following as the preferred approach.
� Positive time preference : Access Economics uses the long term nominal bond rate of 5.8% pa (from recent history) as the parameter for this aspect of the discount rate (If
13 Calculated from the non-indexed studies themselves. Converting the Access Economics average estimates from USD to AUD at purchasing power parity (PPP) would provide slightly higher estimates - $3.9m and $10.2m, with the same midrange estimate.
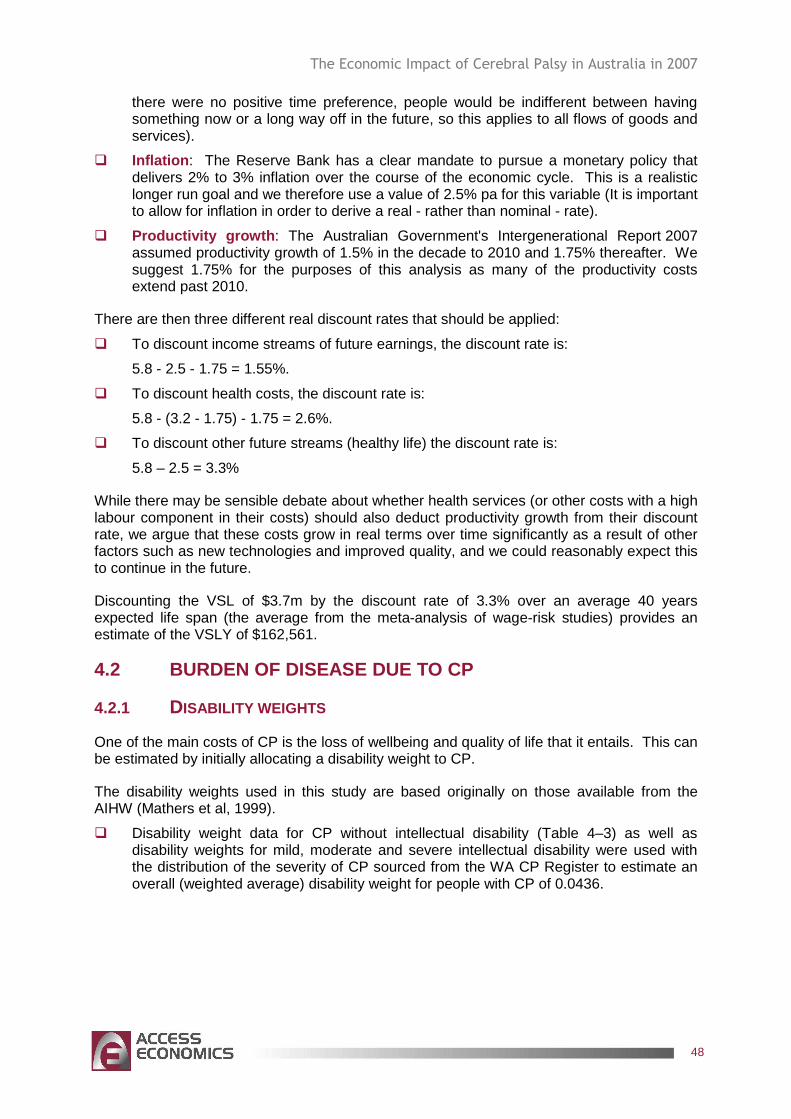
The Economic Impact of Cerebral Palsy in Australia in 2007
48
there were no positive time preference, people would be indifferent between having something now or a long way off in the future, so this applies to all flows of goods and services).
� Inflation : The Reserve Bank has a clear mandate to pursue a monetary policy that delivers 2% to 3% inflation over the course of the economic cycle. This is a realistic longer run goal and we therefore use a value of 2.5% pa for this variable (It is important to allow for inflation in order to derive a real - rather than nominal - rate).
� Productivity growth : The Australian Government's Intergenerational Report 2007 assumed productivity growth of 1.5% in the decade to 2010 and 1.75% thereafter. We suggest 1.75% for the purposes of this analysis as many of the productivity costs extend past 2010.
There are then three different real discount rates that should be applied:
� To discount income streams of future earnings, the discount rate is:
5.8 - 2.5 - 1.75 = 1.55%.
� To discount health costs, the discount rate is:
5.8 - (3.2 - 1.75) - 1.75 = 2.6%.
� To discount other future streams (healthy life) the discount rate is:
5.8 – 2.5 = 3.3%
While there may be sensible debate about whether health services (or other costs with a high labour component in their costs) should also deduct productivity growth from their discount rate, we argue that these costs grow in real terms over time significantly as a result of other factors such as new technologies and improved quality, and we could reasonably expect this to continue in the future.
Discounting the VSL of $3.7m by the discount rate of 3.3% over an average 40 years expected life span (the average from the meta-analysis of wage-risk studies) provides an estimate of the VSLY of $162,561.
4.2 BURDEN OF DISEASE DUE TO CP
4.2.1 DISABILITY WEIGHTS
One of the main costs of CP is the loss of wellbeing and quality of life that it entails. This can be estimated by initially allocating a disability weight to CP.
The disability weights used in this study are based originally on those available from the AIHW (Mathers et al, 1999).
� Disability weight data for CP without intellectual disability (Table 4–3) as well as disability weights for mild, moderate and severe intellectual disability were used with the distribution of the severity of CP sourced from the WA CP Register to estimate an overall (weighted average) disability weight for people with CP of 0.0436.
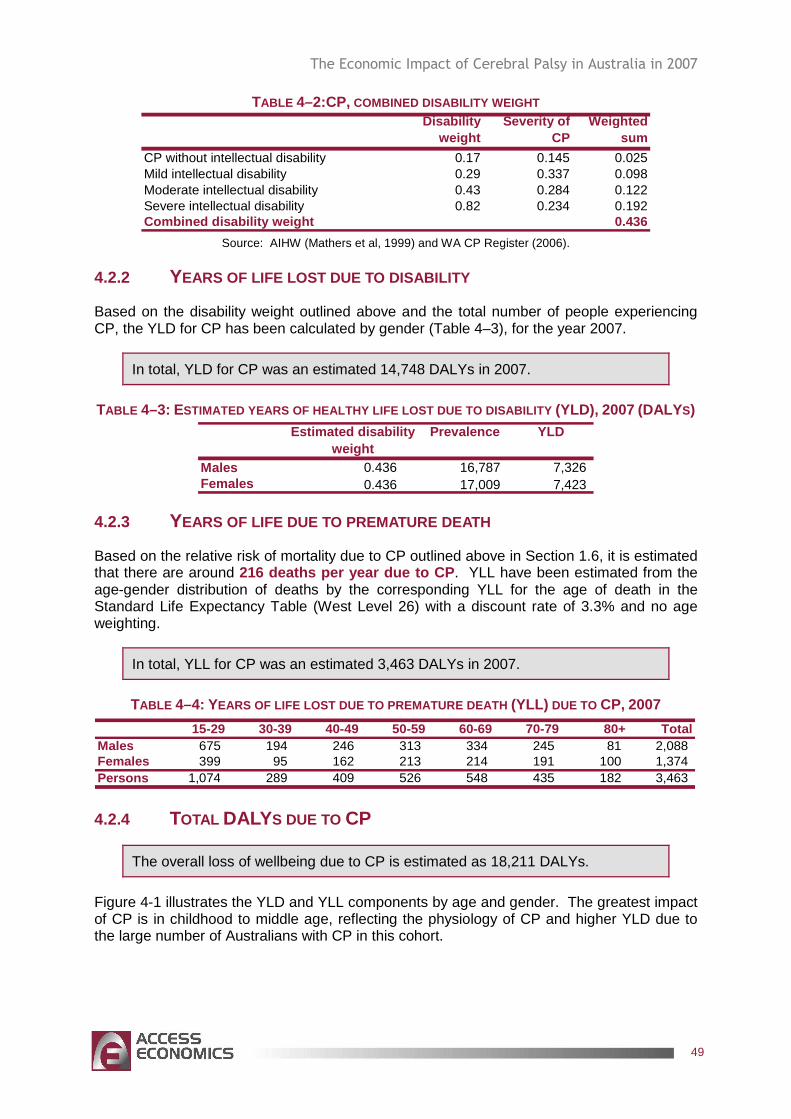
The Economic Impact of Cerebral Palsy in Australia in 2007
49
TABLE 4–2:CP, COMBINED DISABILITY WEIGHT Disability
weightSeverity of
CPWeighted
sum
CP without intellectual disability 0.17 0.145 0.025Mild intellectual disability 0.29 0.337 0.098Moderate intellectual disability 0.43 0.284 0.122Severe intellectual disability 0.82 0.234 0.192Combined disability weight 0.436
Source: AIHW (Mathers et al, 1999) and WA CP Register (2006).
4.2.2 YEARS OF LIFE LOST DUE TO DISABILITY
Based on the disability weight outlined above and the total number of people experiencing CP, the YLD for CP has been calculated by gender (Table 4–3), for the year 2007.
In total, YLD for CP was an estimated 14,748 DALYs in 2007.
TABLE 4–3: ESTIMATED YEARS OF HEALTHY LIFE LOST DUE TO DISABILI TY (YLD), 2007 (DALYS) Estimated disability
weightPrevalence YLD
Males 0.436 16,787 7,326 Females 0.436 17,009 7,423
4.2.3 YEARS OF LIFE DUE TO PREMATURE DEATH
Based on the relative risk of mortality due to CP outlined above in Section 1.6, it is estimated that there are around 216 deaths per year due to CP . YLL have been estimated from the age-gender distribution of deaths by the corresponding YLL for the age of death in the Standard Life Expectancy Table (West Level 26) with a discount rate of 3.3% and no age weighting.
In total, YLL for CP was an estimated 3,463 DALYs in 2007.
TABLE 4–4: YEARS OF LIFE LOST DUE TO PREMATURE DEATH (YLL) DUE TO CP, 2007
15-29 30-39 40-49 50-59 60-69 70-79 80+ TotalMales 675 194 246 313 334 245 81 2,088 Females 399 95 162 213 214 191 100 1,374 Persons 1,074 289 409 526 548 435 182 3,463
4.2.4 TOTAL DALYS DUE TO CP
The overall loss of wellbeing due to CP is estimated as 18,211 DALYs.
Figure 4-1 illustrates the YLD and YLL components by age and gender. The greatest impact of CP is in childhood to middle age, reflecting the physiology of CP and higher YLD due to the large number of Australians with CP in this cohort.
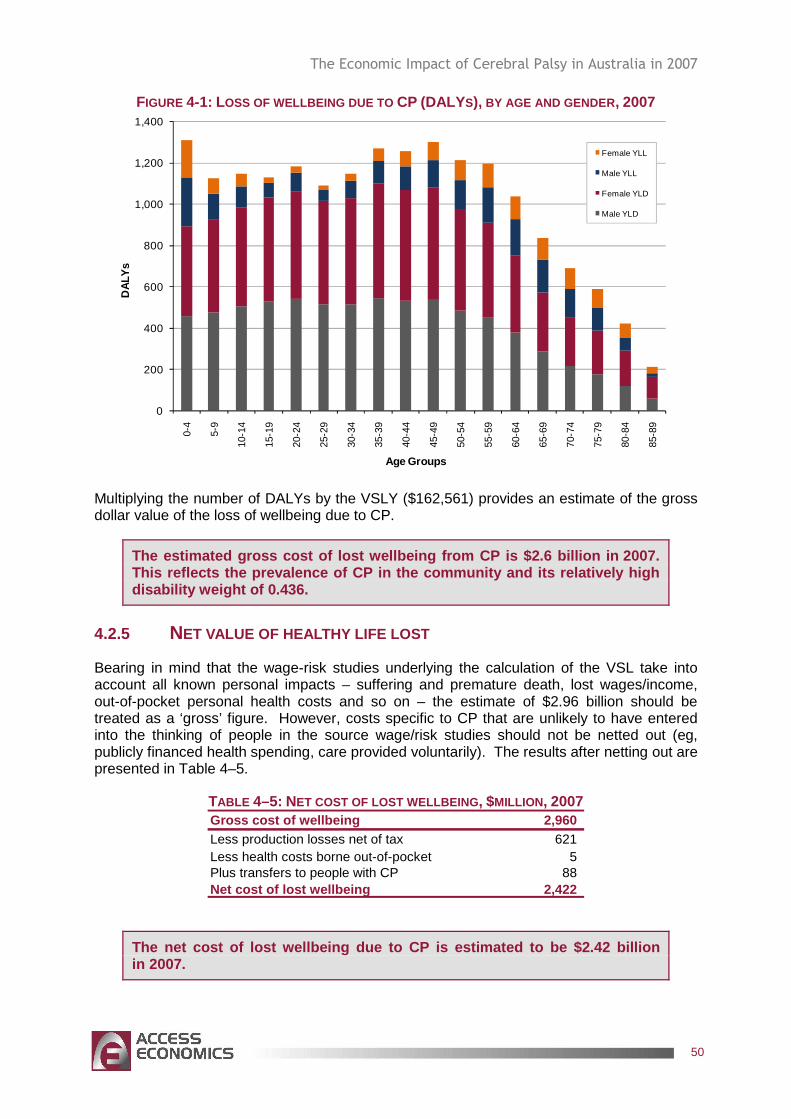
The Economic Impact of Cerebral Palsy in Australia in 2007
50
FIGURE 4-1: LOSS OF WELLBEING DUE TO CP (DALYS), BY AGE AND GENDER , 2007
0
200
400
600
800
1,000
1,200
1,400
0-4
5-9
10-1
4
15-1
9
20-2
4
25-2
9
30-3
4
35-3
9
40-4
4
45-4
9
50-5
4
55-5
9
60-6
4
65-6
9
70-7
4
75-7
9
80-8
4
85-8
9
DAL
Ys
Age Groups
Female YLL
Male YLL
Female YLD
Male YLD
Multiplying the number of DALYs by the VSLY ($162,561) provides an estimate of the gross dollar value of the loss of wellbeing due to CP.
The estimated gross cost of lost wellbeing from CP is $2.6 billion in 2007. This reflects the prevalence of CP in the community and its relatively high disability weight of 0.436.
4.2.5 NET VALUE OF HEALTHY LIFE LOST
Bearing in mind that the wage-risk studies underlying the calculation of the VSL take into account all known personal impacts – suffering and premature death, lost wages/income, out-of-pocket personal health costs and so on – the estimate of $2.96 billion should be treated as a ‘gross’ figure. However, costs specific to CP that are unlikely to have entered into the thinking of people in the source wage/risk studies should not be netted out (eg, publicly financed health spending, care provided voluntarily). The results after netting out are presented in Table 4–5.
TABLE 4–5: NET COST OF LOST WELLBEING , $MILLION , 2007 Gross cost of wellbeing 2,960 Less production losses net of tax 621 Less health costs borne out-of-pocket 5 Plus transfers to people with CP 88 Net cost of lost wellbeing 2,422
The net cost of lost wellbeing due to CP is estimat ed to be $2.42 billion in 2007.
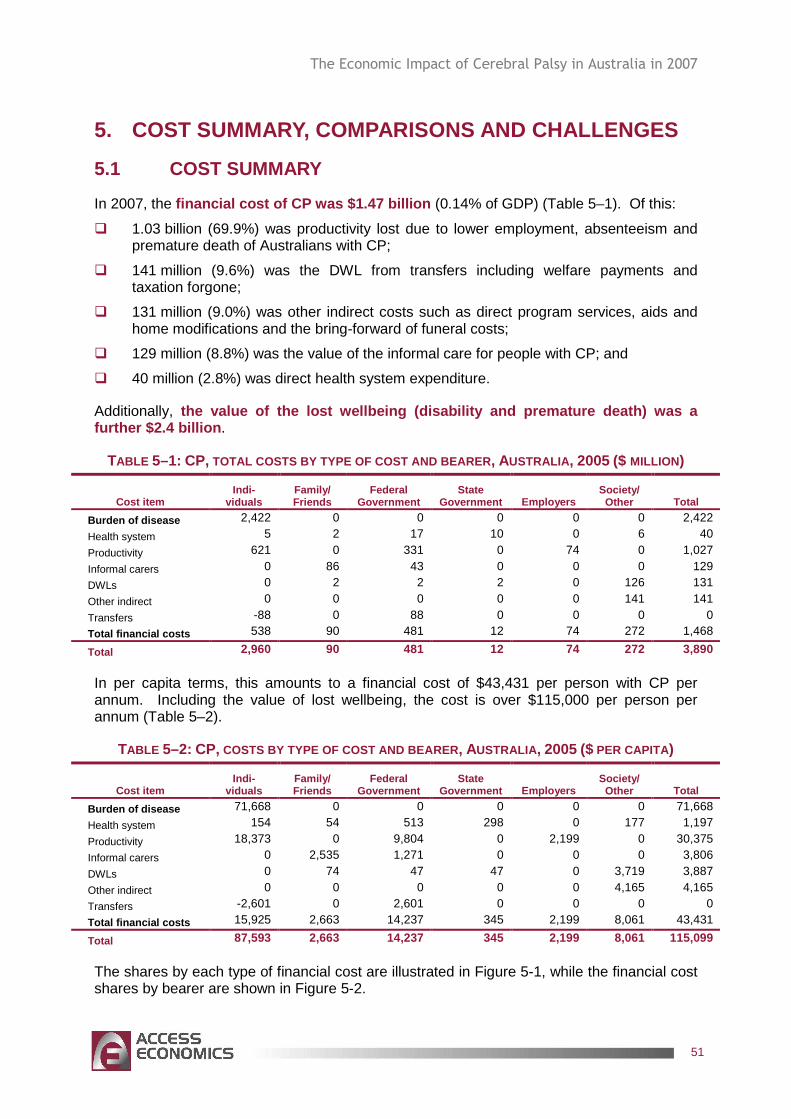
The Economic Impact of Cerebral Palsy in Australia in 2007
51
5. COST SUMMARY, COMPARISONS AND CHALLENGES
5.1 COST SUMMARY
In 2007, the financial cost of CP was $1.47 billion (0.14% of GDP) (Table 5–1). Of this:
� 1.03 billion (69.9%) was productivity lost due to lower employment, absenteeism and premature death of Australians with CP;
� 141 million (9.6%) was the DWL from transfers including welfare payments and taxation forgone;
� 131 million (9.0%) was other indirect costs such as direct program services, aids and home modifications and the bring-forward of funeral costs;
� 129 million (8.8%) was the value of the informal care for people with CP; and
� 40 million (2.8%) was direct health system expenditure.
Additionally, the value of the lost wellbeing (disability and pre mature death) was a further $2.4 billion .
TABLE 5–1: CP, TOTAL COSTS BY TYPE OF COST AND BEARER , AUSTRALIA , 2005 ($ MILLION)
Cost item Indi-
viduals Family/ Friends
Federal Government
State Government Employers
Society/ Other Total
Burden of disease 2,422 0 0 0 0 0 2,422
Health system 5 2 17 10 0 6 40
Productivity 621 0 331 0 74 0 1,027
Informal carers 0 86 43 0 0 0 129
DWLs 0 2 2 2 0 126 131
Other indirect 0 0 0 0 0 141 141
Transfers -88 0 88 0 0 0 0
Total financial costs 538 90 481 12 74 272 1,468
Total 2,960 90 481 12 74 272 3,890
In per capita terms, this amounts to a financial cost of $43,431 per person with CP per annum. Including the value of lost wellbeing, the cost is over $115,000 per person per annum (Table 5–2).
TABLE 5–2: CP, COSTS BY TYPE OF COST AND BEARER , AUSTRALIA , 2005 ($ PER CAPITA)
Cost item Indi-
viduals Family/ Friends
Federal Government
State Government Employers
Society/ Other Total
Burden of disease 71,668 0 0 0 0 0 71,668
Health system 154 54 513 298 0 177 1,197
Productivity 18,373 0 9,804 0 2,199 0 30,375
Informal carers 0 2,535 1,271 0 0 0 3,806
DWLs 0 74 47 47 0 3,719 3,887
Other indirect 0 0 0 0 0 4,165 4,165
Transfers -2,601 0 2,601 0 0 0 0
Total financial costs 15,925 2,663 14,237 345 2,199 8,061 43,431
Total 87,593 2,663 14,237 345 2,199 8,061 115,099
The shares by each type of financial cost are illustrated in Figure 5-1, while the financial cost shares by bearer are shown in Figure 5-2.
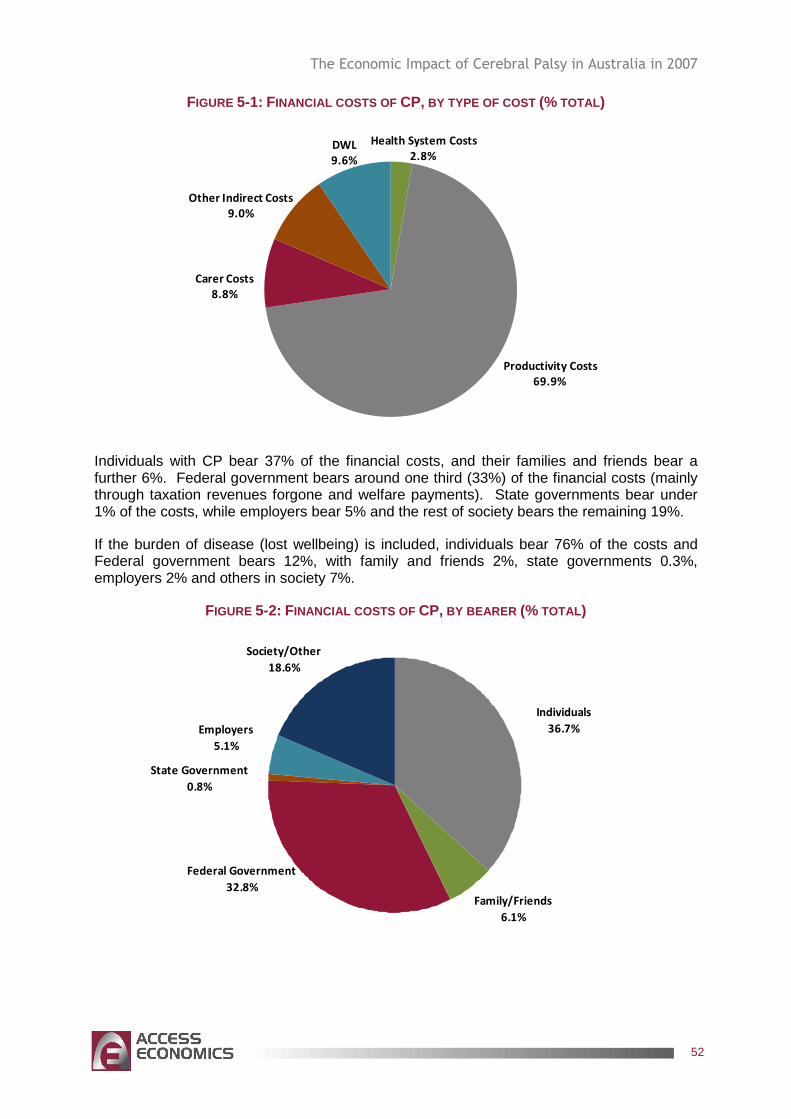
The Economic Impact of Cerebral Palsy in Australia in 2007
52
FIGURE 5-1: FINANCIAL COSTS OF CP, BY TYPE OF COST (% TOTAL)
Health System Costs
2.8%
Productivity Costs
69.9%
Carer Costs
8.8%
Other Indirect Costs
9.0%
DWL
9.6%
Individuals with CP bear 37% of the financial costs, and their families and friends bear a further 6%. Federal government bears around one third (33%) of the financial costs (mainly through taxation revenues forgone and welfare payments). State governments bear under 1% of the costs, while employers bear 5% and the rest of society bears the remaining 19%.
If the burden of disease (lost wellbeing) is included, individuals bear 76% of the costs and Federal government bears 12%, with family and friends 2%, state governments 0.3%, employers 2% and others in society 7%.
FIGURE 5-2: FINANCIAL COSTS OF CP, BY BEARER (% TOTAL)
Family/Friends
6.1%
State Government
0.8%
Employers
5.1%
Society/Other
18.6%
Individuals
36.7%
Federal Government
32.8%
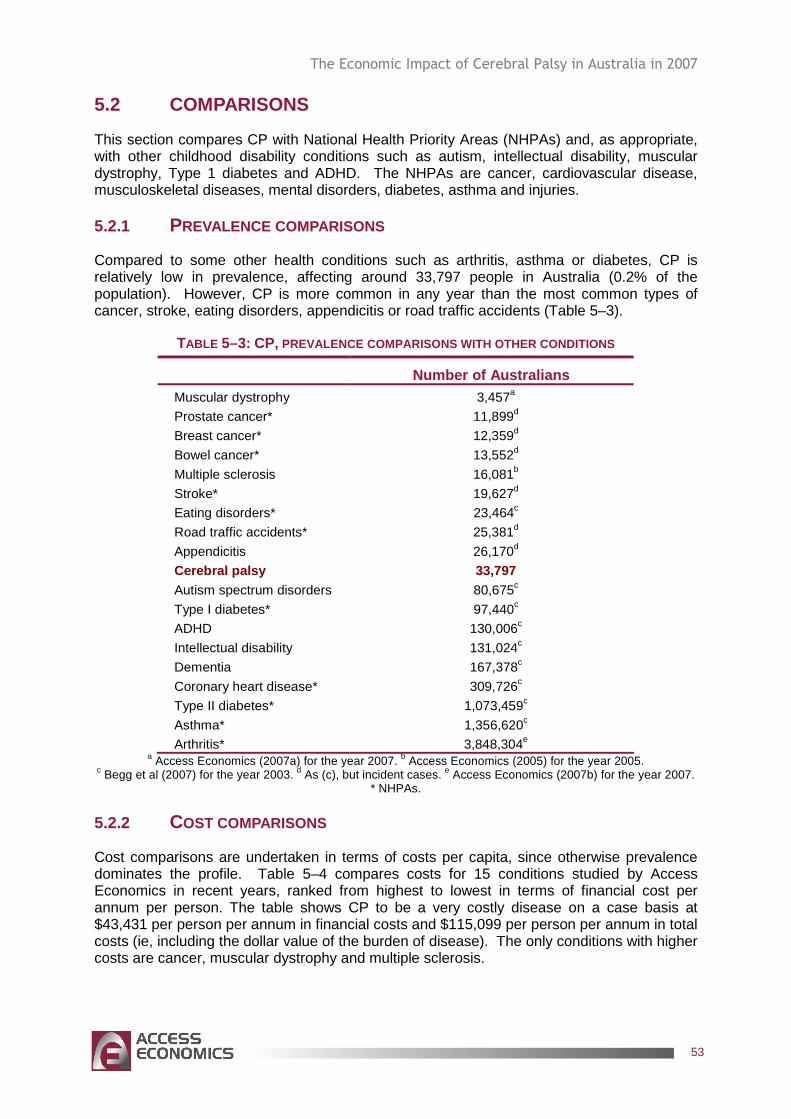
The Economic Impact of Cerebral Palsy in Australia in 2007
53
5.2 COMPARISONS
This section compares CP with National Health Priority Areas (NHPAs) and, as appropriate, with other childhood disability conditions such as autism, intellectual disability, muscular dystrophy, Type 1 diabetes and ADHD. The NHPAs are cancer, cardiovascular disease, musculoskeletal diseases, mental disorders, diabetes, asthma and injuries.
5.2.1 PREVALENCE COMPARISONS
Compared to some other health conditions such as arthritis, asthma or diabetes, CP is relatively low in prevalence, affecting around 33,797 people in Australia (0.2% of the population). However, CP is more common in any year than the most common types of cancer, stroke, eating disorders, appendicitis or road traffic accidents (Table 5–3).
TABLE 5–3: CP, PREVALENCE COMPARISONS WITH OTHER CONDITIONS
Number of Australians Muscular dystrophy 3,457a
Prostate cancer* 11,899d
Breast cancer* 12,359d
Bowel cancer* 13,552d
Multiple sclerosis 16,081b
Stroke* 19,627d
Eating disorders* 23,464c
Road traffic accidents* 25,381d
Appendicitis 26,170d
Cerebral palsy 33,797 Autism spectrum disorders 80,675c
Type I diabetes* 97,440c
ADHD 130,006c
Intellectual disability 131,024c
Dementia 167,378c
Coronary heart disease* 309,726c
Type II diabetes* 1,073,459c
Asthma* 1,356,620c
Arthritis* 3,848,304e a Access Economics (2007a) for the year 2007. b Access Economics (2005) for the year 2005.
c Begg et al (2007) for the year 2003. d As (c), but incident cases. e Access Economics (2007b) for the year 2007. * NHPAs.
5.2.2 COST COMPARISONS
Cost comparisons are undertaken in terms of costs per capita, since otherwise prevalence dominates the profile. Table 5–4 compares costs for 15 conditions studied by Access Economics in recent years, ranked from highest to lowest in terms of financial cost per annum per person. The table shows CP to be a very costly disease on a case basis at $43,431 per person per annum in financial costs and $115,099 per person per annum in total costs (ie, including the dollar value of the burden of disease). The only conditions with higher costs are cancer, muscular dystrophy and multiple sclerosis.
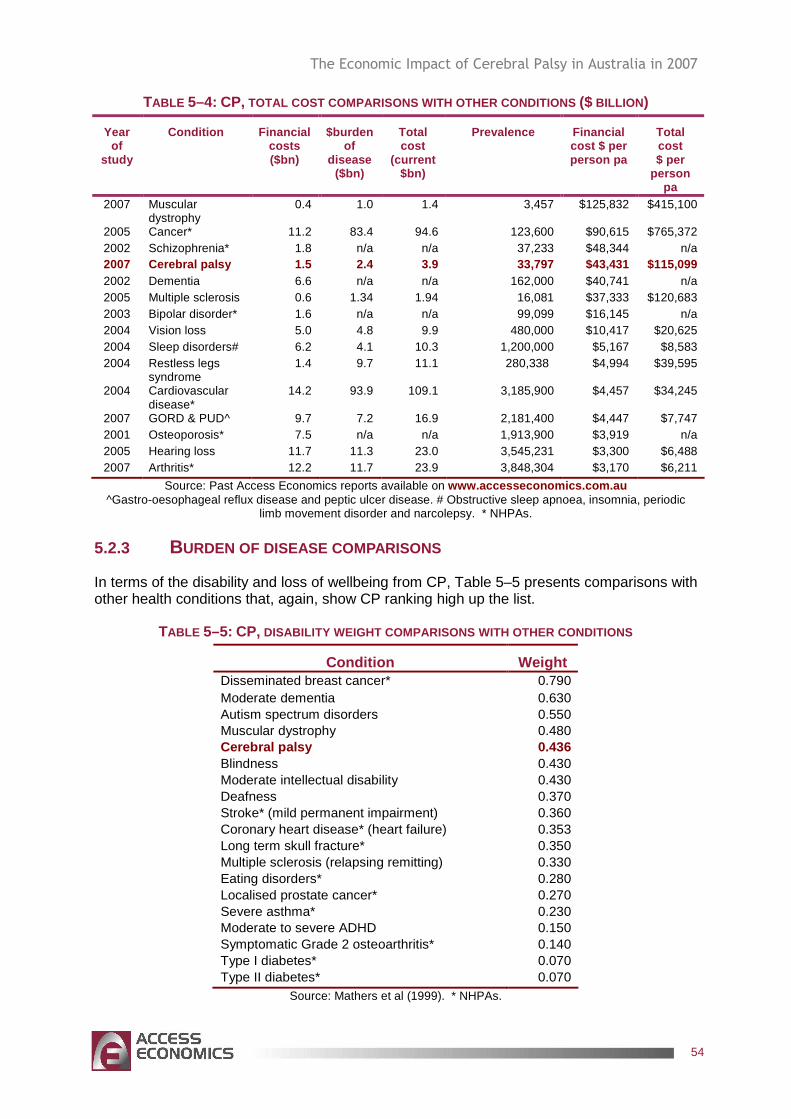
The Economic Impact of Cerebral Palsy in Australia in 2007
54
TABLE 5–4: CP, TOTAL COST COMPARISONS WITH OTHER CONDITIONS ($ BILLION )
Year of
study
Condition Financial costs ($bn)
$burden of
disease ($bn)
Total cost
(current $bn)
Prevalence Financial cost $ per person pa
Total cost $ per
person pa
2007 Muscular dystrophy
0.4 1.0 1.4 3,457 $125,832 $415,100
2005 Cancer* 11.2 83.4 94.6 123,600 $90,615 $765,372 2002 Schizophrenia* 1.8 n/a n/a 37,233 $48,344 n/a 2007 Cerebral palsy 1.5 2.4 3.9 33,797 $43,431 $115 ,099 2002 Dementia 6.6 n/a n/a 162,000 $40,741 n/a 2005 Multiple sclerosis 0.6 1.34 1.94 16,081 $37,333 $120,683 2003 Bipolar disorder* 1.6 n/a n/a 99,099 $16,145 n/a 2004 Vision loss 5.0 4.8 9.9 480,000 $10,417 $20,625 2004 Sleep disorders# 6.2 4.1 10.3 1,200,000 $5,167 $8,583 2004 Restless legs
syndrome 1.4 9.7 11.1 280,338 $4,994 $39,595
2004 Cardiovascular disease*
14.2 93.9 109.1 3,185,900 $4,457 $34,245
2007 GORD & PUD^ 9.7 7.2 16.9 2,181,400 $4,447 $7,747 2001 Osteoporosis* 7.5 n/a n/a 1,913,900 $3,919 n/a 2005 Hearing loss 11.7 11.3 23.0 3,545,231 $3,300 $6,488 2007 Arthritis* 12.2 11.7 23.9 3,848,304 $3,170 $6,211
Source: Past Access Economics reports available on www.accesseconomics.com.au ^Gastro-oesophageal reflux disease and peptic ulcer disease. # Obstructive sleep apnoea, insomnia, periodic
limb movement disorder and narcolepsy. * NHPAs.
5.2.3 BURDEN OF DISEASE COMPARISONS
In terms of the disability and loss of wellbeing from CP, Table 5–5 presents comparisons with other health conditions that, again, show CP ranking high up the list.
TABLE 5–5: CP, DISABILITY WEIGHT COMPARISONS WITH OTHER CONDITION S
Condition Weight Disseminated breast cancer* 0.790 Moderate dementia 0.630 Autism spectrum disorders 0.550 Muscular dystrophy 0.480 Cerebral palsy 0.436 Blindness 0.430 Moderate intellectual disability 0.430 Deafness 0.370 Stroke* (mild permanent impairment) 0.360 Coronary heart disease* (heart failure) 0.353 Long term skull fracture* 0.350 Multiple sclerosis (relapsing remitting) 0.330 Eating disorders* 0.280 Localised prostate cancer* 0.270 Severe asthma* 0.230 Moderate to severe ADHD 0.150 Symptomatic Grade 2 osteoarthritis* 0.140 Type I diabetes* 0.070 Type II diabetes* 0.070
Source: Mathers et al (1999). * NHPAs.
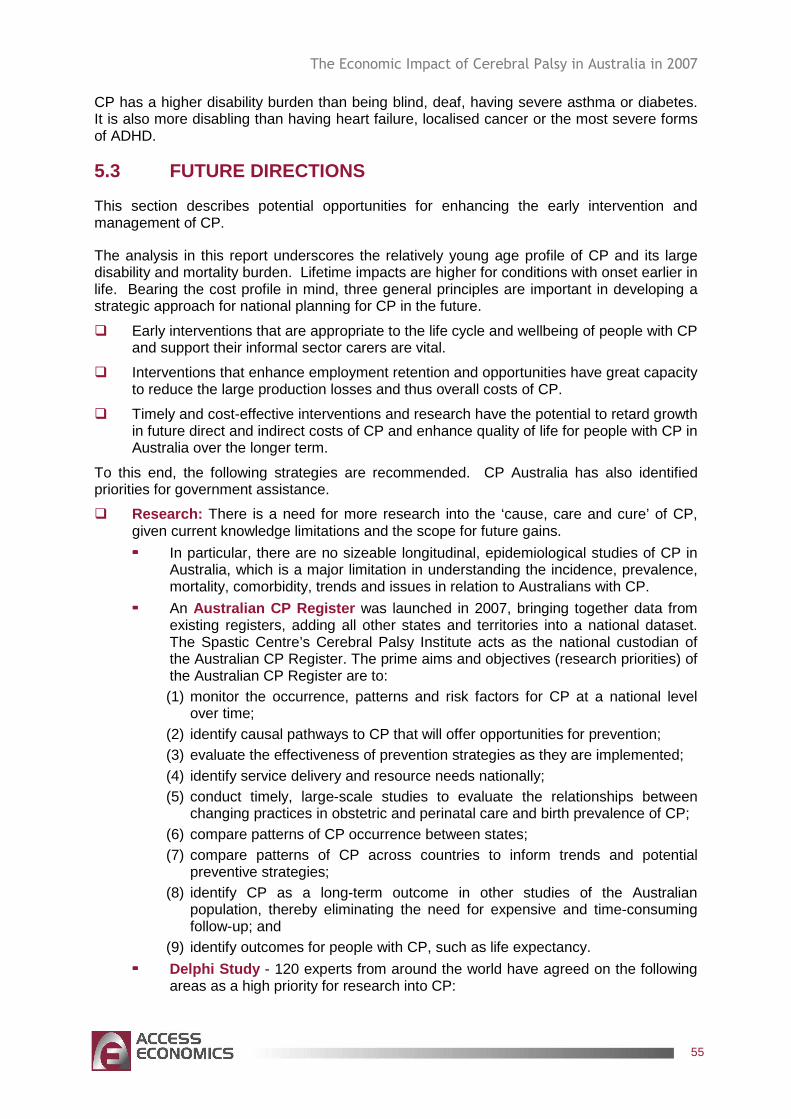
The Economic Impact of Cerebral Palsy in Australia in 2007
55
CP has a higher disability burden than being blind, deaf, having severe asthma or diabetes. It is also more disabling than having heart failure, localised cancer or the most severe forms of ADHD.
5.3 FUTURE DIRECTIONS
This section describes potential opportunities for enhancing the early intervention and management of CP.
The analysis in this report underscores the relatively young age profile of CP and its large disability and mortality burden. Lifetime impacts are higher for conditions with onset earlier in life. Bearing the cost profile in mind, three general principles are important in developing a strategic approach for national planning for CP in the future.
� Early interventions that are appropriate to the life cycle and wellbeing of people with CP and support their informal sector carers are vital.
� Interventions that enhance employment retention and opportunities have great capacity to reduce the large production losses and thus overall costs of CP.
� Timely and cost-effective interventions and research have the potential to retard growth in future direct and indirect costs of CP and enhance quality of life for people with CP in Australia over the longer term.
To this end, the following strategies are recommended. CP Australia has also identified priorities for government assistance.
� Research: There is a need for more research into the ‘cause, care and cure’ of CP, given current knowledge limitations and the scope for future gains.
���� In particular, there are no sizeable longitudinal, epidemiological studies of CP in Australia, which is a major limitation in understanding the incidence, prevalence, mortality, comorbidity, trends and issues in relation to Australians with CP.
���� An Australian CP Register was launched in 2007, bringing together data from existing registers, adding all other states and territories into a national dataset. The Spastic Centre’s Cerebral Palsy Institute acts as the national custodian of the Australian CP Register. The prime aims and objectives (research priorities) of the Australian CP Register are to: (1) monitor the occurrence, patterns and risk factors for CP at a national level
over time; (2) identify causal pathways to CP that will offer opportunities for prevention; (3) evaluate the effectiveness of prevention strategies as they are implemented; (4) identify service delivery and resource needs nationally; (5) conduct timely, large-scale studies to evaluate the relationships between
changing practices in obstetric and perinatal care and birth prevalence of CP; (6) compare patterns of CP occurrence between states; (7) compare patterns of CP across countries to inform trends and potential
preventive strategies; (8) identify CP as a long-term outcome in other studies of the Australian
population, thereby eliminating the need for expensive and time-consuming follow-up; and
(9) identify outcomes for people with CP, such as life expectancy.
���� Delphi Study - 120 experts from around the world have agreed on the following areas as a high priority for research into CP:
The Economic Impact of Cerebral Palsy in Australia in 2007
56
(1) the aetiology and prevention of CP : genetics, infection/ inflammation/ immunity, coagulation, asphyxia/ischaemia, timing of injury and brain repair possibilities; and
(2) living with CP : improving quality of life for people with CP and their families; increasing function and participation; minimising deformity; effectiveness of interventions and their long-term outcomes; most effective service models; families' role in maximising outcomes; effective personal supports.
� Diagnosis and early intervention : Diagnosis can take many months and sometimes years. Education programs to raise awareness and resourcing for peri and post-natal services as well as for mainstream primary care services and to provide support for parents and families during the diagnostic process are important. Such awareness and resourcing is fundamental to assist with earlier differential diagnosis, to reduce misdiagnosis and to reduce the long lags between onset of symptoms and diagnosis with treatment and provision of intervention services.
� Health service delivery issues : There is a need to better address the complications of CP and develop coordinated management strategies. The success of management plans overseas suggests that they should be accessible in Australia also, encompassing the full range and timing of therapy options (physical, occupation, speech and counselling/behavioural), as well as pharmacological and surgical interventions and assistive devices. Particular issues are:
���� ongoing, timely access to appropriate medications including for pain management, muscle relaxation and seizure control;
���� timely access to surgical procedures in public hospitals – in particular, minimum acceptable wait times for anatomical correction surgeries;
���� timely access to physiotherapy, counselling, orthotic and related services, including associated medical aids and equipment such as braces, through public hospital outpatient departments and other community programs; and
���� workforce training and infrastructure development to ensure service provider capacity across Australia in government, non government and private sectors in specialist and generic services.
� Employment initiatives : Employment programs to enhance employment opportunities for people with CP and other disabled Australians are a priority as skilled labour shortages worsen due to demographic ageing and other factors. It is suggested that a discrete policy focus is created within the Department of Education, Employment and Workplace Relations (covering Disability Open Employment sector and the Job Network) to develop programs aimed at retention and adaptation of existing jobs for people with CP and other chronic disabling illnesses who want to work.
���� Such programs should involve innovative strategies such as workplace environment adaptation, job restructuring or tailoring, part-time and flexible work-from-home options, and transport assistance, as appropriate.
���� Existing employer incentive schemes could be extended to include employers supporting workers with CP and other disabilities in job retention programs.
���� Education and awareness strategies should be developed to counter workplace misperceptions and discrimination against people with disabilities (including CP) and encourage employers and employees to identify and implement positive long term solutions.
� Policies to assist carers : A large proportion of people with CP are profoundly disabled and live at home with informal care provided by parents and other family members. As such, continued extension of policies to assist carers through design and delivery of enhanced support, education and respite services for the informal carers of
The Economic Impact of Cerebral Palsy in Australia in 2007
57
people with CP are essential, particularly to assist employed carers in a dignified and relevant manner that enables greater employment continuity. The Commonwealth National Respite for Carers program and State disability programs need to fund appropriate levels of shared care and respite services for carers and people with CP (and other young people with disabilities) that:
���� are lifestyle friendly, flexible and age-appropriate;
���� are available over the lifelong term of CP; and that
���� offer improved case management input to ensure good planning and packaging of services.
� Appropriate accommodation : Adults with CP may still be inappropriately accommodated in residential care facilities (nursing homes), both long term and for respite care. There is a shortage of age-appropriate day care and longer term disability housing for younger people with CP.
���� To improve efficiency and efficacy of community care programs, alternative and better coordinated models of care need to be established across the Commonwealth and State jurisdictions to result in more seamless, flexible and multidisciplinary care and accommodation services.
���� To this end, formal protocols and transfer agreements need to be struck between Commonwealth/State disability and care programs to formalise service access and continuity for people with CP and similar neurological conditions with the aim of supporting people in the community and delaying residential placement for as long as appropriate.
���� Where residential accommodation is required, it should be age-appropriate and should incorporate specific care for disease related symptoms as well as disability support. There is a need for a plan to relocate and provide alternative housing and support options for a targeted number of younger people wishing to move out of nursing homes. There is also a need to reduce further admission of younger people into nursing homes through the timely provision of flexible community service packages to ensure they are able to access choices about where they live.
���� Measures and resourcing should be built into the Commonwealth State Disability Agreement (CSDA) to specify funding responsibilities and ensure sustainable service delivery for the existing target group and those others at risk of inappropriate placement, and to make CSDA services available to younger people with CP and other disabilities currently in inappropriate accommodation.
� Enhancing outcomes through community inclusion : People with CP often need non-vocational support to undertake activities that are meaningful and that enable them to participate and contribute to the life of the community. Current service models in Australia are in transition from more segregated, group-based approaches to more individualised approaches (including individualised funding) that focus on maximising individual outcomes and achieving genuine community inclusion. This transition is in line with broader policy initiatives that recognise the enhanced health and wellbeing that can be achieved for marginalised groups through supporting the attainment of individual life goals and greater community inclusion. Further investment is needed at both a Commonwealth and State level to effectively implement individualised approaches for people with CP if these outcomes are to be achieved. There is also a need to invest in community development strategies that support communities to be more welcoming and inclusive of people with CP. These investments are likely to positively impact on the ongoing costs relating to diminished health and wellbeing for people with CP as well as further facilitating their social and economic contribution.
The Economic Impact of Cerebral Palsy in Australia in 2007
58
� Transport, aids and home modifications : People with CP and their families and carers frequently require assistance with mobility, communication and other activities of daily living. Wheelchairs, walkers and splints, ramps, showering and bathing aids are still financed largely out of pocket by people with CP and their families and carers.
���� Experience suggests a financial shortfall in funds provided by aids and equipment programs in making electric wheelchair modifications to meet the specifications recommended by Occupational Therapists. This shortfall exceeds the allocation by an average of $5,000 per wheelchair and is currently met by people with CP and their families and carers.
���� Access to the transport system and community activities can be particularly problematic for people with CP and similar disabilities. Innovative new practices could be developed and considered, such as community driver services as part of community care programs, to improve access to mainstream leisure and recreational services as well as activities of daily life (shopping, attending appointments, going to work).
� Financing reforms : Serious consideration needs to be given in the current election cycle (2007-2010) to methods for long term financing of health and disability care needs. With demographic ageing, the 2007 Second Intergenerational Report (albeit with a more positive prognosis than the first in 2002) continues to underscore the growing impact on federal budget projections of merely maintaining current levels of per capita real expenditures. With a rapidly increasing population of frail aged due to epidemiological transition and of young people with disabilities, and fewer informal carers among the Gen X and Gen Y populations together with greater propensity to live alone, the projections are likely to underestimate future needs. There is a need to act now to devise ways of channelling private sector resources more effectively to enhance care and outcomes, including through purpose specific savings programs similar to the way that Superannuation Guarantee has been introduced to enhance the adequacy of retirement incomes.
���� Government could consider less onerous and more consistent access to preserved superannuation lump sums for younger people with CP and their families and carers, potentially from age 45 or 50 years, based on individual capacity assessments.
���� Health Savings Accounts could be introduced to make adequate provision to appropriately fund the growing community needs for health, ageing and disability services.
���� Disability Trusts could be established to fund accommodation and support services through public-private partnerships.
� Disadvantaged groups: It is recommended that CP services reflect the different needs of different groups of people, with equal and improved access for people with CP and their families and carers. In particular, people who live in rural and remote regions of Australia and/or who are indigenous Australians or are from culturally and linguistically diverse backgrounds, through:
���� better and more appropriate use of smarter new technologies in diagnosis, treatment, referral and care services; and
���� specific attention to workforce development in outer metropolitan and rural locations for allied health workers capable of working with people with CP and similar neurological conditions.
The Economic Impact of Cerebral Palsy in Australia in 2007
59
REFERENCES
Access Economics (2007a) The cost of Muscular Dystrophy, Report for the Muscular Dystrophy Association, October.
Access Economics (2007b) Painful realities: the economic impact of arthritis in Australia in 2007, Report for Arthritis Australia, July.
Access Economics (2007c) Gut instincts: the economic impact of GORD and PUD, Report for The Gut Foundation, May, Canberra.
Access Economics (2005) Acting positively: strategic implications of the economic costs of multiple sclerosis in Australia, Report for Multiple Sclerosis Australia, Winter.
Access Economics (2003) Exceptional Returns: The Value of Investing in Health R&D in Australia, Report for the Australian Society of Medical Research, Canberra, <www.accesseconomics.com.au/publicationsreports/showreport.php?id=33&searchfor=2003&searchby=year>.
Australian Bureau of Statistics (2003b) Survey of Disability, Ageing and Carers, Cat No 4430.0.
Australian Bureau of Statistics (2006) Australian Historical Population Statistics, Cat No 3105.0.65.001.
Australian CP Register, McIntyre S (2006), The Australian Cerebral Palsy Register: A national collaboration – piecing together the facts on cerebral palsy.
Australian General Practice Statistics and Classification Centre (AGPSCC) (2007) Cerebral Palsy managed in General Practice: April 2000-March 2007.
Australian Government (2007) Intergenerational Report 2007, Canberra.
Australian Institute of Health and Welfare (2006) Therapy and equipment needs of people with cerebral palsy and like disabilities in Australia AIHW Cat No DIS 49, Canberra.
Australian Institute of Health and Welfare (2005) Selected chronic diseases among Australia’s children, Bulletin, Issue 29 (August 2005), Canberra.
Australian Institute of Health and Welfare (2002 and 2005) The AIHW National Mortality Database, Canberra, <http://www.aihw.gov.au/mortality/mortality_database.cfm>.
Australian Institute of Health and Welfare (2002), Australia's children: their health and wellbeing 2002, AIHW Cat. No. PHE 36, Canberra.
Bax M, Goldstein M, Rosenbaum P, Leviton A, Paneth N (2005) ‘Proposed definition and classification of cerebral palsy’ Developmental Medicine and Child Neurology, 47:571-576.
Begg S, Vos T, Barker B, Stevenson C, Stanley L, Lopez AD (2007) Burden of disease and injury in Australia 2003, AIHW PHE 82 Canberra, April.
The Economic Impact of Cerebral Palsy in Australia in 2007
60
Blair E, Watson L (2006) The epidemiology of cerebral palsy. Seminars in Fetal & Neonatal medicine, 11:117-125.
Blair E, Watson L, Badawi N, Stanley F (2001) ‘Life expectancy among people with cerebral palsy in Western Australia’ Developmental Medicine & Child Neurology 43(8):508-515.
Bureau of Transport and Regional Economics (2002) Rail accident costs in Australia, Bureau of Transport and Regional Economics, Report 108, Canberra.
Bureau of Transport Economics (2000) Road Crash Costs in Australia, Bureau of Transport Economics, Report 102, Canberra.
Centrelink Australia (2007) ‘Special data request - number of people on income support payments with cerebral palsy’, Australian Government.
Crichton JU, Mackinnon M, White CP (1994) ‘The life-expectancy of persons with cerebral palsy’ Developmental Medicine & Child Neurology;37:567–76.
Cummins R (2008) ‘Data for direct program services costs’, The Spastic Centre, March 2008.
Cutler DM, Richardson E (1998) ‘The Value of Health: 1970-1990’ American Economic Review, 88: 97-100.
Dussen L, Nieuwstraten W, Roebroeck M, Stam HJ (2001) ‘Functional level of young adults with cerebral palsy’ Clinical Rehabilitation, Vol.15, Iss.1;84.
Emond A, Golding J, Peckham C (1989) ‘Cerebral palsy in two national cohorts’ Archives of disease in Childhood, 64:848-852.
Epilepsy Association of Australia (2006) ‘Fact sheets: Basic Facts; Epilepsy and Driving Australia Guidelines’ Medical Management; Practical Management. 09/07/2006. www.epilepsy.org.au
Evans PM, Evans SJW, Alberman E (1990) ‘Cerebral palsy: why we must plan for survival’ Archives of disease in Childhood, 65:1329–33.
Hall I, Strydom A, Richards M, Hardy R, Bernal J, Wadsworth M (2005) ‘Social outcomes in adulthood of children with intellectual impairment: evidence from a birth cohort’ Journal of Intellectual Disability in Research 49(3):171-179.
Hemming K, Hutton J, Pharoah P (2006) ‘Long-tern survival for a cohort of adults with cerebral palsy’ Developmental Medicine & Child Neurology, 48:90-95.
Howard J, Soo B, Graham HK, Boyd RN, Reid S, Lanigan A, Wolfe R, Reddinhough DS (2005) ‘Cerebral palsy in Victoria: Motor types, topography and gross motor function’ Journal of Paediatric Child Health 41:479–483.
Hutton JL, Pharoah POD, Rosenbloom L (2002) ‘Effects of cognitive, motor, and sensory disabilities on survival in cerebral palsy’, Archives of disease in Childhood, 86;84-89.
Hutton JL, Colver AF, Mackie PC (2000) ‘Effect of severity of disability on survival in north east England cerebral palsy cohort’ Archives of disease in Childhood; 83:468–74.
Hutton JL, Cooke T, Pharoah POD (1994) ‘Life expectancy in children with cerebral palsy’, British Medical Journal;309:431–5.
The Economic Impact of Cerebral Palsy in Australia in 2007
61
Independent Living Centre NSW (2007) <http://www.ilcnsw.asn.au/>.
Jacobsson B, Hagberg G, (2004) ‘Antenatal risk factors for cerebral palsy’ Best Practice & Research in Clinical Obstetrics & Gynaecology, 18(3):425-436.
Knieser T, Leeth J (1991) ‘Compensating Wage Differentials for Fatal Injury Risk in Australia, Japan and the United States’ Journal of Risk and Uncertainty, 4: 75–90.
Koman LA, Paterson Smith B, Shilt JS (2004) ‘Cerebral Palsy’ The Lancet 363(15):1619-1631.
Krigger KW (2006) ‘Cerebral palsy: An overview’ American Family Physician 73(1):91-100.
Lattimore R (1997) Research and Development Fiscal Incentives in Australia: Impacts and Policy Lessons, OECD Conference on Policy Evaluation in Innovation, 26-27 June, Paris, 81:574-7.
Martin MC, Reynell JK (1965) ‘The response of children to physiotherapy’ Physiotherapy, 51:186-9.
Mathers C, Vos T, Stevenson C (1999) The burden of disease and injury in Australia, AIHW Cat No PHE17, Canberra.
Medical Benefits Schedule Online (2007), Australian Government Department of Health and Ageing <http://www.health.gov.au/internet/mbsonline/publishing.nsf/Content/Medicare-Benefits-Schedule-MBS-1>.
Michelsen SI, Uldall P, Kejs AMT, Madsen M (2005) ‘Education and employment prospects in cerebral palsy’ Developmental Medicine and Child Neurology 47:511-517.
Mikkola K, Ritari N, Tommiska V, Salokorpi T, Lehtonen L, Tammela O, Pääkkönen L, Olsen P, Korkman M, Fellman V (2005) ‘Neurodevelopmental outcome at 5 years of age of a national cohort of extremely low birth weight infants who were born in 1996-1997’ Pediatrics, 116(6):1391-400.
Miller P, Mulvey C, Norris K (1997) ‘Compensating Differentials for Risk of Death in Australia’ Economic Record, 73: 363–372.
Murphy KM, Topel R (1999) The Economic Value of Medical Research, University of Chicago Business School.
Murray C, Lopez A, Mathers C, Stein C (2001) The Global Burden of Disease 2000 Project: aims, methods & data sources, Discussion Policy Paper No 36, World Health Organization, November.
Murray C, Lopez A (1996) The Global Burden of Disease: a comprehensive assessment of mortality and disability from diseases, injuries and risk factors in 1990 and projected to 2020, Volume 1, Global Burden of Disease and Injury Series, Harvard: Harvard School of Public Health.
Mutch L, Alberman E, Hagberg B, Velickovic K, Perat M (1992) ‘Cerebral palsy epidemiology: Where are we now and where are we going?’ Developmental Medicine and Child Neurology 34:547-555.
The Economic Impact of Cerebral Palsy in Australia in 2007
62
Nelson KB (2003) ‘Can we prevent cerebral palsy?’ The New England Journal of Medicine, 349(18):1765-1769.
Odding E, Roebroeck ME, Stam HJ (2006) ‘The epidemiology of cerebral palsy: Incidence, impairments and risk factors’ Disability and Rehabilitation, 28(4):183-191.
Palisano R, Rosenbaum P, Walter S, Russell D, Wood E, Galuppi B (1997) ‘Development and reliability of a system to classify gross motor function in children with cerebral palsy’ Developmental Medicine and Child Neurology, 39(4):214-23.
Pharmacy Direct (2007) accessed 15 November 2007 <http://www.pharmacydirect.com.au/>.
Productivity Commission (2003) “Evaluation of the Pharmaceutical Industry Investment Program” Research Report, AusInfo, Canberra.
Reddihough DS, Collins KJ (2003) ‘The epidemiology and causes of cerebral palsy’ Australian Journal of Physiotherapy, 49:7-12.
Reilly S, Skuse D, Poblete X (1996) ‘Prevalence of feeding problems and oral motor dysfunction in children with cerebral palsy: a community survey’ J Pediatr 29(6):877-82.
Reyes AL, Cash AJ, Green SH, Booth IW (1993) ‘Gastrooesophageal reflux in children with cerebral palsy’ Child Care Health Dev 19(2):109-18.
Rogers B, Arvedson J, Buck G, Smart P, Michaell M (1994) ‘Characteristics of dysphagia in children with cerebral palsy’ Dysphagia 9(1):69-73.
Schelling (1968) ‘The life you save may be your own’ in SB Chase (ed) Problems in public expenditure and analysis, Brookings Institution, Washington DC, 127-162.
Stanley F, Blair E, Alberman E (2000) Cerebral palsies: Epidemiology & causal pathways Cambridge University Press: London.
Strauss D, Shavelle R (1998) ‘Life expectancy of adults with cerebral palsy’ Developmental Medicine & Child Neurology, 40(6):369-375.
Sullivan PB, Lambert B, Rose M, Ford-Adams M, Johnson A, Griffiths P (2001) ‘Prevalence and severity of feeding and nutritional problems in children with neurological impairment: Oxford Feeding Study’ Dev Med Child Neurol 43(5):358.
Surveillance of Cerebral Palsy in Europe (2000) ‘Surveillance of cerebral palsy in Europe: a collaboration of cerebral palsy surveys and registers’ Dev Med Child Neur 42:816-24.
Taylor F (2001) Cerebral palsy: hope through research, National Institute of Neurological Disorders and Stroke (US), Office of Science and Health Reports, viewed 20 August 2007, <http://www.ninds.nih.gov/disorders/cerebral_palsy/detail_cerebral_palsy.htm>.
The Spastic Centre (2007) The Spastic Centre, Sydney, viewed 20 August 2007, <http://www.thespasticcentre.org.au>.
Tseng Y, Wilkins R (2002) 'Reliance on Income Support in Australia: Prevalence and Persistence' Melbourne Institute Working Paper, No. 06/2002.
The Economic Impact of Cerebral Palsy in Australia in 2007
63
Victorian Aids and Equipment Program (2007) Department of Human Services, Victoria, <http://www.dhs.vic.gov.au/disability/supports_for_people/living_in_my_home/aids_and_equipment_program>.
Viscusi WK, Aldy JE (2002) ‘The value of a statistical life: a critical review of market estimates throughout the world’ Discussion Paper No 392, Harvard Law School, Cambridge MA. November <www.law.harvard.edu/programs /olin_center/>.
Viscusi WK (1993) ‘The Value of Risks to Life and Health’ Journal of Economic Literature 31:1912-1946.
Watson L, Stanley F, Blair E (1999) Report of the Western Australian Cerebral Palsy Register – to birth year 1994. TVW Telethon Institute for Child Health Research.
WA CP Register (2006) ‘Report of the Western Australian Cerebral Palsy Register to birth year 1999’, Western Australian Cerebral Palsy Register.
Yanney M, Marlow N (2004) ‘Paediatric consequences of fetal growth restriction’ Seminars in Fetal & Neonatal Medicine, 9(5):411-418.