Embed Size (px)
Citation preview
Association ofAmerican Medical Colleges
The Economic Impact of AAMC-Member Medical Schools and Teaching Hospitals2012
Conducted for the AAMC by Tripp Umbach
December 2012

For additional information about this publication, please contact:
Jennifer Gold [email protected]
Association of American Medical Colleges 2450 N Street, NW Washington, DC 20037-1134
©2012 Association of American Medical Colleges.
This is a publication of the Association of American Medical Colleges. The AAMC serves and leads the academic medicine community to improve the health of all. www.aamc.org.

The Economic Impact of AAMC-Member Medical Schools and Teaching Hospitals 2012
Association of American Medical Colleges
Table of ContentsExecutive Summary 1Introduction 3 Goals of the Economic Impact Study of AAMC Members 3 Methodology Employed in the Economic Impact Study 3Economic Impact Findings: Total Impact of AAMC Members, 2011 7 Business Volume Impact 7 The Direct and Indirect Expansion of the Nation’s Economy Attributable to AAMC Members 7 Total Business Volume Impact 7 Direct Spending for Capital Improvements, Goods, Supplies, and Services 9 Direct Spending by Staff Employed by AAMC Members 10 Direct Spending by AAMC-Employed and Contract Physicians and Faculty 11 Direct Spending by Residents, Medical, and Health Sciences Students 12 Direct Spending, Outside of the Medical Schools and Teaching Hospitals, by Patients from Out of State 13 Direct Spending by Out-of-State Patient Visitors 14 Direct Spending by Conference and Meeting Visitors and Visitors to Staff, Employed Physicians, Residents, and Students 15 Additional Business Impacts Allocable to AAMC Members 16 Impact on State Government Revenues 17 Revenues to the States Attributable to AAMC Members 17 Total State Government Revenue 17 Income Taxes Paid by Medical School and Hospital Staff, Employed Physicians, Independent Contractor Physicians, and Medical Residents 18 Sales Tax Revenues Received by the States 19 Corporate Net Income Tax Received by the States 20 Other Selective Business Taxes Received by the States 21 Impact on Employment 22 The Direct and Indirect Expansion of Employment Attributable to AAMC Members 22Appendix A: Definition of Terms 23Appendix B: Data Sources and Assumptions* 24Appendix C: Publicly Funded Research Tables 27Appendix D: Impact of AAMC-Member Research 28 Economic Impact of Publicly Funded Research 28 The Expansion of Research Employment Attributable to AAMC Members 29 Just the Tip of the Iceberg 29 Economic Impact of Medical Advances and Health Care Cost-Savings 30 Cancer Research Leads to Increased Longevity and Medical Cost Savings 31 Personalized Medical Advances 31 Advances in Treating Cardiovascular Disease as a Result of Research Saves Lives 32 AAMC Members’ Total Research Employment Impact in FTEs, 2009 33

Association of American Medical Colleges
The Economic Impact of AAMC-Member Medical Schools and Teaching Hospitals 2012
1
Executive SummaryIn March 2012, the AAMC (Association of American Medical Colleges) retained Tripp Umbach to measure the economic impact1 of AAMC-member institutions on the 46 individual states and the District of Columbia2 in which they are located, as well as the nation as a whole. This report presents results of the combined economic impact that AAMC members have on states, and the country as a whole. Tripp Umbach has conducted this research for the AAMC since 1995, with five economic impact studies completed to date.
During 2011, the combined economic impact of AAMC members totaled more than $587 billion.3 AAMC members accounted for nearly 3.5 million full-time jobs, meaning that one in every 40 wage earners in the U.S. labor force works either directly or indirectly for an AAMC-member institution. This is an increase in economic impact of nearly 15 percent from 2009. Health care continues to be a positive sector in national employment. Despite the national unemployment levels remaining relatively high in the last few years because of the recession, health care has been an industry segment that has continued to grow and add jobs through the last few years and is expected to rise by employing an additional 340,000 during the current year. Additionally, AAMC-member institutions generated more than $34 billion in total state tax revenue through income taxes and sales tax, corporate net income tax, and capital stock/franchise taxes produced by businesses that receive revenue from AAMC members.
AAMC-member organizations have substantial economic and social impacts on their multi-county regions and within the counties and cities where they have operations. Substantial local and regional tax impacts, while beyond the scope of this study, are estimated to be in the billions. Communities in all regions of the country typically rely on these organizations for job creation, high-quality medical care, advanced research, new business development, and education of medical professionals.
Table 1 presents total national impacts, as well as individual state totals for economic, employment, government revenue, and out-of-state medical visitor impacts for each of 24 states and the District of Columbia in which AAMC members’ total economic impact is highest.
1 For the purposes of this report, “economic impact” includes both the direct and indirect business volume generated by an institution. Direct impact includes items such as institutional spending, employee spending, and spending by visitors. The indirect impact, also known as the multiplier effect, results from the re-spending of dollars generated directly by the institution.
2 Although the AAMC does have member medical schools in Puerto Rico, those schools were not included in this research.
3 This study measures the impact of AAMC-member institutions only. The total number of medical schools included in this study is 133; and the total number of teaching hospitals is 255. There are medical schools (osteopathic) and teaching hospitals in the United States that are not members of the AAMC; therefore, the total impact of all medical schools and teaching hospitals on the nation is higher than the impact presented in this report.

Association of American Medical Colleges
The Economic Impact of AAMC-Member Medical Schools and Teaching Hospitals 2012
2
Table 1Summary of Economic, Employment, and Government Revenue Impact For AAMC Members, 2011
Note: Tables include the 24 individual states and the District of Columbia in which AAMC members’ impact is highest, plus an “all other states” total, which reflects the impact of the remaining 22 states where AAMC members are located.
Compared with the last study, which was completed in 2009, it is interesting to note that 24 of the 25 states in Table 1 remain unchanged. The top 25 individual states remain, with the exception of Alabama, which has been replaced by Washington, at number 25. Also, some states, such as California, Florida, Connecticut, Arizona, and Louisiana have moved up in the list, while others have moved back.
States Rank Total Economic Impact
Total Employment Impact
Total Government Revenue Impact
New York 1 $74,151,538,606 430,743 $4,819,032,979California 2 $49,201,512,761 264,046 $2,921,073,540Pennsylvania 3 $47,033,121,373 272,640 $2,882,702,406Massachusetts 4 $38,760,110,682 195,154 $2,234,308,702Texas 5 $35,825,649,773 228,513 $1,327,689,312Ohio 6 $32,314,079,590 209,047 $1,884,550,734Illinois 7 $28,732,944,479 155,233 $1,478,370,705Florida 8 $24,490,233,642 166,676 $1,211,629,554Michigan 9 $23,051,327,122 133,120 $1,585,794,455North Carolina 10 $17,330,838,088 120,578 $942,220,251New Jersey 11 $15,413,836,889 94,961 $1,001,558,411Maryland 12 $14,611,835,125 81,944 $861,726,043Missouri 13 $12,442,654,552 78,390 $605,050,899Georgia 14 $12,359,469,277 83,483 $554,084,789Tennessee 15 $11,959,611,610 74,553 $543,903,310Connecticut 16 $11,768,111,887 65,915 $724,790,589Minnesota 17 $10,276,917,979 65,208 $734,519,205Virginia 18 $9,794,616,363 63,145 $441,567,020Arizona 19 $9,783,041,405 51,897 $489,246,458Wisconsin 20 $9,619,603,739 44,244 $639,287,761Indiana 21 $9,030,962,138 55,456 $569,725,984South Carolina 22 $8,251,462,603 38,242 $448,599,521Louisiana 23 $7,593,762,705 42,602 $383,823,662District of Columbia 24 $7,320,921,118 49,290 $1,041,793,206Washington 25 $5,745,608,783 34,474 $309,279,038All Other States $60,429,232,449 389,881 $3,666,397,182U.S. Total $587,293,004,740 3,489,435 $34,302,725,713

Association of American Medical Colleges
The Economic Impact of AAMC-Member Medical Schools and Teaching Hospitals 2012
3
IntroductionGoals of the Economic Impact Study of AAMC Members
In 1995, the AAMC identified a need to provide benchmark data to continue to assess the status of its members’ current economic impact on states’ economies, employment, and government revenue. Specifically, Tripp Umbach was commissioned to perform research that:
• Measures the direct economic impact on individual states’ and the nation’s economy as a result of the education, research, and clinical services of AAMC-member medical schools and teaching hospitals.
• Measures the direct and indirect employment generated in the United States as a result of AAMC-member medical schools and teaching hospitals.
• Measures government revenues that are generated by the presence and operations of AAMC-member medical schools and teaching hospitals. (Medical schools and hospitals that are public and not-for-profit indirectly generate government revenue through income taxes paid by staff, employed physicians, and medical residents; sales tax revenues paid by businesses providing goods and services to medical schools and hospitals; corporate net income taxes paid by businesses providing goods and services to medical schools and hospitals; and other selective business taxes such as gross receipts taxes, public utility realty taxes, insurance premium taxes, motor vehicle taxes, and financial institutions taxes.)
• Measures the economic impact of publicly funded research, which has a significant effect on the state and local economy. In 2009, this impact was $44.9 billion.4
Methodology Employed in the Economic Impact Study
This report analyzes AAMC-member impact on the national economy. AAMC members employ individuals in their home states, and therefore, generate personal income for state residents. Businesses operating within each state in the wholesale, retail, service, and manufacturing sectors benefit from the direct expenditures of AAMC-member institutions and their staff on goods and services. In addition, businesses in each state are recipients of spending by hospital patients, patients’ visitors, medical students, and their visitors.
All of these “direct” expenditures are recirculated in the economy, as recipients of the first-round of income “re-spend” a portion of this income with other businesses and individuals within each state. This re-spending is often termed the “multiplier” or “indirect” effect. Tripp Umbach’s research has determined a medical school/teaching hospital business volume multiplier effect of 2.3. Therefore, for every dollar directly spent by a medical school or teaching hospital, an additional $1.30 is indirectly generated for a total impact of $2.30. The methodology used for this study measures the effect of both direct and indirect business volume, employment, and government revenue impacts for states containing an AAMC member.
4 “Economic Impact of Public Research Funding Received by AAMC Member Institutions,” conducted for the AAMC by Tripp Umbach, 2010.
Association of American Medical Colleges
The Economic Impact of AAMC-Member Medical Schools and Teaching Hospitals 2012
4
Not included in Tripp Umbach’s impact model is patient spending at the hospital itself, or economic benefits that result from AAMC members’ provision of community health improvement activities, preventive and primary care, access to care, and physician training. Additionally, this study does not include the impact generated by the existence of non-employed physicians with privileges at AAMC-member institutions.
The Tripp Umbach methodology generally employed in these studies was originally derived from a set of research tools and techniques developed for the American Council on Education (ACE).5 The ACE-based methodology employs linear cash flow modeling to track the flow of institution-originated funds through a delineated spatial area. Tripp Umbach modified the ACE model to accommodate the complexities of AAMC-member organizations (see Figure 1).
5 Caffrey, John and Isaacs, Herbert, Estimating the Impact of a College or University on the Local Economy, American Council on Education, 1971.

Association of American Medical Colleges
The Economic Impact of AAMC-Member Medical Schools and Teaching Hospitals 2012
5
Figure 1 AAMC-Member Economic Impact Model
AAMC-member organization
Direct spending by member for capital improvements and goods and services
Direct Employment
Total Tax Impact
Total Business Volume Impact
Total Employment Impact
Income tax payments by staff, MDs, and
residents
In-state spending by staff, MDs, students, and
residents
In-state out-of-hospital spending
by out-of-state patients
Indirect Business Tax Payments
Indirect Employment
Indirect Business Spending
In-state spending by out-of-state
visitors
Multiplier Effect
In-state out-of-medical school
spending by students

Association of American Medical Colleges
The Economic Impact of AAMC-Member Medical Schools and Teaching Hospitals 2012
6
To complete the economic impact model outlined above, Tripp Umbach researchers worked closely with representatives from the AAMC to collect the required data. The following data were used to perform this research:
1. Academic Medical Center Data
The AAMC maintains a number of databases of information necessary for the performance of the impact research. These databases were utilized to supply the following information:
• Capital budget (hospital only) • FTE faculty• Payroll expenditures (hospital only) • Outpatient visits• FTE staff (hospital only) • Inpatient admissions• FTE physician employees • Medical students• FTE residents and interns • Research grants and contracts• FTE contract physicians • Clinical fellows• Faculty payroll
For data needed for the impact study, but not supplied by the AAMC, Tripp Umbach used extrapolations derived from recently performed Tripp Umbach impact studies. Tripp Umbach has found that such extrapolation-based models provide an acceptably accurate measure of economic impact.6 For some sources, the most recent data represented 2010 information rather than 2011 information. To help ensure the comparability of information, the 2010 data were aged by one year, assuming a 3 percent growth rate for inflation.
2. Tripp Umbach Impact Study Data
Using secondary research and the company’s national database of medical school and teaching hospital information (constructed from medical schools and teaching hospitals that have completed individual economic impact studies with Tripp Umbach7), Tripp Umbach supplied additional data to supplement those supplied by the AAMC. Data provided by Tripp Umbach included the following:
• Capital budget (medical schools only) • Employee spending• Goods and services spending • Physician spending• Payroll expenditures (medical schools only) • Government revenue data• FTE staff (medical schools only) • Business multiplier• Visitor spending • Employment multiplier
6 In the Pennsylvania Medical Centers of Excellence study cited in this report, models were built for more than 25 individual teaching hospitals. Two hospitals supplied data late for the study and extrapolation-based models were built. When the hospitals’ actual completed data forms arrived, the data were entered into the model and the overall results obtained by the extrapolations were found to be within +/-5 percent of actual.
7 Tripp Umbach has completed more than 100 economic impact studies for various medical schools and teaching hospitals over the last 20 years; more than 20 of these studies were conducted within the last two years.

Association of American Medical Colleges
The Economic Impact of AAMC-Member Medical Schools and Teaching Hospitals 2012
7
Economic Impact Findings: Total Impact of AAMC Members, 2011Business Volume Impact
The Direct and Indirect Expansion of the Nation’s Economy Attributable to AAMC Members
Direct economic impact stems from the spending of AAMC medical school and teaching hospital members. These impacts fall within seven principal groups: institutional expenditures for capital improvements, goods, and services; spending of employees; spending of independent contractor physicians; spending of medical residents; spending of medical and other health sciences students; spending of patients (external to the hospital); and spending of visitors. In addition, these direct, first-round expenditures, received as income by businesses and individuals in the state, recirculate through the economy in successive rounds of re-spending. The end result is a multiplied economic impact that is a linear result of AAMC members’ presence and their spending patterns.
The results of this analysis include:
Total Business Volume Impact
In 2011, AAMC medical school and teaching hospital members had a combined total economic impact on the United States of $587,293,004,740. This economic impact comprised $255,344,784,670 in direct business volume impact, and a further $331,948,220,070 in indirect economic impacts accruing to the economy through the multiplier.
Table 2 lists the business volume impact (economic impact) for the country and each of the 24 states and the District of Columbia in which AAMC members’ total economic impact is highest.

Association of American Medical Colleges
The Economic Impact of AAMC-Member Medical Schools and Teaching Hospitals 2012
8
Table 2Total State Business Volume Impact of AAMC-Member Institutions, 2011
Note: Tables include the 24 individual states and the District of Columbia in which AAMC members’ impact is highest, plus an “all other states” total, which reflects the impact of the remaining 22 states where AAMC members are located.
States Rank Total Economic Impact
Direct Economic Impact
Indirect Economic Impact
New York 1 $74,151,538,606 $32,239,799,394 $41,911,739,212 California 2 $49,201,512,761 $21,391,962,070 $27,809,550,691 Pennsylvania 3 $47,033,121,373 $20,449,183,206 $26,583,938,168 Massachusetts 4 $38,760,110,682 $16,852,222,036 $21,907,888,646 Texas 5 $35,825,649,773 $15,576,369,466 $20,249,280,306 Ohio 6 $32,314,079,590 $14,049,599,822 $18,264,479,768 Illinois 7 $28,732,944,479 $12,492,584,556 $16,240,359,923 Florida 8 $24,490,233,642 $10,647,927,670 $13,842,305,971 Michigan 9 $23,051,327,122 $10,022,316,140 $13,029,010,982 North Carolina 10 $17,330,838,088 $7,535,146,995 $9,795,691,093 New Jersey 11 $15,413,836,889 $6,701,668,213 $8,712,168,676 Maryland 12 $14,611,835,125 $6,352,971,794 $8,258,863,332 Missouri 13 $12,442,654,552 $5,409,849,805 $7,032,804,747 Georgia 14 $12,359,469,277 $5,373,682,295 $6,985,786,983 Tennessee 15 $11,959,611,610 $5,199,831,135 $6,759,780,475 Connecticut 16 $11,768,111,887 $5,116,570,386 $6,651,541,502 Minnesota 17 $10,276,917,979 $4,468,225,208 $5,808,692,771 Virginia 18 $9,794,616,363 $4,258,528,853 $5,536,087,510 Arizona 19 $9,783,041,405 $4,253,496,263 $5,529,545,142 Wisconsin 20 $9,619,603,739 $4,182,436,408 $5,437,167,331 Indiana 21 $9,030,962,138 $3,926,505,277 $5,104,456,861 South Carolina 22 $8,251,462,603 $3,587,592,436 $4,663,870,167 Lousiana 23 $7,593,762,705 $3,301,635,959 $4,292,126,746 District of Columbia 24 $7,320,921,118 $3,183,009,182 $4,137,911,936 Washington 25 $5,745,608,783 $2,498,090,775 $3,247,518,008 All others $5,330,993,496 $2,317,823,259 $3,013,170,237 U.S. Total $587,293,004,740 $255,344,784,670 $331,948,220,070

Association of American Medical Colleges
The Economic Impact of AAMC-Member Medical Schools and Teaching Hospitals 2012
9
The direct impact comprised the following impact components:
Direct spending for capital improvements, goods, supplies, and services
This category of impact includes the spending by AAMC members for improvements to their facilities and capital equipment purchases. In addition, the category includes the purchase of goods, services, and supplies. These may include a broad range of purchases such as laundry services, food and beverage supplies, drugs, medical disposables, computer consulting, etc. AAMC medical school and teaching hospital members’ spending for capital improvements, goods, supplies, and services totaled $156,641,725,585 in 2011.
Table 3 lists the top 24 state and District of Columbia totals.
Table 3AAMC Members’ State Spending for Capital Improvements, Goods, Supplies, and Services 2011
Note: Tables include the 24 individual states and the District of Columbia in which AAMC members’ impact is highest, plus an “all other states” total, which reflects the impact of the remaining 22 states where AAMC members are located.
States Rank Direct Spending for Capital Improvements
New York 1 $18,611,084,621California 2 $13,467,801,741Pennsylvania 3 $13,411,412,738Massachusetts 4 $10,294,962,931Texas 5 $9,778,233,811Ohio 6 $8,577,873,046Illinois 7 $7,744,330,977Florida 8 $6,619,119,559Michigan 9 $6,358,864,160North Carolina 10 $4,667,185,021Maryland 11 $3,944,179,636New Jersey 12 $3,775,995,940Georgia 13 $3,415,362,687Missouri 14 $3,308,107,757Tennessee 15 $3,172,892,025Connecticut 16 $2,975,887,449Wisconsin 17 $2,822,783,234Arizona 18 $2,807,001,095South Carolina 19 $2,478,130,338Indiana 20 $2,454,010,610Virginia 21 $2,426,643,263Minnesota 22 $2,371,621,869Louisiana 23 $2,233,180,064District of Columbia 24 $1,713,902,194Alabama 25 $1,548,272,759All Other States $15,662,886,064U.S. Total $156,641,725,585
Association of American Medical Colleges
The Economic Impact of AAMC-Member Medical Schools and Teaching Hospitals 2012
10
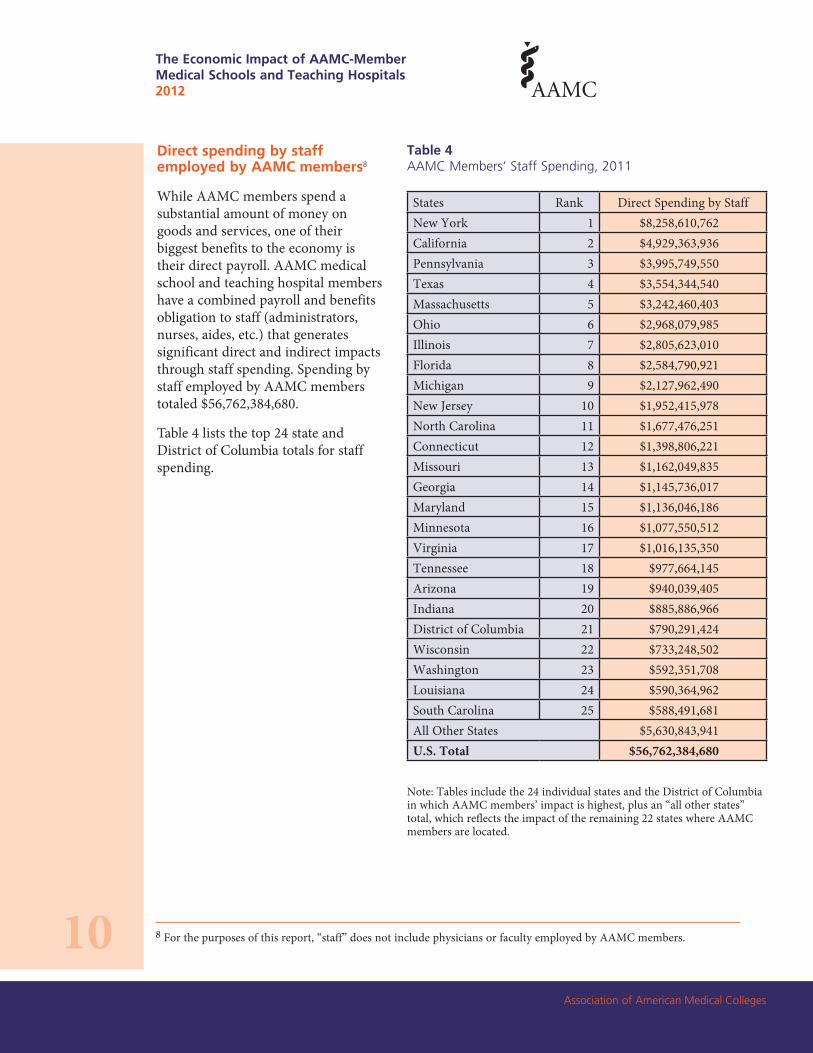
Direct spending by staff employed by AAMC members8
While AAMC members spend a substantial amount of money on goods and services, one of their biggest benefits to the economy is their direct payroll. AAMC medical school and teaching hospital members have a combined payroll and benefits obligation to staff (administrators, nurses, aides, etc.) that generates significant direct and indirect impacts through staff spending. Spending by staff employed by AAMC members totaled $56,762,384,680.
Table 4 lists the top 24 state and District of Columbia totals for staff spending.
Table 4AAMC Members’ Staff Spending, 2011
8 For the purposes of this report, “staff” does not include physicians or faculty employed by AAMC members.
Note: Tables include the 24 individual states and the District of Columbia in which AAMC members’ impact is highest, plus an “all other states” total, which reflects the impact of the remaining 22 states where AAMC members are located.
States Rank Direct Spending by StaffNew York 1 $8,258,610,762California 2 $4,929,363,936Pennsylvania 3 $3,995,749,550Texas 4 $3,554,344,540Massachusetts 5 $3,242,460,403Ohio 6 $2,968,079,985Illinois 7 $2,805,623,010Florida 8 $2,584,790,921Michigan 9 $2,127,962,490New Jersey 10 $1,952,415,978North Carolina 11 $1,677,476,251Connecticut 12 $1,398,806,221Missouri 13 $1,162,049,835Georgia 14 $1,145,736,017Maryland 15 $1,136,046,186Minnesota 16 $1,077,550,512Virginia 17 $1,016,135,350Tennessee 18 $977,664,145Arizona 19 $940,039,405Indiana 20 $885,886,966District of Columbia 21 $790,291,424Wisconsin 22 $733,248,502Washington 23 $592,351,708Louisiana 24 $590,364,962South Carolina 25 $588,491,681All Other States $5,630,843,941U.S. Total $56,762,384,680

Association of American Medical Colleges
The Economic Impact of AAMC-Member Medical Schools and Teaching Hospitals 2012
11
Direct spending by AAMC-employed and contract physicians and faculty
As with payroll to general staff, the pay provided to physicians directly employed by or contracted with AAMC members has a substantial positive impact on the economy through physician spending. Adjustments were made to include only the impact of income received by employed and contract physicians as a result of the services provided at AAMC-member hospitals. Spending by AAMC-employed and contract physicians totaled $19,558,429,338.
Table 5 lists the top 24 state and District of Columbia totals for physician and faculty spending.
Table 5AAMC Members’ Physician (Employed and Contract) and Faculty Spending, 2011
Note: Tables include the 24 individual states and the District of Columbia in which AAMC members’ impact is highest, plus an “all other states” total, which reflects the impact of the remaining 22 states where AAMC members are located.
States Rank Direct Spending by Physicians/Faculty
New York 1 $2,532,402,729Massachusetts 2 $2,067,306,692Pennsylvania 3 $1,357,968,755California 4 $1,318,027,150Ohio 5 $1,193,981,802Texas 6 $927,048,899Illinois 7 $819,098,314Maryland 8 $763,882,659Michigan 9 $670,931,456Minnesota 10 $624,259,616Tennessee 11 $541,271,799Florida 12 $517,707,519North Carolina 13 $458,175,148Missouri 14 $401,318,581Virginia 15 $371,813,746District of Columbia 16 $347,589,439New Jersey 17 $333,211,943Wisconsin 18 $327,541,775Georgia 19 $323,290,015Washington 20 $276,876,885Oregon 21 $276,331,545Connecticut 22 $270,249,402Colorado 23 $263,522,362South Carolina 24 $233,566,592Indiana 25 $230,324,234All Other States $2,110,730,280U.S. Total $19,558,429,338

Association of American Medical Colleges
The Economic Impact of AAMC-Member Medical Schools and Teaching Hospitals 2012
12
Direct spending by residents, medical, and health sciences students
As institutions of excellence in research, medical, and health sciences education, AAMC members attract students from inside and outside the United States to study at their schools and hospitals. Spending by residents and students for housing, food, supplies, entertainment, and other items and services comprise their direct impact on the nation’s economy. Only resident and student spending that is made off campus is included in the impact calculations. Spending by residents and students totaled $4,742,208,916.
Table 6 lists the top 24 state and District of Columbia totals for resident/student spending.
Table 6AAMC Members’ Resident and Student Spending, 2011
Note: Tables include the 24 individual states and the District of Columbia in which AAMC members’ impact is highest, plus an “all other states” total, which reflects the impact of the remaining 22 states where AAMC members are located.
States Rank Direct Spending by Resident/Student
New York 1 $712,307,897California 2 $375,317,087Pennsylvania 3 $347,421,101Illinois 4 $271,516,702Massachusetts 5 $257,881,954Ohio 6 $249,035,276Texas 7 $178,708,836North Carolina 8 $168,886,806Michigan 9 $168,719,500Missouri 10 $138,449,557Florida 11 $128,997,165Connecticut 12 $127,786,780New Jersey 13 $127,401,385Virginia 14 $112,525,891Tennessee 15 $109,988,676Georgia 16 $88,376,216Maryland 17 $86,864,900District of Columbia 18 $79,963,184South Carolina 19 $77,885,794Indiana 20 $68,896,171Wisconsin 21 $64,230,421Kentucky 22 $61,801,308Rhode Island 23 $60,378,050Louisiana 24 $59,984,951Minnesota 25 $58,420,993All Other States $560,462,317U.S. Total $4,742,208,916

Association of American Medical Colleges
The Economic Impact of AAMC-Member Medical Schools and Teaching Hospitals 2012
13
Direct spending, outside of the medical schools and teaching hospitals, by patients from out of state
Spending by patients for medical services is not included in the direct impact. Only the spending of these patients (both inpatients and outpatients) outside of AAMC members is included. Spending outside of AAMC-member institutions by patients totaled $1,388,774,251.
Table 7 lists the top 24 state and District of Columbia totals for out-of-state patient spending.
Table 7AAMC Members’ Out-of-State Patient Spending, 2011
Note: Tables include the 24 individual states and the District of Columbia in which AAMC members’ impact is highest, plus an “all other states” total, which reflects the impact of the remaining 22 states where AAMC members are located.
States Rank Out-of-State Patient Spending
New York 1 $142,722,420California 2 $108,330,759Texas 3 $98,249,812Pennsylvania 4 $96,551,627Ohio 5 $96,115,252Illinois 6 $91,714,600Michigan 7 $78,226,235Massachusetts 8 $75,236,995New Jersey 9 $53,488,463Louisiana 10 $42,962,453Florida 11 $38,412,820North Carolina 12 $34,915,287Indiana 13 $33,256,896Missouri 14 $32,050,287Tennessee 15 $29,664,389Virginia 16 $28,629,268Connecticut 17 $28,231,608Minnesota 18 $22,091,957Maryland 19 $20,275,777Georgia 20 $20,173,808Wisconsin 21 $20,088,197Arizona 22 $19,739,992South Carolina 23 $17,840,146Washington 24 $14,771,970District of Columbia 25 $13,157,603All Other States $131,875,631U.S. Total $1,388,774,251
Association of American Medical Colleges
The Economic Impact of AAMC-Member Medical Schools and Teaching Hospitals 2012
14
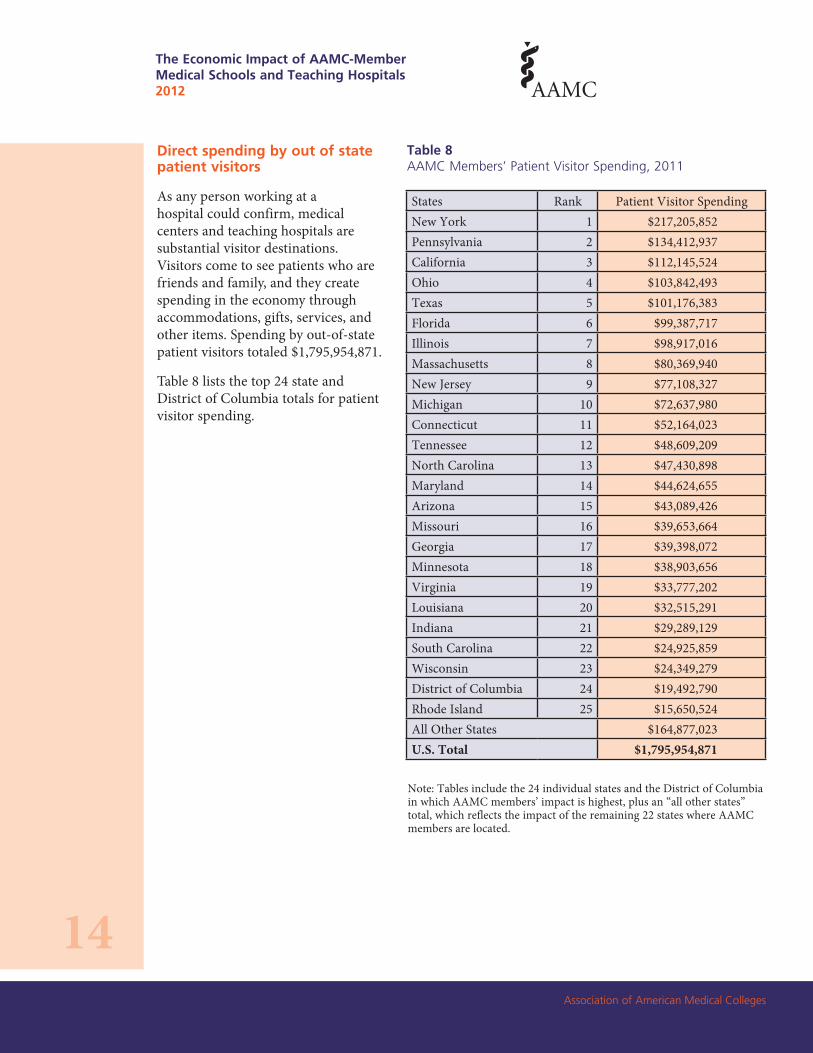
Direct spending by out of state patient visitors
As any person working at a hospital could confirm, medical centers and teaching hospitals are substantial visitor destinations. Visitors come to see patients who are friends and family, and they create spending in the economy through accommodations, gifts, services, and other items. Spending by out-of-state patient visitors totaled $1,795,954,871.
Table 8 lists the top 24 state and District of Columbia totals for patient visitor spending.
Table 8AAMC Members’ Patient Visitor Spending, 2011
Note: Tables include the 24 individual states and the District of Columbia in which AAMC members’ impact is highest, plus an “all other states” total, which reflects the impact of the remaining 22 states where AAMC members are located.
States Rank Patient Visitor Spending New York 1 $217,205,852Pennsylvania 2 $134,412,937California 3 $112,145,524Ohio 4 $103,842,493Texas 5 $101,176,383Florida 6 $99,387,717Illinois 7 $98,917,016Massachusetts 8 $80,369,940New Jersey 9 $77,108,327Michigan 10 $72,637,980Connecticut 11 $52,164,023Tennessee 12 $48,609,209North Carolina 13 $47,430,898Maryland 14 $44,624,655Arizona 15 $43,089,426Missouri 16 $39,653,664Georgia 17 $39,398,072Minnesota 18 $38,903,656Virginia 19 $33,777,202Louisiana 20 $32,515,291Indiana 21 $29,289,129South Carolina 22 $24,925,859Wisconsin 23 $24,349,279District of Columbia 24 $19,492,790Rhode Island 25 $15,650,524All Other States $164,877,023U.S. Total $1,795,954,871

Association of American Medical Colleges
The Economic Impact of AAMC-Member Medical Schools and Teaching Hospitals 2012
15
Direct spending by conference and meeting visitors and visitors to staff, employed physicians, residents, and students
AAMC members are major sponsors of meetings, seminars, and symposiums in the state. These events draw significant numbers of delegates, who, like delegates to other conferences and trade shows, provide a major boost to the economy through their fresh influx of dollars. In addition to the conference delegates, the hospital physicians, employees, and students also attract substantial numbers of visitors. Spending by all of these visitors totaled $14,477,178,148.
Table 9 details the top 24 state and District of Columbia totals for AAMC members’ conference and meeting visitors and visitors to staff, employed physicians, residents, and students.
Table 9Spending by Visitors to AAMC Members’ Conferences, Staff, Physicians, Residents, and Students, 2011
Note: Tables include the 24 individual states and the District of Columbia in which AAMC members’ impact is highest, plus an “all other states” total, which reflects the impact of the remaining 22 states where AAMC members are located.
States Rank Spending by Visitors to Conference
New York 1 $1,765,465,112Pennsylvania 2 $1,105,666,498California 3 $1,080,975,874Texas 4 $938,607,186Ohio 5 $860,671,969Massachusetts 6 $834,003,121Illinois 7 $661,383,938Florida 8 $659,511,970Michigan 9 $544,974,318North Carolina 10 $481,077,583New Jersey 11 $382,046,177Maryland 12 $357,097,980Georgia 13 $341,345,479Missouri 14 $328,220,124Tennessee 15 $319,740,893Minnesota 16 $275,376,606Virginia 17 $269,004,133Connecticut 18 $263,444,903Indiana 19 $224,841,272District of Columbia 20 $218,612,548Arizona 21 $206,327,803Wisconsin 22 $190,195,000Louisiana 23 $186,091,411South Carolina 24 $166,752,027Washington 25 $150,090,729All Other States $1,665,653,494U.S. Total $14,477,178,148

Association of American Medical Colleges
The Economic Impact of AAMC-Member Medical Schools and Teaching Hospitals 2012
16
Additional business impacts allocable to AAMC members
In addition to the annual, recurring impacts of the spending categories outlined above, businesses in the country have invested heavily to support the business volume generated by AAMC members. The Tripp Umbach impact model calculates the two principal components of business investments: business real property development and business inventories committed to academic medical center-related business. Table 10 includes the top 24 state and District of Columbia totals for AAMC members’ real property investments and business inventories.
Table 10AAMC Members’ Business Real Property Investments and Business Inventories, 2011
Note: Tables include the 24 individual states and the District of Columbia in which AAMC members’ impact is highest, plus an “all other states” total, which reflects the impact of the remaining 22 states where AAMC members are located.
States Rank Business Real Property Investments Business Inventories New York 1 $10,974,427,714 $9,194,790,787California 2 $7,281,823,889 $6,100,987,582Pennsylvania 3 $6,960,901,963 $5,832,107,050Massachusetts 4 $5,736,496,381 $4,806,253,725Texas 5 $5,302,196,166 $4,442,380,572Ohio 6 $4,782,483,779 $4,006,945,869Illinois 7 $4,252,475,783 $3,562,885,115Florida 8 $3,624,554,579 $3,036,788,972Michigan 9 $3,411,596,414 $2,858,364,563North Carolina 10 $2,564,964,037 $2,149,023,923New Jersey 11 $2,281,247,860 $1,911,315,774Maryland 12 $2,162,551,599 $1,811,867,556Missouri 13 $1,841,512,874 $1,542,889,165Georgia 14 $1,829,201,453 $1,532,574,190Tennessee 15 $1,770,022,518 $1,482,991,840Connecticut 16 $1,741,680,559 $1,459,245,874Minnesota 17 $1,520,983,861 $1,274,337,829Virginia 18 $1,449,603,222 $1,214,532,429Arizona 19 $1,447,890,128 $1,213,097,134Wisconsin 20 $1,423,701,353 $1,192,830,864Indiana 21 $1,336,582,396 $1,119,839,305South Carolina 22 $1,221,216,465 $1,023,181,363Louisiana 23 $1,123,876,880 $941,626,575District of Columbia 24 $1,083,496,326 $907,794,219Washington 25 $850,350,100 $712,455,489All Other States $8,943,526,402 $7,493,224,824U.S. Total $86,919,364,702 $72,824,332,588
Association of American Medical Colleges
The Economic Impact of AAMC-Member Medical Schools and Teaching Hospitals 2012
17
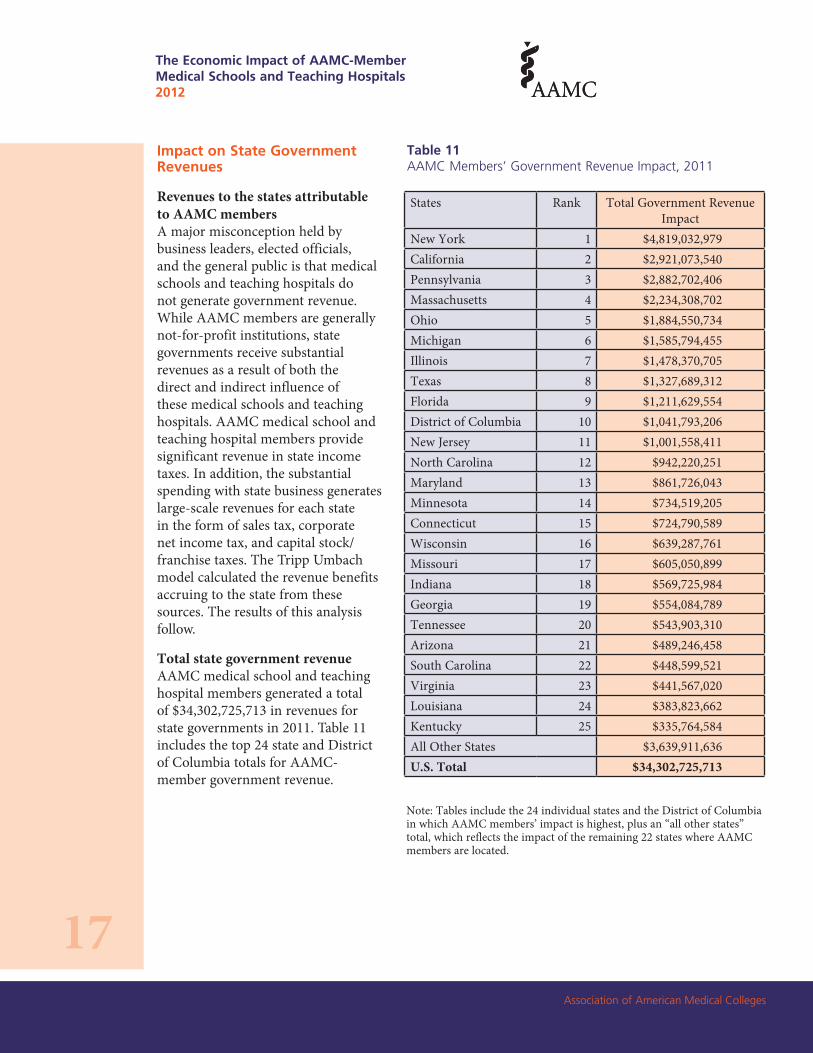
Impact on State Government Revenues
Revenues to the states attributable to AAMC members A major misconception held by business leaders, elected officials, and the general public is that medical schools and teaching hospitals do not generate government revenue. While AAMC members are generally not-for-profit institutions, state governments receive substantial revenues as a result of both the direct and indirect influence of these medical schools and teaching hospitals. AAMC medical school and teaching hospital members provide significant revenue in state income taxes. In addition, the substantial spending with state business generates large-scale revenues for each state in the form of sales tax, corporate net income tax, and capital stock/franchise taxes. The Tripp Umbach model calculated the revenue benefits accruing to the state from these sources. The results of this analysis follow.
Total state government revenue AAMC medical school and teaching hospital members generated a total of $34,302,725,713 in revenues for state governments in 2011. Table 11 includes the top 24 state and District of Columbia totals for AAMC-member government revenue.
Table 11AAMC Members’ Government Revenue Impact, 2011
Note: Tables include the 24 individual states and the District of Columbia in which AAMC members’ impact is highest, plus an “all other states” total, which reflects the impact of the remaining 22 states where AAMC members are located.
States Rank Total Government Revenue Impact
New York 1 $4,819,032,979California 2 $2,921,073,540Pennsylvania 3 $2,882,702,406Massachusetts 4 $2,234,308,702Ohio 5 $1,884,550,734Michigan 6 $1,585,794,455Illinois 7 $1,478,370,705Texas 8 $1,327,689,312Florida 9 $1,211,629,554District of Columbia 10 $1,041,793,206New Jersey 11 $1,001,558,411North Carolina 12 $942,220,251Maryland 13 $861,726,043Minnesota 14 $734,519,205Connecticut 15 $724,790,589Wisconsin 16 $639,287,761Missouri 17 $605,050,899Indiana 18 $569,725,984Georgia 19 $554,084,789Tennessee 20 $543,903,310Arizona 21 $489,246,458South Carolina 22 $448,599,521Virginia 23 $441,567,020Louisiana 24 $383,823,662Kentucky 25 $335,764,584All Other States $3,639,911,636U.S. Total $34,302,725,713

Association of American Medical Colleges
The Economic Impact of AAMC-Member Medical Schools and Teaching Hospitals 2012
18
These revenues comprise the following:
Income taxes paid by medical school and hospital staff, employed physicians, independent contractor physicians, and medical residents
The state income tax payments of personnel employed by the medical centers and teaching hospitals and the independent contractor physicians (on the portion of their income attributable to AAMC members) generates substantial revenue for each state. Income tax revenues totaled $12,578,369,120.
Table 12 includes the top 24 state and District of Columbia totals for AAMC-member income taxes.
Table 12Individual Income Tax Revenues Generated by AAMC Members’ Employees, 2011
States Rank Individual Income Tax Revenue Generated
New York 1 $2,741,554,555California 2 $1,282,747,031Massachusetts 3 $1,202,139,389Pennsylvania 4 $915,510,963Ohio 5 $654,937,054Illinois 6 $464,344,767North Carolina 7 $438,863,202Michigan 8 $408,106,052New Jersey 9 $392,859,097Maryland 10 $365,211,631Connecticut 11 $334,336,683Minnesota 12 $297,385,812Missouri 13 $280,234,953Georgia 14 $268,847,613District of Columbia 15 $268,437,258Wisconsin 16 $264,223,412Virginia 17 $244,463,118South Carolina 18 $165,201,217Indiana 19 $164,927,768Kentucky 20 $114,279,456Arizona 21 $113,178,769Louisiana 22 $110,634,401Rhode Island 23 $110,165,301Oregon 24 $99,830,645Iowa 25 $98,712,697All Other States $777,236,265U.S. Total $12,578,369,120
Note: Tables include the 24 individual states and the District of Columbia in which AAMC members’ impact is highest, plus an “all other states” total, which reflects the impact of the remaining 22 states where AAMC members are located.

Association of American Medical Colleges
The Economic Impact of AAMC-Member Medical Schools and Teaching Hospitals 2012
19
Sales tax revenues received by the states
As noted above, AAMC members generate substantial sales for businesses in the state. This spending also generates sales and other consumption tax revenue in the state. Sales tax revenues totaled $15,854,821,740.
Table 13 shows the top 24 state and District of Columbia totals for AAMC members’ sales and gross receipts tax revenues.
Table 13Sales and Gross Receipts Tax Revenues Generated by AAMC Members’ Spending, 2011
States Rank Sales/Gross Receipts Tax Revenues Generated
New York 1 $1,506,099,306Pennsylvania 2 $1,447,181,616California 3 $1,052,126,045Texas 4 $1,037,085,263Florida 5 $1,019,387,688Ohio 6 $956,003,126Michigan 7 $871,306,185Illinois 8 $794,513,401Massachusetts 9 $693,329,211New Jersey 10 $431,988,930Tennessee 11 $417,083,024North Carolina 12 $387,212,930Maryland 13 $350,817,642Indiana 14 $338,613,255Connecticut 15 $323,409,007Minnesota 16 $315,114,847Arizona 17 $294,861,823Wisconsin 18 $294,146,103District of Columbia 19 $290,853,774Missouri 20 $270,094,856Washington 21 $247,135,868Georgia 22 $241,276,171South Carolina 23 $239,572,605Louisiana 24 $195,747,027Kentucky 25 $160,760,421All Other States $1,679,101,605U.S. Total $15,854,821,740
Note: Tables include the 24 individual states and the District of Columbia in which AAMC members’ impact is highest, plus an “all other states” total, which reflects the impact of the remaining 22 states where AAMC members are located.

Association of American Medical Colleges
The Economic Impact of AAMC-Member Medical Schools and Teaching Hospitals 2012
20
Corporate net income tax received by the states
The business volume generated by AAMC members and their related spending is received as revenue by a broad range of businesses in the states. This revenue, in the case of corporations, generates corporate net income tax receipts for individual states. Corporate net income tax revenues totaled $1,906,714,634.
Table 14 includes the top 24 state and District of Columbia totals for AAMC-member corporate net income taxes.
Table 14Corporate Net Income Tax Generated by AAMC Members’ Spending, 2011
States Rank Corporate Net Income TaxNew York 1 $329,497,999California 2 $275,765,967Massachusetts 3 $202,969,610Pennsylvania 4 $166,851,980New Jersey 5 $88,323,343Illinois 6 $86,096,063Florida 7 $69,405,474Michigan 8 $49,003,377Tennessee 9 $42,553,570Maryland 10 $42,225,055North Carolina 11 $41,380,379Ohio 12 $41,024,330District of Columbia 13 $38,034,757Minnesota 14 $33,344,262Indiana 15 $32,076,458Wisconsin 16 $29,066,457Connecticut 17 $26,467,950New Hampshire 18 $26,274,449Arizona 19 $26,020,738Georgia 20 $23,941,620Louisiana 21 $23,045,565West Virginia 22 $20,313,581Alabama 23 $17,867,549Virginia 24 $16,843,480Missouri 25 $16,365,777All Other States $141,954,832U.S. Total $1,906,714,634
Note: Tables include the 24 individual states and the District of Columbia in which AAMC members’ impact is highest, plus an “all other states” total, which reflects the impact of the remaining 22 states where AAMC members are located.
Association of American Medical Colleges
The Economic Impact of AAMC-Member Medical Schools and Teaching Hospitals 2012
21
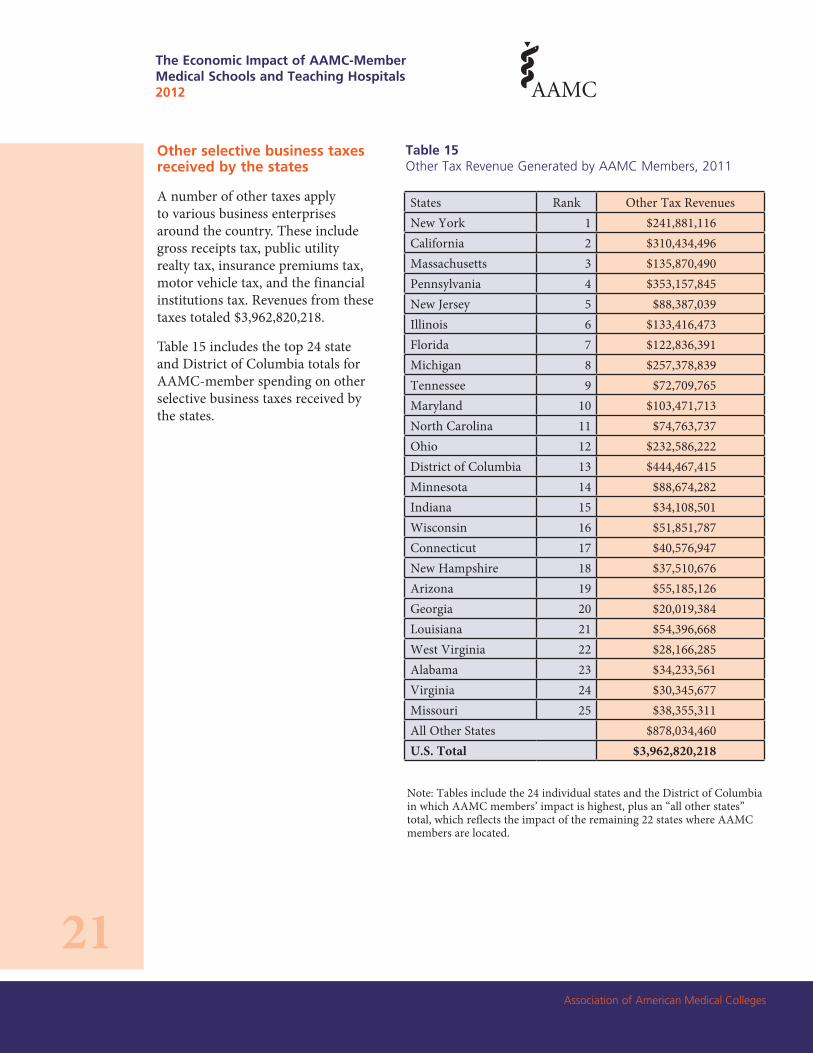
Other selective business taxes received by the states
A number of other taxes apply to various business enterprises around the country. These include gross receipts tax, public utility realty tax, insurance premiums tax, motor vehicle tax, and the financial institutions tax. Revenues from these taxes totaled $3,962,820,218.
Table 15 includes the top 24 state and District of Columbia totals for AAMC-member spending on other selective business taxes received by the states.
Table 15Other Tax Revenue Generated by AAMC Members, 2011
States Rank Other Tax RevenuesNew York 1 $241,881,116California 2 $310,434,496Massachusetts 3 $135,870,490Pennsylvania 4 $353,157,845New Jersey 5 $88,387,039Illinois 6 $133,416,473Florida 7 $122,836,391Michigan 8 $257,378,839Tennessee 9 $72,709,765Maryland 10 $103,471,713North Carolina 11 $74,763,737Ohio 12 $232,586,222District of Columbia 13 $444,467,415Minnesota 14 $88,674,282Indiana 15 $34,108,501Wisconsin 16 $51,851,787Connecticut 17 $40,576,947New Hampshire 18 $37,510,676Arizona 19 $55,185,126Georgia 20 $20,019,384Louisiana 21 $54,396,668West Virginia 22 $28,166,285Alabama 23 $34,233,561Virginia 24 $30,345,677Missouri 25 $38,355,311All Other States $878,034,460U.S. Total $3,962,820,218
Note: Tables include the 24 individual states and the District of Columbia in which AAMC members’ impact is highest, plus an “all other states” total, which reflects the impact of the remaining 22 states where AAMC members are located.

Association of American Medical Colleges
The Economic Impact of AAMC-Member Medical Schools and Teaching Hospitals 2012
22
Impact on Employment
The direct and indirect expansion of employment attributable to AAMC members
Perhaps the benefit that comes closest to home is the sheer number of United States citizens who depend on AAMC members, either directly or indirectly, for their jobs and livelihoods. A total of 3,489,435 jobs in the United States in 2011 were directly or indirectly attributable to AAMC members.
Even on a direct employment basis (i.e., only counting those directly paid by AAMC members such as regular staff, faculty, independent contractors, or residents receiving training), AAMC members are responsible for a substantial component of national employment. During 2011, AAMC members employed a total of 1,938,575 full-time equivalent (FTE) people. This includes staff, physician employees, and independent physician contractors. It also includes residents who are paid a stipend while they continue their graduate medical education.
While direct employment is significant, the actual extent of employment impact on the state stemming from AAMC members is considerably larger. The business volume generated by AAMC members creates jobs in a broad range of sectors throughout the nation’s economy. These jobs are proportionate to the need to service the AAMC members themselves and their related populations (staff, physicians, students, etc.). In addition, the tax revenues generated at the state and local levels by AAMC members and their business volume also create government employment opportunities.
Table 16 includes the top 24 state and District of Columbia totals for AAMC employment impact.
Table 16AAMC Members’ Total Employment Impact in FTEs, 2011
States Rank Total Employment Impact New York 1 430,743 Pennsylvania 2 272,640 California 3 264,046 Texas 4 228,513 Ohio 5 209,047 Massachusetts 6 195,154 Florida 7 166,676 Illinois 8 155,233 Michigan 9 133,120 North Carolina 10 120,578 New Jersey 11 94,961 Georgia 12 83,483 Maryland 13 81,944 Missouri 14 78,390 Tennessee 15 74,553 Connecticut 16 65,915 Minnesota 17 65,208 Virginia 18 63,145 Indiana 19 55,456 Arizona 20 51,897 District of Columbia 21 49,290 Wisconsin 22 44,244 Louisiana 23 42,602 South Carolina 24 38,242 Washington 25 34,474 All Other States 389,881 U.S. Total 3,489,435
Note: Tables include the 24 individual states and the District of Columbia in which AAMC members’ impact is highest, plus an “all other states” total, which reflects the impact of the remaining 22 states where AAMC members are located.

Association of American Medical Colleges
The Economic Impact of AAMC-Member Medical Schools and Teaching Hospitals 2012
23
Appendix A: Definition of Terms
Direct Employment Total employees based on full-time equivalents (FTEs)
Direct Tax Payments Direct tax payments made by an institution to a unit of government
Indirect Employment The additional jobs created as a result of the institution’s economic impact. Local companies that provide goods and services to an institution increase their number of employees as purchasing increases, creating an employment multiplier.
Indirect Tax Payments Government revenue that is collected by governmental units in addition to those paid directly by an institution, including taxes paid directly by employees of the institution, visitors to the institution, and vendors who sell products to the institution.
Multiplier Effect The additional economic impact created as a result of the institution’s direct economic impact. Local companies that provide goods and services to an institution increase their purchasing, creating a multiplier.
Total Business Volume Total sales receipts generated within a given geographic area. Business volume includes wholesale, retail, and service sector spending, as well as value-added in the manufacturing process.
Total Economic Impact The total economic impact of an institution includes both the direct economic impact and the indirect economic impact generated in the economy as a result of the direct impact. Direct impact includes items such as institutional spending, employee spending, and spending by visitors to the institution. Indirect economic impact, also known as the multiplier effect, includes the re-spending of dollars within the local economy.
Research Commercialization Research can be commercialized in a number of ways. In all cases, though, it typically involves defining the nature of the research being commercialized, for instance, in a patent or intellectual property agreement, establishing a commercial relationship with another party such as in a sale or license, and negotiating a contract, or specifically, the details of compensation.

Association of American Medical Colleges
The Economic Impact of AAMC-Member Medical Schools and Teaching Hospitals 2012
24
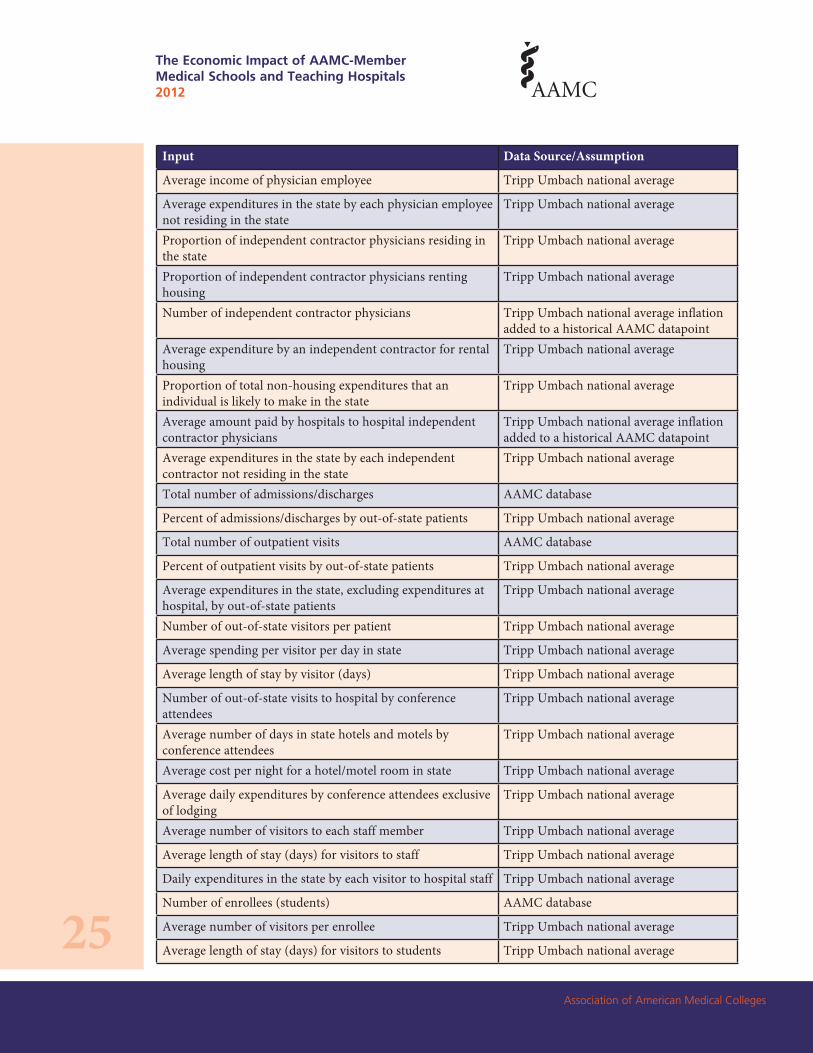
Appendix B: Data Sources and Assumptions*
Input Data Source/Assumption
Total economic impact business volume multiplier Standard state multiplier as recommended by the American Council on Education
Capital account expenditures AAMC database for hospital expenditures Tripp Umbach national average rate for medical school expenditures based on the hospital and medical school budget
Spending on goods, services, and supplies, (non-capital account and non-payroll expenditures)
Tripp Umbach national average rate for medical school and hospital expenditures based on hospital and medical school budgets
Proportion of staff renting housing Tripp Umbach national average
Percent of staff residing in the state Tripp Umbach national average
Number of staff AAMC database for hospital staffing Tripp Umbach national average rate for medical school staffing
Average expenditure by a staff member for rental housing
Tripp Umbach national average
Proportion of the staff residing in the state Tripp Umbach national average
Proportion of total non-housing expenditures that an individual is likely to make in the state
Tripp Umbach national average
Total institution-related income of staff AAMC database for hospital expenditures Tripp Umbach national average rate for medical school expenditures
Proportion of a consumer's total expenditures spent on non-housing items
Tripp Umbach national average
Proportion of the staff not residing in the state Tripp Umbach national average
Average expenditures in the state by each staff person not residing in the state
Tripp Umbach national average
Proportion of physician employees residing in the state
Tripp Umbach national average
Proportion of physician employees renting housing Tripp Umbach national average
Number of physician employees AAMC database
Average expenditure by a physician employee for rental housing
Tripp Umbach national average
Association of American Medical Colleges
The Economic Impact of AAMC-Member Medical Schools and Teaching Hospitals 2012
25
Input Data Source/Assumption
Average income of physician employee Tripp Umbach national average
Average expenditures in the state by each physician employee not residing in the state
Tripp Umbach national average
Proportion of independent contractor physicians residing in the state
Tripp Umbach national average
Proportion of independent contractor physicians renting housing
Tripp Umbach national average
Number of independent contractor physicians Tripp Umbach national average inflation added to a historical AAMC datapoint
Average expenditure by an independent contractor for rental housing
Tripp Umbach national average
Proportion of total non-housing expenditures that an individual is likely to make in the state
Tripp Umbach national average
Average amount paid by hospitals to hospital independent contractor physicians
Tripp Umbach national average inflation added to a historical AAMC datapoint
Average expenditures in the state by each independent contractor not residing in the state
Tripp Umbach national average
Total number of admissions/discharges AAMC database
Percent of admissions/discharges by out-of-state patients Tripp Umbach national average
Total number of outpatient visits AAMC database
Percent of outpatient visits by out-of-state patients Tripp Umbach national average
Average expenditures in the state, excluding expenditures at hospital, by out-of-state patients
Tripp Umbach national average
Number of out-of-state visitors per patient Tripp Umbach national average
Average spending per visitor per day in state Tripp Umbach national average
Average length of stay by visitor (days) Tripp Umbach national average
Number of out-of-state visits to hospital by conference attendees
Tripp Umbach national average
Average number of days in state hotels and motels by conference attendees
Tripp Umbach national average
Average cost per night for a hotel/motel room in state Tripp Umbach national average
Average daily expenditures by conference attendees exclusive of lodging
Tripp Umbach national average
Average number of visitors to each staff member Tripp Umbach national average
Average length of stay (days) for visitors to staff Tripp Umbach national average
Daily expenditures in the state by each visitor to hospital staff Tripp Umbach national average
Number of enrollees (students) AAMC database
Average number of visitors per enrollee Tripp Umbach national average
Average length of stay (days) for visitors to students Tripp Umbach national average

Association of American Medical Colleges
The Economic Impact of AAMC-Member Medical Schools and Teaching Hospitals 2012
26
Input Data Source/Assumption
Daily expenditures in the state by each visitor to students Tripp Umbach national average
Total number of medical residents AAMC database
Average number of out-of-state visitors to each resident Tripp Umbach national average
Average length of stay (days) for visitors to medical residents Tripp Umbach national average
Daily expenditures in the state by each visitor to residents Tripp Umbach national average
Average number of visitors per physician Tripp Umbach national average
Average length of stay (days) for visitors to physician employees
Tripp Umbach national average
Daily expenditures in the state by each visitor to physician employees
Tripp Umbach national average
Number of visits to hospital independent contractor physicians
Tripp Umbach national average
Average length of stay (days) for visitors to physician inde-pendent contractors
Tripp Umbach national average
Daily expenditures in the state by each visitor to independent contractor physicians
Tripp Umbach national average
Proportion of medical school enrollees from in the state AAMC database
Proportion of students living in medical-hospital housing Tripp Umbach national average
Average non-housing expenditures made in the state by medical students
Tripp Umbach national average
Proportion of students living off-campus Tripp Umbach national average
Average cost of off-campus rent Tripp Umbach national average
Proportion of medical residents renting housing in the state Tripp Umbach national average
Average expenditure by a medical resident for rental housing Tripp Umbach national average
Proportion of medical residents residing in the state Tripp Umbach national average
Average income of a medical resident allocable to the medical school/hospital
AAMC database
Average expenditures in the state by each medical resident not residing in the state
Tripp Umbach national average
State business volume U.S. Bureau of Economic Analysis
Sales and gross receipt taxes received by the state U.S. Census Data
Individual income taxes received by the state U.S. Census Data
Corporate net income taxes received by the state U.S. Census Data
Other taxes received by the state U.S. Census Data
*Tripp Umbach’s national averages are derived from surveys conducted with faculty at medical colleges and teaching hospitals. Some of the AAMC data were from the previous study and appropriate increases were applied for the 2011 research.

Association of American Medical Colleges
The Economic Impact of AAMC-Member Medical Schools and Teaching Hospitals 2012
27
Appendix C: Publicly Funded Research TablesTotal State Business Volume Impact of Publicly Funded Research Conducted at AAMC- Member Institutions, 2009
Note: Tables include the 24 individual states and the District of Columbia in which AAMC members’ impact is highest, plus an “all other states” total, which reflects the impact of the remaining 22 states where AAMC members are located.
States Rank Total Economic Impact
Direct Economic Impact
Indirect Economic Impact
California 1 $5,360,125,905 $2,061,586,886 $3,298,539,018 Massachusetts 2 $4,666,938,397 $1,794,976,306 $2,871,962,090 New York 3 $4,532,330,490 $1,743,204,035 $2,789,126,455 Pennsylvania 4 $2,892,439,702 $1,112,476,808 $1,779,962,893 Texas 5 $2,496,576,899 $960,221,884 $1,536,355,014 North Carolina 6 $2,158,422,741 $830,162,593 $1,328,260,148 Ohio 7 $2,045,422,508 $786,700,965 $1,258,721,543 Maryland 8 $1,785,291,194 $686,650,459 $1,098,640,734 Washington 9 $1,777,062,201 $683,485,462 $1,093,576,739 Illinois 10 $1,599,980,668 $615,377,180 $984,603,488 Missouri 11 $1,159,651,627 $446,019,857 $713,631,771 Michigan 12 $1,115,569,675 $429,065,259 $686,504,415 Connecticut 13 $1,044,055,338 $401,559,745 $642,495,593 Tennessee 14 $987,400,090 $379,769,265 $607,630,824 Minnesota 15 $944,632,296 $363,320,114 $581,312,182 Georgia 16 $936,334,559 $360,128,677 $576,205,883 Florida 17 $853,058,512 $328,099,428 $524,959,085 Wisconsin 18 $801,488,179 $308,264,684 $493,223,495 Virginia 19 $714,777,147 $274,914,287 $439,862,860 Colorado 20 $710,221,195 $273,161,998 $437,059,197 Oregon 21 $606,657,791 $233,329,920 $373,327,871 Alabama 22 $597,519,638 $229,815,245 $367,704,392 District of Columbia 23 $507,709,004 $195,272,694 $312,436,310 Rhode Island 24 $411,336,816 $158,206,468 $253,130,348 Iowa 25 $407,826,860 $156,856,485 $250,970,375 All Other States $3,834,500,328 $1,474,807,818 $2,359,692,509 U.S. Total $44,947,329,758 $17,287,434,522 $27,659,895,236

Association of American Medical Colleges
The Economic Impact of AAMC-Member Medical Schools and Teaching Hospitals 2012
28
9 DeBakey, Michael E., “Medical Centers of Excellence and Health Reform,” Science, Vol. 262 (22 October, 1993), pp. 523-525.
10 Ibid.
11 For this report, Tripp Umbach utilized the RIMS II multiplier for industry code 541700 on scientific research and development services on the national level. This multiplier was used to measure the impact on the U.S. economy and not on each individual state.
12 Association of American Medical Colleges, “The Economic Impact of Medical Research on the U.S. Economy,” May 2011.
Appendix D: Impact of AAMC-Member ResearchWhile previous Tripp Umbach studies of AAMC members did not cover the impact of medical research, this report examines the impact of the publicly funded research conducted by AAMC-member medical schools and teaching hospitals. As noted in Science,9 “Periodic bursts in medical knowledge have always been tied to the intensity of attention and support for research. The explosion of new medical knowledge during the past three decades, emanating largely from the research in the medical centers of excellence [AAMC members], has achieved prodigious progress in controlling many disabling and even fatal diseases.” Investment in medical center-based research in the United States has brought immeasurable gains in identifying, curing, and preventing disease and alleviating the suffering of millions worldwide. Such research has provided cures and treatments for diphtheria, tetanus, pertussis, poliomyelitis, and other infectious diseases; significantly improved survival rates for heart disease, cancer, stroke, and diabetes; and developed life-saving equipment and techniques, such as the heart-lung machine, arterial substitutes for diseased arteries, transplantation of organs, diagnosis imaging machines, and genetic engineering techniques.10
The economic impact of medical research on the U.S. economy is an important and timely topic as the federal government, in the current climate of budget struggles, contemplates cutting funding to the National Institutes of Health (NIH) and other federal research programs. Additionally, medical research funding is in danger of experiencing cuts at the state budget level. In 2009, research funding at the national and state level received by medical schools and teaching hospitals added more than $44.9 billion to the U.S. economy annually,11 and supported nearly 300,000 full-time, high-paying jobs—or more than one in every 500 jobs.12
Economic Impact of Publicly Funded Research
Direct economic impact stems from the spending by AAMC medical school and teaching hospital members from federal and state funds allocated for research. In addition, these direct, first-round expenditures, received as income by businesses and individuals in the state, re-circulate through the economy in successive rounds of re-spending. The end result is a multiplied economic impact that is a linear result of AAMC members’ presence and their research spending patterns.
Nationwide, the economic impact generated by state and federal funding for research consists of nearly $17.3 billion in direct spending, and an additional $27.6 billion in indirect economic impacts accruing to the economy through the re-spending by AAMC vendors, suppliers, staff, researchers, and visitors.

Association of American Medical Colleges
The Economic Impact of AAMC-Member Medical Schools and Teaching Hospitals 2012
29
The Expansion of Research Employment Attributable to AAMC Members
The research operations of AAMC members create a significant number of jobs, both directly and indirectly, in a multitude of industry segments within their state of operation, as well as the nation. A total of 299,649 jobs in the United States in 2009 were directly or indirectly attributable to AAMC-member research derived from federal and state sources.
While reviewing the total employment impact, it is important to note that this is more than merely the number of individuals engaged in the support of research efforts, such as faculty, postdoctoral students, graduate students, residents and fellows, and technical and administrative support staff who are paid directly through the research funding of AAMC members. These mostly high-skilled jobs are significant to the economy because of the higher wages that tend to be paid, in addition to the benefits provided to those who are employed in these positions.
While the number of direct employees is significant, the true measure of the employment impact on the state and the nation stemming from AAMC members’ research is significantly larger. The operational impact generated by AAMC members as a result of their research enterprise sustains jobs in a wide variety of industries throughout the U.S. economy. These indirect jobs, including staff, physicians, researchers, students, supply purchases, capital construction projects, etc., are created in industries that support the research enterprise of the member institutions. Finally, the research operations of AAMC-member institutions generate tax revenues at the state and local levels.
Appendix C includes tables listing the total economic and employment impacts generated at the national and state levels by state and federal funding for research in the top 24 states and the District of Columbia with AAMC-member medical schools and teaching hospitals.
Just the Tip of the Iceberg
While impressive, these economic impact and employment data are the tip of the iceberg, as they represent only the spending of research dollars received by medical schools and teaching hospitals from federal and state sources as they ripple through the U.S. economy. Not included in Tripp Umbach’s impact model are those economic impacts of the medical school and teaching hospital research missions that are more difficult to measure. The economic impact resulting from commercial application and cost-savings to society from medical progress is many times higher than operational impacts. The size of these additional downstream economic and employment benefits demands further study and more accurate and ongoing quantification. Previous studies by Tripp Umbach and others suggest that these additional measures (outputs) may be as high as seven times greater than operational impacts (inputs).13 Currently, we are unable to measure the evidence of programs and services that lead to measurable societal cost-savings as a result of discovery and bringing research to market. It is also important to note that these impacts are in addition to the operational impacts described in the initial sections of this report.
13 Cost Savings Resulting from NIH Research Support, NIH Publication No. 93. Silverstein, H.H. Garrison and S.J. Heinig, 1995.
Association of American Medical Colleges
The Economic Impact of AAMC-Member Medical Schools and Teaching Hospitals 2012
30
14 Kirschner, Marc W., Marincola, Elizabeth, and Teisberg, Elizabeth Olmstead, “The Role of Biomedical Research in Health Care Reform,” Science, October 7, 1994.
15 U.S. Congressional Record – House, H5268. Appropriations Committee, Labor, Health and Human Services, Education, and Related Agencies Subcommittee; Rep. John Porter (R-IL). June 28, 1994.
16 Kirschner, Marc W., op. cit.
17 U.S. Health Care Costs Background Brief. www.http://www.kaiseredu.org/en/Issue-Modules/US-Health-Care-Costs/Background-Brief.aspx.
18 The Benefits of Medical Research and the Role of the NIH. Office of the Chairman, Connie Mack http://jec.senate.gov. May 2000.
At the time of publication, it is not possible to fully quantify the total cost savings as a result of research discovery and bringing research to market. However, the narrative below seeks to highlight a few examples of how research is transforming modern health care and having an impact on the bottom-line, while at the same time improving the health of the nation’s citizens.
Economic Impact of Medical Advances and Health Care Cost-Savings
These research-led advances in medicine have a positive impact not only on human health and quality of life; they also have substantial economic advantages. A historical study14 conducted by the Centers for Disease Control and Prevention estimates that the polio vaccine averted $30 billion per year in treatment costs for the disease. Further, were it not for the tuberculosis vaccine, the American health care system would continue to incur the costs of long-term care for 250,000 patients, without improving their health. Other such cost-savings include an estimated $145 billion of savings in hospitalization costs in less than 25 years as a result of the discovery of lithium treatment for manic depression; $400 million to $870 million annually in savings as a result of potassium citrate treatment for the prevention of kidney stone recurrence; and $350 million to $450 million annually in savings as a result of a new vaccine developed to prevent haemophilus influenzae Type B disease, the leading cause of bacterial meningitis in the United States (not to mention the number of deaths and cases of neurological damage among infants and children averted by this vaccine).15
Some critics have argued that biomedical research is expensive. However, while biomedical innovation often begins with relatively expensive, invasive treatments or therapies, continued research has often led to highly cost-effective prevention via vaccines. According to Kirschner et al., the typical progression of biomedical innovation is such that “an incurable and expensive disease is initially treated with invasive surgery, then by progressively effective drug therapy, and finally by an inexpensive cure or vaccine. It would have been a mistake to freeze the process of discovery at an expensive intermediate stage by not investing in the next discovery.”16
Addressing this growing burden of rising health expenditures continues to be a major policy priority. Health expenditures in the United States approached $2.6 trillion in 2010, more than 10 times the $256 billion spent in 1980.17 Chronic disease is the main driver of mortality in the United States, and the costs to the U.S. economy both directly and indirectly are staggering. According to a study completed by the NIH,18 the economic costs of illness in the United States are approximately $3 trillion annually, representing 31 percent of the nation’s GDP. This includes “direct” costs of public and private health care spending of $1.3 trillion, and “indirect” illness costs from reduced
Association of American Medical Colleges
The Economic Impact of AAMC-Member Medical Schools and Teaching Hospitals 2012
31
ability to work and premature death of $1.7 trillion.19 The importance of advancing the science of medicine through research cannot be understated. In addition to reducing the direct costs of care, medical advances cut illness costs by reducing lost economic output from disability and premature death. Through these medical advances, the United States has made considerable gains in health and longevity. A major driver behind this progress has been medical research.
By extending the life and improving the health of the patient, medical research generates value, while simultaneously lowering the economic costs of illness (both directly and indirectly). U.S. citizens are living almost 30 years longer than they did in 1900. These gains in longevity have enhanced the lives of individuals and families, and have added an estimated $3.2 trillion annually to the U.S. economy since 1970. Moreover, people are staying active longer, which helps to improve overall health. The proportion of older people with chronic disabilities has dropped by nearly one-third in the last 25 years.20
Major health advances achieved through research have had an impact on the lives of many patients suffering from chronic diseases. Medical advances through research have reduced the prevalence of many acute conditions and increased life expectancy. These medical advances save lives and money.
Cancer Research Leads to Increased Longevity and Medical Cost-Savings U.S. cancer death rates are currently decreasing by approximately one percent annually. Each one percent decline in the death rate saves about $500 billion. In addition, tremendous progress treating childhood cancers, such as acute lymphocytic leukemia, has resulted in the five-year survival rate reaching 90 percent.21
Personalized Medical Advances Personalized medicine in the treatment of breast cancer allows patients to avoid unnecessary chemotherapy while reducing costs in the overall health care system. Previously, women diagnosed with breast cancer and negative lymph nodes faced a difficult decision regarding follow-up treatment with chemotherapy. NIH studies have shown that following a lumpectomy and radiation, most women are cured of the disease, but a small percentage are not; thus many women choose the chemotherapy route to improve their cure rate. As a result of the Human Genome Project, molecular testing of the breast cancer cells, using a gene-based diagnostic tool makes it possible to see which genes are turned on or off in an individual tumor, thereby helping women decide if they need chemotherapy. The pattern of gene activity allows prediction of the chance of recurrence at high accuracy. According to the NIH, this genomic test will be utilized by approximately 50,000 women annually and a large percentage will be found not to need chemotherapy. As a result of this medical advancement, women will avoid unnecessary chemotherapy, and the U.S. health care system will be spared $100 million in costs.22
19 Ibid.
20 Cost Savings Resulting from NIH Research Support, NIH Publication No. 93. Silverstein, H.H. Garrison and S.J. Heinig, 1995.
21 http://www.nih.gov/about/impact/health.htm.
22 Examples of NIH Research Advances and Economic Benefits: Advances Related to Genomics. October 21, 2011. http://www.nih.gov/about/director/10212011_advances.pdf.

Association of American Medical Colleges
The Economic Impact of AAMC-Member Medical Schools and Teaching Hospitals 2012
32
23 Statins Remain Cost-Effective, Not Cost Saving. November 26, 2011. http://managinghealth carecosts.blogspot.com/2011/11/statins-remain-cost-effective-not-cost.html.
24 The quality-adjusted life year (QALY) is a measure of disease burden, including both the quality and the quantity of life lived. It is used in assessing the value for money of a medical intervention. The QALY model requires utility inde-pendent, risk neutral, and constant proportional tradeoff behavior. The QALY is based on the number of years of life that would be added by the intervention. Each year in perfect health is assigned the value of 1.0 down to a value of 0.0 for death. If the extra years would not be lived in full health, for example if the patient would lose a limb, or be blind or have to use a wheelchair, then the extra life-years are given a value between 0 and 1 to account for this.
25 Statins Remain Cost-Effective, Not Cost Saving. November 26, 2011. http://managinghealth carecosts.blogspot.com/2011/11/statins-remain-cost-effective-not-cost.html.
26 Ibid.
Advances in Treating Cardiovascular Disease as a Result of Research Saves Lives Advances against the biggest killer of Americans, cardiovascular disease, further illustrates the benefits of medical research. The death rate from cardiovascular disease and stroke has fallen by more than 60 percent in the last 50 years. In part, the decline is the result of advances in medical technology.23
Statins are enormously effective drugs that, coupled with a decrease in cigarette smoking, have been responsible for a huge decrease in the incidence of cardiac death, especially in young men. Statins have been effective at lowering mortality since 1994. Statins have proven to be a cost-effective medication in the treatment of cardiovascular disease. The availability of generic medication has reduced the cost of statins to consumers, allowing more affordable access to treatment. Findings of a study conducted by Harvard University show that the cost of a Quality-Adjusted Life Year (QALY)24 for a 55-year-old man with a 5 percent 10-year risk of a heart attack was nearly $170,000.25 The cost to save lives with specific statins is quite modest in many instances, especially over the longer time periods. For example, it cost only $6,600 dollars for each QALY for a 55 year-old man at a 30 percent risk for a vascular event over a 10-year period. As a result of statins, positive health outcomes are achieved at a reasonable cost.26
Research and medical advances are key to containing medical costs and improving the quality of life for patients. Continuing to invest in research and quantifying the impact of advances is critical to demonstrating the value of research. It is important to note that while the studies above serve to highlight the financial benefits of medical research, the detailed measurement of the economic impact of medical research requires specialized research tools and long-term temporal studies that are significantly beyond the scope of the research performed here.

Association of American Medical Colleges
The Economic Impact of AAMC-Member Medical Schools and Teaching Hospitals 2012
33
AAMC Members’ Total Research Employment Impact in FTEs, 2009
Note: Tables include the 24 individual states and the District of Columbia in which AAMC members’ impact is highest, plus an “all other states” total, which reflects the impact of the remaining 22 states where AAMC members are located.
States Rank Total Employment ImpactCalifornia 1 35,734 Massachusetts 2 31,113 New York 3 30,216 Pennsylvania 4 19,283 Texas 5 16,644 North Carolina 6 14,389 Ohio 7 13,636 Maryland 8 11,902 Washington 9 11,847 Illinois 10 10,667 Missouri 11 7,731 Michigan 12 7,437 Connecticut 13 6,960 Tennessee 14 6,583 Minnesota 15 6,298 Georgia 16 6,242 Florida 17 5,687 Wisconsin 18 5,343 Virginia 19 4,765 Colorado 20 4,735 Oregon 21 4,044 Alabama 22 3,983 District of Columbia 23 3,385 Rhode Island 24 2,742 Iowa 25 2,719 All Other States 25,563 U.S. Total 299,648

Association ofAmerican Medical Colleges2450 N Street, N.W., Washington, D.C. 20037-1127 T 202 828 0400 F 202 828 1125 www.aamc.org