Embed Size (px)
Citation preview
Research Report
The Economic Footprint of Selected Pharmaceutical
Companies in Europe
Authors:
Nora Albu, Marc Mecke, Dr. Dennis A. Ostwald, Katharina Zubrzycki
WifOR Berlin
Joseph-Haydn-Straße 1
10557 Berlin
Germany
Phone +49 30 232 566 6-50
Telefax +49 30 232 566 6-951
Email [email protected]
Web www.wifor.com
Berlin, October 2016

II © WifOR 2016
WifOR does not engage in research for advertising, sales promotion, or endorsement of our clients’
interests including raising investment capital or recommending investment decisions or for any use in
litigation.
This report was prepared by WifOR for efpia. WifOR endeavors at all times to produce work of the
highest quality, consistent with our contract commitments. Because of the research nature of this work
the client undertakes the sole responsibility for the consequence of any use or misuse of, or inability to
use, any information or result obtained from WifOR. WifOR and its employees have no legal liability for
the accuracy, adequacy, or efficacy thereof.
III © WifOR 2016
Table of Contents
List of Figures ........................................................................................................................ V
List of Tables ........................................................................................................................ VI
List of Abbreviations and Acronyms ..................................................................................... VII
List of Symbols ................................................................................................................... VIII
Abstract ................................................................................................................................. X
1. Introduction .....................................................................................................................1
2. Data and Facts about the European Pharmaceutical Industry .........................................3
3. Study Design ...................................................................................................................6
3.1 Project Scope ...........................................................................................................6
3.2 Stand Alone Characteristics .....................................................................................8
4. Results of the Economic Footprint Analysis in Europe .....................................................9
4.1 Powering Growth ....................................................................................................11
4.2 Driving Employment ...............................................................................................12
4.3 Investing in Innovation ............................................................................................14
4.3.1 Investment Intensity Measure ..........................................................................14
4.3.2 Efficiency Measure ..........................................................................................16
4.3.3 Productivity Measure .......................................................................................17
5. Conclusion ....................................................................................................................19
5.1 Key Results ............................................................................................................19
5.2 Further Research ...................................................................................................21
6. Methodology and Database of the Economic Footprint..................................................22
6.1 The company-specific European Satellite Account .................................................22
6.1.1 Participating Companies .................................................................................22
6.1.2 Types of Business Entities ..............................................................................22
6.1.3 Time Period .....................................................................................................22
6.1.4 Data Collection Process ..................................................................................22
6.1.5 Input-Output Table ..........................................................................................24
6.1.6 Compilation of the Company-Specific European Satellite Account ..................24
6.2 The Group-Specific European Satellite Account .....................................................27
6.2.1 Database for the Group-Specific European Satellite Account ..........................27
6.2.2 Direct Economic Effects ..................................................................................27
6.2.3 The Input-Output Analysis ...............................................................................29

IV © WifOR 2016
6.2.4 The calculation of Indirect and Induced Economic Effects ...............................30
6.3 Further Economic Indicators of the Economic Footprint..........................................31
7. Appendix A: Glossary ....................................................................................................32
8. Appendix B: The Calculation Model of the Direct and Spillover Effects ..........................34
9. Appendix C: Results of the Economic Footprint Analysis of Selected Companies .. XXXIX
10. References ............................................................................................................. XLII
V © WifOR 2016
List of Figures
Figure 1: Summary of the Worldwide Paradigm Shift in the Healthcare Sector .......................2
Figure 2: Key Facts about the Global Pharmaceutical Industry in 2013 ..................................3
Figure 3: Gross Value Added and Employment of the Pharmaceutical Industry by
Continent, 2013, in billion Euro and number of persons ..............................................4
Figure 4: Regional Allocation of Commissioned Deep Dives in the EU ...................................6
Figure 5: Allocation of Deep Dives and Countries with Further Data Deliveries on the
Selected Companies ...................................................................................................7
Figure 6: Share of Selected Companies on EU28 Pharmaceutical Industry’s Direct
GVA ............................................................................................................................8
Figure 7: Most Important Supplier Industries in 2014 ............................................................10
Figure 8: Objectives of Economic Policy ...............................................................................10
Figure 9: Developments of Gross Value Added Effects of Selected efpia Companies ..........12
Figure 10: Comparison of Total GVA Multipliers in the EU28 Area .......................................12
Figure 11: Development of Employment Effects of Selected efpia Companies .....................13
Figure 12: Comparison of Total Employment Multipliers in the EU28 Area ...........................14
Figure 13: Comparison of Internal R&D Intensities ...............................................................15
Figure 14: Comparison of Internal R&D Intensities between Industries.................................15
Figure 15: Development of GVA Rate and its Determining Factors ......................................16
Figure 16: Comparison of GVA Rates in the EU28 Area .......................................................17
Figure 17: Development of Labour Productivity and its Determining Factors ........................17
Figure 18: Comparison of Labour Productivities in the EU28 Area .......................................18
Figure 19: Key Results at a Glance ......................................................................................19
Figure 20: WifOR’s Reference Book on Additional Fields of Research .................................21
Figure 21: Subset of Official National Questionnaires ...........................................................23
Figure 22: Illustration of the Company-Specific European Satellite Account .........................26
Figure 23: Schematic Illustration of the Satellite Account .....................................................27
Figure 24: Calculation of Direct Economic Effects ................................................................28
Figure 25: Illustration of the Significance of Gross Value Added and Revenue .....................29
Figure 26: Architecture of Input-Output Tables .....................................................................30
Figure 27: Schematic Explanation of Direct and Spillover Effects .........................................31
Figure 28: Causality Regarding Investigation of the Indirect Effects .....................................35
Figure 29: Causality Regarding Investigation of the Induced Effects ....................................36
VI © WifOR 2016
List of Tables
Table 1: Key Results of Selected Pharmaceutical Companies in Europe................................9
Table 2: Direct, Spillover and Total Economic Effects of Selected Pharmaceutical
Companies, from 2010 to 2014 .......................................................................... XXXIX
Table 3: Key Results of Selected Pharmaceutical Companies, from 2010 to 2014 ............. XLI
VII © WifOR 2016
List of Abbreviations and Acronyms
abs Absolut
avg Average
bn Billion
CAGR Compound annual growth rate
Destatis Statistisches Bundesamt Deutschland (Federal Office of Statis-
tics Germany)
ECB European Central Bank
Eurostat Statistical Office of the European Union
ESA European System of Accounts
EUR European Euro
FTE Full time equivalent
GDP Gross domestic product
GVA Gross value added
IOT Input-output table
n/a Not available
OECD Organisation for Economic Co-operation and Development
p.a. Per annum (per year)
pps percentage points
PV Production value
R&D Research and Development
SNA System of National Accounts
UN United Nations
WHO World Health Organisation
VIII © WifOR 2016
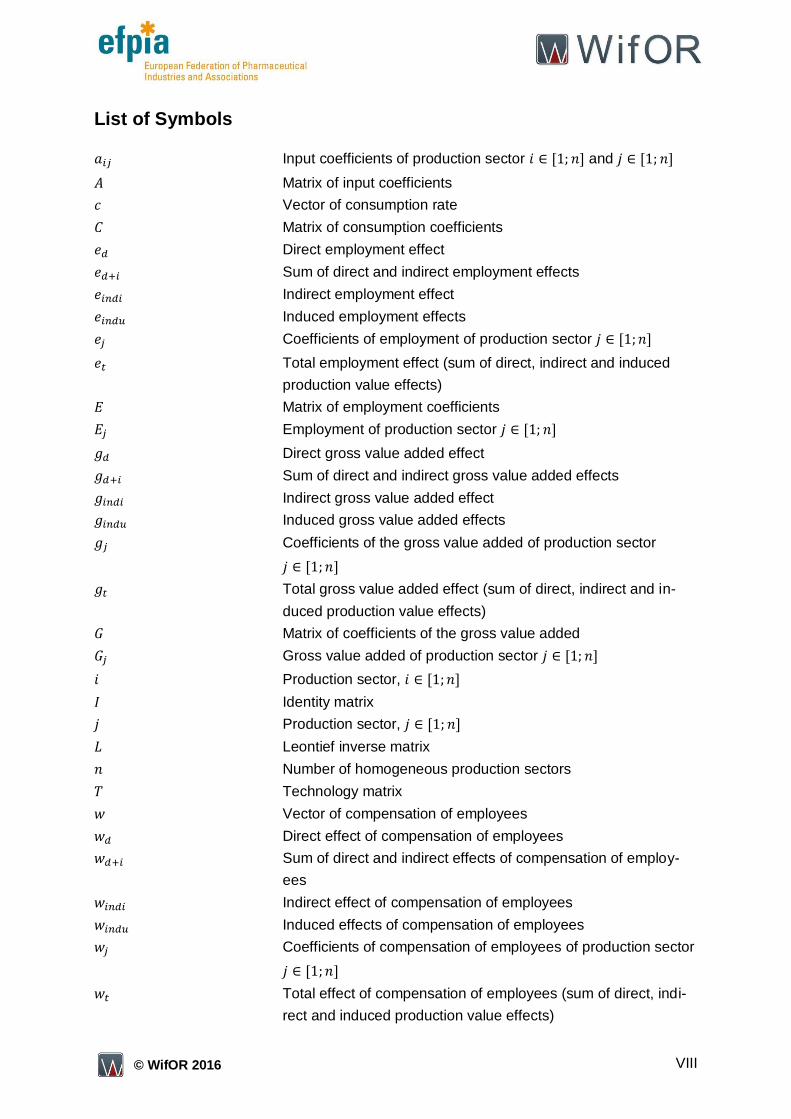
List of Symbols
Input coefficients of production sector and
Matrix of input coefficients
Vector of consumption rate
Matrix of consumption coefficients
Direct employment effect
Sum of direct and indirect employment effects
Indirect employment effect
Induced employment effects
Coefficients of employment of production sector
Total employment effect (sum of direct, indirect and induced
production value effects)
Matrix of employment coefficients
Employment of production sector
Direct gross value added effect
Sum of direct and indirect gross value added effects
Indirect gross value added effect
Induced gross value added effects
Coefficients of the gross value added of production sector
Total gross value added effect (sum of direct, indirect and in-
duced production value effects)
Matrix of coefficients of the gross value added
Gross value added of production sector
Production sector,
Identity matrix
Production sector,
Leontief inverse matrix
Number of homogeneous production sectors
Technology matrix
Vector of compensation of employees
Direct effect of compensation of employees
Sum of direct and indirect effects of compensation of employ-
ees
Indirect effect of compensation of employees
Induced effects of compensation of employees
Coefficients of compensation of employees of production sector
Total effect of compensation of employees (sum of direct, indi-
rect and induced production value effects)
IX © WifOR 2016
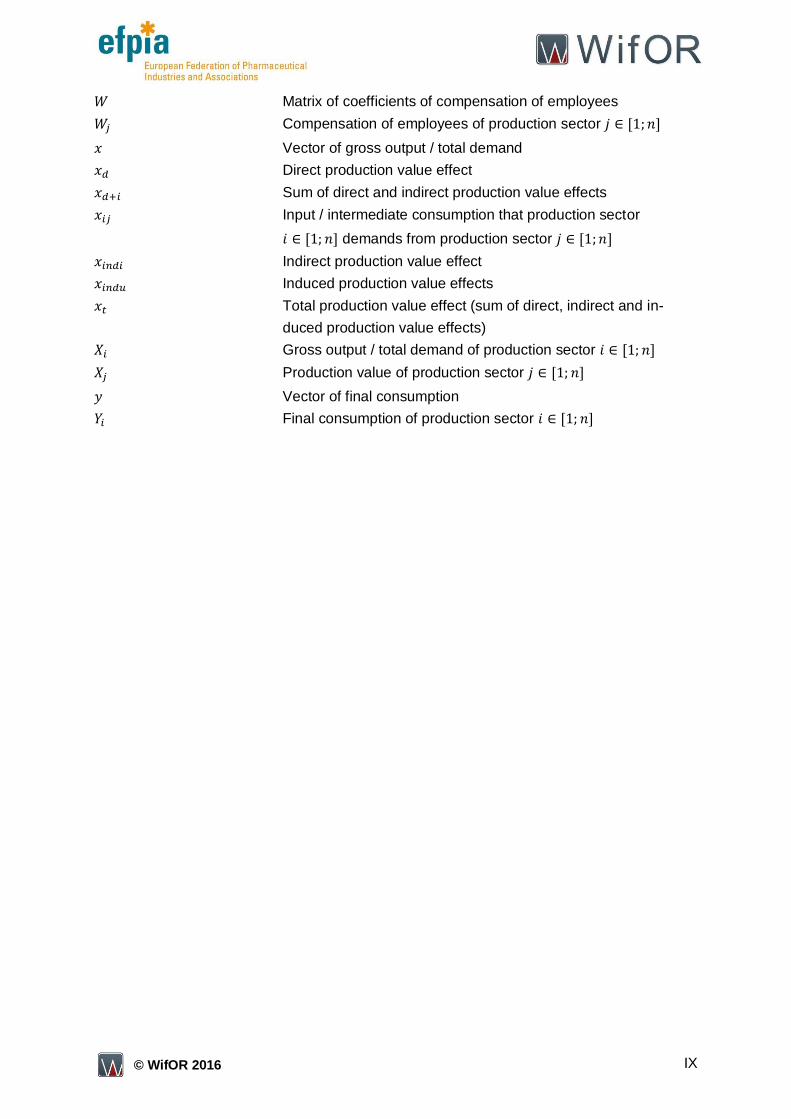
Matrix of coefficients of compensation of employees
Compensation of employees of production sector
Vector of gross output / total demand
Direct production value effect
Sum of direct and indirect production value effects
Input / intermediate consumption that production sector
demands from production sector
Indirect production value effect
Induced production value effects
Total production value effect (sum of direct, indirect and in-
duced production value effects)
Gross output / total demand of production sector
Production value of production sector
Vector of final consumption
Final consumption of production sector
X © WifOR 2016
Abstract
This research study, conducted by the independent economic research institute WifOR, in-
vestigates the direct economic impact of selected companies of the pharmaceutical industry
in Europe as well as their contribution to the entire European economy from 2010 to 2014.
Thus, the study analyses the European Economic Footprint of selected pharmaceutical com-
panies. In addition to direct economic effects, the Economic Footprint also accounts for indi-
rect and induced economic effects (so-called spillover effects). Direct effects describe a
company’s immediate economic impact while indirect effects are a result of inputs or inter-
mediate consumption. Induced economic effects originate in the spending of income by em-
ployees working in the pharmaceutical industry and for its suppliers. The economic impact
analysis is based on the United Nations’ System of National Accounts (SNA). In a first step, a
satellite account of the selected pharmaceutical companies is modelled to derive their direct
economic effects. In a second step, the indirect and induced economic effects are computed
based on the Leontief Inverse. Thus, the economic impact analysis yields direct, indirect and
induced gross value added and employment effects in the European economy supported by
the selection of European pharmaceutical companies. In addition to these economic impacts,
economic key indicators such as R&D intensities are also derived.
1 © WifOR 2016
1. Introduction
This study, on behalf of the European Federation of Pharmaceutical Industries and Associa-
tions (efpia), examines the impact of selected pharmaceutical companies on the European
economy. Efpia is the voice of the pharmaceutical industry in the European Union (EU), rep-
resenting 40 leading pharmaceutical companies in Europe. The Economic Footprint of the
pharmaceutical industry is measured in order to quantify the macroeconomic contribution of
seven major pharmaceutical companies to economic growth, employment and innovation in
Europe from 2010 to 2014. The results of this study aim to enrich the public discussion with
newly derived data substantiating how the pharmaceutical industry in Europe is powering
growth in Europe, how the pharmaceutical industry in Europe is driving employment and how
the pharmaceutical industry in Europe is investing in innovation. These three core aspects
affirm the pharmaceutical industry’s importance for the European economy.
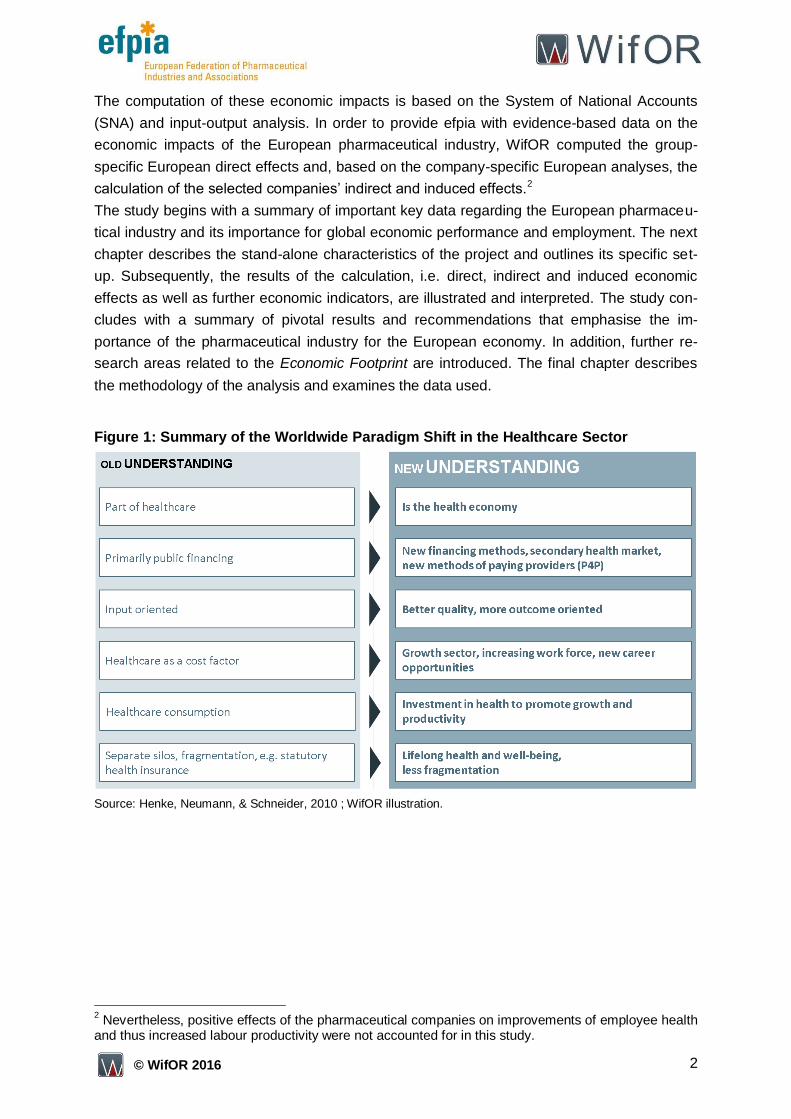
The objective of the study is to supplement the present and on-going dialogue about the per-
ception of the healthcare sector. As stated in Figure 1, perception changes are occurring in
several areas. For example, while previously being understood as a separate system for the
provision of health related services, the healthcare sector is now perceived as an economic
sector. In light of the emerging secondary health market, it has also become a playing field
for new methods of financing and compensating providers. Another key development is the
focus on high-quality outcomes rather than on inputs that are needed to achieve them.
These shifts are all driven and reinforced by the fact that the healthcare sector is perceived
as a reliable contributor to stable economic growth and a guarantor of employment. As such,
the healthcare sector no longer represents a cost factor that is accountable for huge public
and private expenditures. Instead, it constitutes an investment in health that can promote
growth through the activities of Research and Development and labour productivity. One
prominent example in this regard is a recent statement by the Director-General of the World
Health Organisation (WHO), Dr. Margaret Chan, concerning the first meeting of the high-
level commission on health employment and economic growth: “The Commission calls for a
change in the way policy-makers look at the health sector, not as a drain on resources but as
a source of opportunities […]. Employment in the health sector can operate as a counterforce
to the world’s growing inequalities in income levels and opportunities.”1
The economic impact analysis, conducted by the independent economic research institute
WifOR, encompasses the calculation of the European Economic Footprint of a selected
group of European Pharmaceutical companies, i.e. Abbvie, AstraZeneca, Boehringer Ingel-
heim, Ipsen, Janssen (a Johnson & Johnson subsidiary), Novartis and Sanofi. In addition to
direct economic effects, the Economic Footprint also accounts for indirect and induced eco-
nomic effects. Direct effects describe the seven participating companies’ immediate econom-
ic impact while indirect effects arise due to demand for inputs or intermediate consumption
and their usage by the companies’ business activities. Induced economic effects originate in
the spending of income by employees working both for the selected companies in the phar-
maceutical industry and their suppliers.
1 Cf. (WHO, 2016 ).
2 © WifOR 2016
The computation of these economic impacts is based on the System of National Accounts
(SNA) and input-output analysis. In order to provide efpia with evidence-based data on the
economic impacts of the European pharmaceutical industry, WifOR computed the group-
specific European direct effects and, based on the company-specific European analyses, the
calculation of the selected companies’ indirect and induced effects.2
The study begins with a summary of important key data regarding the European pharmaceu-
tical industry and its importance for global economic performance and employment. The next
chapter describes the stand-alone characteristics of the project and outlines its specific set-
up. Subsequently, the results of the calculation, i.e. direct, indirect and induced economic
effects as well as further economic indicators, are illustrated and interpreted. The study con-
cludes with a summary of pivotal results and recommendations that emphasise the im-
portance of the pharmaceutical industry for the European economy. In addition, further re-
search areas related to the Economic Footprint are introduced. The final chapter describes
the methodology of the analysis and examines the data used.
Figure 1: Summary of the Worldwide Paradigm Shift in the Healthcare Sector
Source: Henke, Neumann, & Schneider, 2010 ; WifOR illustration.
2 Nevertheless, positive effects of the pharmaceutical companies on improvements of employee health
and thus increased labour productivity were not accounted for in this study.
3 © WifOR 2016
2. Data and Facts about the European Pharmaceutical Industry
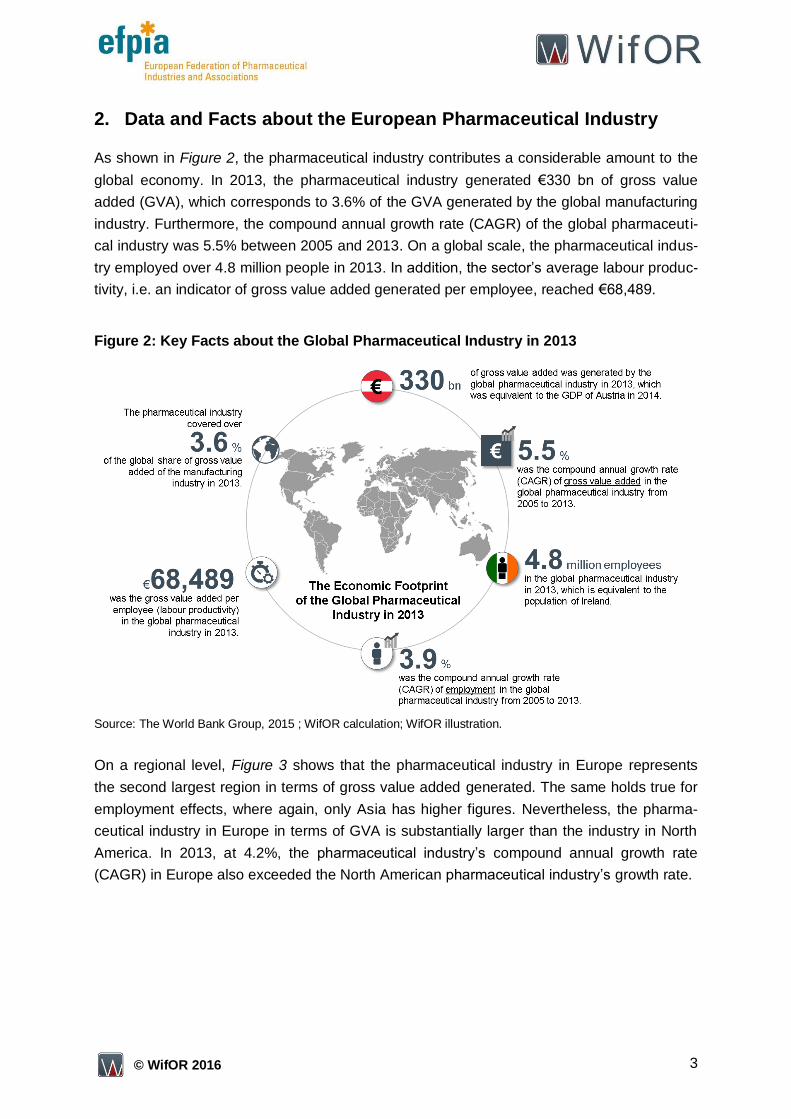
As shown in Figure 2, the pharmaceutical industry contributes a considerable amount to the
global economy. In 2013, the pharmaceutical industry generated €330 bn of gross value
added (GVA), which corresponds to 3.6% of the GVA generated by the global manufacturing
industry. Furthermore, the compound annual growth rate (CAGR) of the global pharmaceuti-
cal industry was 5.5% between 2005 and 2013. On a global scale, the pharmaceutical indus-
try employed over 4.8 million people in 2013. In addition, the sector’s average labour produc-
tivity, i.e. an indicator of gross value added generated per employee, reached €68,489.
Figure 2: Key Facts about the Global Pharmaceutical Industry in 2013
Source: The World Bank Group, 2015 ; WifOR calculation; WifOR illustration.
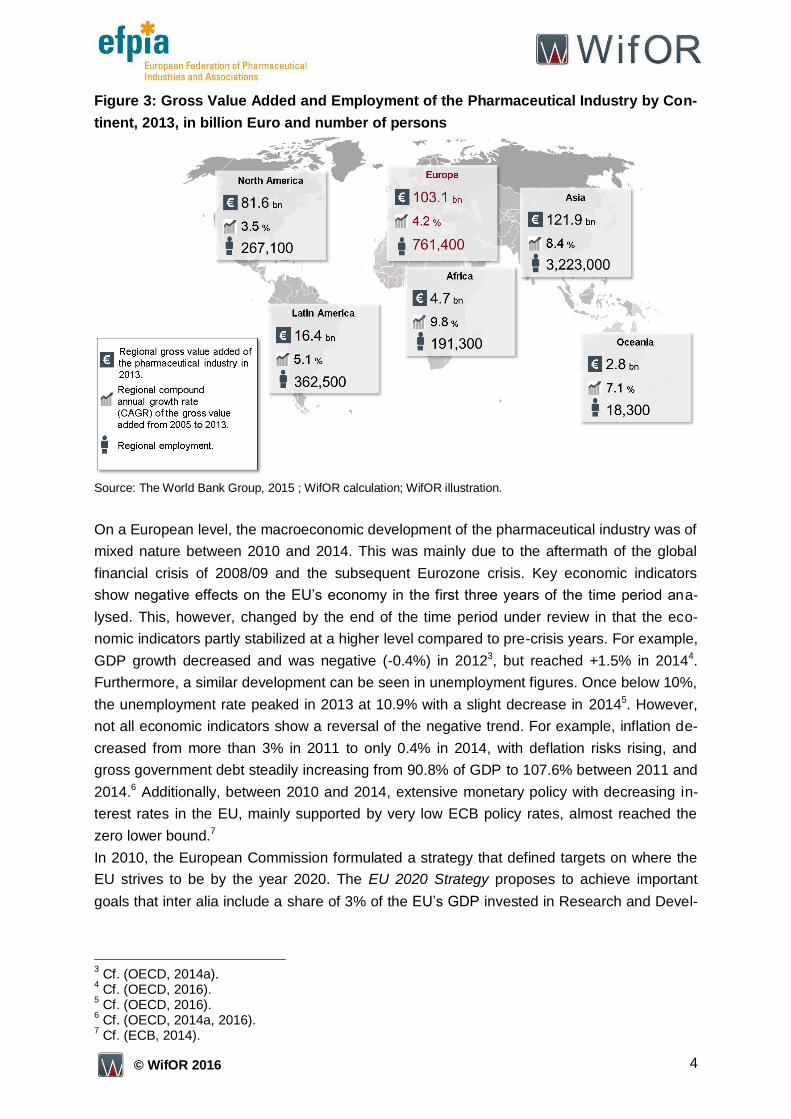
On a regional level, Figure 3 shows that the pharmaceutical industry in Europe represents
the second largest region in terms of gross value added generated. The same holds true for
employment effects, where again, only Asia has higher figures. Nevertheless, the pharma-
ceutical industry in Europe in terms of GVA is substantially larger than the industry in North
America. In 2013, at 4.2%, the pharmaceutical industry’s compound annual growth rate
(CAGR) in Europe also exceeded the North American pharmaceutical industry’s growth rate.
4 © WifOR 2016
Figure 3: Gross Value Added and Employment of the Pharmaceutical Industry by Con-
tinent, 2013, in billion Euro and number of persons
Source: The World Bank Group, 2015 ; WifOR calculation; WifOR illustration.
On a European level, the macroeconomic development of the pharmaceutical industry was of
mixed nature between 2010 and 2014. This was mainly due to the aftermath of the global
financial crisis of 2008/09 and the subsequent Eurozone crisis. Key economic indicators
show negative effects on the EU’s economy in the first three years of the time period ana-
lysed. This, however, changed by the end of the time period under review in that the eco-
nomic indicators partly stabilized at a higher level compared to pre-crisis years. For example,
GDP growth decreased and was negative (-0.4%) in 20123, but reached +1.5% in 20144.
Furthermore, a similar development can be seen in unemployment figures. Once below 10%,
the unemployment rate peaked in 2013 at 10.9% with a slight decrease in 20145. However,
not all economic indicators show a reversal of the negative trend. For example, inflation de-
creased from more than 3% in 2011 to only 0.4% in 2014, with deflation risks rising, and
gross government debt steadily increasing from 90.8% of GDP to 107.6% between 2011 and
2014.6 Additionally, between 2010 and 2014, extensive monetary policy with decreasing in-
terest rates in the EU, mainly supported by very low ECB policy rates, almost reached the
zero lower bound.7
In 2010, the European Commission formulated a strategy that defined targets on where the
EU strives to be by the year 2020. The EU 2020 Strategy proposes to achieve important
goals that inter alia include a share of 3% of the EU’s GDP invested in Research and Devel-
3 Cf. (OECD, 2014a).
4 Cf. (OECD, 2016).
5 Cf. (OECD, 2016).
6 Cf. (OECD, 2014a, 2016).
7 Cf. (ECB, 2014).
5 © WifOR 2016
opment (R&D).8 The R&D target is of particular importance in the context of analysing the
pharmaceutical industry as it serves as a benchmark for meaningful comparison. As phar-
maceutical companies generally invest heavily into R&D, it can be assumed that the seven
selected companies’ internal R&D intensity rate is substantially higher than 3% of the GDP.
Furthermore, the EU pharmaceutical industry was in part also negatively affected by eco-
nomic shocks in recent years. For example, direct gross value added generated by the Euro-
pean pharmaceutical industry decreased from €85.8 bn in 2011 to €79.5 bn in 2014. The
GVA rate, i.e. the gross value added share of output, dropped from 41.0% in 2011 to 37.8%
in 2014. Also, labour productivity, i.e. the gross value added per employee, decreased from
158,239 in 2011 to 142,630 in 2013. On the other hand, the number of directly employed
persons in the industry increased 2.8% from 542,500 to 557,700 in the same time period.9
On another note, health-related government spending affected the pharmaceutical industry.
While growing at 4.7% per year between 2000 and 2009, health spending in EU countries
decreased on average by 0.6% each year between 2009 and 2012. Despite this develop-
ment, most EU members were able to maintain universal health coverage and thus protected
access to health care in the EU.10
8 Cf. (European Commission Communication, 2010).
9 Data from Eurostat; WifOR calculations.
10 Cf. (OECD, 2014b).
6 © WifOR 2016
3. Study Design
This unique study provides an in-depth analysis of the selected pharmaceutical com-
panies’ economic impacts within the European Union. It marks the first time that direct
effects, spillover effects and contributions to the EU single market’s GDP were calcu-
lated using company-specific data provided by multinational pharmaceutical compa-
nies in the EU.
3.1 Project Scope
In order to calculate the European Economic Footprint of the selected pharmaceutical com-
panies, each company’s key management data was retrieved, transformed into macroeco-
nomic data and aggregated to form the basis for the European calculations. The participating
efpia members are the multinational companies Abbvie, AstraZeneca, Boehringer Ingelheim,
Ipsen, Janssen (a Johnson & Johnson subsidiary), Novartis and Sanofi. WifOR calculated a
company-specific European Economic Footprint for each participating member and, depend-
ing on the individual contracting, conducted up to 5 country deep-dive analyses.
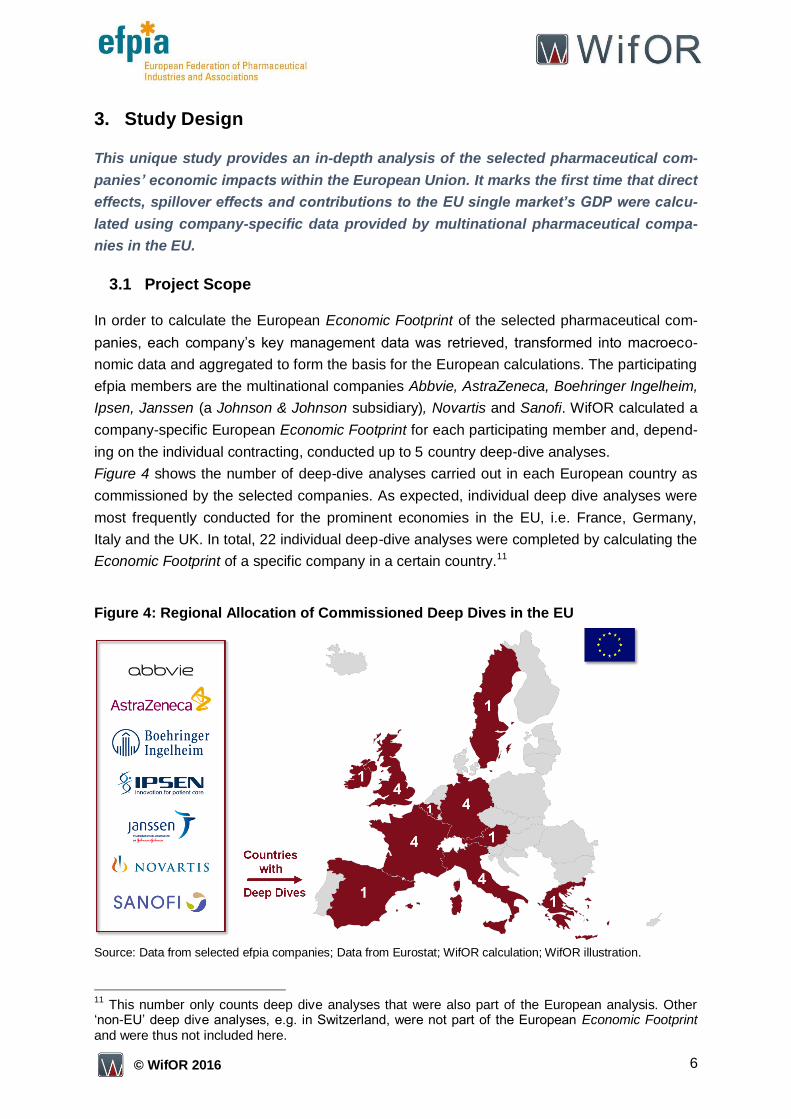
Figure 4 shows the number of deep-dive analyses carried out in each European country as
commissioned by the selected companies. As expected, individual deep dive analyses were
most frequently conducted for the prominent economies in the EU, i.e. France, Germany,
Italy and the UK. In total, 22 individual deep-dive analyses were completed by calculating the
Economic Footprint of a specific company in a certain country.11
Figure 4: Regional Allocation of Commissioned Deep Dives in the EU
Source: Data from selected efpia companies; Data from Eurostat; WifOR calculation; WifOR illustration.
11
This number only counts deep dive analyses that were also part of the European analysis. Other ‘non-EU’ deep dive analyses, e.g. in Switzerland, were not part of the European Economic Footprint and were thus not included here.
7 © WifOR 2016
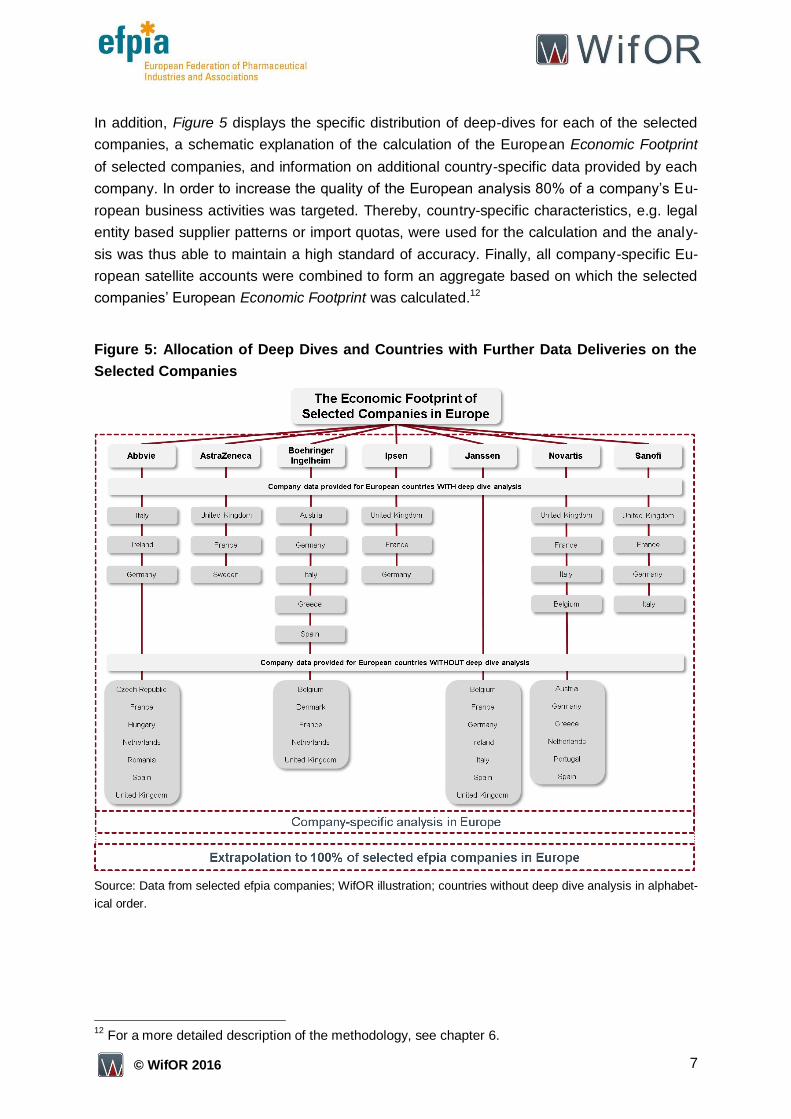
In addition, Figure 5 displays the specific distribution of deep-dives for each of the selected
companies, a schematic explanation of the calculation of the European Economic Footprint
of selected companies, and information on additional country-specific data provided by each
company. In order to increase the quality of the European analysis 80% of a company’s Eu-
ropean business activities was targeted. Thereby, country-specific characteristics, e.g. legal
entity based supplier patterns or import quotas, were used for the calculation and the analy-
sis was thus able to maintain a high standard of accuracy. Finally, all company-specific Eu-
ropean satellite accounts were combined to form an aggregate based on which the selected
companies’ European Economic Footprint was calculated.12
Figure 5: Allocation of Deep Dives and Countries with Further Data Deliveries on the
Selected Companies
Source: Data from selected efpia companies; WifOR illustration; countries without deep dive analysis in alphabet-
ical order.
12
For a more detailed description of the methodology, see chapter 6.
8 © WifOR 2016
3.2 Stand Alone Characteristics
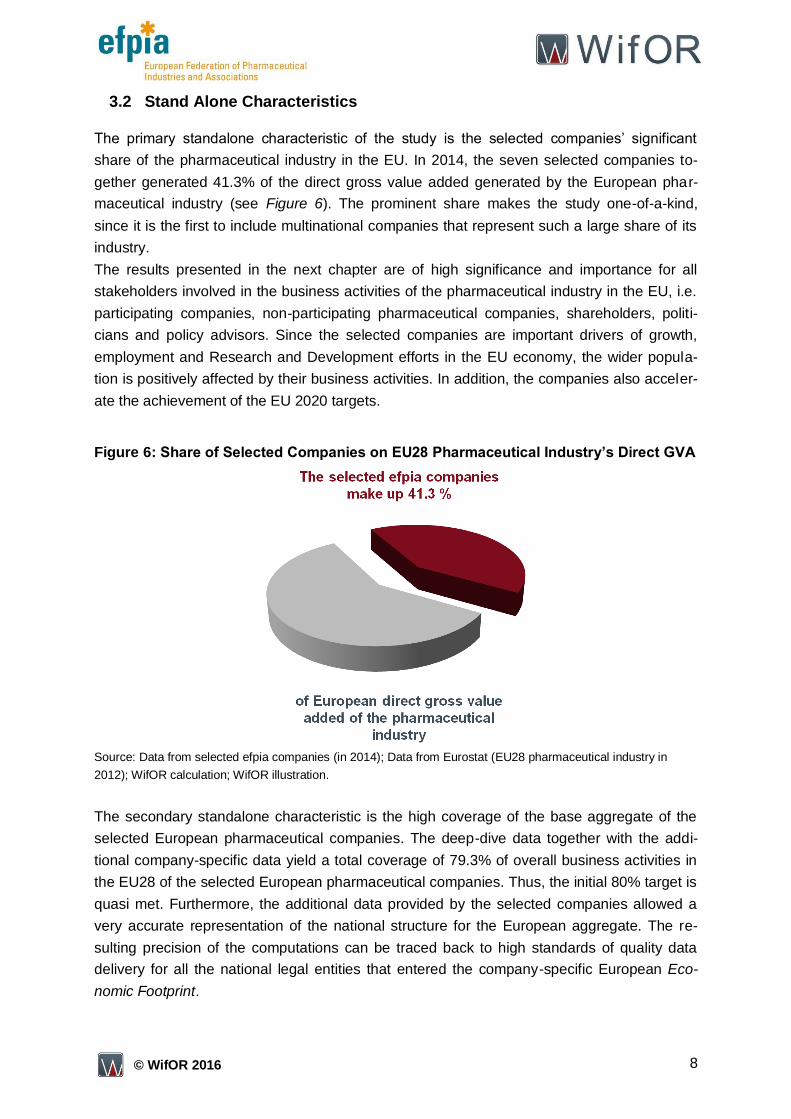
The primary standalone characteristic of the study is the selected companies’ significant
share of the pharmaceutical industry in the EU. In 2014, the seven selected companies to-
gether generated 41.3% of the direct gross value added generated by the European phar-
maceutical industry (see Figure 6). The prominent share makes the study one-of-a-kind,
since it is the first to include multinational companies that represent such a large share of its
industry.
The results presented in the next chapter are of high significance and importance for all
stakeholders involved in the business activities of the pharmaceutical industry in the EU, i.e.
participating companies, non-participating pharmaceutical companies, shareholders, politi-
cians and policy advisors. Since the selected companies are important drivers of growth,
employment and Research and Development efforts in the EU economy, the wider popula-
tion is positively affected by their business activities. In addition, the companies also acceler-
ate the achievement of the EU 2020 targets.
Figure 6: Share of Selected Companies on EU28 Pharmaceutical Industry’s Direct GVA
Source: Data from selected efpia companies (in 2014); Data from Eurostat (EU28 pharmaceutical industry in
2012); WifOR calculation; WifOR illustration.
The secondary standalone characteristic is the high coverage of the base aggregate of the
selected European pharmaceutical companies. The deep-dive data together with the addi-
tional company-specific data yield a total coverage of 79.3% of overall business activities in
the EU28 of the selected European pharmaceutical companies. Thus, the initial 80% target is
quasi met. Furthermore, the additional data provided by the selected companies allowed a
very accurate representation of the national structure for the European aggregate. The re-
sulting precision of the computations can be traced back to high standards of quality data
delivery for all the national legal entities that entered the company-specific European Eco-
nomic Footprint.
9 © WifOR 2016
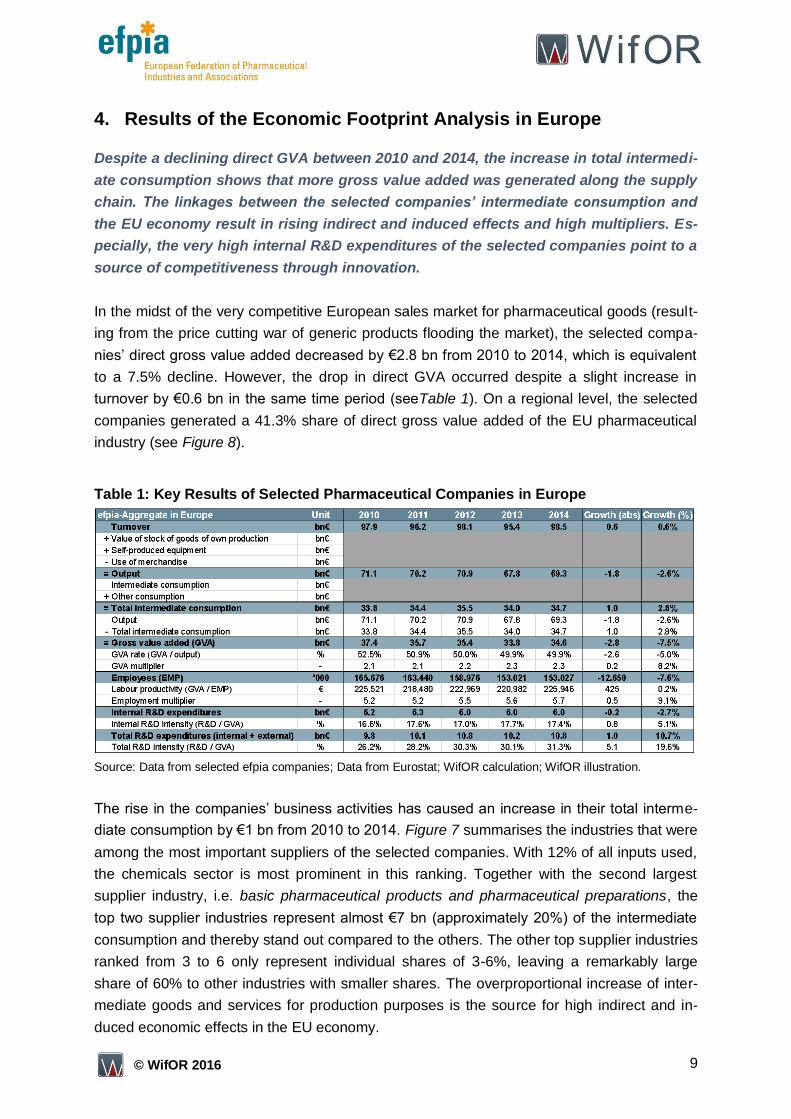
4. Results of the Economic Footprint Analysis in Europe
Despite a declining direct GVA between 2010 and 2014, the increase in total intermedi-
ate consumption shows that more gross value added was generated along the supply
chain. The linkages between the selected companies’ intermediate consumption and
the EU economy result in rising indirect and induced effects and high multipliers. Es-
pecially, the very high internal R&D expenditures of the selected companies point to a
source of competitiveness through innovation.
In the midst of the very competitive European sales market for pharmaceutical goods (result-
ing from the price cutting war of generic products flooding the market), the selected compa-
nies’ direct gross value added decreased by €2.8 bn from 2010 to 2014, which is equivalent
to a 7.5% decline. However, the drop in direct GVA occurred despite a slight increase in
turnover by €0.6 bn in the same time period (seeTable 1). On a regional level, the selected
companies generated a 41.3% share of direct gross value added of the EU pharmaceutical
industry (see Figure 8).
Table 1: Key Results of Selected Pharmaceutical Companies in Europe
Source: Data from selected efpia companies; Data from Eurostat; WifOR calculation; WifOR illustration.
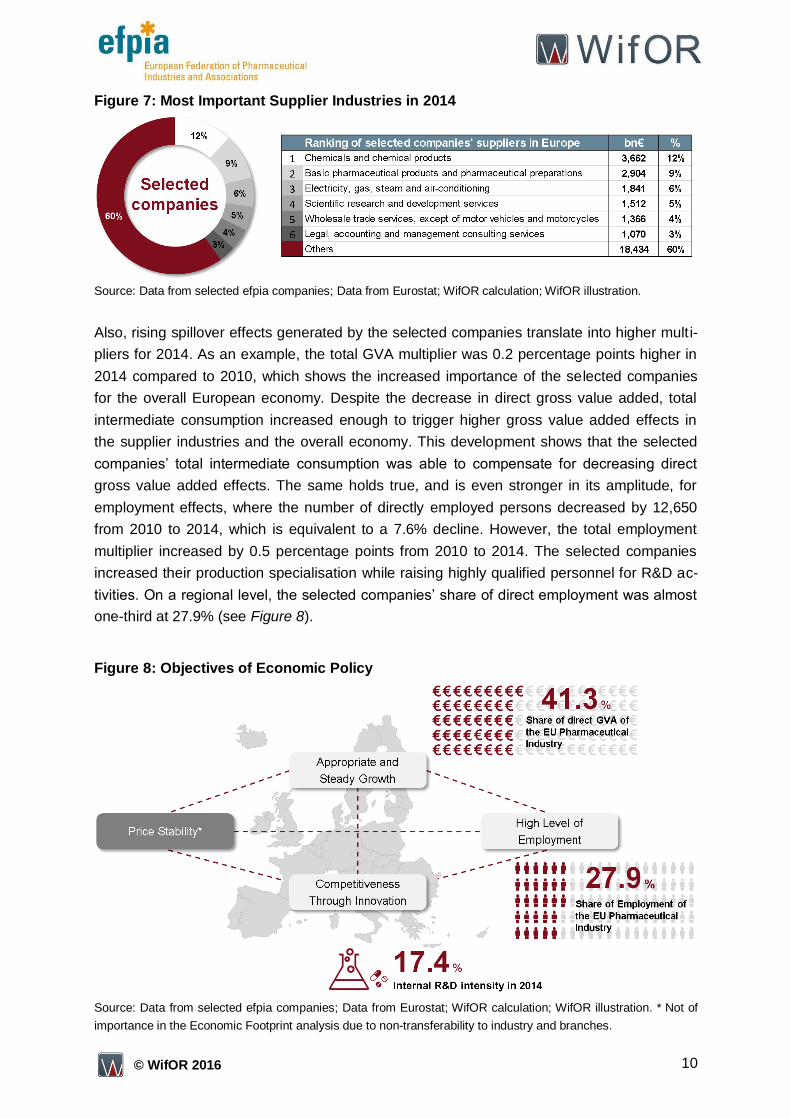
The rise in the companies’ business activities has caused an increase in their total interme-
diate consumption by €1 bn from 2010 to 2014. Figure 7 summarises the industries that were
among the most important suppliers of the selected companies. With 12% of all inputs used,
the chemicals sector is most prominent in this ranking. Together with the second largest
supplier industry, i.e. basic pharmaceutical products and pharmaceutical preparations, the
top two supplier industries represent almost €7 bn (approximately 20%) of the intermediate
consumption and thereby stand out compared to the others. The other top supplier industries
ranked from 3 to 6 only represent individual shares of 3-6%, leaving a remarkably large
share of 60% to other industries with smaller shares. The overproportional increase of inter-
mediate goods and services for production purposes is the source for high indirect and in-
duced economic effects in the EU economy.
10 © WifOR 2016
Figure 7: Most Important Supplier Industries in 2014
Source: Data from selected efpia companies; Data from Eurostat; WifOR calculation; WifOR illustration.
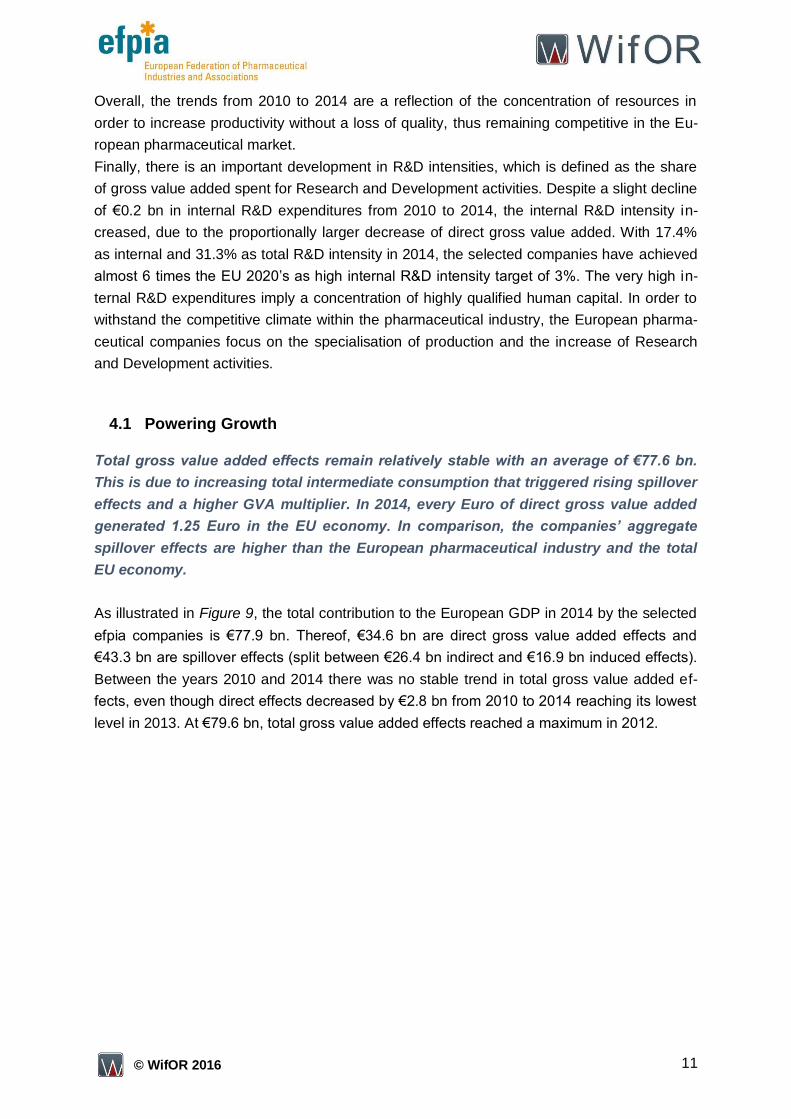
Also, rising spillover effects generated by the selected companies translate into higher multi-
pliers for 2014. As an example, the total GVA multiplier was 0.2 percentage points higher in
2014 compared to 2010, which shows the increased importance of the selected companies
for the overall European economy. Despite the decrease in direct gross value added, total
intermediate consumption increased enough to trigger higher gross value added effects in
the supplier industries and the overall economy. This development shows that the selected
companies’ total intermediate consumption was able to compensate for decreasing direct
gross value added effects. The same holds true, and is even stronger in its amplitude, for
employment effects, where the number of directly employed persons decreased by 12,650
from 2010 to 2014, which is equivalent to a 7.6% decline. However, the total employment
multiplier increased by 0.5 percentage points from 2010 to 2014. The selected companies
increased their production specialisation while raising highly qualified personnel for R&D ac-
tivities. On a regional level, the selected companies’ share of direct employment was almost
one-third at 27.9% (see Figure 8).
Figure 8: Objectives of Economic Policy
Source: Data from selected efpia companies; Data from Eurostat; WifOR calculation; WifOR illustration. * Not of
importance in the Economic Footprint analysis due to non-transferability to industry and branches.
11 © WifOR 2016
Overall, the trends from 2010 to 2014 are a reflection of the concentration of resources in
order to increase productivity without a loss of quality, thus remaining competitive in the Eu-
ropean pharmaceutical market.
Finally, there is an important development in R&D intensities, which is defined as the share
of gross value added spent for Research and Development activities. Despite a slight decline
of €0.2 bn in internal R&D expenditures from 2010 to 2014, the internal R&D intensity in-
creased, due to the proportionally larger decrease of direct gross value added. With 17.4%
as internal and 31.3% as total R&D intensity in 2014, the selected companies have achieved
almost 6 times the EU 2020’s as high internal R&D intensity target of 3%. The very high in-
ternal R&D expenditures imply a concentration of highly qualified human capital. In order to
withstand the competitive climate within the pharmaceutical industry, the European pharma-
ceutical companies focus on the specialisation of production and the increase of Research
and Development activities.
4.1 Powering Growth
Total gross value added effects remain relatively stable with an average of €77.6 bn.
This is due to increasing total intermediate consumption that triggered rising spillover
effects and a higher GVA multiplier. In 2014, every Euro of direct gross value added
generated 1.25 Euro in the EU economy. In comparison, the companies’ aggregate
spillover effects are higher than the European pharmaceutical industry and the total
EU economy.
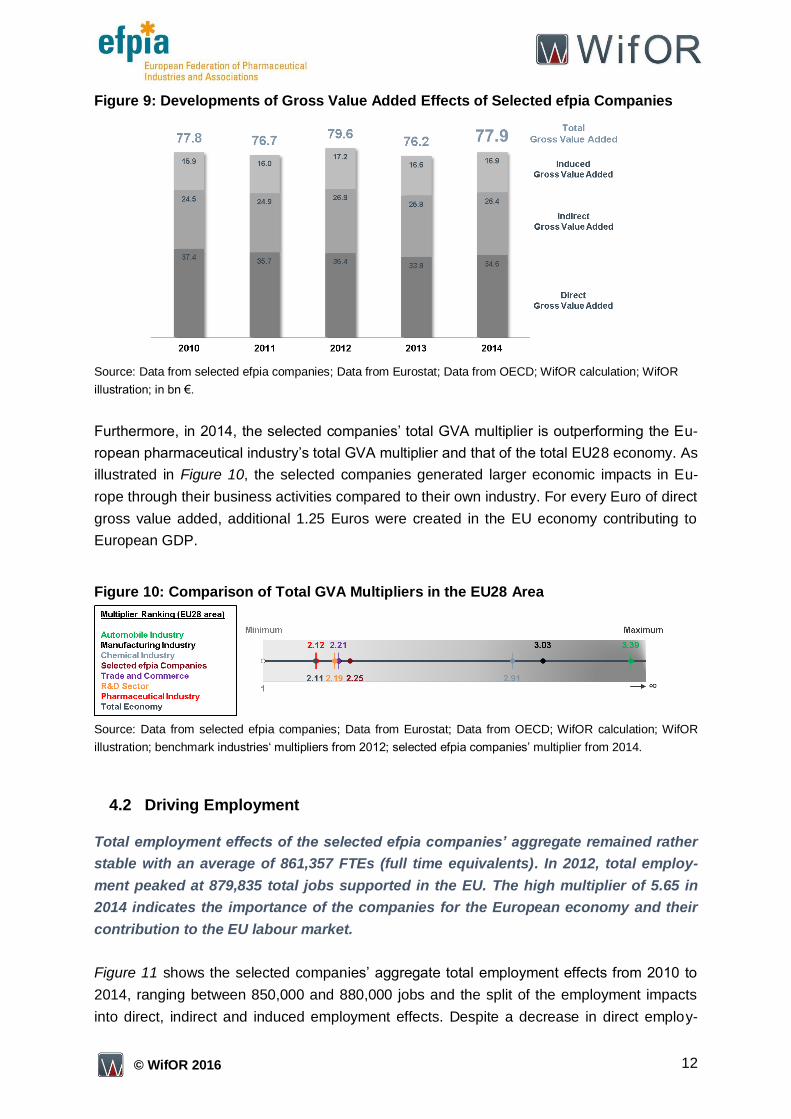
As illustrated in Figure 9, the total contribution to the European GDP in 2014 by the selected
efpia companies is €77.9 bn. Thereof, €34.6 bn are direct gross value added effects and
€43.3 bn are spillover effects (split between €26.4 bn indirect and €16.9 bn induced effects).
Between the years 2010 and 2014 there was no stable trend in total gross value added ef-
fects, even though direct effects decreased by €2.8 bn from 2010 to 2014 reaching its lowest
level in 2013. At €79.6 bn, total gross value added effects reached a maximum in 2012.
12 © WifOR 2016
Figure 9: Developments of Gross Value Added Effects of Selected efpia Companies
Source: Data from selected efpia companies; Data from Eurostat; Data from OECD; WifOR calculation; WifOR
illustration; in bn €.
Furthermore, in 2014, the selected companies’ total GVA multiplier is outperforming the Eu-
ropean pharmaceutical industry’s total GVA multiplier and that of the total EU28 economy. As
illustrated in Figure 10, the selected companies generated larger economic impacts in Eu-
rope through their business activities compared to their own industry. For every Euro of direct
gross value added, additional 1.25 Euros were created in the EU economy contributing to
European GDP.
Figure 10: Comparison of Total GVA Multipliers in the EU28 Area
Source: Data from selected efpia companies; Data from Eurostat; Data from OECD; WifOR calculation; WifOR
illustration; benchmark industries‘ multipliers from 2012; selected efpia companies’ multiplier from 2014.
4.2 Driving Employment
Total employment effects of the selected efpia companies’ aggregate remained rather
stable with an average of 861,357 FTEs (full time equivalents). In 2012, total employ-
ment peaked at 879,835 total jobs supported in the EU. The high multiplier of 5.65 in
2014 indicates the importance of the companies for the European economy and their
contribution to the EU labour market.
Figure 11 shows the selected companies’ aggregate total employment effects from 2010 to
2014, ranging between 850,000 and 880,000 jobs and the split of the employment impacts
into direct, indirect and induced employment effects. Despite a decrease in direct employ-
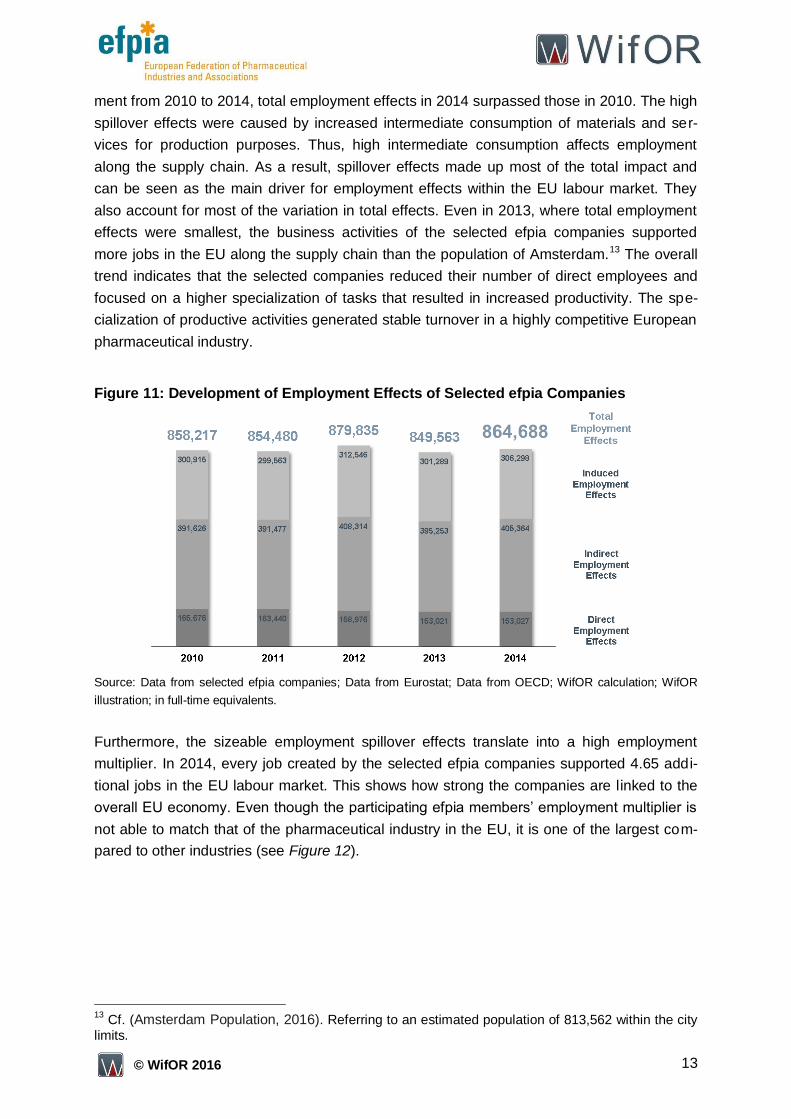
13 © WifOR 2016
ment from 2010 to 2014, total employment effects in 2014 surpassed those in 2010. The high
spillover effects were caused by increased intermediate consumption of materials and ser-
vices for production purposes. Thus, high intermediate consumption affects employment
along the supply chain. As a result, spillover effects made up most of the total impact and
can be seen as the main driver for employment effects within the EU labour market. They
also account for most of the variation in total effects. Even in 2013, where total employment
effects were smallest, the business activities of the selected efpia companies supported
more jobs in the EU along the supply chain than the population of Amsterdam.13 The overall
trend indicates that the selected companies reduced their number of direct employees and
focused on a higher specialization of tasks that resulted in increased productivity. The spe-
cialization of productive activities generated stable turnover in a highly competitive European
pharmaceutical industry.
Figure 11: Development of Employment Effects of Selected efpia Companies
Source: Data from selected efpia companies; Data from Eurostat; Data from OECD; WifOR calculation; WifOR
illustration; in full-time equivalents.
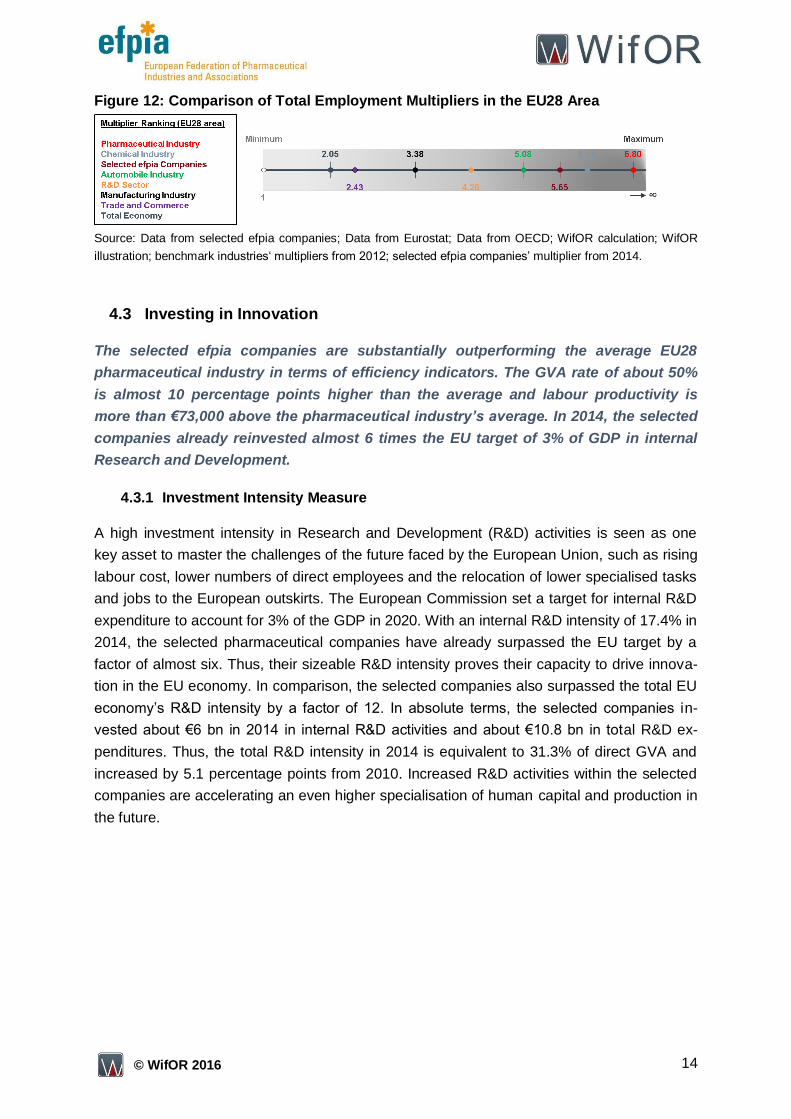
Furthermore, the sizeable employment spillover effects translate into a high employment
multiplier. In 2014, every job created by the selected efpia companies supported 4.65 addi-
tional jobs in the EU labour market. This shows how strong the companies are linked to the
overall EU economy. Even though the participating efpia members’ employment multiplier is
not able to match that of the pharmaceutical industry in the EU, it is one of the largest com-
pared to other industries (see Figure 12).
13
Cf. (Amsterdam Population, 2016). Referring to an estimated population of 813,562 within the city limits.
14 © WifOR 2016
Figure 12: Comparison of Total Employment Multipliers in the EU28 Area
Source: Data from selected efpia companies; Data from Eurostat; Data from OECD; WifOR calculation; WifOR
illustration; benchmark industries‘ multipliers from 2012; selected efpia companies’ multiplier from 2014.
4.3 Investing in Innovation
The selected efpia companies are substantially outperforming the average EU28
pharmaceutical industry in terms of efficiency indicators. The GVA rate of about 50%
is almost 10 percentage points higher than the average and labour productivity is
more than €73,000 above the pharmaceutical industry’s average. In 2014, the selected
companies already reinvested almost 6 times the EU target of 3% of GDP in internal
Research and Development.
4.3.1 Investment Intensity Measure
A high investment intensity in Research and Development (R&D) activities is seen as one
key asset to master the challenges of the future faced by the European Union, such as rising
labour cost, lower numbers of direct employees and the relocation of lower specialised tasks
and jobs to the European outskirts. The European Commission set a target for internal R&D
expenditure to account for 3% of the GDP in 2020. With an internal R&D intensity of 17.4% in
2014, the selected pharmaceutical companies have already surpassed the EU target by a
factor of almost six. Thus, their sizeable R&D intensity proves their capacity to drive innova-
tion in the EU economy. In comparison, the selected companies also surpassed the total EU
economy’s R&D intensity by a factor of 12. In absolute terms, the selected companies in-
vested about €6 bn in 2014 in internal R&D activities and about €10.8 bn in total R&D ex-
penditures. Thus, the total R&D intensity in 2014 is equivalent to 31.3% of direct GVA and
increased by 5.1 percentage points from 2010. Increased R&D activities within the selected
companies are accelerating an even higher specialisation of human capital and production in
the future.
15 © WifOR 2016
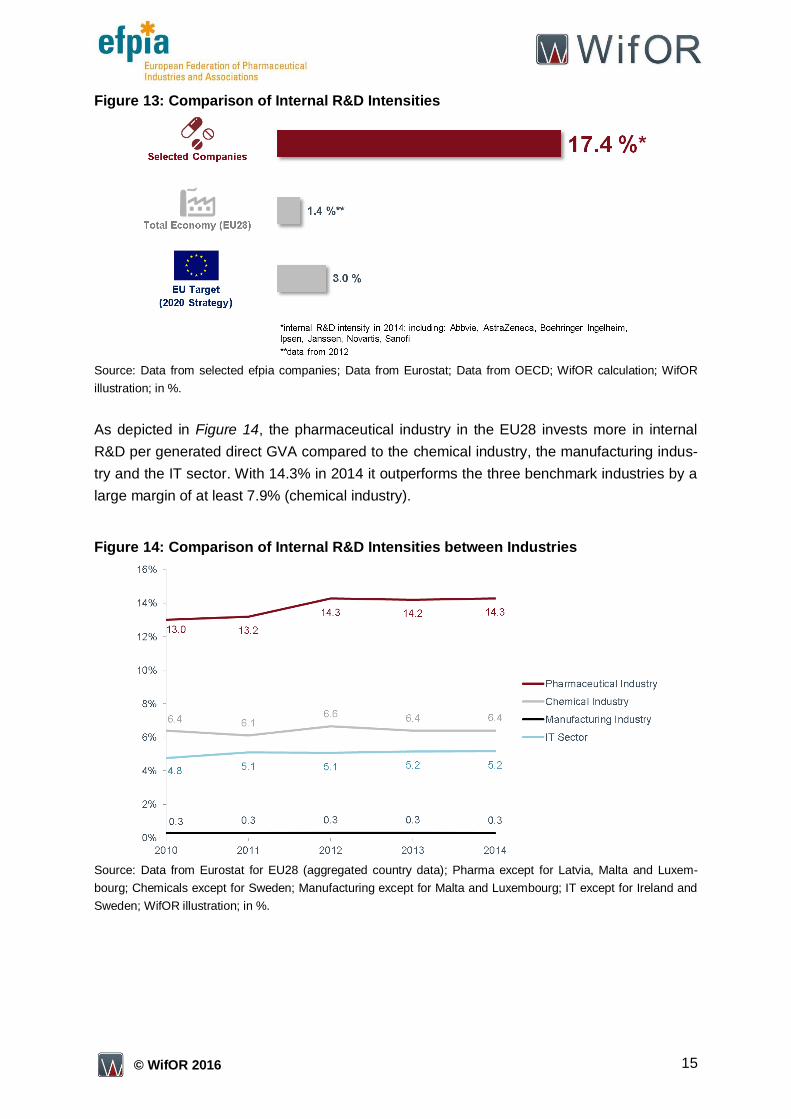
Figure 13: Comparison of Internal R&D Intensities
Source: Data from selected efpia companies; Data from Eurostat; Data from OECD; WifOR calculation; WifOR
illustration; in %.
As depicted in Figure 14, the pharmaceutical industry in the EU28 invests more in internal
R&D per generated direct GVA compared to the chemical industry, the manufacturing indus-
try and the IT sector. With 14.3% in 2014 it outperforms the three benchmark industries by a
large margin of at least 7.9% (chemical industry).
Figure 14: Comparison of Internal R&D Intensities between Industries
Source: Data from Eurostat for EU28 (aggregated country data); Pharma except for Latvia, Malta and Luxem-
bourg; Chemicals except for Sweden; Manufacturing except for Malta and Luxembourg; IT except for Ireland and
Sweden; WifOR illustration; in %.
16 © WifOR 2016
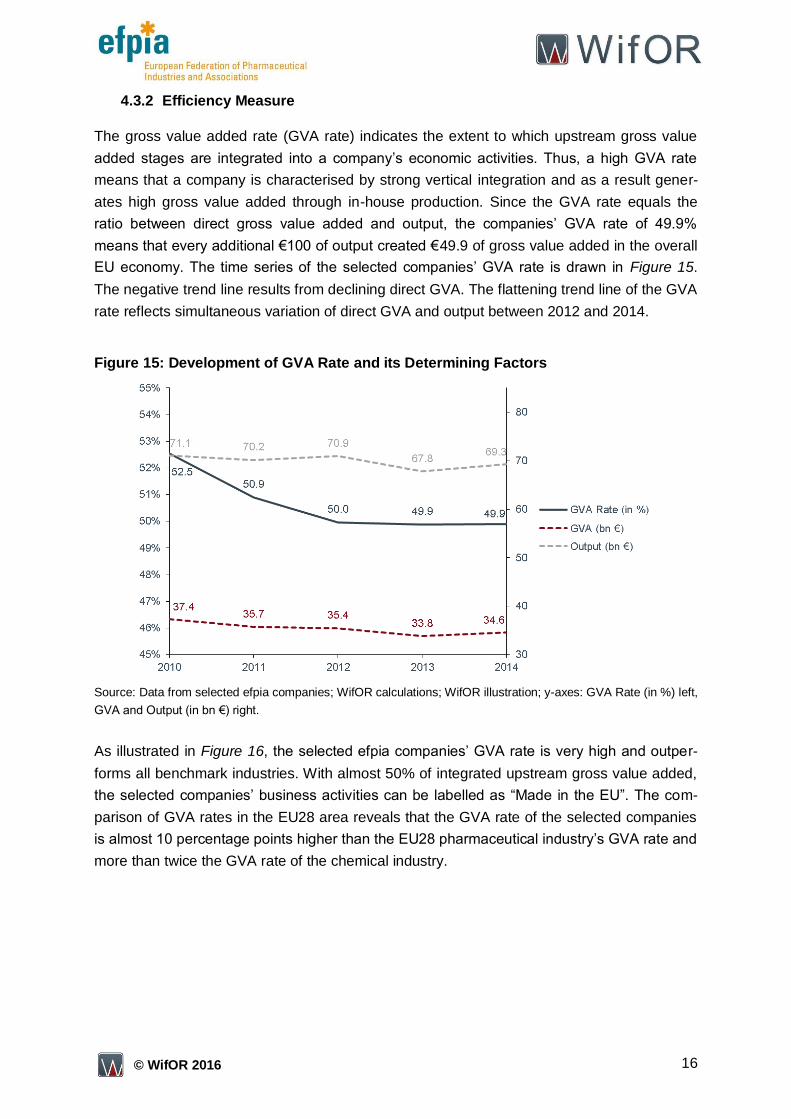
4.3.2 Efficiency Measure
The gross value added rate (GVA rate) indicates the extent to which upstream gross value
added stages are integrated into a company’s economic activities. Thus, a high GVA rate
means that a company is characterised by strong vertical integration and as a result gener-
ates high gross value added through in-house production. Since the GVA rate equals the
ratio between direct gross value added and output, the companies’ GVA rate of 49.9%
means that every additional €100 of output created €49.9 of gross value added in the overall
EU economy. The time series of the selected companies’ GVA rate is drawn in Figure 15.
The negative trend line results from declining direct GVA. The flattening trend line of the GVA
rate reflects simultaneous variation of direct GVA and output between 2012 and 2014.
Figure 15: Development of GVA Rate and its Determining Factors
Source: Data from selected efpia companies; WifOR calculations; WifOR illustration; y-axes: GVA Rate (in %) left,
GVA and Output (in bn €) right.
As illustrated in Figure 16, the selected efpia companies’ GVA rate is very high and outper-
forms all benchmark industries. With almost 50% of integrated upstream gross value added,
the selected companies’ business activities can be labelled as “Made in the EU”. The com-
parison of GVA rates in the EU28 area reveals that the GVA rate of the selected companies
is almost 10 percentage points higher than the EU28 pharmaceutical industry’s GVA rate and
more than twice the GVA rate of the chemical industry.
17 © WifOR 2016
Figure 16: Comparison of GVA Rates in the EU28 Area
Source: Data from selected efpia companies; Data from Eurostat; Data from OECD; WifOR calculation; WifOR
illustration; benchmark industries‘ GVA rates from 2012; selected efpia companies’ GVA rate from 2014; in %.
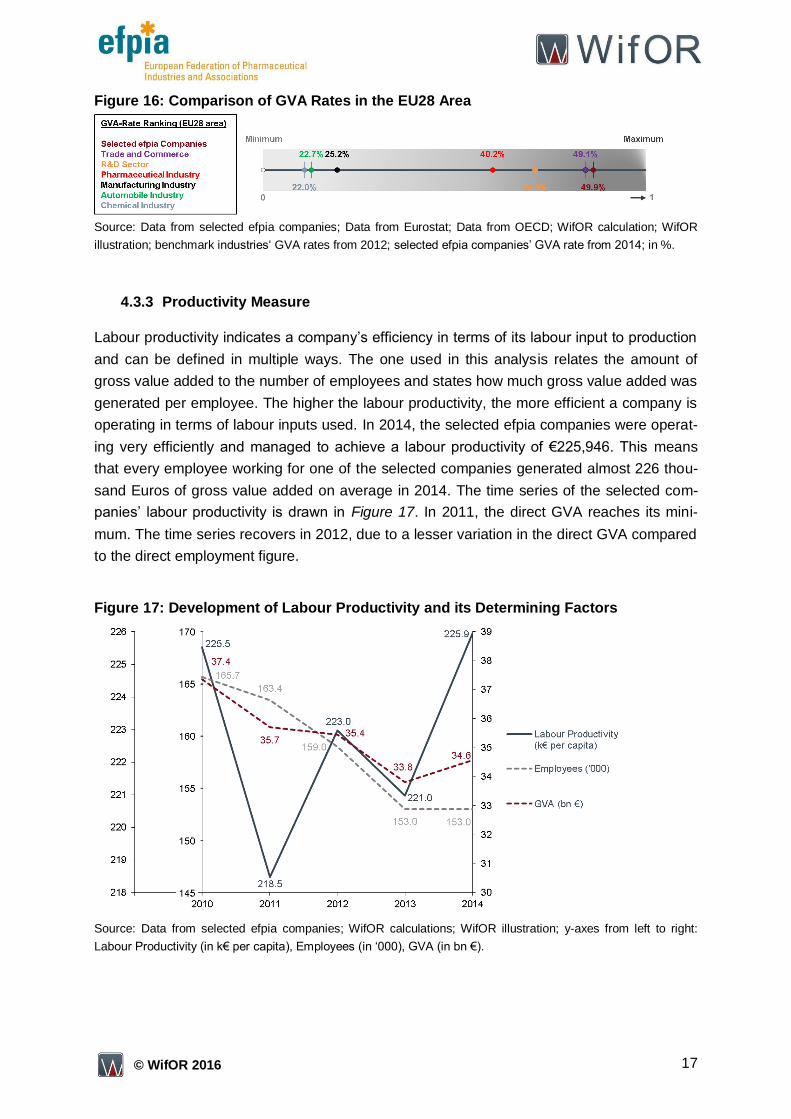
4.3.3 Productivity Measure
Labour productivity indicates a company’s efficiency in terms of its labour input to production
and can be defined in multiple ways. The one used in this analysis relates the amount of
gross value added to the number of employees and states how much gross value added was
generated per employee. The higher the labour productivity, the more efficient a company is
operating in terms of labour inputs used. In 2014, the selected efpia companies were operat-
ing very efficiently and managed to achieve a labour productivity of €225,946. This means
that every employee working for one of the selected companies generated almost 226 thou-
sand Euros of gross value added on average in 2014. The time series of the selected com-
panies’ labour productivity is drawn in Figure 17. In 2011, the direct GVA reaches its mini-
mum. The time series recovers in 2012, due to a lesser variation in the direct GVA compared
to the direct employment figure.
Figure 17: Development of Labour Productivity and its Determining Factors
Source: Data from selected efpia companies; WifOR calculations; WifOR illustration; y-axes from left to right:
Labour Productivity (in k€ per capita), Employees (in ‘000), GVA (in bn €).
18 © WifOR 2016
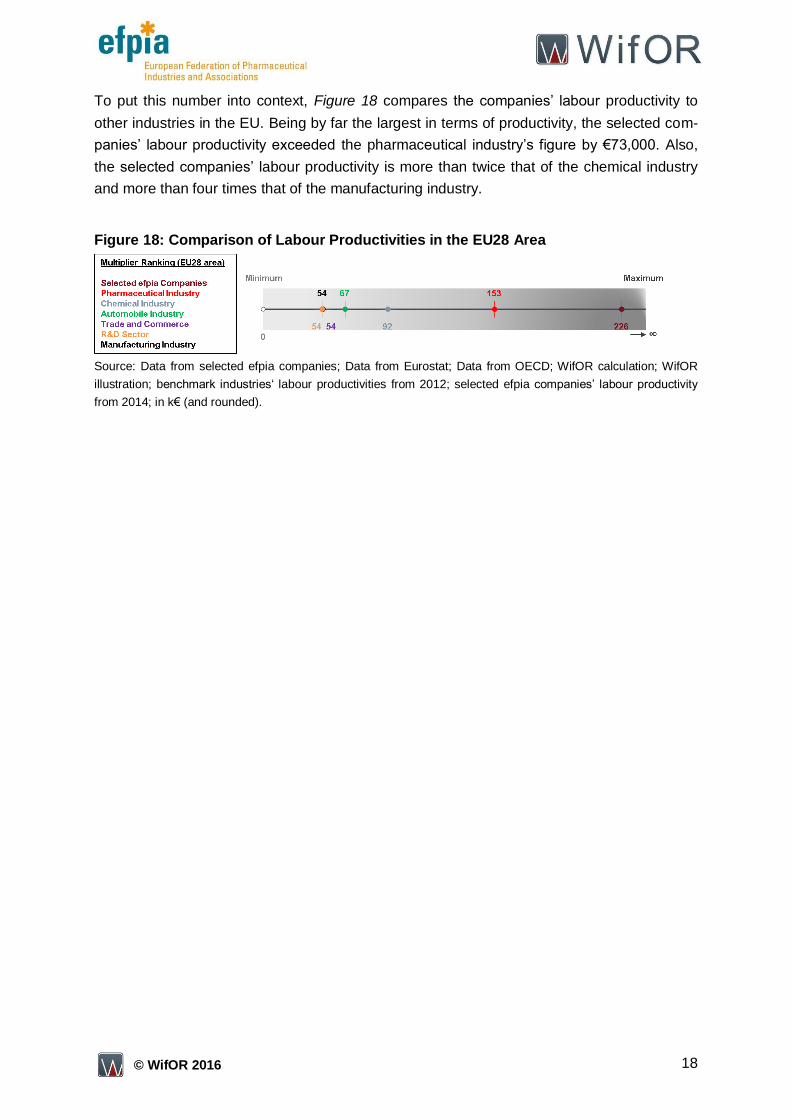
To put this number into context, Figure 18 compares the companies’ labour productivity to
other industries in the EU. Being by far the largest in terms of productivity, the selected com-
panies’ labour productivity exceeded the pharmaceutical industry’s figure by €73,000. Also,
the selected companies’ labour productivity is more than twice that of the chemical industry
and more than four times that of the manufacturing industry.
Figure 18: Comparison of Labour Productivities in the EU28 Area
Source: Data from selected efpia companies; Data from Eurostat; Data from OECD; WifOR calculation; WifOR
illustration; benchmark industries‘ labour productivities from 2012; selected efpia companies’ labour productivity
from 2014; in k€ (and rounded).
19 © WifOR 2016
5. Conclusion
The high total GVA impact reflects the selected companies’ contribution to powering
growth in the European business landscape. The high total employment impact shows
the selected companies’ share in driving employment in Europe. The high R&D inten-
sities prove that the selected companies are investing in innovation throughout the
European economy. In combination with in-depth explanations, the results can be
communicated to private and public stakeholders, policy makers and other groups.
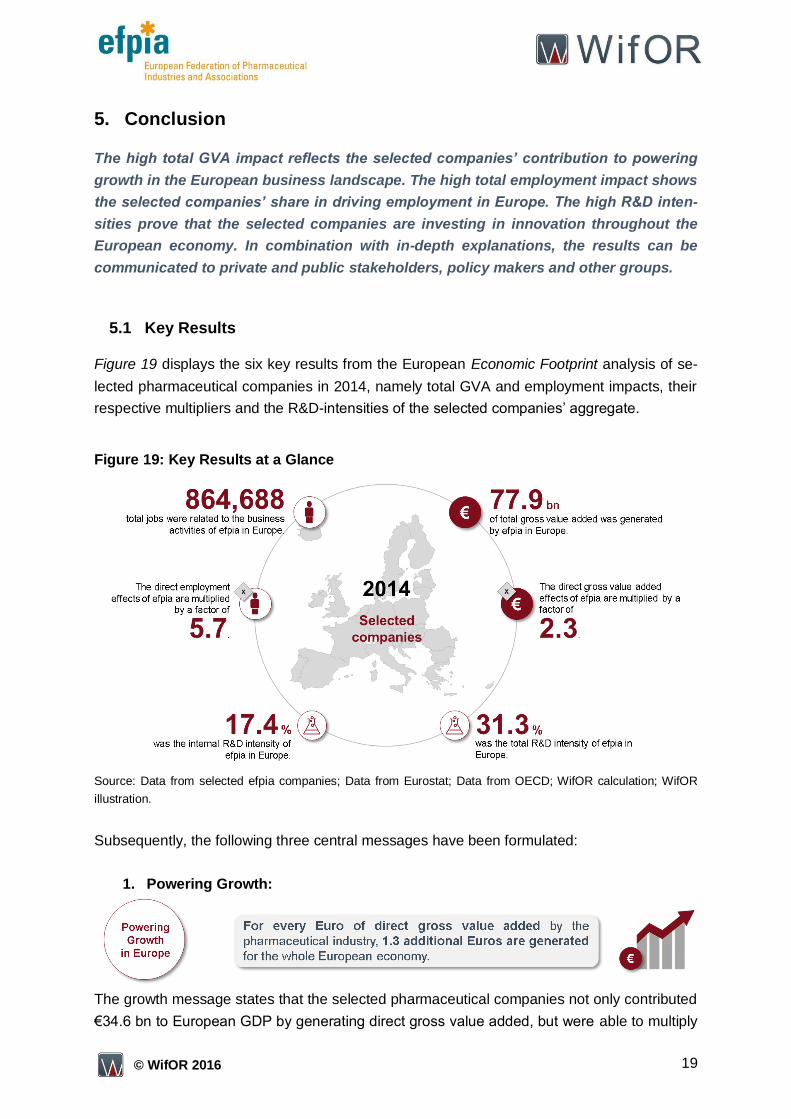
5.1 Key Results
Figure 19 displays the six key results from the European Economic Footprint analysis of se-
lected pharmaceutical companies in 2014, namely total GVA and employment impacts, their
respective multipliers and the R&D-intensities of the selected companies’ aggregate.
Figure 19: Key Results at a Glance
Source: Data from selected efpia companies; Data from Eurostat; Data from OECD; WifOR calculation; WifOR
illustration.
Subsequently, the following three central messages have been formulated:
1. Powering Growth:
The growth message states that the selected pharmaceutical companies not only contributed
€34.6 bn to European GDP by generating direct gross value added, but were able to multiply
20 © WifOR 2016
this effect by a factor of 2.3. Thus, direct effects and spillover effects in total contributed
€77.9 bn to European GDP.
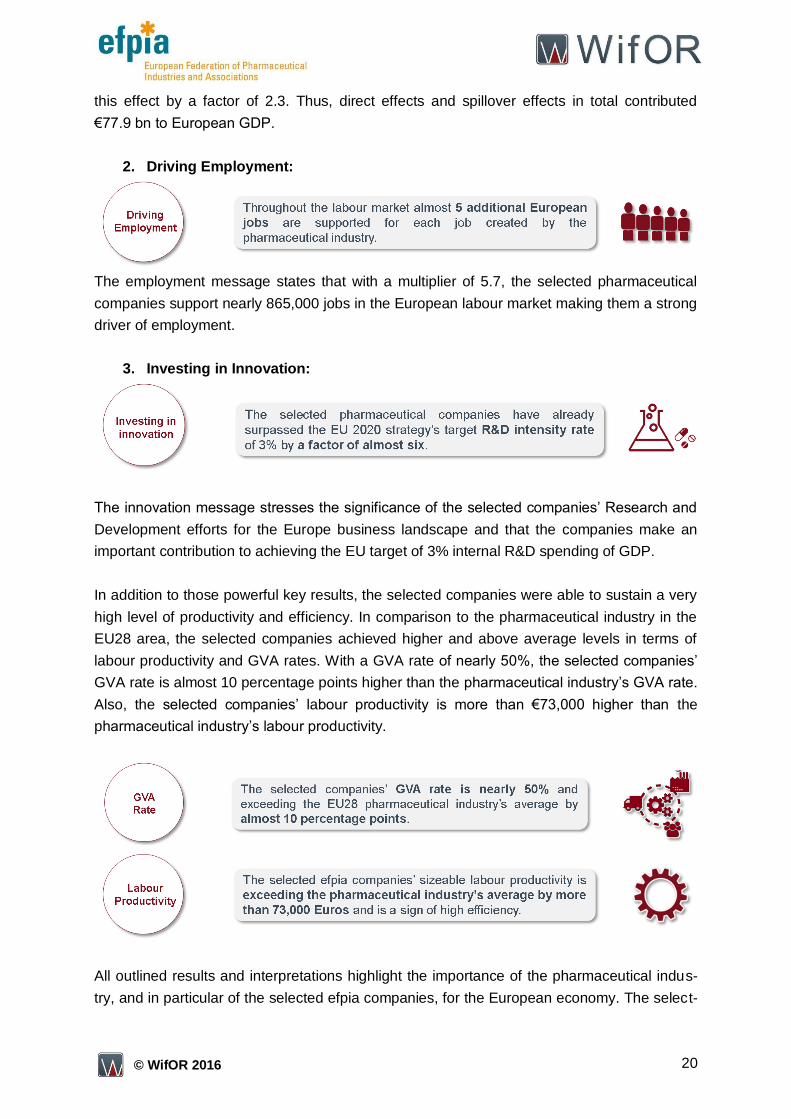
2. Driving Employment:
The employment message states that with a multiplier of 5.7, the selected pharmaceutical
companies support nearly 865,000 jobs in the European labour market making them a strong
driver of employment.
3. Investing in Innovation:
The innovation message stresses the significance of the selected companies’ Research and
Development efforts for the Europe business landscape and that the companies make an
important contribution to achieving the EU target of 3% internal R&D spending of GDP.
In addition to those powerful key results, the selected companies were able to sustain a very
high level of productivity and efficiency. In comparison to the pharmaceutical industry in the
EU28 area, the selected companies achieved higher and above average levels in terms of
labour productivity and GVA rates. With a GVA rate of nearly 50%, the selected companies’
GVA rate is almost 10 percentage points higher than the pharmaceutical industry’s GVA rate.
Also, the selected companies’ labour productivity is more than €73,000 higher than the
pharmaceutical industry’s labour productivity.
All outlined results and interpretations highlight the importance of the pharmaceutical indus-
try, and in particular of the selected efpia companies, for the European economy. The select-
21 © WifOR 2016
ed companies’ strong linkages to the European economy have enabled them to be a catalyst
for both growth and employment in the aftermath of the economic crises.
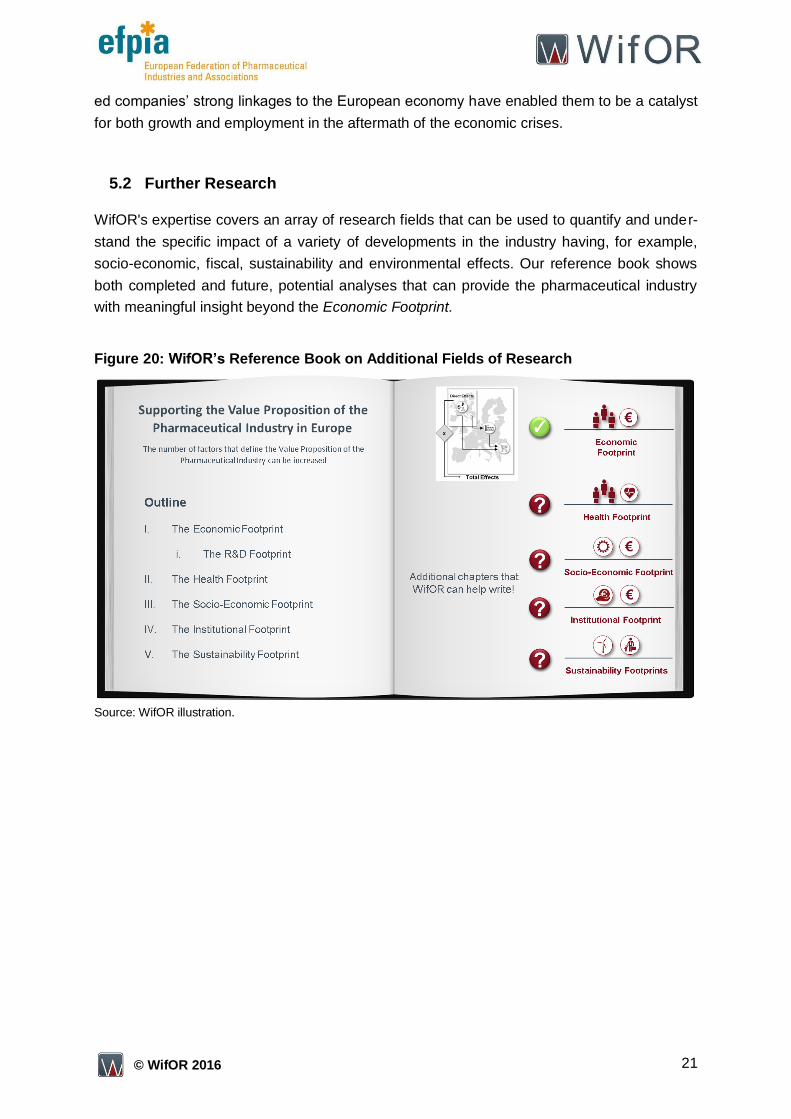
5.2 Further Research
WifOR's expertise covers an array of research fields that can be used to quantify and under-
stand the specific impact of a variety of developments in the industry having, for example,
socio-economic, fiscal, sustainability and environmental effects. Our reference book shows
both completed and future, potential analyses that can provide the pharmaceutical industry
with meaningful insight beyond the Economic Footprint.
Figure 20: WifOR’s Reference Book on Additional Fields of Research
Source: WifOR illustration.
22 © WifOR 2016
6. Methodology and Database of the Economic Footprint
The Economic Footprint traces the direct, indirect and induced economic impact of an
object of investigation and illustrates linkages to other industries. The System of Na-
tional Accounts serves as its database while the input-output analysis is the founda-
tion of the calculation method.
6.1 The company-specific European Satellite Account
6.1.1 Participating Companies
For the efpia-project, seven European pharmaceutical companies were requested to provide
representative data amounting to about 80% of their respective European revenue. The par-
ticipating pharmaceutical companies in the efpia study are Abbvie, AstraZeneca, Boehringer
Ingelheim, Ipsen, Janssen, Novartis and Sanofi. For Janssen, deep dive analyses were not
performed in the EU area, only the European analysis.
6.1.2 Types of Business Entities
Every type of business entity that contributes gross value added to the national Gross Do-
mestic Product (GDP) was included, e.g.
» Private Limited Company (Ltd.)
» Limited Partnership,
» Statutory Company,
» Holding Company
and more.
6.1.3 Time Period
The calculations are made for the time period reaching from 2010 until 2014. The company-
specific European satellite accounts from 2010 until 2014 are compiled for AstraZeneca,
Sanofi, Ispen, Boehringer Ingelheim and Janssen. In the case of Novartis, the data was only
provided for 2014 and for Abbvie the data was only available for 2013. This fact leads to level
effects for the other years, since the identical company-specific European satellite account
has been added throughout the period of interest for Novartis and Abbvie.
6.1.4 Data Collection Process
The data collection process was complex and time consuming. The best practice was to use
official national questionnaires that have already been filled out by the relevant companies in
connection with obligatory annual official surveys (see below Figure 21) from the national
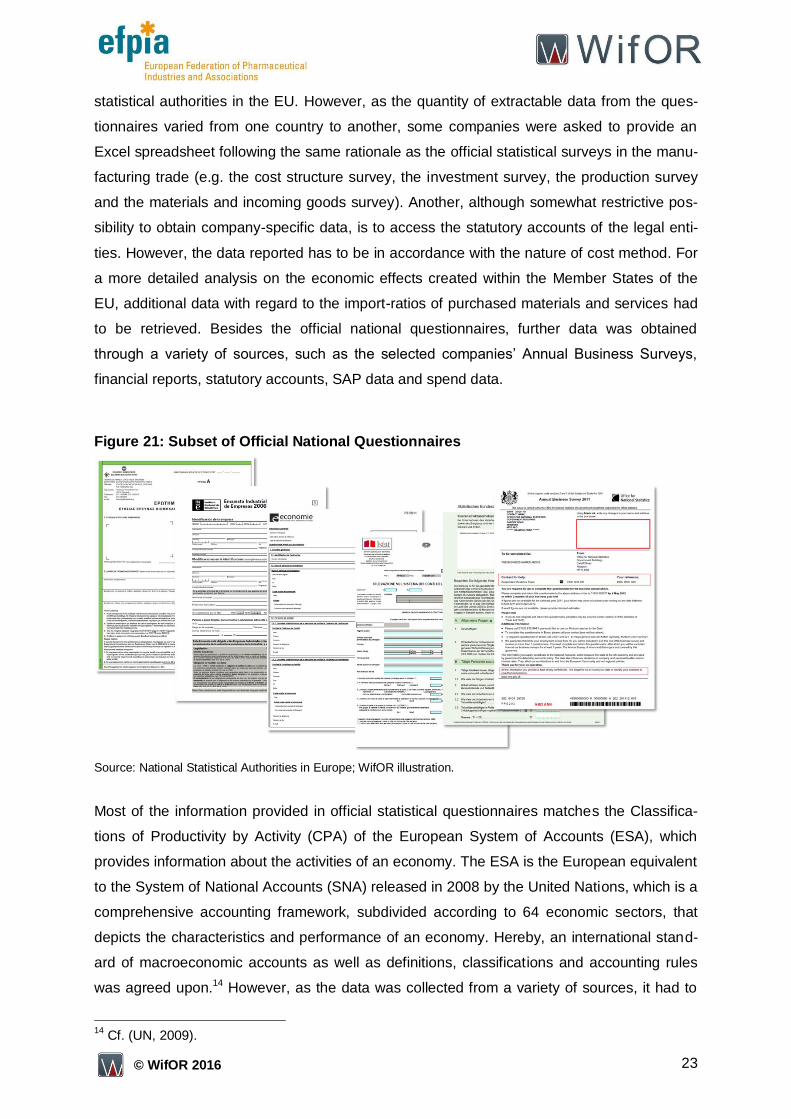
23 © WifOR 2016
statistical authorities in the EU. However, as the quantity of extractable data from the ques-
tionnaires varied from one country to another, some companies were asked to provide an
Excel spreadsheet following the same rationale as the official statistical surveys in the manu-
facturing trade (e.g. the cost structure survey, the investment survey, the production survey
and the materials and incoming goods survey). Another, although somewhat restrictive pos-
sibility to obtain company-specific data, is to access the statutory accounts of the legal enti-
ties. However, the data reported has to be in accordance with the nature of cost method. For
a more detailed analysis on the economic effects created within the Member States of the
EU, additional data with regard to the import-ratios of purchased materials and services had
to be retrieved. Besides the official national questionnaires, further data was obtained
through a variety of sources, such as the selected companies’ Annual Business Surveys,
financial reports, statutory accounts, SAP data and spend data.
Figure 21: Subset of Official National Questionnaires
Source: National Statistical Authorities in Europe; WifOR illustration.
Most of the information provided in official statistical questionnaires matches the Classifica-
tions of Productivity by Activity (CPA) of the European System of Accounts (ESA), which
provides information about the activities of an economy. The ESA is the European equivalent
to the System of National Accounts (SNA) released in 2008 by the United Nations, which is a
comprehensive accounting framework, subdivided according to 64 economic sectors, that
depicts the characteristics and performance of an economy. Hereby, an international stand-
ard of macroeconomic accounts as well as definitions, classifications and accounting rules
was agreed upon.14 However, as the data was collected from a variety of sources, it had to
14
Cf. (UN, 2009).
24 © WifOR 2016
be validated prior to being assigned to homogeneous sectors of the CPA, i.e. the production
of unique goods or services identified by their unique production structure. In addition, at a
later stage of the compilation, the collected data was transformed from purchasers’ prices
into basic prices, i.e. excluding the use of imported products and taxes less subsidies.
6.1.5 Input-Output Table
For the calculation of the group-specific Economic Footprint in the EU area, EU-28 symmet-
ric input-output tables (SIOT) for domestic output with a breakdown of 64 activities/products
provided by Eurostat according to the ESA 2010 methodology were used. The necessary
tables were downloaded from the Eurostat website for the years 2010, 2011 and 2012. The
SIOTs are product-by-product or industry-by-industry matrices combining both supply and
use into a single table with identical classification of products or industries, applied to both
rows and columns. The product-by-product input-output table is compiled by converting the
supply and use tables, both at basic prices. This involves a change in format, i.e. from two
asymmetric tables into one symmetric table. The conversion can be divided into three steps:
first, the allocation of secondary products in the supply table to the industries of which they
are the principal products; second, the rearrangement of columns of the use table from in-
puts into industries to inputs into homogeneous sectors (without aggregation of the rows),
and third, the aggregation of detailed products (rows) of the new use table to the homogene-
ous sectors shown in the columns, if appropriate.15
6.1.6 Compilation of the Company-Specific European Satellite Account
The data collection exercise allowed for the aggregation of seven company-specific European
satellite accounts, each of which is made up of numerous company-specific national satellite
accounts. The compilation of a company-specific European satellite account was conducted
in four steps: first, the allocation and distribution of company-specific cost positions; second,
the aggregation to numerous company-specific European homogenous sectors; third, the
purchasers’ price conversion into basic prices; fourth, the aggregation to one company-
specific European satellite account; fifth, the extrapolation to 100% of the company-specific
European Satellite Account.
i. Allocation and Distribution of Company-Specific Cost Positions
The company’s business activities that can differ from one legal entity to another are split in
accordance with CPA-units of homogenous sectors. The distinction between the company’s
national output shares of goods and services is decisive for the split into homogenous sec-
tors. In the case of the selected companies, the business activities were spread across the
15
Cf. (Eurostat, 2016).
25 © WifOR 2016
following homogenous sectors: basic pharmaceutical products and pharmaceutical prepara-
tions (CPA_C21); wholesale trade services, except of motor vehicles and motorcycles
(CPA_G46); scientific research and development activities (CPA_M72); legal and accounting
services, services of head offices, management consulting (PA_M69_M70); chemical and
chemical products (CPA_C20). Furthermore, the company data was used to derive the com-
pany-specific national satellite accounts either by directly allocating the cost positions that
are clearly assignable to CPA units, or, for cost positions that are not clearly allocable to one
specific CPA unit, by distributing the cost across the remaining CPA units by means of inter-
mediate consumption distribution of their respective homogenous national sectors. Both allo-
cation and distribution occurs in purchasers’ prices using national Input-Output Tables (IOT)
provided by Eurostat. Company-specific national accounts purposefully resort to national
IOTs in order to preserve the national economic structure of the linkages with the economy
when distributing cost positions that are not clearly allocable to one particular CPA unit.
ii. Aggregation to Numerous Company-Specific European Homogenous Sec-
tors
The company-specific homogeneous national sectors from every company-specific national
satellite account are then aggregated to inter-company-specific homogeneous European
sectors, respectively. This is done by summing up all company-specific French, Swedish,
German, Italian, etc. homogenous national sectors such as “basic pharmaceutical products
and pharmaceutical preparations”, “wholesale trade services, except of motor vehicles and
motorcycles”, etc. Thus, every company is represented by up to five inter-company-specific
homogenous European sectors.
iii. Purchasers’ Price Conversion into Basic Prices
Next, the intercompany-specific homogenous European sectors’ purchasers’ prices are con-
verted into basic prices. The prices are converted based on the respective sectors’ share of
imports and taxes less subsidies provided by the EU-28 domestic symmetric IOT (ESA 2010
methodology). This procedure is based on the assumption that the selected companies’ ex-
tra-EU-28 gross imports of intermediate goods and services is small compared to their intra-
EU-28 imports of intermediate consumption. This assumption is supported by 2011 figures
made available by the OECD, stating that the EU-28 gross import share of intermediate
goods and services from the “World“ equals 10.11%, the EU-28 gross import share of inter-
mediate goods and services of the Chemical Industry, which includes the Pharmaceutical
industry, equals 15.53% and the EU-28 gross import share of intermediate goods and ser-
vices of the Wholesale industry equals 11.46%. Thus, the EU-28 intra-European market is
more important to the European businesses than the rest of the world.16
16
Cf. (OECD, 2016b). Data from: Trade in Value Added (TiVA) Database.
26 © WifOR 2016
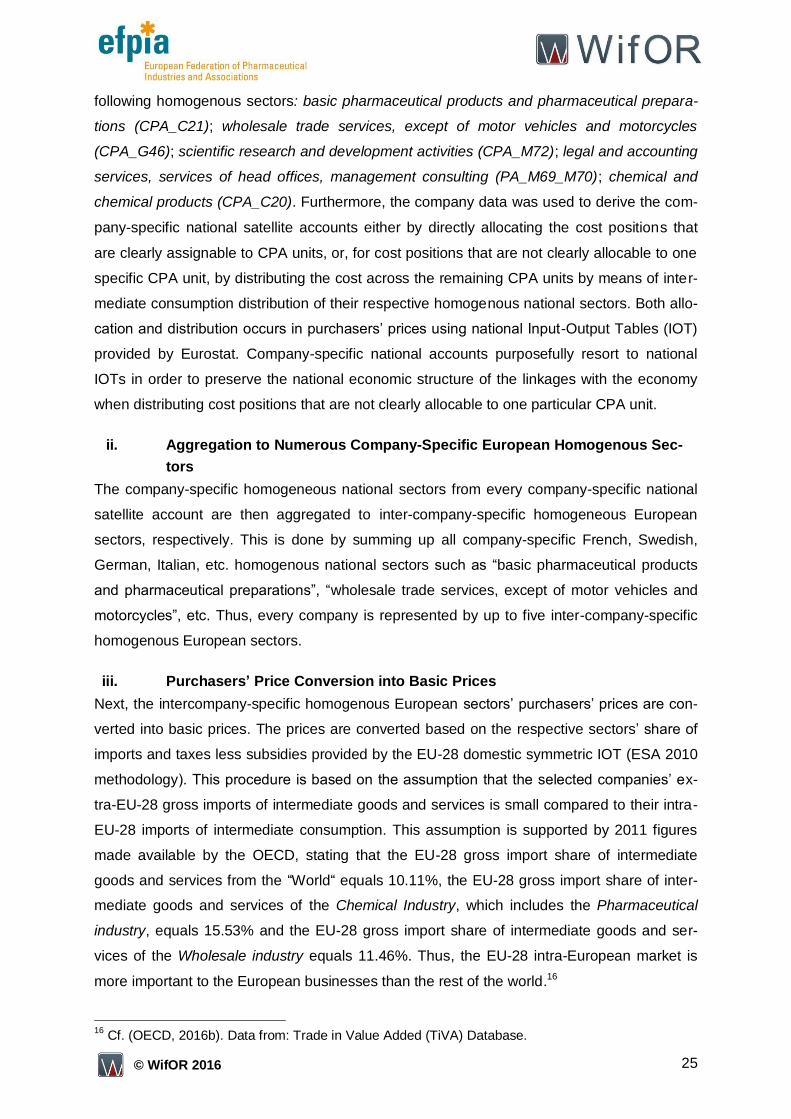
iv. Aggregation to one Company-Specific European Satellite Account
The numerous company-specific homogenous European sectors are then aggregated into
one company-specific European satellite account (see below Figure 22).
Figure 22: Illustration of the Company-Specific European Satellite Account
Source: WifOR illustration.
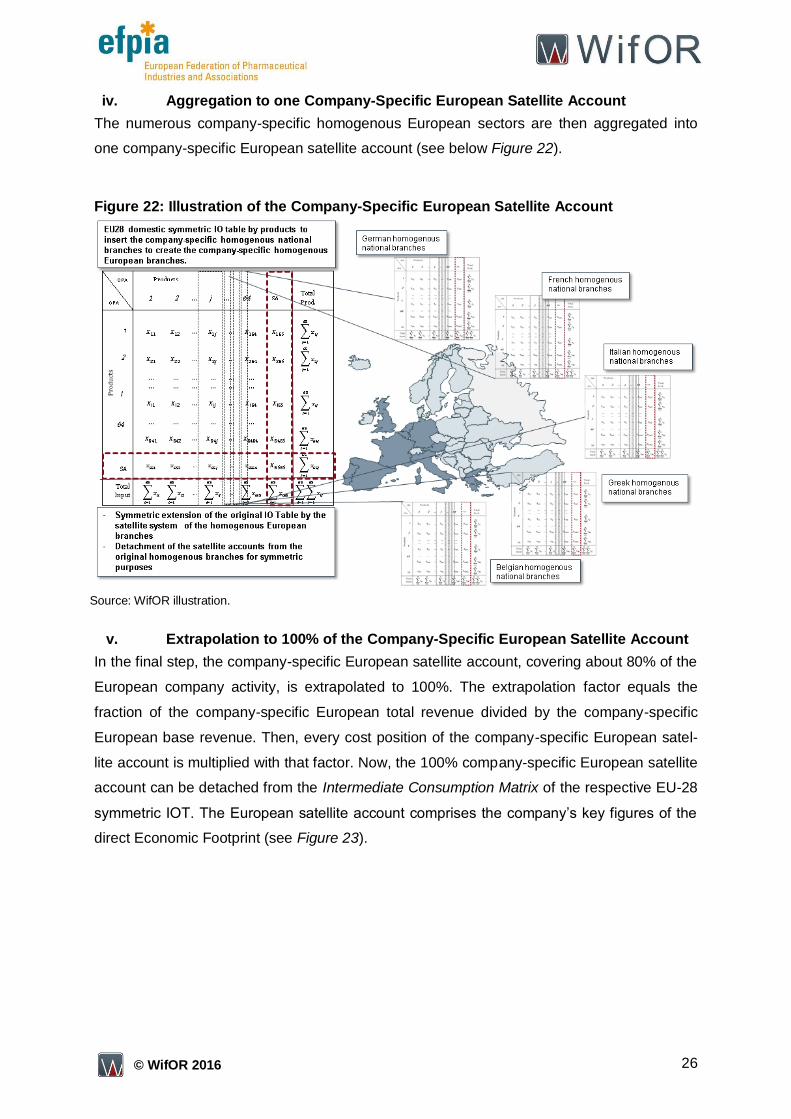
v. Extrapolation to 100% of the Company-Specific European Satellite Account
In the final step, the company-specific European satellite account, covering about 80% of the
European company activity, is extrapolated to 100%. The extrapolation factor equals the
fraction of the company-specific European total revenue divided by the company-specific
European base revenue. Then, every cost position of the company-specific European satel-
lite account is multiplied with that factor. Now, the 100% company-specific European satellite
account can be detached from the Intermediate Consumption Matrix of the respective EU-28
symmetric IOT. The European satellite account comprises the company’s key figures of the
direct Economic Footprint (see Figure 23).
27 © WifOR 2016
Figure 23: Schematic Illustration of the Satellite Account
Source: WifOR illustration.
6.2 The Group-Specific European Satellite Account
6.2.1 Database for the Group-Specific European Satellite Account
The aggregation of the seven company-specific European satellite accounts into one group-
specific European satellite account includes the major business units and legal entities of the
seven pharmaceutical companies within the EU 28 area. This group-specific European satel-
lite account shows the economic interrelationships of the group’s activity in the European
economy and the linked sectors. Prior to the aggregation of the company-specific European
satellite accounts, the compilation of the group-specific European satellite account was
based on a number of important steps, such as the delivery of a database of about 80% of
the European business by every participating company, the transformation of the delivered
data into the categories of the System of National Accounts (SNA) and the compilation of
100% of the company-specific European satellite accounts.
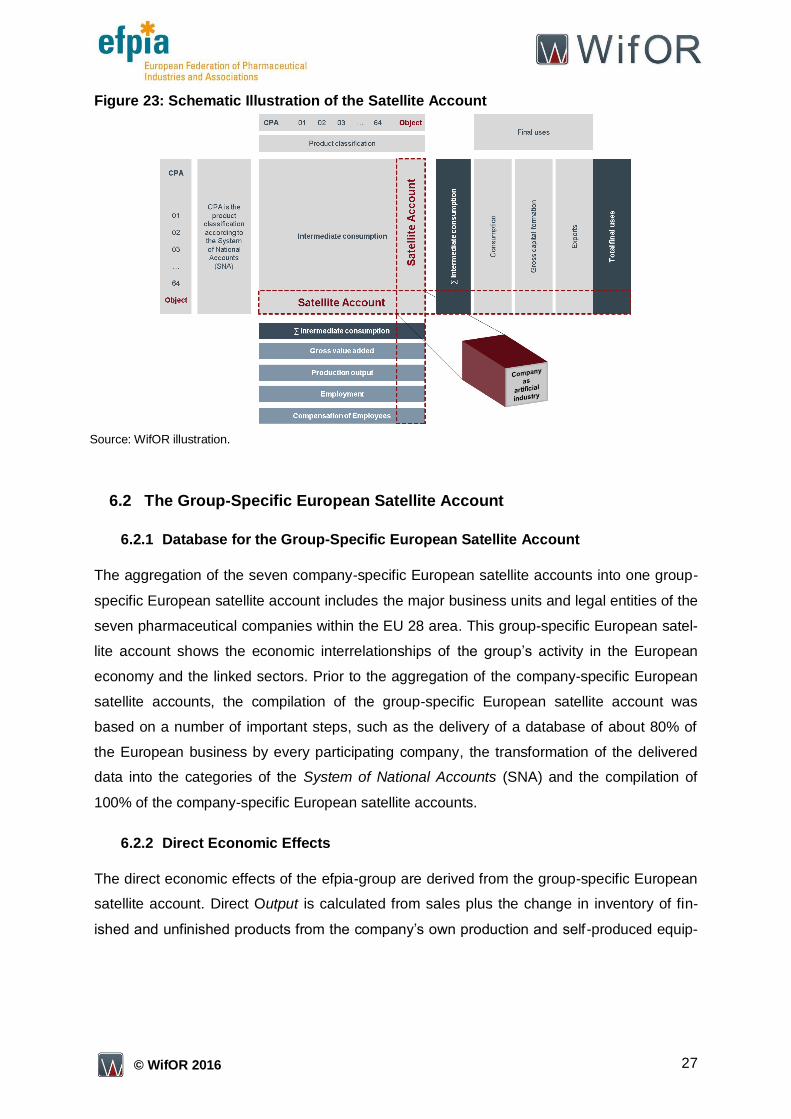
6.2.2 Direct Economic Effects
The direct economic effects of the efpia-group are derived from the group-specific European
satellite account. Direct Output is calculated from sales plus the change in inventory of fin-
ished and unfinished products from the company’s own production and self-produced equip-
28 © WifOR 2016
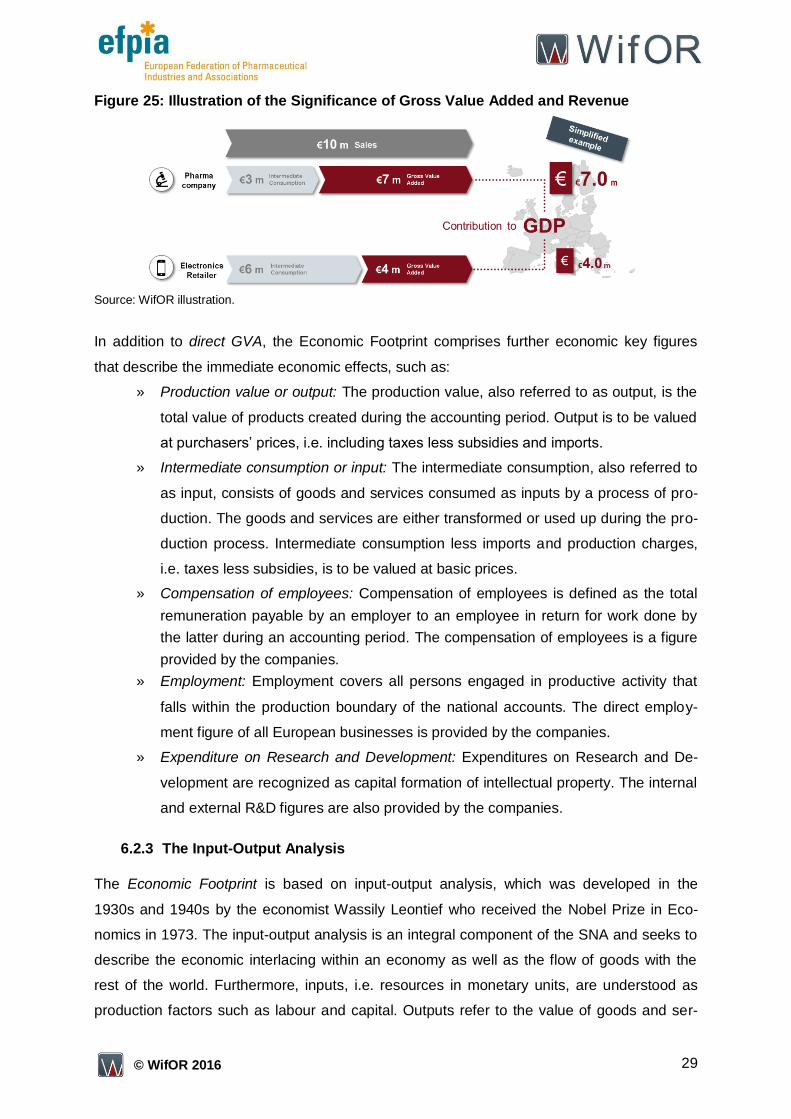
ment less merchandise.17 The central figure is the gross value added (GVA), which is deter-
mined by subtracting intermediate inputs from output (see below Figure 24).
Figure 24: Calculation of Direct Economic Effects
Source: WifOR illustration.
The GVA is more than a simple residuum - it represents any company’s share of the Gross
Domestic Product (GDP). The direct GVA is used to assess the size as well as the perfor-
mance of a company, an industry, a sector and even an economy. Thus, the direct GVA indi-
cates the company’s contribution to the GDP of the national economy. In order to illustrate
the significance of the direct GVA,
Figure 25 shows two direct GVAs of different companies that produce the same amount of
sales. In contrast to revenue, the amount of intermediate consumption used in the production
process determines the level of direct GVA. In our example, the pharmaceutical company
contributes more to GDP (per employee) than the electronics retailer. Following the argu-
mentation above, the direct GVA is better suited to state a company’s economic perfor-
mance.
17
For a detailed treatment of the topic cf. (Destatis, 2010), p. 4ff. The entire methodological represen-tation has been highly simplified in this section.
29 © WifOR 2016
Figure 25: Illustration of the Significance of Gross Value Added and Revenue
Source: WifOR illustration.
In addition to direct GVA, the Economic Footprint comprises further economic key figures
that describe the immediate economic effects, such as:
» Production value or output: The production value, also referred to as output, is the
total value of products created during the accounting period. Output is to be valued
at purchasers’ prices, i.e. including taxes less subsidies and imports.
» Intermediate consumption or input: The intermediate consumption, also referred to
as input, consists of goods and services consumed as inputs by a process of pro-
duction. The goods and services are either transformed or used up during the pro-
duction process. Intermediate consumption less imports and production charges,
i.e. taxes less subsidies, is to be valued at basic prices.
» Compensation of employees: Compensation of employees is defined as the total
remuneration payable by an employer to an employee in return for work done by
the latter during an accounting period. The compensation of employees is a figure
provided by the companies.
» Employment: Employment covers all persons engaged in productive activity that
falls within the production boundary of the national accounts. The direct employ-
ment figure of all European businesses is provided by the companies.
» Expenditure on Research and Development: Expenditures on Research and De-
velopment are recognized as capital formation of intellectual property. The internal
and external R&D figures are also provided by the companies.
6.2.3 The Input-Output Analysis
The Economic Footprint is based on input-output analysis, which was developed in the
1930s and 1940s by the economist Wassily Leontief who received the Nobel Prize in Eco-
nomics in 1973. The input-output analysis is an integral component of the SNA and seeks to
describe the economic interlacing within an economy as well as the flow of goods with the
rest of the world. Furthermore, inputs, i.e. resources in monetary units, are understood as
production factors such as labour and capital. Outputs refer to the value of goods and ser-
30 © WifOR 2016
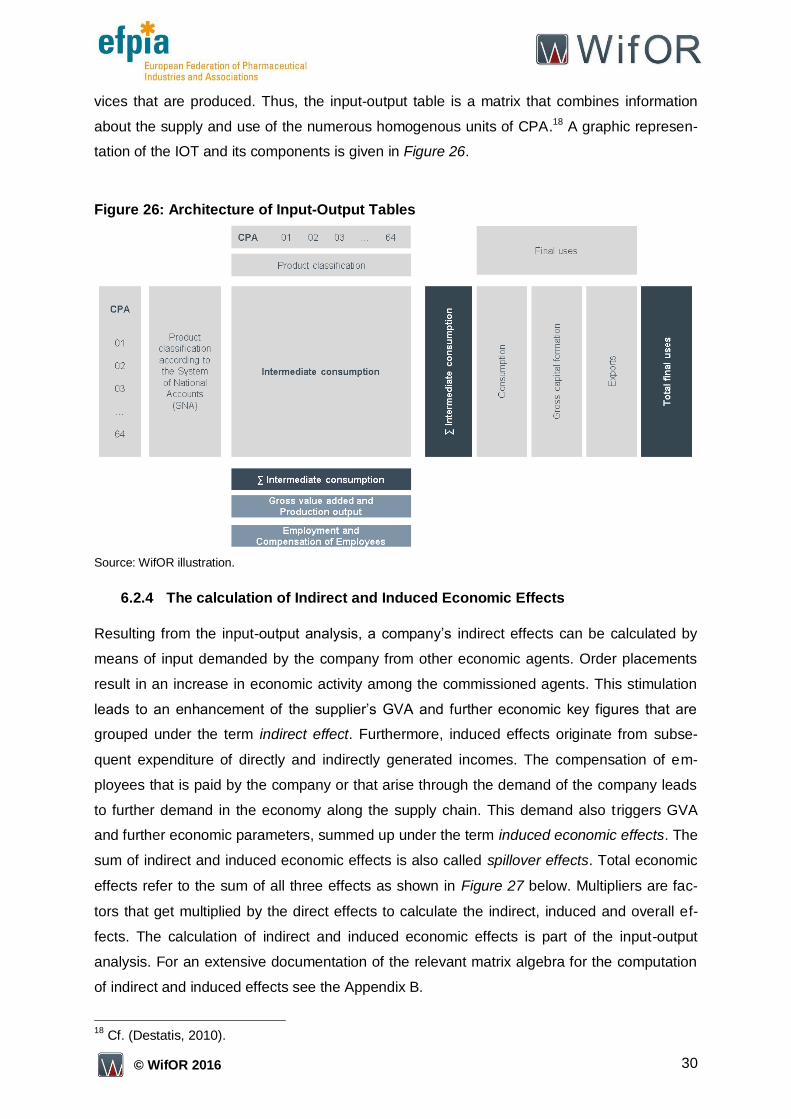
vices that are produced. Thus, the input-output table is a matrix that combines information
about the supply and use of the numerous homogenous units of CPA.18 A graphic represen-
tation of the IOT and its components is given in Figure 26.
Figure 26: Architecture of Input-Output Tables
Source: WifOR illustration.
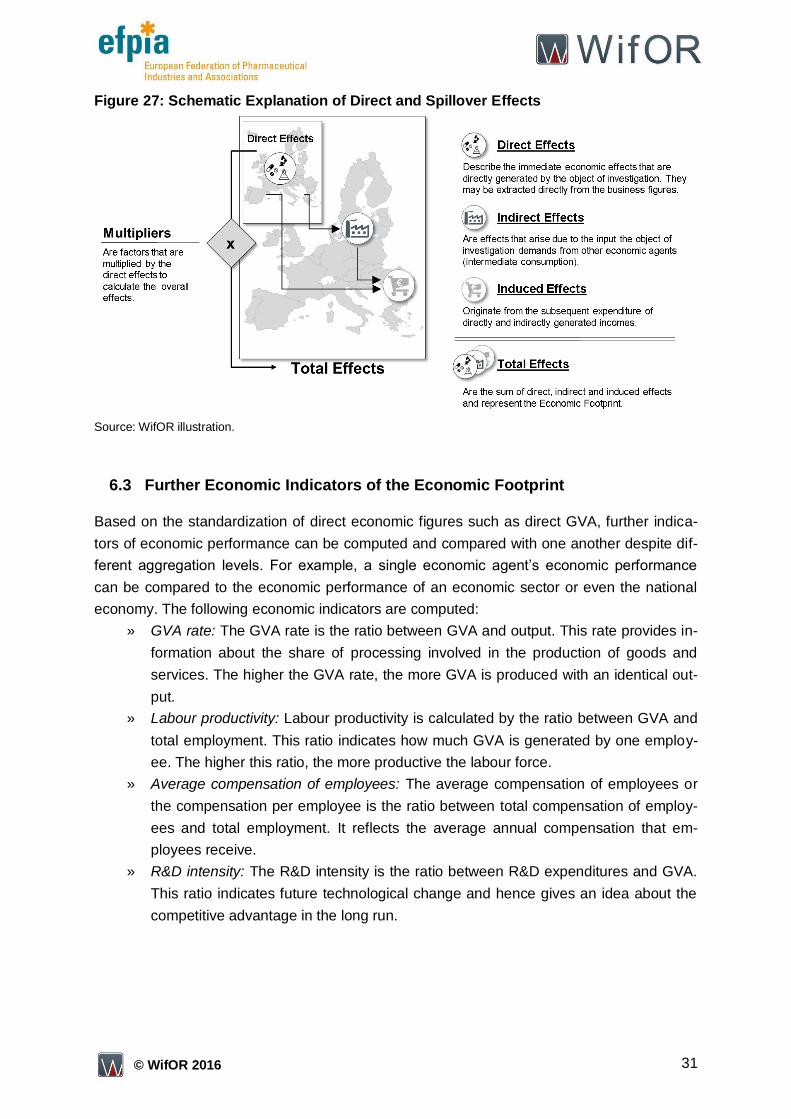
6.2.4 The calculation of Indirect and Induced Economic Effects
Resulting from the input-output analysis, a company’s indirect effects can be calculated by
means of input demanded by the company from other economic agents. Order placements
result in an increase in economic activity among the commissioned agents. This stimulation
leads to an enhancement of the supplier’s GVA and further economic key figures that are
grouped under the term indirect effect. Furthermore, induced effects originate from subse-
quent expenditure of directly and indirectly generated incomes. The compensation of em-
ployees that is paid by the company or that arise through the demand of the company leads
to further demand in the economy along the supply chain. This demand also triggers GVA
and further economic parameters, summed up under the term induced economic effects. The
sum of indirect and induced economic effects is also called spillover effects. Total economic
effects refer to the sum of all three effects as shown in Figure 27 below. Multipliers are fac-
tors that get multiplied by the direct effects to calculate the indirect, induced and overall ef-
fects. The calculation of indirect and induced economic effects is part of the input-output
analysis. For an extensive documentation of the relevant matrix algebra for the computation
of indirect and induced effects see the Appendix B.
18
Cf. (Destatis, 2010).
31 © WifOR 2016
Figure 27: Schematic Explanation of Direct and Spillover Effects
Source: WifOR illustration.
6.3 Further Economic Indicators of the Economic Footprint
Based on the standardization of direct economic figures such as direct GVA, further indica-
tors of economic performance can be computed and compared with one another despite dif-
ferent aggregation levels. For example, a single economic agent’s economic performance
can be compared to the economic performance of an economic sector or even the national
economy. The following economic indicators are computed:
» GVA rate: The GVA rate is the ratio between GVA and output. This rate provides in-
formation about the share of processing involved in the production of goods and
services. The higher the GVA rate, the more GVA is produced with an identical out-
put.
» Labour productivity: Labour productivity is calculated by the ratio between GVA and
total employment. This ratio indicates how much GVA is generated by one employ-
ee. The higher this ratio, the more productive the labour force.
» Average compensation of employees: The average compensation of employees or
the compensation per employee is the ratio between total compensation of employ-
ees and total employment. It reflects the average annual compensation that em-
ployees receive.
» R&D intensity: The R&D intensity is the ratio between R&D expenditures and GVA.
This ratio indicates future technological change and hence gives an idea about the
competitive advantage in the long run.
32 © WifOR 2016
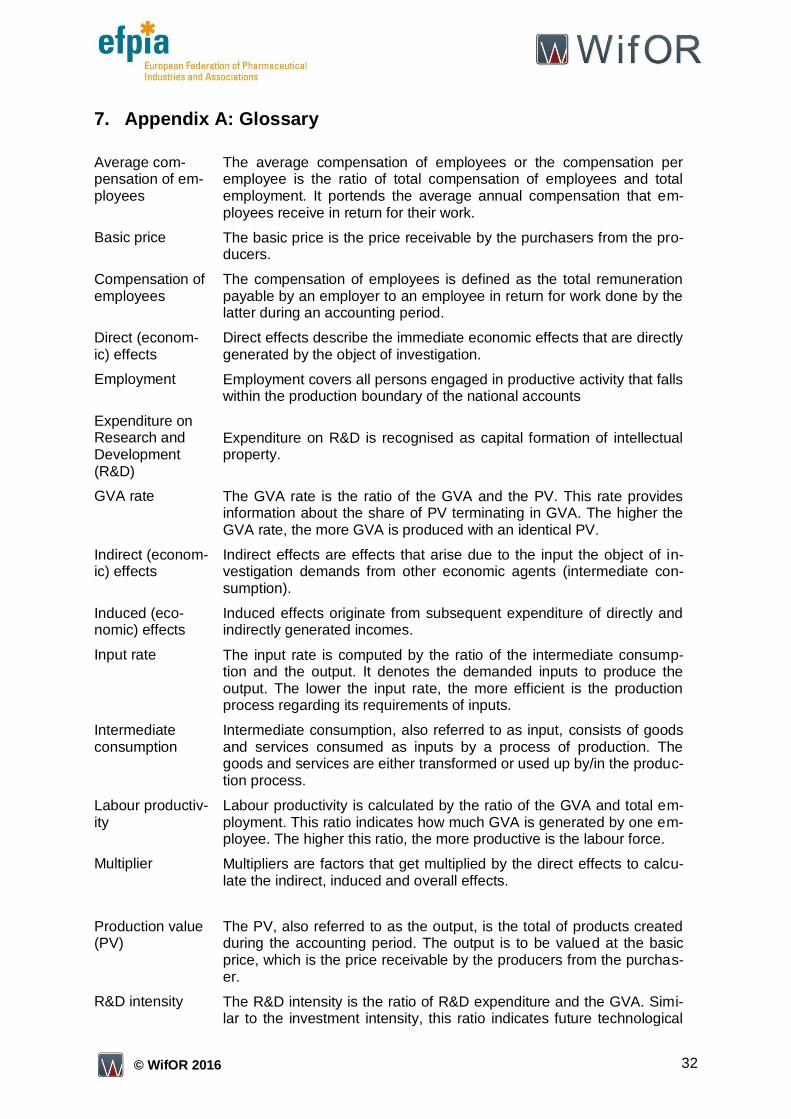
7. Appendix A: Glossary
Average com-pensation of em-ployees
The average compensation of employees or the compensation per employee is the ratio of total compensation of employees and total employment. It portends the average annual compensation that em-ployees receive in return for their work.
Basic price The basic price is the price receivable by the purchasers from the pro-ducers.
Compensation of employees
The compensation of employees is defined as the total remuneration payable by an employer to an employee in return for work done by the latter during an accounting period.
Direct (econom-ic) effects
Direct effects describe the immediate economic effects that are directly generated by the object of investigation.
Employment Employment covers all persons engaged in productive activity that falls within the production boundary of the national accounts
Expenditure on Research and Development (R&D)
Expenditure on R&D is recognised as capital formation of intellectual property.
GVA rate The GVA rate is the ratio of the GVA and the PV. This rate provides information about the share of PV terminating in GVA. The higher the GVA rate, the more GVA is produced with an identical PV.
Indirect (econom-ic) effects
Indirect effects are effects that arise due to the input the object of in-vestigation demands from other economic agents (intermediate con-sumption).
Induced (eco-nomic) effects
Induced effects originate from subsequent expenditure of directly and indirectly generated incomes.
Input rate The input rate is computed by the ratio of the intermediate consump-tion and the output. It denotes the demanded inputs to produce the output. The lower the input rate, the more efficient is the production process regarding its requirements of inputs.
Intermediate consumption
Intermediate consumption, also referred to as input, consists of goods and services consumed as inputs by a process of production. The goods and services are either transformed or used up by/in the produc-tion process.
Labour productiv-ity
Labour productivity is calculated by the ratio of the GVA and total em-ployment. This ratio indicates how much GVA is generated by one em-ployee. The higher this ratio, the more productive is the labour force.
Multiplier Multipliers are factors that get multiplied by the direct effects to calcu-late the indirect, induced and overall effects.
Production value (PV)
The PV, also referred to as the output, is the total of products created during the accounting period. The output is to be valued at the basic price, which is the price receivable by the producers from the purchas-er.
R&D intensity The R&D intensity is the ratio of R&D expenditure and the GVA. Simi-lar to the investment intensity, this ratio indicates future technological

33 © WifOR 2016
change and hence gives an idea about the competitive advantage in the long run.
Spillover effects Spillover effects are the sum of indirect and induced economic effects.
Total (economic) effects
Total economic effects are the sum of the direct and spillover effects.
34 © WifOR 2016
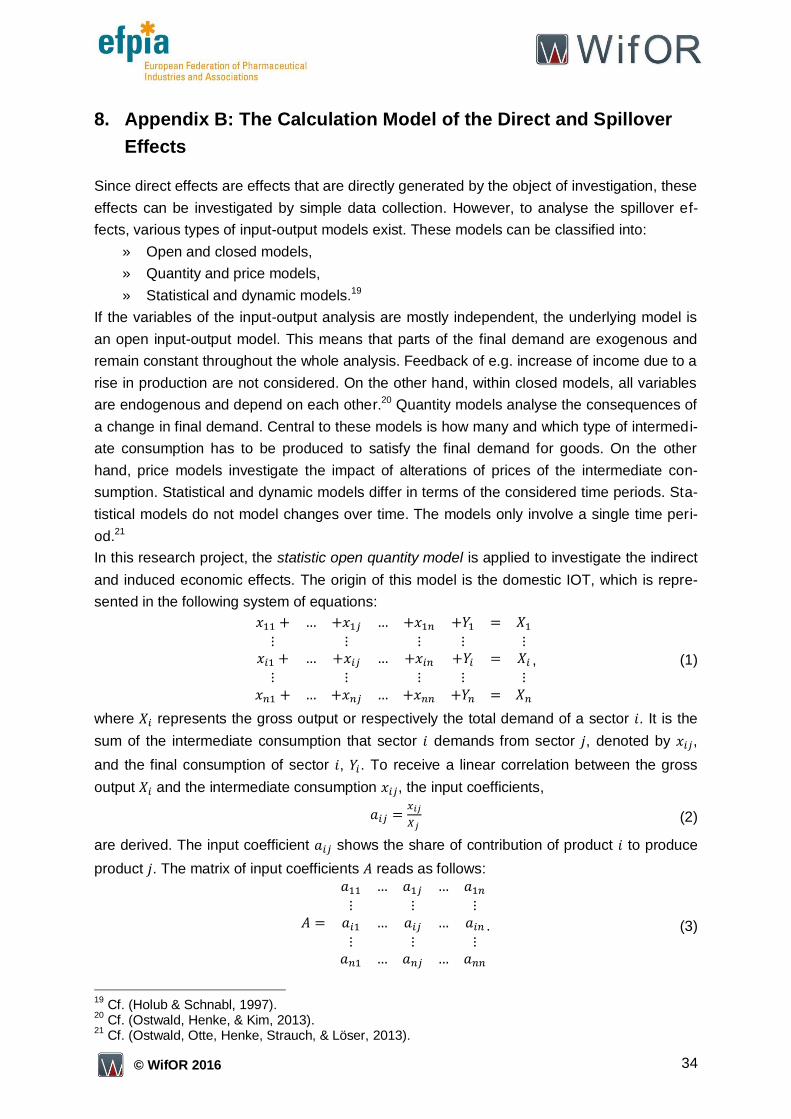
8. Appendix B: The Calculation Model of the Direct and Spillover
Effects
Since direct effects are effects that are directly generated by the object of investigation, these
effects can be investigated by simple data collection. However, to analyse the spillover ef-
fects, various types of input-output models exist. These models can be classified into:
» Open and closed models,
» Quantity and price models,
» Statistical and dynamic models.19
If the variables of the input-output analysis are mostly independent, the underlying model is
an open input-output model. This means that parts of the final demand are exogenous and
remain constant throughout the whole analysis. Feedback of e.g. increase of income due to a
rise in production are not considered. On the other hand, within closed models, all variables
are endogenous and depend on each other.20 Quantity models analyse the consequences of
a change in final demand. Central to these models is how many and which type of intermedi-
ate consumption has to be produced to satisfy the final demand for goods. On the other
hand, price models investigate the impact of alterations of prices of the intermediate con-
sumption. Statistical and dynamic models differ in terms of the considered time periods. Sta-
tistical models do not model changes over time. The models only involve a single time peri-
od.21
In this research project, the statistic open quantity model is applied to investigate the indirect
and induced economic effects. The origin of this model is the domestic IOT, which is repre-
sented in the following system of equations:
, (1)
where represents the gross output or respectively the total demand of a sector . It is the
sum of the intermediate consumption that sector demands from sector , denoted by ,
and the final consumption of sector , . To receive a linear correlation between the gross
output and the intermediate consumption , the input coefficients,
(2)
are derived. The input coefficient shows the share of contribution of product to produce
product . The matrix of input coefficients reads as follows:
. (3)
19
Cf. (Holub & Schnabl, 1997). 20
Cf. (Ostwald, Henke, & Kim, 2013). 21
Cf. (Ostwald, Otte, Henke, Strauch, & Löser, 2013).
35 © WifOR 2016
Equation (2) and (3) can be substituted into Equation (1):
, (4)
yielding the following equation in matrix notation:
, (5)
with denoting the vector of gross output, is the vector of final consumption.
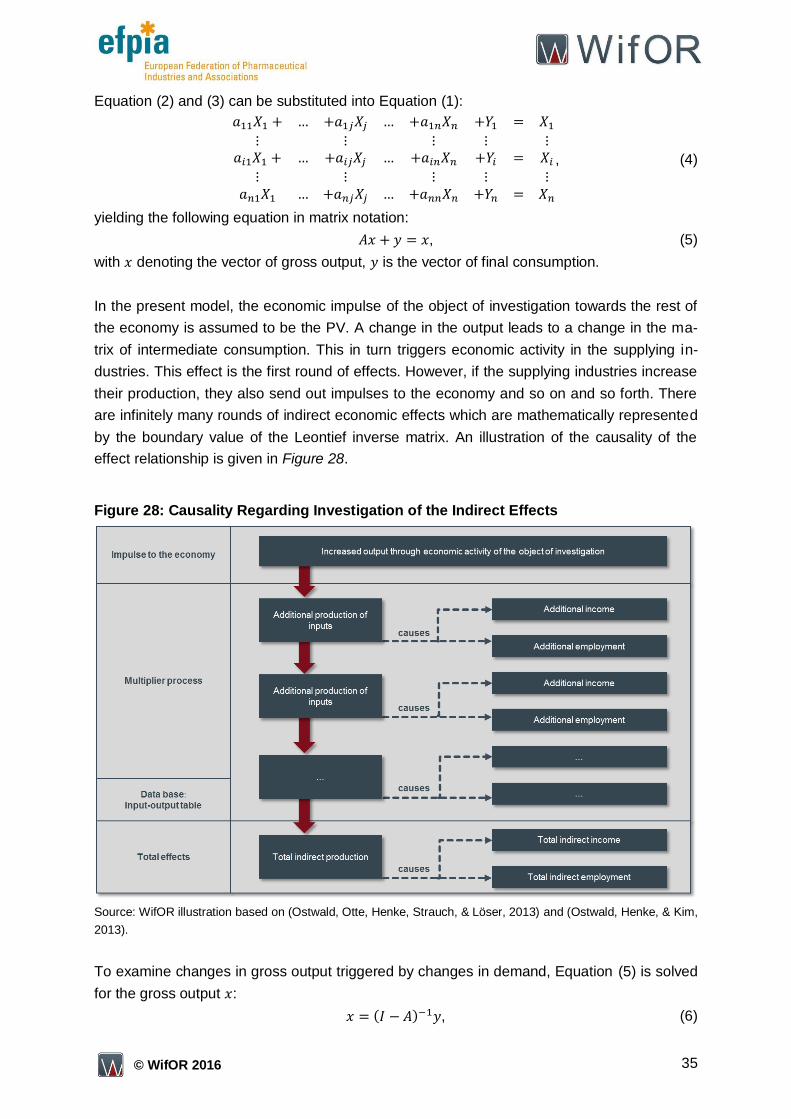
In the present model, the economic impulse of the object of investigation towards the rest of
the economy is assumed to be the PV. A change in the output leads to a change in the ma-
trix of intermediate consumption. This in turn triggers economic activity in the supplying in-
dustries. This effect is the first round of effects. However, if the supplying industries increase
their production, they also send out impulses to the economy and so on and so forth. There
are infinitely many rounds of indirect economic effects which are mathematically represented
by the boundary value of the Leontief inverse matrix. An illustration of the causality of the
effect relationship is given in Figure 28.
Figure 28: Causality Regarding Investigation of the Indirect Effects
Source: WifOR illustration based on (Ostwald, Otte, Henke, Strauch, & Löser, 2013) and (Ostwald, Henke, & Kim,
2013).
To examine changes in gross output triggered by changes in demand, Equation (5) is solved
for the gross output :
( ) , (6)
36 © WifOR 2016
with being the identity matrix. The first term is called the Leontief inverse matrix :
( ) . 22 (7)
Furthermore, the Leontief inverse matrix is standardized, i.e. the main diagonal elements
contain the value 1 only. This new matrix , the technology matrix, is crucial for changes in
output given a change in demand, hence it is crucial for calculation of the indirect effects:
( ) (8)
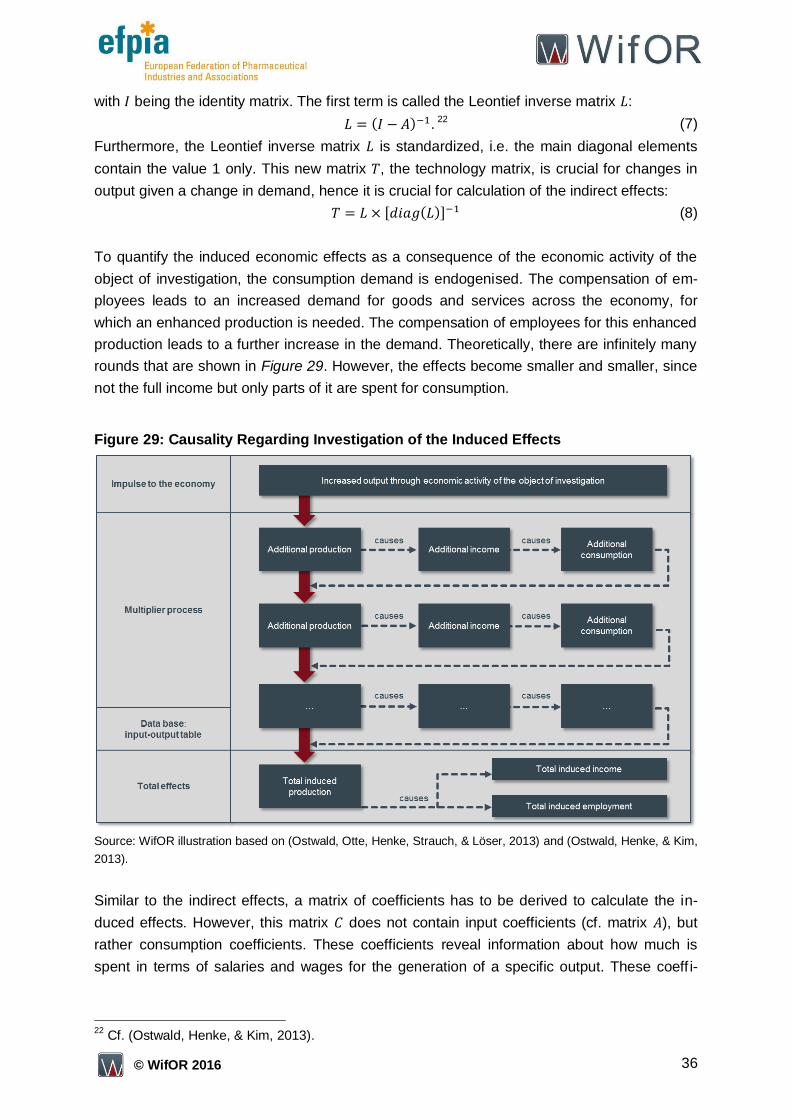
To quantify the induced economic effects as a consequence of the economic activity of the
object of investigation, the consumption demand is endogenised. The compensation of em-
ployees leads to an increased demand for goods and services across the economy, for
which an enhanced production is needed. The compensation of employees for this enhanced
production leads to a further increase in the demand. Theoretically, there are infinitely many
rounds that are shown in Figure 29. However, the effects become smaller and smaller, since
not the full income but only parts of it are spent for consumption.
Figure 29: Causality Regarding Investigation of the Induced Effects
Source: WifOR illustration based on (Ostwald, Otte, Henke, Strauch, & Löser, 2013) and (Ostwald, Henke, & Kim,
2013).
Similar to the indirect effects, a matrix of coefficients has to be derived to calculate the in-
duced effects. However, this matrix does not contain input coefficients (cf. matrix ), but
rather consumption coefficients. These coefficients reveal information about how much is
spent in terms of salaries and wages for the generation of a specific output. These coeff i-
22
Cf. (Ostwald, Henke, & Kim, 2013).
37 © WifOR 2016
cients are computed by the product of the vector of the consumption rate and a vector of
coefficients of the compensation of employees :
, (9)
where is a vector consisting of the ratio of the compensation of employees in the produc-
tion sector , , and the output of the production sector , :
. 23 (10)
The standardized technology matrix for calculation of the induced economic effects then
reads as follows:
( ) , (11)
with:
( ) . (12)
Production Value Effects
To compute the PV effects, the technology matrices and are multiplied with the initial
impulse, the PV . First, the sum of the direct and indirect PV effect, , is reached:
, (13)
with being equal to the direct PV effect, :
. (14)
Subtraction of the direct effect, yields the indirect PV:
. 24 (15)
The following equation yields the total production effect:
, (16)
from which the direct and indirect effects are subtracted to achieve the induced PV effect:
.25 (17)
Gross Value Added Effects
To compute the value added effects, the model is expanded by a matrix with the following
elements on the main diagonal:
. (18)
The coefficients result from the GVA of the production areas , , and the PV of the same
production area , .
With these coefficients, the indirect and induced GVA effects are calculated (cf. Equation
(20) and (22)):
(19)
23
Cf. (Ostwald, Henke, & Kim, 2013). 24
Cf. (Ostwald, Henke, & Kim, 2013). 25
Cf. (Ostwald, Henke, & Kim, 2013).
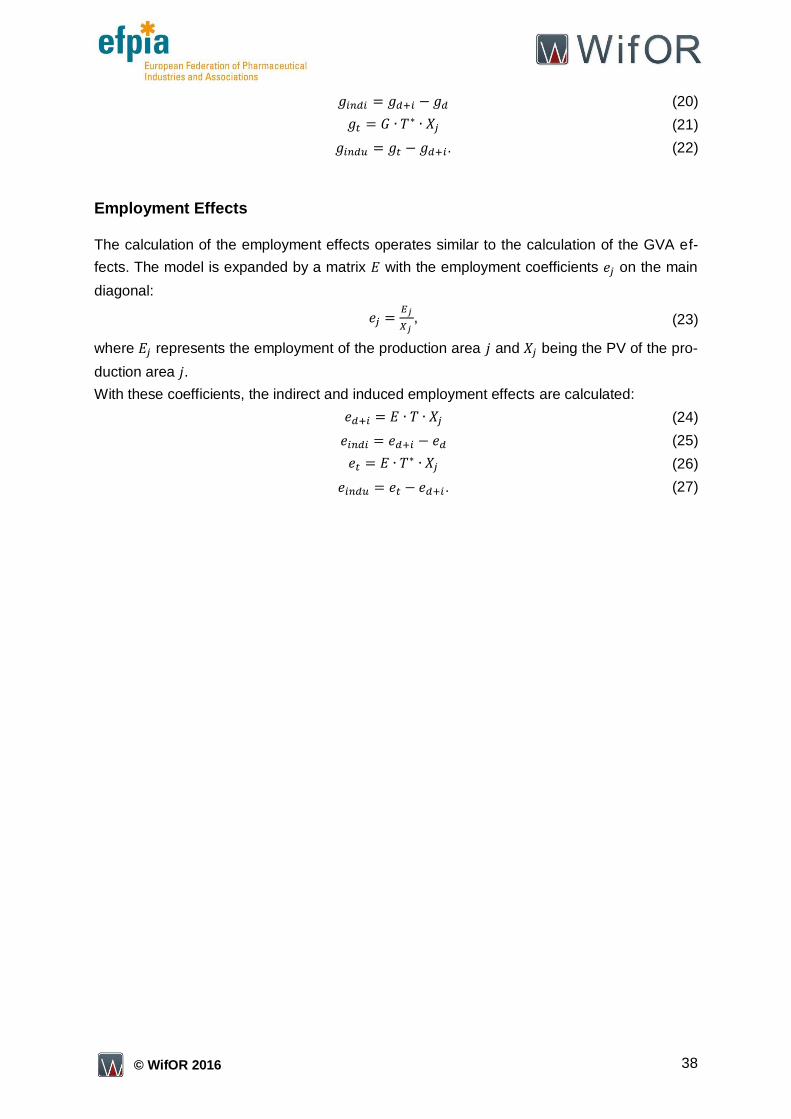
38 © WifOR 2016
(20)
(21)
. (22)
Employment Effects
The calculation of the employment effects operates similar to the calculation of the GVA ef-
fects. The model is expanded by a matrix with the employment coefficients on the main
diagonal:
, (23)
where represents the employment of the production area and being the PV of the pro-
duction area .
With these coefficients, the indirect and induced employment effects are calculated:
(24)
(25)
(26)
. (27)
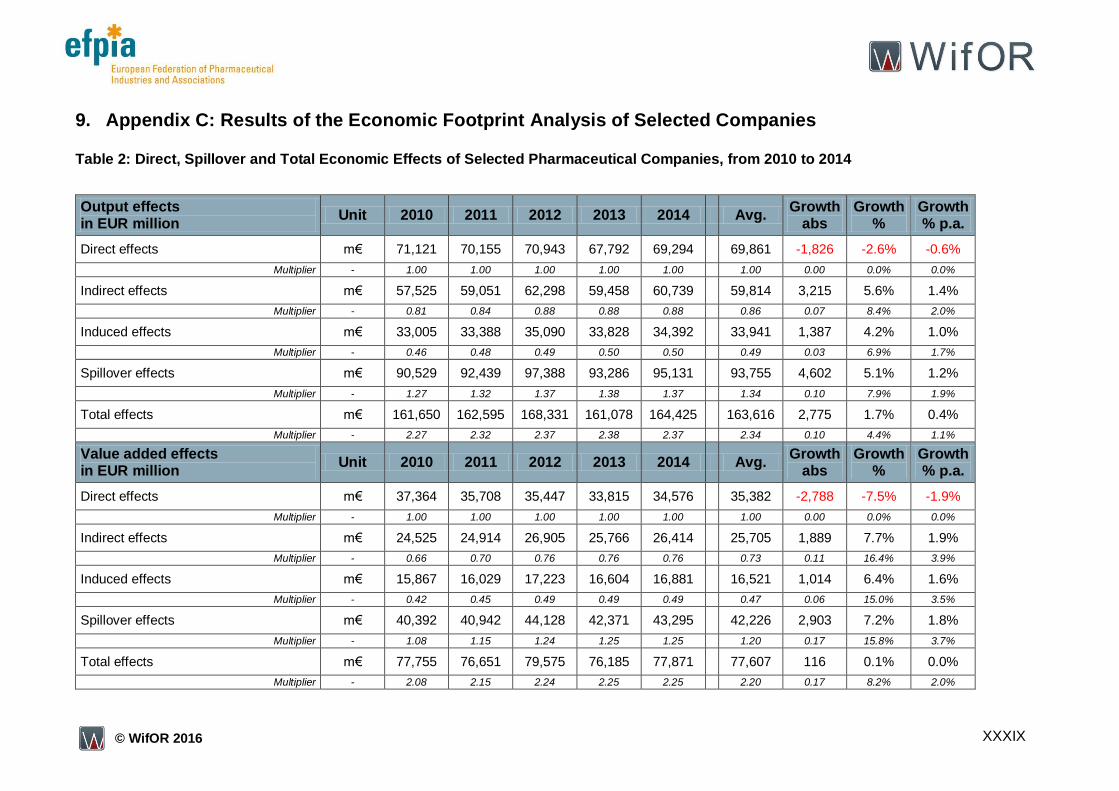
XXXIX © WifOR 2016
9. Appendix C: Results of the Economic Footprint Analysis of Selected Companies
Table 2: Direct, Spillover and Total Economic Effects of Selected Pharmaceutical Companies, from 2010 to 2014
Output effects in EUR million
Unit 2010 2011 2012 2013 2014 Avg. Growth
abs Growth
% Growth % p.a.
Direct effects m€ 71,121 70,155 70,943 67,792 69,294 69,861 -1,826 -2.6% -0.6%
Multiplier - 1.00 1.00 1.00 1.00 1.00 1.00 0.00 0.0% 0.0%
Indirect effects m€ 57,525 59,051 62,298 59,458 60,739 59,814 3,215 5.6% 1.4%
Multiplier - 0.81 0.84 0.88 0.88 0.88 0.86 0.07 8.4% 2.0%
Induced effects m€ 33,005 33,388 35,090 33,828 34,392 33,941 1,387 4.2% 1.0%
Multiplier - 0.46 0.48 0.49 0.50 0.50 0.49 0.03 6.9% 1.7%
Spillover effects m€ 90,529 92,439 97,388 93,286 95,131 93,755 4,602 5.1% 1.2%
Multiplier - 1.27 1.32 1.37 1.38 1.37 1.34 0.10 7.9% 1.9%
Total effects m€ 161,650 162,595 168,331 161,078 164,425 163,616 2,775 1.7% 0.4%
Multiplier - 2.27 2.32 2.37 2.38 2.37 2.34 0.10 4.4% 1.1%
Value added effects in EUR million
Unit 2010 2011 2012 2013 2014 Avg. Growth
abs Growth
% Growth % p.a.
Direct effects m€ 37,364 35,708 35,447 33,815 34,576 35,382 -2,788 -7.5% -1.9%
Multiplier - 1.00 1.00 1.00 1.00 1.00 1.00 0.00 0.0% 0.0%
Indirect effects m€ 24,525 24,914 26,905 25,766 26,414 25,705 1,889 7.7% 1.9%
Multiplier - 0.66 0.70 0.76 0.76 0.76 0.73 0.11 16.4% 3.9%
Induced effects m€ 15,867 16,029 17,223 16,604 16,881 16,521 1,014 6.4% 1.6%
Multiplier - 0.42 0.45 0.49 0.49 0.49 0.47 0.06 15.0% 3.5%
Spillover effects m€ 40,392 40,942 44,128 42,371 43,295 42,226 2,903 7.2% 1.8%
Multiplier - 1.08 1.15 1.24 1.25 1.25 1.20 0.17 15.8% 3.7%
Total effects m€ 77,755 76,651 79,575 76,185 77,871 77,607 116 0.1% 0.0%
Multiplier - 2.08 2.15 2.24 2.25 2.25 2.20 0.17 8.2% 2.0%
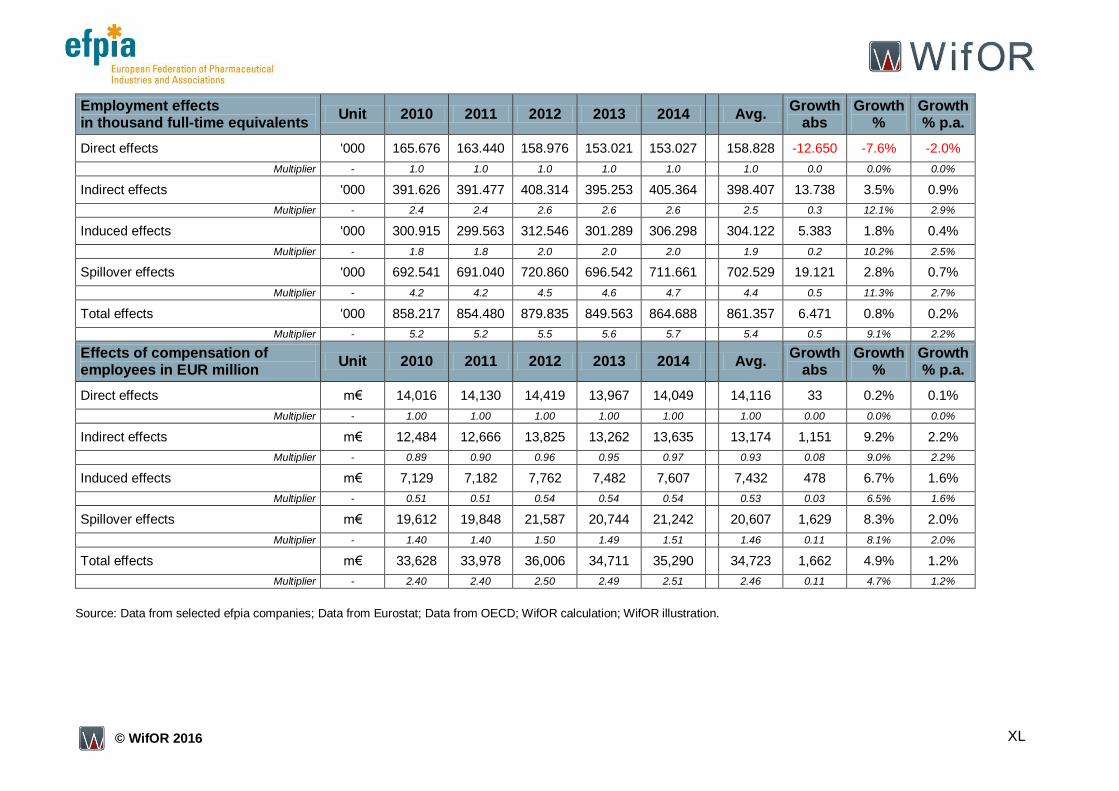
XL © WifOR 2016
Employment effects in thousand full-time equivalents
Unit 2010 2011 2012 2013 2014 Avg. Growth
abs Growth
% Growth % p.a.
Direct effects '000 165.676 163.440 158.976 153.021 153.027 158.828 -12.650 -7.6% -2.0%
Multiplier - 1.0 1.0 1.0 1.0 1.0 1.0 0.0 0.0% 0.0%
Indirect effects '000 391.626 391.477 408.314 395.253 405.364 398.407 13.738 3.5% 0.9%
Multiplier - 2.4 2.4 2.6 2.6 2.6 2.5 0.3 12.1% 2.9%
Induced effects '000 300.915 299.563 312.546 301.289 306.298 304.122 5.383 1.8% 0.4%
Multiplier - 1.8 1.8 2.0 2.0 2.0 1.9 0.2 10.2% 2.5%
Spillover effects '000 692.541 691.040 720.860 696.542 711.661 702.529 19.121 2.8% 0.7%
Multiplier - 4.2 4.2 4.5 4.6 4.7 4.4 0.5 11.3% 2.7%
Total effects '000 858.217 854.480 879.835 849.563 864.688 861.357 6.471 0.8% 0.2%
Multiplier - 5.2 5.2 5.5 5.6 5.7 5.4 0.5 9.1% 2.2%
Effects of compensation of employees in EUR million
Unit 2010 2011 2012 2013 2014 Avg. Growth
abs Growth
% Growth % p.a.
Direct effects m€ 14,016 14,130 14,419 13,967 14,049 14,116 33 0.2% 0.1%
Multiplier - 1.00 1.00 1.00 1.00 1.00 1.00 0.00 0.0% 0.0%
Indirect effects m€ 12,484 12,666 13,825 13,262 13,635 13,174 1,151 9.2% 2.2%
Multiplier - 0.89 0.90 0.96 0.95 0.97 0.93 0.08 9.0% 2.2%
Induced effects m€ 7,129 7,182 7,762 7,482 7,607 7,432 478 6.7% 1.6%
Multiplier - 0.51 0.51 0.54 0.54 0.54 0.53 0.03 6.5% 1.6%
Spillover effects m€ 19,612 19,848 21,587 20,744 21,242 20,607 1,629 8.3% 2.0%
Multiplier - 1.40 1.40 1.50 1.49 1.51 1.46 0.11 8.1% 2.0%
Total effects m€ 33,628 33,978 36,006 34,711 35,290 34,723 1,662 4.9% 1.2%
Multiplier - 2.40 2.40 2.50 2.49 2.51 2.46 0.11 4.7% 1.2%
Source: Data from selected efpia companies; Data from Eurostat; Data from OECD; WifOR calculation; WifOR illustration.
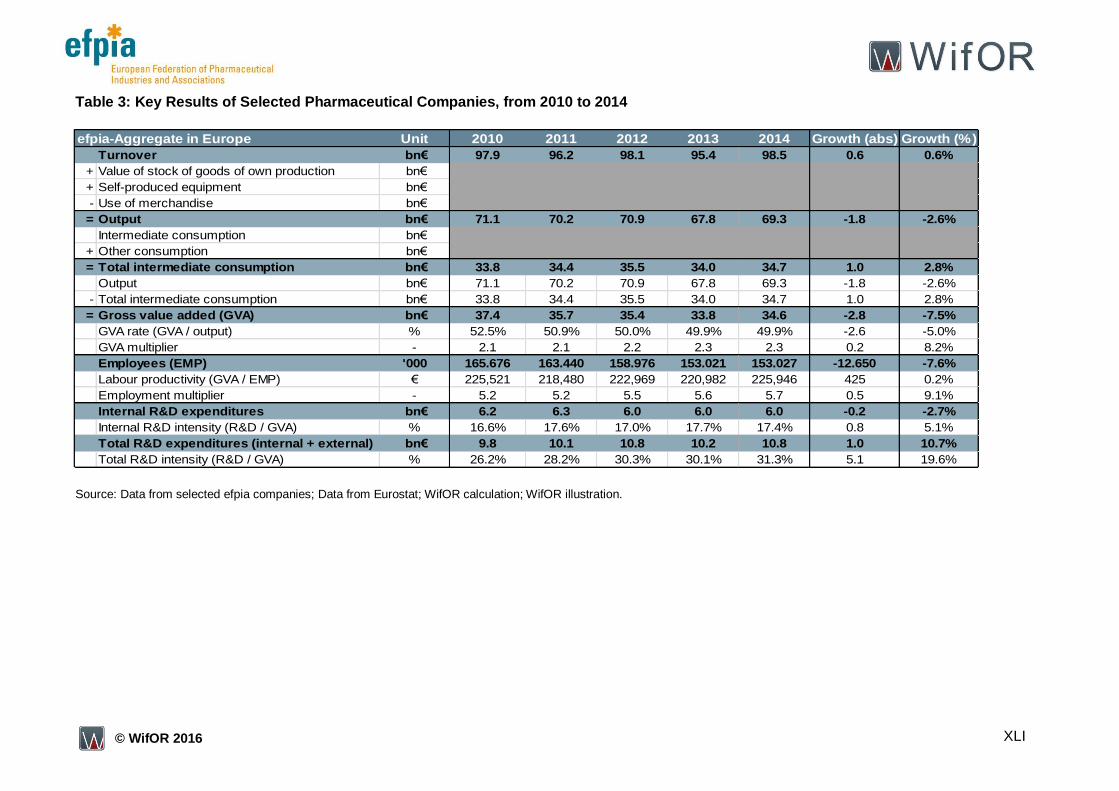
XLI © WifOR 2016
Table 3: Key Results of Selected Pharmaceutical Companies, from 2010 to 2014
Source: Data from selected efpia companies; Data from Eurostat; WifOR calculation; WifOR illustration.
efpia-Aggregate in Europe Unit 2010 2011 2012 2013 2014 Growth (abs) Growth (%)
Turnover bn€ 97.9 96.2 98.1 95.4 98.5 0.6 0.6%
+ Value of stock of goods of own production bn€
+ Self-produced equipment bn€
- Use of merchandise bn€
= Output bn€ 71.1 70.2 70.9 67.8 69.3 -1.8 -2.6%
Intermediate consumption bn€
+ Other consumption bn€
= Total intermediate consumption bn€ 33.8 34.4 35.5 34.0 34.7 1.0 2.8%
Output bn€ 71.1 70.2 70.9 67.8 69.3 -1.8 -2.6%
- Total intermediate consumption bn€ 33.8 34.4 35.5 34.0 34.7 1.0 2.8%
= Gross value added (GVA) bn€ 37.4 35.7 35.4 33.8 34.6 -2.8 -7.5%
GVA rate (GVA / output) % 52.5% 50.9% 50.0% 49.9% 49.9% -2.6 -5.0%
GVA multiplier - 2.1 2.1 2.2 2.3 2.3 0.2 8.2%
Employees (EMP) '000 165.676 163.440 158.976 153.021 153.027 -12.650 -7.6%
Labour productivity (GVA / EMP) € 225,521 218,480 222,969 220,982 225,946 425 0.2%
Employment multiplier - 5.2 5.2 5.5 5.6 5.7 0.5 9.1%
Internal R&D expenditures bn€ 6.2 6.3 6.0 6.0 6.0 -0.2 -2.7%
Internal R&D intensity (R&D / GVA) % 16.6% 17.6% 17.0% 17.7% 17.4% 0.8 5.1%
Total R&D expenditures (internal + external) bn€ 9.8 10.1 10.8 10.2 10.8 1.0 10.7%
Total R&D intensity (R&D / GVA) % 26.2% 28.2% 30.3% 30.1% 31.3% 5.1 19.6%
XLII © WifOR 2016
10. References
Amsterdam Population. (2016). Retrieved 10 14, 2016, from
http://worldpopulationreview.com/world-cities/amsterdam-population/
Banchs, R. E., Silvestri, F., Liu, T.-Y., Zhang, M., Gao, S., & Lang, J. (2013). Information
Retrieval Technology. Singapore: Springer.
Destatis. (2010). Input-Output-Rechnung im Überblick. Retrieved 12 09, 2015, from
https://www.destatis.de/DE/Publikationen/Thematisch/VolkswirtschaftlicheGesamtrec
hnungen/InputOutputRechnung/InputOutputRechnungUeberblick5815116099004.pdf
?__blob=publicationFile
ECB. (2014). Annual Report 2014. Retrieved 09 02, 2016, from
http://www.ecb.europa.eu/pub/pdf/annrep/ar2014en.pdf
European Commission Communication. (2010). EUROPE 2020 - A strategy for smart,
sustainable and inclusive growth. Retrieved 09 19, 2016, from
http://www.europeanpaymentscouncil.eu/index.cfm/knowledge-bank/other-sepa-
information/european-commission-communication-europe-2020-a-strategy-for-smart-
sustainable-and-inclusive-growth-march-2010-/
Eurostat. (2008). Eurostat Manual of Supply, Use and Input-Output Tables. Retrieved 12 09,
2015, from http://ec.europa.eu/eurostat/documents/3859598/5902113/KS-RA-07-013-
EN.PDF/b0b3d71e-3930-4442-94be-70b36cea9b39?version=1.0
Eurostat. (2013). European System of Accounts (ESA) 2010. Retrieved 12 09, 2015, from
http://ec.europa.eu/eurostat/documents/3859598/5925693/KS-02-13-269-
EN.PDF/44cd9d01-bc64-40e5-bd40-d17df0c69334
Eurostat. (2016). Symmetric Input-Output Tables. Retrieved 10 01, 2016, from
http://ec.europa.eu/eurostat/web/esa-supply-use-input-
tables/methodology/symmetric-input-output-tables
Heeger, D. (2013). Quantitative Analyse der ökonomischen Bedeutung eines Unternehmens:
Vor dem Hintergrund neuer Herausforderungen in der Industriepolitik. Landau,
Germany: Lang, Peter Frankfurt.
Henke, K.-D., Neumann, K., & Schneider, M. (2010). Erstellung eines Satellitenkontos für die
Gesundheitswirtschaft in Deutschland, Forschungsprojekt im Auftrag des
Bundesministerium für Wirtschaft und Technologie. Baden-Baden.
Holub, H.-W., & Schnabl, H. (1997). Input- Output- Rechnung: Input- Output- Analyse.
Oldenbourg, Germany: Oldenbourg Wissenschaftsverlag.
Knippel, J. (2015). Der Informationsgehalt der Bruttowertschöpfung für die unternehmerische
Praxis: Wertschöpfung als Bindeglied zwischen betriebswirtschaftlicher und
volkswirtschaftlicher Leistungsmessung. Baden-Baden: Nomos.
Nobelprize.org. (2015). Wassily Leontief. Retrieved 12 10, 2015, from
http://www.nobelprize.org/nobel_prizes/economic-sciences/laureates/1973/leontief-
facts.html
OECD. (2001). Glossary of Statistical Terms - Gross Value Added. Retrieved 04 22, 2016,
from https://stats.oecd.org/glossary/detail.asp?ID=1184
XLIII © WifOR 2016
OECD. (2012). National Accounts at a Glance 2011. Paris: Organisation for Economic Co-
operation and Development (OECD) Publishing.
OECD. (2014a). OECD Economic Surveys: European Union 2014. Paris: Organisation for
Economic Co-operation and Development (OECD) Publishing.
OECD. (2014b). Health at a Glance: Europe 2014. Paris: Organisation for Economic Co-
operation and Development (OECD) Publishing.
OECD. (2015a). Input-Output Tables. Retrieved 12 09, 2015, from
http://www.oecd.org/trade/input-outputtables.htm
OECD. (2015b). Taxing Wages - Comparative tables. Retrieved 11 17, 2015, from
http://stats.oecd.org/index.aspx?DataSetCode=AWCOMP
OECD. (2015c). R&D expenditures in Industry. Paris: OECD.Stat. Retrieved 11 02, 2015,
from http://stats.oecd.org/
OECD. (2016a). OECD Economic Surveys: European Union 2016. Paris: Organisation for
Economic Co-operation and Development (OECD) Publishing.
OECD. (2016b). Measuring Trade in Value Added: An OECD-WTO joint initiative. Retrieved
08 29, 2016, from http://www.oecd.org/sti/ind/measuringtradeinvalue-addedanoecd-
wtojointinitiative.htm
Ostwald, D. A., & Knippel, J. (2013). Measuring the Economic Footprint of the
Pharmaceutical Industry. Darmstadt & Berlin, Germany: WifOR.
Ostwald, D. A., Henke, K.-D., & Kim, Z.-G. (2013). Nutzung und Weiterentwicklung des
deutschen Gesundheitssatellitenkontos (GSK) zu einer Gesundheitswirtschaftlichen
Gesamtrechnung (GGR). Darmstadt & Berlin, Germany: Bundesministerium für
Wirtschaft und Energie (BMWi).
Ostwald, D. A., Otte, C., Henke, K.-D., Strauch, G., & Löser, R. (2013). "Ökonomischer
Fußabdruck" ausgewählter Unternehmen der industriellen Gesundheitswirtschaft für
den deutschen Wirtschaftsstandort. Berlin, Germany: Industrie-förderung Gesellschaft
mbH.
Ostwald, D. A., Zubrzycki, K., & Knippel, J. (2015). Research Report: The Economic
Footprint of the Pharmaceutical Industry. Darmstadt, Berlin: International Federation
of Pharmaceutical Manufacturers and Associations (IFPMA). Retrieved 10 07, 2015,
from
http://www.ifpma.org/fileadmin/content/Publication/2015/wifor_research_report_2015
_web.pdf
The World Bank Group. (2015). Data. Retrieved 10 07, 2015, from
http://databank.worldbank.org/data/reports.aspx?source=2&Topic=3
UN. (2009). System of National Accounts 2008. Retrieved 12 08, 2015, from
http://unstats.un.org/unsd/nationalaccount/docs/SNA2008.pdf
WHO. (2016). Health Workforce. Retrieved 01 28, 2016, from http://www.who.int/hrh/com-
heeg/com-heeg-meeting-chair/en/