Embed Size (px)
Citation preview
Malaysian Financial Planning Council (MFPC) 7-�
RFP Programme - Module 1 Chapter 7: The Economic Environment and its Impact on Financial Planning
Chapter 7
The Economic Environment and its Impact on Financial Planning
Chapter Objectives
Students must be able to:
Describe Broadly the Type of Economic System in Malaysia
Describe the Two Main Branches of Economics
Describe the Key Features of the Malaysian Economy
Explain the Circular Flow Operation of the Main Economic Sectors
Explain the Financial System and its Importance
Briefly Describe the Role of the Government
Briefly Describe the Role of the Private Sector
Describe the Major Economic Activity in the Private Sector
Briefly Describe the Investment Incentives Offered by the Government
Explain Fiscal Policy
Explain Monetary Policy
Explain Business Cycles
Outline the Causes Of Inflation
Explain the Importance of Exchange Rates to Economic Analysis
Explain the Wages Policy of the Government
•
•
•
•
•
•
•
•
•
•
•
•
•
•
•
7-� Malaysian Financial Planning Council (MFPC)
RFP Programme - Module 1 Chapter 7: The Economic Environment and its Impact on Financial Planning
Chapter 7
The Economic Environment and its Impact on Financial Planning
Introduction
Financial planners are in demand in the world for a variety of reasons, one of which is their understanding of the economic environment in which we live in. The economic environment is always in a state of flux, moving and swaying but without the precision of the oceans. There are now so many active variables that affect our economy. Today it is the price of petrol and the increasing cost of food. It may be something else in the future. The economic environment plays a big part in the risk and return profile of different markets and products. The investing public is looking into the future and therefore financial planners who are helping clients invest into the future must be aware of all the variables affecting the financial markets.
In this chapter we will explore the many aspects of our economic environment that affects people and their financial life.
The Economic System
The economic system looks at the production and distribution of goods and services. Human wants and needs are manifold and each nation indulges in a tremendous variety of goods and services that it consumes. Some of these goods it produces itself but quite a significant amount is imported from other nations. The one prevalent thought in economics is the scarcity of resources and therefore these scarce resources must be allocated among competing wants.
There is a need for a social and legal framework for the orderly functioning of the economy. Malaysia has a good foundation and a well regulated economic system. There are a number of different types of economic systems in the world and each has had their history. Russia and China has or had a communist ideology where the state controlled the economic resources and people worked for the common good of the state. Democratic countries follow a freer market economy. They encourage private ownership of capital and enterprise. Communism has failed in most parts of the world and today there is more free trade with private ownership of capital and enterprise. We live in a capitalist economic system. Capital is a major factor of production. So is labor and land. Technology is also major factor in the production of goods and services. Today it is all about factor markets, commodity markets, financial markets and the free exchange of goods and services.
Malaysian Financial Planning Council (MFPC) 7-�
RFP Programme - Module 1 Chapter 7: The Economic Environment and its Impact on Financial Planning
The Two Main Branches of Economics
Economics is derived from the Greek word “oiknomia” which means “household management”. It is a study of how people make their living, overcome their problems and make their choices.
Economics has two main branches; macro-economics and micro-economics. Macroeconomics looks at aggregates and therefore is concerned with the general price level, total output, employment and the balance of payments.
Micro-economics is concerned with the individual components of the economy. It looks at the individual or the individual firm producing its own goods and services and its consumption patterns. The output of an individual firm, prices of individual goods and services, the exports and imports by individuals and individual firms.
There is today a particular focus by financial planners on financial market economics. This is a study of the demand and supply factors affecting all the various financial markets, like stocks, bonds, real estate, money market, foreign exchange and interest rates and futures.
What is the Economic Problem?
A clear example would be the current problem of food shortage. The resources allocated and the factors of production utilized in food production are a reflection of the current supply situation. Therefore the economic problem for a nation is the efficient allocation of its scarce resources into the production of the various goods and services needed by the country This production decision is also connected to the level of international trade and exchange between nations. Through its free market capitalist system decisions are made as to what to produce, how much to produce, how to produce, how to maintain and expand production and how the economic output is distributed to all levels and members of society.
The Malaysian Economy
The Malaysian economy is highly trade oriented and therefore a very open economy. Malaysia historically was commodity based with rubber, tin, palm oil, timber and cash crops taking center stage. Agriculture was always important but increasingly it receded into the background and has thus caused a serious problem to current food supply. Manufacturing took importance in the seventies and eighties and made Malaysia a prominent exporter of manufactured goods, especially in electrical and electronic goods. Foreign direct investments poured into Malaysia as Malaysia offered many advantages including cheap and educated labor, tax incentives and a stable political, economic and social environment. However the flow of Foreign Direct Investment has eased in recent times due to the prominence of China and India. However manufacturing still remains a major sector in the Malaysian economy. For this situation we owe much gratitude to the government’s ‘Look East’ policy which encouraged a large flow of Japanese investments.
While Malaysia adopts a free market capitalist system, there is an increasing reliance on government economic plans to bolster the economy. The government had introduced 9 Malaysian Plans to

7-� Malaysian Financial Planning Council (MFPC)
RFP Programme - Module 1 Chapter 7: The Economic Environment and its Impact on Financial Planning
develop the economy and bring a balanced growth to all parts of the economy. The government has established many corridors for economic development in various parts of Malaysia including East Malaysia. That is the reason the government had to incur a budget deficit over many years to finance the development of the economy. It has therefore a large borrowing commitment. However, Malaysia has been fortunate in the exploration of petroleum and gas and through Petronas the government has derived a large revenue base. However, these fossil fuels do not last forever and therefore Malaysia must keep looking for new sources of revenue.
The Economic Sectors
In every economy we can see several sectors making up the economic system.
First we have the Household sector that comprises the individuals who consume the output of the economy, who contribute their savings to the finance sector and who also derive their income from providing their labor.
Next we have the Business sector that produces the goods and services, borrow the savings from the financial intermediaries, and pay the income to the labor hired.
We must recognize the government as another major sector. There are three levels of government; the Federal, State and Local governments. The consumption and investment by the government sector is sizeable and it has become customary to expect regular stimulus packages from the government to boost economic activity.
Another important sector is the International sector, or External sector, involving exports and imports. Malaysia has reached the one trillion trade figure. However, exports are only slightly higher than imports. Therefore while exports have brought valuable foreign exchange the foreign exchange reserves are being used to fund an equally large import bill. Economic strategies of the past included both import substitution and export expansion. However, export promotion proved to be the more popular of the two strategies, hence the big increase in manufacturing and services sector. Malaysians are not ready to give up their consumptive taste for international goods and services.
Another important sector is the Finance sector. Financial intermediation adds flexibility and efficiency to the economic system. Without this financial intermediation it would be difficult to bring savers and borrowers together and for businesses to expand their production. There are two major ways businesses get to borrow from the household sector. One is through the banks and the other is directly through funds mobilized through direct issue of securities. Stocks and bonds are capital directly sourced from the public. There are a whole range of financial intermediaries.
Malaysian Financial Planning Council (MFPC) 7-�
RFP Programme - Module 1 Chapter 7: The Economic Environment and its Impact on Financial Planning
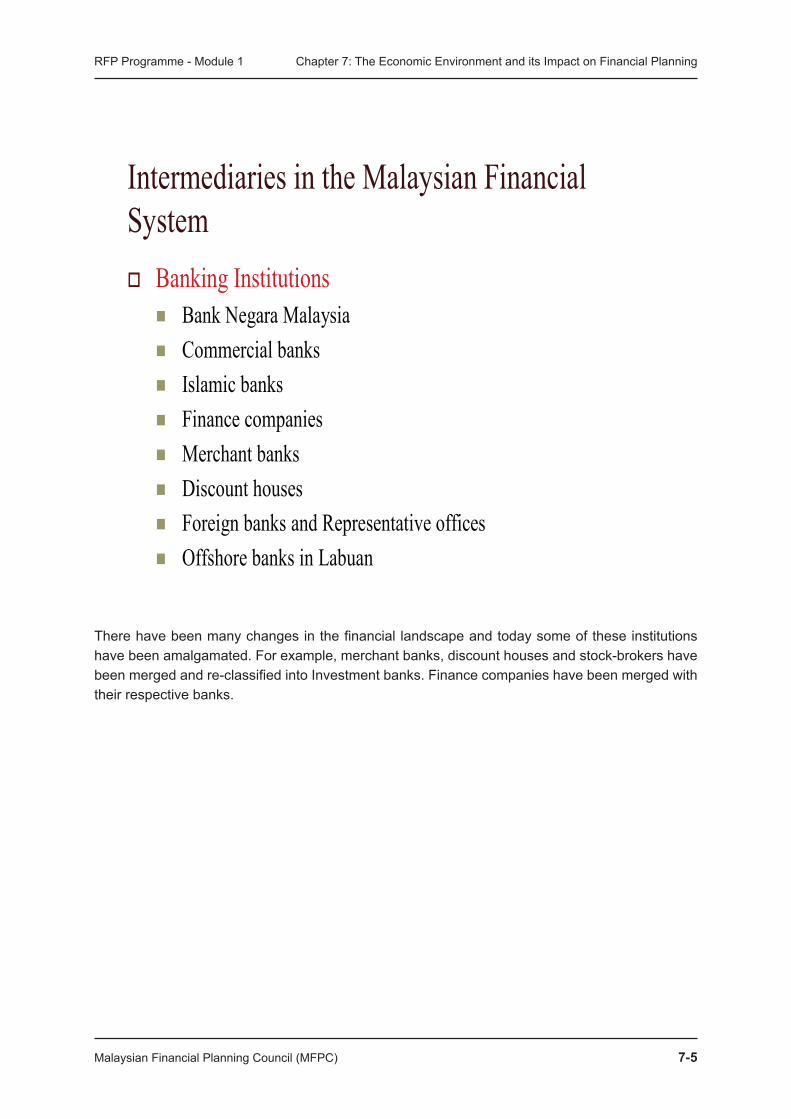
IntermediariesintheMalaysianFinancialSystem BankingInstitutions
BankNegaraMalaysia Commercialbanks Islamicbanks Financecompanies Merchantbanks Discounthouses ForeignbanksandRepresentativeoffices OffshorebanksinLabuan
There have been many changes in the financial landscape and today some of these institutions have been amalgamated. For example, merchant banks, discount houses and stock-brokers have been merged and re-classified into Investment banks. Finance companies have been merged with their respective banks.
7-� Malaysian Financial Planning Council (MFPC)
RFP Programme - Module 1 Chapter 7: The Economic Environment and its Impact on Financial Planning
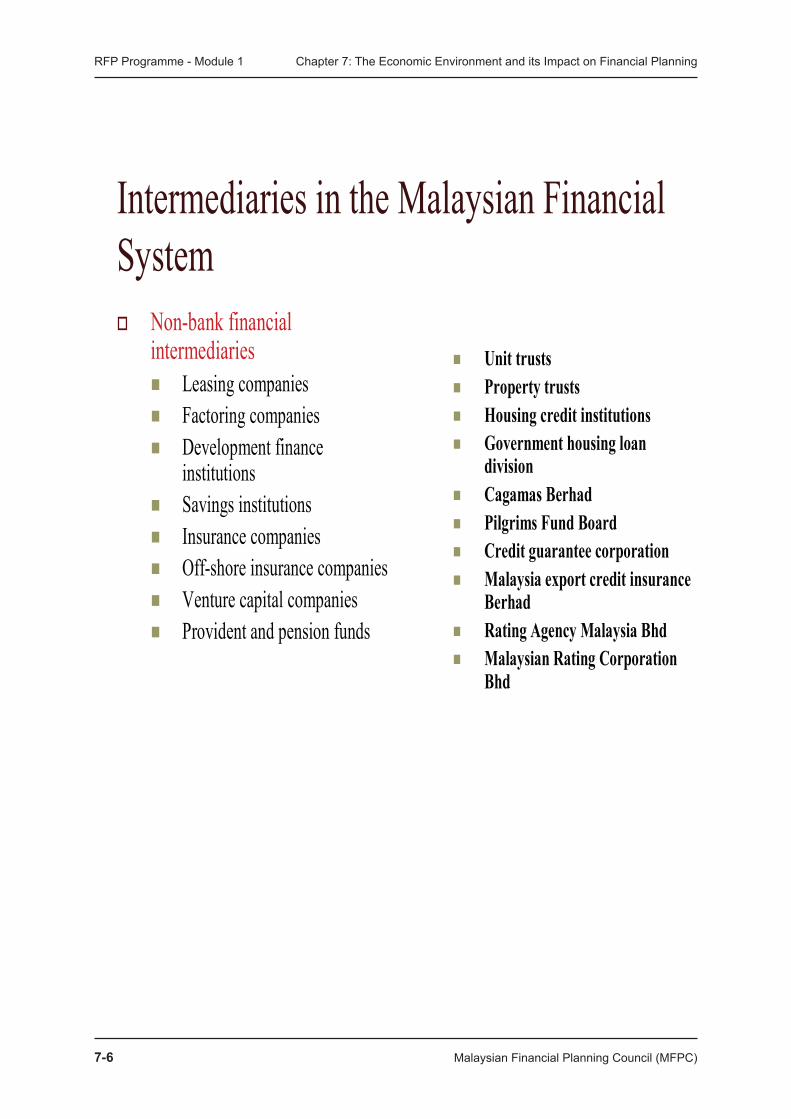
IntermediariesintheMalaysianFinancialSystem Non-bankfinancial
intermediaries Leasingcompanies Factoringcompanies Developmentfinance
institutions Savingsinstitutions Insurancecompanies Off-shoreinsurancecompanies Venturecapitalcompanies Providentandpensionfunds
Unit trusts Property trusts Housing credit institutions Government housing loan
division Cagamas Berhad Pilgrims Fund Board Credit guarantee corporation Malaysia export credit insurance
Berhad Rating Agency Malaysia Bhd Malaysian Rating Corporation
Bhd
Malaysian Financial Planning Council (MFPC) 7-7
RFP Programme - Module 1 Chapter 7: The Economic Environment and its Impact on Financial Planning
The Financial System
Just as we view the economic system it is important to understand the financial system. How money flows in the economy is quite important.
THE FINANCIAL SYSTEM & INTERMEDIARIES - Consists of an intricate network of markets and institutions.
The main attributes of the Financial System are as follows:
Mobilization of fund Flexibility of investment Implementation of monetary policy An efficient saving process
Funds are mobilized through the savings process. Fixed deposits still represent a major component of savings, although increasingly deposits are being converted into unit trusts and investment-linked insurance products.
Savings are the result of surplus income after consumption has taken place. Most Malaysians know the importance of savings and thus Malaysia has a high savings rate. The major reason for this high savings rate is the compulsory savings scheme through the Employee Provident Fund. While the employee’s contributions are taxed the employer’s contributions remains un-taxed. EPF is an income tax approved scheme and therefore income earned by EPF and distributed to contributors is also not taxed.
Savings mobilized by the banking system are then lent to businesses. They have a price to pay which is the interest rate and the banks make the difference between the interest rate on deposits and the interest rate on borrowings.
Through this financial system the government’s main agency, Bank Negara is able to implement appropriate monetary policy. Through the interest rate mechanism Bank Negara is able to influence the short-term interest rates in the market. It can keep inflation under control and also affect the short-term exchange rates. Thus the financial system has become an important component for economic management.
The Role of Government
The government is an important institution that is required to provide public goods such as defense, social security, public transportation and public utilities.
It is the expressed objective of the government to achieve at least four clear objectives:
Low unemployment rates
Stable economic growth
Low inflation rate
Favorable balance of trade
7-� Malaysian Financial Planning Council (MFPC)
RFP Programme - Module 1 Chapter 7: The Economic Environment and its Impact on Financial Planning
The government as the public sector is responsible for:
Provision of all relevant services
National development
Trade regulations
Overall economic policy management
The Role of the Private Sector
The private sector consists of the three domestic sectors of household, business and the finance sectors and is important contributors to the external sector. We have seen the importance of all these sectors to the economy.
A major development in recent times is the development of Islamic financial institutions and Islamic products. The whole fabric of the economic system in Malaysia is changing and making way for the dual existence of conventional and Islamic institutions and products. This dichotomy will result in plenty of choices and the people may need the services of financial planners to evaluate the diverse products and services.
The private sector must play an active role in the development of the economy. Private sector finance initiatives will add to the ongoing efforts of the government to stimulate the economy. The private sector must increase its productivity to expand output. If every individual, firm and institution operates at their maximum or optimum productivity level, we will be an economy that will be hard to beat.
Major Components of the Private Sector
Agriculture has become an important sector especially as it has become clear that food production has dropped drastically and with food prices sky rocketing it has become imperative that Malaysia improves her output of agriculture. The prime agricultural activity is still the plantation sector of oil palm and rubber. Other popular products are cocoa, pepper, fruits, vegetables and aquaculture.
The mining sector is primarily devoted to petroleum and gas. Tin is no longer a major commodity. However, there are still statements being made that Malaysia possesses other great mining potential.
Manufacturing has become the engine of growth for Malaysia. It contributes more than 30 percent of our Gross Domestic Product. It accounts for more than 85% of our exports. This impetus was built in the nineteen eighties through large inflows of foreign capital. However the scale of foreign direct investment has slowed but still remains sizeable.
The Services sector has become the largest economic sector accounting for more than 54% of GDP. It employs more than 47% of the labor market. The services that are being promoted are tourism, education, health, transportation, shipping and air transport, insurance and re-insurance.
Malaysian Financial Planning Council (MFPC) 7-�
RFP Programme - Module 1 Chapter 7: The Economic Environment and its Impact on Financial Planning
Investment Incentives
The government has provided wide ranging incentives to the manufacturing sector which has attracted a steady stream of foreign direct investments (FDIs). The incentives are mainly tax incentives which give the investor partial or complete tax exemption. The main tax incentives are:
Pioneer status Pioneer status companies enjoy tax holidays of 5 to 10 years.
Investment tax allowance Investment tax allowance is an allowance based on the capital expenditure incurred.
This is an allowance over and above the normal capital allowance claimed. These incentives are appropriate for projects with large capital expenditures.
Re-investment allowance This is an incentive given under the Income Tax Act 1967. It is an allowance based
on capital expenditure incurred to modernize the plant or improve the production facilities.
Small and medium scale enterprises. There are a variety of incentives given to small and
medium scale enterprises which are more vulnerable to market conditions. Financing facilities are critical for the success of these SMEs.
The typical companies that can avail themselves of these incentives are:
High technology companies
Strategic projects
Information communication technology
Multimedia super corridor
Operational headquarters
Fiscal Policy
Fiscal policy is defined as that part of government policy which is concerned with raising revenue through taxation and other means and deciding on the level and pattern of expenditure.
Financial planners pay very careful attention to the fiscal policy of the government. The government presents a budget every year outlining its revenue and expenses for the coming year. The government through its budget paper presented to parliament identifies the factors contributing to the current economic situation, the direction of its expenditures, the major economic policy shifts and changes to its tax policy to achieve certain economic objectives.
•
•
•
•
•

7-�0 Malaysian Financial Planning Council (MFPC)
RFP Programme - Module 1 Chapter 7: The Economic Environment and its Impact on Financial Planning
The key point to note is whether it is adopting an expansionary policy or the opposite contraction policy. Expansionary policy would involve the government spending more than its revenue collected and would usually result in a deficit budget. The government has taken its responsibility to stimulate the economy and will initiate major economic shifts to push the economy forward.
The government also undertakes ‘transfer payments’ in its attempt to help the less fortunate segment of society. These payments do not add to the GDP but are distributions in the interest of socio-economic parity.
There are always tax amendments and the public pays great attention to all the tiny amendments to taxes payable. Some of these amendments are major and affects the taxpayer’s life quite considerably. A recent major shift in tax policy was the change in the company tax structure to a single tier tax system. This improved the corporate tax compliance requirements but it resulted in low income taxpayers being taxed at the corporate tax rate. The tax credit available on dividends paid by taxable corporations now remains with the Inland Revenue Board (IRB) and are not given as a tax set-off to shareholders. Retirees have been affected badly as a result of this change. The Budget therefore remains a major policy document to be keenly observed by financial planners.
Monetary Policy
A key aspect of economic management is the monetary policy adopted by the government. The government is concerned about the general level of prices and inflation. The mechanism by which it maintains the general level of prices is through its control on money supply. The institution primarily charged with monetary policy is Bank Negara, the Malaysian central bank.
Monetary policy is defined as that part of economic policy which regulates the level of Money or Liquidity in the economy in order to achieve some policy objectives, such as the control of inflation, an improvement in the balance of payments, or growth in the Gross National product. It contrasts with more direct measures of control, such as taxation, credit control, or fiscal policy.
Increase in money supply without a corresponding increase in output will lead to inflation. Bank Negara will have to maintain the money supply at the right level so that a situation of too much money chasing too few goods does not arise. Bank Negara can influence the short-term interest rates by being a lender of last resort and through treasury or money market operations. It maintains an overnight policy rate (OPR) that it is prepared to implement to stabilize the interest rates. At the moment the OPR is at 3.5%. The KLIBOR rate will therefore settle around this rate that Bank Negara has set. The base lending rate is set close to this overnight money rate. Currently the base lending rate is around 6.7%.
By money market operations is meant the buying and selling of government securities in the money market. Where an expansionary monetary policy is desired Bank Negara will buy back government securities. By this it has put cash into the money market, thereby increasing money supply. By selling government securities it has borrowed money from the market thus reducing money supply. Therefore, when the government is borrowing from the money market it reduces the money available for private sector borrowing. This contraction affects economic activity.
Malaysian Financial Planning Council (MFPC) 7-��
RFP Programme - Module 1 Chapter 7: The Economic Environment and its Impact on Financial Planning
Business Cycles
Financial planners are keenly aware of the existence of business cycles Economists have observed that the economy goes through a cycle that repeats itself over several years. There are clear demarcations that show peaks and troughs. These peaks and troughs are sometimes called boom or bust cycles, trade cycles or economic cycles. There are four identifiable stages or phases in each cycle.
Peak to contraction
Contraction to trough
Trough to expansion
Expansion to peak
All financial markets seem to have these general cycles. Therefore it is important to identify what stage in the current cycle one is in. The stage in the business cycle reveals the economic activity of the day.
For example in an expansionary period, the following can be observed.
Expansion
– Increasing investment spending
– Increasing consumer spending
– Increasing price levels
– Increasing money wages
– Rising employment
– Increasing national income
Contraction
– Decline in the level of national income
– Decrease in aggregate spending
– Decreasing prices
– Decreasing wages/retrenchments
Duration of business cycles
There are perhaps natural explanations for the appearance of cycles. As financial planners one is concerned with timing and what the immediate and medium term future holds. They say it is difficult to time the market but knowledge of business cycles will at least help in avoiding drastic mistakes. The duration of each cycle and the respective phases is unclear and often they differ in length and breadth. There are many different theories and descriptions of these phases. Obviously those who
7-�� Malaysian Financial Planning Council (MFPC)
RFP Programme - Module 1 Chapter 7: The Economic Environment and its Impact on Financial Planning
study these cycles and their different phases will have an advantage when it comes to timing their investments. But very little evidence exists to support the superiority of market timing and consistent success. However, we do have superior investors like Warren Buffet and George Soros.
Just as in business cycles each financial market has its own cycle. Stock markets have their ups and down, just as properties. The bonds also have their peaks and troughs. One has to study the individual variables that affect each financial market. There are some common variables and some specific ones. Interest rates generally affect almost all markets but in a different way. Asset allocation decisions are made with the knowledge of the different phase of the business or financial market cycles.
In economics, expectations, both rational and irrational, play a big part in market movements. Perceptions of current and future conditions by market participants are going to influence the general price level of the different markets.
Indicators
Associated with business and financial market cycles is the study of market indicators. There are three different categories of market indicators, leading, co-incident and lagging indicators.
Leading indicators lead the business cycle by about six months. Examples of leading indicators are the Stock exchange index (KLCI),
housing finance commitments, residential building approvals, and consumer sentiment.
Co-incident indicators move concurrently with the business cycle. Examples would be the level of retail trade, new motor vehicle registration, credit provided to the private sector, and job advertisements
Lagging indicators trail the business cycle by about six months. Examples of lagging indicators would be the unemployment rate and employment growth.
Inflation
Inflation is currently (in 2008) one of the biggest concern of the government. The cost of petrol is at its record highest (USD 144 per barrel) and all prices are moving in tandem with this increase in energy cost. To make matters worse the electricity tariffs are also increasing by a large proportion. Energy cost is becoming one of the largest components of his daily consumption.
There are two theories regarding causes of inflation. One is the demand-pull inflation and the other is cost-push inflation.
Demand-pull inflation – is when the output of the economy cannot keep up with the total demand for goods and services. Excess demand pulls prices up. It is a case of too much money chasing too few goods. When there is an extremely loose monetary/fiscal policy or when there is an export or
Malaysian Financial Planning Council (MFPC) 7-��
RFP Programme - Module 1 Chapter 7: The Economic Environment and its Impact on Financial Planning
investment boom there would be an increase in money supply. Demand for goods leads to demand for labor which leads to rise in unit labor costs which in turn leads to higher prices of goods and services.
Cost push inflation is the result of increasing costs pushing the price levels up independent of the demand. Petrol is an indispensable item and therefore its increase will raise prices irrespective of demand.
Inflation can result in ‘stagflation’ where there is a double disadvantage of inflation and a stagnant economy.
Inflation can also be ‘imported’ through imports. Malaysia although a producer of oil, imports oil and so imports the increasing cost. Inflation in other countries increases the cost of imports. The depreciation in the ringgit exchange value will also cause imports to be more expensive.
Inflation expectations also cause businesses and consumers to respond as though inflation is at hand and thus cause a spiraling effect.
The problem with inflation is that they distort prices and thus cause chaos to the economic system. Fixed income earners experience a fall in standard of living. There is a purchasing power risk as fixed income investments do not hedge against inflation. There will be a mad scramble to adjust the asset allocation to investments that can hedge inflation. The rate of interest will also be affected as the borrowers and lenders will try to balance their position. There will be a risk premium added to interest to allow for loss in purchasing power.
Exchange Rates
Malaysia is exposed to the world economy Therefore the exchange rates are an important factor for savings, investments and consumption. Malaysia has only recently recovered from the 1998 Asian financial crisis where it had to introduce a fixed exchange rate regime of RM 3.8 to 1 USD. Today it is adopting a managed floating rate system to prevent any untoward fluctuation in exchange rates. Bank Negara will interfere in the exchange rate market to keep the ringgit within a certain band. Exchange rates are affected by the supply and demand for ringgit, the inflation rate, interest rate differentials, exchange rate expectations and other political factors. It is a topic of great interest and it would be valuable to study further the implications of exchange rate fluctuations. Today we find packaged investments in different currencies being promoted in the marketplace.
Wages Policy
A growing concern today is the increasing cost of wages. Wages affect the cost of production and therefore the pricing of goods and services. To keep wages costs down we see an increasing trend in hiring labor from the neighboring poorer countries. This has increased Malaysia’s dependence on foreign labor. However, this has also caused social problems. Official statistics vary but with illegal immigrant labor included we are almost looking at more than three million foreign labors. We need to study the long-term implications of such dependence on foreign labor.
7-�� Malaysian Financial Planning Council (MFPC)
RFP Programme - Module 1 Chapter 7: The Economic Environment and its Impact on Financial Planning
Malaysian exports must be cheap for foreigners to continue buying Malaysian products. Labor costs must therefore be monitored to keep Malaysia competitive.
While Malaysia can be considered not very unionized there are many unions that have a say in the wage policy of their respective employers. Unions use collective bargaining to negotiate their wages. The manufacturing, transportation, storage and communication sectors including clerical unions in the civil service and the banking sector are powerful bodies that actively negotiate their wages. However there is no centralized wage determination like minimum wages in Malaysia like in many other developed countries. Minimum wages have always been an issue but so far it has not taken any center stage. When and if minimum wages are introduced we can see another round of price increases.
Note: A more detailed analysis of Malaysian economics is presented as an appendix to this module.

Malaysian Financial Planning Council (MFPC) 7-��
RFP Programme - Module 1 Chapter 7: The Economic Environment and its Impact on Financial Planning
Appendix
The Significance of Economic Analysis in Financial Planning
The economic environment provides an essential backdrop for the prices of assets in the bond, stock, and property markets. The outlook for each of these asset markets depends on economic factors which will include:
i. The growth of real (inflation-adjusted) and nominal income (income at current prices).
ii. The supply of funds from businesses and personal savings including retirement funds.
iii. The demand for funds to finance spending by government, businesses and consumers.
iv. The effect of the decisions above on price level movements (inflation).
v. The effect ultimately, on corporate profits and the prices of financial assets.
The outlook for an industry or a company depends on the outlook for those economic factors that affect the demand for their products and the cost of labour, raw material inputs and capital. An accurate assessment by a planner of the viability or otherwise of investing in a financial or physical asset associated with a company or industry depends on a close knit between the planner’s assessment of an industry’s sales, expenses and earnings, and an assessment of prospects for the economy.
Assessments for the Short Term and Assessments for the Long Term
The planner must base assessments both on short term as well as long term prospects. It must be noted that longer term assessments are based on projections far into the future. The uncertainty of projections rises as the projection horizon is extended. Dividends possibly earned 10 years from now are less certain than dividends earned next year. On the other hand, an opinion of the earning power of a company cannot be adequately formed based on a 1- or 2-year outlook. So, a balance must be struck between the two.
Assessments for the shorter term of much less than 5 years are more likely to be based on cyclical forces that appear periodically rather than on secular forces that continue to hold over long periods of time. Shorter term forecasts typically reflect forecasts of changes of demand conditions rather than changes in supply. As changes in demand are largely influenced by changes in incomes, expenditures, corporate profits and expenditures, and fiscal and monetary measures, assessments of prospects within the economic system where such forces emanate should be the first stop for near-term assessments for financial planners.
7-�� Malaysian Financial Planning Council (MFPC)
RFP Programme - Module 1 Chapter 7: The Economic Environment and its Impact on Financial Planning
In the absence of detailed statistical forecasting techniques, the practical use of economic analysis in financial planning is to provide a judgemental answer to questions such as: What is the likely impact of the rise in diesel prices on a cigarette manufacturer?
In order to do so, financial professionals look for stable relationships between economic variables, including published data and such factors as the company’s sales, cost and earnings.
Application of Economic Analysis to Financial Planning: Approaches
The planner should first establish the likely direction of the economy and use it as part of a more comprehensive assessment of the broad capital market implications and then move on to assess the most likely scenario for the specific financial planning issues being considered.
The planner need not attempt to determine the economy’s direction but may use someone else’s forecasts deemed normally reliable and then modify the projections according to the degree the planner’s opinions differ.
Investment strategies may be tied to assessments of economic outlook. For example, an investor may want to avoid investing in properties if the forecast is that the money supply will be tightened, thereby raising interest rates. On the other hand, with the expectation that interest rates will fall, and with a recession looming ahead, an investor may wish to invest in bonds. Or, an investor still bent on equity investments will choose to invest in defensive or recession-resistant sectors.
Economic Analysis - Microeconomics
A core concept in microeconomics is the concept of utility. This can be thought of as the level of happiness derived from the consumption of any economic goods and services. The purchaser of any goods or services decides how much of the goods and services he or she will consume based on the level of utility derived from its consumption and balances that against what he or she has to give up. Consuming one type of economic goods always involves giving up the opportunity to consume something else because, as we indicated earlier, resources are limited but wants are many.
Another important concept in economics is the Law of Diminishing Marginal Utility. Put simply, as consumption of particular economic goods increases, the additional utility derived from the consumption of that additional unit drops. The rate at which it diminishes is tied to how close the level of satiation is.
The other major economic decision unit is the firm. Firms decide how much to produce. This is a function of the level of profits the firm can expect to derive from the production of the economic goods in question. Firms are assumed to be driven by the profit maximisation motive.
In economics, the consumer or any unit making an economic decision is, as a rule, said to face a budget constraint. Put simply, in order to be able to consume more of one type of goods, the consumer must give up the consumption of another or other goods. At equilibrium, a rational
Malaysian Financial Planning Council (MFPC) 7-�7
RFP Programme - Module 1 Chapter 7: The Economic Environment and its Impact on Financial Planning
consumer is assumed to choose the mix of goods or services that maximises the utility derived from consumption, subject to the budget constraint.
In specialised areas of economics, this idea is extended to making decisions when allocating resources for consumption between different time periods. Such decisions are subject to expected lifetime resources. In financial planning, this concept is of special interest.
The concept of utility can be extended to include even dis-utility, i.e., the negative results from consumption that the consumer will wish to avoid. An example of an application of this idea can be found in finance.
When investing in financial assets, investors are expected to derive levels of utility that increase with the rate of return on the investment. More returns are preferred to less returns. In finance theory, investors are assumed under normal circumstances to also derive negative utility from risk exposure. Less risk is assumed to always be preferred to more risk. Hence, lower levels of utility are associated with a given level of returns if the risk associated with that investment is higher than investments offering the same returns, but with lower risk.
Equilibrium in the Market
The aggregate quantity purchase decision by consumers at different price levels represents a demand curve. At the opposing end is a supply curve representing the aggregate quantity firms in the industry are willing to supply at various price levels. At equilibrium, demand must be met by supply with prices being the equilibrating mechanism.
Factors of Production
All economic decision-making units in a microeconomics context interact with others with regard to basic decisions on inputs to the production process, which economists term factors of production. Such factors are fundamentally just four:
1. land,
2. labour,
3. capital, and
4. enterprise.
Economic Analysis- Macroeconomics
Macroeconomics is concerned with the relationship between the major producing and consuming sectors of the economy each made up of economic decision making units as described in microeconomics. These sectors each provide and consume the basic inputs into the production process which we have identified as the factors of production.

7-�� Malaysian Financial Planning Council (MFPC)
RFP Programme - Module 1 Chapter 7: The Economic Environment and its Impact on Financial Planning
The sectors themselves are, for ease of analysis, divided into
The Household Sector,
Businesses,
The Financial Sector,
The Government or Public Sector, and
The External Sector.
Table: How each sector in the economy interacts with other sectors
Sector Households Businesses Financial Sector Government External
SectorHouseholds -
Businesses Businesses pay factor
income such as wages,
rent, interest and profits; households
supply savings;
households consume
goods and services.
-
Financial Sector
Households supply
savings to the financial
market.
Businesses borrow for
investments.
-
Government Households pay net
taxes to the government; receive wage and transfer payments
from employment.
Businesses pay net
taxes to the government; government. buys goods and services
from businesses.
Government borrows from the financial sector; pays
interest.
-
External Sector Households spend a portion of their
income on imports; and accumulate
foreign assets.
Net exports/ imports; may invest in or borrow in
international financial markets.
Financial sector receives
balance of payments
surplus and channels it to
the government through the
central bank.
Government borrows in
international financial
markets and invests foreign
exchange reserves overseas.
-
Malaysian Financial Planning Council (MFPC) 7-��
RFP Programme - Module 1 Chapter 7: The Economic Environment and its Impact on Financial Planning
These 5 major sectors in the economy interact in the marketplace. To simplify the types of interactions between these sectors, economists divide them into 4 major types:
1. The product market where goods and services are exchanged, mainly between households and businesses but also between businesses and the government
2. The factor or resource market where there prices for factors of production like the labour market and property market are determined by the forces of demand and supply.
3. The financial market where savings by households flow to businesses for investments and to the government in order that the government can make purchases for public sector investments in, for example, public infrastructure.
4. The foreign exchange market where payments can be made for net imports or received in respect of net exports, surplus savings can be channeled overseas, or shortfalls in capital can be met by savings channeled inward from other countries.
The flow of income in the economy is a circular flow. Income flows in a loop that allows approximate simultaneous equilibrium to be established across all the markets. However, the reader should be aware that the basic assumption in economics is that economic units make decisions on rational grounds. This is not always the case. Information required to make sound, rational decisions is always less than perfect; hence, decisions have to be made under conditions of uncertainty. Emotional factors can especially affect the financial market and the foreign exchange markets, leading at various times to exaggerated volatility in the prices of financial assets and foreign exchange rates, such as happened during the Asian Crisis of 1997.
Measuring the Economy’s Level of Output
As economic growth relates to the rate of growth of output and it raises the question of what output is and how we can measure it in practice, a system of National Income Accounting has been developed to measure an economy’s output in a given period of time. The two commonly used measures are Gross Domestic Product (also, Gross Domestic Income) and Gross National Product (also, Gross National Income).
Gross Domestic Product is defined as the total market value of all final goods and services produced in the economy in a given period of time.
Gross National Income is Gross Domestic Product plus net factor income from abroad less net factor payments abroad.
In Malaysia, the net factor income from abroad is typically a deficit value due to large payments for the repatriation of profits earned by non-residents and investors. But, as more Malaysians make investments outside the country over time, this situation may change.
7-�0 Malaysian Financial Planning Council (MFPC)
RFP Programme - Module 1 Chapter 7: The Economic Environment and its Impact on Financial Planning
There are three approaches to calculating Gross Domestic Product (GDP):
A) The Expenditure Approach to Calculating GDP
The expenditure approach adds up all types of spending of finished or final goods and services. To measure output accurately with this approach, all goods and services produced in any given year must only be counted once. This is important as many products go through a series of production stages before reaching a market. As a result, parts or components of most products are bought and sold many times. To avoid double counting, the sale of intermediate goods or inputs is excluded from GDP. One way in which double counting can be avoided is by calculating GDP using the value-added approach. To calculate the value added at each stage of the production process, we subtract all the costs of intermediate goods.
The expenditure approach can be sub-divided into different types of expenditures.
GDP = C + G + I + (X-M)
C: Personal Consumption Expenditures
This is expenditure by households on durable and non-durable consumer goods and services. It is expenditure designed to satisfy current wants.
G: Government Purchases of Goods and Services
This category includes all Government expenditure on the finished products of businesses and all direct purchases of resources. It excludes all Government transfer payments because such expenditures do not reflect any current production. Government expenditure can be broken down into Government final consumption expenditure, which includes expenditure on goods and services other than on fixed assets or stocks, and Government fixed capital expenditure, which is capital goods expenditure.
I: Gross Private Investment
“Investment” is defined as the act of producing goods that are not for immediate consumption. Investment increases the capacity of the economy for the production of consumption goods in the future. Investment results in the satisfying of future wants.
Investment covers basically three things:
(1) all final purchases of machinery, equipment and tools by business;
(2) all buildings and construction; and
(3 changes in inventories.
Malaysian Financial Planning Council (MFPC) 7-��
RFP Programme - Module 1 Chapter 7: The Economic Environment and its Impact on Financial Planning
Changes in inventories are considered as investment as an increase in inventories makes possible a future increase in consumption.
“Investment” as defined here, is not the same thing that non-economists have in mind when they talk of investment. The purchase of shares and bonds is not, as we have defined here, investment. The purchase of such paper assets merely transfers the ownership of existing assets. When economists speak of “investment”, they refer to the purchase of income-producing capital assets.
(X - M): Net Exports
Net exports of goods and services or the balance of trade is the amount by which foreign spending on domestic goods and services exceeds domestic spending on foreign goods and services. We need to use net exports (NX) as our measure as we need to subtract our expenditure on imports and include foreign expenditure on domestically produced goods. Our expenditure on imports is expenditure on goods and services produced overseas. GDP is designed to measure expenditure on final goods and services produced domestically, be it by domestic or foreign residents.
B) The Product Approach to Calculating GDP
This approach simply adds up the value of all goods and services produced in the country during the year for which it is being determined. Output is grouped under broad categories. In Malaysia, the categories are the Agriculture, Construction, Mining, Manufacturing, and Services sectors. This approach uses the summation of gross value added at basic prices across all the broad sectors in the economy. This does not mean that we simply add up the final sales value of all goods and services produced in the economy less the cost of imported inputs. We face the problem of double counting in that the entire sales value of one industry can be counted as the cost of input by another industry if we do that.
Consequently, in using this approach, we add up only the value added to goods and services at each step along the production process, excluding taxes. Alternatively, we can add up only the cost of final goods and services in the economy at purchasers’ prices less the cost of imported inputs.
C) The Factor Income Approach to Calculating GDP
This method uses the approach of summing up factor income such as wages, rent, profits and interest, with taxes and transfer payments such as subsidies and pensions added back and deducted respectively. Non income cost items like depreciation are added back to arrive at total factor income. A GNP-GDP adjustment factor adds back net factor payments abroad to arrive at GDP.
The equivalence of the three approaches illustrates the National Income identity:
National Income Ξ National Expenditure Ξ National Product
7-�� Malaysian Financial Planning Council (MFPC)
RFP Programme - Module 1 Chapter 7: The Economic Environment and its Impact on Financial Planning
In a closed (self-sufficient) economy, the value of all income is the value of all spending in that economy and this is also equal to all that is produced in the economy.
Factors that affect Long Term GDP Growth
GDP growth is affected by the growth of the population of the country. Even if the output per capita (per person) is stagnant, the mere fact that the population grows and more people entering the labour force find employment, will result in GDP growth. Malaysia’s labour force of 10.55 million grew at a very rapid rate of 3.6% in 2004, half again as fast as its nominal population growth rate of 2.1% a year. This was mainly on account of the very young profile of its population.
But it is clear that unless the growth of output exceeds the rate of growth of the population, the standard of living of the average person will actually decline. In fact, output per labour force participant (productivity) will have dropped if GDP growth in Malaysia fell below 3.6%! Growth of that order of magnitude would have been considered extremely good in a country with little growth in its labour force, but Malaysia needs to achieve this rate of growth just in order that real incomes do not slip. Excessively high rates of population growth in many developing countries thus make it difficult to improve on the average standard of living because the total output of goods and services in the economy will then have to be shared amongst more persons.
The level of self-sufficiency in households that make up an economy also has an impact on computed GDP. In many countries, a high proportion of output is accounted for by the informal economy or subsistence agriculture. A quirk of national income accounting is that output is not measured unless it is traded.
A rural farmer who survives off his farm’s output and only sells part of his produce for money to buy goods he requires may be recorded as earning a very low income when in fact the market value of the farm produce he consumes can be high. On the other hand, if the same farmer sells all his produce, and buys other goods in exchange, he will then have been recorded as enjoying a much larger output when in fact he enjoys a low standard of living due to the high exchange value of the goods he purchases. A mother’s contribution in the form of childcare is not recorded in national income but if she employs a maid to act in that role, the maid’s wages for childcare services shall be recorded as part of national income. Yet more is recorded as part of the national product if she takes up employment after giving up childcare.
In fact, in the past 30 years, the increase in women’s participation in the labour force has been one of the biggest sources of growth in GDP. When an economy moves into a trend of a greater level of exchange of goods and services between individuals, GDP can rise even if the average standard of living does not actually improve. This last point drives home an important distinction in economics between income and welfare, a measure of the well-being of the average person.
Finally, GDP growth can arise even when the labour pool is stagnant because of improvements in productivity. This means that a rise in output per capita allows more goods and services to be produced in an economy when the population does not grow, as is the case in many Western and OECD economies. Productivity per capita improvements can arise with improvements in technology and more inputs of capital. However, in economics, the emphasis more recently has
Malaysian Financial Planning Council (MFPC) 7-��
RFP Programme - Module 1 Chapter 7: The Economic Environment and its Impact on Financial Planning
been on total factor productivity. This involves a focus on improving output from given total inputs of capital as well labour resources (not just focusing on the former or on the latter). This is rightfully so, since the most efficient use of inputs of all scarce resources including capital, should be the aim of policy makers.
Short Term Trends Can be Very Different
In the short term, trends in GDP growth can be very different from the preceding framework involving long term analysis of trends. Cyclical forces work in the short term. When an economy is just coming out of a recession, productivity growth can be very high, as low capacity utilization that leaves capital use at inefficient levels get replaced by more optimal use of capital. As output grows, the efficiency with which labour can be put to use can rise significantly. Such rapid growth in output can be non-inflation–inducing but sustainable only for relatively shorter periods. Output growth can be sustained at above full employment level rates in the short term. Shortages of labour can be temporarily resolved by migrant labour, but only as a short term solution.
Short term GDP growth patterns are affected by some of the cyclical forces listed below:
i. Increases in real wealth, in the form of asset accumulation or asset price increases at rates in excess of the inflation rate. For example, an increase in property values can spur spending by house owners who then feel better off.
ii. Decreases in the real rate of interest (adjusted for inflation) that cuts the cost of borrowing to consume.
iii. Confidence or optimism amongst businesses and consumers about the economic outlook in the near future.
iv. Expectations of higher inflation rate in the future will spur current consumption and cut deferral of spending.
v. A reduction in the exchange value of a currency that increase net exports will boost GDP growth.
Trade surpluses may be accumulated during a recession precipitated by a drop in income levels. This drop in income normally reduces consumption of imports more than they reduce consumption of domestically produced goods. Large accumulated foreign exchange reserves will allow sharp growth of imports that result in larger trade deficits than would otherwise be sustainable when better economic conditions prevail.
To the extent countries supplement domestic sources of demand with export demand through trade, export growth permits economies to grow at a faster pace in the long term than is permissible relying on domestic sources alone.

7-�� Malaysian Financial Planning Council (MFPC)
RFP Programme - Module 1 Chapter 7: The Economic Environment and its Impact on Financial Planning
Pricing the Economy’s Output
Because goods and services traded in the economy are only observable by the prices they are traded at, the measurement of GDP typically begins with the measurement of nominal values or current prices. However, an adjustment needs to be made for changes in the price level between different periods to measure the change in real output. This adjustment factor is known as the GDP deflator. It measures the changes in the price level at all levels of the economy, including intermediate goods and services.
This is different from changes in the price level at the end consumer level, which we term the Consumer Price Index. The Consumer Price Index is used to measure the nominal cost of living that the average person faces.
Changes in the price level can be brought about by excessive demand in relation to available supply (termed the demand-pull variety of inflation), or by supply shocks that cause costs to rise (cost-push inflation).
Price levels can be measured at several levels using different indices. One is the business level as measured by the Producer Price Index. This measures the level of cost inflation at the firm level and includes prices at the intermediate stages of production. The Statistics Department publishes a Producer Price Index monthly, with a slight lag. This takes into account major cost components that enter the production process.
The Producer Price Index: Components
Component Weight (%)
Food and live animals 14.9Crude materials 18.0Mineral fuels, lubricants and related materials 18.8Animal and vegetable oils and fats 8.5Manufactured goods 10.8Machinery and transport equipment 18.3Total for local production 79.3
Imports 20.7
Source: Statistics Department
The Producer Price Index is useful as a measure of the price level in that it measures the production cost of goods and services. In measuring the cost of living, what matters is the cost of final goods and services that consumers pay in the market. Producers may not actually pass on all the increase in costs to consumers due to a lack of pricing power in competitive conditions. In addition, the growth of productivity at the producer level may allow producers to maintain profits without needing
Malaysian Financial Planning Council (MFPC) 7-��
RFP Programme - Module 1 Chapter 7: The Economic Environment and its Impact on Financial Planning
to recover the full increase in the cost of goods through an increase in the prices of final goods and services.
As can be surmised from the cost components tabulated above, energy costs feature prominently in total costs. They affect transport costs and the costs of mineral fuel, lubricants as well as selected crude materials. This is one reason the government subsidises the pump price of diesel as well as petrol.
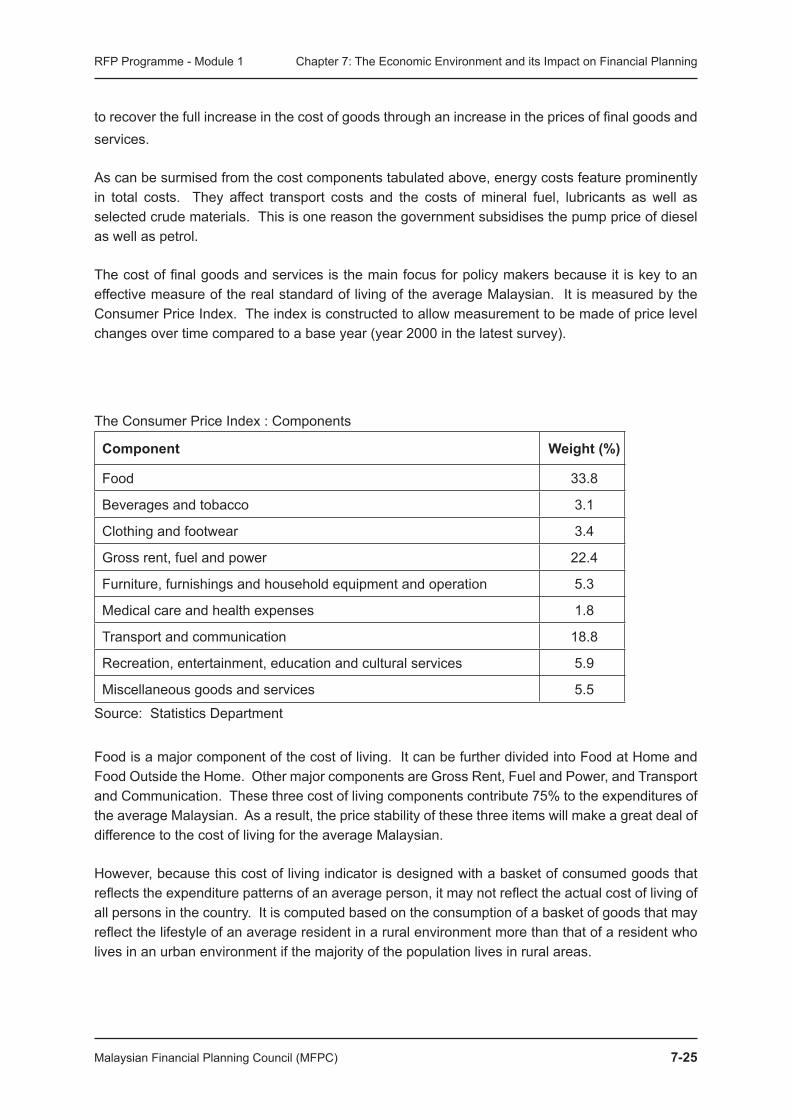
The cost of final goods and services is the main focus for policy makers because it is key to an effective measure of the real standard of living of the average Malaysian. It is measured by the Consumer Price Index. The index is constructed to allow measurement to be made of price level changes over time compared to a base year (year 2000 in the latest survey).
The Consumer Price Index : Components
Component Weight (%)
Food 33.8
Beverages and tobacco 3.1
Clothing and footwear 3.4
Gross rent, fuel and power 22.4
Furniture, furnishings and household equipment and operation 5.3
Medical care and health expenses 1.8
Transport and communication 18.8
Recreation, entertainment, education and cultural services 5.9
Miscellaneous goods and services 5.5
Source: Statistics Department
Food is a major component of the cost of living. It can be further divided into Food at Home and Food Outside the Home. Other major components are Gross Rent, Fuel and Power, and Transport and Communication. These three cost of living components contribute 75% to the expenditures of the average Malaysian. As a result, the price stability of these three items will make a great deal of difference to the cost of living for the average Malaysian.
However, because this cost of living indicator is designed with a basket of consumed goods that reflects the expenditure patterns of an average person, it may not reflect the actual cost of living of all persons in the country. It is computed based on the consumption of a basket of goods that may reflect the lifestyle of an average resident in a rural environment more than that of a resident who lives in an urban environment if the majority of the population lives in rural areas.
7-�� Malaysian Financial Planning Council (MFPC)
RFP Programme - Module 1 Chapter 7: The Economic Environment and its Impact on Financial Planning
While the Consumer Price Index measures the cost of living for the average Malaysian, Malaysians in different income brackets living in different parts of the country may face different price level increases at the same time. The Statistics Department recognises this. It divides its survey of the cost of living into separate surveys involving people in different income brackets, people in urban and rural localities, and people residing in different states, a reflection of the fact that such differences have a bearing on spending patterns and on the price level increases that are relevant to them. The Consumer Price Index pertaining to Rural Residents for example, has a 37.8% weight attached to expenditure on Food as compared to 31.5% for Urban Residents.
Finally, as noted, a broad measure of price levels across the economy in the production process is the GDP deflator. This is an adjustment factor that is used to normalise observed prices at which goods and services (including at the intermediate stages), are exchanged in the economy to a base year level.
Why Inflation is an Economic Problem?
Inflation feeds back to the value of financial assets through changes in interest rates. As shall be seen later in the section on valuation of financial assets, the market price and current yields of financial assets depends on the discount rate, which depends amongst other things, on the general level of interest rates. This can have unfavourable effects in the following ways:-
1) Unanticipated variations in the rate of inflation disrupts longer range planning. Economic returns from investments are denominated in nominal values and unforeseeable changes in the real value of the returns can retard the level of such productive activities.
2) Feedback to economic decision-making units is contained in market prices. Inflationary pressures can distort price information that send appropriate price signals to producers with regard to the scarcity or otherwise of the goods they produce or correspondingly, the demand for the goods they produce relative to the supply. Market prices for some goods can be changed faster than for others. Producers usually adopt strategies anticipating changes in prices. Unanticipated changes in price levels can therefore distort planned productive activities if the prices of some goods cannot respond to changing market forces and do not properly reflect relative scarcity.
3) Resources are wasted in trying to anticipate changes in price levels if they are volatile and unpredictable. Speculative hoarding and similar unproductive activities divert resources away from more productive activities and reduce the economy’s production possibility frontier (i.e., the potential total output in the economy if all resources are productively employed or put to their best use).
4) Persons with fixed incomes such as pensioners and providers of long term savings suffer loss of purchasing power when price levels rise faster than the rate of return on their savings. Welfare considerations therefore necessitate action on the part of the government. Disincentives for savers can also disrupt the supply of long term savings that users of capital rely on for investment in productive assets.
Malaysian Financial Planning Council (MFPC) 7-�7
RFP Programme - Module 1 Chapter 7: The Economic Environment and its Impact on Financial Planning
While excessive price level increases are bad, the opposite, disinflation or deflation is equally bad. Why is this so? When disinflation or deflation occurs, consumers hold back spending, because by doing so, the purchasing power of the marginal Ringgit increases with time under conditions of deflation. Such a drop in demand will cause a shortfall in expenditure over supply in specific periods. This means recessionary conditions will set in.
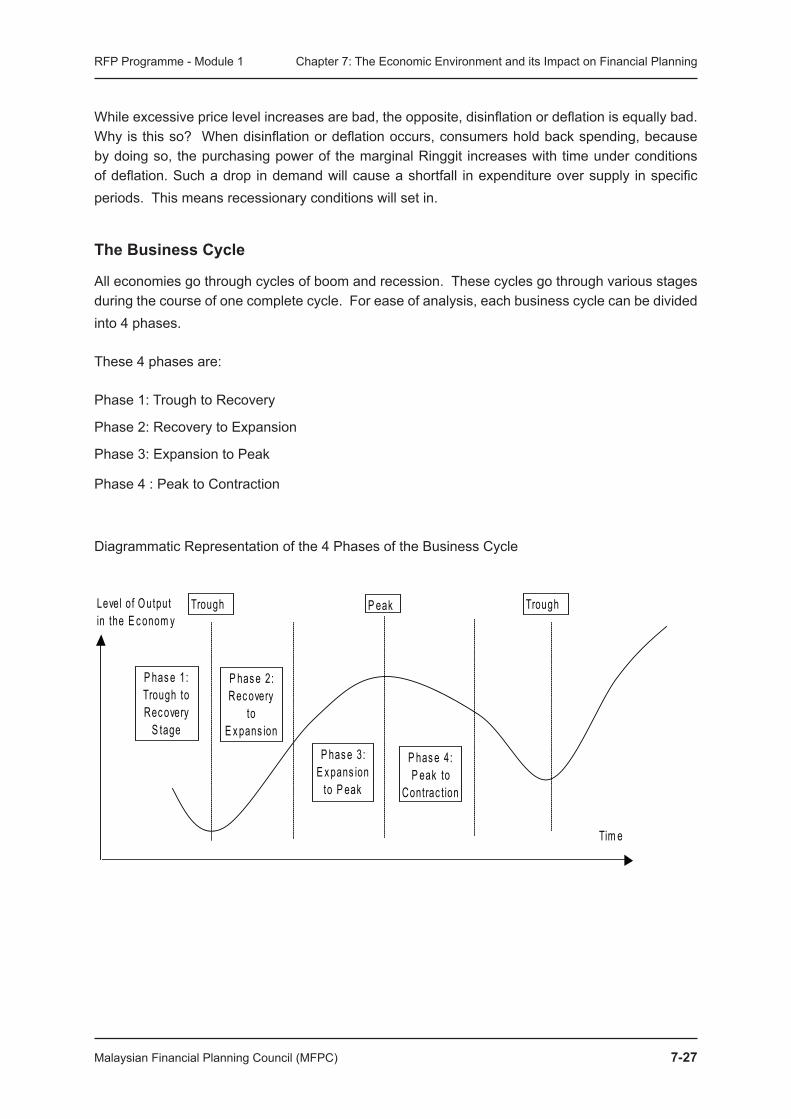
The Business Cycle
All economies go through cycles of boom and recession. These cycles go through various stages during the course of one complete cycle. For ease of analysis, each business cycle can be divided into 4 phases.
These 4 phases are:
Phase 1: Trough to Recovery
Phase 2: Recovery to Expansion
Phase 3: Expansion to Peak
Phase 4 : Peak to Contraction
Diagrammatic Representation of the 4 Phases of the Business Cycle
Trough P eak
P has e 1: Trough to Rec overy
S tage
P has e 2: Rec overy
to E x pans ion
P has e 3: E x pans ion
to P eak
P has e 4: P eak to
Contrac t ion
Trough
Tim e
Level of O utput in the E c onom y
7-�� Malaysian Financial Planning Council (MFPC)
RFP Programme - Module 1 Chapter 7: The Economic Environment and its Impact on Financial Planning
Features of the Four Phases of the Business Cycle
Phase �: From Trough to RecoveryDuring the trough to recovery phase, industrial production falls, capacity utilisation falls, labour costs fall as employment and perhaps even wages fall. Property prices can be expected to soften. Frequently, the extent of the drop in labour usage is far more than the drop in demand, such that labour productivity actually rises during this phase. The lower demand for inputs into productive activities such as commodities causes the overall price level to drop. This means a drop in the rate of inflation (though it does not usually lead to deflationary conditions except in extreme, depression situations). The lower inflation rate and higher unemployment rate pressures the central bank to lower interest rates as a way to stimulate investment and consumption demand.
In the money market, the central bank’s intervention typically focuses on depressing the short end of the yield curve. The yield curve becomes positively sloped. Bond prices rise. The rise may be across the entire spectrum of maturities if the long end of the yield curve gets shifted lower as well.
In the stock market, stock prices may continue to be depressed if earnings continue to drop. However, stock prices are also affected by the relative attractiveness of returns in the bond market caused by shifts in the yield curve, as well as the prospects for specific companies and industries. Defensive sectors may continue to attract investors.
In the foreign exchange market, the focus is on trade balances as well as international interest rate differentials between currencies. During a recession, lower interest rates reduce the attractiveness of holding interest-bearing assets in the recession-hit country’s currency compared to other currencies. Lower demand for investment-related activities due to poor economic prospects may also reduce the demand for the currency. However, if import demand slumps while exports remain buoyant during the recession, the trade balance may strengthen and demand for the currency may then act in the opposite direction, lending strength to the exchange value of the currency.
Phase � : From Recovery to ExpansionEconomic activities pick up during phase 2 due to the low cost of credit and the lower price level because the rate of inflation is low. As the level of real income picks up amidst low rates of inflation and interest rates, consumer confidence picks up. Consumers are more willing to buy on credit. Consumer credit picks up along with demand for big ticket items like housing, cars, etc. They also spend more on everything else like retail purchases, consumption items, etc.
In the money market, the yield curve remains positively sloped. However, a strong demand for credit may result in the rates at the short end of the maturity spectrum rising slightly. Yields at the longer term maturity spectrum may continue to get slightly depressed continuing from the previous phase of the business cycle. A slight flattening of the yield curve results.
In the stock market, rising demand and improving corporate profits amidst productivity improvements spur rising share prices. The emphasis may shift top growth stocks. Prices for commodities and other inputs may start to recover.

Malaysian Financial Planning Council (MFPC) 7-��
RFP Programme - Module 1 Chapter 7: The Economic Environment and its Impact on Financial Planning
In the foreign exchange markets, imports rise due to the import content in consumption items and investments. The percentage increase of imports typically exceeds the percentage increase in incomes (in economists’ jargon, the income elasticity of demand for imports is greater than 1.0). The trade balance may narrow or revert to approximate balance.
Phase � : From Expansion to PeakDuring this phase, broad-based growth incomes will allow expansion of consumer credit. Consumer spending peaks in big ticket items like housing, cars, etc. Consumers also spend more on everything else like retail purchases, consumer goods, etc. Capacity utilisation rises, and businesses invest more in fixed assets like machineries and factories. Corporations build up inventory so that opportunities for sales are not missed.
Overly rapid capital equipment spending or overly high capacity utilisation rates cause labour productivity to fall and labour cost per unit of output to rise. Otherwise, lower rates of unemployment also cause hourly/daily/monthly wages to rise. Commodity prices and prices of other inputs also rise.
As a result, producer prices rise and inflationary tendencies creep in. The central bank is under pressure to raise interest rates.
In the money market, the intervention by the central bank is typically carried out in the short end of the maturity spectrum along the yield curve. Since longer maturity yields are much less volatile in practice, this causes the yield curve to take the form of either inverted yield curves or hump-shaped yield curves.
In the stock market, rising demand and improving corporate profits amidst productivity improvements may continue to spur rising stock prices, but funds may flow away from equities as stocks now face competition from higher yields in the bond market.
In the foreign exchange markets, imports continue to rise due to imported consumption goods and investments. The trade balance may turn into a deficit position from the approximate balance earlier. The exchange rate may come under pressure.
Phase �: From Peak to Contraction (Recession)During phase 4, unsustainable additions to labour without corresponding increases in productivity cause the price level to rise. Capacity utilisation rates rise to suboptimal high levels or recent investments in fixed assets like machineries and factories have yet to pick up to sufficiently high or efficient levels. Corporate profits suffer. High prevailing interest rates cause profits at indebted companies to suffer. Investment spending is cut back.
The rise in the general price level reduces real income and consumer confidence and real purchasing power drops. Consumers postpone purchases as confidence drops. Orders are cut back in order that over-stocked inventories may be pared down. Unemployment rises as businesses cut back on the employment of new workers.
7-�0 Malaysian Financial Planning Council (MFPC)
RFP Programme - Module 1 Chapter 7: The Economic Environment and its Impact on Financial Planning
In the money market, the contraction in economic activities causes the central bank to begin rolling back high interest rates at the lower end of the maturity spectrum where they typically intervene. At the same time, the longer term rates may rise in a delayed reaction to higher inflation rates from the previous phase. The yield curve may become flat.
In the stock market, deteriorating corporate turnover and profits amidst lower labour productivity and higher interest rates may continue to spur a bear market. Funds continue to flow away from equities on competing and improved horizon returns in the bond market due to falling interest rates.
In the foreign exchange markets, the trade deficit position depresses the exchange value of the currency. This causes consumption demand to initially weaken for imports as well as domestically produced goods, some of which experience a rise in prices due to the higher cost of their import content, until consumption patterns adjust, shifting away from pricier imports. In the meantime, a contraction in demand for all goods may follow a deterioration in the exchange value of the local currency.
What Causes Recessions?
Recessions are periods when disequilibrium prevails in the economy during which aggregate demand falls short of aggregate supply. To an extent, supply always creates demand. If a firm invests in productive capacity and hires labour to meet expected demand, wages paid to the suppliers of capital equipment and its own labour force would have constituted income.
However, shocks in the economy create conditions for disequilibrium. Supply shocks create conditions of higher costs and reduced output at each given price level. For example, the oil shock of 1973 in the US raised the cost of production, such that aggregate supply shifted (shrank) at the then prevailing price level. To elicit the required supply, expenditures must rise. This expenditure increase was without a corresponding rise in income for US consumers because it had to be paid to oil producers. This fed back into a drop in domestic demand in the US.
Other recessions can be caused by a demand shock which follows a rise in price levels and which precipitates a financial market response in the form of a rise in interest rates. For example, large government spending programmes can stimulate GDP growth and cause interest rates to rise due to the competition between the government and the private sector for funds. It can also increase price levels rapidly due to the expansion in demand beyond the capacity of the economy. A rapid price level increase is not necessarily accompanied by an increase in real incomes, especially if the adjustment in the labour market lags behind.
The last observation is of significance. The speed at which factor markets are able to adjust has a great deal of bearing on the length of the adjustment process. Built-in lags such as union wage agreements and price control mechanisms or subsidies, or fixed exchange rates (if set at levels that are improper given the domestic economic conditions) may slow the adjustment process and amplify the magnitude of the contraction when recessions occur.
Malaysian Financial Planning Council (MFPC) 7-��
RFP Programme - Module 1 Chapter 7: The Economic Environment and its Impact on Financial Planning
The Role of the Government in the Economy
The role of the government in a modern economy is very significant. The government influences the development of all sectors in the economy directly and indirectly. Government policies guide the development of the economy in a direction the government believes is best for the long term.
Broad government policy objectives
i. Rising income - rising levels of income are generally associated with higher standards of living.
ii. Widely available employment opportunities.
iii. Price stability - low inflation rates (but not zero inflation).
iv. Sustainable equilibrium in the external sector.
v. Equitable distribution of income - eradication of poverty as well as uneven income levels.
vi. Sustainable development.
The ultimate aim of the government in the economy is to ensure an adequate level of economic welfare in the country. This means more than just rising levels of income as measured by GDP growth as we have noted. Welfare includes enjoying things like non-traded services, for example childcare at home, DIY house repairs, care for the infirm, etc. They also include quality of life measures like commuting time to work, pollution of the environment, resource depletion, etc. A high per capita income is not necessarily indicative of a high level of economic welfare if the wealth is concentrated in the hands of a few while the majority of the population live in poverty.
Major Malaysian government priority policy areas include policies on
• the full development and utilisation of human resources available - low unemployment rates consistent with full or near-full employment (note: this does not mean zero unemployment);
• the equitable distribution of income, including along racial lines, as embodied in the New Economic Policy;
• a sustainable rate of economic growth of a sufficiently high rate to ensure attainment of other objectives;
• a stable price level ;
• the balance of payments equilibrium -a stable Ringgit exchange rate policy.
We can see that the policy objectives of the Malaysian government are similar to the objectives of governments anywhere. In support of these broad objectives, there are more explicitly spelled out government policies towards specific sectors of the economy. The Malaysian government spells
7-�� Malaysian Financial Planning Council (MFPC)
RFP Programme - Module 1 Chapter 7: The Economic Environment and its Impact on Financial Planning
out these policies in the form of formal programmes such as the New Economic Policy, the National Agriculture Policy, the National Energy Policy, etc.
Some Explicit Malaysian Government Policies
The New Economic Policy
The race riots in 1969 underscored what was up to then, insufficient emphasis on the distributional aspect of development, resulting in socio-economic imbalances among the ethnic groups that brewed civil strife. Malaysia’s development policy was up until then, primarily aimed at promoting growth with a strong emphasis on the export market. Despite rapid growth during this period of an annual average of 6.0%, it finally became apparent that the equity aspect of welfare, long neglected, can disrupt the entire economic fabric and had to be addressed.
The launch of the New Economic Policy (NEP) in 1971 was in recognition of the importance of achieving a balance in the distribution of wealth created in general as well as along racial lines. National unity was seen as a necessary base on which to build economic growth in a nation with many ethnic and religious groups.
To achieve this, two major strategies were adopted:
• The reduction of absolute poverty through raising income levels and increasing employment opportunities for all Malaysians; and
• The restructuring of society to correct economic imbalances so as to reduce and eventually eliminate the identification of race with economic function.
A key necessary condition for the success of the NEP was that there had to be a rapidly growing economy. Rapid growth was a necessary condition so that the distribution of wealth, on the face of it, could meet what is in welfare economics called a Pareto optimal condition - that no one was worse off although some were better off as a result. The layperson's understanding of this is that the restructuring of society would not involve robbing Peter to pay Paul. This means that distribution will not be undertaken by the reallocation of existing wealth but from allocating newly created wealth.
The implementation of the strategies to eradicate poverty and restructure society resulted in a significant improvement in income distribution by 1990. The proportion of households living below the poverty line income declined from 49.3% in 1970 to 16.5% in 1990 and dropped further to 5.1% in 2002. The incidence of poverty now affects an estimated 267,000 households. Rural poverty is higher at 11.4%, while only 2% of the urban population is living below the poverty line. A total of 12,600 urban households are hardcore poor, earning less than RM260 per month, which is half of the poverty line income (PLI). The PLI for Peninsular Malaysia is RM529 per household, RM690 for Sabah and RM600 for Sarawak. Efforts are currently underway to review and redefine poverty given changing price levels.

Malaysian Financial Planning Council (MFPC) 7-��
RFP Programme - Module 1 Chapter 7: The Economic Environment and its Impact on Financial Planning
In terms of corporate equity restructuring, more than two thirds of corporate equity in Malaysia was owned by foreigners in 1970. Bumiputeras who made up two thirds of the population, owned slightly over 2.0%. The NEP set a restructuring target ratio of 30:40:30, to be achieved by 1990. The holdings of Bumiputeras was to reach 30%, other Malaysians, 40% and foreigners 30%, all in the midst of an expanding economy.
By 1990, the Bumiputera share of equity amounted to 20.4% of total corporate equity share; the holdings of other Malaysians reached 46.8%; and 25.1% for foreign holdings. Although Bumiputeras had still not achieved the 30 percent equity ownership target by 1990, the progress made by them has been substantial compared to the position in 1970. By 2002, because the total value of corporate equity expanded rapidly, the holdings of all groups increased further in value in absolute terms. Although the share of foreign ownership fell to almost a third, its value increased by over 30 times compared with the position in 1970. The achievability of restructuring targets is one reason a great deal of importance is attached to continued high GDP growth in Malaysia.
Malaysia’s poverty eradication strategy has always focused on human resource development and quality of life improvements. Development programmes emphasised income-generation rather than welfare handouts, except in exceptional cases. This was aimed at ensuring self-reliance and participation in economic activities amongst the poor. Rural development strategy incorporated poverty eradication programmes such as
• development of new land and in-situ development;
• provision of drainage and irrigation infrastructure;
• provision of agriculture support services;
• promotion of development of village/small industries;
• provision of rural infrastructure including roads, electricity and water; and social services such as health, schools, food supplement and squatter resettlement.
Restructuring programmes have focussed on strategies that include:
i. Direct government creation of specialized agencies to acquire interest in economic entities and hold them in trust for Bumiputeras until they were capable of taking over;
ii. Introduction of special rules and arrangements designed to assist the involvement and participation of Bumiputeras;
iii. Provision of financial support towards Bumiputera entrepreneurial development;
iv. Accelerated programmes for education and training;
v. Increasing Bumiputera ownership through privatisation projects; and
vi. Progressive reduction, through overall economic growth, of imbalances in employment such that employment by sectors and occupational levels reflect racial composition.
7-�� Malaysian Financial Planning Council (MFPC)
RFP Programme - Module 1 Chapter 7: The Economic Environment and its Impact on Financial Planning
The National Agriculture Policy III (NAP III) ����-�0�0
Launched in 1998, this spells out a goal of income maximization through optimal utilization of the sector’s resources. The NAP III spells out policy objectives as follows:-
i. to enhance food security as dependence on imports puts the country in a strategically weak position;
ii. to increase productivity and competitiveness;
iii. to strengthen linkages with other sectors particularly agro-based industries and related services sector;
iv. to explore and develop new sources of growth; and
v. to conserve and utilise natural resources on a sustainable basis.
The agriculture sector plays an important role in the economy through its contribution to the national income. The sector is a major supplier of food and raw materials to resource based industries, generates export earnings and creates employment. In line with the importance of this sector, the government lends a hand through adjustment measures to improve the competitiveness of the sector in order that it may overcome challenges both at domestic and international levels.
In 2004, the Ministry of Agriculture and Agro-based Industries (MoA) and related agencies undertook a Food Trade Balance Action Plan. The aim is to reverse the net deficit in the balance of payments for the food bill to a surplus position by 2010, one of the major aims of the NAPIII. Three key strategies are being explored. The first is to raise the production levels of food crops by increasing planting and catchment areas through schemes such as Permanent Food Production Parks, Aquaculture Industrial Zones and private sector-led large scale commercial farming ventures. The second is to establish a deeper linkage with higher value-creating downstream processing activities such as agro-based food industries. The third strategy is to establish a sound marketing plan and to ensure the quality and safety of food products for overseas markets by embarking on a series of accreditation and labelling schemes benchmarked to internationally recognised food standards.
The National Energy Policy
This was formulated to ensure adequate, secure, quality and cost-effective supply of energy in Malaysia. It also promotes efficient utilisation of energy; and ensures that environment protection considerations are taken into account in the production and utilization of energy. In support of the National Energy Policy, the National Depletion Policy which set a cap of 600,000 barrels of oil a day, including condensates, was formulated with the aim of conserving energy resources, in particular oil and gas. In addition, a Four-Fuel Diversification Policy incorporates renewable energy as the fifth fuel to supplement supply from conventional energy sources, namely oil, gas, coal and hydro. Tax incentives have been introduced to enhance dependence on power generation using biomass. Many industries have reported extremely encouraging results in the first months of using wood discards and palm fronds as fuel feedstock, with some projecting energy cost savings that imply payback periods of only 6 months or so.
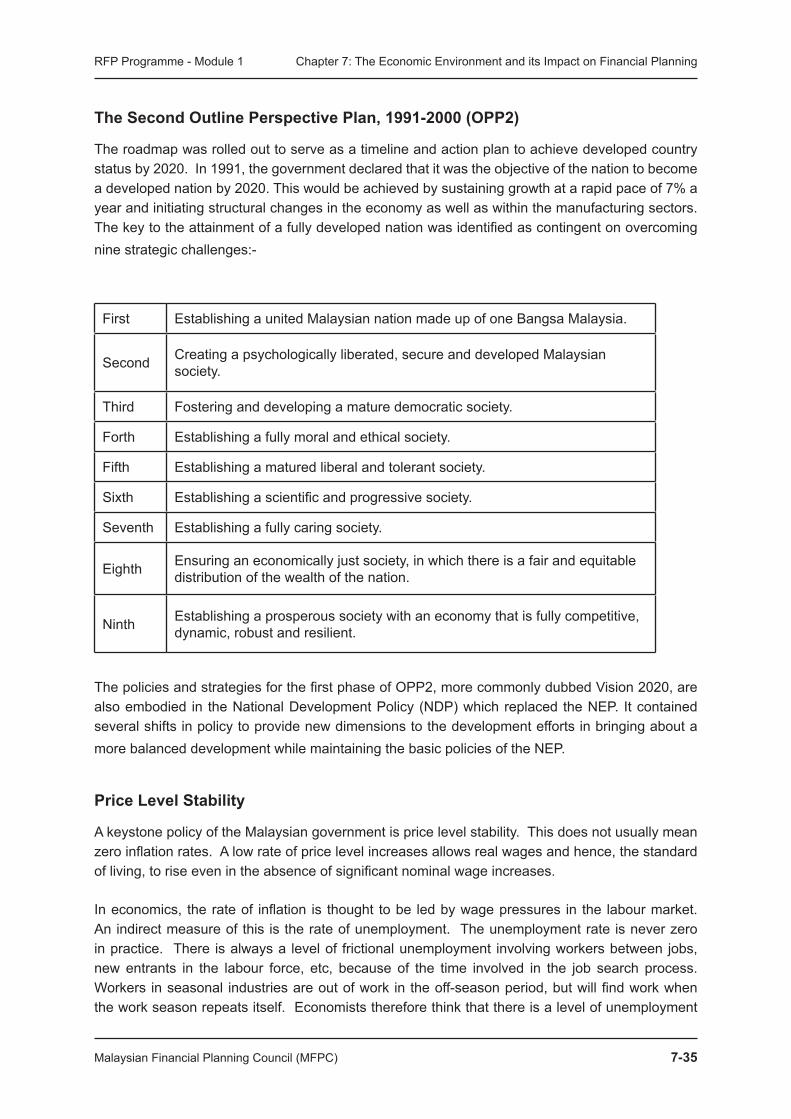
Malaysian Financial Planning Council (MFPC) 7-��
RFP Programme - Module 1 Chapter 7: The Economic Environment and its Impact on Financial Planning
The Second Outline Perspective Plan, ����-�000 (OPP�)
The roadmap was rolled out to serve as a timeline and action plan to achieve developed country status by 2020. In 1991, the government declared that it was the objective of the nation to become a developed nation by 2020. This would be achieved by sustaining growth at a rapid pace of 7% a year and initiating structural changes in the economy as well as within the manufacturing sectors. The key to the attainment of a fully developed nation was identified as contingent on overcoming nine strategic challenges:-
First Establishing a united Malaysian nation made up of one Bangsa Malaysia.
Second Creating a psychologically liberated, secure and developed Malaysian society.
Third Fostering and developing a mature democratic society.
Forth Establishing a fully moral and ethical society.
Fifth Establishing a matured liberal and tolerant society.
Sixth Establishing a scientific and progressive society.
Seventh Establishing a fully caring society.
Eighth Ensuring an economically just society, in which there is a fair and equitable distribution of the wealth of the nation.
Ninth Establishing a prosperous society with an economy that is fully competitive, dynamic, robust and resilient.
The policies and strategies for the first phase of OPP2, more commonly dubbed Vision 2020, are also embodied in the National Development Policy (NDP) which replaced the NEP. It contained several shifts in policy to provide new dimensions to the development efforts in bringing about a more balanced development while maintaining the basic policies of the NEP.
Price Level Stability
A keystone policy of the Malaysian government is price level stability. This does not usually mean zero inflation rates. A low rate of price level increases allows real wages and hence, the standard of living, to rise even in the absence of significant nominal wage increases.
In economics, the rate of inflation is thought to be led by wage pressures in the labour market. An indirect measure of this is the rate of unemployment. The unemployment rate is never zero in practice. There is always a level of frictional unemployment involving workers between jobs, new entrants in the labour force, etc, because of the time involved in the job search process. Workers in seasonal industries are out of work in the off-season period, but will find work when the work season repeats itself. Economists therefore think that there is a level of unemployment

7-�� Malaysian Financial Planning Council (MFPC)
RFP Programme - Module 1 Chapter 7: The Economic Environment and its Impact on Financial Planning
called the natural rate of unemployment that is actually a state of full employment in the economy for practical purposes. What economists worry more about is a potential skills mismatch with employer requirements, which leads to structural unemployment.
Wage pressures themselves arising from labour shortages were kept in check by import of migrant labour. Price level stability objectives are met through a combination of administrative controls on prices of basic inputs, use of subsidies, and removal of supply bottlenecks, such as infrastructure limitations. Competitive forces are fostered by nurturing a multiplicity of producers in industries wherever feasible, so as to pressure against price increases. With inflationary expectations kept low, unproductive activities like hoarding and excessive stocking of inventory will be avoided. Finally, fiscal prudence by the public sector in the 1990s during the period of relative prosperity kept the crowding out effect of public sector spending in check.
The contribution to price level inflation from asset price inflation feeding into the real sector is difficult to control, but is unhealthy when fueled by excessive availability of credit. Bank Negara Malaysia at times issues guidelines to banks to trim the levels of lending for property purchases and to finance share purchases when unhealthy levels of exposure are reached.
In order that stability of price levels is achieved, there must also be stability in exchange rates and terms of trade with major trading partners. Otherwise, variations in prices will arise not from changes in the real cost of traded goods but from changes in the exchange rates. In this respect, Malaysia’s fixed peg to the US Dollar, the currency in which the trading of international commodities is priced, introduced many years of relative price stability. Ongoing price pressures emanating from the weakness of the US Dollar itself may prove to be temporary if international trade imbalances are eventually ironed out.
Policy INSTRUMENTS
The tools the government uses for fine tuning the economy can be divided into 4 main policy instruments:
• Fiscal Policy
• Monetary Policy
• Administrative Controls
• Exchange Rate Policy.
Fiscal Policy
Fiscal policy is a flexibility the government retains in order to smoothen out the demand deficits during economic recessions or to dampen demand during periods of boom in the economy. As stated earlier, aggregate demand in the economy is made up essentially of 4 expenditure components.
Malaysian Financial Planning Council (MFPC) 7-�7
RFP Programme - Module 1 Chapter 7: The Economic Environment and its Impact on Financial Planning
Y = C + I + G + (X-M)
For any given level of spending by the government, tax receipts will depend on the state of the economy. Accordingly, during periods of disequilibrium in the economy when aggregate demand falls short of the full employment level, the public sector fiscal position usually experiences a deficit (shortfall). Typically, the government finances deficit spending (spending more than taxes and other receipts allow) by borrowing in the financial markets. Spending on infrastructure projects which have a high domestic input content can help bridge the demand gap without the attendant leakages into the external economy by the way of imports. The government can also stimulate demand by cutting taxes without cutting back spending, thereby putting money back into the disposable income of consumers. In this respect, progressive tax regimes (in which higher incomes attract higher tax rates) constitute a built-in stabiliser in the economy as taxes automatically rise during boom times and fall when incomes fall during a recession.
Although, in theory, the sovereign capacity of a government to tax its citizens limits its capacity to borrow only at some very high levels of borrowings, it is generally thought that a sustainable level of borrowings is not more than about 5.5% of GDP. At high levels of borrowings, government borrowings in the market may distort it by crowding out or competing with the private sector for credit otherwise available for private investments or consumption. Interest rates can rise in such a scenario, just at a time when the economy can least afford it. Yet, as in Japan, very high rates of savings and low private consumption spending allows the government to finance high levels of borrowings and still leave interest rates at extremely low levels.
One school of thought is that the actual level of public sector deficit at any point in time is not important in itself. Rather, what is important is the level of deficit that the government would be operating at if the economy was operating at full employment (the so-called structural deficit) given the level of spending in focus.
An increase in public sector deficits to above what may be considered normal for that particular phase of the business cycle will result in income in the hands of the suppliers of the factors of production, namely businesses and households. Increased investment spending by businesses and consumption households on the confidence that their earnings are more assured boosts their own spending in turn. This is termed as the second round multiplier effect of government spending. The magnitude of this multiplier on consumer spending depends on what is known in economics as the marginal propensity to consume. In lay terms, it is the additional spending by consumers created by an additional Ringgit of income. In general, the average spending out of income received by consumers in the lower income levels is higher than for people with higher income levels. Hence, the efficiency by which demand can be stimulated by government spending depends on the level of income of the first round beneficiaries of increases in government spending.
Monetary Policy
Monetary policy in Malaysia is supervised by the central bank, Bank Negara Malaysia. This involves the control of the money supply as well as the exercise of moral suasion over the commercial banks in the country. Briefly, the control of the supply of money by Bank Negara is exercised in 3 ways:
7-�� Malaysian Financial Planning Council (MFPC)
RFP Programme - Module 1 Chapter 7: The Economic Environment and its Impact on Financial Planning
i. Through the setting of statutory reserve ratios, the proportion of total deposits accepted that commercial banks are required to keep at the central bank in interest-free deposits. This ratio exerts its influence on the money supply through a multiplier effect on lending by banks as further described below. The statutory reserve ratio is currently 4.0%, but at its height during Bank Negara’s push to rein in money supply growth, it was as high as 13.5% between June 1996 and February 1998.
ii. Through open market operations by Bank Negara buying government T-Bills that the commercial banks own as part of their liquid assets or selling such bills to them. When paying for T-Bills that the banks buy from Bank Negara, banks draw upon their balances kept at the central bank, which must be eventually met by calling back (reducing) either loan assets or loanable funds. In this manner, Bank Negara achieves a reduction in the money supply. On the other hand, the sale of a T-Bill by a commercial bank to Bank Negara translates into a credit entry for the proceeds in its account with Bank Negara, which qualify as statutory reserves. The bank can then proceed to create new overdraft loans (which if drawn upon and deposited at the same bank or another bank, becomes money) of a sum not more than the T-Bill sale proceeds divided by the statutory reserve ratio. The higher the statutory reserve ratio, the lower the multiplier; hence, the lower the sum in overdrafts the banks can extend and the smaller the money supply created in this manner.
iii. Through exercising its influence on the short-term end of the yield curve by borrowing money directly from the banks in the money market when interest rates are deemed too low. Alternatively, it may lend money in the money market at the published discount rate to commercial banks when a shortage of liquidity (funds) in the money market exerts an upward pressure on interest rates at a time when economic conditions are depressed.
As at the time of writing this text, there is a significant sum of speculative funds parked in the country betting on a repeg of the Ringgit to higher values. This inflow, an addition to the money supply, was sterilised (negated) by Bank Negara though its borrowing money from the banking system. The central bank finances the interest cost of its borrowings by investing overseas the foreign exchange it receives in exchange for Ringgit. US Federal Fund rates at 3.75%, are, for example, higher than Malaysian money market interest rates which at this juncture are about 2.7%, making it even profitable for Bank Negara to engage currency speculators.
Bank Negara also makes known to the money market its preferred level of interest rates through a quarterly posting of its Monetary Policy Statement that includes an explicit reference to an Overnight Policy Rate which is effectively a target Average Overnight Interest Rate. This was set at 2.70% and has the impact of sending a timely signal to the market so that no undue rate volatility and uncertainty of interest rate direction prevails.
Bank lending rates are determined pegged against a Base Lending Rate (BLRs). Prior to the Asian Crisis, a formula was used that pegged the Base Lending Rate to the benchmark 3-month KLIBOR (Kuala Lumpur Interbank Borrowing Rate). Since the Asian Crisis, and until 26 April 2004, the central bank allowed commercial banks to set their Base Lending Rates subject to a ceiling rate that was pegged to a formula pegged to its officially posted 3-month Intervention Rate. As
Malaysian Financial Planning Council (MFPC) 7-��
RFP Programme - Module 1 Chapter 7: The Economic Environment and its Impact on Financial Planning
interest rates sagged in the face of increasing levels of liquidity, this Intervention Rate became out of alignment with market interest rates. As a result, in 2004, Bank Negara abolished the system of pegging Base Lending Rates to the Intervention Rate and allowed banks to set Base Lending Rates that their cost of funds allowed that would remain competitive. In practice, banks have got around the system by setting loan rates at even below their published BLRs.
In order to make a reasonable assessment of the outlook for the Malaysian economy and hence provide insights for financial planning decisions, financial planners should be familiar with the structure of the Malaysian economy. It is also incumbent on financial planners to keep themselves informed about ongoing developments in the domestic and international environment that affects the Malaysian economy. Such information is useful for timely decisions concerning financial planning to be made.
Exchange Rate Policy
Bank Negara aims for stable Ringgit exchange rates, particularly against its major trading partners. It traditionally intervened in the foreign exchange markets only to protect the market from risks arising from undue volatility. While Malaysia aims to establish an exchange rate that will balance the competitiveness of Malaysia’s exports but not permit deterioration in its terms of trade against its trading partners, it does not seek to influence market trends through intervention.
Prior to the Asian Crisis of 1997-1998, Malaysia maintained a nominally flexible exchange rate that was best described as a managed float. Yet, its major export competitors in Asia maintained informal pegs to the US Dollar that ultimately became dislodged during the Crisis. The regional contagion effect spilled over to the trading of the Ringgit and resulted in a drop in the exchange value of the Ringgit to as low as RM4.80 at one stage in 1998.
Upon the adoption of a formal fixed peg to the Dollar in September 1998, the Ringgit became no longer exchangeable outside the country’s foreign exchange market. To buttress the value of the pegged Ringgit, controls on capital account transactions were introduced although current account transactions were subject only to form-filling formalities. To prevent smuggling of notes overseas that could undermine the peg, large denomination (RM500 and RM1,000) notes were withdrawn from circulation. Cash remittances of more than RM1,000 or RM10,000 equivalent in foreign currency is not permitted except with prior approval.
With all signs pointing to a diminished threat of speculative pressure against the Ringgit, a series of steps towards a liberalisation of exchange regulations began. An exit tax levy imposed on portfolio investments by non-residents was abolished in May 2001.
In April 2005, a series of liberalisation measures took hold that permitted the opening of foreign currency accounts by residents with transfers into such accounts of up to RM100,000 each calendar year for individuals with domestic credit facilities and RM10 million a year for corporate groups with domestic credit facilities.
Malaysians with no borrowings locally were also allowed unrestricted investments overseas but investments funded by borrowings overseas were limited to RM10 million in each instance. Ceilings

7-�0 Malaysian Financial Planning Council (MFPC)
RFP Programme - Module 1 Chapter 7: The Economic Environment and its Impact on Financial Planning
on credit facilities for individuals in foreign currencies were raised from RM5 million to RM10 and to RM50 million for corporations on a group basis.
Unit trusts, investment-linked insurance funds, were allowed to invest overseas up to 30% of the Net Asset Values their funds, up from 10% previously. Fund/Asset managers were permitted to invest all money pooled from residents without borrowings and up to 30% of funds, if the investors had domestic borrowings.
Administrative Controls
Finally, the government also can resort to administrative controls over prices, incomes and other economic variables that it deems necessary to achieve economic objectives. This includes steps like outright price ceilings on prices of essential consumer or construction material commodities and services such as flour, sugar, chicken, cement, steel rebars, bus fares, etc. Subsidies for fuel are intended to smooth out the effects of commodity price swings which fuel is typically subject to.
At other times, incomes policies such as controls on salary adjustments may be implemented or credit policies such as outright lending ceilings or margin of financing to sectors deemed overheated may be imposed. Quotas may be imposed on imports or production of selected goods.
Major Sectors of the Malaysian Economy
For ease of analysis, the Malaysian economy can be broadly divided into 5 sectors :
1. Agriculture
2. Mining and Quarrying
3. Construction
4. Manufacturing
5. Services.
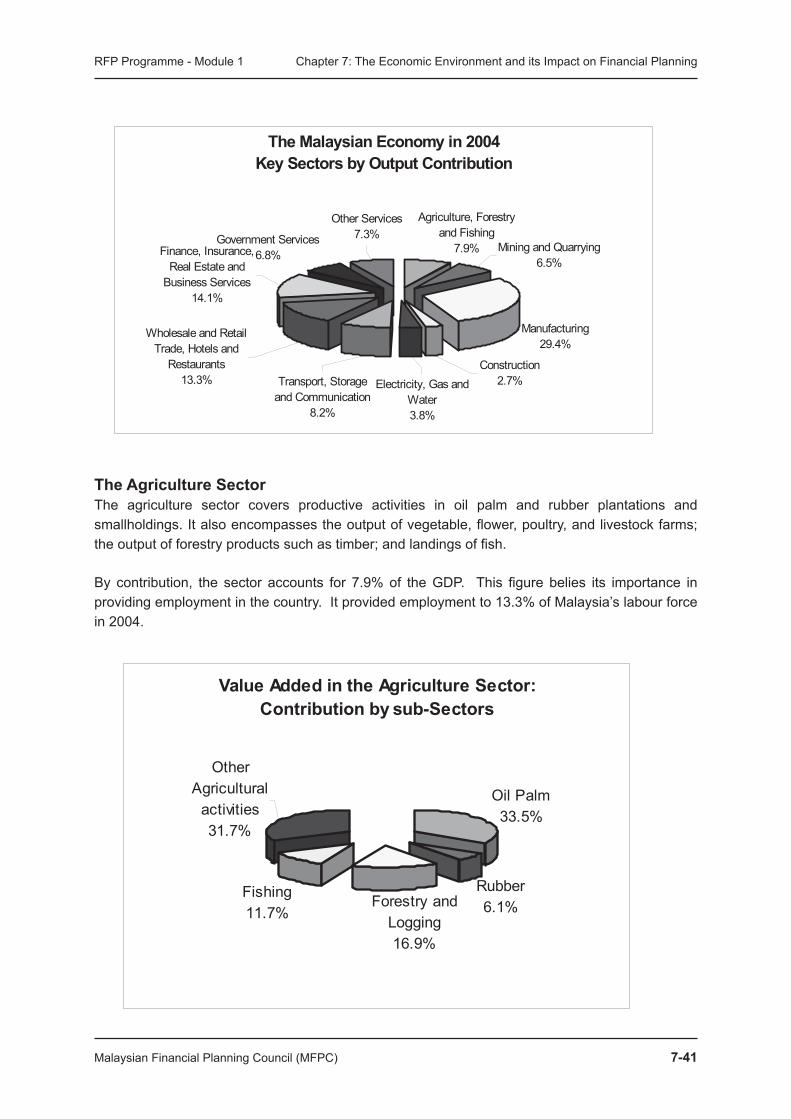
Malaysian Financial Planning Council (MFPC) 7-��
RFP Programme - Module 1 Chapter 7: The Economic Environment and its Impact on Financial Planning
RFP Programme – Module 1 Chapter 7 – The Economic
Malaysian Financial Planning Council (MFPC) 39
4. Manufacturing
5. Services.
The Agriculture Sector
The agriculture sector covers productive activities in oil palm and rubber plantations
and smallholdings. It also encompasses the output of vegetable, flower, poultry, and
livestock farms; the output of forestry products such as timber; and landings of fish.
By contribution, the sector accounts for 7.9% of the GDP. This figure belies its
importance in providing employment in the country. It provided employment to
13.3% of Malaysia's labour force in 2004.
The Malaysian Economy in 2004 Key Sectors by Output Contribution
Agriculture, Forestry and Fishing
7.9%
Manufacturing29.4%
Government Services6.8%
Transport, Storage and Communication
8.2%
Other Services7.3%
Finance, Insurance, Real Estate and
Business Services14.1%
Wholesale and Retail Trade, Hotels and
Restaurants13.3% Electricity, Gas and
Water3.8%
Construction2.7%
Mining and Quarrying6.5%
The Agriculture Sector The agriculture sector covers productive activities in oil palm and rubber plantations and smallholdings. It also encompasses the output of vegetable, flower, poultry, and livestock farms; the output of forestry products such as timber; and landings of fish.
By contribution, the sector accounts for 7.9% of the GDP. This figure belies its importance in providing employment in the country. It provided employment to 13.3% of Malaysia’s labour force in 2004.
RFP Programme – Module 1 Chapter 7 – The Economic
Malaysian Financial Planning Council (MFPC) 40
In 2004, Malaysia produced 13.98 million tonnes of crude palm oil (+4.7%), of which
12.555 million tonnes were exported. The main growth driver was the rise in mature
oil palm acreage. It rose by 4.5% to 3.45 million hectares in 2004 (2003: 3.6%),
mainly due to increases in the East Malaysia. states of Sabah and Sarawak which
registered growth rates of 4.4% and 17.7% respectively. In Peninsular Malaysia, the
expansion rate was a more moderate 2.2% but still constituted a majority share of
about 58% to total crude palm oil (CPO) production. The second factor behind output
growth was an improvement in the oil extraction rates (OER), which are a barometer
of palm oil yield productivity. The Malaysian OER breached the critical 20%
threshold for the first time in history, to 20.03% (2003:19.75%). This is important, as
every 1% increase in the OER translates to an increase of about 0.5 million tonnes in
CPO output.
Rubber production rose to 1.16 million tonnes (+17.6%) as even previously idle
acreages were brought back into tapping after rubber prices soared 33.7% in 2003 and
continued to rise, adding 10.2% in 2004. Rubber prices were buoyed by the Chinese
government’s decision to abolish import quotas for natural rubber in accordance with
their WTO trade liberalization obligations.
Value Added in the Agriculture Sector: Contribution by sub-Sectors
Oil Palm33.5%
Rubber6.1%Forestry and
Logging16.9%
Fishing11.7%
Other Agricultural
activities31.7%

7-�� Malaysian Financial Planning Council (MFPC)
RFP Programme - Module 1 Chapter 7: The Economic Environment and its Impact on Financial Planning
In 2004, Malaysia produced 13.98 million tonnes of crude palm oil (+4.7%), of which 12.555 million tonnes were exported. The main growth driver was the rise in mature oil palm acreage. It rose by 4.5% to 3.45 million hectares in 2004 (2003: 3.6%), mainly due to increases in the East Malaysia. states of Sabah and Sarawak which registered growth rates of 4.4% and 17.7% respectively. In Peninsular Malaysia, the expansion rate was a more moderate 2.2% but still constituted a majority share of about 58% to total crude palm oil (CPO) production. The second factor behind output growth was an improvement in the oil extraction rates (OER), which are a barometer of palm oil yield productivity. The Malaysian OER breached the critical 20% threshold for the first time in history, to 20.03% (2003:19.75%). This is important, as every 1% increase in the OER translates to an increase of about 0.5 million tonnes in CPO output.
Rubber production rose to 1.16 million tonnes (+17.6%) as even previously idle acreages were brought back into tapping after rubber prices soared 33.7% in 2003 and continued to rise, adding 10.2% in 2004. Rubber prices were buoyed by the Chinese government’s decision to abolish import quotas for natural rubber in accordance with their WTO trade liberalization obligations.
The strong growth in fruit (+7.1% in 2004) and vegetable (+25% in 2004) production was due mainly to increases in cultivation areas amidst strong domestic consumption.
Timber output is on a secular decline as the availability of new forested areas not previously logged shrinks by the year and with the gazettement of increasing forest hectarages as Permanent Forest Estate . In 2004, sawlogs output rose just 0.7% to 21,576 million cubic metres despite a huge incentive from average timber log prices reaching a record-high at RM398/cubic metre following a ban on log exports by Indonesia. There is an active programme of replanting rubber trees under forest plantation tax incentives offered by the government in order to keep the RM5 billion furniture export industry going.
Data from the Statistics Department’s concerning the growth of the sector reports real output figures, meaning that high commodity prices and higher nominal export figures do not necessarily get reflected as higher output for the industry. At current (nominal) prices, the value of the total sector output can rise, buoyed by high export prices, even as official statistics report a contraction for the industry.
Real output in the agriculture sector is affected by weather conditions. Dry weather can cause crop productivity to drop, but overly wet weather can cause floods that disrupt the harvesting of fresh oil palm fruit bunches and this also affects harvesting of timber logs, or in the case of rubber, causes the production of dilute latex. Expansion of hectarage of plantations can boost output. Rubber trees or oil palms entering peak productive age profiles also help boost output without any rise in plantings by the industry. Seasonal factors such as the wintering season affects the output of the rubber plantation industry. The oil palm plantation industry is affected by a multi-year (3-4 year) biological yield stress cycle which sees years of better yields alternating with years of poorer yield during which the palms “rest”.
Nominal (current price) output is affected by the prices of competing oils or raw materials such as soybean and sunflower oil in the case of palm oil, and crude oil (feedstock for synthetic rubber) in the case of natural rubber. Variations in supply that affect prices can arise from changes in milling

Malaysian Financial Planning Council (MFPC) 7-��
RFP Programme - Module 1 Chapter 7: The Economic Environment and its Impact on Financial Planning
efficiency as in the oil extraction ratio. Prices can fluctuate with variations in offtake from major importing countries such as China, India, and Europe. World and major export market population dynamics, weather conditions in countries producing competing oils, export market government policies such as import tariffs, subsidies for planting of local substitute oils etc, can affect the nominal prices for palm oil and rubber.
The demand from industrial users such as for palm kernel oil can cause movements in opposite directions for palm kernel oil as opposed to crude palm oil. Environmental protection legislation in Europe promoting the use of biodiesel may affect demand in that market. Legislation in developed countries such as the Food and Drug Administration (FDA) regulations on the labeling of food products that contain trans fatty acid beginning 2006, resulted in a significant increase in imports by the US (+29.2%) to 298,760 tonnes.
The poultry farming industry, another important sub sector, undergoes frequent boom and bust cycles due to rival farms not sharing industry data. High prices for farm produce encourage over-investment which results in spells of poor produce prices that require the culling of day old chick stocks to curtail supply, etc., eventually restoring high prices and repeating the cycle. Festive periods normally see periods of seasonal peak production by the livestock or poultry industry. Random events such as outbreaks of diseases such as hoof-and-mouth disease, the Nipah virus, the avian flu, etc., can affect the output of the livestock or poultry industry. The fishery industry is also affected by conditions at sea and investments into fishing fleets or freshwater ponds. For example, the fisheries sub-sector grew by 6.5% in 2004 to 1.58 million tonnes (2003: 1.48 million tonnes), driven mainly by more active deep-sea fishing and increased output of high value-added aquaculture and ornamental fish.
It is not easy to track the performance of most of the sub-sectors in the Agriculture sector. A reasonably close assessment about the performance of the sector can be established by tracking the output of the main components in the sector, namely the oil palm plantations sector which accounts for about 34% of the agriculture sector’s output.
Monthly data on the total hectarage of oil palms and rubber trees to which output is linked, are readily available from the Statistics Department. But information regarding the age profile of planted acreages and current data on the Oil Extraction Rate is difficult to come by. The Palm Oil Registration and Licensing Authority (PORLA) tracks production, and export data on crude and refined palm oil. Annual or monthly times series data are also contained in the Bank Negara Monthly Statistical Bulletin and the Treasury Department’s Economic Report.
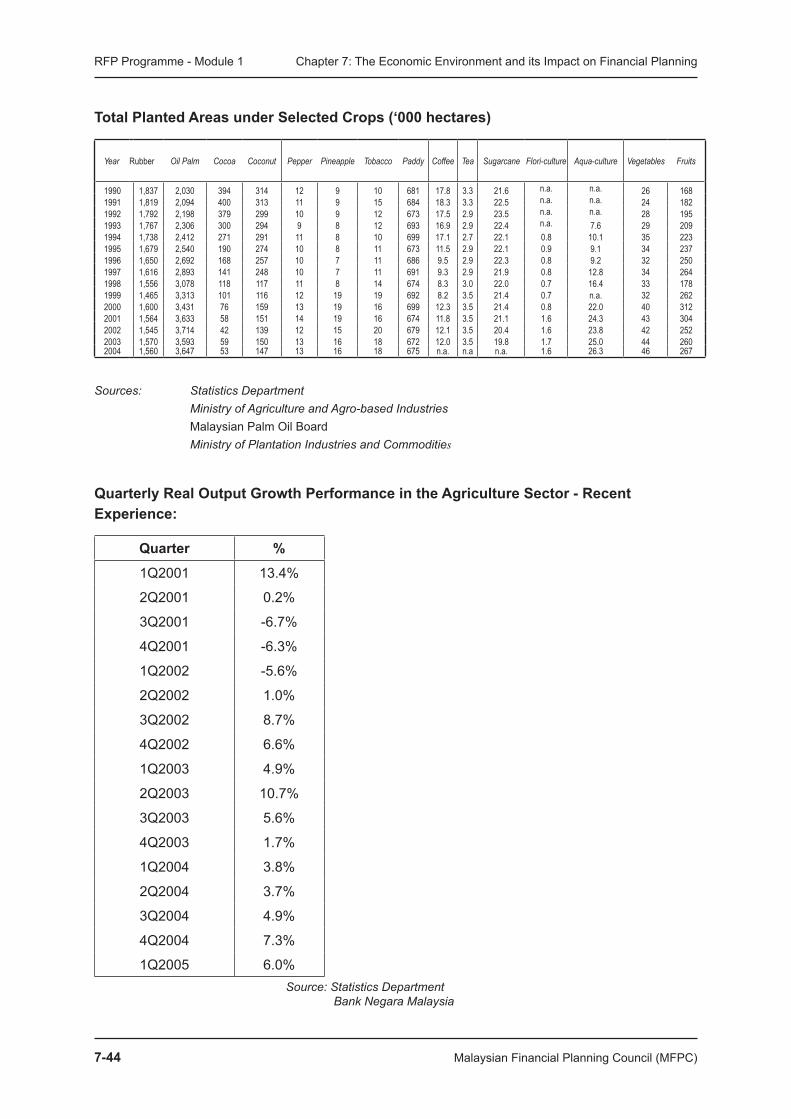
7-�� Malaysian Financial Planning Council (MFPC)
RFP Programme - Module 1 Chapter 7: The Economic Environment and its Impact on Financial Planning
Total Planted Areas under Selected Crops (‘000 hectares)
Year Rubber Oil Palm Cocoa Coconut Pepper Pineapple Tobacco Paddy Coffee Tea Sugarcane Flori-culture Aqua-culture Vegetables Fruits
1990 1,837 2,030 394 314 12 9 10 681 17.8 3.3 21.6 n.a. n.a. 26 1681991 1,819 2,094 400 313 11 9 15 684 18.3 3.3 22.5 n.a. n.a. 24 1821992 1,792 2,198 379 299 10 9 12 673 17.5 2.9 23.5 n.a. n.a. 28 1951993 1,767 2,306 300 294 9 8 12 693 16.9 2.9 22.4 n.a. 7.6 29 2091994 1,738 2,412 271 291 11 8 10 699 17.1 2.7 22.1 0.8 10.1 35 2231995 1,679 2,540 190 274 10 8 11 673 11.5 2.9 22.1 0.9 9.1 34 2371996 1,650 2,692 168 257 10 7 11 686 9.5 2.9 22.3 0.8 9.2 32 2501997 1,616 2,893 141 248 10 7 11 691 9.3 2.9 21.9 0.8 12.8 34 2641998 1,556 3,078 118 117 11 8 14 674 8.3 3.0 22.0 0.7 16.4 33 1781999 1,465 3,313 101 116 12 19 19 692 8.2 3.5 21.4 0.7 n.a. 32 2622000 1,600 3,431 76 159 13 19 16 699 12.3 3.5 21.4 0.8 22.0 40 3122001 1,564 3,633 58 151 14 19 16 674 11.8 3.5 21.1 1.6 24.3 43 3042002 1,545 3,714 42 139 12 15 20 679 12.1 3.5 20.4 1.6 23.8 42 2522003 1,570 3,593 59 150 13 16 18 672 12.0 3.5 19.8 1.7 25.0 44 2602004 1,560 3,647 53 147 13 16 18 675 n.a. n.a n.a. 1.6 26.3 46 267
Sources: Statistics Department Ministry of Agriculture and Agro-based Industries Malaysian Palm Oil Board Ministry of Plantation Industries and Commodities
Quarterly Real Output Growth Performance in the Agriculture Sector - Recent Experience:
Quarter %
1Q2001 13.4%
2Q2001 0.2%
3Q2001 -6.7%
4Q2001 -6.3%
1Q2002 -5.6%
2Q2002 1.0%
3Q2002 8.7%
4Q2002 6.6%
1Q2003 4.9%
2Q2003 10.7%
3Q2003 5.6%
4Q2003 1.7%
1Q2004 3.8%
2Q2004 3.7%
3Q2004 4.9%
4Q2004 7.3%
1Q2005 6.0% Source: Statistics Department Bank Negara Malaysia
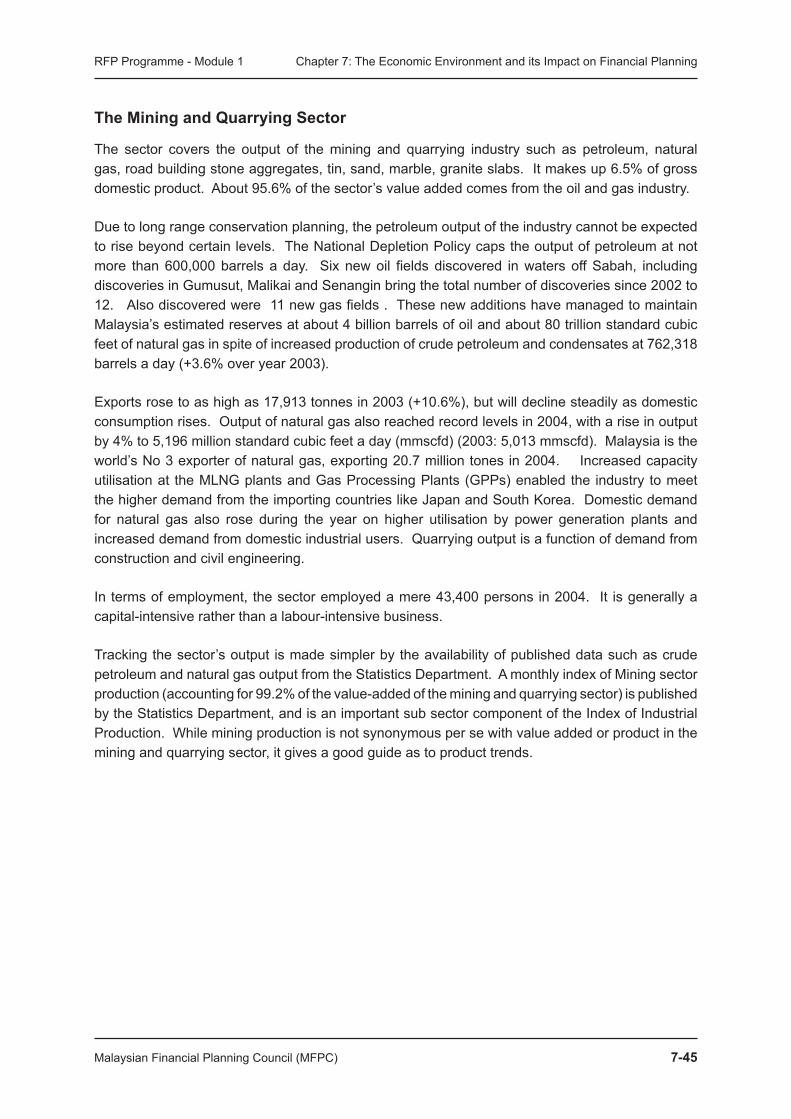
Malaysian Financial Planning Council (MFPC) 7-��
RFP Programme - Module 1 Chapter 7: The Economic Environment and its Impact on Financial Planning
The Mining and Quarrying Sector
The sector covers the output of the mining and quarrying industry such as petroleum, natural gas, road building stone aggregates, tin, sand, marble, granite slabs. It makes up 6.5% of gross domestic product. About 95.6% of the sector’s value added comes from the oil and gas industry.
Due to long range conservation planning, the petroleum output of the industry cannot be expected to rise beyond certain levels. The National Depletion Policy caps the output of petroleum at not more than 600,000 barrels a day. Six new oil fields discovered in waters off Sabah, including discoveries in Gumusut, Malikai and Senangin bring the total number of discoveries since 2002 to 12. Also discovered were 11 new gas fields . These new additions have managed to maintain Malaysia’s estimated reserves at about 4 billion barrels of oil and about 80 trillion standard cubic feet of natural gas in spite of increased production of crude petroleum and condensates at 762,318 barrels a day (+3.6% over year 2003).
Exports rose to as high as 17,913 tonnes in 2003 (+10.6%), but will decline steadily as domestic consumption rises. Output of natural gas also reached record levels in 2004, with a rise in output by 4% to 5,196 million standard cubic feet a day (mmscfd) (2003: 5,013 mmscfd). Malaysia is the world’s No 3 exporter of natural gas, exporting 20.7 million tones in 2004. Increased capacity utilisation at the MLNG plants and Gas Processing Plants (GPPs) enabled the industry to meet the higher demand from the importing countries like Japan and South Korea. Domestic demand for natural gas also rose during the year on higher utilisation by power generation plants and increased demand from domestic industrial users. Quarrying output is a function of demand from construction and civil engineering.
In terms of employment, the sector employed a mere 43,400 persons in 2004. It is generally a capital-intensive rather than a labour-intensive business.
Tracking the sector’s output is made simpler by the availability of published data such as crude petroleum and natural gas output from the Statistics Department. A monthly index of Mining sector production (accounting for 99.2% of the value-added of the mining and quarrying sector) is published by the Statistics Department, and is an important sub sector component of the Index of Industrial Production. While mining production is not synonymous per se with value added or product in the mining and quarrying sector, it gives a good guide as to product trends.
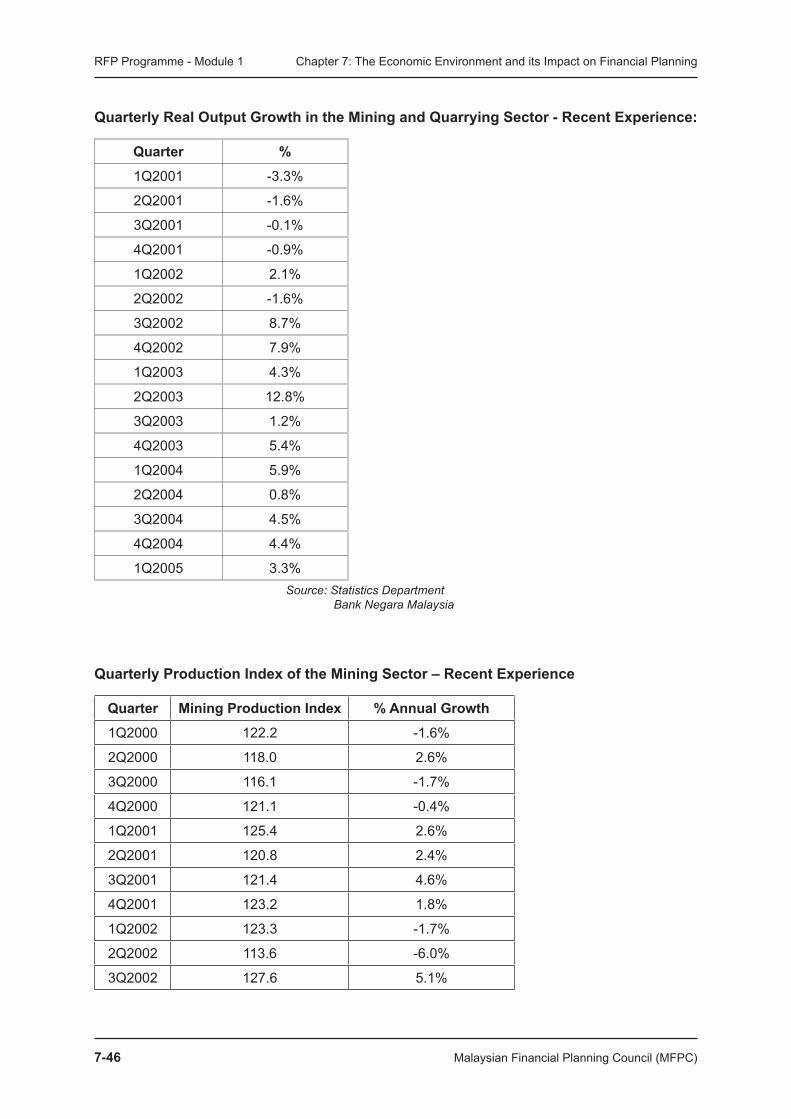
7-�� Malaysian Financial Planning Council (MFPC)
RFP Programme - Module 1 Chapter 7: The Economic Environment and its Impact on Financial Planning
Quarterly Real Output Growth in the Mining and Quarrying Sector - Recent Experience:
Quarter %
1Q2001 -3.3%
2Q2001 -1.6%
3Q2001 -0.1%
4Q2001 -0.9%
1Q2002 2.1%
2Q2002 -1.6%
3Q2002 8.7%
4Q2002 7.9%
1Q2003 4.3%
2Q2003 12.8%
3Q2003 1.2%
4Q2003 5.4%
1Q2004 5.9%
2Q2004 0.8%
3Q2004 4.5%
4Q2004 4.4%
1Q2005 3.3% Source: Statistics Department Bank Negara Malaysia
Quarterly Production Index of the Mining Sector – Recent Experience
Quarter Mining Production Index % Annual Growth
1Q2000 122.2 -1.6%
2Q2000 118.0 2.6%
3Q2000 116.1 -1.7%
4Q2000 121.1 -0.4%
1Q2001 125.4 2.6%
2Q2001 120.8 2.4%
3Q2001 121.4 4.6%
4Q2001 123.2 1.8%
1Q2002 123.3 -1.7%
2Q2002 113.6 -6.0%
3Q2002 127.6 5.1%
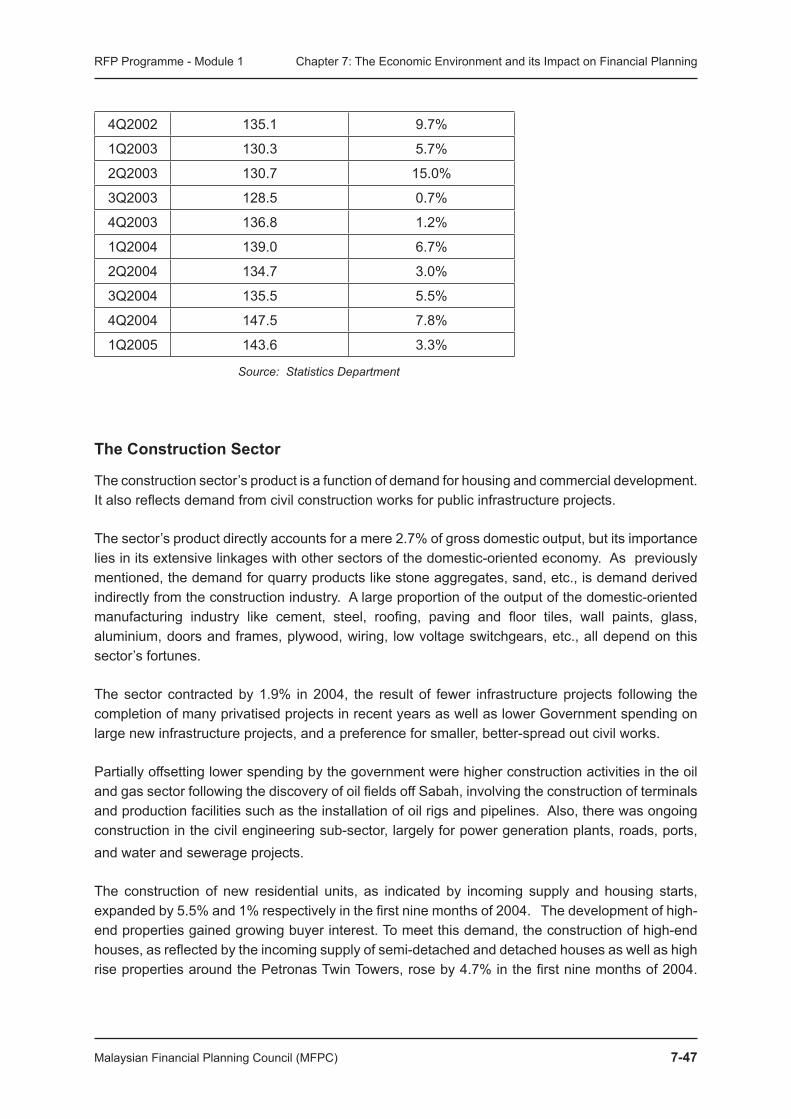
Malaysian Financial Planning Council (MFPC) 7-�7
RFP Programme - Module 1 Chapter 7: The Economic Environment and its Impact on Financial Planning
4Q2002 135.1 9.7%
1Q2003 130.3 5.7%
2Q2003 130.7 15.0%
3Q2003 128.5 0.7%
4Q2003 136.8 1.2%
1Q2004 139.0 6.7%
2Q2004 134.7 3.0%
3Q2004 135.5 5.5%
4Q2004 147.5 7.8%
1Q2005 143.6 3.3%
Source: Statistics Department
The Construction Sector
The construction sector’s product is a function of demand for housing and commercial development. It also reflects demand from civil construction works for public infrastructure projects.
The sector’s product directly accounts for a mere 2.7% of gross domestic output, but its importance lies in its extensive linkages with other sectors of the domestic-oriented economy. As previously mentioned, the demand for quarry products like stone aggregates, sand, etc., is demand derived indirectly from the construction industry. A large proportion of the output of the domestic-oriented manufacturing industry like cement, steel, roofing, paving and floor tiles, wall paints, glass, aluminium, doors and frames, plywood, wiring, low voltage switchgears, etc., all depend on this sector’s fortunes.
The sector contracted by 1.9% in 2004, the result of fewer infrastructure projects following the completion of many privatised projects in recent years as well as lower Government spending on large new infrastructure projects, and a preference for smaller, better-spread out civil works.
Partially offsetting lower spending by the government were higher construction activities in the oil and gas sector following the discovery of oil fields off Sabah, involving the construction of terminals and production facilities such as the installation of oil rigs and pipelines. Also, there was ongoing construction in the civil engineering sub-sector, largely for power generation plants, roads, ports, and water and sewerage projects.
The construction of new residential units, as indicated by incoming supply and housing starts, expanded by 5.5% and 1% respectively in the first nine months of 2004. The development of high-end properties gained growing buyer interest. To meet this demand, the construction of high-end houses, as reflected by the incoming supply of semi-detached and detached houses as well as high rise properties around the Petronas Twin Towers, rose by 4.7% in the first nine months of 2004.

7-�� Malaysian Financial Planning Council (MFPC)
RFP Programme - Module 1 Chapter 7: The Economic Environment and its Impact on Financial Planning
With improving demand, house prices trended upwards in the first half of 2004 with the Malaysian House Price Index rising by 5.7%.
Notwithstanding new supply, the overall occupancy rate for office and retail space in the Klang Valley improved to 81.9% and 79.6% respectively in the first nine months of 2004 (2003: 80.5% and 78% respectively). Construction activity in the non-residential segment recovered in 2004, driven by the higher demand for office and retail space following more business activities. New office and retail space completed increased by 222,000 sq. metres and 265,000 sq. metres respectively in the first nine months of 2004 (first nine months of 2003: 159,000 sq. metres and 183,000 sq. metres respectively). In the purpose-built office segment, the demand was supported by growth in service-related businesses such as finance, insurance, education and health. In the shopping complex segment, the demand for retail space was boosted by strong consumer spending. New shopping complexes were located mainly in the popular residential areas and suburbs to target the growing affluent population in the surrounding neighbourhoods.
The construction of 235 new hotels during 2004 added 6,755 rooms to the national stock of hotel rooms. A linkage to the hotels sub sector within the services sector is therefore obvious.
The construction sector faces regular challenges such as the late 2004 temporary shortages of migrant labour on which it is very dependent, and of raw materials such as steel bars, which in early 2004, led to delays in some civil engineering projects. As world prices for steel bars and billets rose along with prices of other building materials such as sand and timber products, the industry faces rising costs.
Tracking the construction industry’s growth is a difficult exercise. For indicative trends, the reader can track the Monthly Statistical Bulletin published by Bank Negara. This contains statistics on housing developers’ advertisement and sales permits and renewals, housing approvals, cement production, iron and basic steel production, production of construction-related products, housing credits and construction sector extended by the banks, the Malaysian House Price Index, and imports of construction materials.
While such statistics are indicative of planned activities, the forecasting of actual housing demand requires an astute reading of income trends, interest rates and bank credit policies and availability.
Even where demand is strong, seasonal factors that affect the sector’s actual product are clearly at work during specific festive quarters. The vagaries of the weather affect the progress of civil works and unheralded raw materials supply bottlenecks such as caused by international demand from China make forecasting of the sector’s performance difficult even in the short term.
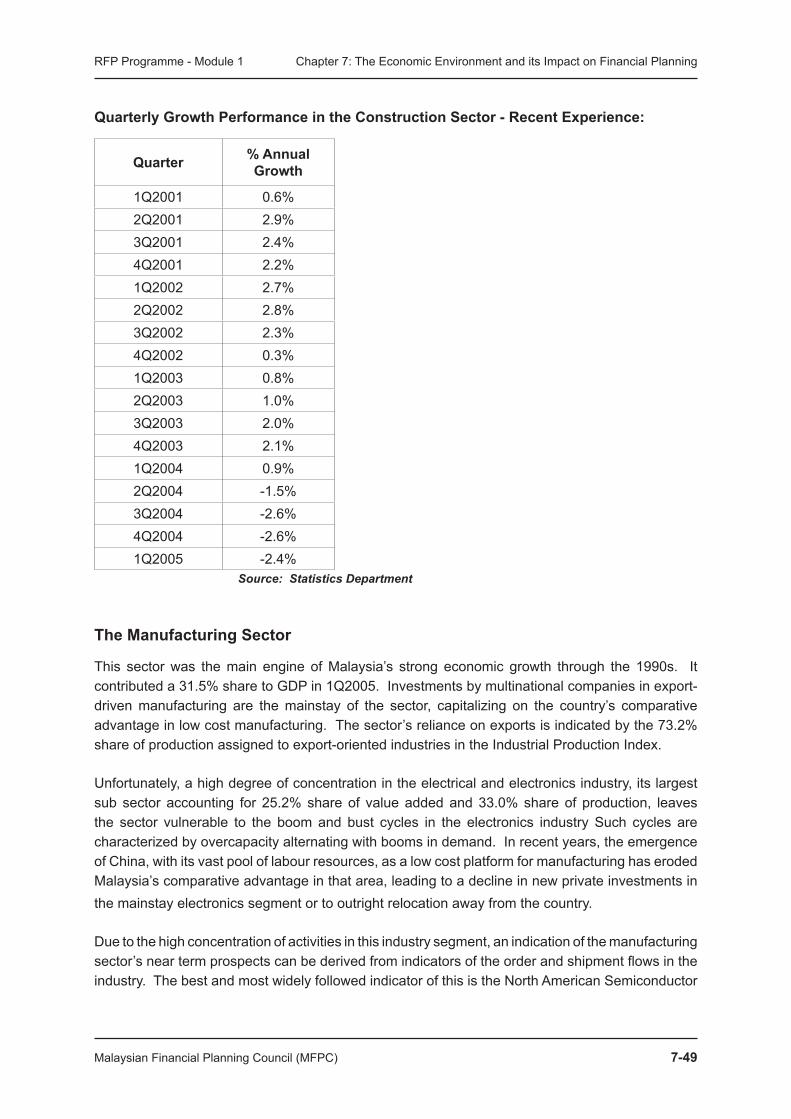
Malaysian Financial Planning Council (MFPC) 7-��
RFP Programme - Module 1 Chapter 7: The Economic Environment and its Impact on Financial Planning
Quarterly Growth Performance in the Construction Sector - Recent Experience:
Quarter % Annual Growth
1Q2001 0.6%2Q2001 2.9%3Q2001 2.4%4Q2001 2.2%1Q2002 2.7%2Q2002 2.8%3Q2002 2.3%4Q2002 0.3%1Q2003 0.8%2Q2003 1.0%3Q2003 2.0%4Q2003 2.1%1Q2004 0.9%2Q2004 -1.5%3Q2004 -2.6%4Q2004 -2.6%1Q2005 -2.4%
Source: Statistics Department
The Manufacturing Sector
This sector was the main engine of Malaysia’s strong economic growth through the 1990s. It contributed a 31.5% share to GDP in 1Q2005. Investments by multinational companies in export-driven manufacturing are the mainstay of the sector, capitalizing on the country’s comparative advantage in low cost manufacturing. The sector’s reliance on exports is indicated by the 73.2% share of production assigned to export-oriented industries in the Industrial Production Index.
Unfortunately, a high degree of concentration in the electrical and electronics industry, its largest sub sector accounting for 25.2% share of value added and 33.0% share of production, leaves the sector vulnerable to the boom and bust cycles in the electronics industry Such cycles are characterized by overcapacity alternating with booms in demand. In recent years, the emergence of China, with its vast pool of labour resources, as a low cost platform for manufacturing has eroded Malaysia’s comparative advantage in that area, leading to a decline in new private investments in the mainstay electronics segment or to outright relocation away from the country.
Due to the high concentration of activities in this industry segment, an indication of the manufacturing sector’s near term prospects can be derived from indicators of the order and shipment flows in the industry. The best and most widely followed indicator of this is the North American Semiconductor
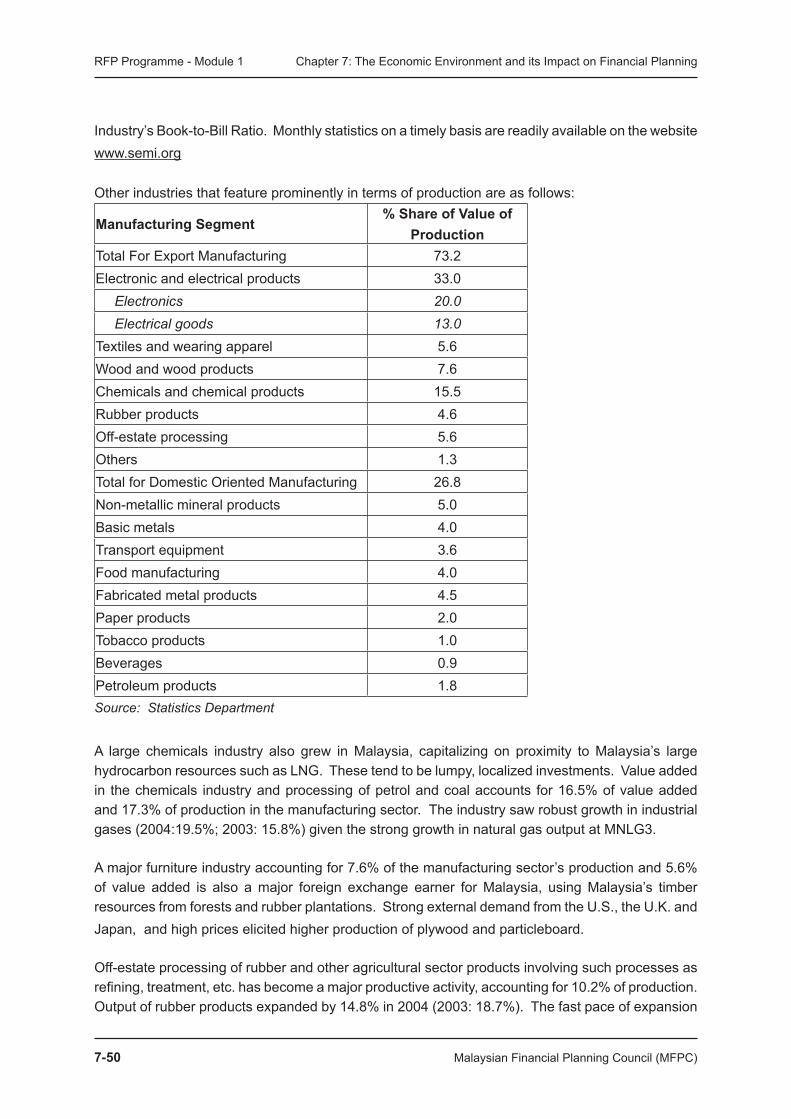
7-�0 Malaysian Financial Planning Council (MFPC)
RFP Programme - Module 1 Chapter 7: The Economic Environment and its Impact on Financial Planning
Industry’s Book-to-Bill Ratio. Monthly statistics on a timely basis are readily available on the website www.semi.org
Other industries that feature prominently in terms of production are as follows:
Manufacturing Segment % Share of Value of
ProductionTotal For Export Manufacturing 73.2Electronic and electrical products 33.0
Electronics 20.0Electrical goods 13.0
Textiles and wearing apparel 5.6Wood and wood products 7.6Chemicals and chemical products 15.5Rubber products 4.6Off-estate processing 5.6Others 1.3Total for Domestic Oriented Manufacturing 26.8Non-metallic mineral products 5.0Basic metals 4.0Transport equipment 3.6Food manufacturing 4.0Fabricated metal products 4.5Paper products 2.0Tobacco products 1.0Beverages 0.9Petroleum products 1.8Source: Statistics Department
A large chemicals industry also grew in Malaysia, capitalizing on proximity to Malaysia’s large hydrocarbon resources such as LNG. These tend to be lumpy, localized investments. Value added in the chemicals industry and processing of petrol and coal accounts for 16.5% of value added and 17.3% of production in the manufacturing sector. The industry saw robust growth in industrial gases (2004:19.5%; 2003: 15.8%) given the strong growth in natural gas output at MNLG3.
A major furniture industry accounting for 7.6% of the manufacturing sector’s production and 5.6% of value added is also a major foreign exchange earner for Malaysia, using Malaysia’s timber resources from forests and rubber plantations. Strong external demand from the U.S., the U.K. and Japan, and high prices elicited higher production of plywood and particleboard.
Off-estate processing of rubber and other agricultural sector products involving such processes as refining, treatment, etc. has become a major productive activity, accounting for 10.2% of production. Output of rubber products expanded by 14.8% in 2004 (2003: 18.7%). The fast pace of expansion
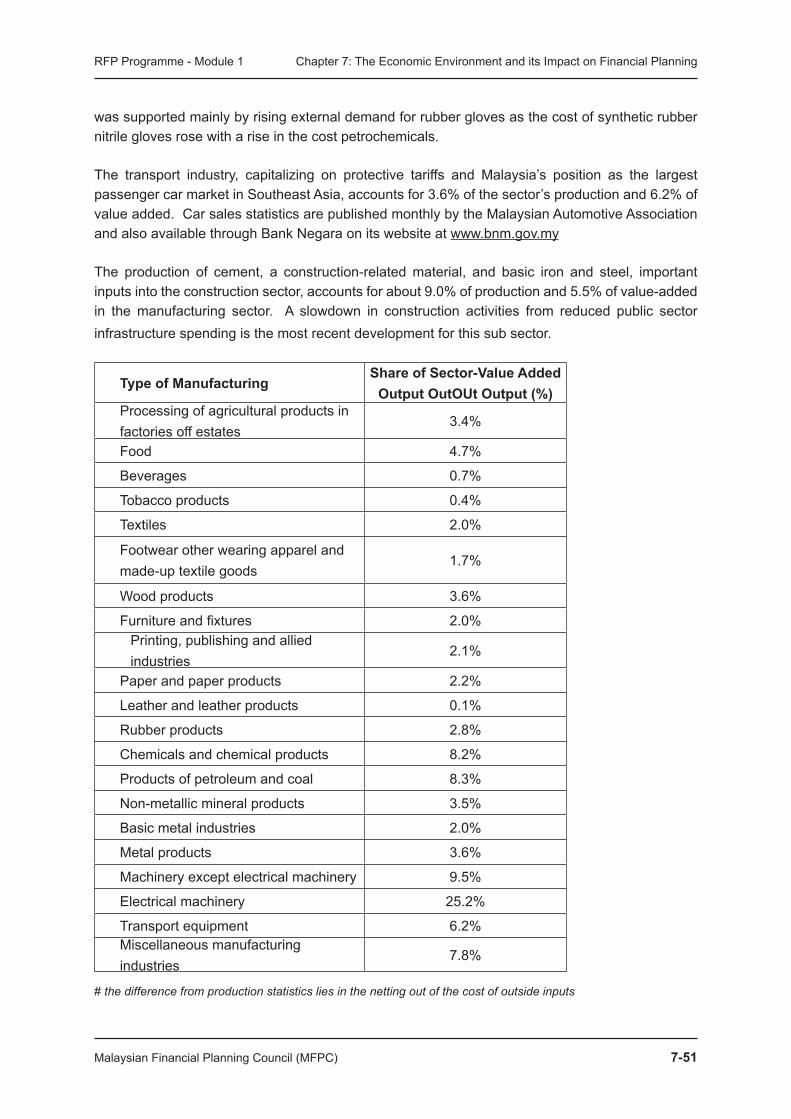
Malaysian Financial Planning Council (MFPC) 7-��
RFP Programme - Module 1 Chapter 7: The Economic Environment and its Impact on Financial Planning
was supported mainly by rising external demand for rubber gloves as the cost of synthetic rubber nitrile gloves rose with a rise in the cost petrochemicals.
The transport industry, capitalizing on protective tariffs and Malaysia’s position as the largest passenger car market in Southeast Asia, accounts for 3.6% of the sector’s production and 6.2% of value added. Car sales statistics are published monthly by the Malaysian Automotive Association and also available through Bank Negara on its website at www.bnm.gov.my
The production of cement, a construction-related material, and basic iron and steel, important inputs into the construction sector, accounts for about 9.0% of production and 5.5% of value-added in the manufacturing sector. A slowdown in construction activities from reduced public sector infrastructure spending is the most recent development for this sub sector.
Type of Manufacturing Share of Sector-Value Added
Output OutOUt Output (%)Processing of agricultural products in factories off estates
3.4%
Food 4.7%
Beverages 0.7%
Tobacco products 0.4%
Textiles 2.0%
Footwear other wearing apparel and made-up textile goods
1.7%
Wood products 3.6%
Furniture and fixtures 2.0%Printing, publishing and allied industries
2.1%
Paper and paper products 2.2%
Leather and leather products 0.1%
Rubber products 2.8%
Chemicals and chemical products 8.2%
Products of petroleum and coal 8.3%
Non-metallic mineral products 3.5%
Basic metal industries 2.0%
Metal products 3.6%
Machinery except electrical machinery 9.5%
Electrical machinery 25.2%
Transport equipment 6.2%Miscellaneous manufacturing industries
7.8%
# the difference from production statistics lies in the netting out of the cost of outside inputs
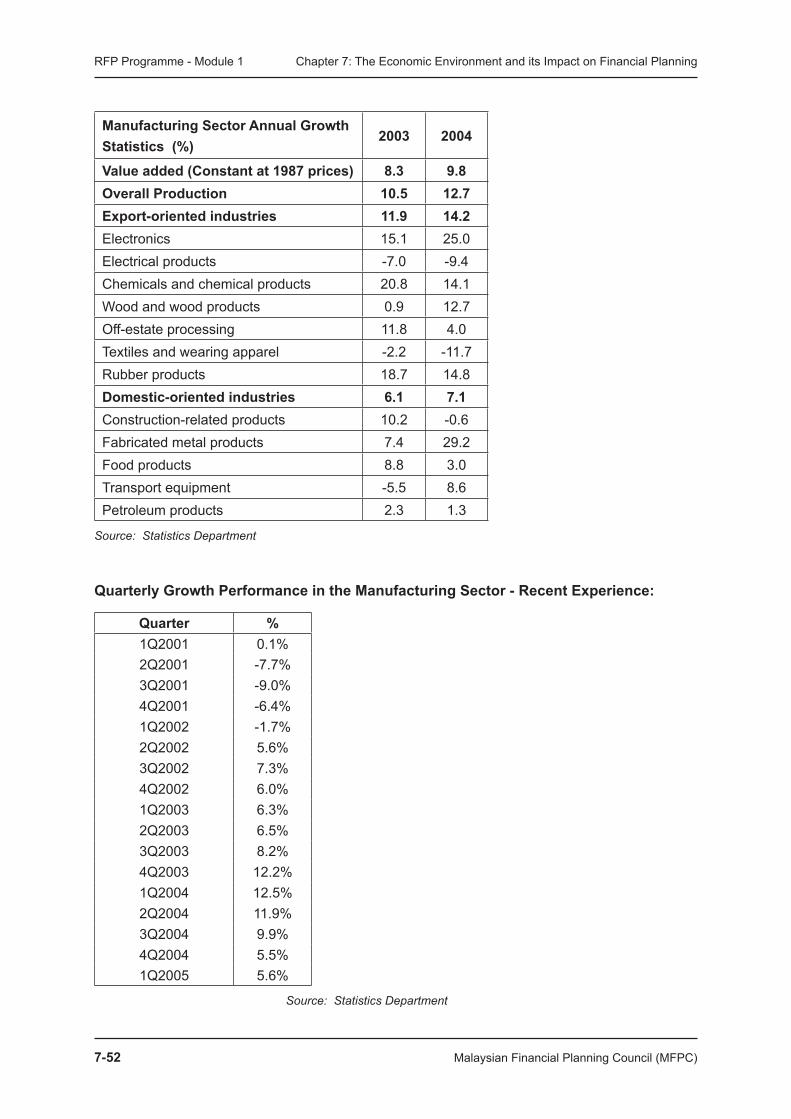
7-�� Malaysian Financial Planning Council (MFPC)
RFP Programme - Module 1 Chapter 7: The Economic Environment and its Impact on Financial Planning
Manufacturing Sector Annual Growth Statistics (%)
�00� �00�
Value added (Constant at ���7 prices) �.� �.�Overall Production �0.� ��.7Export-oriented industries ��.� ��.�Electronics 15.1 25.0Electrical products -7.0 -9.4Chemicals and chemical products 20.8 14.1Wood and wood products 0.9 12.7Off-estate processing 11.8 4.0Textiles and wearing apparel -2.2 -11.7Rubber products 18.7 14.8Domestic-oriented industries �.� 7.�Construction-related products 10.2 -0.6Fabricated metal products 7.4 29.2Food products 8.8 3.0Transport equipment -5.5 8.6Petroleum products 2.3 1.3
Source: Statistics Department
Quarterly Growth Performance in the Manufacturing Sector - Recent Experience:
Quarter %1Q2001 0.1%2Q2001 -7.7%3Q2001 -9.0%4Q2001 -6.4%1Q2002 -1.7%2Q2002 5.6%3Q2002 7.3%4Q2002 6.0%1Q2003 6.3%2Q2003 6.5%3Q2003 8.2%4Q2003 12.2%1Q2004 12.5%2Q2004 11.9%3Q2004 9.9%4Q2004 5.5%1Q2005 5.6%
Source: Statistics Department

Malaysian Financial Planning Council (MFPC) 7-��
RFP Programme - Module 1 Chapter 7: The Economic Environment and its Impact on Financial Planning
The overall capacity utilisation rate in the manufacturing sector was marginally lower at 79% in 2004 (2003: 80%), due to additions to capacity in selected industries. The capacity utilisation rate for export-oriented and domestic-oriented industries stood at 81% and 75% respectively (2003: 82% and 76% respectively). Due to inherent down and lead time in industries, these may be in practice near full capacity in the export industries. The implication is that a new cycle of private investments may be necessary if output growth must be maintained in export-oriented industries.
The Services Sector
The services sector is the largest sector in the economy, contributing 57.4% to the gross domestic product. It is made up of major sub sectors like:
i. Electricity, Water and Gas Generation
ii. Wholesale and Retail Trade, Hotels and Restaurants
iii. Finance, Insurance, Real Estate and Business Services
iv. Transport, Storage and Communications
v. Government Services
vi. Other Services,
Its output is affected by leisure and tourism spending, and spending on private education and healthcare. Increased investments in water, power and other utilities infrastructure also boost the sector’s output. Investments in the transport services and the increased usage of such facilities due to increased travel in and out of the country as well as the carriage of commercial goods spur the sector’s growth. Foreign investments into the distribution business, call centres and the establishment of regional operating headquarters in Malaysia capitalizing on excellent communications infrastructure and wide local usage of English and Asian languages is also boosting the sector’s growth. The increased use of communications services has been spurred by the ease and decreasing costs of such services, including the rapidly declining cost of communications devices. The sector also receives a boost as a financial sector deepening occurs and more transactions are conducted through the financial system, such as through insurance, banking and stockbroking intermediaries. Finally, the size of the civil service has an impact on the growth of the sector.
The wholesale and retail trade, hotels and restaurants business, the second largest of the services sector sub-segments with a 25.4% share of output, is affected by spending by domestic and foreign tourists, business travellers, and shoppers. The growth of service tax receipts published monthly by Bank Negara on its website at www.bnm.gov.my gives an indication of spending trends in the industry. Malaysia’s Mega Sale Carnival is an attempt to lure cash-rich residents and tourists to spend more. Such spending also reflects the feel-good factor in the economy.
7-�� Malaysian Financial Planning Council (MFPC)
RFP Programme - Module 1 Chapter 7: The Economic Environment and its Impact on Financial Planning
After being affected by SARS in 2003, the hotel segment recovered strongly with the average occupancy rate rising to above 60% in 2004 (2003: 53%). This was despite the construction of 235 new hotels during 2004 that added 6,755 rooms to the national stock of hotel rooms. A sharp increase in foreign tourist arrivals especially from West Asia and North Asia by almost 50% to 15.7 million (2003: 10.6 million) as well as robust domestic tourism boosted the demand for new hotel rooms. Sales of passenger cars and imports of consumption goods saw strong growth rates of 15.3% and 24.1% respectively in 2004. This sub sector grew a strong 7.1% in 2004 as a result.
The electricity, water and gas generation sub-segment accounting for a 7.2% share of the services sector product, is dependent on generation of power by Tenaga Nasional, the independent power producers, and water production and consumption in the country. The commissioning of new power plants helps push the sub sector’s growth in a lumpy, step-like manner. An index of electricity output is also included as a sub sector in the Index of Industrial Production. It carries a 7.44% weight, closely reflecting its share of the services sector’s product and value added.
The transport, storage and communication sub-sector’s strong growth of 8.4% in 2004 (2003: 5.7%) was fuelled by expansion in trade and travel activities. It contributes 15.8% of the services sector’s real output. Strong growth in trade flows as well as transhipment activity involving sea cargo contributed towards the 10.7% growth in. total TEUs (twenty-foot = units) handled at major ports such as the Port of Tanjung Pelepas, Northport, and Kuantan Port. Air cargo handled in the country recorded rapid growth of 10.5% in 2004. Passenger traffic in the transportation industry recorded a strong growth of nearly 20% partly on aggressive promotion by the discount airline, Air Asia. Monthly statistics on shipping volume and air passenger traffic is available from the Statistics Department.
Growth in the sub-sector was also buoyed by expansion in the telecommunications industry, mainly the cellular segment. A wider subscriber base, increases in international calls and increased popularity in the usage of SMS aided by a price war boosted the sector’s growth. The number of cellular phone subscribers rose to 14.5 million by December 2004 (end-2003: 11.1 million). Monthly statistics on the mobile subscriber base are available from the website of the Malaysian Communications and Multimedia Commission.
The finance, insurance, real estate and business services sub sector , the largest within the services sector with a 25.9% share of output, saw stronger growth in 2004, driven mainly by banking and insurance. Growth in both interest and non-interest income came partly from the strong growth of Islamic banks. Good premium growth in the insurance sector, especially in investment-linked products, and the bullish market conditions on Bursa Malaysia also buoyed growth in the sub sector. Annual insurance premium/bank income statistics are available from Bank Negara.
The other services sub sector with a 13.6% share of the sector’s output, expanded by 5% in 2004 (2003: 3.3%) with growth in the entertainment segment and private education and private healthcare services. The Government services sub sector accounting for 12.2% of the services sector output, expanded by 5.1% in 2004 due to higher salary payments in the civil service, including bonus payments.

Malaysian Financial Planning Council (MFPC) 7-��
RFP Programme - Module 1 Chapter 7: The Economic Environment and its Impact on Financial Planning
Quarterly Growth Performance in the Services Sector - Recent Experience:
Quarter
Electricity, Gas and
Water
Transport, Storage and Communica-
tion
Wholesale and Retail Trade, Ho-
tels
Finance, Insur-
ance Real Estate,
Business Services
Govern-ment Ser-
vices
Other Services
Overall Services Sector
Growth Rate (%)1Q2001 9.2% 11.3% 3.1% 3.7% 2.0% 6.7% 5.2%
2Q2001 3.1% 12.3% 2.6% 8.6% 5.8% 7.6% 6.6%
3Q2001 1.4% 7.0% 2.8% 11.7% 4.6% 7.0% 6.2%
4Q2001 0.7% 3.0% 1.8% 13.6% 6.1% 6.4% 5.9%
1Q2002 0.5% 3.5% 1.9% 17.4% 5.8% 4.1% 6.5%
2Q2002 7.6% 3.9% 2.6% 17.2% 2.6% 3.7% 6.8%
3Q2002 6.3% 4.3% 2.3% 12.9% 4.2% 4.4% 6.0%
4Q2002 9.3% 4.7% 3.4% 10.2% 8.4% 4.8% 6.5%
1Q2003 6.3% 5.2% 3.6% 4.5% 8.7% 3.7% 4.9%
2Q2003 4.5% 4.0% -2.3% 5.7% 11.1% 2.2% 3.5%
3Q2003 3.5% 5.7% 1.7% 7.0% 8.0% 3.8% 4.9%
4Q2003 5.4% 8.0% 3.0% 4.9% 5.8% 3.4% 4.8%
1Q2004 8.7% 7.9% 5.3% 7.2% 5.9% 4.9% 6.4%
2Q2004 8.6% 9.1% 10.5% 7.2% 5.9% 6.5% 8.1%
3Q2004 8.0% 7.6% 6.0% 5.5% 7.0% 4.5% 6.2%
4Q2004 7.3% 9.3% 6.9% 5.6% 7.2% 3.7% 6.5%
1Q2005 5.7% 10.4% 7.7% 4.4% 3.2% 4.1% 6.0%Source: Statistics Department
7-�� Malaysian Financial Planning Council (MFPC)
RFP Programme - Module 1 Chapter 7: The Economic Environment and its Impact on Financial Planning
Self Assessment
1. Money has the following functions except:
A. Store of value
B. Maintain purchasing power
C. Unit of account
D. Medium of exchange
2. Which of the following is not an economic resource?
A. Land
B. Labor and Capital
C. Money
D. Entrepreneurship
3. Which of the following is a macroeconomic topic?
A. How does a rise in crude oil price affect gas refinery prices?
B. What factors determine the nation’s inflation rate?
C. How does the recent growth in the food manufacturing industry affect the grocery industry?
D. Why are desktop computers so cheap?
4. ‘Opportunity cost’ is
A. the cost of producing a good or service
B. giving up an opportunity because it’s not important
C. all the alternatives given up by making a choice
D. the highest valued alternative given up by making a choice
Malaysian Financial Planning Council (MFPC) 7-�7
RFP Programme - Module 1 Chapter 7: The Economic Environment and its Impact on Financial Planning
5. The fundamental problem of economics is
A. developing a price mechanism to resolve scarcity
B. reducing unemployment
C. allocating scarce productive resources to satisfy wants
D. providing social goods and services
6. Which of the following is an example of monetary policy?
A. decreasing the government deficit
B. increasing the interest rate
C. decreasing the tax rate
D. increasing government spending
7. Which one is the proper order for the business cycle?
A. expansion, trough, recession, peak
B. peak, expansion, recession, trough
C. expansion, peak, trough, recession
D. None of the above
8. Which of the following is not a macroeconomic goal?
A. minimize government spending
B. reduce inflation
C. attain full employment
D. increase economic growth
7-�� Malaysian Financial Planning Council (MFPC)
RFP Programme - Module 1 Chapter 7: The Economic Environment and its Impact on Financial Planning
9. The Consumer Price Index measures which of the following?
A. the economy’s price level
B. the gross domestic product deflator
C. weighted prices of a selection of consumer goods and services
D. changes in the economy’s cost level
10. Which of the following groups will not be hurt by inflation?
A. borrowers at fixed interest rates
B. individuals on fixed income
C. Retail store owners
D. individuals with savings earning fixed interest rates
Answers: 1- B, 2- C, 3- B, 4- D, 5- C, 6- B, 7- D, 8- A, 9- C, 10- A .


![Popple5 c7[2]](https://img.pdfslide.us/doc/110x75/5550bed1b4c905fa618b50ea/popple5-c72.jpg)