Embed Size (px)
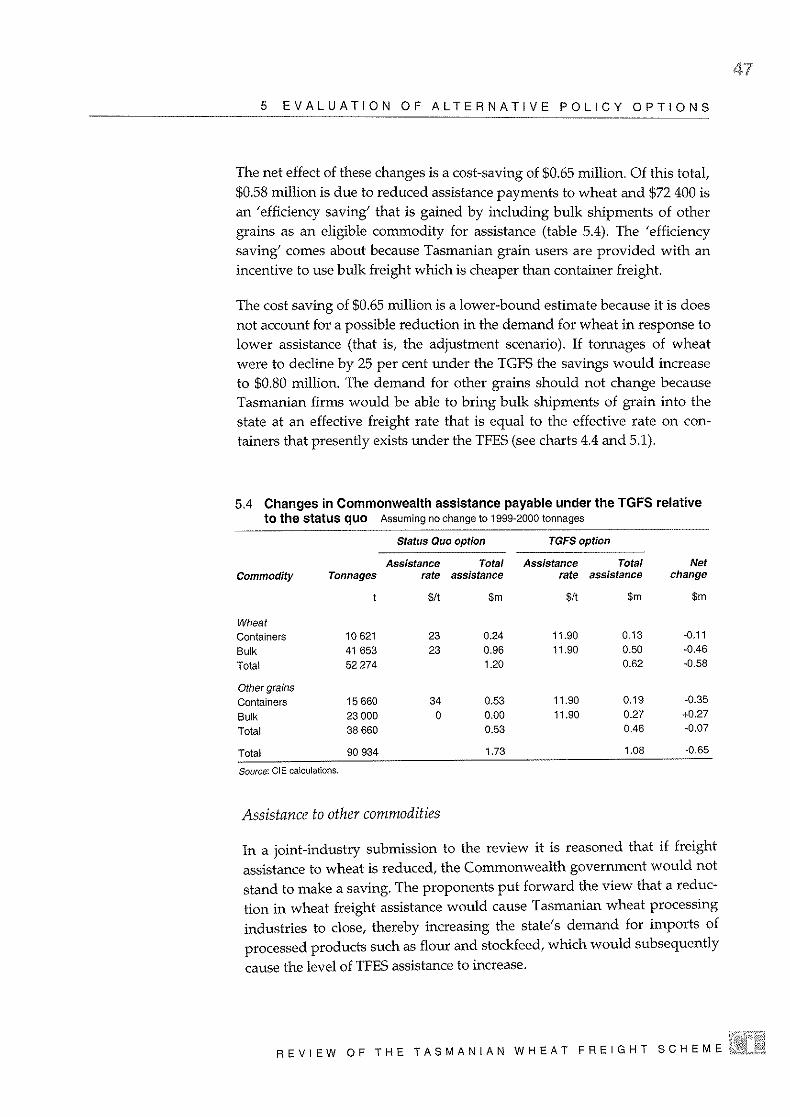
Citation preview
Centre of Policy Studies Melbourne Vic 3800 Phone: 03 9905 2398 Fax: 03 9905 2426
http://www.monash.edu.au/policy/
The Economic Effects of
the Tasmanian Freight Equalisation Scheme
A study undertaken for the Department of Infrastructure, Energy and Resources
11 July 2005 (revised 5 October 2005)
ii
The Centre of Policy Studies
Centre of Policy Studies Monash University Clayton Victoria 3800 Australia Contact persons: A/Prof. John R Madden Telephone: (61-3) 9905 9757 Facsimile: (61-3) 9905 2426 Email: [email protected] Web address: http://www.monash.edu.au/policy/
1
Executive Summary This study reports on simulations with a multiregional economic model of the Australian economy that assess the current economic effects of the Tasmanian Freight Equalisation Scheme on the Tasmanian economy. Both the current economic effects of the TFES and the economic consequences over each of the next ten years of withdrawal of the Scheme are examined. The TFES acts to increase the competitiveness of Tasmanian industries by subsidizing the price of eligible Tasmanian-produced goods in mainland markets and subsidizing the prices of certain mainland-produced inputs used by Tasmanian industries. The dollar values of the subsidizes on the flows of each commodity category across Bass Strait are available from Department of Transport and Regional Services statistics. The ultimate effects of the Scheme on prices and economic activity were then estimated with the aid of the well-known MONASH multiregional forecasting (MMRF) model. The simulation of the current economic effects indicate that the TFES has led to a significantly larger Tasmanian economy than would otherwise be the case. The effects on the Australian economy as a whole are estimated as being negligible. It is estimated that Tasmanian real gross state product, real consumption and employment are between 1 and 2 per cent higher as a result of the TFES. In dollar terms the TFES’ contribution to Tasmanian GSP is between $150 million and $300 million. Average jobs are estimated as being between around 2,150 (average-time) jobs and around 4,300 jobs higher than would have been the case in the absence of the Scheme. These effects on economic activity and employment are very slightly more than offset by reduced economic activity and employment in mainland states. There is a slight estimated increase in real consumption per head for Tasmanian residents and a trivial reduction in real consumption per head of residents in Australian mainland states. While the Tasmanian industry activities that receive the major boost from the TFES are industries producing commodities subject to the major northbound subsidies (metal, wood & paper, and food products), all Tasmanian industries are estimated to have significantly higher output than would have been the case without the Scheme. Thus, under standard assumptions, industries in the Tasmanian services sector are estimated to have 1 or 2 per cent higher output due to the TFES. These industries gain from multiplier effects, particularly through induced higher demand from Tasmanian consumers. The Tasmanian construction industry is estimated to be 2 per cent larger due to higher investment in Tasmanian generated by the TFES. The simulation of a hypothetical withdrawal of the Scheme in 2005-06 showed that the Tasmanian economy would experience substantial negative effects on employment and activity that would intensify over time. In that initial year Tasmania would feel just under a third of the ultimate reduction in gross state product and about 45 per cent of the ultimate reduction in employment. By the tenth year of the simulation Tasmanian employment would have almost fully adjusted to the loss of the Scheme, with total employment down by up to around 4,250 jobs compared to the baseline forecast with the existing Scheme in place.
2
1. Introduction In May 2005 the Department of Infrastructure, Energy and Resources (DIER) commissioned the Centre of Policy Studies (CoPS) to estimate the contribution of the Tasmanian Freight Equalisation Scheme (TFES) to the Tasmanian economy and the consequences of any reduction in the schemes subsidy levels or its complete withdrawal. This report details the method and results of this analysis.
The economy-wide effects of the TFES scheme have been estimated using the MONASH Multiregional Forecasting (MMRF-GREEN) model of the Australian economy. MMRF-GREEN is a dynamic multiregional computable general equilibrium model. A brief overview of the key features of MMRF-GREEN is provided in Section 2.1. In section 2.2 the MMRF simulations for each of the TFES scenarios are described. The simulation results for the economic contribution of the TFES are outlined in Section 3.1,
2. Study Method
2.1 MMRF-GREEN The MMRF-GREEN model divides Australia into eight regions (the six states and two territories). At the state level there is detailed modelling of the behaviour of five types of economic agents: industries, capital creators, households, governments, and foreigners. At the lower level of spatial aggregation (statistical division), a top-down decomposition of state results is employed. Readers interested in a detailed description of MMRF should consult Adams, et al (2003). For a briefer overview, see Adams et al. (2000).
In the version of MMRF-GREEN used for the study, there are 49 industry sectors. All industries, except Petroleum Products, produce a single commodity1. Investment is allocated across industries to maximise rates of returns to investors (households, firms). Capital creators assemble, in a cost-minimizing manner, units of industry-specific capital for each industry. Each state has a single household and a state government. There is also a federal government. Finally, there are foreigners, whose behaviour is summarised by export demand curves for the products of each state and by supply curves for international imports to each state.
As is standard in CGE models, MMRF-GREEN determines the supply and demand for each regionally produced commodity as the outcome of optimising behaviour of economic agents. Regional industries are assumed to choose labour, capital and land so as to maximize their profits while operating in a competitive market. In each region a representative household purchases a particular bundle of goods in accordance with the household’s preferences, relative prices and its amount of disposable income.
States are linked via interstate trade, interstate migration and capital movements and governments operate within a fiscal federal framework.
In the current study we make use of the dynamic features of MMRF-GREEN to simulate the effects of three TFES policy scenarios over a ten-year period from the year the policy change is assumed to be introduced (2005-06). We also undertake a comparative static simulation to analyse the economic effects on the Tasmanian economy of the TFES in 2004-05.
1 Petroleum Products produces various fuels such as automotive petrol, aviation fuels, diesel and LPG. This is of no particular relevance to the current project.
3
For the dynamic simulations we first generate a baseline forecasts for the Australian economy. We then conduct simulations to examine the deviations away from the baseline that result from the TFES scenarios under examination. MMRF-GREEN provides results for economic variables on a year-on-year basis. The results for a particular year are used to update the database for the commencement of the next year. In particular the model contains a series of equations that connect capital stocks to past-year capital stocks and net investment. Similarly debt is linked to past and present borrowing/saving and regional population is related to natural growth and international and interstate migration.
2.2 The Simulations 2.2.1 Simulation Tasks
Two sets of simulation tasks were requested by DIER. These tasks are as follow:
1. Determine the current economic effects on the Tasmanian economy of the presence of the Tasmanian Freight Equalisation Scheme.
2. Determine the impacts on the Tasmanian economy of a withdrawal of the Scheme.
Task 1 is performed with the model being used in what is termed comparative-static long-run mode. This is because we wish to examine the effects on the Tasmanian economy in 2004-05 of a long-running Scheme, one that has been in place since 1976. Although the Scheme has been revised on a number of occasions, it can be safely assumed that the economy has for all intents and purposes fully adjusted to all past changes in the scheme. By adopting a long-run simulation mode we take into account the full extent of the effects of the scheme on Tasmanian variables, such as population and industry capital stocks, that take a considerable time to adjust.
On the other hand under the second task, we wish to look at the effects of a hypothetical removal of the Scheme. In this case we are interested in the adjustment path of the economy, and thus employ the model in dynamic mode. 2.2.2 Exogenous Shocks
The effect of the TFES is to lower the sea freight costs of importing selected goods into Tasmania and exporting certain goods from Tasmania to other states2. In order to simulate the effects of the TFES, we first had to decide which variables of the model to shock and the size of the shocks.
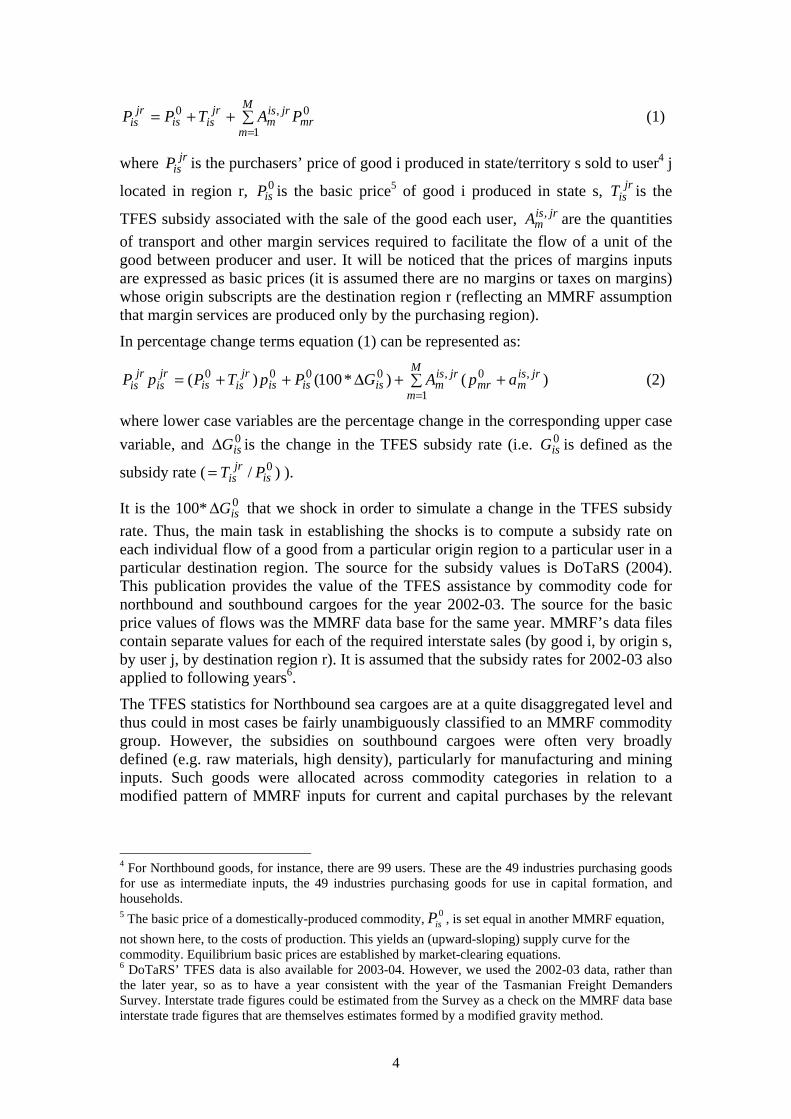
With regard to the first of these questions, we chose tax/subsidy variables which fall on the basic value of flows of commodities between regions specified by user. This is best explained by looking at an example of an MMRF price equation that relates the price paid by the domestic purchaser of a domestically produced good to its basic (or factory/farm-gate) value. Such an equation is3:
2 It is assumed in this study that the sea freight cost of transporting an eligible good is reduced by the full amount of the subsidy. 3 This equation is a stylized one that conveys the concept of the relevant price equation. The actual MMRF equations differ slightly. Indeed the working version of MMRF contained no useable variables (ones that could be made exogenous) that could be used to impose the TFES subsidy shocks (that varied by commodity, user, and source and destination states). Thus relevant TFES subsidy variables were introduced into MMRF for the purposes of this study.
4
∑++==
M
mmr
jrism
jrisis
jris PATPP
1
0,0 (1)
where jrisP is the purchasers’ price of good i produced in state/territory s sold to user4 j
located in region r, 0isP is the basic price5 of good i produced in state s, jr
isT is the
TFES subsidy associated with the sale of the good each user, jrismA , are the quantities
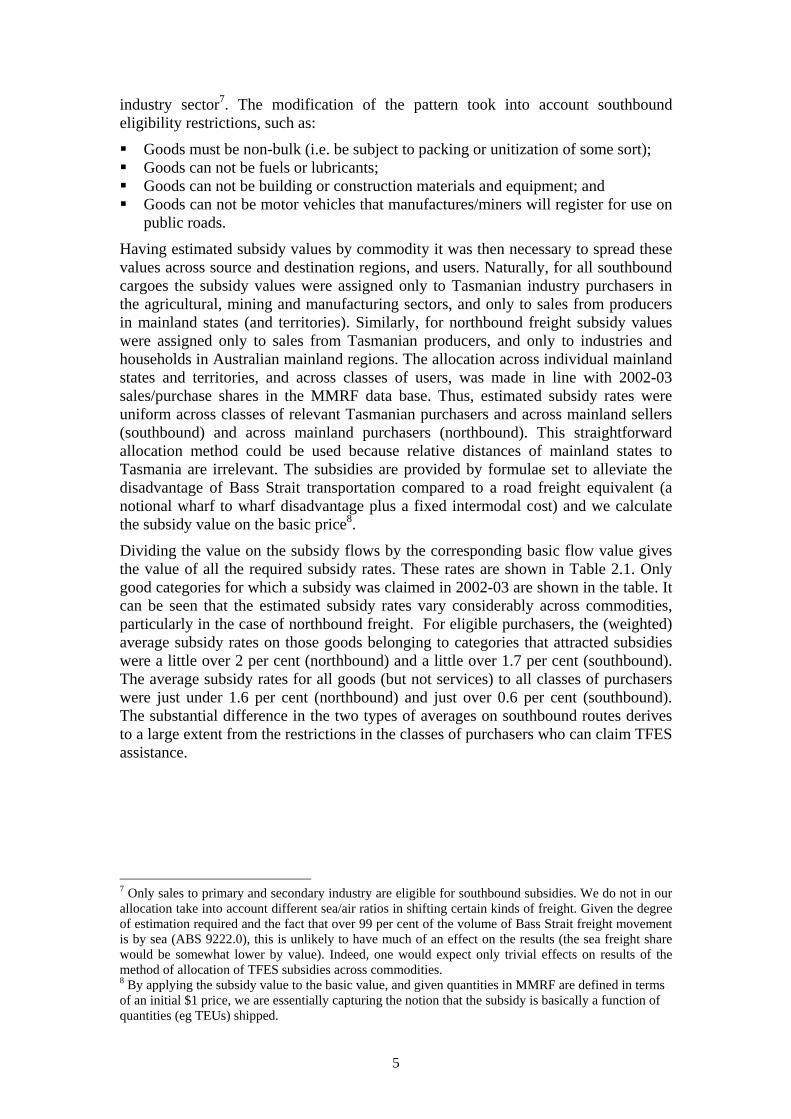
of transport and other margin services required to facilitate the flow of a unit of the good between producer and user. It will be noticed that the prices of margins inputs are expressed as basic prices (it is assumed there are no margins or taxes on margins) whose origin subscripts are the destination region r (reflecting an MMRF assumption that margin services are produced only by the purchasing region).
In percentage change terms equation (1) can be represented as:
)()*100()( ,
1
0,0000 jrism
M
mmr
jrismisisis
jrisis
jris
jris apAGPpTPpP +∑+Δ++=
= (2)
where lower case variables are the percentage change in the corresponding upper case variable, and 0
isGΔ is the change in the TFES subsidy rate (i.e. 0isG is defined as the
subsidy rate ( 0/ isjr
is PT= ) ).
It is the 100* 0isGΔ that we shock in order to simulate a change in the TFES subsidy
rate. Thus, the main task in establishing the shocks is to compute a subsidy rate on each individual flow of a good from a particular origin region to a particular user in a particular destination region. The source for the subsidy values is DoTaRS (2004). This publication provides the value of the TFES assistance by commodity code for northbound and southbound cargoes for the year 2002-03. The source for the basic price values of flows was the MMRF data base for the same year. MMRF’s data files contain separate values for each of the required interstate sales (by good i, by origin s, by user j, by destination region r). It is assumed that the subsidy rates for 2002-03 also applied to following years6.
The TFES statistics for Northbound sea cargoes are at a quite disaggregated level and thus could in most cases be fairly unambiguously classified to an MMRF commodity group. However, the subsidies on southbound cargoes were often very broadly defined (e.g. raw materials, high density), particularly for manufacturing and mining inputs. Such goods were allocated across commodity categories in relation to a modified pattern of MMRF inputs for current and capital purchases by the relevant
4 For Northbound goods, for instance, there are 99 users. These are the 49 industries purchasing goods for use as intermediate inputs, the 49 industries purchasing goods for use in capital formation, and households. 5 The basic price of a domestically-produced commodity, 0
isP , is set equal in another MMRF equation, not shown here, to the costs of production. This yields an (upward-sloping) supply curve for the commodity. Equilibrium basic prices are established by market-clearing equations. 6 DoTaRS’ TFES data is also available for 2003-04. However, we used the 2002-03 data, rather than the later year, so as to have a year consistent with the year of the Tasmanian Freight Demanders Survey. Interstate trade figures could be estimated from the Survey as a check on the MMRF data base interstate trade figures that are themselves estimates formed by a modified gravity method.
5
industry sector7. The modification of the pattern took into account southbound eligibility restrictions, such as:
Goods must be non-bulk (i.e. be subject to packing or unitization of some sort); Goods can not be fuels or lubricants; Goods can not be building or construction materials and equipment; and Goods can not be motor vehicles that manufactures/miners will register for use on
public roads.
Having estimated subsidy values by commodity it was then necessary to spread these values across source and destination regions, and users. Naturally, for all southbound cargoes the subsidy values were assigned only to Tasmanian industry purchasers in the agricultural, mining and manufacturing sectors, and only to sales from producers in mainland states (and territories). Similarly, for northbound freight subsidy values were assigned only to sales from Tasmanian producers, and only to industries and households in Australian mainland regions. The allocation across individual mainland states and territories, and across classes of users, was made in line with 2002-03 sales/purchase shares in the MMRF data base. Thus, estimated subsidy rates were uniform across classes of relevant Tasmanian purchasers and across mainland sellers (southbound) and across mainland purchasers (northbound). This straightforward allocation method could be used because relative distances of mainland states to Tasmania are irrelevant. The subsidies are provided by formulae set to alleviate the disadvantage of Bass Strait transportation compared to a road freight equivalent (a notional wharf to wharf disadvantage plus a fixed intermodal cost) and we calculate the subsidy value on the basic price8.
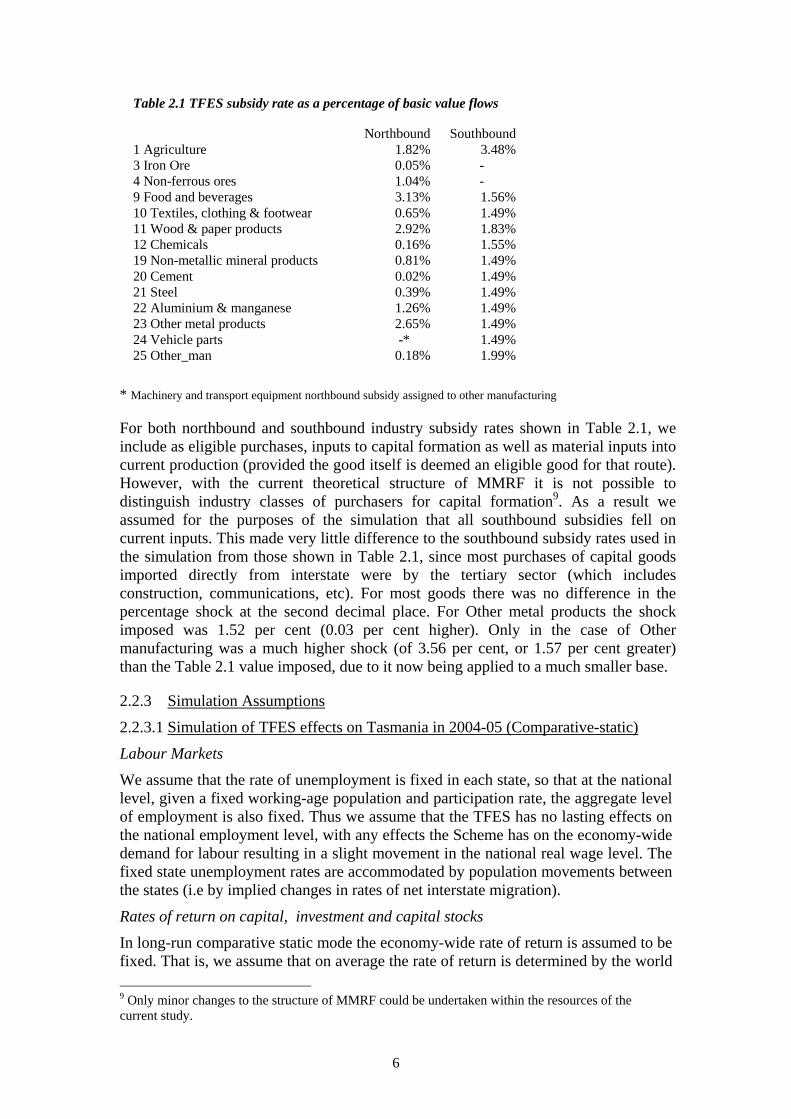
Dividing the value on the subsidy flows by the corresponding basic flow value gives the value of all the required subsidy rates. These rates are shown in Table 2.1. Only good categories for which a subsidy was claimed in 2002-03 are shown in the table. It can be seen that the estimated subsidy rates vary considerably across commodities, particularly in the case of northbound freight. For eligible purchasers, the (weighted) average subsidy rates on those goods belonging to categories that attracted subsidies were a little over 2 per cent (northbound) and a little over 1.7 per cent (southbound). The average subsidy rates for all goods (but not services) to all classes of purchasers were just under 1.6 per cent (northbound) and just over 0.6 per cent (southbound). The substantial difference in the two types of averages on southbound routes derives to a large extent from the restrictions in the classes of purchasers who can claim TFES assistance.
7 Only sales to primary and secondary industry are eligible for southbound subsidies. We do not in our allocation take into account different sea/air ratios in shifting certain kinds of freight. Given the degree of estimation required and the fact that over 99 per cent of the volume of Bass Strait freight movement is by sea (ABS 9222.0), this is unlikely to have much of an effect on the results (the sea freight share would be somewhat lower by value). Indeed, one would expect only trivial effects on results of the method of allocation of TFES subsidies across commodities. 8 By applying the subsidy value to the basic value, and given quantities in MMRF are defined in terms of an initial $1 price, we are essentially capturing the notion that the subsidy is basically a function of quantities (eg TEUs) shipped.
6
Table 2.1 TFES subsidy rate as a percentage of basic value flows
Northbound Southbound1 Agriculture 1.82% 3.48%3 Iron Ore 0.05% - 4 Non-ferrous ores 1.04% - 9 Food and beverages 3.13% 1.56%10 Textiles, clothing & footwear 0.65% 1.49%11 Wood & paper products 2.92% 1.83%12 Chemicals 0.16% 1.55%19 Non-metallic mineral products 0.81% 1.49%20 Cement 0.02% 1.49%21 Steel 0.39% 1.49%22 Aluminium & manganese 1.26% 1.49%23 Other metal products 2.65% 1.49%24 Vehicle parts -* 1.49%25 Other_man 0.18% 1.99%
* Machinery and transport equipment northbound subsidy assigned to other manufacturing
For both northbound and southbound industry subsidy rates shown in Table 2.1, we include as eligible purchases, inputs to capital formation as well as material inputs into current production (provided the good itself is deemed an eligible good for that route). However, with the current theoretical structure of MMRF it is not possible to distinguish industry classes of purchasers for capital formation9. As a result we assumed for the purposes of the simulation that all southbound subsidies fell on current inputs. This made very little difference to the southbound subsidy rates used in the simulation from those shown in Table 2.1, since most purchases of capital goods imported directly from interstate were by the tertiary sector (which includes construction, communications, etc). For most goods there was no difference in the percentage shock at the second decimal place. For Other metal products the shock imposed was 1.52 per cent (0.03 per cent higher). Only in the case of Other manufacturing was a much higher shock (of 3.56 per cent, or 1.57 per cent greater) than the Table 2.1 value imposed, due to it now being applied to a much smaller base.
2.2.3 Simulation Assumptions
2.2.3.1 Simulation of TFES effects on Tasmania in 2004-05 (Comparative-static)
Labour Markets We assume that the rate of unemployment is fixed in each state, so that at the national level, given a fixed working-age population and participation rate, the aggregate level of employment is also fixed. Thus we assume that the TFES has no lasting effects on the national employment level, with any effects the Scheme has on the economy-wide demand for labour resulting in a slight movement in the national real wage level. The fixed state unemployment rates are accommodated by population movements between the states (i.e by implied changes in rates of net interstate migration).
Rates of return on capital, investment and capital stocks In long-run comparative static mode the economy-wide rate of return is assumed to be fixed. That is, we assume that on average the rate of return is determined by the world 9 Only minor changes to the structure of MMRF could be undertaken within the resources of the current study.
7
interest rate. An industry’s capital stock is positively related to the industry’s rate of return compared with the economy-wide rate. Investment is determined by an assumption of each industry having a fixed investment to capital ratio.
Real Consumption Private consumption in each region is a function of regional household disposable income. Real public consumption by the federal government is assumed to be unaffected by the TFES. State governments are assumed to alter their public consumption in line with changes in their revenue bases.
Government budgets, balance of trade It is assumed that the effect of the TFES is budget neutral for both federal and state governments. The federal government is assumed to adjust slightly the Australia-wide PAYE tax rate to cover the cost of operating the Scheme, while as noted above state governments adjust their current expenditure levels to prevent the Scheme affecting their public sector borrowing requirement. Under these circumstances, it can be expected that there is virtually no impact on the balance of trade.
2.2.3.2 Simulation of a hypothetical removal of the TFES (Dynamic)
Labour markets At the national level, we assume that the deviation in the national real wage rate from its base case level increases in proportion to the deviation in economy-wide employment from its base case level. Eventually, the real wage adjustment eliminates any deviation in national employment caused by a particular year’s set of shocks. At the regional level, we assume that labour is mobile between state economies. Labour is assumed to move between states/territories so as to maintain inter-state wage and unemployment rate differentials at their base case levels. Accordingly, for the TFES removal scenario, mainland states and territories can be expected to experience projected increased employment and population at the expense of Tasmania.
Real Consumption In each year of the deviation scenarios, aggregate real private consumption in state r diverges from its base case level by an amount reflecting the divergence in real after-tax income available to the residents of r.
Analogously to the TFES-benefits simulation, we assume that the time path of real public consumption is unaffected by a reduction in the Scheme’s payment rates.
Government budgets, balance of trade The assumptions here are the same as for the TFES-current-effects simulation.
Rates of return on capital, investment and capital stocks In deviation simulations MMRF-Green allows for short-run divergences in rates of return on industry capital stocks from their levels in the base case forecasts. Such divergences cause divergences in investment and capital stocks. The divergences in capital stocks gradually erode the divergences in rates of return.
8
3. Results
3.1 The Economic Effects of the TFES in 2004-05
The TFES-current-effects simulation is implemented by simulating the long-run effects of a removal of the Scheme. In effect we are simulating the effects in 2004-05 of removing the Scheme quite some years ago (so that all adjustments of removing the TFES have all taken place). We then report the economic effects of the TFES as the negative of our simulation results. Thus the economic effects of the TFES are measured as a comparison between the Tasmanian economy as it is in 2004-05 and what it would have looked like had there been no Scheme in 2004-05, nor indeed for many years so that the economy had fully adjusted to this situation.
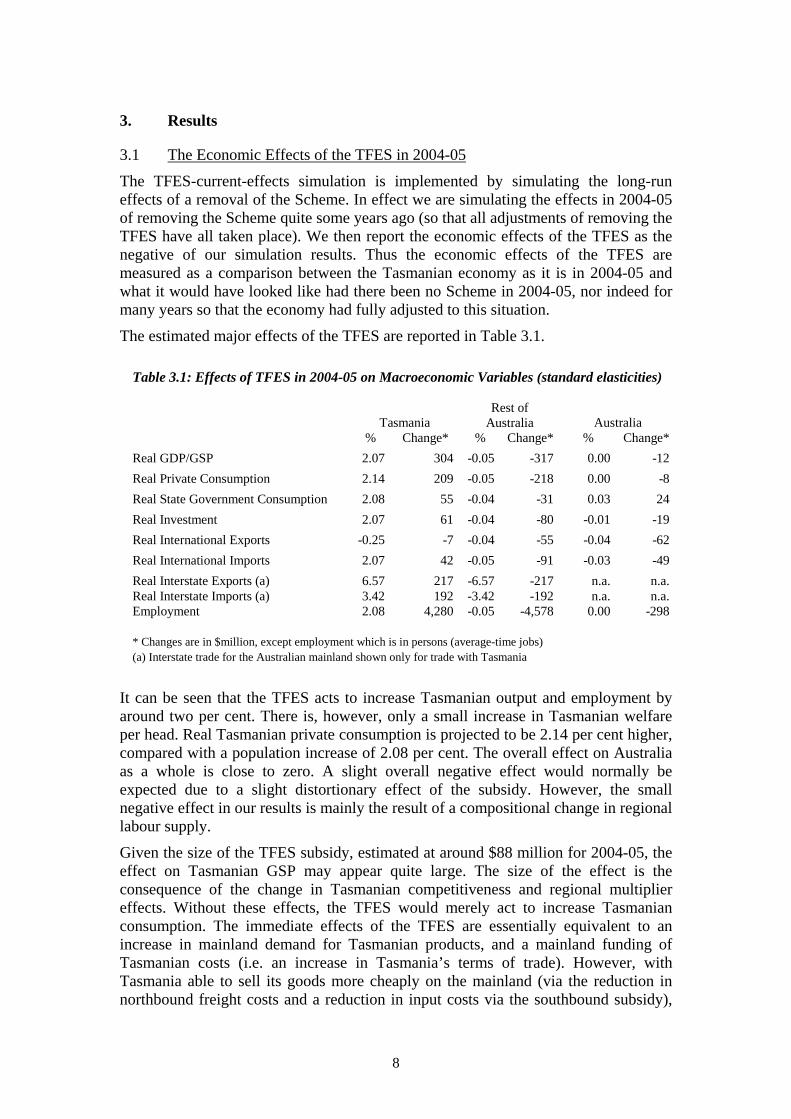
The estimated major effects of the TFES are reported in Table 3.1.
Table 3.1: Effects of TFES in 2004-05 on Macroeconomic Variables (standard elasticities)
Tasmania Rest of
Australia Australia % Change* % Change* % Change*Real GDP/GSP 2.07 304 -0.05 -317 0.00 -12Real Private Consumption 2.14 209 -0.05 -218 0.00 -8Real State Government Consumption 2.08 55 -0.04 -31 0.03 24Real Investment 2.07 61 -0.04 -80 -0.01 -19Real International Exports -0.25 -7 -0.04 -55 -0.04 -62Real International Imports 2.07 42 -0.05 -91 -0.03 -49Real Interstate Exports (a) 6.57 217 -6.57 -217 n.a. n.a.Real Interstate Imports (a) 3.42 192 -3.42 -192 n.a. n.a.Employment 2.08 4,280 -0.05 -4,578 0.00 -298 * Changes are in $million, except employment which is in persons (average-time jobs) (a) Interstate trade for the Australian mainland shown only for trade with Tasmania
It can be seen that the TFES acts to increase Tasmanian output and employment by around two per cent. There is, however, only a small increase in Tasmanian welfare per head. Real Tasmanian private consumption is projected to be 2.14 per cent higher, compared with a population increase of 2.08 per cent. The overall effect on Australia as a whole is close to zero. A slight overall negative effect would normally be expected due to a slight distortionary effect of the subsidy. However, the small negative effect in our results is mainly the result of a compositional change in regional labour supply.
Given the size of the TFES subsidy, estimated at around $88 million for 2004-05, the effect on Tasmanian GSP may appear quite large. The size of the effect is the consequence of the change in Tasmanian competitiveness and regional multiplier effects. Without these effects, the TFES would merely act to increase Tasmanian consumption. The immediate effects of the TFES are essentially equivalent to an increase in mainland demand for Tasmanian products, and a mainland funding of Tasmanian costs (i.e. an increase in Tasmania’s terms of trade). However, with Tasmania able to sell its goods more cheaply on the mainland (via the reduction in northbound freight costs and a reduction in input costs via the southbound subsidy),
9
the rest of Australia wishes to substitute towards the Tasmanian product. There is an increase in the demand for Tasmanian labour, which is met in the long run from interstate migration. The initial boost to Tasmanian activity is enlarged by increased consumption expenditure arising from increased Tasmanian income, and by increased government spending arising from the Tasmanian government being able to maintain real per capita spending out of an increased revenue base. Tasmanian interstate exports receive a boost of almost 6.6 per cent. This acts to lower Tasmanian interstate export prices (since mainland demand curves for Tasmanian products are downward sloping). This largely removes the initial gain in Tasmania’s effective terms of trade.
A key factor in the degree of expansion is the rate at which Australian purchasers switch towards Tasmanian goods for given decreases in their relative prices. This is governed by the relevant elasticities of substitution that are in the MMRF data base. We employ the standard MMRF interstate-trade elasticities that are our best judgment of the degree of substitution for each product for each class of purchaser. For TFES assisted goods for which there is Tasmanian production, these elasticities vary from 2.5 for Iron ore to almost 17 for Textile, clothing and footwear sales to households. This latter elasticity is particularly high, with all other elasticities in the range being below 10. Due to the dearth of data on interstate trade, the estimates for these elasticities are based largely on judgment. It is therefore important to test the sensitivity of the simulation results to these elasticities. We consequently conducted a second simulation in which all non-zero interstate elasticities were reduced to 2.0. This number would generally be thought of as a quite low (highly conservative) value for interstate substitution elasticities.
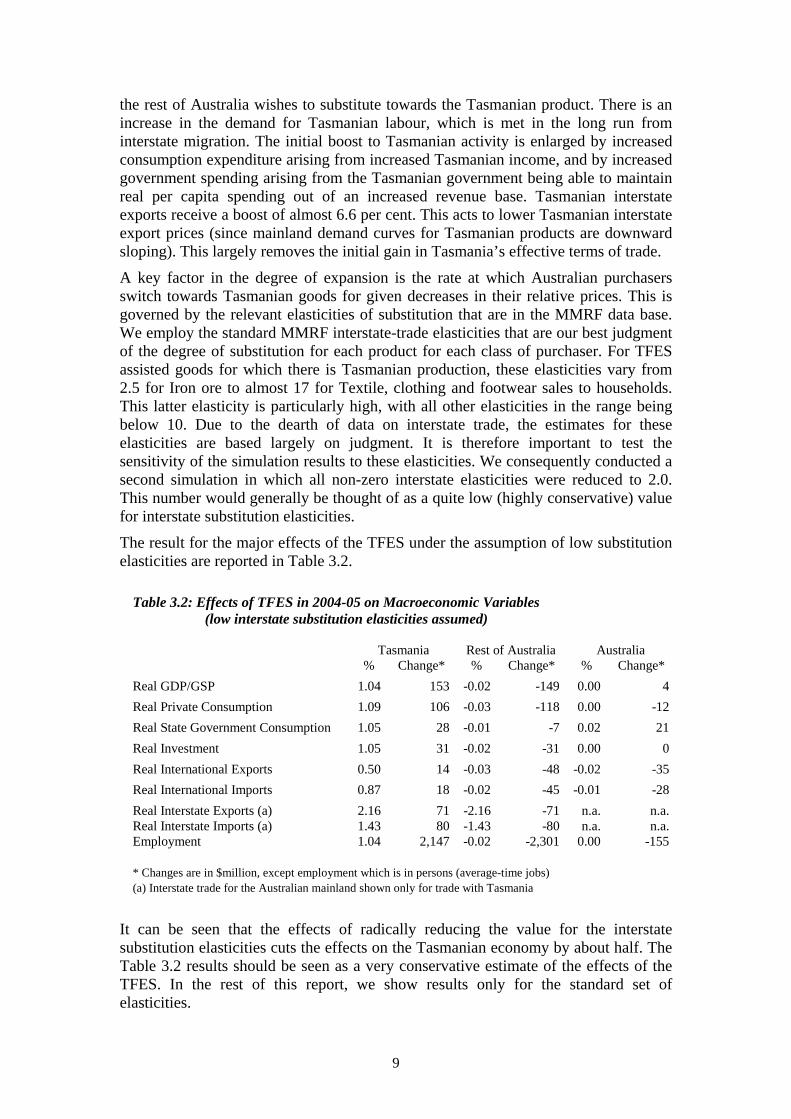
The result for the major effects of the TFES under the assumption of low substitution elasticities are reported in Table 3.2.
Table 3.2: Effects of TFES in 2004-05 on Macroeconomic Variables (low interstate substitution elasticities assumed) Tasmania Rest of Australia Australia % Change* % Change* % Change*Real GDP/GSP 1.04 153 -0.02 -149 0.00 4Real Private Consumption 1.09 106 -0.03 -118 0.00 -12Real State Government Consumption 1.05 28 -0.01 -7 0.02 21Real Investment 1.05 31 -0.02 -31 0.00 0Real International Exports 0.50 14 -0.03 -48 -0.02 -35Real International Imports 0.87 18 -0.02 -45 -0.01 -28Real Interstate Exports (a) 2.16 71 -2.16 -71 n.a. n.a.Real Interstate Imports (a) 1.43 80 -1.43 -80 n.a. n.a.Employment 1.04 2,147 -0.02 -2,301 0.00 -155 * Changes are in $million, except employment which is in persons (average-time jobs) (a) Interstate trade for the Australian mainland shown only for trade with Tasmania
It can be seen that the effects of radically reducing the value for the interstate substitution elasticities cuts the effects on the Tasmanian economy by about half. The Table 3.2 results should be seen as a very conservative estimate of the effects of the TFES. In the rest of this report, we show results only for the standard set of elasticities.
10
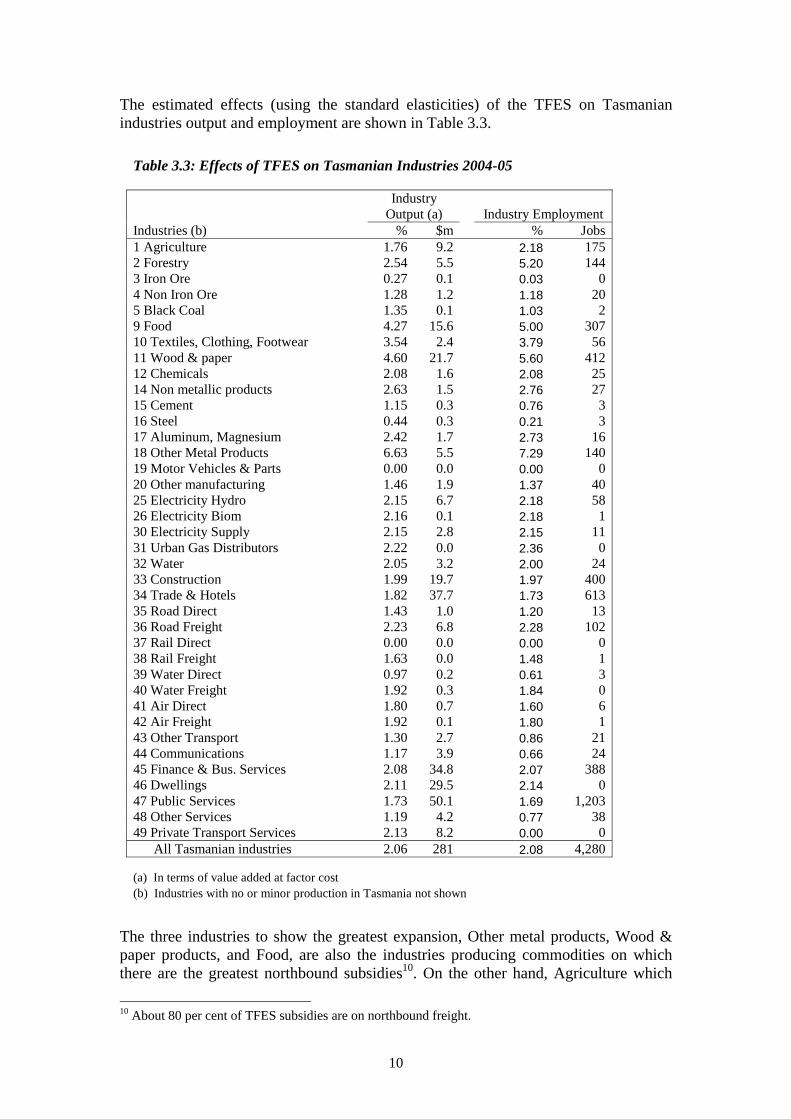
The estimated effects (using the standard elasticities) of the TFES on Tasmanian industries output and employment are shown in Table 3.3.
Table 3.3: Effects of TFES on Tasmanian Industries 2004-05
Industry
Output (a) Industry Employment Industries (b) % $m % Jobs 1 Agriculture 1.76 9.2 2.18 175 2 Forestry 2.54 5.5 5.20 144 3 Iron Ore 0.27 0.1 0.03 0 4 Non Iron Ore 1.28 1.2 1.18 20 5 Black Coal 1.35 0.1 1.03 2 9 Food 4.27 15.6 5.00 307 10 Textiles, Clothing, Footwear 3.54 2.4 3.79 56 11 Wood & paper 4.60 21.7 5.60 412 12 Chemicals 2.08 1.6 2.08 25 14 Non metallic products 2.63 1.5 2.76 27 15 Cement 1.15 0.3 0.76 3 16 Steel 0.44 0.3 0.21 3 17 Aluminum, Magnesium 2.42 1.7 2.73 16 18 Other Metal Products 6.63 5.5 7.29 140 19 Motor Vehicles & Parts 0.00 0.0 0.00 0 20 Other manufacturing 1.46 1.9 1.37 40 25 Electricity Hydro 2.15 6.7 2.18 58 26 Electricity Biom 2.16 0.1 2.18 1 30 Electricity Supply 2.15 2.8 2.15 11 31 Urban Gas Distributors 2.22 0.0 2.36 0 32 Water 2.05 3.2 2.00 24 33 Construction 1.99 19.7 1.97 400 34 Trade & Hotels 1.82 37.7 1.73 613 35 Road Direct 1.43 1.0 1.20 13 36 Road Freight 2.23 6.8 2.28 102 37 Rail Direct 0.00 0.0 0.00 0 38 Rail Freight 1.63 0.0 1.48 1 39 Water Direct 0.97 0.2 0.61 3 40 Water Freight 1.92 0.3 1.84 0 41 Air Direct 1.80 0.7 1.60 6 42 Air Freight 1.92 0.1 1.80 1 43 Other Transport 1.30 2.7 0.86 21 44 Communications 1.17 3.9 0.66 24 45 Finance & Bus. Services 2.08 34.8 2.07 388 46 Dwellings 2.11 29.5 2.14 0 47 Public Services 1.73 50.1 1.69 1,203 48 Other Services 1.19 4.2 0.77 38 49 Private Transport Services 2.13 8.2 0.00 0 All Tasmanian industries 2.06 281 2.08 4,280 (a) In terms of value added at factor cost (b) Industries with no or minor production in Tasmania not shown
The three industries to show the greatest expansion, Other metal products, Wood & paper products, and Food, are also the industries producing commodities on which there are the greatest northbound subsidies10. On the other hand, Agriculture which
10 About 80 per cent of TFES subsidies are on northbound freight.
11
receives the fourth highest level of northbound TFES support is projected to receive only a modest boost to its employment and a below all-Tasmanian-industry average increase in its output. Agriculture also enjoys the benefit of a high TFES subsidy on agriculture inputs it purchases from the mainland. However, mainland Agricultural products make up less than 6 per cent of Tasmanian Agriculture’s material inputs (compared to Tasmanian Food products for whom 14 per cent of material inputs are mainland Agriculture)11. Two other factors also form a limitation on Agriculture’s expansion. The first is that the industry uses agricultural land that is assumed to be in fixed supply. Secondly, Tasmanian Agriculture also sells a portion of its output to overseas markets. There is some crowding out of Tasmanian overseas exports by interstate exports.
Table 3.3 demonstrates that the benefits to Tasmanian industries spread much wider than those industries which receive direct assistance from the TFES. For instance, Forestry’s output is increased by around 2.5 per cent. The major reason for this is the heavy concentration of this industry’s sales to the Wood & paper industry. Excluding intra-industry sales, about 45 per cent of Forestry’s sales are to Wood & paper. Like Agriculture, Forestry’s employment is increased by considerably more than it’s output due to constraints in the supply of forestry land12.
Looking at the $ million change in the value of output and the change in job numbers it can be seen that Public services and Trade and hotels are the most affected industries in output and employment. These industries are affected through the induced effects to government consumption and private household consumption. Similarly consumption induced and production effects boost Dwellings, Financial & business services, etc. Higher economic activity also results in higher investment in the state, which in turn boosts the Construction industry.
3.2 The Economic Effects of a Hypothetical Withdrawal of the TFES from 2005-06
We now turn to the simulations of hypothetical reductions, including a full withdrawal, of the TFES in 2005-06 and trace out the time path of the impact on the Tasmanian economy over the coming decade.
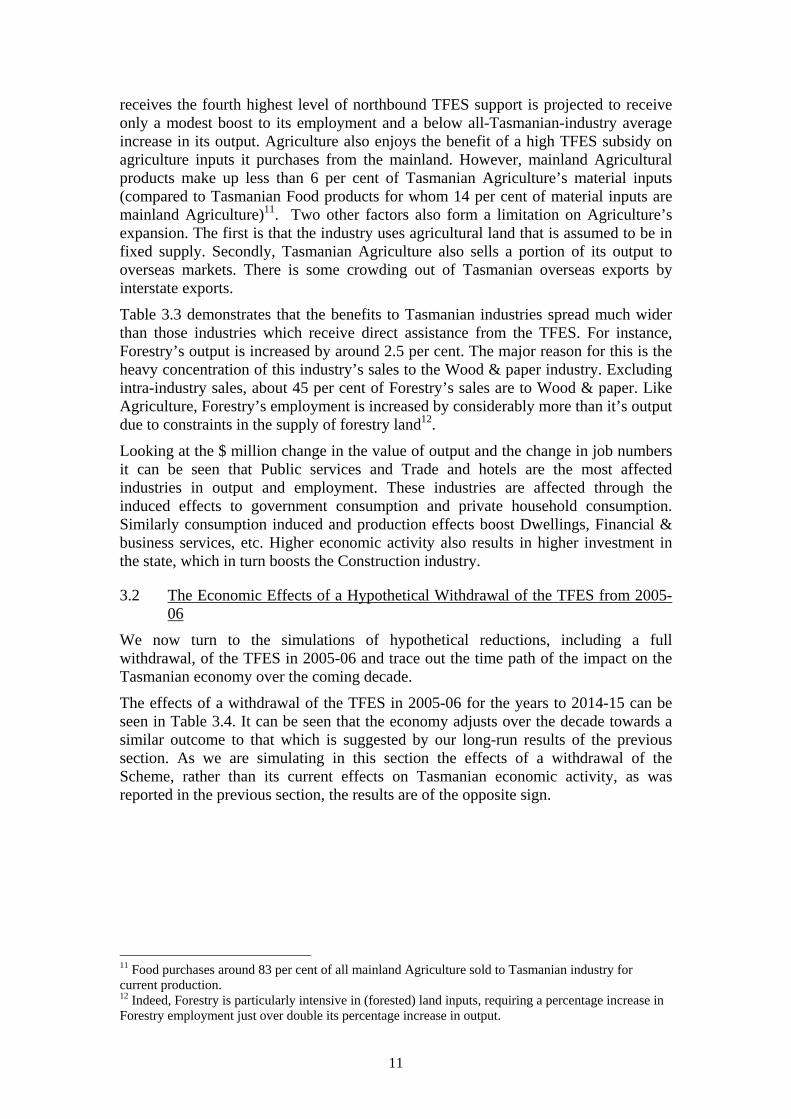
The effects of a withdrawal of the TFES in 2005-06 for the years to 2014-15 can be seen in Table 3.4. It can be seen that the economy adjusts over the decade towards a similar outcome to that which is suggested by our long-run results of the previous section. As we are simulating in this section the effects of a withdrawal of the Scheme, rather than its current effects on Tasmanian economic activity, as was reported in the previous section, the results are of the opposite sign.
11 Food purchases around 83 per cent of all mainland Agriculture sold to Tasmanian industry for current production. 12 Indeed, Forestry is particularly intensive in (forested) land inputs, requiring a percentage increase in Forestry employment just over double its percentage increase in output.
12
Table 3.4: Impact of Scheme Withdrawal on Tasmanian Macroeconomic Variables (percentage deviations from Baseline) 2006 2007 2008 2009 2010
% -0.66 -0.90 -1.07 -1.20 -1.35Real gross value added (GDP/GSP) $m -100 -138 -167 -192 -220% -0.60 -0.83 -0.99 -1.12 -1.25Real consumption $m -60 -85 -103 -119 -134% -0.73 -0.91 -1.04 -1.18 -1.31Real state government
consumption $m -20 -25 -30 -34 -39% -3.02 -3.02 -3.16 -3.18 -3.11Real investment $m -95 -102 -109 -109 -115% 2.69 2.54 2.17 1.81 1.57Real international exports $m 77 70 65 59 52% -1.27 -1.44 -1.58 -1.66 -1.77Real international imports $m -23 -27 -32 -32 -38% -5.01 -5.21 -5.47 -5.68 -5.81Real interstate exports $m -166 -185 -201 -212 -218% -2.44 -2.53 -2.59 -2.68 -2.76Real interstate imports $m -134 -151 -168 -180 -192% -1.25 -1.46 -1.57 -1.64 -1.74Employment (hours) '000 jobs -2.56 -3.01 -3.28 -3.47 -3.69
2011 2012 2013 2014 2015
% -1.47 -1.57 -1.66 -1.73 -1.79Real gross value added (GDP/GSP) $m -244 -266 -285 -303 -319% -1.37 -1.47 -1.56 -1.64 -1.71Real consumption $m -149 -163 -176 -188 -199% -1.42 -1.53 -1.61 -1.69 -1.75Real state government
consumption $m -43 -47 -50 -53 -56% -3.06 -2.98 -2.90 -2.80 -2.72Real investment $m -115 -114 -113 -111 -109% 1.28 1.03 0.82 0.63 0.47Real international exports $m 44 37 31 25 19% -1.84 -1.90 -1.95 -1.99 -2.02Real international imports $m -41 -44 -47 -50 -53% -5.97 -6.10 -6.21 -6.30 -6.38Real interstate exports $m -250 -265 -280 -297 -313% -2.83 -2.87 -2.90 -2.93 -2.95Real interstate imports $m -223 -236 -250 -264 -278% -1.81 -1.86 -1.91 -1.95 -1.98Employment (hours) '000 jobs -3.85 -3.98 -4.09 -4.18 -4.25
*years are financial years ending in date indicated; e.g. 2006 indicates 2005-06 financial year
In 2005-06, the year of the hypothetical withdrawal of the TFES, there is a much more muted response in the effect on Tasmanian activity13. Tasmanian Gross State Product deviates by 0.66 percentage points below its baseline growth rate. The reason for the short-run effect on GSP being much smaller than in the long-run has to do with the fixity of capital. In general installed capital can not be easily moved to other
13 In Table 3.4 we denote the year in which the financial year is completed. For instance, 2006 in the column heading indicates the year 2005-06, while 2015 indicates the year 2014-15.
13
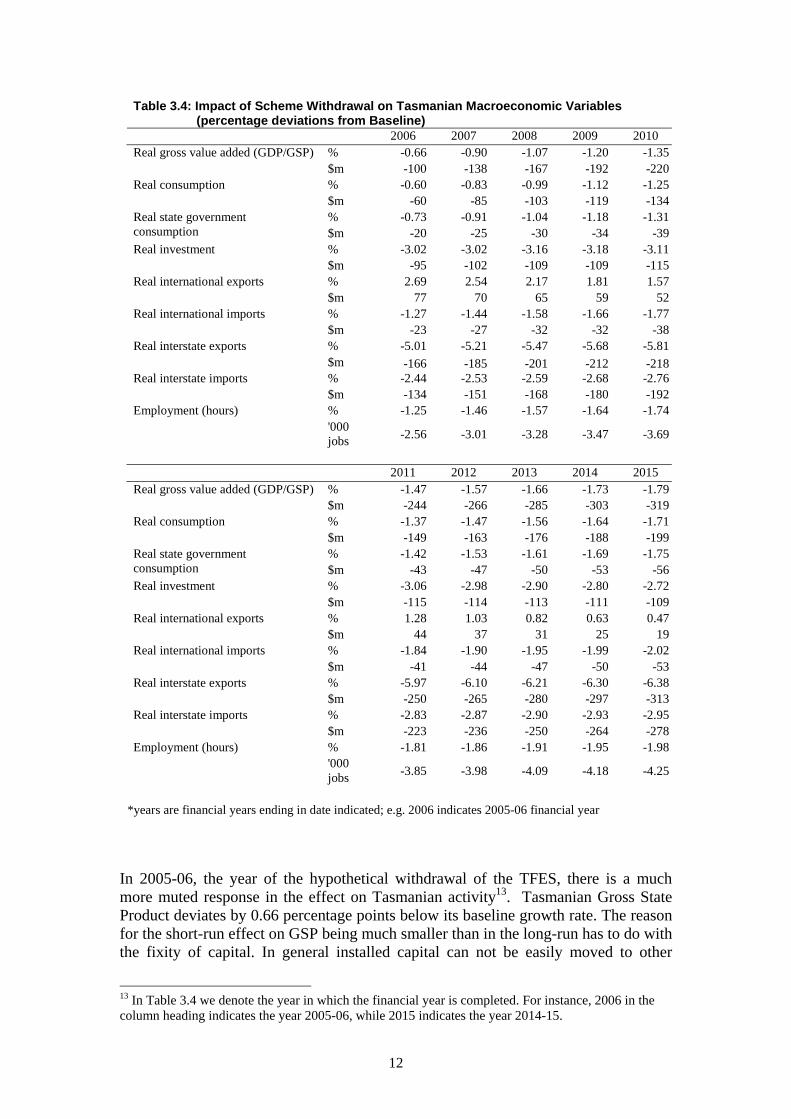
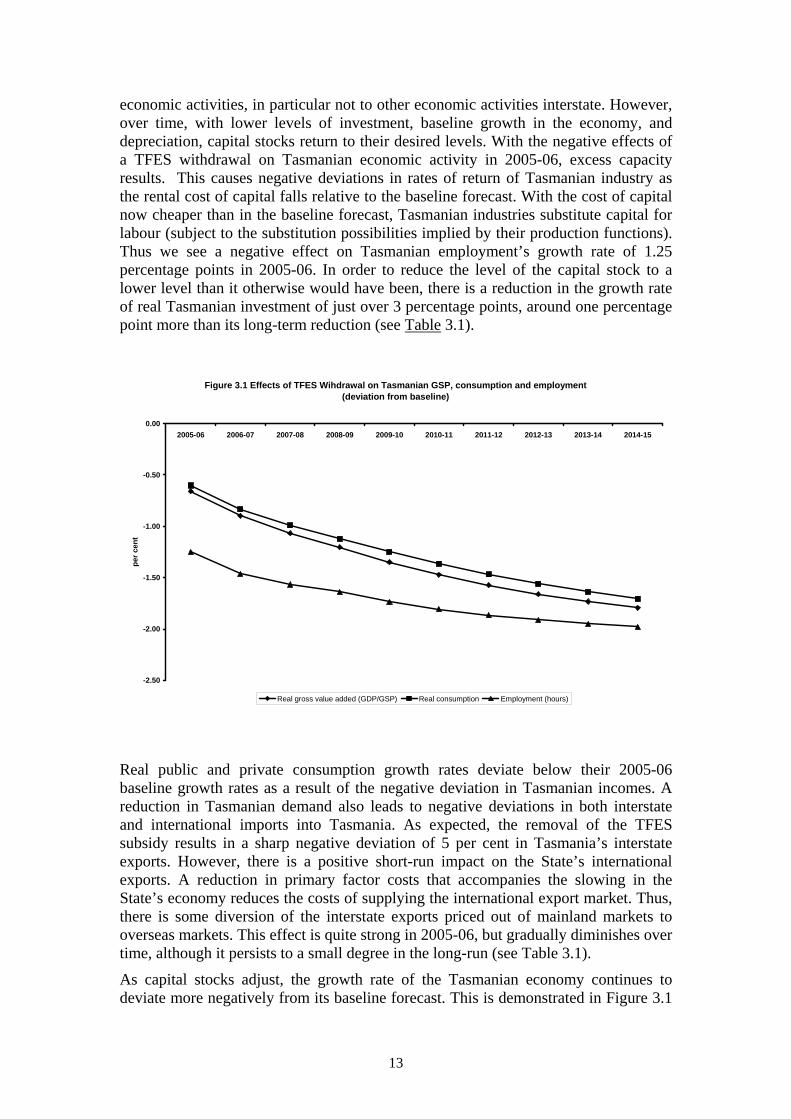
economic activities, in particular not to other economic activities interstate. However, over time, with lower levels of investment, baseline growth in the economy, and depreciation, capital stocks return to their desired levels. With the negative effects of a TFES withdrawal on Tasmanian economic activity in 2005-06, excess capacity results. This causes negative deviations in rates of return of Tasmanian industry as the rental cost of capital falls relative to the baseline forecast. With the cost of capital now cheaper than in the baseline forecast, Tasmanian industries substitute capital for labour (subject to the substitution possibilities implied by their production functions). Thus we see a negative effect on Tasmanian employment’s growth rate of 1.25 percentage points in 2005-06. In order to reduce the level of the capital stock to a lower level than it otherwise would have been, there is a reduction in the growth rate of real Tasmanian investment of just over 3 percentage points, around one percentage point more than its long-term reduction (see Table 3.1).
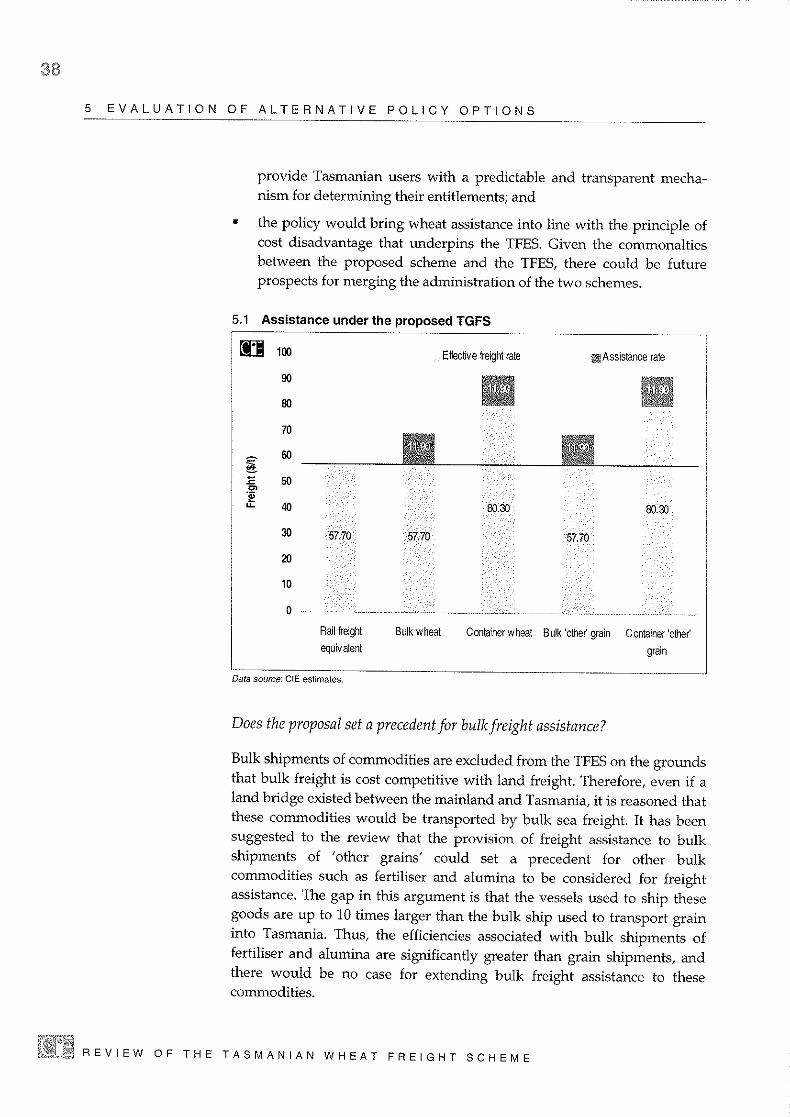
Figure 3.1 Effects of TFES Wihdrawal on Tasmanian GSP, consumption and employment(deviation from baseline)
-2.50
-2.00
-1.50
-1.00
-0.50
0.002005-06 2006-07 2007-08 2008-09 2009-10 2010-11 2011-12 2012-13 2013-14 2014-15
per c
ent
Real gross value added (GDP/GSP) Real consumption Employment (hours)
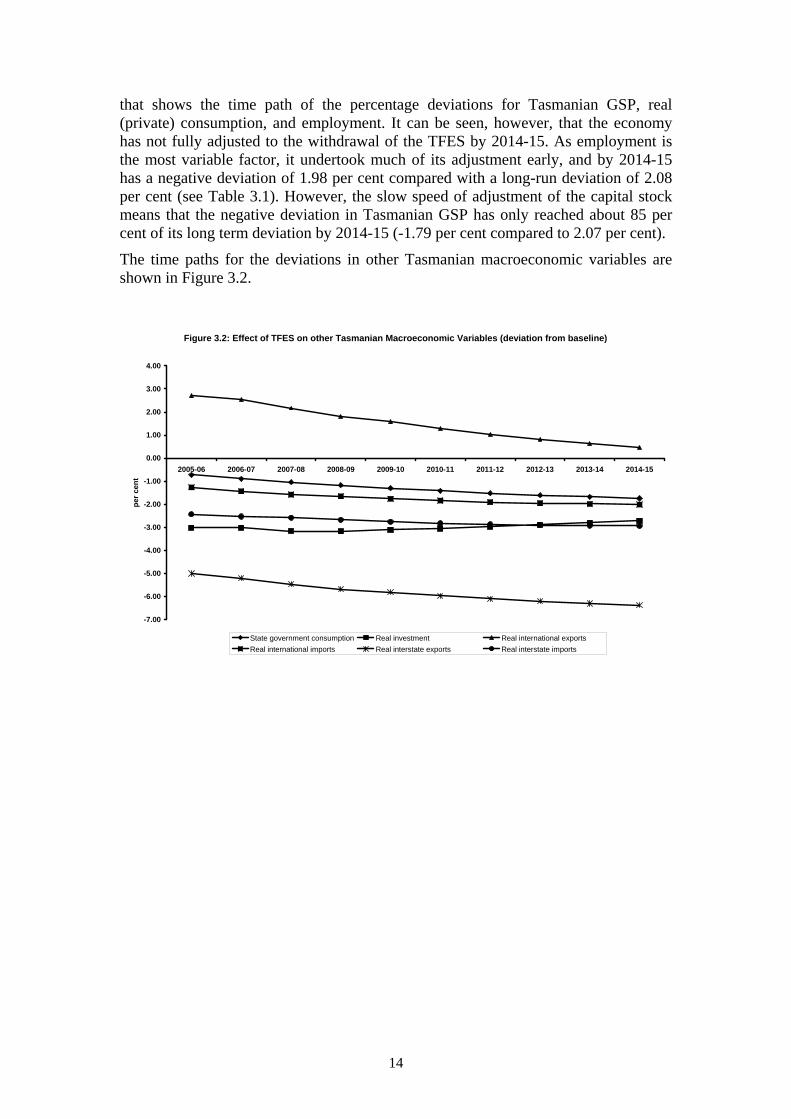
Real public and private consumption growth rates deviate below their 2005-06 baseline growth rates as a result of the negative deviation in Tasmanian incomes. A reduction in Tasmanian demand also leads to negative deviations in both interstate and international imports into Tasmania. As expected, the removal of the TFES subsidy results in a sharp negative deviation of 5 per cent in Tasmania’s interstate exports. However, there is a positive short-run impact on the State’s international exports. A reduction in primary factor costs that accompanies the slowing in the State’s economy reduces the costs of supplying the international export market. Thus, there is some diversion of the interstate exports priced out of mainland markets to overseas markets. This effect is quite strong in 2005-06, but gradually diminishes over time, although it persists to a small degree in the long-run (see Table 3.1).
As capital stocks adjust, the growth rate of the Tasmanian economy continues to deviate more negatively from its baseline forecast. This is demonstrated in Figure 3.1
14
that shows the time path of the percentage deviations for Tasmanian GSP, real (private) consumption, and employment. It can be seen, however, that the economy has not fully adjusted to the withdrawal of the TFES by 2014-15. As employment is the most variable factor, it undertook much of its adjustment early, and by 2014-15 has a negative deviation of 1.98 per cent compared with a long-run deviation of 2.08 per cent (see Table 3.1). However, the slow speed of adjustment of the capital stock means that the negative deviation in Tasmanian GSP has only reached about 85 per cent of its long term deviation by 2014-15 (-1.79 per cent compared to 2.07 per cent).
The time paths for the deviations in other Tasmanian macroeconomic variables are shown in Figure 3.2.
Figure 3.2: Effect of TFES on other Tasmanian Macroeconomic Variables (deviation from baseline)
-7.00
-6.00
-5.00
-4.00
-3.00
-2.00
-1.00
0.00
1.00
2.00
3.00
4.00
2005-06 2006-07 2007-08 2008-09 2009-10 2010-11 2011-12 2012-13 2013-14 2014-15
per c
ent
State government consumption Real investment Real international exportsReal international imports Real interstate exports Real interstate imports
15
References
Adams, P.D., M.J. Horridge and B.R. Parmenter (2000), “Forecasting for Australian Regions Using the MMRF-GREEN Model”, Australasian Journal of Regional Studies, 6(3), pp. 293-322.
Adams, P.D., M.J. Horridge, G. Wittwer (2003), “MMRF-GREEN: A Dynamic Multi-Regional Applied General Equilibrium Model of the Australian Economy, Based on the MMR and MONASH Models”, CoPS Working Paper G-140, Centre of Policy Studies and Impact Project, Monash University, Melbourne, pp. 70.
DoTaRS (2004) Tasmanian Freight Equalisation Scheme Statistics: 12 months ending 30 June 2003, Australian Government: Department of Transport and Regional Services and Tasmanian Assistance Services, Centrelink, Hobart, November 2004.
WORLD MARITIME DAY
Friday 30 September, 2005
Australian Shippinq Policy. Not
David Sterrett - Chairman, Australian Shipowners Association
Good morning ladies & gentlemen, I would like to welcome you all to this ASA function. In keeping with ASA's general approach these breakfast sessions are intended to be focussed, time-efficient, practical, informed and informing. They are also meant to be enjoyable. In particular I would like to welcome Ivan Backman, Chair of the Australian Logistics Council and a very influential figure in the Australian transport logistics sector. If you ask him, Ivan will tell you that the transport logistics sector contributes 9% of Australia's GDP and sea transport is a key part of that sector. We also welcome Ted Anson, Chair of the Australian Maritime Safety Authority, whose career has been involved in and around the shipping industry in this country. We welcome a number of ASA member companies' representatives including Adsteam Australasia, CSR Shipping, BlueScope Steel, Patrick Shipping, Teekay Shipping, Dorchester Maritime and ASP Ship Management. We also have with us a range of experts in the maritime industry including insurers, lawyers, consultants, publishers, the Melbourne Harbour-Master, Capt Tim Muir and interests from the seafarers' welfare community. World Maritime Day is gaining momentum in Australia and I am pleased to inform you of an initiative that ASA is to pursue. We will be convening an Australian Shipping Summit early in 2006. The purpose of the summit will be to gather influential interests in the Australian sea transport sector. The interests that will be gathered will address sea transport opportunities that currently exist, as well as sea transport opportunities that could be developed if Australia had a market environment for sea transport service providers based on conventional market competition principles.
It is interesting that in Australia, it seems to be necessary to capture the attention of decision makers over things that in other nations are just taken for granted. Having a shipping policy for Australia is one such matter. For example, ASA recently wrote a letter to the editor of LLDCN, pointing out the
things you do not do if you want to be Australian and be a ship operator. We reiterated these `don't do's' at Freight Week 2005 which was held in Melbourne recently. What we did was to describe the example of an Australian entity which wants to enter the Australian sea transport industry in Australia. We described how they would expect to be covered by Australian law. What the Australian entity would be faced with is the preposterous reality that, because of Australian law, it would be desirable for them to:
• not own the ship in Australia, and • not register the ship in Australia, and • not operate the ship from Australia, and • not employ Australian-residents as the majority of the crew, and • not obtain a licence under the Navigation Act, and • not remain permanently in Australian waters.
These are six things an Australian should not do if he or she wants to compete on roughly equal terms with foreign ships that are facilitated in operating under permits - but outside Australia's legal framework - in Australia's sea transport industry. Peter Couchman, the former ABC television reporter and journalist who was moderating the Freight Week discussion, was so taken aback by our description of what Australians ought not do that he cited our example to highlight what he perceived to be a divide between commercial practice and reality on the one hand and the regulatory environment in Australia on the other. Australians are encouraged to be lots of things but to be ship operators is not one of them. It's a bit early in the morning to take you through turgid detail but consider this: If you are Australian it is best not to own the ship in Australia because if you do, you will be obliged by the Shipping Registration Act to register the ship in Australia. No matter who you are it is best not to register the ship in Australia because Australia offers no registration-linked incentives for investment in shipping whereas most other OECD countries, and certainly all the G8 countries, do offer incentives to shipping interests. In fact an Australian Treasury official once said to us that Australians should register their ships in nations that are stupid - his word not ours - stupid enough to offer incentives to ship operators. Would that we could!

If you are Australian it is best not to operate the ship from Australia because if you do, the ship will be deemed to be an Australian ship under the Navigation Act and will fall under Australia's Seafarers' Rehabilitation and Compensation legislation as well as Australia's OH&S legislation, both of which impose costs that are not imposed on the foreign ship operator with whom you compete. If you are Australian it would be best not to employ Australian-residents as the majority of the crew because if you do, that too will turn your ship into an Australian ship under the Navigation Act with consequent cost impositions that are not applied to your competition. If you are an Australian it would be best not to obtain a licence under the Navigation Act lest your ship be deemed to be "engaged in the coasting trade" which again turns it into an Australian ship as opposed to it "operating in the coastal trade" which is what a foreign ship is said to do. The foreign ship thereby escapes Australian law. If you are an Australian it would certainly be preferable not to have your ship remain permanently in Australian waters because if you do your ship will be imported under the Customs Act and all the other cost-imposing dominoes will be set in motion for the Australian but not his foreign competitor. There is a wafer-thin administrative distinction between foreign and Australian vessels which can create a cavern between them in terms of their relative competitive positions. There is also a broader inconsistency in policy application. I have already mentioned the Shipping Registration Act. The Shipping Registration Act is crucial because it raises a fundamental question that is central to the future of Australian sea transport, and it is this: If an entity has to own a ship in a place outside Australia to be able to optimise its registration arrangements and if it has to be operated outside Australia to avoid Part II of the Navigation Act, why have any part of that entity in Australia? The unmistakeable incentive is to locate the entity outside Australia altogether. The logic of that seems unmistakeable which makes another proposition even more ridiculous: it is possible that the Shipping Registration Act remains unaltered due to a concern that non-Australian registered ships are rust-buckets. There is a maxim in shipping which says that behind every sub-standard ship stands a sub-standard operator. That maxim would be good for the trucking, rail and the airline industry as well. The challenge is to convince our legislators that if a ship operated by an Australian were to transfer its registry to some other jurisdiction, it would not change the standards of its operator one bit.
Besides, all the foreign vessels that are provided by the Australian government with permits to trade in Australia's domestic transport industry are foreign-registered and they're not rust-buckets. Australian operators are among the best in the world and their registration arrangements have nothing to do with their operational standards. And there's another issue that goes to another crucial question - maritime skills and careers for young Australians. The tax treatment of Australians who work in shipping can be different to that of other Australians. Not the same treatment - less favourable treatment. Here's an example: two Australians are employed outside Australia in a foreign country in circumstances that are identical except one's workplace is ashore. The Australian who works outside Australia but on a ship is said not to be working in a foreign country because, according to the Federal Court, the high seas are the only waters in the world that aren't considered a foreign country. This accident of wording is relied upon by the Treasurer to apply the taxation act differentially. Don't worry that it is an accident of wording, don't worry that it is discriminatory application of law, don't worry that it is denying young Australians careers in the maritime sector, don't worry that it is contributing to a growing maritime skills shortage in Australia. Another curiosity about the policy treatment of shipping is that the barriers to participation by Australians in Australia's shipping business flies in the face of the government's own competition policy.
As a result, users of shipping services in Australia are denied choice of shipping services because Australians are severely circumscribed from participation in shipping. Let me put this to you: Imagine if the government were to say to Toll, Patrick, Linfox or Pacific National that they must compete with - but not be able to access the same cost structures as foreign road and rail transport operators operating in Australia who are not required to pay tax, who are excused from observing Australia's OH&S regulations, workers' compensation regulations and who are facilitated in employing foreign workers in Australia at a fraction of the labour cost applicable to Toll, Patrick and Pacific National. We would be surprised if Paul Little, Chris Corrigan or Lindsay Fox copped that if it seriously jeopardised their shareholders' interests. And it would.
Most people would say that would never happen but in shipping in Australia it does. Don't be under any misapprehension, Australian laws are waived for foreign operators trading in Australia while those same laws are applied to Australians and impose a much higher cost structure on them. National Competition Policy The Australian Government National Competition Policy Annual Report for the period 1 April 2003 to 30 June, 2004 describes the importance of competition policy for Australia. Competition policy talks about the impetus for pursuit of productivity improvements, reductions in market transaction costs, increases in information available to consumers to make informed choices and encouragement of innovation in product design. The anti-competitive nature of regulation which seriously inhibits the ability of Australians to compete in Australia's own domestic sea transport sector quells the incentive to pursue those objectives which the National Competition Policy is supposed to inspire in the Australian economy. The National Competition Policy framework speaks of the review of, and where necessary reform of, legislation that is anti-competitive. To give you an idea of how that does not apply to shipping regulation, we have a letter on file which says, in part:
"I can confirm.. . .my intention to progress the recommendations as quickly as possible, including removal of the obligation on Australian shipowners to register vessels in Australia."
That letter was from the then Minister for Transport and Regional Services, The Hon John Anderson. It gave us great comfort and confidence in the Australian government's responsiveness to collisions between poor policy and commercial practicality. The letter is dated 14 April, 2000: seventy months have elapsed since then and still, despite continuing lobbying by ASA on that and other key issues, nothing has happened. National Competition Policy is said to be part of a broader reform programme aimed at, amongst other things, providing lower prices and greater choices for consumers.
Well, let's test that proposition. Not including cargo moving between Tasmania and Melbourne, around a million tonnes of general cargo was carried by foreign ships between Australian ports in 2002/03.
That cargo was moved almost exclusively in vessels operating under continuing voyage permits issued under the Navigation Act. We are the first to say that we see the efficacy of the permit system, but we also say that the permit system creates an extraordinarily anti-competitive marketplace that flies in the face of the Australian government's own competition policy. The permit system is anti-competitive because it allows foreign vessels, operating with foreign labour to enter the Australian shipping market and offer to carry freight on a cost base that is not available to Australians operating in the same market. The key point here is that the differential between the cost-base of the foreign operator and the cost-base of the Australian operator comes about because of the application of, or exemption from (in the case of the foreign vessels) applicable Australian law. What has happened is that the legislation that determines the importation status of a ship and the immigration status of its foreign crew have been aligned in such a way that - and this is the cutest bit of all - a foreign ship can operate between Australian ports for months at a time and still be said to be on an international voyage. The semantics go further. A foreign ship which operates for months at a time in Australia is said to be "operating in the coastal trade". An Australian ship which operates for months or years at a time is said to be "engaged in the coasting trade". This apparently inconsequential distinction in phraseology is crucial for the Australian government to allow the foreign ship to avoid coverage by Australian laws that are applicable to and impose additional costs on, the Australian ship. Whilst the Australian government apparently has no position on shipping other than to subject Australians to a flagrantly anti-competitive regulatory regime, it is rapidly emerging that the private sector has a different view. On Tuesday 14 September there was a Freight Networks Day as part of Freight Week 2005. The Freight Networks Day consisted of representatives of industry transport logistics specialists and leaders from a wide range of sectors. The Networks Day, after an exhaustive scrutiny of issues and objectives, produced a communique. The communique identified a series of issues under the Australian Logistics Industry Strategy headings of Leadership, Infrastructure and Planning, People, Innovation and Sustainability and Freight Transport Security. One of the key priorities identified for immediate action under the heading of Innovation and Sustainability was policy and infrastructure support for rail and coastal shipping as sustainable modes. That's not surprising when you consider that sea transport performs 28% of the nonurban freight task but consumes only 9.6% of total energy in the freight transport sector and contributes only 2% of total transport emissions.
The significance of that initiative - an initiative not just of the shipping sector but of the transport logistics industry as a whole - is that industry recognises sea transport as a core transport logistics mode. The transport logistics sector seems to be mobilising to embrace sea transport as part of Australia's domestic transport structure. Government can no longer turn a blind eye to shipping. The government should be moving to remove the anti-competitive barriers to investment in Australian domestic shipping by Australian enterprises. The government should be moving to recognise that, unlike the road and rail sectors which are having $12.5 billion spent on their infrastructure over the next five years, the sea transport industry pays for its own infrastructure - in fact more than pays for most of it by way of dividends returned by port authorities to their state government owners.
Ladies and gentlemen, if you care about Australia being prevented from having a burgeoning sea transport sector then tell someone you care about it - starting with us.