Embed Size (px)
Citation preview
The Economic Costs of
Employee Misclassification in the State of Illinois
Michael P. Kelsay, Ph.D. James I. Sturgeon, Ph.D. Kelly D. Pinkham, M.S.
A Report by the
Department of Economics University of Missouri‐Kansas City
December 6, 2006
This research project received funding from the National Alliance for Fair Contracting (NAFC)
I. Summary Findings This report is a first step toward analyzing the economic implications of employee misclassification for the public and private sectors in the State of Illinois. It is based upon aggregate audit data for the five‐year period, 2001‐2005, provided by the Illinois Department of Employment Security (IDES) and the results of similar studies on misclassification in other states. In this report, we analyze the scope and trends of misclassification in Illinois. We provide estimates of the impact of misclassification on Illinois state revenues, the unemployment insurance fund, and for workers’ compensation in Illinois. Employee misclassification is defined as the case where employers treat workers as independent contractors that should otherwise be wage or salaried employees. If an employee is classified as an independent contractor, the employers are not required to pay a variety of payroll‐related taxes, fees and benefits (e.g. social security, unemployment insurance, income taxes, workers compensation, pension and health benefits, etc.). Not only are these costs illegally shifted to the individual worker, the “independent contractor” is also not fully protected by various employment laws (minimum wage and overtime requirements, workers compensation protection, the right to form a union and bargain collectively, etc.) and may, incorrectly, believe he or she is not protected by Illinois unemployment laws. The issue of misclassifying employees as an independent contractor is a growing problem for the unemployment insurance system in Illinois and the nation since employers remit their unemployment taxes based upon their payroll. Recent studies have shown that misclassification by employers is increasing.1 Note, the “underground economy” (workers paid in cash) is outside the scope of our study. Thus, the estimates we provide may underestimate the full extent of the problems associated with the employer practice of misclassification in Illinois. Misclassification negatively impacts the citizens of Illinois in several ways. First, the conditions for a fair and competitive marketplace are sabotaged. Firms that misclassify can bid for work without having to account for many normal payroll‐related costs. This illegal practice can decrease payroll costs by as much as 15 to
2
1 In a report by the National Employment Law Project, it was reported that US DOL quarterly audits found 30,135 employees misclassified in 2002. This was a 42% increase from the prior year.
30%. This places employers who correctly classify their employees at a distinct competitive disadvantage. In Illinois, workers who have been misclassified, but who have been paid on a 1099‐basis, may still receive unemployment insurance benefits if they complete an affidavit and file for benefits. When they do so, a benefit‐related audit is triggered by the Audit Section of the Illinois Department of Employment Security (IDES) to determine the eligibility of the former employee. If the employer can be located and/or the former employee’s eligibility can be confirmed, the employer will be subject to collection procedures to recover the unreported wages. Ultimately, in a legal sense, it is not the employer but state law that determines who is eligible for unemployment insurance benefits. Still, the violating employer will have been able to gain business illegally by exploiting their competitive advantage during the bidding process and they will have profited by avoiding other payroll related expenses. Several studies have shown the problem of misclassification to be particularly acute in the construction sector. A U.S. Census Bureau analysis of projected employment by major industry division for the period 2004‐2014 shows that the growth in overall employment is projected to increase 14.8%, or an annual rate of increase of 1.4%; in construction, the growth in employment is projected to increase 11.4%, or an annual rate of increase of 1.1%. Given the projected growth in the construction sector, the impacts of misclassification will get worse. A number of studies have been conducted to assess the extent and impact of misclassification. For the 11 states studied, the moderate rate of misclassification was from 13‐23%. In two states, Massachusetts and Maine, the incidence of misclassification in the construction industry is higher than all other industries in their states. For Massachusetts, the moderate statewide rate is 19%, while the rate of misclassification in the construction sector is 24%; for Maine, the low statewide estimate is 11%, while the incidence rate of misclassification in the construction sector is 14%. In a report by the General Accounting Office (1996), it was reported that the percentage of misclassified workers in all industries was 15%, while the percentage of misclassified workers in the construction sector was 20%.
3
In Illinois, since 2003, the Unemployment Insurance Trust Fund has been experiencing increasing deficits. While the key contributing factor to the growing deficit was the downturn in the overall economy during this period,
misclassification did partially contribute to the negative outcomes. A review of the Fund’s year‐end balances shows the trend. From 1987 through 2002, the Trust Fund ended each year with a positive balance. In 2000, the year‐end trust fund balance was a positive $2.051 billion. However, in 2003, the Fund ended the year with a $511 million deficit which was projected to increase to a $627 million deficit in 2004.2 States, including Illinois, perform unemployment insurance audits that are both random and non‐random. The purpose of performing non‐random audits is to search for incidents of misclassification where they are more likely to be discovered than with random audits alone. In Illinois, unlike some other states, nearly all the non‐random audits were related to specific filings for unemployment benefits. Unlike Illinois, some other states also perform “targeted” audits that are based upon the conduct of employers. Examples of these situations would include the delinquent filing of reports, late registration, past violations of state law such as with misclassification of employees, etc. For the purposes of making informed projections for our study on Illinois, random audits will provide a lower bound estimate on the prevalence of misclassification while non‐random audits will provide an upper bound estimate on the extent of misclassification. Based upon data provided by the Illinois Department of Employment Security, the audit department conducted 23,587 audits for the five‐year period, 2001‐ 2005. Of these audits, 18,092 or 76.7% were random. Benefit related audits (e.g. non‐random audits) were 5,106 or 21.6% of the total. These two audit types account for 98.3% of all unemployment insurance audits in Illinois for 2001‐2005. The remaining 1.7% was comprised of six other audit types (see table, Page 23). Employee Misclassification in Illinois • For the years 2001‐2005, state audits found that 17.8% of the audited Illinois employers had misclassified workers as independent contractors. This translates into approximately 56,650 total employers statewide of which 6,206 were in construction. In 2005, the rate of misclassification was higher, 19.5%. This translates into 63,666 employers statewide with 7,040 employers in
4
2 The Unemployment Insurance Trust Fund. Illinois Department of Employment Security. August 19, 2004.
construction.3 Based upon the fact that 76.7% of these audits were random, the rate of misclassification in Illinois indicates that the rate of misclassification may be higher in Illinois than in other states that have been studied. • When an employer practices misclassification in Illinois, the results show that this behavior is pervasive. An analysis of the percentage of employees that are misclassified indicates that it is a common occurrence rather than a random one in those companies that do misclassify. According to the data provided by the Illinois Department of Employment Security, 28.8% of workers were misclassified by employers that were found to be misclassifying for the period 2001‐2005. The rate of misclassification showed an upward trend as well. In 2001, 22.8% of workers were misclassified by employers who were found to be misclassifying; this had increased to 33.0% in 2003, and had decreased somewhat to 27.6% in 2005. The rate of misclassification by violating employers had increased 21% from 2001 to 2005. • From our analysis of the labor force of all employers in Illinois (those that misclassify and those that don’t), we estimate that 7.5% of employees in Illinois were misclassified as an independent contractor for the period 2001‐2005. The audit results show that misclassification is a growing problem in Illinois. While 5.5% of employees in Illinois were estimated to be misclassified in 2001, this increased to 8.5% in 2005. This represents a 55% increase in the misclassification rate in Illinois from 2001 to 2005. • The number of employees statewide that were affected by the improper misclassification is estimated to have averaged 368,685 annually for the 2001‐2005 period. For 2005 alone, the estimated number of employees affected by misclassification had increased to 418,870. Within the construction sector for the period 2001‐2005, the number of employees affected by misclassification is estimated to have averaged 20,202. In the year 2005, the estimated number of misclassified employees in the construction sector had increased to 22,371. • Misclassification of employees has a negative financial impact on individual workers, the Illinois state government, and the private sector in
5
3 According to the Illinois Department of Employment Security, the average number of employers over 2001‐2005 was 34,954 in construction and 319,054 in all industries. In 2005, there were 36,154 construction employers and 326,945 in all industries. These numbers exclude local, state, and federal government.
Illinois. The workers are directly impacted by being denied the protection of various employment laws and by being forced to pay costs normally borne by employers. State income tax revenues and the unemployment insurance system in Illinois are adversely affected as well. Misclassification also imposes other costs on employers who play by the rules, the general health delivery system, taxpayers, and upon the public at large. • We estimate that the unemployment insurance system lost an average of $39.2 million every year from 2001 to 2005 in unemployment insurance taxes that were not levied on the payroll of misclassified workers as they should have been. During 2005, we estimate that the unemployment insurance system in Illinois lost $53.7 million in unemployment insurance taxes. A portion of this lost revenue may be recaptured when misclassified workers who received a 1099 apply for unemployment insurance benefits. In those cases, a benefit related audit is normally triggered and the IDES will seek to recover the unpaid unemployment insurance taxes involved. In 2005 for example, the amount of uncollected unemployment insurance tax that was recovered from these non‐random audits, approximately $1.1 million, equaled nearly 2% of the total amount that we project was not collected. • For the construction sector, we estimate that the unemployment insurance system lost an average of $2.0 million annually from 2001 through 2005 in unemployment insurance taxes that were not levied on the payroll of misclassified workers in construction as they should have been. For 2005 alone, we estimate that the unemployment insurance system in Illinois lost $2.5 million in unemployment insurance taxes just in the construction sector. • According to published data, workers misclassified as independent contractors are known to underreport their personal income as well; as a result Illinois suffers a loss of income tax revenue. According to the IRS reports, wage earners report 99% of their wages whereas non‐wage earners (such as independent contractors) report approximately only 68% of their income. This represents a gap of 31%. Other studies estimate the gap to be as high as 50%.
6
• Based upon IRS estimates that 30% of the income of misclassified workers in Illinois is not reported, we estimate that, on average, $124.7 million annually of income tax was lost in Illinois for 2001 through 2005. In just 2005, we estimate that $149.0 million of income tax was not collected in Illinois. For the construction sector, we estimate that $8.9 million annually of income tax was lost
in Illinois from 2001‐2005. For 2005, we estimate that $10.4 million of income tax was lost in the construction sector in Illinois. • Based upon the higher estimate that up to 50% of the income of misclassified workers is not reported, an estimated $207.8 million annually of income tax was lost, on average, in Illinois for 2001 through 2005. For just 2005, we estimate that $248.4 million of income tax was lost in Illinois. For the construction sector, we estimate that an average of $14.8 million annually of income tax was lost in Illinois during 2001‐2005. For 2005, we estimate that $17.3 million of income tax was lost just in the construction sector. • Misclassification also impacts worker’s compensation insurance. Among other effects, costs are higher for employers that follow the rules placing them at a distinct competitive disadvantage. A large, national study reported that the cost of worker’s compensation premiums is the single most dominant reason why employers misclassify (Planmatics, 2000). Employers who misclassify can underbid the legitimate employers who provide coverage for their employees. The practice of misclassification shifts the burden of paying workers’ compensation insurance premiums onto those employers who properly classify their employees. It has the further effect of destroying the fairness and legitimacy of the bidding process. The same national study (Planmatics, 2000) reported that many previously misclassified workers were later added to their company’s worker’s compensation policy by their employer after they were injured, resulting in the payment of benefits even though premiums had not been collected. • Based upon statewide average worker’s compensation insurance premium rates published by the State of Illinois, we estimate that, on average, $95.9 million annually of worker’s compensation premiums were not properly paid for misclassified workers. For 2004, we estimate that $97.9 million of worker’s compensation premiums were not properly paid due to misclassification.
7
• Worker’s compensation premiums are much higher in the construction industry. In Illinois the statewide rate for all industries is less than $3.00 (per $100 of payroll). However, within construction, rates can range from $8.01 for electrical wiring to $27.94 for concrete construction. Using an average premium rate of $10 per $100 of payroll, we estimate an annual average of $23.2 million of worker’s compensation premiums were not properly paid by construction
employers in Illinois. Using a higher average premium rate of $15 per $100 of payroll, we estimate this average annual amount to be $34.8 million. Thus, we conclude that misclassification is an increasing problem in Illinois. The effects of increasing misclassification negatively impact workers, employers, small businesses, insurers, taxpayers and tax authorities. Furthermore, the operation of fair, competitive markets is compromised when the bidding process is undermined by the practice of misclassification. Illinois will stand to benefit from better documentation of misclassification, from adopting measures that help to improve compliance with state statutes and from targeting employers who intentionally and repeatedly misclassify their employees. Acknowledgements This project received funding from the National Alliance for Fair Contracting (NAFC). According to the NAFC website: “The National Alliance for Fair Contracting (NAFC) has been providing a forum in the construction industry for those interested in fair, competitive contracting. NAFC is a labor‐management organization that promotes a ‘level playing field’ through compliance with all applicable laws in public construction.” (www.faircontracting.org) The authors wish to especially thank the Illinois Department of Employment Security (IDES) for their assistance in providing summary‐level data to us without which this study could not have been completed. Preferred de‐identified, individual audit‐level data, like that utilized for studies conducted in a few other states, could not be obtained due to proprietary software issues and other limitations. With enough time, funding and cooperation from numerous parties, an industry‐specific analysis of misclassification could be done that would help the IDES more effectively target their resources toward those sectors with a higher rate of misclassification. Note: Studies such as ours that project economic costs to a given state due to the employer practice of misclassification should not be taken as report cards, so to speak, on the departments in those states responsible for collecting various revenues. In fact, the Illinois Department of Employment Security (IDES) consistently ranks at or near the top for all states in the U.S. for identifying and recovering unreported wages and in other measures of performance.
8
II. The Problem of Misclassification – Detailed Findings Employee misclassification is defined as the case where employers treat workers as independent contractors that should otherwise be wage or salaried employees. If an employee is classified as an independent contractor, the employers are not required to pay a variety of payroll related expenses (e.g. social security, unemployment insurance) while the independent contractor loses the protections that go with being an employee and is forced to pay many of his or her own employment related costs (the employer’s portion of social security insurance, workers compensation, health insurance premiums, etc). Workers with alternative work arrangements are making up an increasing percentage of the workforce.4 According to the United States Bureau of Labor Statistics, workers with alternative work arrangements accounted for 11.0% of the total workforce in February, 2005. Of the total amount of workers with alternative work arrangements, independent contractors accounted for 70% of workers with alternative work arrangements. An examination of independent contactors by industry showed that the construction sector accounted for 22.0% of all independent contractors, the highest level of concentration of independent contractors in all industries. The problem of misclassifying employees as an independent contractor is a growing problem for the unemployment insurance system in Illinois and the nation, as employers remit their unemployment taxes based upon their payroll. Recent studies have shown that employee misclassification is a growing problem.5 There are a number of different practices whereby misclassification is accomplished. First, many employers may hire labor as self‐employed independent contractors and provide them with a 1099‐Miscellaneous Income for tax purposes. An emerging problem takes the form of simply paying labor with cash with no trail of the independent contractor agreement. State and federal revenue bases are significantly impacted when employees are improperly
4 The Bureau of Labor Statistics defines workers with alternative work arrangements as (1) independent contractors, (2) on‐call workers, (3) temporary help agency workers, and (4) workers provided by contract firms. (http:www.bls.gov/news.release/conemp.t08.htm)
9
5 In a report by the National Employment Law Project, it was reported that US DOL quarterly audits found 30,135 employees misclassified. This was a 42% increase from the prior year.
classified as independent contractors. The IRS reports that voluntary compliance in reporting income varies significantly across groups of individual taxpayers. Among those filing tax returns, wage earners report 99% of their wages; self‐employed individuals who receive a 1099, report 68% of their business income; and “informal suppliers” ‐ self‐employed individuals who operate informally on a cash basis ‐ report just 19% of such income on their tax returns. Informal suppliers accounted for almost 17% of all unpaid individual income and employment taxes in 1992.6 The issue of misclassification has implications for the unemployment insurance system in several ways. Firms that misclassify employees as independent contractors pay no employment insurance tax on those workers. A portion of this unpaid tax may be eventually recovered when audits are generated due to formerly misclassified workers applying for unemployment insurance benefits. In 2005, these audits recovered about 2% of the total amount of taxes we project were not collected in Illinois. Employers who correctly classify their employees are at a distinct competitive disadvantage over those employers who misclassify their employees. This practice also has distinct budgetary implications for the unemployment insurance fund and state tax revenues in Illinois.7 This may be particularly acute in the construction sector.8 It was reported by Planmatics (2000) that the construction industry was the most frequently cited sector as the one most likely to use independent contractors, contain the highest incidence of misclassification, and the one that lures workers into becoming independent contractors. There may be a number of reasons why a person, who would otherwise be legally authorized, would not file for unemployment insurance benefits. For one, filing will automatically trigger a benefit‐related audit which will cause their former employer to be assessed back taxes that may also include penalties and interest. The worker may reasonably assume that such an outcome could jeopardize their future employment opportunities with that employer. In addition, violating employers require workers to sign various forms of 6 United States General Accounting Office. Taxpayer Compliance: Analyzing the Nature of the Income Tax Gap. GAO/T‐GGD‐97‐35. 7 Illinois Department of Employment Security. Office of Revenue. EA‐2005.
10
8 The General Accounting Office (1996) reported that the estimated percentage of employees with misclassified workers was 13.4%, while the estimated percentage in the construction sector was the highest of all industry groups at 19.8%.
paperwork that serves to provide legitimization to the whole disenfranchising process of misclassification. The worker may be understandably confused as to their full rights under the law. In particular, workers paid “off the books” (in cash) are highly unlikely to file. These are just a few reasons why benefit‐triggered audits only get at a portion of the total uncollected unemployment insurance tax. Misclassification also presents societal costs to workers and the private and public sectors in Illinois. Although these costs are not quantified in this report, the societal costs are substantial. For example, workers that are misclassified do not receive health insurance benefits. The lack of health insurance coverage exacts a large toll on the uninsured – avoidable deaths, poorly managed chronic conditions, and underutilizes life‐savings medical procedures. In addition to the direct toll the lack of health insurance coverage takes on the uninsured, there are other substantial social and economic costs as well. The economic costs of being uninsured or under‐insured are borne by workers, employers, the health system, taxpayers, and the public at large. The costs borne by the uninsured include a greater probability of death, reduced preventive care, and a smaller likelihood of early detection of medical problems.9 The health system also bears an economic cost as well. It is reported that $34.5 billion in uncompensated care was received by the uninsured in 2001. In addition to these direct costs to the health system, there are indirect costs through inefficient use of the health system (e.g. costs of emergency room visits that are not needed). One report stated that 33% of emergency room visits were for health reasons that did not require emergency room care and could have been avoided. The taxpayers also bear economic costs of the uninsured and underinsured. Federal, state, and local governments support care of the uninsured through public clinics, and payments to certain care facilities that care for the poor and uninsured. The Commonwealth Fund reported that these intergovernmental expenditures were approximately $30.6 billion annually. These conclusions show that the uninsured as a result of misclassification are exacting a high cost on those individuals as well as employers, the general health delivery system, taxpayers, and the public at large.
11
9 The Commonwealth Fund reports that the lack of health insurance leads to 18,000 deaths per year. The Commonwealth Fund. The Costs and Consequences of Being Uninsured. Commonwealth Fund Publication #663.
There are a number of reasons why employers engage in misclassification. It is reported that the cost of workers’ compensation premiums is the single most dominant reason for misclassification (Planmatics, 2000). Employers also engage in misclassification in order to avoid the economic costs associated with litigation against employers alleging discrimination, sexual harassment, and putting in place the regulations and reporting procedures required for employees (Planmatics, 2000). Additionally, if an employee is classified as an independent contractor, the employers are not required to pay a variety of payroll taxes (e.g. social security, unemployment insurance) and the independent contractor is not fully protected by employment laws. This allows employers to underbid the legitimate employers who provide coverage for their employees. In the construction sector, workers compensation misclassification penalizes legitimate contractors in the bidding process. It has been reported that many workers are added after an injury to a company’s worker’s compensation policy, resulting in payment of benefits even though premiums were not paid (Planmatics, 2000). From 1987 through 2002, the Illinois Unemployment Insurance Trust Fund ended each year with a positive balance. In 2000, the year‐end trust fund balance was a positive $2.051 billion. However, in 2003, the Fund ended the year with a $511 million deficit which was projected to increase to a $627 million deficit in 2004.10 While the key contributing factor to the deficit was the downturn in the overall economy during this period in Illinois and the nation, misclassification in Illinois partially contributed to the negative outcomes experienced by the Trust Fund. In the State of Illinois, the maximum unemployment insurance rate remained constant at 6.8% for the period 1996‐2002. It has increased every year since 2002 with the maximum rate in 2005 at 9.8%, an increase of 44.1% since 2002. The wage base had remained constant at $9,000 for the period 1996‐2003. It increased in 2004 and 2005 to a level of $10,500, which is an increase of 16.7% since 2003. Table 1 provides estimates from a number of studies undertaken to determine the extent of employee misclassification in a number of states. For the 11 states where studies have been conducted, the moderate rate of misclassification was from 13‐23%. In two state‐level studies (Massachusetts and Maine), the incidence of misclassification in the construction industry is higher than all industries in their states. For Massachusetts, the moderate statewide rate is 19%,
12
10 The Unemployment Insurance Trust Fund. Illinois Department of Employment Security. August 19, 2004.
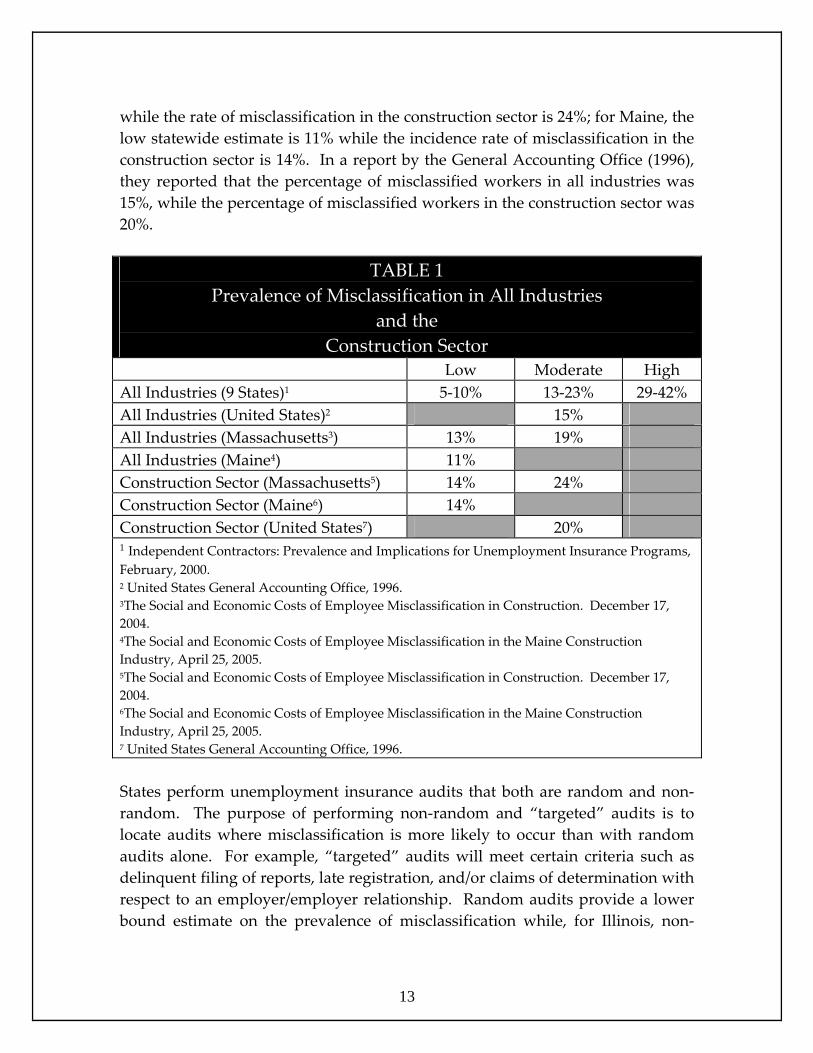
while the rate of misclassification in the construction sector is 24%; for Maine, the low statewide estimate is 11% while the incidence rate of misclassification in the construction sector is 14%. In a report by the General Accounting Office (1996), they reported that the percentage of misclassified workers in all industries was 15%, while the percentage of misclassified workers in the construction sector was 20%.
TABLE 1 Prevalence of Misclassification in All Industries
and the Construction Sector
Low Moderate High All Industries (9 States)1 5‐10% 13‐23% 29‐42% All Industries (United States)2 15% All Industries (Massachusetts3) 13% 19% All Industries (Maine4) 11% Construction Sector (Massachusetts5) 14% 24% Construction Sector (Maine6) 14% Construction Sector (United States7) 20% 1 Independent Contractors: Prevalence and Implications for Unemployment Insurance Programs, February, 2000. 2 United States General Accounting Office, 1996. 3The Social and Economic Costs of Employee Misclassification in Construction. December 17, 2004. 4The Social and Economic Costs of Employee Misclassification in the Maine Construction Industry, April 25, 2005. 5The Social and Economic Costs of Employee Misclassification in Construction. December 17, 2004. 6The Social and Economic Costs of Employee Misclassification in the Maine Construction Industry, April 25, 2005. 7 United States General Accounting Office, 1996.
13
States perform unemployment insurance audits that both are random and non‐random. The purpose of performing non‐random and “targeted” audits is to locate audits where misclassification is more likely to occur than with random audits alone. For example, “targeted” audits will meet certain criteria such as delinquent filing of reports, late registration, and/or claims of determination with respect to an employer/employer relationship. Random audits provide a lower bound estimate on the prevalence of misclassification while, for Illinois, non‐
random audits provide an upper bound estimate on the extent of misclassification. Illinois does not conduct “targeted” audits. The Illinois Department of Employment Security (IDES) has 9 different types of unemployment insurance audits (see table on page 23). The IDES conducted 23,587 audits from 2001 through 2005. The largest category of audits was audit type 1, “random audits.” The number of random audits from 2001‐2005 was 18,092 or 76.7% of the total number of audits. The second largest category was audit type 6, “Referral for Benefit Related Audits.” These represent an audit undertaken as a ‘claim of determination’ that has been made with respect to an employer/employee relationship. The number of benefit related audits conducted from 2001‐2005 was 5,106 or 21.6% of the audits. These two categories of audits accounted for 98.3% of all audits conducted for 2001‐2005. Using aggregate level data on unemployment insurance tax audits provided by the Illinois Department of Employment Security, we have developed reliable estimates of statewide misclassification and misclassification in the construction sector in Illinois. Using methodologies developed in earlier studies, we present projections of the economic costs of misclassification for unemployment insurance, income tax, and the worker compensation system in Illinois. Some studies of misclassification in other states have been able to obtain de‐identified data from unemployment insurance tax audits from which to derive estimates of misclassification. De‐identified data is data that does not identify an individual or company and from which there is no reasonable basis to believe that the information provided can be used to identify an individual or a company. The use of micro‐level, de‐identified data would have allowed a detailed analysis of misclassification for multiple industry sectors. For example, previous research has shown that the rate of misclassification is higher in construction and home health care than in other sectors. Due to the proprietary nature of the IDES database, we were provided with aggregate level data for 2001‐2005. From this data we have been able to estimate the overall rate of misclassification in Illinois, and for the construction sector, with statistical reliability. III. Extent of Misclassification in Illinois
14
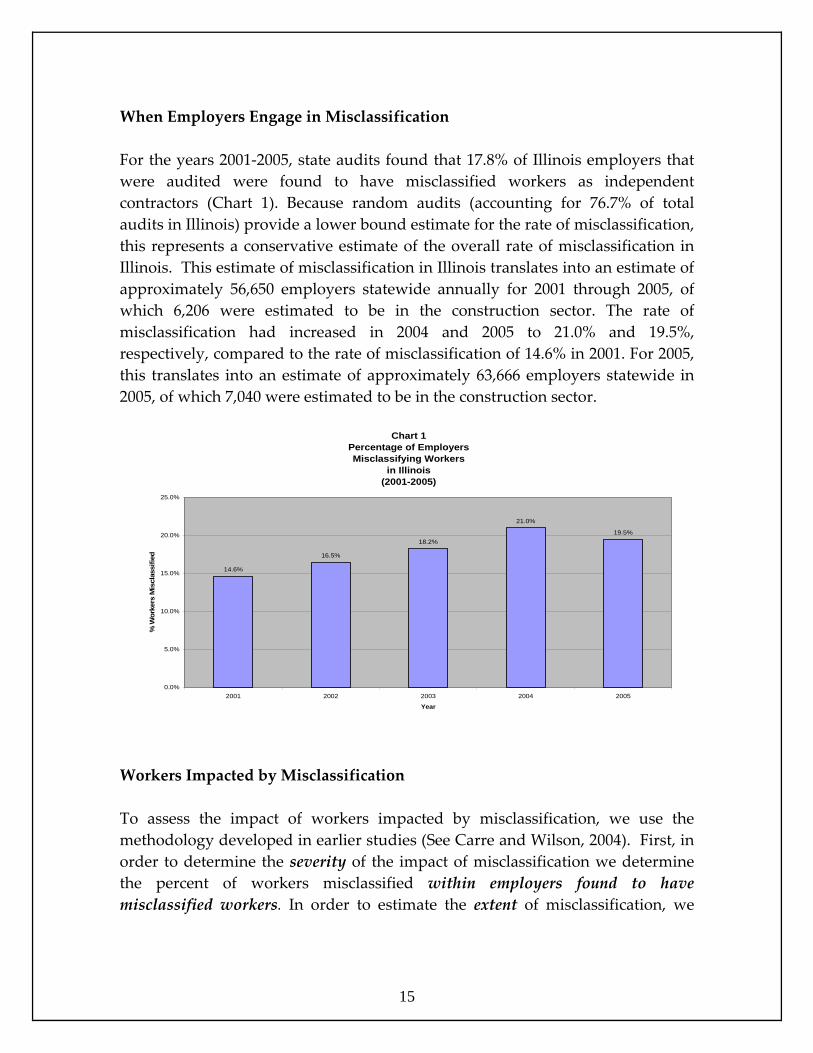
When Employers Engage in Misclassification For the years 2001‐2005, state audits found that 17.8% of Illinois employers that were audited were found to have misclassified workers as independent contractors (Chart 1). Because random audits (accounting for 76.7% of total audits in Illinois) provide a lower bound estimate for the rate of misclassification, this represents a conservative estimate of the overall rate of misclassification in Illinois. This estimate of misclassification in Illinois translates into an estimate of approximately 56,650 employers statewide annually for 2001 through 2005, of which 6,206 were estimated to be in the construction sector. The rate of misclassification had increased in 2004 and 2005 to 21.0% and 19.5%, respectively, compared to the rate of misclassification of 14.6% in 2001. For 2005, this translates into an estimate of approximately 63,666 employers statewide in 2005, of which 7,040 were estimated to be in the construction sector.
Chart 1Percentage of Employers Misclassifying Workers
in Illinois (2001-2005)
14.6%
16.5%
18.2%
21.0%
19.5%
0.0%
5.0%
10.0%
15.0%
20.0%
25.0%
2001 2002 2003 2004 2005
Year
% W
orke
rs M
iscl
assi
fied
Workers Impacted by Misclassification
15
To assess the impact of workers impacted by misclassification, we use the methodology developed in earlier studies (See Carre and Wilson, 2004). First, in order to determine the severity of the impact of misclassification we determine the percent of workers misclassified within employers found to have misclassified workers. In order to estimate the extent of misclassification, we
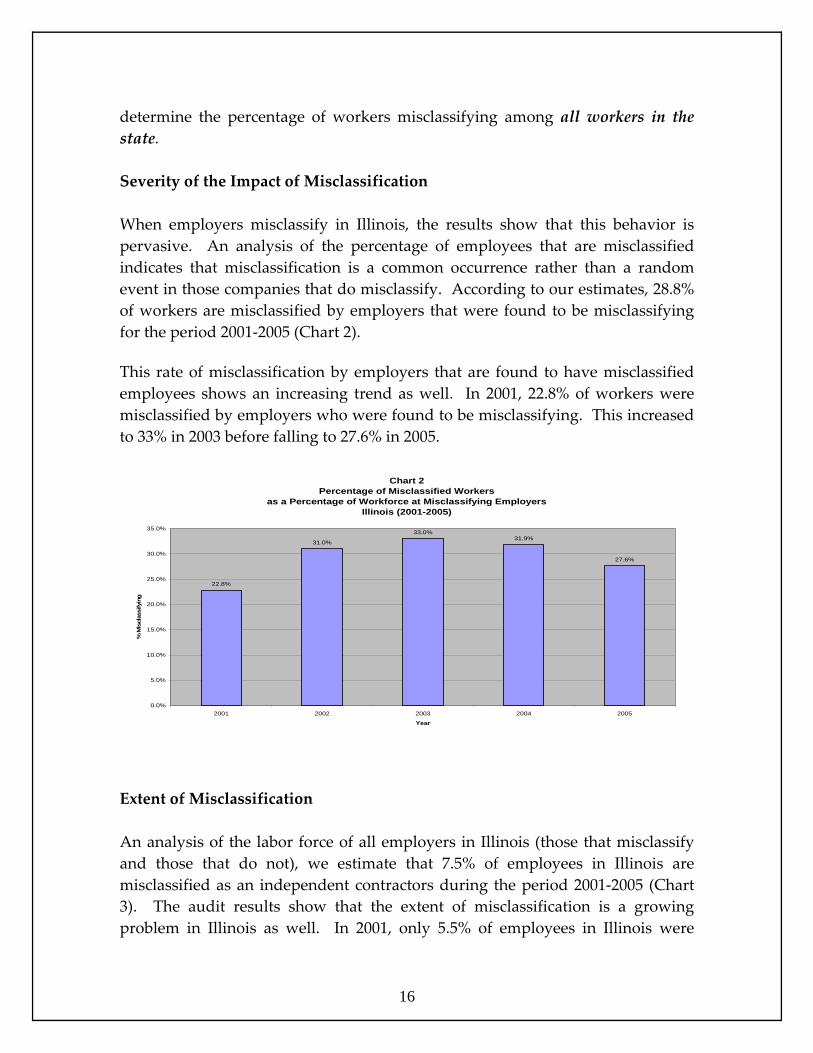
determine the percentage of workers misclassifying among all workers in the state. Severity of the Impact of Misclassification When employers misclassify in Illinois, the results show that this behavior is pervasive. An analysis of the percentage of employees that are misclassified indicates that misclassification is a common occurrence rather than a random event in those companies that do misclassify. According to our estimates, 28.8% of workers are misclassified by employers that were found to be misclassifying for the period 2001‐2005 (Chart 2). This rate of misclassification by employers that are found to have misclassified employees shows an increasing trend as well. In 2001, 22.8% of workers were misclassified by employers who were found to be misclassifying. This increased to 33% in 2003 before falling to 27.6% in 2005.
Chart 2Percentage of Misclassified Workers
as a Percentage of Workforce at Misclassifying EmployersIllinois (2001-2005)
31.0%
33.0%31.9%
27.6%
22.8%
0.0%
5.0%
10.0%
15.0%
20.0%
25.0%
30.0%
35.0%
2001 2002 2003 2004 2005
Year
% M
iscl
assi
fyin
g
Extent of Misclassification
16
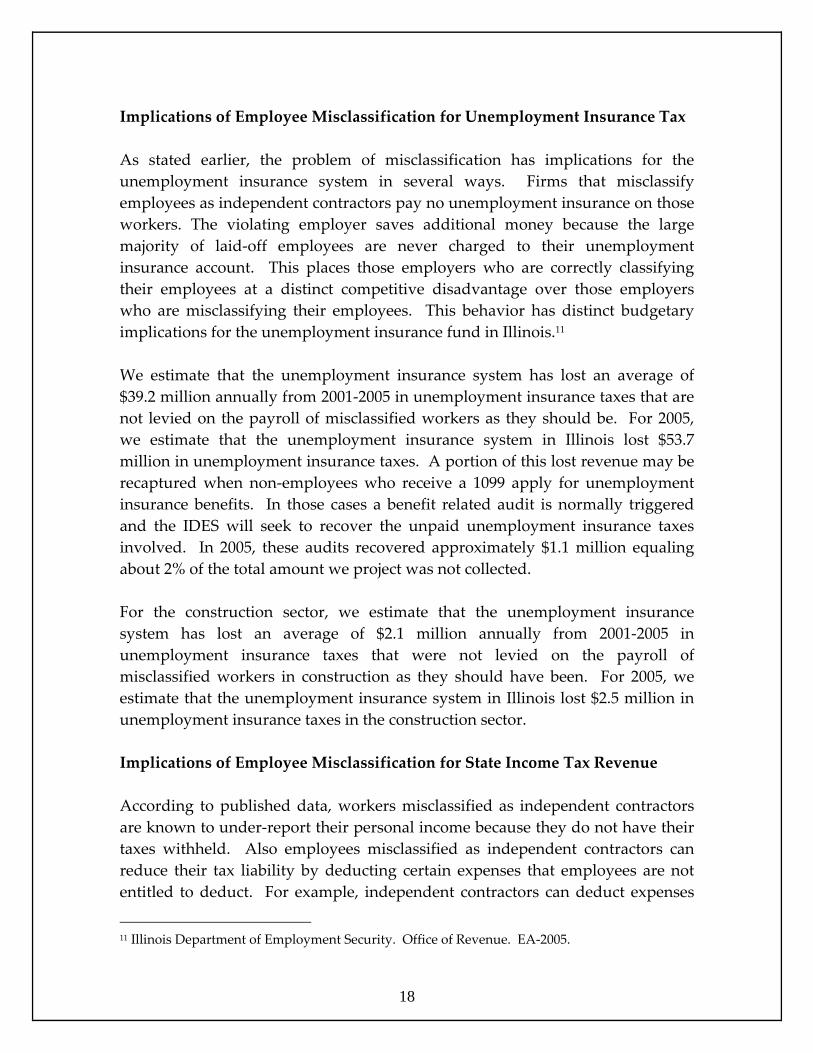
An analysis of the labor force of all employers in Illinois (those that misclassify and those that do not), we estimate that 7.5% of employees in Illinois are misclassified as an independent contractors during the period 2001‐2005 (Chart 3). The audit results show that the extent of misclassification is a growing problem in Illinois as well. In 2001, only 5.5% of employees in Illinois were
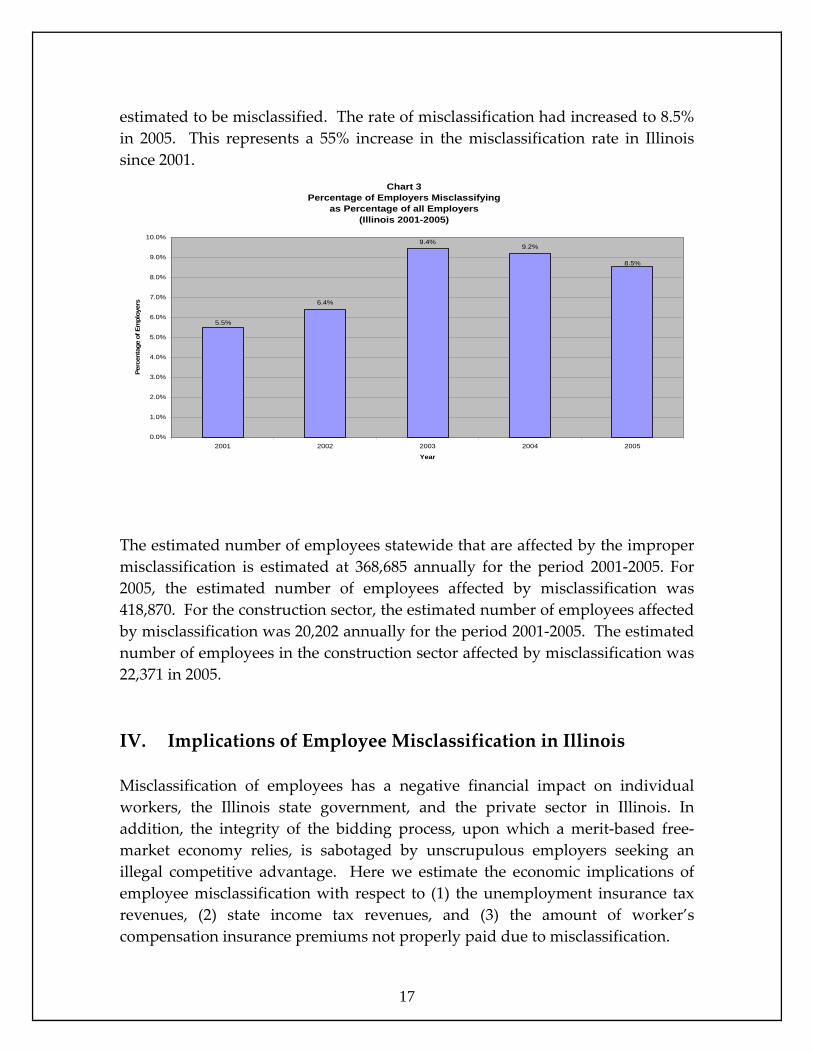
estimated to be misclassified. The rate of misclassification had increased to 8.5% in 2005. This represents a 55% increase in the misclassification rate in Illinois since 2001.
Chart 3Percentage of Employers Misclassifying
as Percentage of all Employers(Illinois 2001-2005)
6.4%
9.4%9.2%
8.5%
5.5%
0.0%
1.0%
2.0%
3.0%
4.0%
5.0%
6.0%
7.0%
8.0%
9.0%
10.0%
2001 2002 2003 2004 2005
Year
Perc
enta
ge o
f Em
ploy
ers
The estimated number of employees statewide that are affected by the improper misclassification is estimated at 368,685 annually for the period 2001‐2005. For 2005, the estimated number of employees affected by misclassification was 418,870. For the construction sector, the estimated number of employees affected by misclassification was 20,202 annually for the period 2001‐2005. The estimated number of employees in the construction sector affected by misclassification was 22,371 in 2005. IV. Implications of Employee Misclassification in Illinois
17
Misclassification of employees has a negative financial impact on individual workers, the Illinois state government, and the private sector in Illinois. In addition, the integrity of the bidding process, upon which a merit‐based free‐market economy relies, is sabotaged by unscrupulous employers seeking an illegal competitive advantage. Here we estimate the economic implications of employee misclassification with respect to (1) the unemployment insurance tax revenues, (2) state income tax revenues, and (3) the amount of worker’s compensation insurance premiums not properly paid due to misclassification.
Implications of Employee Misclassification for Unemployment Insurance Tax As stated earlier, the problem of misclassification has implications for the unemployment insurance system in several ways. Firms that misclassify employees as independent contractors pay no unemployment insurance on those workers. The violating employer saves additional money because the large majority of laid‐off employees are never charged to their unemployment insurance account. This places those employers who are correctly classifying their employees at a distinct competitive disadvantage over those employers who are misclassifying their employees. This behavior has distinct budgetary implications for the unemployment insurance fund in Illinois.11 We estimate that the unemployment insurance system has lost an average of $39.2 million annually from 2001‐2005 in unemployment insurance taxes that are not levied on the payroll of misclassified workers as they should be. For 2005, we estimate that the unemployment insurance system in Illinois lost $53.7 million in unemployment insurance taxes. A portion of this lost revenue may be recaptured when non‐employees who receive a 1099 apply for unemployment insurance benefits. In those cases a benefit related audit is normally triggered and the IDES will seek to recover the unpaid unemployment insurance taxes involved. In 2005, these audits recovered approximately $1.1 million equaling about 2% of the total amount we project was not collected. For the construction sector, we estimate that the unemployment insurance system has lost an average of $2.1 million annually from 2001‐2005 in unemployment insurance taxes that were not levied on the payroll of misclassified workers in construction as they should have been. For 2005, we estimate that the unemployment insurance system in Illinois lost $2.5 million in unemployment insurance taxes in the construction sector. Implications of Employee Misclassification for State Income Tax Revenue According to published data, workers misclassified as independent contractors are known to under‐report their personal income because they do not have their taxes withheld. Also employees misclassified as independent contractors can reduce their tax liability by deducting certain expenses that employees are not entitled to deduct. For example, independent contractors can deduct expenses
18
11 Illinois Department of Employment Security. Office of Revenue. EA‐2005.
for automobiles, homes, medical insurance, retirement plans, and business trips. As a result, Illinois suffers a loss of state income tax revenue. According to published IRS figures, wage earners report 99% of their wages. Non‐wage earners report approximately 68% of their income. This represents a gap of 31% in reported income. Other estimates report the gap as high as 50%. The IRS reports that when informational returns (e.g. 1099 Miscellaneous Income) are examined, misclassified workers reported 77% of that income on their tax returns, but reported only 29% of the income not covered by informational returns (e.g. wages paid in cash).12 The State of Illinois imposes a flat 3.0% income tax on income. We assume that personal exemptions and federal exemptions are fully incorporated into their reported tax returns and we do not apply these exemptions to unreported income. We also do not report the loss in federal tax revenue which would be even much more substantial as well. We present two estimates for lost income taxes. The first estimate is based upon the assumption that 30% of the income of misclassified workers is not reported; our second estimate is based upon the assumption that 50% of the income of misclassified workers is not reported. For our calculations with respect to lost state revenues, we estimated the annual earnings of all misclassified workers in the State of Illinois and the annual earnings of construction workers in the State of Illinois.13 Based upon an estimate that 30% of the income of misclassified workers is not reported, we estimate that an average of $124.7 million of Illinois income tax was lost annually during the period of 2001 through 2005 due to unreported income. For 2005 itself, we estimate that $149.0 million of Illinois income tax was lost. In the construction sector, we estimate that an average of $8.9 million of Illinois income tax was lost annually for 2001‐2005. For the year 2005, we estimate that $10.4 million of Illinois income tax was lost from construction sector income.
12 Tax Administration. Issues in Classifying Workers as Employees or Independent Contractors. United States General Accounting Office. GAO/T‐GGD‐96‐130.
19
13 We obtained the average annual earnings for workers across all industries from the United States Department of Labor, Bureau of Labor Statistics. November 2004 State Occupational Employment and Wage Estimates. State of Illinois (http://www.bls.gov/oes/current/eos_il.htm.) The mean annual earnings in 2004 was $38,580. We adjusted the earnings for other years using the Employment Cost Index from the Bureau of Labor Statistics. Series ID: ECS20002I. For the construction sector, the mean annual earnings in 2004 in Illinois was $49,950. We adjusted the earning for other years using the Employment Cost Index from the Bureau of Labor Statistics: Series ID: ECS22302I.
Based upon an estimate that 50% of the income of misclassified workers is not reported, we estimate that an average of $207.8 million of Illinois income tax was lost annually during the period of 2001 through 2005 due to unreported income. For 2005 itself, we estimate that $248.4 million of Illinois income tax was lost. In the construction sector, we estimate that $14.8 million of Illinois income tax was lost annually during 2001‐2005. For 2005 itself, we estimate that $17.3 million of Illinois income tax was lost from construction sector income. Implications of Employee Misclassification for Worker Compensation Misclassification also impacts worker’s compensation insurance. Among other effects, the costs are higher for employers that follow the rules, placing them at a distinct disadvantage. It has been reported (Planmatics, 2000) that the cost of worker’s compensation insurance premiums is the primary reason why employers misclassify. Misclassification offers employers an opportunity to avoid paying the high cost of these insurance premiums. This allows those employers who misclassify employees as independent contractors the ability to underbid employers who correctly classify workers as employees. Therefore, in the construction sector, workers compensation premium costs have increasingly fallen on those contractors who classify their employees appropriately. It has also been reported that after an injury has occurred many independent contractors are simply converted to employee status in order to obtain coverage under the company’s worker’s compensation policy, resulting in payment of benefits even though premiums were not collected.14 According to the Fiscal Year 2004 Report of the Illinois Worker’s Compensation Commission, the average worker’s compensation statewide premium rate was $2.65 per $100 of payroll. Based upon published worker’s compensation premium rates, we estimate that from 2001 through 2005, an annual average of $95.9 million of premiums were not properly paid for misclassified workers. For the year 2005, we estimate this annual amount was $97.9 million of worker’s compensation insurance premiums that were not properly paid. When these annual premiums are not paid by those employers who misclassify, it results in raising the premiums that are charged to those employers who do correctly classify their employees.
20
14 “Reconversion from IC [Independent Contractor] to employee status also occurs in order to avoid paying high worker’s compensation premiums...[in California]...This practice was prevalent in the other states also.” (p. 30); and, “...the retroactive use of workers’ compensation [when they are injured]...The insurers have to pay benefits for workers they never received premiums for.” (p. 76). Planmatics (2000)
Worker’s compensation premiums are much higher in the construction industry. As reported, the statewide rate for all industries is less than $3.00 per $100 of payroll. However, within the construction trades, the rates can range from $8.01 per $100 of payroll for electrical wiring to $29.94 per $100 of payroll for concrete construction in Illinois.15 We present two estimates for worker’s compensation premiums in construction trades in Illinois based upon (1) a rate of $10 per $100 of payroll and (2) a rate of $15 per $100 of payroll. Based upon a rate of $10 per $100, we estimate the annual cost shift of premiums to be $23.2 million. Based upon a rate of $15 per $100, we estimate the annual cost shift in premiums to be $34.8 million. Again, annual premiums not paid by misclassifying employers may result in an increase of premiums paid by employers who classify their employees correctly. V. Comparison of Illinois Estimates with Other States. The low estimates presented in Table 1 are generally based upon random audits, where the rate of misclassification is lowest. With high levels of random audits, it is reported that from 90%‐100% of the audit group was randomly sampled. This places the estimates of misclassification in this group in a range from 5‐14%. The moderate estimates presented in Table 1 are based upon a range of audit types, ranging from random to non‐random. With moderate levels of random audits, it was reported that from 50%‐56% of the audit group was randomly audited. The estimates of misclassification in this group range from 12%‐23%. The high estimates presented in Table 1 are based primarily upon non‐random audits. With low levels of random audits, it was report than from 1%‐18% of the audit group was randomly audited. For all industries reported in Illinois, the rate of misclassification was 17.4%, with 76.6% of those audited randomly selected. VI. Conclusions Our study is a first step toward illustrating the dimensions of and the negative economic impacts associated with the problem of employer misclassification in the State of Illinois. Our study has confirmed the fact that misclassification is a severe and growing problem which impacts the public and private sectors in
21
15 Oregon Workers’ Compensation Premium Rate Ranking ‐ Calendar Year 2004. Appendix 4.
Illinois. We have shown that misclassification has direct and significant impacts on workers, employers, taxpayers and markets. By gaining access to de‐identified individual tax audit files, future analysis would be able to project revenue losses by specific industry sectors which would allow the Illinois Department of Employment Security to target their resources effectively toward those sectors where the problem of misclassification is most acute. One factor involved in calculating the extent of economic costs related to misclassification in Illinois concerns the three different definitions utilized for determining “independent contractor” status by the Illinois Department of Employment Security, the Illinois Department of Revenue and the Illinois Worker’s Compensation Commission. In other states, this kind of discrepancy has been found to hinder efforts for reform. An attempt to bring these varying definitions into alignment would be preferred. We believe we have shown that workers, businesses, revenue collection agencies, and policy analysts in Illinois will benefit from better documentation on misclassification in Illinois. Furthermore, it seems reasonable to suggest that public officials devote special attention to those employers who intentionally and/or repeatedly violate state statutes regarding misclassification. As a beginning, we recommend the following steps for consideration by policy makers and public officials in Illinois: (1) the Legislature empower the IDES to perform “targeted” audits on problem employers like those done in other states,16 (2) develop meaningful penalties to deter those employers who intentionally and/or repeatedly violate state laws on misclassification, (3) seek to align the three different definitions for what constitutes an “independent contractor” currently applied by the IDES, the Department of Revenue and the Worker’s Compensation Commission, and (4) review current authorities and procedures for the sharing of information among state agencies so that violations of state statutes will receive a comprehensive and coordinated response with the intent of recovering all payroll‐related funds that are due and of deterring future willful violations.
22
16 Targeted audits are those audits identified where a higher degree of misclassification may be observed. For example, targeted audits might be audits of employers with (1) delinquent filings or (2) multiple delinquent quarters of unemployment insurance due. Planmatics (2000) encouraged states to maintain audit selection criteria that reflect potential noncompliance (e.g. high employee turnover, type of industry, and prior reporting history).
23
Unemployment Insurance Audit Statistics and Audit Definitions for Illinois *
2001 2002 2003 2004 2005
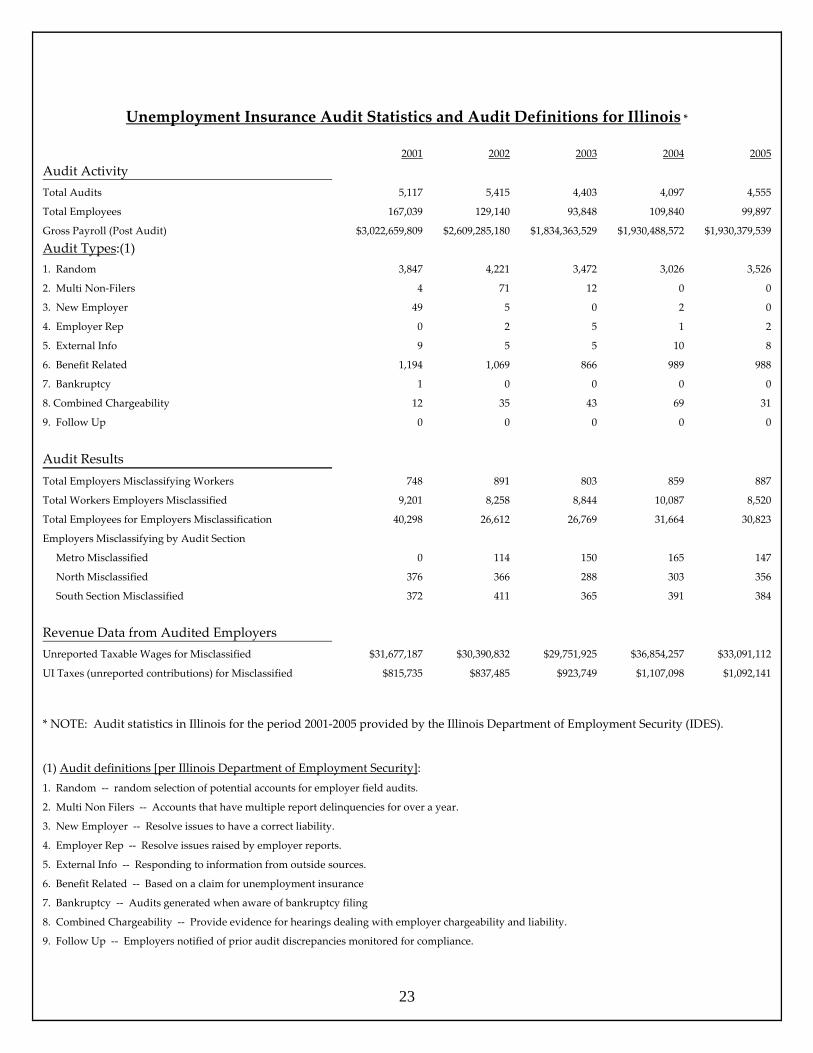
Audit Activity Total Audits 5,117 5,415 4,403 4,097 4,555
Total Employees 167,039 129,140 93,848 109,840 99,897
Gross Payroll (Post Audit) $3,022,659,809 $2,609,285,180 $1,834,363,529 $1,930,488,572 $1,930,379,539
Audit Types:(1) 1. Random 3,847 4,221 3,472 3,026 3,526
2. Multi Non‐Filers 4 71 12 0 0
3. New Employer 49 5 0 2 0
4. Employer Rep 0 2 5 1 2
5. External Info 9 5 5 10 8
6. Benefit Related 1,194 1,069 866 989 988
7. Bankruptcy 1 0 0 0 0
8. Combined Chargeability 12 35 43 69 31
9. Follow Up 0 0 0 0 0
Audit Results Total Employers Misclassifying Workers 748 891 803 859 887
Total Workers Employers Misclassified 9,201 8,258 8,844 10,087 8,520
Total Employees for Employers Misclassification 40,298 26,612 26,769 31,664 30,823
Employers Misclassifying by Audit Section
Metro Misclassified 0 114 150 165 147
North Misclassified 376 366 288 303 356
South Section Misclassified 372 411 365 391 384
Revenue Data from Audited Employers Unreported Taxable Wages for Misclassified $31,677,187 $30,390,832 $29,751,925 $36,854,257 $33,091,112
UI Taxes (unreported contributions) for Misclassified $815,735 $837,485 $923,749 $1,107,098 $1,092,141
* NOTE: Audit statistics in Illinois for the period 2001‐2005 provided by the Illinois Department of Employment Security (IDES).
(1) Audit definitions [per Illinois Department of Employment Security]:
1. Random ‐‐ random selection of potential accounts for employer field audits.
2. Multi Non Filers ‐‐ Accounts that have multiple report delinquencies for over a year.
3. New Employer ‐‐ Resolve issues to have a correct liability.
4. Employer Rep ‐‐ Resolve issues raised by employer reports.
5. External Info ‐‐ Responding to information from outside sources.
6. Benefit Related ‐‐ Based on a claim for unemployment insurance
7. Bankruptcy ‐‐ Audits generated when aware of bankruptcy filing
8. Combined Chargeability ‐‐ Provide evidence for hearings dealing with employer chargeability and liability.
9. Follow Up ‐‐ Employers notified of prior audit discrepancies monitored for compliance.
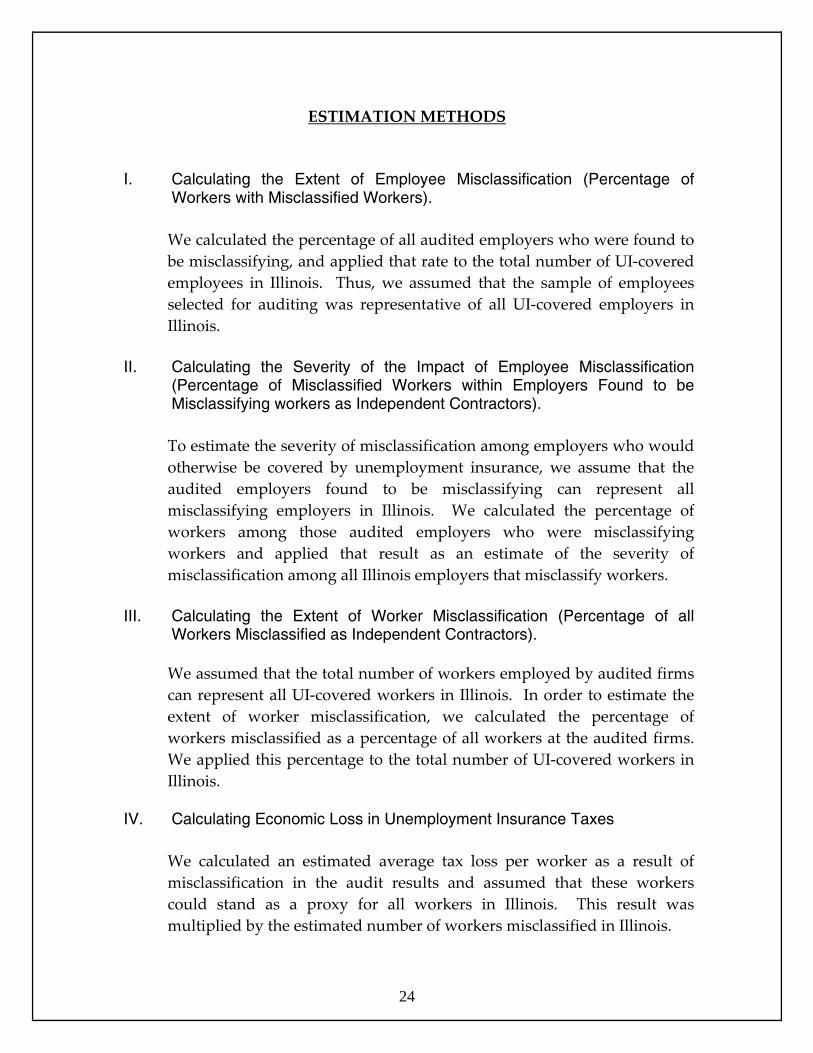
ESTIMATION METHODS
I. Calculating the Extent of Employee Misclassification (Percentage of Workers with Misclassified Workers).
We calculated the percentage of all audited employers who were found to be misclassifying, and applied that rate to the total number of UI‐covered employees in Illinois. Thus, we assumed that the sample of employees selected for auditing was representative of all UI‐covered employers in Illinois.
II. Calculating the Severity of the Impact of Employee Misclassification
(Percentage of Misclassified Workers within Employers Found to be Misclassifying workers as Independent Contractors).
To estimate the severity of misclassification among employers who would otherwise be covered by unemployment insurance, we assume that the audited employers found to be misclassifying can represent all misclassifying employers in Illinois. We calculated the percentage of workers among those audited employers who were misclassifying workers and applied that result as an estimate of the severity of misclassification among all Illinois employers that misclassify workers.
III. Calculating the Extent of Worker Misclassification (Percentage of all
Workers Misclassified as Independent Contractors).
We assumed that the total number of workers employed by audited firms can represent all UI‐covered workers in Illinois. In order to estimate the extent of worker misclassification, we calculated the percentage of workers misclassified as a percentage of all workers at the audited firms. We applied this percentage to the total number of UI‐covered workers in Illinois.
24
IV. Calculating Economic Loss in Unemployment Insurance Taxes
We calculated an estimated average tax loss per worker as a result of misclassification in the audit results and assumed that these workers could stand as a proxy for all workers in Illinois. This result was multiplied by the estimated number of workers misclassified in Illinois.
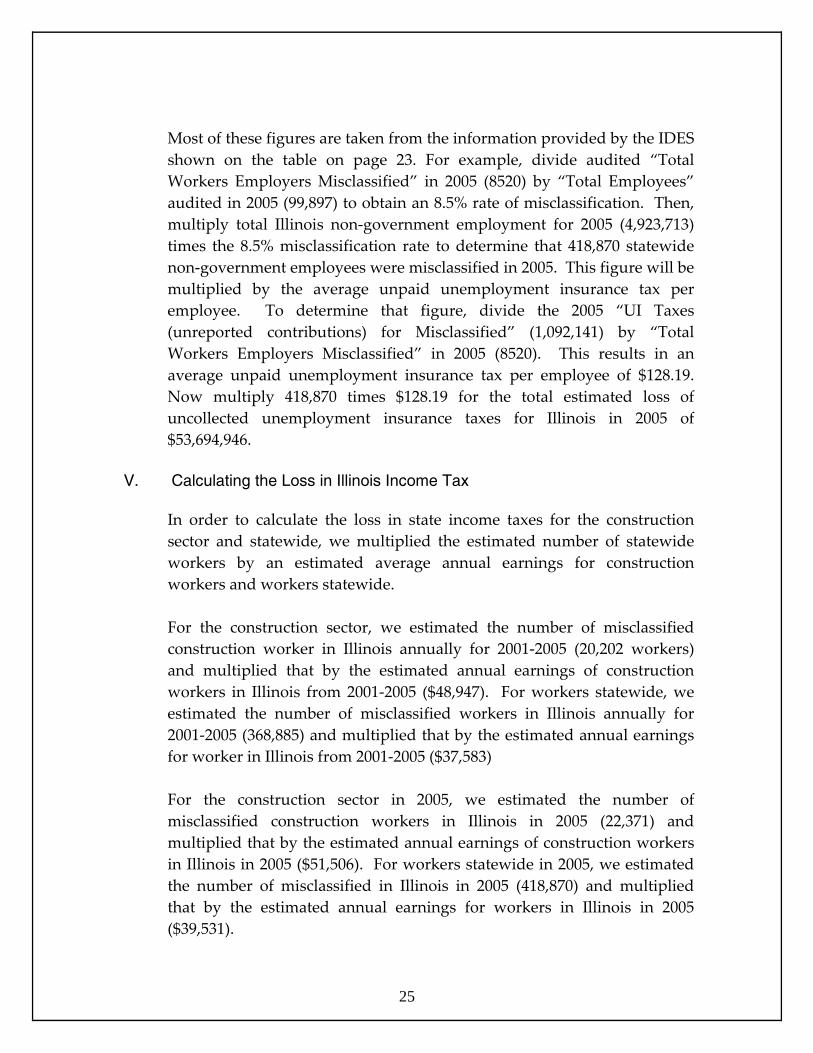
Most of these figures are taken from the information provided by the IDES shown on the table on page 23. For example, divide audited “Total Workers Employers Misclassified” in 2005 (8520) by “Total Employees” audited in 2005 (99,897) to obtain an 8.5% rate of misclassification. Then, multiply total Illinois non‐government employment for 2005 (4,923,713) times the 8.5% misclassification rate to determine that 418,870 statewide non‐government employees were misclassified in 2005. This figure will be multiplied by the average unpaid unemployment insurance tax per employee. To determine that figure, divide the 2005 “UI Taxes (unreported contributions) for Misclassified” (1,092,141) by “Total Workers Employers Misclassified” in 2005 (8520). This results in an average unpaid unemployment insurance tax per employee of $128.19. Now multiply 418,870 times $128.19 for the total estimated loss of uncollected unemployment insurance taxes for Illinois in 2005 of $53,694,946.
25
V. Calculating the Loss in Illinois Income Tax In order to calculate the loss in state income taxes for the construction sector and statewide, we multiplied the estimated number of statewide workers by an estimated average annual earnings for construction workers and workers statewide. For the construction sector, we estimated the number of misclassified construction worker in Illinois annually for 2001‐2005 (20,202 workers) and multiplied that by the estimated annual earnings of construction workers in Illinois from 2001‐2005 ($48,947). For workers statewide, we estimated the number of misclassified workers in Illinois annually for 2001‐2005 (368,885) and multiplied that by the estimated annual earnings for worker in Illinois from 2001‐2005 ($37,583) For the construction sector in 2005, we estimated the number of misclassified construction workers in Illinois in 2005 (22,371) and multiplied that by the estimated annual earnings of construction workers in Illinois in 2005 ($51,506). For workers statewide in 2005, we estimated the number of misclassified in Illinois in 2005 (418,870) and multiplied that by the estimated annual earnings for workers in Illinois in 2005 ($39,531).
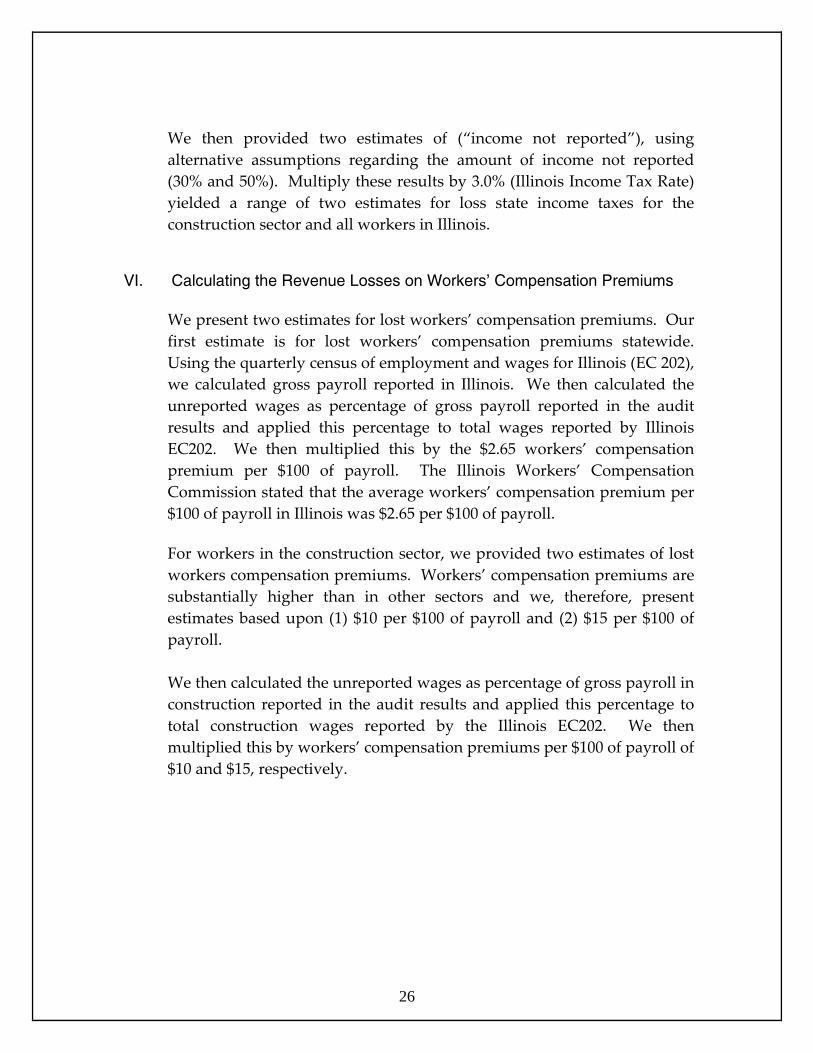
We then provided two estimates of (“income not reported”), using alternative assumptions regarding the amount of income not reported (30% and 50%). Multiply these results by 3.0% (Illinois Income Tax Rate) yielded a range of two estimates for loss state income taxes for the construction sector and all workers in Illinois.
26
VI. Calculating the Revenue Losses on Workers’ Compensation Premiums
We present two estimates for lost workers’ compensation premiums. Our first estimate is for lost workers’ compensation premiums statewide. Using the quarterly census of employment and wages for Illinois (EC 202), we calculated gross payroll reported in Illinois. We then calculated the unreported wages as percentage of gross payroll reported in the audit results and applied this percentage to total wages reported by Illinois EC202. We then multiplied this by the $2.65 workers’ compensation premium per $100 of payroll. The Illinois Workers’ Compensation Commission stated that the average workers’ compensation premium per $100 of payroll in Illinois was $2.65 per $100 of payroll. For workers in the construction sector, we provided two estimates of lost workers compensation premiums. Workers’ compensation premiums are substantially higher than in other sectors and we, therefore, present estimates based upon (1) $10 per $100 of payroll and (2) $15 per $100 of payroll. We then calculated the unreported wages as percentage of gross payroll in construction reported in the audit results and applied this percentage to total construction wages reported by the Illinois EC202. We then multiplied this by workers’ compensation premiums per $100 of payroll of $10 and $15, respectively.

RE FERENCES
1. Carre, Francois, PhD. and Randall Wilson. Center for Social Policy. J.W. McCormick Graduate School of Public Policy Studies. The Social and Economic Costs of Employee Misclassification in Construction. Elaine Bernard, PhD. And Robert Herrick, ScD. Principal Investigators. December 17, 2004.
2. Carre, Francois, PhD. and Randall Wilson. Center for Social Policy. J.W.
McCormick Graduate School of Public Policy Studies. The Social and Economic Costs of Employee Misclassification in Maine Construction Industry. Elaine Bernard, PhD. And Robert Herrick, ScD. Principal Investigators. April 25, 2005.
3. General Accounting Office. Taxpayer Compliance: Analyzing the Nature of
the Income Tax Gap. GAO/T‐GGD‐97‐35. 4. General Accounting Office. Tax Compliance: Reducing the tax Gap Can
Contribute to Fiscal Sustainability but Will Require a Variety of Strategies. GAO‐05‐527T.
5. General Accounting Office. Tax Administration: Informational Returns Can
be Used to Identify Employers Who Misclassify Workers. GAO‐GGD‐89‐107. 6. General Accounting Office. Tax Administration: Issues in Classifying
Workers as Employees or Independent Contractors. GAO/T‐GGD‐96‐130. 7. Illinois Department of Employment Security. Audit Statistics for the Period
2001‐2005. 8. Illinois Department of Employment Security. Fast Facts for Employers.
www.ides.state.il.us. 9. Illinois Department of Employment Security. Quarterly Census of
Employment & Wages (ES 202).
27
10. Illinois Department of Employment Security. The Unemployment Insurance Trust Fund. August 19, 2004.
11. Illinois Department of Employment Security. Wage Data 2006. 12. Illinois Workers’ Compensation Commission. FY04 Annual Report. 13. National Academy of Social Insurance. Workers’ Compensation: Benefits,
Coverage, and Costs, 2003. July, 2005. Washington, D.C. 14. National Academy of Social Insurance. Sources and Methods: A
Companion to: Workers’ Compensation: Benefits, Coverage, and Costs, 2003. July, 2005. Washington, D.C.
15. National Employment Law Project. The Whole Truth: Employer Fraud and
Error in the UI System. A Special Report by the National Employment Law Project. December, 2003.
16. National Employment Law Project. Financing Unemployment Insurance in
Illinois. May 16, 2003. 17. Oregon Department of Consumer and Business Services. Oregon Workers’
Compensation Premium Rate Ranking Calendar Year 2004. May 2005. 18. Planmatics, Inc. For the U.S. Department of Labor – Employment and
Training Administration. Independent Contractors: Prevalence and Implications for Unemployment Insurance Programs. February, 2000.
19. Social Security Administration. Social Security Bulletin. Volume 65.
Number 4. 2003/2004. 20. State Individual Income Tax Rates. www.taxadmin.org/fta/rate/ind_
inc.html. 21. The Commonwealth Fund. The Costs and Consequences of Being Uninsured.
Commonwealth Fund Publication #663. 22. United States Department of Labor. Employment & Training
Administration. www.doleta.gov.
28
23. United States Department of Labor. Employment by Industry Division: 1994, 2004, 2014.
24. United States Department of Labor. November 2004 State Occupational
Employment and Wage Estimates. Illinois. www.bls.gov/oes/current /oes_il.htm.
25. United States Department of Labor. Employed Workers with Alternative and
Traditional Work Arrangements by Occupation Industry. www.bls.gov. news.release/conemp.t08.htm.
26. United States Chamber of Commerce. Analysis of Workers’
Compensation Laws. 2004. 27. United States Department of Labor. Employment Cost Index. Series ID
ECS20002I. 28. United States Department of Labor. Employment Cost Index. Series ID:
ECS22302I.
29
29. United States Census Bureau. County Business Patterns. Illinois: 2003. CBP/03‐15.