Embed Size (px)
Citation preview

The Economic Benefits of Recycling
in Virginia
Alexander P. Miller
Hang T. Nguyen
Samantha D. Sifleet
A Study
By the Thomas Jefferson Program in Public Policy
At the College of William and Mary
For the Virginia Department of Environmental Quality

2
Acknowledgements
We would like to first thank Dr. David Finifter of the College of William & Mary for his role as
a constant point of reference throughout this endeavor.
We are grateful for our contacts at the Virginia Department of Environmental Quality, Dr. Vijay
Satyal and Mr. Stephen Coe. We appreciate the time they spent advising us, including travelling
to meet with us at multiple occasions.
We would also like to thank Dr. Lou Rossiter and our colleagues at the Thomas Jefferson
Program in Public Policy who assisted us in numerous ways concerning this project.
Lastly, we would like to thank those who assisted us in gathering our data, especially Mr. Tim
Kestner of the Virginia Employment Commission, Ms. Ann Battle of the Virginia Economic
Development Partnership, and the recycling contacts from the participating Solid Waste Planning
Units discussed in this study.

3
Table of Contents
Executive Summary ____________________________________________________ 6
Introduction___________________________________________________________ 8
Purpose of the Project __________________________________________________ 9
Design of the Study ____________________________________________________ 10
Literature Review _____________________________________________________ 12
Socioeconomic Determinants of Recycling _______________________________ 12
State Reports _______________________________________________________ 13
���� North Carolina _______________________________________________ 14
���� Southern States _______________________________________________ 15
���� Michigan ____________________________________________________ 16
���� Northeast Recycling Council (NERC)_____________________________ 16
���� Massachusetts ________________________________________________ 18
���� Pennsylvania _________________________________________________ 19
���� California____________________________________________________ 20
���� Iowa ________________________________________________________ 21
The Recycling Industry in Virginia_______________________________________ 22
Methodology _______________________________________________________ 22
Analysis ___________________________________________________________ 26
Determinants of Recycling Performance in Virginia ________________________ 39
Methodology _______________________________________________________ 39
Summary statistics __________________________________________________ 42
���� Urban vs. Rural SWPUs________________________________________ 46
���� Response vs. Non-response SWPUs_______________________________ 49
Multivariate Regression Results _______________________________________ 51
Policy Recommendations _______________________________________________ 60
Public sector recommendations________________________________________ 60
Private sector recommendations – future research ________________________ 61
APPENDIX __________________________________________________________ 63
REFERENCES AND WORKS CITED ___________________________________ 70

4
List of Tables
Table 1: Six Industry Sectors within the Recycling Industry as a Whole ___________ 22
Table 2: Average Number of Employees within VEC Firm Size Classes ___________ 24
Table 3: 2002 Summary of the Recycling Industry in Virginia ___________________ 26
Table 4: Average Salary in the Recycling Industry in Virginia in 2002 ____________ 26
Table 5: Gross Revenue in the Recycling Industry in Virginia 2002 _______________ 27
Table 6: Employment in the Recycling Industry in Virginia 2002_________________ 28
Table 7: Businesses in the Recycling Industry in Virginia in 2002 ________________ 28
Table 8: Comparison of VEC Projected Growth Rates and Calculated Annual Growth Rates for
Industry Subsectors within the Recycling Industry in Virginia ___________________ 29
Table 9: 2006 Projected Revenue and Recycling Employment ___________________ 31
Table 10: 2007 Revenue and Employment Projections _________________________ 32
Table 11: Estimates of 2006 Personal Income in the Recycling Industry in Virginia __ 38
Table 12: Urban vs. Rural SWPUs (by US Census Bureau definition of urban) ______ 46
Table 13: Urban vs. Rural SWPUs (by Virginia definition of urban) ______________ 47
Table 14: Response vs. Non-response SWPUs________________________________ 49
Table 15: Descriptive Statistics ___________________________________________ 51
Table 16: Determinants of Recycling Performance – Interpretation of Key Results ___ 54
Table 17: Determinants of Recycling Performance – Interpretation of Key Results ___ 55

5
List of Figures
Figure 1: Recycling Revenues in Virginia ___________________________________ 33
Figure 2: Industry Composition by Firm Size for Recyclable Material Merchant Wholesalers in
Virginia (2007) ________________________________________________________ 34
Figure 3: Industry Composition by Firm Size for Materials Recovery Facilities in Virginia
(2007) _______________________________________________________________ 35
Figure 4: Industry Composition by Firm size for Industrial Building Construction in Virginia
2007_________________________________________________________________ 35
Figure 5: Industry Composition by Firm Size for Paper Manufacturing in VA 2007 __ 36
Figure 6: Industry Composition by Firm Size for Solid Waste Collection in VA 2007_ 36
Figure 7: Industry Composition by Firm Size for Specialized Trucking in VA 2007 __ 37
Figure 8: Recycling Rate of Virginia 2003 - 2006 _____________________________ 43
Figure 9: Recycling Tonnage in Virginia 2003 - 2006__________________________ 43
Figure 10 : Recycling Rate Distribution Map of Virginia 2005 __________________ 44
Figure 11: Recycling Rate Distribution Map of Virginia 2006 ___________________ 45

6
Executive Summary
This report was created for the Virginia Department of Environmental Quality to provide
an overall economic analysis of recycling in Virginia. To begin, a review of the literature is
conducted. Specific attention is paid to the various studies analyzing the socioeconomic
determinants of recycling performance. Next, an in-depth characterization of similar state and
regional reports is made. It is within this framework that the two-pronged approach for this
study was developed. The first prong of the analysis focuses only on the private sector of the
Virginia recycling industry. The second prong of this analysis focuses only on the public sector
recycling efforts in Virginia.
The results of this study indicate that the recycling industry generates $1.9 billion dollars
in gross revenues every year and employs at least 8,000 people. This represents 0.6 % of the
Commonwealth’s gross domestic product (GDP)1 and 0.2% of Virginia’s total employment.
From the public sector research, it has been found that state funding has consistent positive
impacts on recycling efforts. Urban and highly populated areas are not only more likely to
recycle, but along with low income localities, they are able to use available funding most
efficiently due to the presence of economies of scale.2 While state dollars usually result in
higher recycling performance, the relationship between local budget and recycling performance
is less clear.
Some key results are shown below:
- An additional $10,000 allocated to a Solid Waste Planning Unit (SWPU) as state
funding is likely to lead to an additional 73,337 recycled tons increase.
1 The GDP of a country or a region is defined as the total market value of all final goods and services produced within a country or a region in a given period of time (usually a calendar year). 2 Economies of scale characterize a production process in which an increase in the scale of the firm causes a decrease in the long-run average cost of each unit.

7
- Being an urban SWPU is likely to have 10.53 more percentage point in recycling rate.
- An additional $10,000 allocated to an urban SWPU as state funding is likely to create
an additional 53,225 tons more recycled than allocate the same amount to a rural
SWPU.
Based on these analytical results, the following recommendations can be made. First, the
funding of urban, highly populated, and low income areas by the Commonwealth is highly
recommended. Also it is clear that local managers require more training to enhance budget
management and recycling techniques. Furthermore, the Commonwealth’s current units for
local recycling are too large. Smaller, more concentrated recycling planning units are
recommended.
Going forward, it is clear that future research needs to target the actual amount of
recycling activities occurring within the manufacturing and transportation sections of Virginia’s
recycling industry. Furthermore, an analysis of tax rates and revenues would be extremely
helpful in determining the relationship between state revenues generated by the recycling
industry and the funding the state spends on recycling programs.

8
Introduction
The U.S. is currently experiencing a crisis managing its waste. According to the
Environmental Protection Agency (EPA), the amount of waste each American creates has almost
doubled in the past four decades from 2.7 to 4.4 pounds per day.3 Because of this, there is a need
to build additional and larger landfills. Lobbying for the addition of landfills, however, is no
easy task. Citizens, by and large, have a “Not in my backyard!” mentality; they know there is a
need for one, but citizens are typically not willing to be a landfill’s neighbor. Landfill tipping
fees are increasing with the intention of discouraging landfill use, but this is, unfortunately, not
having a significant effect on the reduction of waste because recycling is, on average, still more
costly.
Recycling has served as a potential method to combat this problem. In 1999, recycling
and composting activities prevented about 64 million tons of material from ending up in landfills
and incinerators. Today, this country recycles 32.5 percent of its waste, a rate that has almost
doubled during the past 15 years.4 While recycling has grown in general, recycling of specific
materials has grown even more drastically: Fifty-two percent of all paper, 31 percent of all
plastic soft drink bottles, 45 percent of all aluminum beer and soft drink cans, 63 percent of all
steel packaging, and 67 percent of all major appliances are now recycled.5
Recycling in Virginia is following this steady growth rate evidenced by the nation as a
whole. Here, as elsewhere in the country, recycling is touted as an effective and practical
solution to waste. Virginians believe that it has the potential to conserve the Commonwealth’s
natural resources, reduce the need for landfills, and prevent future environmental degradation.
3 EPA (2007) 4 EPA (2007) 5 EPA (2007)

9
But could recycling also be degrading the state economy? Could Virginia be saving trees
and other materials at the cost of increasing unemployment? Are recycling programs in “the
Commonwealth” really designed for the common good?
For many who study recycling on the national level, the economic benefits are obvious.
According to the National Recycling Coalition (NRC), returning commodities to the stream of
commerce is a “value-adding, job-providing, and economy-spurring activity.”6 So, the NRC
claims that recycling saves a variety of resources—not only those that are “natural” to the Earth.
This study attempts to see if the conclusions from this national study hold true for
Virginia. Based on the socioeconomic variables it analyzes, the report also proposes strategies
for the Commonwealth to implement in order to maximize the economic benefits it reaps from
its recycling industry.
Purpose of the Project
In the fall of 2007, the Virginia Joint Legislative Audit and Review Committee
(JLARC) began a two-year study on waste minimization in Virginia. This study comes as a
mandate from the Commonwealth with the passage in early 2007 of Virginia Senate Joint
Resolution 361.
This resolution charges JLARC with the task of evaluating waste minimization, reuse,
and recycling in Virginia. According to JLARC, if current conditions continue, landfill capacity
in Virginia will be exceeded by 2023. However, less than seven percent of the material delivered
to the State's landfills is diverted for recycling or mulching.7
6 NRC 7 JLARC

10
The Virginia Department of Environmental Quality (DEQ) has requested that the Thomas
Jefferson Program in Public Policy at the College of William and Mary perform a preliminary
investigation into the state of recycling in Virginia.
The results from this study may be used as a reference for economic development
agencies, entrepreneurs, and financiers to understand and evaluate recycling businesses; a
reference for lawmakers to assist them in evaluating legislation that would affect recycling; a
tool for recycling advocates to increase understanding of the industry, promote awareness of
recycling and reuse, and target resources for growth; and a baseline of economic information to
document future growth and development of the industry.
Design of the Study
This report was designed to address two distinct research questions. The primary
question asks, “What is the value of the recycling industry in the Commonwealth of Virginia?”
The secondary question asks, “What are the determinants of the amount of recycling at the local
level?”
The design of this study was inspired by that of the 2001 report of the National Recycling
Coalition, which includes both the public and private sectors.8 Since the recycling industry is an
integrated network where the public and private sectors work together, this study is designed to
describe recycling activities in full. Therefore, the data were gathered from both public and
private organizations.
The body of this report is organized into four parts. The first portion of this study entails
a two-pronged approach to reviewing the available literature on this topic. This discussion is
8 National Recycling Coalition (2001).

11
designed to provide background to frame the analysis made in the report. This includes a review
of various state and federal recycling reports, as requested by the Virginia DEQ.
The second portion of this report details the methodology and results of an analysis of
the recycling industry in Virginia. This portion of the report is focused only on the private sector
of recycling in Virginia. The purpose of this section is to provide estimates of recycling related
to employment, revenue, and personal income within the Commonwealth of Virginia.
The third piece of this study includes the detailed econometric or multivariate analysis of
the socioeconomic determinants on local recycling performance in Virginia. These determinants
not only cover demographic variables (like population), but also budget variables (like state and
local funding). The goal of this portion of the study is to reveal what distinguishes SWPUs with
high recycling performance from those with low recycling performance.
Based on the analysis results presented in the second and the third sections, the fourth
part of this study will propose strategies to make state and local funding efforts more efficient
and outline future research needs.
12
Literature Review
Socioeconomic Determinants of Recycling
Recycling as a practice of waste minimization is a relatively young process in the United
States. The 1990s saw a dramatic rise in recycling rates across the country. An article
published in Public Works Management in 2000 addressed the issues behind the growth in
municipal recycling programs.9 The growth of recycling in the U.S. rose from a rate of 10% to
30% from 1990 to the turn of the new century.10 Kinnaman’s analysis identifies a lack of
accurate data as leading to the debate over the cause of the rising recycling rates.
The crux of this debate focuses on whether market or nonmarket factors can be identified
as the underlying cause. Kinnaman tackles the issue by conducting a cost-benefit analysis of a
municipal recycling program. While this analysis is clearly dated, it provides insights.
Kinnaman’s analysis suggests that municipal recycling programs are costly. The fundamental
question is then why does it remain popular? This article suggests that local governments could
be responding to households that perceive a benefit from recycling services.
In layman’s terms, Kinnaman acknowledges the idea that recycling programs function as
a public service boosting overall social welfare. Within this frame of reference, recycling
programs can be viewed as serving the same purpose of public parks, recreation areas, and public
events. These are similar public services that are costly yet supported by public funding. These
types of public services are viewed as a necessity by the community and are only able to exist
due to the presence and willingness of the government to provide public funds to sustain them.
9 Kinnaman (2000). 10 Recycling rate is definied as total tonnage of recycling divided by the total tonnage of solid waste collected.
13
According to a 1994 study performed by Gamba and Oskamp, relevant recycling
knowledge was the most significant predictor of observed recycling behavior. In this study
knowledge variables are related to recycling practices while attitudinal measures were used to
quantify political beliefs and opinions. Relevant recycling knowledge and a few specific
attitudinal measures were significant predictors of self-reported recycling behavior.11
Berger published a study in 1997 which shows that the size of residential area, the type of
dwelling, educational attainment, and household income are significant determinants of whether
recycling facilities are available and used. Analyses also show that environmental behaviors are
structured around specific environmental issues such as water, energy, or waste disposal and
suggest that recycling may operate as a first step toward the adoption of other behaviors.
Owens et. al in 2000 examined the demographic covariates of what Owens terms
“residential recycling efficiency.”12 Owens defines “recycling efficiency” as the weight of
recycled materials divided by the total weight of materials recycled plus recyclables discarded as
solid waste.13 In this study educational attainment, income level, and residential status (rent vs.
own) all had significant impacts on recycling efficiency.
State Reports
Senate Joint Resolution 361 directs JLARC to review reports from other U.S. states as it
evaluates the economics of recycling in Virginia. This study reviewed reports of six states as
well as two regions.
11 Gamba and Oskamp (1994). 12 Owens, Dickerson, and Macintosh (2000). 13 This is different from the term “recycling rate,” which is defined as total tonnage of recycling dived by the total tonnage of solid waste collected.

14
� North Carolina14
Nearly 12 million tons of municipal solid waste was generated in North Carolina in 1997,
and eight million tons were disposed of into a landfill. Construction and Demolition (C&D)
debris made up the largest component of the disposed waste (29 percent), and paper made up
another 18 percent. Organic materials comprised about 12 percent of the waste stream, and wood
made up 11 percent. All other materials each comprised 10 percent or less.
A conservative estimate of the total tonnage of material recycled in 1997 is 4.1 million
tons, which yields a 34 percent recycling rate. The last time the statewide recycling rate was
calculated, in 1995, it was estimated at 22 percent (2.1 million tons recycled and 7.6 million tons
disposed).
The recycling rates for specific commodities vary. Container recovery rates tend to be
low, especially for plastics. Although the paper recovery infrastructure is well established, there
is still room for growth in many grades, especially magazines, mixed and office paper. Some
other materials are virtually untouched in terms of recycling potential, including C&D,
electronics, food residuals, most plastics, and textiles.
Despite limited recovery in some categories, the 1998 assessment found a thriving
industry that continues to grow and change. The 1990s had seen the introduction of new
technologies, expansion of collection systems, and considerable fluctuations in foreign and
domestic economic cycles. In addition, recycling companies (both processors and end users) in
1998 were consolidating in many sectors. Since the last assessment was conducted, North
Carolina had provided business management, technical and financial assistance to 608
businesses. In that period, 185 jobs were created and $5.05 million were invested. The total
14 North Carolina Department of Environment and Natural Resources (1998).

15
volume of new capacity created was 217,000 tons per year. More than half of that capacity was
construction and demolition (C&D) debris processing. Another significant development since the
last industry assessment is the inception of a recycling business loan fund, supported by the N.C.
Department of Environment and Natural Resources (DENR), the U.S. Environmental Protection
Agency (EPA), and the Self-Help Ventures Fund (Self-Help). This fund is administered by Self-
Help, and the project will offer at least $660,000 in loans to recycling businesses. These loans
are expected to create or retain at least 80 jobs, provide 115,000 tons per year of recycling
capacity, and leverage an additional $330,000 of private investment.
� Southern States15
This study analyzes recycling efforts in sixteen Southern states, including North
Carolina.16 An estimated 138,632 people were employed in firms that process recovered
materials or use them in manufacturing in the thirteen states included in the study in 1995. This
represented 2.8 percent of the nearly five million jobs in the manufacturing sector in 1995.
Approximately 24 percent of the recycling employment in these states was in processing
firms, and 76 percent was in manufacturing firms. Paper manufacturers were the leading
recycling employers, with an estimated 47,102 employees, or 34 percent of the total recycling
employment in the thirteen states and territories. Ferrous manufacturers were the next largest
contributor to employment, with approximately 21 percent of total recycling employment.
Approximately $18.5 billion of value was added to recyclables in the region through
processing and manufacturing. This is an estimated 4.9 percent of the total value added by the
manufacturing sector.
15 Roy F. Weston (1996). 16 The report includes the following states: AL, AK, GA, FL, KY, LA, MD, MS, MO, NC, OK, SC, TN, TX, VA, WV.
16
� Michigan17
Recyclable materials processing has a significant impact on Michigan’s economy.
Respondents to a survey of recyclable materials processors conducted by the Michigan
Recycling Coalition reported $437 million in annual revenue, 1,920 jobs, and over $52 million in
annual payroll attributable directly to processing activities. When extrapolated from the 51
percent of entities who responded to the survey to the entire processing industry in Michigan,
this implies total annual revenues of over $1.9 billion, total employment of 5,028, and a total
annual payroll of more than $137 million.
Economic activity in recyclable materials processing generates additional activity in other
sectors that provide goods and services as inputs to processing. This additional activity supports
jobs that can be indirectly attributed to recyclable materials processing. Furthermore, workers in
processing activities spend their money on other goods and services that support still more
economic activity and jobs.
Estimating indirect and induced economic impacts associated with recyclable materials
processing in Michigan was beyond the scope of this study. Studies in other states in the region,
however, suggest that the total economic impact of recyclable materials processing may be twice
as large as the direct impact of processing activities.
� Northeast Recycling Council (NERC)18
NERC consists of ten states: Maine, Vermont, New Hampshire, Massachusetts,
Connecticut, Rhode Island, New York, New Jersey, Pennsylvania, and Delaware. According to
17 Michigan Recycling Coalition (2001). 18 Northeast Recycling Council (1996).

17
its report, the recycling industry is a significant contributor to the region’s economy, adding over
100,000 jobs and $7.2 billion in value added activity.
In New Jersey, for instance, the recycling industry compares favorably to other industries
in the state on indicators like the number of businesses comprising the industry and the number
of employees in the industry. The state Department of Labor collects payroll information on 72
Goods Producing Industry categories. Recycling is not a recognized category but if it were, it
would rank 14th in total employment. Recycling approaches the estimated 14,800 jobs in the
manufacture of medical instruments and is almost double the estimated 7,000 jobs in motor
vehicle construction within New Jersey.
In Massachusetts, more than 800 recycling businesses contribute $588 million in value
added and over 14,000 jobs to the state’s economy. The Massachusetts recycling industry
compares favorably to other industries in the states on indicators like the number of businesses
comprising the industry and the number of employees in the industry.
The recycling industry added nearly $300 million and over 2,000 jobs to the Maine
economy in 1992. The average annual salary of all private sector jobs attributable directly to
recycling in Maine is $18,476. By comparison, the Maine Dept. of Labor reported that the 1990
average annual earnings of all Maine workers was $19,820.
The study found that recycling businesses stimulate local economies in a number of
ways:
1. Local recycling businesses reduce dependence on distant markets for recyclables and are
likely to provide greater market stability.
2. Recycling manufacturing can support local recycling programs, stabilizing and possibly
reducing waste management costs.

18
3. Recycling manufacturing with locally collected materials adds value by producing
finished goods for export rather than exporting raw materials and importing finished
products. Local jobs are created, local manufacturers have access to less expensive raw
materials, and the reduced dependence on solid waste disposal facilities saves the money
of residents and local governments better spent elsewhere in the local economy.
4. Local ownership ensures that business assets remain in the region, and spin-off
purchasing enhances the stability of the local retail business environment and contributes
to the local tax base.
� Massachusetts19
By converting raw materials into products, recycling (including reuse and
remanufacturing) creates jobs, builds more competitive manufacturing industries and adds
significantly to the Massachusetts economy. There are 1,437 recycling businesses and
organizations in the Commonwealth of Massachusetts. They offer 19,500 jobs with a $557
million annual payroll, and have $3.5 million in receipts. This represents an increase in
recycling businesses and recycling jobs, but a decrease in annual payroll in the eight years since
the NERC study was conducted.
The indirect impacts of recycling businesses include their interaction with a wide variety
of service-based businesses (e.g., equipment manufacturers, consultants, brokers, transporters,
accounting firms, office supply companies). They also provide an additional 11,452 jobs, $470
million payroll, and $1.6 billion in receipts. Recycling businesses also generate roughly $64
million in state tax revenues.
19 Massachusetts Department of Environmental Protection (2004).

19
Recycling is a major employer. More than 3 percent of the Massachusetts workforce
works in recycling related fields. Recycling employs as many people in Massachusetts as does
the child care, the accounting and bookkeeping sector, or the electric utilities industry.
Employment in the Massachusetts recycling industry ranks higher per capita than California,
New York, and Florida.
Sorting and processing recyclables provides 10 times more jobs than if the same
materials were thrown away. Manufacturers that use recyclable materials to make new products
employ even more people, and at higher wages, than sorting and processing companies. For
instance, some recycling-based paper mills and plastic product manufacturers, employ 60 times
more workers than do landfills on a per-ton basis.
� Pennsylvania20
Recycling adds value to Pennsylvania's economy. For example, collection and
processing, the initial steps in the recycling process, involve sorting and aggregating recyclable
materials. This includes municipal and private collectors, material recovery and composting
facilities, and recyclable material wholesalers. These activities employ nearly 10,000 people in
Pennsylvania, with a payroll of $284 million and annual sales of $2.3 billion.
Recycling manufacturing involves the actual conversion of recyclables into products. The
primary recycling manufacturers in Pennsylvania in order of magnitude are steel mills, plastic
converters, paper and paperboard mills, and nonferrous metal manufacturers. Recycling
manufacturing employs over 64,000 people with a payroll of almost $2.5 billion and annual sales
of over $15.5 billion.
20 Pennsylvania Department of Environmental Protection (2007).

20
Reuse and remanufacturing focus on the refurbishing and repair of products to be reused
in their original form. The largest activities are retail sales of used merchandise and reuse of used
motor vehicle parts. The amount of value that can be added via this process is limited because of
competition from new products. Nevertheless, reuse and remanufacturing contribute over 7,000
jobs, a payroll of $115 million and sales of over a half billion dollars.
In addition to the direct benefits, support businesses that provide goods and services to
the recycling and reuse establishments also contribute to the state's economy. These supporting
activities include recycling and reuse equipment manufacturers, consulting/engineering services,
brokers, and transporters. These contribute an additional 13,297 jobs and $1.8 billion in receipts.
Pennsylvania tax revenues from the recycling and reuse businesses are estimated at 305 million
dollars per year.
� California21
While additional work is needed to better define and refine the inputs used in this study,
the results to date suggest that disposal and diversion activities have a significant impact on the
California economy. In addition to estimates of factors such as jobs and revenue in the recycling
industry, the results show that recycling solid waste has a significantly higher impact on the
economy than disposing it. When material is diverted rather than disposed in California, total
sales and value-added impacts more than double, output impacts and total income impacts nearly
double, and the employment impact nearly doubles.
21 Goldman & Ogishi (2001).

21
� Iowa22
In 1999, the Iowa recycling industry reported that more than $101 million in commodity
gross receipts based on estimated quantities of recyclable materials collected. There were 1,636
direct processing jobs and 2,720 in total recycling-related processing jobs (including organics
and C & D). 1999 also reflected more than $2.268 billion in direct-industrial output. The
recycling equipment industry, in itself, provided more than $80 million in total industrial output
and 725 total jobs. For every 100 jobs created in the recycling processing industry, 72 additional
jobs are sustained in the Iowa economy. For every dollar in total income created in the recycling
processing industry, $1.03 of additional income is sustained in the Iowa economy.
22 Beck (2001).

22
The Recycling Industry in Virginia
This portion of the report focuses on the private industry involved in recycling activities
in Virginia. The overall structure of this analysis involves quantitative estimates of the economic
value of the recycling industry in Virginia. These estimates are characterized for the time period
ranging from 2002 to 2007. A variety of data sources are pooled to compile this analysis. The
discussion below will first identify the various data sources used, outline the analytical methods,
and finally present the results.
Methodology
Six industry sectors within the recycling industry as a whole were selected from the
North American Industry Classification System (NAICS). The six sectors were then separated
into three categories to cover the various stages of the recycling process.
Table 1: Six Industry Sectors within the Recycling Industry as a Whole
Recycling Industry NAICS Code Industry Sector
42393 Recyclable material merchant wholesalers Core
56292 Materials recovery facilities
32211 Pulp, paper, & paperboard mills Manufacturing
23621 Industrial Building Construction
4842303 Other specialized trucking, long-distance Transportation
562111 Solid waste collection
Source: 2002 NAICS U.S. Economic Census
These six industry sectors can be classified in three different categories. The Core
category includes Materials Recovery Facilities (MRFs) and Recyclable Material Merchant
Wholesalers, which are NAICS codes 56292 and 42393, respectively. The definition of the core

23
group for the purpose of this study is industry sectors 100% involved in recycling activities. The
manufacturing category covers recycling activities, which include processing, manufacturing and
end use of recyclable materials. For the purpose of this report the manufacturing category
includes two NAICS codes including Pulp, Paperboard, and Paper Mills (32211) and Industrial
Building Construction (23621). The transportation category includes Solid Waste Collection
(562111) and Other Specialized Trucking (4842303), which involves the transfer of recyclable
materials.
The data available from the 2002 U.S. Economic Census utilized in this report include the
following variables: number of establishments, number of employees, gross revenue, and annual
payroll. These variables are reported for the State of Virginia as a whole. The average annual
salary is calculated by dividing the annual payroll value by the number of employees. Personal
income is calculated by multiplying average salary by the number of employees related to
recycling within an industry sector. The method for qualifying the amount of employees within
an industry related to recycling is explained at the end of this section.
The Virginia Employment Commission (VEC) provided data on the number and size of
firms in the six industry sectors in Virginia for 2007. These data are used to create a profile of
the industry composition by firm size. The data from the VEC are discrete and not continuous as
firm size class organizes it. The size classes for the individual firms are listed as follows: zero,
one to four, five to nine, ten to nineteen, etc. The complete list of size classes is shown in Table
2. To calculate a valid estimate of the number of employees within each industry sector in 2007,
an average of the numbers bounding each size class is taken. This average is then multiplied by
the number of firms reported by the VEC in each size class in each of the six industry sectors.
The sum of the employee estimates is then made by industry sector.

24
Table 2: Average Number of Employees within VEC Firm Size Classes
Size Class 0 1-4 5-9 10-19 20-49 50-99 100-249 250-499 500-999
Average Number
of Employees
0
2
7
14.5
34.5
74.5
174.5
224.5
749.5
Source: VEC data.
The VEC also provided general time series data for each of the six industry sectors
identified above. These data include annual averages (of quarterly data) of total employment and
firm numbers from 2002 through 2006. The change in total employment within each industry
subsector is used to calculate an industry specific growth rate. The annual growth rate is
calculated as follows:
( ) ( )
( )years4
Employment Total 2002
Employment Total 2002Employment Total 2006 RateGrowth Annual ÷
−=
The calculated annual growth rate is then used to create revenue projections for each
industry sector for the years 2006 and 2007. The formula used is shown below:
( )41 RateGrowth Annual Revenue Gross 2002 Revenue Gross 2006 +×=
( )51 RateGrowth Annual Revenue Gross 2002 Revenue Gross 2007 +×=
The three groupings used to characterize the recycling industry in this report relate to
varying amounts of involvement in recycling activities. While the core category includes
industry sectors 100% involved in recycling activities the other two categories do not.
Therefore, the revenue and employment estimates for the manufacturing and transportation
categories must be qualified to represent the true percentage of recycling related activities
occurring in these industry sectors. To accomplish this, a search of the available literature and
data was made.

25
Summary statistics of manufacturing use data from the Institute of Scrap Recycling
Industries (ISRI)23 were identified. Unfortunately, this type of information was only found for
the paper manufacturing industry. ISRI reports that 50% of U.S. paper industry relies on scrap
paper. The other industry within the manufacturing category is industrial building construction.
In the trade the use of recycled materials in this industry is called the reuse of construction and
demolition waste. This type of recycling activity is prevalent in Virginia, as shown by the Mid-
Atlantic Consortium of Recycling and Economic Development Officials (MACREDO) database
of recyclers in Virginia. However, no specific use data are available identifying the proportion
of inputs that are reused in this industry. Therefore, a simplifying assumption is made. The 50%
scrap use rate is applied uniformly over the manufacturing industry sectors in this study.
Within the transportation industry sectors identified in this study, an absence of accurate
data exists as well. For this category, another simplifying assumption is made. The Virginia
statewide recycling rate is used to identify the proportion of activities within solid waste
collection and specialized transportation related to recycling. The Virginia statewide recycling
rate is defined as the total annual recycling tonnage divided by total annual municipal solid waste
tonnage. The formula is shown below:
Tonnage WasteSolid Municipal Total State Annual
Tonnage Recycled Total State Annual Rate Recycling Statewide VA =
The Virginia statewide recycling rate for the calendar year 2006 is used to qualify the
true amount of recycling related economic activity within the transportation category.
23 www.isri.org

26
Analysis
To begin the analysis portion of this section, the data from the 2002 U.S. Economic
Census are presented. Table 3 shows the final summation of the calculations made using the
economic census data. The methods for deriving total personal income are discussed above.
Table 3: 2002 Summary of the Recycling Industry in Virginia
Industry Group Number of Employees
Gross Revenue (2002 $)
Total Personal Income (2002 $)
Core 1790 344,537,000 53,343,000
Manufacturing 3188 1,317,883,000 176,806,500
Transportation 1995 296,107,392 748,820,096
Source: U.S. Economic Census 2002
Based on this analysis the total revenue for the recycling industry in Virginia in 2002 was
$1.958 billion. Total employment was 6,973, and total personal income is estimated to have
been $978 million. Tables 4-7 below show the specific values of the variables by industry code.
The average salary for each industry sector was calculated by dividing the total payroll values
presented in the census by the total employment within the industry sector.
Table 4: Average Salary in the Recycling Industry in Virginia in 2002
Industry Sector Average salary
($ per annum)
Core Recyclable material merchant wholesalers 30,017.65

27
Materials recovery facilities 27,374.15
Pulp, paper, & paperboard mills 60,840.59 Manufacturing
Industrial building construction 25,895.92
Other specialized trucking, long-distance 35,834.92 Transportation
Solid waste collection 38,719.72
Source: U.S. Economic Census 2002
As described above, the total gross revenues reported in the 2002 census are adjusted by
recycling category. The manufacturing category is adjusted using the 50% recycled material use
assumption derived from the Institute of Scrap Recycling Industries. The transportation category
is adjustedusing the 2006 recycling rate for the entire state of Virginia. Table 5 shows the results.
Table 5: Gross Revenue in the Recycling Industry in Virginia 2002
Industry Sector
Total Gross Revenue
Recycling Related Revenue
Recyclable material merchant
wholesalers
322,614,000 322,614,000
Materials recovery facilities 21,923,000 21,923,000
Core
Total 344,537,000 344,537,000
Pulp, paper, & paperboard mills 2,484,545,000 1,242,272,500
Industrial building construction 151,221,000 75,610,500
Manufacturing
Total 2,635,766,000 1,317,883,000
Other specialized trucking, long-
distance
231,435,000 88,871,040 Transportation
Solid waste collection 539,678,000 207,236,352

28
Total 771,113,000 296,107,392
Source: Authors’ calculations based on 2002 U.S. Economic Census
Table 6 outlines the total employment within each of the industry sectors and the adjusted
recycling related employment. These estimates are made using the two simplifying assumptions
discussed above.
Table 6: Employment in the Recycling Industry in Virginia 2002
Industry Sector
Total # Employees
Recycling related
Employees
Recyclable material merchant wholesalers
1,643 1,643
Materials recovery facilities 147 147
Core
Total 1,790 1,790
Pulp, paper, & paperboard mills 5,395 2697.5 Industrial building construction 980 490
Manufacturing
Total 6,375 3187.5
Other specialized trucking, long-distance
2,199 844.416
Solid waste collection 2,997 1150.848
Transportation
Total 5,196 1995.264 Source: Authors’ calculations based on 2002 U.S Economic Census
Manufacturing is the largest employment category within Virginia’s recycling industry
with 3,187 employees in 2002. The core group is the smallest employer in the industry as a
whole in 2002. Once again, the large amount of uncertainty over the amount of recycling
activities carried out in the transportation sectors makes it difficult to accurately estimate the true
level of recycling employment in this group. Table 7 below shows the number of firms
operating in Virginia within each industry sector in 2002.
Table 7: Businesses in the Recycling Industry in Virginia in 2002
Industry Sector Total # of Firms

29
Recyclable material merchant wholesalers
114 Core
Materials recovery facilities 15 Total 129
Pulp, paper, & paperboard mills 14 Manufacturing Industrial building construction 38*
Total 52
Other specialized trucking, long-distance
121 Transportation
Solid waste collection 156 Total 277
Source: U.S. Economic Survey 2002 Note: * Sampling error exceeds 40 percent
In analyzing the Virginia recycling industry over time, data from the Virginia
Employment Commission24 was integrated into the data available from the U.S. Economic
Census. The VEC data are described above in the methodology section. Specifically, revenue
and payroll data were not available. In the Appendix, Figures 1-6 show average employment
from 2002 through 2006 in each industry sector. The VEC creates industry sector growth
projections for the decade ranging from 2004 to 2014. It must be noted that the VEC projections
reported here are for the most closely related industry sectors available to the recycling sectors.
For example, there is no VEC projection available for recyclable material merchant wholesalers.
Therefore, the projection for merchant wholesalers of durable goods is used instead. These
projected growth rates are compared with the calculated annual growth rates in Table 8 below.
Table 8: Comparison of VEC Projected Growth Rates and Calculated Annual Growth
Rates for Industry Subsectors within the Recycling Industry in Virginia
Industry Sector VEC Projected
Growth Rate 2004 to 2014
Calculated Annual Growth
Rate
Core
Recyclable material merchant wholesalers
15.7% -0.4%
24 Personal communications with Tim Kestner, VEC, 9/2007 to 11/2007

30
Materials recovery facilities NA 2% Pulp, paper, & paperboard mills
-3.3% -2% Manufacturing
Industrial building construction
13.5% -5%
Other specialized trucking, long-distance
12.3% 8% Transportation
Solid waste collection 23.1% 5% Source: Virginia Employment Commission 2007
The calculated annual growth rates seem to tell a different story than the VEC projected
growth rates. Within the manufacturing category, the decline of employment in both industry
sectors is greater than the VEC projection. The opposite is true of the transportation category.
The calculated growth rates are greater than the VEC projected growth rates. The VEC projected
growth rate for all industries in VA for the period from 2004 to 2014 is 17.1%.
The calculated annual growth rates were then used to create revenue projections for 2006
and 2007. Projections for both years were made for specific reasons. First of all, there is data
available on the total employment in each of the six industry sectors for 2006 but not for 2007.
However, a complete list of firms for each industry sector is available for 2007. Also, the
industry composition data by firm size are available only for 2007 and not 2006. Furthermore,
the Bureau of Economic Analysis (BEA) has data available for total Virginia GDP and
employment for 2006 but not yet for 2007. Table 9 below shows the revenue projections for
2006 using the actual employment numbers reported by the VEC.

31
Table 9: 2006 Projected Revenue and Recycling Employment
Source: Authors’ calculations based on VEC data and the 2002 U.S. Economic Census
Using the numbers from Table 9 above, the total employment within the recycling
industry in Virginia in 2006 was 8,607. It is interesting to compare this number with the smaller
total employment value of 7,720 projected for 2007 in Table 10 below. The reason for this
difference is not that employment declined between 2006 and 2007. Rather, the value for 2007
was created as a projection from the size class data provided by the VEC for all the firms in each
of the NAICS codes. The reason for this glaring underestimation is that many firms reported a
size of zero employees. While it is apparent that the employment projection for 2007 is
inaccurate, the revenue estimates are consistent with the 2006 projections, which are based on
the 2002 U.S. Economic Census data.
Industry Sector Total Employment
Recycling Projected Revenue
Recyclable material merchant
wholesalers
1,990 316,457,496.4
Materials recovery facilities 325 23,723,977.5
Core
Total 2,315 340,181,473.9
Pulp, paper, & paperboard mills 2522 1,139,141,841
Industrial building construction 1,680.5 60,944,654.36
Manufacturing
Total 4,202.5 1,200,086,495
Other specialized trucking, long-
distance
802.944 123,893,797.7
Solid Waste Collection 1,286.4 252,794,785.9
Transportation
Total 2,089.344 376,688,583.6

32
Table 10: 2007 Revenue and Employment Projections
Source: Authors’ calculations using VEC data and the 2002 U.S. Economic Census
Combining the data presented in Tables 5, 9, and 10, a comparison of revenue growth and
decline within the three categories of the recycling industry in VA can be made. This
comparison is expressed below in Figure 1.
Industry Sector Projected Employment
Recycling Projected Revenue
Recyclable material merchant
wholesalers
379 314,936,816
Materials recovery facilities 2,339 24,196,880
Core
Total 2,718 339,133,696.72
Pulp, paper, & paperboard mills 1,193.25 1,114,725,759
Industrial building construction 1,636.25 57,746,277.75
Manufacturing
Total 2,829.5 1,172,472,037
Other specialized trucking, long-
distance
835.97 44,349,141.32
Solid Waste Collection 1,336.51 265,670,697.1
Transportation
Total 2,172.48 310,019,838.4

33
Figure 1: Recycling Revenues in Virginia
Figure 1: VA Recycling Revenues
0
200
400
600
800
1,000
1,200
1,400
2002(*) 2006(**) 2007(**)
Year
2002 $
Mil
lio
n
Core
Manufacturing
Transportation
Source: *Data from 2002 U.S. Economic Census; **Data projected from 2002 Economic Census Data using employment trends calculated from data provided by the VEC.
Note: Please see Table 1 in the Appendix for more information.
Figure 1 shows that the gross revenues from the core of the recycling industry seem to
have fallen from $344 million in 2002 to $339 million in 2007. The decline of this category is
driven by the recyclable material merchant wholesalers industry sector. There is distinctive
growth in the materials recovery facilities sector. The manufacturing revenues also show an
overall declining trend from $1.3 billion in 2002 to $1.17 billion in 2007. Only the
transportation category shows an overall growth in revenues from $296 million in 2002 to $400
million in 2007. The trend for the revenues of the recycling industry as a whole in Virginia for
this time period is negative. The value of the industry in 2002 was $1.958 billion. The estimated
value for 2006 is $1.916 billion, and the value for 2007 is estimated to be $1.911 billion. It is
important to remember that the revenue values for 2006 and 2007 are projections based on
employment trends. We will know the true revenue values when the 2007 U.S. Economic
Census data is published.

34
The U.S. Bureau of Economic Analysis estimates the total GDP of the Commonwealth of
Virginia in 2006 to have been $318.727 billion (expressed in terms of dollars from the year
2000.) Using this value, the recycling industry in Virginia represented 0.6% of the total GDP for
the state in 2006. According to VELMA25, the total size of the Commonwealth of Virginia’s
workforce was 3,665,764 in 2006. This means that the total private sector recycling workforce
of 8,607 in 2006 represented 0.2% of all employment in the state.
The final component of this analysis is the description of the recycling industry
composition by firm size. This is accomplished using the VEC data from 2007. Each industry
sector is graphed using a histogram. This is designed to illustrate what types of firms exist
within Virginia’s recycling industry.
Figure 2: Industry Composition by Firm Size for Recyclable Material Merchant
Wholesalers in Virginia (2007)
Figure 2 shows the
composition of the recyclable
material merchant wholesalers
industry sector. The total number of
firms within this sector was 136 in
2007. The median salary for
employees within this subsector in
2007 is reported by VELMA to
have been $50,419 per annum.
Figure 2: Industry Composition by Firm Size
for Recyclable Material Merchant Wholesalers
in VA 2007
0
5
10
15
20
25
30
35
40
45
50
00000 1-4 5-9 10-19 20-49 50-99 100-
249
250-
499
500-
999
1000+
Empl oy e e S i z e C l a ss
25 Virginia Employment Labor Market Analysis (VELMA)

35
Figure 3: Industry Composition by Firm Size for Materials Recovery Facilities in Virginia
(2007)
Figure 3 shows the composition of
the materials recovery facility industry
sector. The total number of firms within
this sector was 28 in 2007. The median
salary for employees within this subsector
in 2007 is not reported by VELMA.
Figure 3: Industry Composition by Firm Size
for Materials Recovery Facilities in VA 2007
0
50
100
150
200
250
300
00000 1-4 5-9 10-19 20-49 50-99 100-
249
250-
499
500-
999
1000+
Fi r m S iz e C la ss
Figure 4: Industry Composition by Firm size for Industrial Building Construction in
Virginia 2007
The composition of the
industrial building construction
industry sector is illustrated in Figure
4. The total number of firms in this
sector was 146 in 2007. VELMA
reports the median salaries for the top
two most common occupations in this
industry to be $34,860 per annum for
carpenters and $55,334 per annum for
supervisors.
Figure 4: Industry Composition by Firm
Size for Industrial Building Construction in
VA 2007
0
5
10
15
20
25
30
35
40
45
00000 1-4 5-9 10-19 20-49 50-99 100-
249
250-
499
500-
999
1000+
Empl oy e e S iz e C l a ss

36
Figure 5: Industry Composition by Firm Size for Paper Manufacturing in Virginia 2007
The industry composition for
paper manufacturing in Virginia is
shown in Figure 5 below. The total
number of firms in this sector was 26 in
2007. VELMA reports the median
salaries for the top two most common
occupations in this industry to be
$25,519 per year for machine operators
and $42,214 per year for machine
mechanics.
Figure 5: Industry Composition by Firm
Size for Paper Manufacturing in VA 2007
0
0.5
1
1.5
2
2.5
3
3.5
4
4.5
00000 1-4 5-9 10-19 20-49 50-99 100-
249
250-
499
500-
999
1000+
Empl oy e e S iz e C l a ss
Figure 6: Industry Composition by Firm Size for Solid Waste Collection in Virginia 2007
The industry composition for solid
waste collection in Virginia is shown in
Figure 6 below. The total number of firms
in this sector was 190 in 2007. VELMA
reports the median salaries for the top two
most common occupations in this industry
to be $24,471 per annum for collectors and
$33,932 per annum for truck drivers.
Fi gur e 6 : Indust r y Composi t i on by Fi r m S i z e f or S ol i d
Wa st e Col l e c t i on i n VA 2 0 0 7
0
10
20
30
40
50
60
70
80
00000 1-4 5-9 10-19 20-49 50-99 100-249 250-499 500-999 1000+
E mpl oyee Si z e Cl ass

37
Figure 7: Industry Composition by Firm Size for Specialized Trucking in Virginia 2007
Figure 7 below shows the
composition of the specialized trucking
industry in 2007. The total number of
firms in this sector was 173 in Virginia
in 2007. VELMA reports the median
salary for employees in this industry to
be $33,932 per annum for truck drivers.
Figure 7: Ind ust ry C o mp osit ion by F irm Size f o r
Sp ecialized T rucking in V A 2 0 0 7
0
10
20
30
40
50
60
70
80
90
100
00000 1-4 5-9 10-19 20-49 50-99 100-249 250-499 500-999 1000+
E mpl oyee Si z e Cl ass
One crucial point about Figures 2 through 7 is to note the presence of the 00000 size
class. The reason this size class is labeled with five zeros instead of one is that it is highly
unlikely that these firms truly have zero employees. Rather, it is more likely that the data for
these firms are simply unavailable. In essence, these data from the VEC represent a sample. The
firms in the 00000 category represent the non-responders. The total number of firms across the
six NAICS codes classified into the 00000 category equals 68 of a total of 699. This equates
with a 10% rate of non-response or unavailable data for the recycling industry as a whole in
Virginia for 2007.
The median salary values within each industry sector reported by VELMA are used to
calculate an estimate for 2006 total personal income. No estimate of personal income is made
for 2007. The reason for this is the inherent inaccuracy in the projected total employment for
2007. This issue is discussed both in the preceding sections and in the final section of this report
containing recommendations for future research. In the case that two median salaries are
reported above, the average of the two values will be used. This value is then multiplied by the
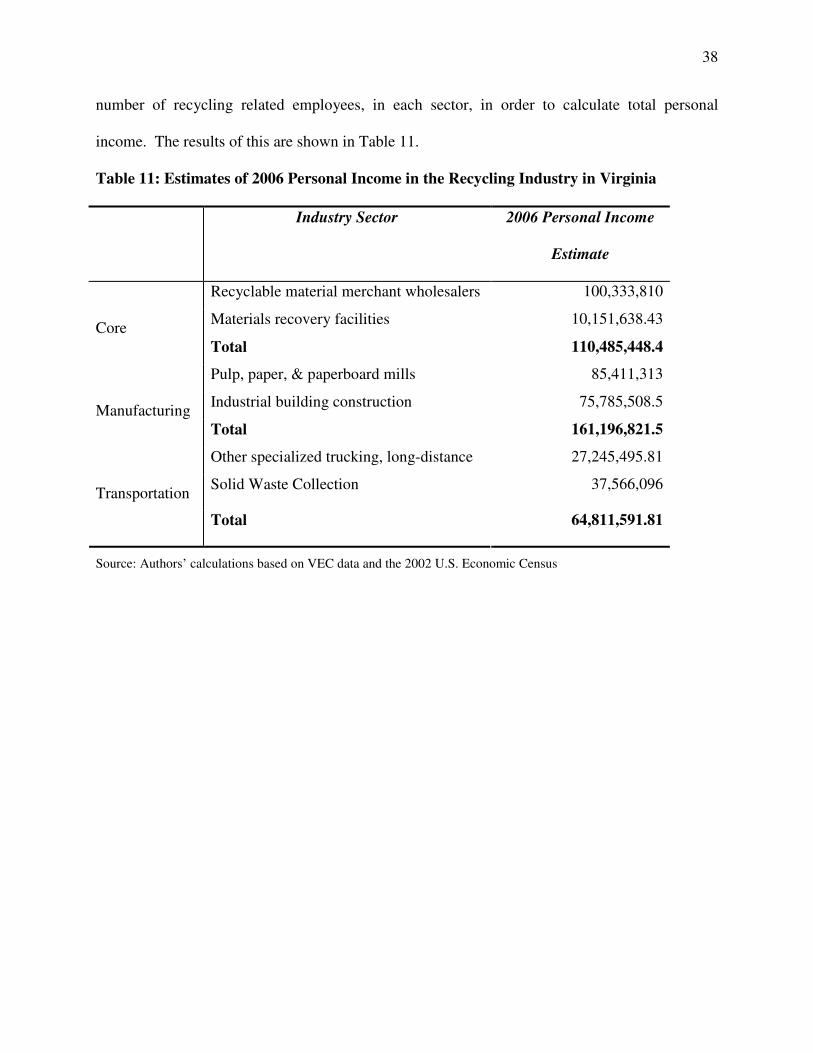
38
number of recycling related employees, in each sector, in order to calculate total personal
income. The results of this are shown in Table 11.
Table 11: Estimates of 2006 Personal Income in the Recycling Industry in Virginia
Industry Sector 2006 Personal Income
Estimate
Recyclable material merchant wholesalers 100,333,810
Materials recovery facilities 10,151,638.43
Core
Total 110,485,448.4
Pulp, paper, & paperboard mills 85,411,313
Industrial building construction 75,785,508.5
Manufacturing
Total 161,196,821.5
Other specialized trucking, long-distance 27,245,495.81
Solid Waste Collection 37,566,096
Transportation
Total 64,811,591.81
Source: Authors’ calculations based on VEC data and the 2002 U.S. Economic Census

39
Determinants of Recycling Performance in Virginia
This report is the first attempt to estimate the economic impacts of recycling in Virginia.
Based on some sources of secondary data and a survey of the Solid Waste Planning Units
(SWPUs), this report provides summary statistics and econometric estimates of the determinants
of the recycling performance in Virginia.
Methodology
The objective of this part of the report is to examine the determinants of recycling
performance, particularly recycling rate and recycling tonnage, in Virginia. The goal is to
estimate the significance and magnitude of the relationship between the determinants and
recycling rate or recycling tonnage in Virginia. Based on the results of this exercise, specific
policy recommendations are made to help improve the recycling performance in Virginia, and
the effectiveness of local budget and state funding used to support recycling programs.
A short statewide survey of the Solid Waste Planning Units (SWPUs)26 was undertaken
to gather information on local recycling budget, size of the public workforce, and average hourly
wage of these public employees27. Also, other secondary data have been compiled, including
recycling rate and tonnage by SWPUs, state funding for litter prevention and recycling programs
in local governments, and SWPUs’ demographic data such as population density, average
income, and educational attainment. The sources for this data include the U.S. Census Bureau
and the Virginia Department of Environmental Quality (DEQ).
26 Solid Waste Planning Units (SWPUs) are politically determined solid waste reporting entities within the State of Virginia which may include one or more localities such as counties, cities, and towns. 27 This average hourly wage information is different from the average income data to be used in regression models later in the report.

40
The results of this analysis will be reported in two ways. First, summary statistics for the
different determinants will be presented. Then the results of the econometric models will be
tabulated and discussed. In order to achieve the econometric estimates, several multivariate
regression models have been used. These models specify functions of recycling rate or recycling
tonnage on several different sets of determinants with SWPU as the unit of analysis.
The basic analysis equations might be expressed as:
RecyclingRate OR Tonnagei = β0 + β1 PopulationDensityi + β2 AverageIncomei + β3 Educationi +
β4 MandatedRatei + β5 RecyclingBudgeti + β6 StateFundingi + β7 Urbani + εi
As shown above and discussed in detail in the introduction of this report, the basic set of
determinants included in this analysis are listed as follows::
- Population density is generated by dividing population estimates of 2006 by land area in
square miles;
- Average income is collected by SWPUs for 2005 from the Bureau of Economic Analysis
website;
- Educational attainment is the percentage of population 25 years and over with
bachelor's degree or higher (Census 2000);
- Mandated recycling rates, as explained in the introduction, are the minimum recycling
rates that all SWPUs must meet based on two sets of criteria28;
- Local recycling budget is gotten from the SPWU survey where SWPUs are asked the
following question: “What is the local budget for recycling of your SWPU?”;
28 According to §10.1 1411 of the Code of Virginia, “all Solid Waste Planning Units (SWPUs) must meet the minimum recycling rate of 25% unless their population density is less than 100 persons per square mile or if their civilian unemployment rate is 50% above the statewide average. Those SWPUs qualifying under these new criteria must meet a minimum recycling rate of 15%.”

41
- State funding is the amount of money allocated to local governments within SWPUs by
the State of Virginia through the Virginia Department of Environmental Quality (DEQ)
to support their litter prevention and recycling programs. Currently, this funding includes
only grants and is allocated based on localities’ population and road miles; and
- Urban, which is a dummy variable, is coded 1 if an SWPU is urban and 0 if rural.
Due to the impact these socioeconomic variables are expected to have on recycling
performance, there exists the assumption that there is variation in the effectiveness of spending
money on recycling in different types of localities. For example, spending on recycling by rural
and urban SWPUs is expected to yield significantly different returns. For this reason a broader
set of determinants has been used in the same multivariate regression models to estimate the
potential of targeting State funding for recycling programs. The set of determinants was
broadened to include the following interaction variables29:
- State funding and urban/rural;
- State funding and population size;
- State funding and area (square miles);
- State funding and average income;
- Local recycling budget and urban/rural;
- Local recycling budget and population size;
- Local recycling budget and are (square miles); and
- Local recycling budget and average income.
In summary, the regression results of the two models discussed above will provide
estimations of how many more tons of waste can be expected to be recycled given a one dollar
29 These interaction variables are generated by respectively multiplying state funding variable or local recycling budget variable with four other variables, urban/rural dummy variable, population size, area, and average income.

42
increase in state funding or in local recycling budget at the SWPU level. Likewise, the expected
percentage point increase in recycling rate will also be estimated given a one dollar increase in
state funding in local recycling budget at the SWPU level. The use of the multiple regression
method allows the calculation of these estimates when other determinants are statistically
controlled for. With the interaction variables, the regression results imply differential marginal
effects between groups of SWPUs on recycling performance.For example, it shows whether
providing state funding to local governments in urban SWPUs is more effective than funding
those in rural SWPUs.
Summary statistics
To date, Virginia as a whole has done a good job in its recycling effort. The following
two graphs provide a picture of recycling for the State in terms of the recycling rate and total
tonnage recycled. The data for these two graphs were compiled and adjusted for consistency
using the annual DEQ recycling summary from the reports submitted by the 74 SWPUs and
represents recycling information from 325 Virginia cities, counties, and towns.30
30 The Virginia Annual Recycling Rate Report 2006, DEQ.

43
Figure 8: Recycling Rate of Virginia 2003 - 2006
From 2003 to 2006, Virginia
has made significant progress in
recycling rate, from 30.3% in 2003 to
38.4% in 2006, an increase of 8.1
percentage points. A slight decrease in
2004 does not represent a true decline.
An explanation from DEQ reveals that
this decline is attributed to changes in
definitions of recyclable materials.31
Recycling rate of Virginia 2003 - 2006
30.30% 29.80%32.20%
38.40%
0.00%
5.00%
10.00%
15.00%
20.00%
25.00%
30.00%
35.00%
40.00%
45.00%
2003 2004 2005 2006
Year
Recyclin
g r
ate
(%
)
Source: DEQ
Figure 9: Recycling Tonnage in Virginia 2003 - 2006
Consistent with the changes in
recycling rates, there is also a sizable
increase in recycling tonnage in
Virginia from 2.82 million tons in 2003
to 3.7 million tons in 2006, a
percentage increase of 31.2% and a net
increase of 880,000 tons, with a slight
decline as in recycling rate in 2004.
Recycling tonnage in Virginia 2003 - 2006
2.82 2.69 2.76
3.7
0
0.5
1
1.5
2
2.5
3
3.5
4
2003 2004 2005 2006
Year
Mil
lio
n t
on
s
Source: DEQ
31 It is mentioned in the 2004 report that the DEQ asked that storm debris and ash not be included in the calculations as they would skew the overall calculation of MSW recycling.

44
The following two maps depict the recycling rate distribution in Virginia in 2005 and
2006. In the maps, Virginia is divided into 74 SWPUs. In turn, these 74 SWPUs are categorized
into three groups:
- Group 1 with recycling rates below 15%, which in the maps are shown in pink;
- Group 2 with recycling rates at least 15% but less than 25%, which in the maps are
shown in yellow; and
- Group 3 with recycling rates at 25% or more, which in the maps are shown in green.
Figure 10 : Recycling Rate Distribution Map of Virginia 200532
Bland
Buchanan
Dick enson
Grays onLee
Russel l
Scott
Smy th
Tazewel l
Was hington
Ab ingdon
Wis e
Wy the
Bri stol City
Acc
omack
Albemarle
Al leghany
Amel ia
Am herst
Appomattox
Arl ington
Augusta
Ba th
Bedfo rd
Bo tetourt
Bruns wick
Buck ingham
Campbell
Carol i ne
Carrol l
Cha rles City
Charlotte
Ches terf ield
Cla rk e
Craig
Cu lpeper
Cumberl and
Dinwiddie
Ess ex
Fa irfaxFauquier
Floy d
Fluv anna
Frank lin
Frederick
Gi les
Glo
uces
ter
Gooc h land
Greene
Greensv il le
Hal ifax
Hanover
Henrico
Hen ry
Highland
Isle O
f Wight
Jam
es City
Ki ng And Queen
King Wi ll iam
Lancaster
Loudoun
Louis a
Lunenburg
Mad is on
Mathews
Meck lenburg
Middl esex
Montgom ery
Nels on
New Kent
No
rthamp
ton
Northumberland
No ttoway
Orange
Page
Patrick
Pi t ts ylv ania
Powhatan
Princ e Edward
Princ e G
eorge
Princ e Wi l liam
Pu laski
Rappahannock
Richmond
Roanok e
Rock bri dge
Rock ingham
Shenandoah
Sou thampton
Spo tsy lv ania
Staffo rd
Surry
Sussex
Warren
Wes tm
ore land
York
Alex andria Ci ty
Charlottes vi lle Ci ty
Ches apeake Ci ty
Danv il l e Ci ty
Fairfax City
Hampton Ci ty
Lynchburg
Norfolk
Richmond Ci ty
Roanok e
Salem City
Suffo lk Ci ty
Virgi nia Beach City
Recycling Rate Reporting Units for CY 2005
GREEN 25% or more
YELLOWYELLOW At least 15% but less than 25%
PINKPINK Below 15%
Ports mouth Ci ty
Newport News City
King GeorgeFrede rick sburg
Woodbridge
Harris onbu rg
Lo rton
Spring field
9.8% 10.6% 13.7% 13.9%14.9% 6.9%
6.3%
10.5%
14.9%
12.3%
1.8%
32 Source: DEQ

45
Figure 11: Recycling Rate Distribution Map of Virginia 200633
Bland
Buchanan
Dickenson
Grays onLee
Russel l
Scott
Smy th
Tazewel l
Was hi ng ton
Ab ingdon
Wise
Wy the
Bristol City
Acc
omack
Albemarle
Al leghany
Am el ia
Am herst
Appomattox
Arl ington
Augusta
Bath
Bedford
Botetourt
Bruns wick
Buck ingham
Campbell
Carol i ne
Carrol l
Charles City
Charl otte
Ches terfie ld
Cla rk e
Craig
Cu lpeper
Cumberland
Di nwiddie
Essex
Fa irfaxFauqui er
Floyd
Fl uv anna
Frank li n
Frederick
Gil es
Glo
uces
ter
Gooc h land
Greene
Greensv il le
Hal ifax
Hanover
Henri co
Henry
Highl and
Isle O
f Wight
Jam
es City
King And Queen
King Will iam
Lancaste r
Loudoun
Louis a
Lunenburg
M ad ison
Mathews
M eck l enburg
Middlesex
M ontgom ery
Ne lson
New Kent
No
rthamp
ton
Northumberland
Nottoway
Orange
Page
Patrick
Pi tts ylv an ia
Powhatan
Princ e Edward
Princ e G
eorge
Pri nc e Wil liam
Pu laski
Rappahannock
Richmond
Roanok e
Rock bri dge
Rock ingham
Shenandoah
Southampton
Spotsy lvania
Sta ffo rd
Surry
Sussex
Warren
Wes tm
ore land
York
Al ex andria Ci ty
Charl ottes vi lle Ci ty
Ches apeake City
Danv il l e Ci ty
Fa irfax City
Hampton City
Lynchburg
Norfolk
Ri chmond City
Roanoke
Salem City
Suffolk City
Vi rgi nia Beach City
Recycling Rate Reporting Units for CY 2006
GREEN 25% or more
YELLOWYELLOW At least 15% but less than 25%
PINKPINK Below 15%
Ports mouth City
Newport News City
Ki ng GeorgeFredericksburg
Woodbridge
Harris onburg
Lorton
Spring fiel d
11% 10.2% 12.2% 8.5%
10.5%
13.2%
7.6%11%
9.9% (Manassas Park)
24.3% (Alexandria)
Comparing the two maps, it is notable that in the 2006 map, there are more green areas, a
bit more yellow, and much less pink. In the 2005 map, there are 12 SWPUs in pink, meaning
these 12 SWPUs have the reported recycling rates less than 15%. However, in the 2006 map,
there are only nine SWPUs in pink. In total, between 2005 and 2006, seven SWPUs remained in
pink, three turned from pink to yellow, two turned from pink to green, and two SWPUs changed
from yellow to pink.
In examining the mandated recycling rates, of the 74 SWPUs, 31 belong to the 25%
group and 43 belong to the 15% group. According to the 2005 recycling data, 61 out of 74
SWPUs have met or exceeded the mandated thresholds, of which 32 and 29 have met or
exceeded the 15% and 25% thresholds respectively. For 2006 the mandated numbers remained
33 Source: DEQ
46
the same. However, there is an increase in the number of SWPUs meeting the required rates,
from 61 to 64, and this increase of 3 SWPUs in attributed totally to the 15% mandated group.
Consequently, this increase of 3 SWPUs meeting the mandated rates from 2005 to 2006, equates
with an increase of 4.05 percentage points from 82.43% in 2005 to 86.48% in 2006.
� Urban vs. Rural SWPUs
Distinction between urban and rural areas has always been an interest in general policy
research, and so is it within the scope of this study. The following two tables present the
comparison between urban and rural SWPUs, in terms of their recycling rate, recycling tonnage,
local recycling budget, state funding, meeting mandated rates status, and responsiveness to the
survey. The key difference between the two tables is that Table 12 uses the US Census Bureau
definition of urban to differentiate urban and rural SWPUs while Table 13 uses the Virginia
definition of urban.
The US Census Bureau definition of urban states that “urban areas equate to SWPUs
with population density equal to or greater than 1,000 people per square mile with some
exceptions given to SWPUs with some big cities.” Whereas, §10.1-1411 of the Code of Virginia
specifies that “urban areas equate to SWPUs with population density greater than or equal to
100 people per square mile.”
Table 12: Urban vs. Rural SWPUs (by US Census Bureau definition of urban)
Total Urban Rural
74 23 51
Recycling rate 38.4% 42.3% 27.9%
Recycling tonnage
(million tons)
3.7 2.9
(78.9%)
0.8
(21.1%)
Average (tons) 49,982.44 126,912 15,288.7

47
Recycling budget
(million $)
31.4 24.7
(78.7%)
6.7
(21.3%)
Average ($) 424,729.5 1,074,808.9 131,556.5
State Funding
(thousand $)
557 210
(37.6%)
347
(62.4%)
Average ($) 7,528.3 9,112 6,814
Meeting mandate 64 (86.48%) 21 (91.3%) 43 (84.3%)
Response 57 15 (65.2%) 42 (82.4%)
Source: Based on authors’ calculations from the compiled dataset (SWPUs survey, US Census 2000, Bureau of Economic Analysis, and VA DEQ).
Table 13: Urban vs. Rural SWPUs (by Virginia definition of urban)
Total Urban Rural
74 37 37
Recycling rate 38.4% 40.33% 23.99%
Recycling tonnage
(million tons)
3.7 3.4
(91.5%)
0.3
(8.5%)
Average (tons) 49,982.44 91,438 8,527
Recycling budget
(million US$)
31.4 29.2
(93%)
2.2
(7%)
Average (US$) 424,729.5 790,447 59,012
State Funding
(thousand US$)
557 334
(59.9%)
223
(40.1%)
Average (US$) 7,528.3 9,016 6,041
Meeting mandate 64 (86.48%) 34 (91.9%) 30 (81.08%)
Response 57 28 (75.68%) 29 (78.38%)
Source: Based on authors’ calculations from the compiled dataset (SWPUs survey, US Census 2000, Bureau of Economic Analysis, and VA DEQ).
According to the US Census Bureau definition of urban, there are 23 urban and 51 rural
SWPUs, while according to the Virginia definition of urban; there are 37 SWPUs of each group.

48
The similarity between the two tables is that urban SWPUs consistently report higher recycling
rates, higher amounts of recycling tonnage, higher recycling budgets per SWPU, higher state
funding per SWPU, and greater ability to meet mandated rates. This comparison is supported by
the econometric estimates to be presented in the next part of this report.
It is important to note that the magnitude of the differences between the two groups is not
the same in the two tables. Again, there is consistency as the differences indicated in Table 13
are always larger than those documented in Table 12. For illustration, the difference in recycling
rates between urban and rural SWPUs in Table 12 is 14.4 percentage points while that reported
in Table 13 is 16.34 percentage points34. Likewise, in Table 12, the tonnage recycled by urban
SWPUs is 3.625 times higher than that recycled by rural SWPUs, while the number in Table 13
is much higher, 11.33 times35. These facts can most likely be attributed to the wider range of the
Virginia definition of urban, which captures more SWPUs in the urban category, and thus
widening the gap between urban SWPUs and rural SWPUs. Local recycling budget, state
funding, and meeting mandated rates also show gaps between the two tables, and thus, between
the two definitions. Urban SWPUs in Table 12 has average local recycling budgets of 8 times
higher than rural SWPUs while the gap shown in Table 13 is more than 13 times36. Similarly, the
difference in average state funding between urban and rural SWPUs in Table 13 is higher than
that in Table 12 ($2,975 compared to $2,298)37. The same situation applies in calculation of the
difference in meeting mandated rates between the two groups as the meeting mandated rate
34 Calculated by taking the difference between recycling rates of urban and rural SWPUs. 35 Calculated by dividing the total recycling tonnage of urban SWPUs by that of rural SWPUs. 36 Calculated by dividing the average local recycling budget of urban SWPUs by that of rural SWPUs. 37 Calculated by taking the difference between average state funding of urban and rural SWPUs.

49
among urban SWPUs in Table 13 is around 10 percentage points higher than the rate among
rural SWPUs while the gap in Table 12 is only 7 percentage points38.
� Response vs. Non-response SWPUs
It is instructivve to report summary statistics of response and non-response in a survey.
The reason for this is to determine any biases in response rate, the results of which would
probably direct implications for future surveys. Table 14 provides a comparison between
response and non-response SWPUs in terms of their recycling rates, recycling tonnage,
population size, area, average number of localities within an SWPU39, average income, and
educational attainment, state funding, and meeting threshold rates.
Table 14: Response vs. Non-response SWPUs
Total Response Non-response
74 57 17
Recycling rate 38.4% 35.81% 40.76%
Recycling tonnage
(million tons)
3.7 1.9
(50.3%)
1.8
(49.7%)
Average (tons) 49,982.44 32,625.67 108,178.7
Population
(million people)
7.7 4.6
(59.74%)
3.1
(40.26%)
Average (people) 103,884 80,633 181,843
Area (square miles) 39,601.92 27,674.08
(69.9%)
11,927.84
(30.1%)
Average (square miles) 535.2 485.5 701.6
Average # of localities 4.4 3.77 6.53
Average Income ($) 30,930.13 30,066.84 33,951.66
38 Calculated by subtracting the meeting threshold rate among urban SWPUs by that among rural SWPUs. 39 As each SWPU may cover several counties, cities, and towns, this variable asks for the total number of localities/units that each SWPU covers.
50
Educational attainment 20.95% 20.11% 23.87%
State Funding
(thousands $)
557 388.4
(69.7%)
168.6
(30.3%)
Average ($) 7,528.3 6,814 9,923
Meet mandate 64 (86.5%) 47 (82.46%) 17 (100%)
Source: Based on authors’ calculations from the compiled dataset (SWPUs survey, US Census 2000, Bureau of Economic Analysis, and VA DEQ).
As of November 29th, 2007 the Project Team40 received 57 responses and 17 non-
responses, making the response rate 77% Interestingly, the response rate of urban SWPUs is
lower than that of rural SWPUs. Compared to respondent SWPUs, non-respondent SWPUs
report higher recycling rates (40.76% vs. 35.81%), higher average recycling tonnage (108,178.7
tons vs. 32,625.67 tons), bigger population size (almost 182 thousand people compared to only
81 thousand on average among response SWPUs), larger area (701.6 square miles vs. 485.5
square miles), higher average income (almost 34 thousand dollars compared to merely 30
thousand dollars), higher educational attainment (23.87% vs. 20.11%), and higher state funding
per SWPU ($9,923 vs. $6,814). It is also interesting that 100% of the non-respondent SWPUs
meet the required recycling rates, while the number for respondent SWPUs is only 82.46%.
Average number of localities within SWPUs, a newly generated variable, indicates that
non-respondent SWPUs contain more localities than respondent SWPUs on average. For
illustration, the average number of localities of the non-response group is 6.53, higher than that
of the response group, which is only 3.77.
It seems like the missing SWPUs in the survey are not randomly distributed. This means
that the response rate might have been affected by some specific determinants. In order to answer
40 The Project Team refers to the three co-authors of this report.

51
this question, an econometric probit model41 was used to determine the significance and
magnitude of the impacts of measured determinants on SWPU response rate. The estimated
model is significant at 10%. Significant differences have been found between the two groups
with several determinants having an impact on the responsiveness of SWPUs to this survey.
These determinants include the number of localities within an SWPU, population size, recycling
tonnage, and average income. For example, having one more locality within an SWPU
decreases the probability of that SWPU’s responding to our survey by 4.4 percentage points42.
These results support the previous conclusion concerning the relationship between SWPUs’
response rate and the number of localities located within an SWPU bulkiness.
Multivariate Regression Results
As mentioned, the Project Team used multivariate regression models to estimate the
relationship between recycling rate/tonnage and various determinants. Table 15 below illustrates
descriptive statistics of all the variables, including recycling rate, recycling tonnage, and all
determinants. Definitions of the variables can be found in the methodology part of this report.
Table 15: Descriptive Statistics
Variable # of obs. Mean Range
Recycling rate 2006 74 27.703 (10.882)
7.6 - 55.1
Recycling tonnage 2006 74 49,982.45 (129,059.4)
624 – 908,103
Local recycling budget 54 582,036.7 (1,846,405)
0 - 1.15e+07
State funding 74 7,528.279 (9,136.947)
0 – 51262.5
Educational attainment 72 20.949 8.28 – 63.7
41 In statistics, a probit model is a popular specification of a generalized linear model, using the probit link function, in which the dichotomous dependent variable is the probability of response. 42 See Appendix – Table 2 for more estimates on the impacts of population size, recycling tonnage, and average income on the probability of an SWPU’s responding to the survey.

52
(13.259) Average income 72 30,930.13
(9,616.573) 20,085 – 61,147
Population density 74 926.67 (1,791.356)
6.04 – 9,023.32
Mandated recycling rate 74 .419 (.497)
0 – 1
State funding & Urban/rural (US Census Bureau definition of urban)
74 2,832.112 (8,595.519)
0 – 51,262.5
State funding & Urban/rural (Virginia definition of urban)
74 4,508.023 (9,501.79)
0 – 51,262.5
Recycling budget & Urban/rural (US Census Bureau definition of urban)
54 457,788.9 (1,858,128)
0 - 1.15e+07
Recycling budget & Urban/rural (Virginia definition of urban)
54 541,602.7 (1,856,525)
0 - 1.15e+07
Recycling budget & Average income
53 2.23e+10 (7.04e+10)
0 - 4.32e+11
Recycling budget & area 54 6.57e+08 (3.82e+09)
0 - 2.81e+10
Recycling budget & population size 54 3.03e+11 (1.68e+12)
0 - 1.21e+13
State funding & Average income 72 2.57e+08 (4.30e+08)
0 - 3.09e+09
State funding & area 74 6,905,660 (1.42e+07)
0 - 7.91e+07
State funding & population size 74 2.21e+09 (8.05e+09)
0 - 5.18e+10
Note: Standard deviations appear in parentheses below unweighted means. Source: Based on authors’ calculations from the compiled dataset (SWPUs survey, US Census 2000, Bureau of
Economic Analysis, and VA DEQ).
Except for recycling rate, educational attainment, average income, and mandated
recycling rate, other variables are rather widespread.43 For example, recycling tonnage 2006
reports a mean of 49,982.45 tons and a standard deviation44 (or deviation from the mean) of
43 With standard deviations significantly higher than unweighted means. 44 In probability and statistics, the standard deviation of a random variable is a measure of the spread of its values. It is defined as the square root of the variance. Standard deviation, being the square root of that quantity, therefore measures the spread of data about the mean, measured in the same units as the data.
53
129,059.4 tons. A look at the range of the indicator (from 624 to 908,103 tons) supports the
argument.
The average recycling rate documented in this table is different from the number reported
in the summary statistics because this number is calculated by taking the average of the recycling
rates of all 74 SWPUs while the previous one is calculated by dividing the total recycling
tonnage by total waste for the entire State of Virginia. Likewise, local recycling budget also
demonstrates different average number compared to the previously mentioned one because the
previous average is calculated by dividing total recycling budget by 74 while with this average,
the denominator is only the number of SWPUs having responded to the survey with budget
information.
The following tables present interpretation of some key results of the regression models.
All the models are significant at 5% with 53 observations. Table 16 reports results from the
models of recycling performance on the basic set of independent variables45. Table 17
demonstrates results from the models run on the full set including the interaction variables46 to
test for potential targeting of funding. The results highlighted in the tables are of only those
determinants that have impacts at 10% statistical significance at least on recycling performance.
Some of these determinants are significant in the US Census Bureau definition of urban models,
some are significant in the Virginia definition of urban models, and some are significant in both
(see number of asterisks).
45 The basic set of independent variables includes: population density, urban/rural dummy variable, educational attainment, average income, mandated recycling rate, state funding, and local recycling budget. 46 The full set of independent variables includes the basic set and eight interaction variables, which are state funding and urban/rural, three variables of state funding and population size, area, and average income respectively, recycling budget and urban/rural, and three variables of recycling budget and population size, area, and average income respectively.

54
Table 16: Determinants of Recycling Performance – Interpretation of Key Results47
(Basic set of independent variables)
Recycling rate
Population density* An SWPU with population density of 1,000 more
people per square mile is likely to have recycling rate
of 2.8 less percentage point.
Urban/rural* Being an urban SWPU is likely to have 10.53 more
percentage point in recycling rate.
Mandated recycling rate** Being in the 25% mandated group makes it likely for
an SWPU to have 8.48 more percentage point in
recycling rate.
State funding* An additional $10,000 allocated to an SWPU as state
funding is likely to make a 3 percentage point increase
in recycling rate.
Recycling tonnage
State funding*** An additional $10,000 allocated to an SWPU as state
funding is likely to make an increase of 20,289 (US
Census Bureau definition of urban) or 19,450 tons
(Virginia definition of urban) recycled.
Local recycling budget*** An additional $10,000 spent on recycling budget is
likely to make an increase of 270 (US Census Bureau
definition of urban) or 277 tons (Virginia definition of
urban) recycled.
Note: * statistically significant when using US Census Bureau definition of urban, ** Virginia definition of urban, and *** both.
Source: Based on authors’ calculations from the compiled dataset (SWPUs survey, US Census 2000, Bureau of Economic Analysis, and VA DEQ).
As can be seen from Table 16, population density indicates a negative relationship with
recycling performance, which means SWPUs with higher population density are likely to have
47 See Appendix – Table 3 for more details (more variables and more coefficients).

55
lower recycling rate. This result is supported throughout the models in this report, except for the
one of recycling tonnage on the full set of variables. This is a strange result and counter to our
hypothesis that recycling performance is subject to economies of scale.
Consistently these models report, urban/rural dummy variable and mandated recycling
rate are positively related to recycling performance. This means that being an urban SWPU
and/or being in the 25% mandated group equates with increasing an SWPU’s recycling
rate/tonnage. These results are similar to those reported in the summary statistics and are useful
for policy recommendations stated later in this report.
State funding and local recycling budget, especially state funding, prove to have
statistically and also economically significant impacts on recycling performance. This means
investment in recycling, especially by the state government, would bring sizable benefits.
Table 17: Determinants of Recycling Performance – Interpretation of Key Results48
(Full set including interaction variables)
Recycling rate
Population density* An SWPU with population density of 1,000 more
people per square mile is likely to have recycling rate
of 4.15 less percentage point.
Mandated recycling rate*** Being in the 25% mandated group makes it likely for
an SWPU to have 9.75 (US Census Bureau definition
of urban) 8.84 (Virginia definition of urban) more
percentage point in recycling rate.
Recycling budget & urban/rural*
An additional $10,000 spent by an urban SWPU on
recycling yields 0.347 more percentage point in
recycling rate than if spent by a rural SWPU.
State funding & area* An additional $10,000 allocated to an SWPU with
48 See Appendix – Table 4 for more details (more variables and more coefficients).

56
one square mile larger of area is likely to make a
0.00786 percentage point decrease in recycling rate.
Recycling tonnage
Population density*** An SWPU with population density of 1,000 more
people per square mile is likely to recycle 8,938 tons
less (US Census Bureau definition of urban) and
5,308 tons more (Virginia definition of urban).
Educational attainment*** An additional percentage point in an SWPU’s
average number of people 25 years old or more with
bachelor’s degree or higher is likely to recycle 849.67
tons less (US Census Bureau definition of urban) or
1,061.7 tons less (Virginia definition of urban).
Average income*** An additional $1,000 in an SWPU’s average income
makes it likely for the SWPU to recycle 2,593 tons
more (US Census Bureau definition of urban) or
1,341 tons more (Virginia definition of urban).
State funding* An additional $10,000 allocated to an SWPU as state
funding is likely to lead to an additional 73,337
recycled tons increase.
Local recycling budget** An additional $10,000 spent by an SWPU recycling
is likely to lead to an additional 1,139 recycled tons
increase.
State funding & urban/rural*
An additional $10,000 allocated to an urban SWPU
as state funding is likely to create an additional
53,225 tons more recycled than allocate the same
amount to a rural SWPU.
Recycling budget & urban/rural*
An additional $10,000 spent on recycling budget by
an urban SWPU increases the recycled tonnage by
519 tons more than if the same amount is spent by a
rural SWPU.
Recycling budget & An additional $10,000 spent on recycling budget by

57
income** an SWPU with one additional dollar in average
income would decrease the recycling tonnage by
0.016.
Recycling budget & area** An additional $10,000 spent by an SWPU with one
square mile larger of area on recycling is likely to
make a decrease of 0.491 tons recycled.
Recycling budget & population*
An additional $10,000 spent on recycling budget by
an SWPU with one more people per square mile is
likely to make a decrease of 0.002 tons recycled.
State funding & income* An additional $10,000 allocated as state funding to an
SWPU with one additional dollar in average income
would decrease the recycling tonnage by 3.179.
State funding & area*** An additional $10,000 allocated as state funding to an
SWPU with one square mile larger of area on
recycling is likely to make a decrease of 18.786 (US
Census Bureau definition of urban) and 17.647
(Virginia definition of urban) tons recycled.
State funding & population***
An additional $10,000 allocated as state funding to an
SWPU with one more people per square mile is likely
to make an increase of 0.443 (US Census Bureau
definition of urban) and 0.39 (Virginia definition of
urban) tons recycled.
Note: * statistically significant when using US Census Bureau definition of urban, ** Virginia definition of urban, and *** both.
Source: Based on authors’ calculations from the compiled dataset (SWPUs survey, US Census 2000, Bureau of Economic Analysis, and VA DEQ).
Similar to the results in Table 16, mandated recycling rate, state funding, and local
recycling budget continue to demonstrate positive relationships with recycling performance.
Average income is also positively related to recycling tonnage. This means that SWPUs with
higher average income are likely to recycle more, which is reasonable as people with higher

58
income are in a better financial position to afford recycling storage space and transportation cost.
Educational attainment, on the other hand, shows a counterintuitive negative relationship with
recycling performance. This means that SWPUs containing citizens with higher levels of
educational attainment are on average less likely to recycle. This result remains unexplainable.
Just like basic variables, interaction variables in Table 17 indicate some expected and
some unexpected results. First, interaction variables with an urban/rural dummy variable
consistently show strong positive impacts on recycling performance This not only reiterates that
urban SWPUs are likely to recycle more than rural ones, but also unveils an interesting
implication that funding or investing in recycling programs in urban SWPUs is more effective
than in rural ones.
Interaction variables with area, on the other hand, show a negative relationship. This
means that state funding allocated to or recycling budget spent on recycling in SWPUs of larger
area is less efficient than dollars spent in SWPUs of smaller area. This result can be explained by
transportation cost which makes it more difficult to collect recyclable materials from households
located in a widespread area.
Third, interaction variables with population size document different results in different
models and is for this reason unexplainable. It can be stated that state funding allocated to higher
populated SWPUs is more efficient than state dollars allocated to lower populated ones.
However, the local budget spent by higher populated SWPUs turns out to be less efficient. This
raises a question of how local recycling budget is defined and spent by SWPUs. The Project
Team experienced difficulty when trying to get this local recycling budget information from
SWPUs. Some of them responded with huge budget numbers which include administrative fees
and budget for recycling programs; some provided with modest numbers including only

59
administrative fees (salary) for half or one full-time recycling official; and some even reported
no budget as they have no assigned employee to work on recycling program and all recycling
activities are contracted out to private firms.
Combining the results of interaction variables with population size, area, and population
density, one can see that the sign of the population density interaction variables is sometimes
positive and sometimes negative.49 Specifically there is a positive relationship of population size
interaction variables with recycling performance and negative relationship of area interaction
variables with recycling performance, which equate to an ambiguous relationship between
population density interaction variables and recycling performance. The final result illustrates an
overall negative relationship with recycling performance. It can be argued that the area effects
(i.e., the transportation costs effects) have outperformed the population size effects (i.e., the
economies of scale effects).
Finally, another challenging interpretation is related to the interaction variables with
average income. These variables illustrate a negative relationship with recycling performance.
This means that the allocation of funding to or spending money in higher income SWPUs is less
efficient in improving recycling performance than allocating to or spending in lower income
SWPUs. Though the magnitude of the relationship is not large, the relationship is worth
considering. One explanation for the negative sign is probably the diminishing returns to
investment. It was obvious in the basic models50 that higher income SWPUs are likely to recycle
more than lower income ones, possibly due to affordability. Thus, the story that these interaction
variables tell is that the returning benefit of an additional dollar allocated to or spent in richer and
already recycling dedicated SWPUs is smaller than if the dollar is allocated to or spent in poorer
49 Remember that population density is calculated by dividing population size by area. 50 Refer back to table 16.

60
SWPUs, which are still at lower levels of recycling. This raises another policy implication of
needs versus effectiveness in the targeting of funding. In this case, it seems like both
requirements, needs and effectiveness, are met in lower income SWPUs.
Policy Recommendations
Public sector recommendations
The previous section presents results from the regression models and some interpretations
of the results. In this part of the report, some policy recommendations are provided based on the
interpretation of the statistical results discussed in detail above.
First, state funding has consistent positive impacts on SWPU recycling effort. Moreover,
funding urban and highly-populated SWPUs has proven to be more effective than funding of
rural and geographically large SWPUs. Thus, it is recommended that the State focus on
additional funding for recycling in urban and highly-populated SWPUs.
Second, besides urban/rural status and population size, it is also important to include
average income in the priority list of funding criteria as indicated in the previous section of this
report. The regression results show that lower income SWPUs are those mostly in need for
funding and potentially more efficient in recycling performance improvement.
Third, the local recycling budget sometimes significantly affects recycling performance
and sometimes does not. Like state funding, recycling budget spent by urban SWPUs is more
effective than spent by rural SWPUs. However, budget spent by SWPUs with bigger population,
larger area, and higher average income turns out to be less effective. As explained in the previous

61
section, large SWPUs might have suffered from diseconomies of scale51 or local budgets might
not have been efficiently allocated. We suggest more training and instructions on recycling be
provided to the localities; and/or if feasible, SWPUs should be rearranged in the future towards
more SWPUs covering less area.
Fourth, it was obvious that SWPUs assigned to the 25% mandated recycling rate are
more likely to have better recycling performance. Within the limitations of the study, the Project
Team has not been able to answer the question as to whether this is because these SWPUs have
more pressure to meet the threshold, or the results just report reality that SWPUs that belong to
the 25% mandated group are inherently more efficient in recycling effort. The policy
recommendation to raise current mandated rates, thus, remains unverified.
Last but not least, there are some small recommendations for future survey/research
activities in the field. As the number of localities within an SWPU has a significant impact on
whether or not that SWPU responded to our survey, we would recommend using smaller units of
analysis, for example smaller SWPUs (if these SWPUs can be rearranged) or counties, cities, and
towns instead of SWPUs, in future surveys. Also, it seems that the US Census Bureau definition
of urban of urban areas works better in regression models as a predictor of recycling
performance. We recommend using this definition for impacts/relationship approach of the topic.
Private sector recommendations – future research
The Project Team developed a survey instrument to send to the 699 firms identified by
the VEC to be operating within the Virginia recycling industry. Unfortunately, funding
shortfalls prohibited the distribution of the survey. Please see the Appendix for a copy of the
51 Diseconomies of scale characterizes a production process in which an increase in the scale of the firm causes an increase in the long-run average cost of each unit.

62
survey instrument. The collection of the data requested in this survey would resolve many of the
inaccuracies within the analysis of the private sector. First and foremost, the two simplifying
assumptions would no longer be needed. The survey seeks to identify the true percentage of
recycling activities occurring within each industry sector in Virginia. Therefore, the over-
application of the paper use rate from ISRI would no longer be needed. Rather, a value for the
actual use rate of construction and demolition recycled materials would be available. The same
would be true within the solid waste and specialized trucking industry sectors. The industry
survey would also allow a much more accurate estimate of employment to be made for 2007.
Specifically, the 10% rate of missing data within the VEC firm size data set would be resolved.
Beyond this, the next step is to collect recent and accurate revenue estimates from these
industry sectors. These data can then be used to determine whether or not revenues are actually
tracking employment trends. In this vein, it would be interesting to analyze the tax rates
imposed on these industries, especially because this is what matters most to the State
government. Any increase in state funding for recycling programs should equate with an
increase in general revenues available to the government. Sadly, tax revenue data was not
available to the Project Team. Therefore, this final component of this analysis must be left to
future researchers.

63
APPENDIX
Table 1: Gross Revenues for the Recycling Industry in VA
Industry Sector 2002(*) 2006(**) 2007(**)
Recyclable material merchant wholesalers
322,614,000 316,457,496.40 314,936,816
Materials recovery facilities
21,923,000 23,723,977.50 24,196,880.70
Core
Total 344,537,000 340,181,473.90 339,133,696.72
Pulp, paper, & paperboard mills
1242272500 1,139,141,841 1,114,725,759
Industrial building construction
75610500 60,944,654.36 57,746,277.75
Manufacturing
Total 1,317,883,000 1,200,086,495 1,172,472,037
Other specialized trucking, long-distance
88871040 123,893,797.70 134,623,814.32
Solid waste collection
207236352 252,794,785.90 265,670,697.10
Transportation
Total 296,107,392 376,688,583.60 400,294,511.42 Source: * 2002 U.S. Economic Survey **Authors’ calculations based on VEC data and 2002 U.S. Economic Census
Table 2: Probability of Survey Response
Variable Marginal effects Standard errors
Number of localities within SWPUs -.04422 .02115**
Population size 2.02e-06 .00000*
Area -.00006 .0002
Recycling rate 2006 -.00429 .00713
Recycling tonnage 2006 -4.98e-06 .00000*

64
State funding .00001 .00001
Urban/rural .13501 .16689
Average income -.00001 .00001*
Note: * denotes statistically significant at 10% and ** denotes statistically significant at 5%. Source: Based on authors’ calculations from the compiled dataset (SWPUs survey, US Census 2000, Bureau of
Economic Analysis, and VA DEQ).
Table 3: Determinants of recycling performance
(Basic set of independent variables)
Variable US Census Bureau definition of urban
Virginia definition of urban
Recycling rate
Population density -.0028 (.0016)*
-.0008 (.0011)
Urban/rural 10.5294 (6.2228)*
1.2210 (4.4234)
Educational attainment .0770 (.1862)
.0464 (.1911)
Average income .0004 (.0003)
.0002 (.0003)
Mandated recycling rate 6.2074 (3.8431)
8.4824 (5.0089)*
State funding .0003 (.0002)*
.0003 (.0002)
Local recycling budget -3.05e-07 (9.44e-07)
6.61e-07 (7.86e-07)
Constant 6.9966 (7.1994)
12.5123 (6.8431)*
Recycling tonnage Population density 3.3317
(4.6991) 4.7301
(3.2997) Urban/rural 5,230.289
(18,659.56) 11,754.22
(12,763.41) Educational attainment -534.6594
(558.3013) -523.6864 (551.2692)
Average income .1066 (.8761)
-.1757 (.8471)
Mandated recycling rate 17,154.83 (11,523.66)
9,055.934 (14,452.71)
State funding 2.0289 (.5947)***
1.9450 (.5769)***
Local recycling budget .0270 .0277

65
(.0028)*** (.0023)*** Constant -1,401.228
(21,587.75) 4,591.12
(19,745.42) Note: Standard errors in parentheses below marginal effects;
* denotes statistically significant at 10% and *** denotes statistically significant at 1%. Source: Based on authors’ calculations from the compiled dataset (SWPUs survey, US Census 2000, Bureau of
Economic Analysis, and VA DEQ).
Table 4: Determinants of recycling performance
(Full set including interaction variables)
Variable US Census Bureau definition of urban
Virginia definition of urban
Recycling rate Population density -.0041464
(.0021057)* -.0002789 (.0016074)
Educational attainment .2153446 (.2091902)
.071701 (.218673)
Average income .000656 (.000396)
.0004768 (.0003931)
Mandated recycling rate 9.752099 (4.12208)**
8.836536 (4.668294)*
State funding .0016349 (.0013408)
-.0001036 (.0013264)
Local recycling budget -.0000137 (.0000158)
.0000318 (.000023)
State funding & urban/rural .0000244 (.001063)
.0001129 (.0005744)
Recycling budget & urban/rural .0000347 (.000015)**
-.0000213 (.0000213)
Recycling budget & income -8.94e-11 (4.91e-10)
-5.49e-10 (5.00e-10)
Recycling budget & area 2.17e-08 (1.44e-08)
-1.26e-08 (1.01e-08 )
Recycling budget & population -6.88e-11 (4.61e-11)
4.20e-11 (3.17e-11)
State funding & income -2.26e-08 (5.15e-08)
3.48e-08 (5.04e-08)
State funding & area -7.86e-07 (4.58e-07)*
-2.05e-07 (3.09e-07)
State funding & population 1.93e-09 (3.54e-09)
-1.52e-09 (3.47e-09)
Constant -2.036246 (10.37675)
3.527044 (10.46312)
Recycling tonnage
Population density -8.938725 5.308219

66
(2.783609)*** (2.988783)* Educational attainment -849.6707
(276.5342)*** -1061.695
(406.6025)** Average income 2.592974
(.5234744)*** 1.341088
(.7308851)* Mandated recycling rate 2156.156
(5449.089) -4082.336 (8680.265)
State funding 7.533669 (1.772499)***
1.858854 (2.46636)
Local recycling budget .0330325 (.0208308)
.1139261 (.0428282)**
State funding & urban/rural 5.322542 (1.405238)***
.467138 (1.068057)
Recycling budget & urban/rural .0518992 (.0198709)**
-.0227227 (.0395474)
Recycling budget & income 1.19e-07 (6.49e-07)
-1.60e-06 (9.29e-07)*
Recycling budget & area .0000172 (.0000191)
-.0000491 (.0000189)**
Recycling budget & population -2.08e-07 (6.10e-08)***
2.08e-08 (5.90e-08)
State funding & income -.0003179 (.0000681)***
-.0000823 (.0000937)
State funding & area -.0018786 (.0006058)***
-.0017647 (.0005753)***
State funding & population .0000443 (4.68e-06)***
.000039 (6.46e-06)***
Constant -49024.97 (13717.31)***
-15558.24 (19455.21)
Note: Standard errors in parentheses below marginal effects; * denotes statistically significant at 10%, ** at 5%, and *** at 1%.
Source: Based on authors’ calculations from the compiled dataset (SWPUs survey, US Census 2000, Bureau of Economic Analysis, and VA DEQ).

67
Figure 2: Employment in VA Recyclable Material Merchant
Wholesalers Industry Sector 2002 to 2006
1,800
1,850
1,900
1,950
2,000
2,050
2002 2003 2004 2005 2006
Year
Avera
ge E
mp
loym
en
tFigure 1: Employment in VA Materials Recovery Facilities
Industry Sector 2002 through 2006
260
270
280
290
300
310
320
330
2002 2003 2004 2005 2006
Year
Avera
ge E
mp
loym
en
t

68
Figure 3: Employment in the VA Paper Manufacturing Industry
2002 to 2006
4,800
4,900
5,000
5,100
5,200
5,300
5,400
5,500
5,600
2002 2003 2004 2005 2006
Year
Av
era
ge
Em
plo
ym
en
t
Figure 4: Employment in VA Industrial Building Construction
2002 to 2007
1,500
2,000
2,500
3,000
3,500
4,000
4,500
2002 2003 2004 2005 2006
Year
Av
era
ge
Em
plo
ym
en
t

69
Figure 6: Employment in the VA Specialized Freight (except
Used Goods) Trucking, Long-Distance Industry Sector 2002 to
2007
500
1,000
1,500
2,000
2,500
2002 2003 2004 2005 2006
Year
Av
era
ge
w E
mp
loy
me
nt
Figure 5: Employment in the VA Solid Waste Collection
Industry 2002 to 2007
2,000
2,200
2,400
2,600
2,800
3,000
3,200
3,400
3,600
2002 2003 2004 2005 2006
Year
Avera
ge E
mp
loym
en
t

70
REFERENCES AND WORKS CITED
Berger, I.E. (1997). The Demographics of Recycling and the Structure of Environmental
Behavior. Environment and Behavior #29.
EPA. Municipal Solid Waste. 28 November 2007. Accessed 11/30/07.
http://www.epa.gov/epaoswer/non-hw/muncpl/recycle.htm
Gamba, R. J., & Oskamp, S. (1994). Factors Influencing Community Residents' Participation
in Commingled Curbside Recycling Programs. Environment and Behavior # 26.
Goldman, G., & Ogishi, A. (2001). The Economic Impact of Waste Disposal and Diversion in
California: A Report to the California Integrated Waste Management Board. Berkeley,
CA: California Integrated Waste Management Board.
Institute for Local Self-Reliance, Washington, DC, January 11, 2002. Recycling Sector Has a 30-
Year Record of Impressive Growth. Press release, available at:
http://www.ilsr.org/recycling/recyclingma.htm
Kinnaman, T. (2000). Explaining the Growth in Municipal Recycling Programs. Public Works
Management & Policy. 5.
Massachusetts Department of Environmental Protection. (2004). The Massachusetts
Recycling Economy. Boston, MA: Bureau of Waste Prevention.
Michigan Recycling Coalition. (2001). Michigan Recycling Measurement Project: The
Economic Impact of Recycling. Lansing, MI: State of Michigan.
National Recycling Coalition. (2001). U.S. Recycling Economic Information Study
Washington, DC: R.W. Beck, Inc.
71
North Carolina Department of Environment and Natural Resources. (1998). 1998 North
Carolina Markets Assessment of the Recycling Industry and Recyclable Materials
Raleigh, NC: State of North Carolina.
Northeast Recycling Council. (1996). Guide to Conducting State Recycling Economic
Development Finance Workshops. Brattleboro, VT: Northeast Recycling Council.
Pennsylvania Department of Environmental Protection, (2007).
http://www.dep.state.pa.us/dep/deputate/airwaste/wm/RECYCLE/Recycle.htm.
Retrieved September 13, 2007,
R. W. Beck (2001). Economic Impacts of Recycling in Iowa.
Roy F. Weston, Inc. (1996). Economic Benefits of Recycling in the Southern States.
Norcross, GA: Southern States Waste Management Coalition.
Shore, Michael. (1995). The Impact of Recycling on Jobs in North Carolina. Raleigh, NC:
North Carolina Recycling Business Assistance Center.
The White House Task Force on Recycling. Recycling... for the future: Consider the benefits.
Washington, DC: Office of the Environmental Executive, 1998. Available at:
http://www.ofee.gov/wpr/future.pdf