Embed Size (px)
Citation preview

Tony Lavender Phillipa Marks Sarongrat Wongsaroj
The economic benefits of LSA in 2.3 GHz in Europe
A report for Ericsson, NSN and Qualcomm
December 2013
Plum Consulting, London
T: +44(0)20 7047 1919, www.plumconsulting.co.uk
About Plum
Plum Consulting is a specialised consulting firm offering strategy, policy and regulatory advice on
telecoms, online and spectrum issues. We draw on economics, our knowledge of the sector and our
clients' perspectives to deliver soundly based solutions to problems. We are an international leader in
advising on spectrum policy and regulation. We work in many countries in Asia, Africa, the Americas
and Europe on issues affecting all uses of spectrum. Our clients include telecoms operators,
regulators, equipment vendors, broadcasters and online service providers. Many of our reports are
published and can be seen at http://plumconsulting.co.uk/publications.

© Plum, 2013
Preface
Mobile communications over the last few decades has contributed significantly to the economic and
social developments in Europe and other parts of the world. As today’s world is powered by
information, the opportunities created by Information and Communication Technology (ICT) are one of
the main impacting factors on how society is evolving. Given that the Internet has become an
indispensable tool in everyday life, access to the Internet on the move with ever growing bandwidth
requirements is also expected to become a key fundament of society. In many ways the mobile
internet will be the 21st century equivalent of train tracks and roads in the 19th and 20th century: the
prerequisite for but also a main trigger of economic growth.
Spectrum availability is the key enabler of mobile broadband. It is not just a question of spectrum
being available, but it is critical for spectrum to be available in a timely and harmonized manner.
Further, mobile broadband relies on exclusive spectrum to provide Quality of Service (QoS). Europe
has precious assets in the race towards mobile digital innovation, including its large population and its
technological expertise. But Europe also faces a unique challenge due to the widespread range of
legacy spectrum use in various states. In particular, the important 2.3-2.4 GHz frequency band is not
currently used in Europe to provide mobile broadband services; rather it is mainly used by a mix of
amateur services, Programme Making and Special Events (PMSE) and government use.
Licensed Shared Access (LSA), or Authorised Shared Access (ASA), has been identified by the
RSPG and the CEPT as one of the key tools to overcome the European spectrum challenge. LSA can
provide the best of both worlds, by unlocking bands in a harmonized manner at European level while
maintaining flexibility at national level. LSA is a national and voluntary decision and delivers
predictable quality of service. LSA is a complementary solution for mobile network operators to access
spectrum when critical incumbent uses cannot be vacated from a frequency band. It enables world-
class mobile infrastructure on the 2.3-2.4 GHz frequency band that can unlock European innovation
potential for connected products and services. Thus, LSA can contribute to achieving the targets of a
Digital Single Market.
The 2.3-2.4 GHz band - a band harmonized for mobile broadband at international level - is used by
many important services in some European countries, while being hardly used in other countries. This
study demonstrates the significant benefits the 2.3-2.4 GHz band can deliver for mobile broadband
Europe-wide if it is unlocked by LSA. Ericsson, NSN and Qualcomm encourage European regulators
to consider the study and its findings as a direct call to make the 2.3-2.4 GHz band available for
mobile broadband to benefit Europe through maximizing the economic contribution of this valuable
spectrum. Though the report focuses on the direct economic benefits of the approach, there is little
doubt that the indirect benefits would be much greater from Europe taking global lead in implementing
innovative and sustainable spectrum access methods.
© Plum, 2013
Table of Contents
Executive Summary .................................................................................................................................. 1
What is Licensed Shared Access? ........................................................................................................ 1
What is the extent of the sharing opportunity at 2.3 GHz? .................................................................... 2
The case for LSA at 2.3 GHz ................................................................................................................. 4
Benefits and costs of LSA at 2.3 GHz ................................................................................................... 4
1 Introduction ..................................................................................................................................... 6
1.1 Reason for the study ................................................................................................................. 6
1.2 What is Licensed Shared Access? ........................................................................................... 7
1.3 Study approach ......................................................................................................................... 9
2 Use of the 2.3 GHz band now and in future .................................................................................10
2.1 Global situation .......................................................................................................................10
2.2 European situation ..................................................................................................................10
2.3 Potential future availability of the band in Europe ...................................................................12
3 The case for LSA at 2.3 GHz .......................................................................................................14
3.1 There is potential demand for 2.3 GHz spectrum ...................................................................14
3.2 The band cannot be released Europe-wide on an exclusive basis for mobile
broadband ...............................................................................................................................18
3.3 Access to the band offers benefits ..........................................................................................18
3.4 Conclusions .............................................................................................................................20
4 Benefits and costs of LSA at 2.3 GHz ..........................................................................................21
4.1 Approach .................................................................................................................................21
4.2 Benefits arising from infrastructure cost savings ....................................................................21
4.3 Benefits under alternative mobile data growth scenario .........................................................27
4.4 Consumer surplus from new product ......................................................................................29
4.5 Summary of the net benefits of 2.3 GHz LSA .........................................................................30
Appendix A: Steps in calculating avoided costs of additional spectrum ................................................31
Appendix B: LSA modelling assumptions ...............................................................................................33
B.1 Geotype classification assumptions ........................................................................................33
B.2 Network assumptions ..............................................................................................................33
B.3 Infrastructure cost assumptions ..............................................................................................35
B.4 Traffic forecast assumptions ...................................................................................................36
B.5 Spectrum availability assumptions ..........................................................................................38
Appendix C: Assumptions specific to study countries ............................................................................40
C.1 Network assumptions ..............................................................................................................40
C.2 Traffic forecast assumptions ...................................................................................................40
C.3 Spectrum availability at 2.3 GHz .............................................................................................41
Appendix D: Elasticity of demand for mobile broadband .......................................................................42
Appendix E: Improved quality of service benefits ..................................................................................44

© Plum, 2013
E.1 Linear demand curve ..............................................................................................................44
E.2 Implications for the 2.3 GHz LSA analysis ..............................................................................45
© Plum, 2013 1
Executive Summary
The 2.3 GHz band was identified for IMT services at a global level at WRC-07. It has been
standardised for LTE TDD by 3GPP. In Europe the band is not currently used to provide mobile
broadband services; rather it is mainly used by a mix of amateur services (secondary), government
use (e.g. military, including aeronautical telemetry, emergency services and wireless cameras) and
PMSE applications (video links, wireless cameras)1. CEPT and ETSI have each initiated regulatory
activities aimed at harmonising the band for mobile broadband services in Europe, including
developing guidelines for the implementation of Licensed Shared Access (LSA) in the band. The
Radio Spectrum Policy Group (RSPG) adopted an opinion on Wireless Broadband spectrum in June
2013, including 2.3GHz spectrum, and in November 2013 adopted an Opinion on Licensed Shared
Access. This study commissioned by Ericsson, NSN and Qualcomm is intended to provide an input to
these regulatory activities.
What is Licensed Shared Access?
Licensed shared access is a regulatory framework for licensed sharing of bands that are already
assigned to a user(s) where the additional user is granted access through an individual authorisation
scheme following the terms set out in the Authorisation Directive2. This framework has the following
key features3:
Voluntary: The terms and conditions of any access to the band by a new user(s) would be agreed
between the incumbent user, the new user(s) and the regulator on a voluntary basis.
Mutually beneficial: Both the incumbent and the new user(s) need to have incentives to engage
in a sharing arrangement.
Legal certainty and quality of service: The new user in the band has exclusive licensed access to
the spectrum on the terms and conditions specified in its licence. Incumbent and new user(s)
systems will receive protection from harmful emissions. The new licensee(s) would be of equal
status to the incumbent.
Harmonised bands: To create and take advantage of scale economies, the bands in question are
likely to be harmonised for uses requiring significant additional spectrum access, in particular for
mobile broadband services.
Compatible with European regulation: The involvement of the regulator is required to ensure the
terms and conditions of access are compatible with the Authorisation Directive and any EU or
ECC measures prescribing least restrictive technical conditions for use of the band.
It is important to be clear that LSA is not about opportunistic access to a band through cognitive radio
or radio environment sensing, unlicensed access to a band, access to a band on a secondary basis or
spectrum trading.
1 The current and intended use in 40 CEPT countries is given in the ECC document FM (12)017rev1, 13 April 2012.
2 Directive 2002/20/EC
3 The definition given by ECC is given in draft ECC Report 205 (October 2013) which can be found at
http://www.cept.org/ecc/tools-and-services/ecc-public-consultation; The definition given in the RSPG Opinion on LSA
(November 2013) can be found at https://circabc.europa.eu/faces/jsp/extension/wai/navigation/container.jsp

© Plum, 2013 2
The administrative and functional implementation of LSA in the 2.3 GHz band is envisaged to be as
shown in Figure 1 and Figure 2, respectively.
Figure 1: Administrative implementation of LSA
Source: Draft ECC Report 205
Figure 2: Functional implementation of LSA
Source: Draft ECC Report 205
What is the extent of the sharing opportunity at 2.3 GHz?
The current and expected future use of the 2.3 GHz band was surveyed by CEPT in 2012. The survey
showed that current use varies by country and includes one or more of government use (e.g. military,
including aeronautical telemetry, emergency services, wireless video link) and PMSE applications
(video links, ENG) and amateur services (secondary)4. In terms of future use of the band the CEPT
survey showed that of the 40 countries surveyed 43% planned to use some or all of the band for BWA
or mobile services while 30% had no plans to change the use of the band and 27% were uncertain
about the future use of the band.
4 The current and intended use in 40 CEPT countries is given in the ECC document FM(12)017rev1, 13 April 2012.
© Plum, 2013 3
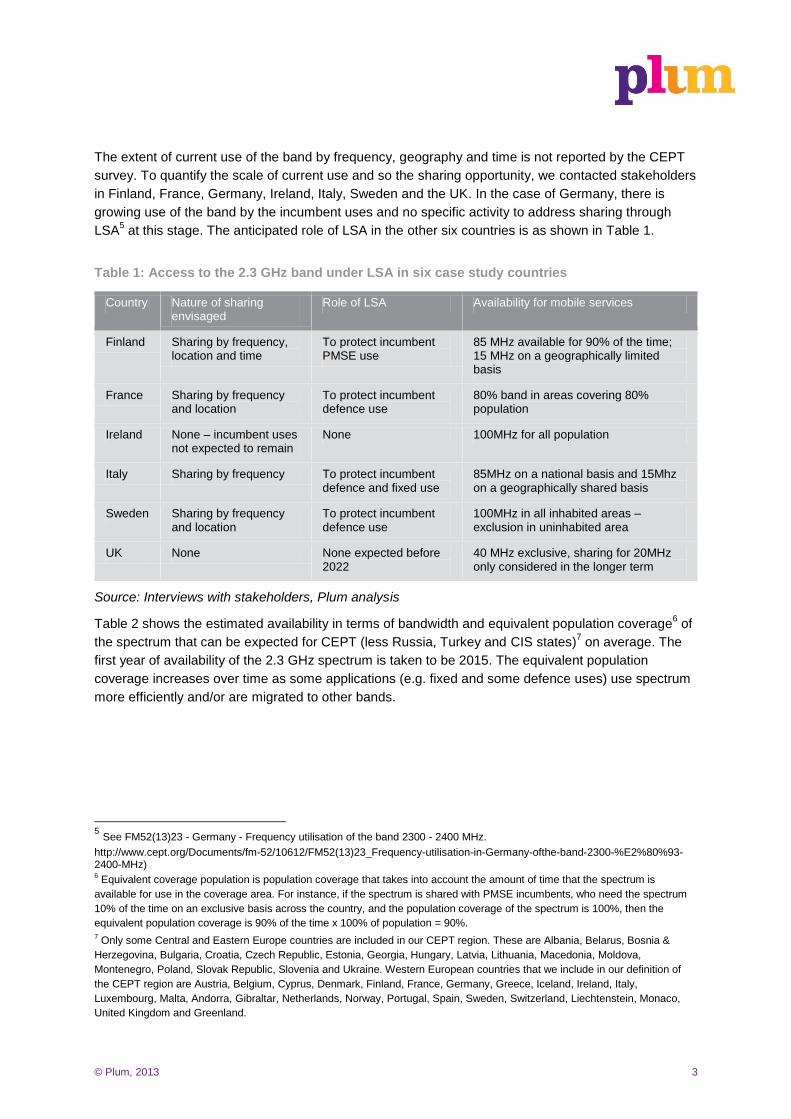
The extent of current use of the band by frequency, geography and time is not reported by the CEPT
survey. To quantify the scale of current use and so the sharing opportunity, we contacted stakeholders
in Finland, France, Germany, Ireland, Italy, Sweden and the UK. In the case of Germany, there is
growing use of the band by the incumbent uses and no specific activity to address sharing through
LSA5 at this stage. The anticipated role of LSA in the other six countries is as shown in Table 1.
Table 1: Access to the 2.3 GHz band under LSA in six case study countries
Country Nature of sharing envisaged
Role of LSA Availability for mobile services
Finland Sharing by frequency, location and time
To protect incumbent PMSE use
85 MHz available for 90% of the time; 15 MHz on a geographically limited basis
France Sharing by frequency and location
To protect incumbent defence use
80% band in areas covering 80% population
Ireland None – incumbent uses not expected to remain
None 100MHz for all population
Italy Sharing by frequency To protect incumbent defence and fixed use
85MHz on a national basis and 15Mhz on a geographically shared basis
Sweden Sharing by frequency and location
To protect incumbent defence use
100MHz in all inhabited areas – exclusion in uninhabited area
UK None None expected before 2022
40 MHz exclusive, sharing for 20MHz only considered in the longer term
Source: Interviews with stakeholders, Plum analysis
Table 2 shows the estimated availability in terms of bandwidth and equivalent population coverage6 of
the spectrum that can be expected for CEPT (less Russia, Turkey and CIS states)7 on average. The
first year of availability of the 2.3 GHz spectrum is taken to be 2015. The equivalent population
coverage increases over time as some applications (e.g. fixed and some defence uses) use spectrum
more efficiently and/or are migrated to other bands.
5 See FM52(13)23 - Germany - Frequency utilisation of the band 2300 - 2400 MHz.
http://www.cept.org/Documents/fm-52/10612/FM52(13)23_Frequency-utilisation-in-Germany-ofthe-band-2300-%E2%80%93-2400-MHz) 6 Equivalent coverage population is population coverage that takes into account the amount of time that the spectrum is
available for use in the coverage area. For instance, if the spectrum is shared with PMSE incumbents, who need the spectrum
10% of the time on an exclusive basis across the country, and the population coverage of the spectrum is 100%, then the
equivalent population coverage is 90% of the time x 100% of population = 90%. 7 Only some Central and Eastern Europe countries are included in our CEPT region. These are Albania, Belarus, Bosnia &
Herzegovina, Bulgaria, Croatia, Czech Republic, Estonia, Georgia, Hungary, Latvia, Lithuania, Macedonia, Moldova,
Montenegro, Poland, Slovak Republic, Slovenia and Ukraine. Western European countries that we include in our definition of
the CEPT region are Austria, Belgium, Cyprus, Denmark, Finland, France, Germany, Greece, Iceland, Ireland, Italy,
Luxembourg, Malta, Andorra, Gibraltar, Netherlands, Norway, Portugal, Spain, Sweden, Switzerland, Liechtenstein, Monaco,
United Kingdom and Greenland.

© Plum, 2013 4
Table 2: Comparison of estimated population x time coverage of 80 MHz8 of the 2.3 GHz band
with and without LSA implementation
Parameter 2015 2020 2025 2030
Equivalent population coverage with LSA
71% 83% 84% 84%
Equivalent population coverage without LSA
9
1% 17% 17% 17%
Source: Plum analysis
The case for LSA at 2.3 GHz
Our analysis shows that there will be potential demand for spectrum at 2.3 GHz to support future
mobile broadband traffic i.e. that demand will exceed current and planned future spectrum supply in
many locations. Without LSA only a minority of countries in Europe would be able to offer access to
the 2.3 GHz band. In particular, an ECC harmonisation measure could not be implemented without
LSA10
. The resulting market would not be sufficiently large for major operators to deploy the band and
for vendors to manufacture European handsets supporting the band. This is because it will not include
some core European markets e.g. Germany, France, Spain and the Netherlands.
The benefits offered to MNOs and possibly other operators by LSA and the 2.3 GHz band are reduced
network costs or the opportunity to generate additional revenue from customers, who are interested in
high capacity/low cost plans. In the latter case, the new product would also confer benefits in the form
of increased consumer surplus – i.e. consumers’ willingness to pay for the product over and above the
price they pay for it.
Shared use of 2.3 GHz will therefore complement planned exclusive release of the band in parts of
Europe. This will help to deliver the Europe-wide scale that European operators need to implement the
2.3 GHz band and to place orders for devices that support the band.
Benefits and costs of LSA at 2.3 GHz
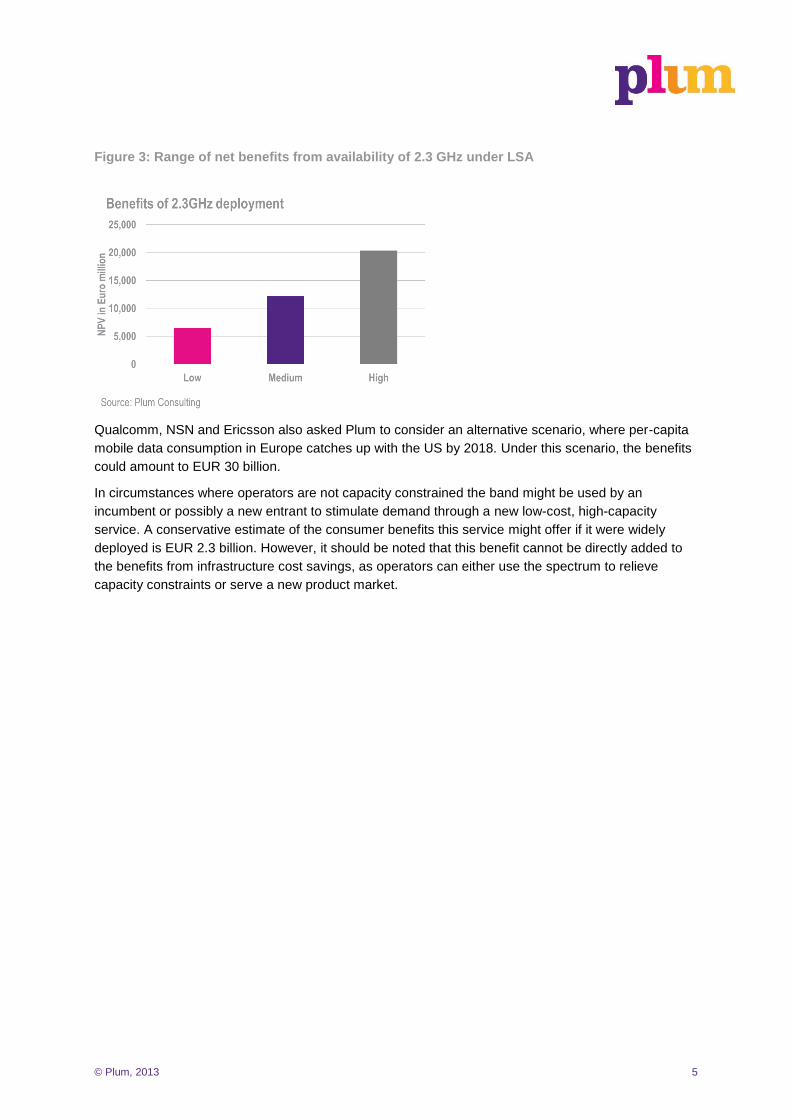
The availability of 2.3 GHz with LSA on a harmonised basis across Europe is estimated to yield
significant net benefits - ranging from EUR 6.5-22 billion as shown in Figure 3. The costs of making
the spectrum available are relatively small – around EUR 50 million plus administrative costs while our
medium estimate of the benefits from savings in infrastructure costs is around EUR 12 billion. We find
the need for the band to help support peak traffic demands varies considerably by country, largely
because of differences in traffic levels.
8 To allow for the same uplink and downlink capacities over TDD frequencies, we assume 2/3 of the bandwidth is used for
downlink transmission. Therefore, given a total of 80 MHz of usable bandwidth in the 2.3 GHz band, 53 MHz is the downlink
bandwidth. 9 A few relatively small countries (e.g. Ireland and Sweden) have plans to release the entire band in the absence of LSA.
10 Other countries have important incumbents that will remain in the band in the future, and therefore could not agree to an ECC
Decision harmonising the band exclusively for mobile/fixed communications networks (MFCN).
© Plum, 2013 5
Figure 3: Range of net benefits from availability of 2.3 GHz under LSA
Qualcomm, NSN and Ericsson also asked Plum to consider an alternative scenario, where per-capita
mobile data consumption in Europe catches up with the US by 2018. Under this scenario, the benefits
could amount to EUR 30 billion.
In circumstances where operators are not capacity constrained the band might be used by an
incumbent or possibly a new entrant to stimulate demand through a new low-cost, high-capacity
service. A conservative estimate of the consumer benefits this service might offer if it were widely
deployed is EUR 2.3 billion. However, it should be noted that this benefit cannot be directly added to
the benefits from infrastructure cost savings, as operators can either use the spectrum to relieve
capacity constraints or serve a new product market.

© Plum, 2013 6
1 Introduction
Spectrum sharing is likely to provide an increasingly important mechanism for meeting growing
demand for spectrum as low-cost opportunities for clearing bands to meet demand diminish. The
regulatory arrangements for sharing on a voluntary licensed basis are at early stage of development in
Europe. An approach to sharing initially called Authorised Shared Access (ASA)11
, now framed within
Licensed Shared Access (LSA), provides a regulatory framework for licensed sharing of bands that
are already assigned to a user(s) in return for compensation. The use of LSA could thereby increase
the utilisation of bands in a controlled way.
1.1 Reason for the study
The 2.3 GHz band was identified for IMT services at a global level at WRC-07. It has been
standardised for LTE TDD by 3GPP. In Europe the band is not currently used to provide mobile
broadband services; rather it is mainly used for a mix of amateur services (secondary), government
use (e.g. military, including aeronautical telemetry, emergency services and wireless cameras) and
PMSE applications (video links, wireless cameras)12
.
CEPT has initiated regulatory activities aimed at harmonising the band for mobile broadband services
in Europe (in FM52). This work is aimed at developing harmonised, least restrictive technical
conditions for use of the band by mobile broadband services and developing guidelines for the
implementation of Licensed Shared Access in the band (LSA) 13
. An ECC Decision addressing both
aspects is to be produced in June 2014. In addition FM53 is consulting on draft ECC Report 205 which
describes LSA and provides guidelines to CEPT administrations for the implementation of LSA14
.
FM53 is expected to finalise its work in September 2015.
It is expected that, while parameters critical to harmonisation15
will be adopted at CEPT level in order
to secure economies of scale, detailed implementation of LSA will be left to national administrations to
develop, taking account of specific national circumstances concerning incumbent use of the band.
In parallel ETSI has prepared a System Reference Document that contains market and technical
information for mobile broadband at 2.3 GHz under LSA16
. The RSPG adopted an opinion on Wireless
Broadband spectrum in June 2013, including 2.3 GHz spectrum, and in November 2013 adopted an
Opinion on Licensed Shared Access (LSA)17
.
This study is intended to provide an input to these regulatory activities. The report was commissioned
by Ericsson, NSN and Qualcomm to assess the economic benefits of LSA in the 2.3 GHz band in
Europe. The study also assesses the extent of the sharing opportunity in the 2.3 GHz band for mobile
11
The ASA concept is described in more detail in “Authorised Shared Access: an Innovative Model of Pro-Competitive
Spectrum Management, Parcu and Associates, 2012. 12
The current and intended use in 40 CEPT countries is given in the ECC document FM (12)017rev1, 13 April 2012. 13
These guidelines will build on earlier work on the compatibility between mobile services and incumbent uses of the band
undertaken by CEPT and reported in ECC Report 172. 14
Draft ECC Report 205 (October 2013) http://www.cept.org/ecc/tools-and-services/ecc-public-consultation 15
In particular, band harmonisation for MFCN and harmonised Least Restrictive Technical Conditions (LRTCs) both required to
enable standardisation and single implementation CEPT-wide 16
http://www.etsi.org/deliver/etsi_tr/103100_103199/103113/01.01.01_60/tr_103113v010101p.pdf 17
RSPG Opinion on LSA (November 2013): https://circabc.europa.eu/faces/jsp/extension/wai/navigation/container.jsp

© Plum, 2013 7
broadband services in six EU member states, the business models that may be enabled and the net
economic benefits this could deliver.
1.2 What is Licensed Shared Access?
The definition of LSA proposed by the RSPG in its Opinion on LSA is:
“A regulatory approach aiming to facilitate the introduction of radiocommunication systems
operated by a limited number of licensees under an individual licensing regime in a frequency
band already assigned or expected to be assigned to one or more incumbent users. Under the
Licensed Shared Access (LSA) approach, the additional users are authorised to use the spectrum
(or part of the spectrum) in accordance with sharing rules included in their rights of use of
spectrum, thereby allowing all the authorized users, including incumbents, to provide a certain
Quality of Service (QoS)”.
The RSPG notes that LSA is not intended as a new licensing regime but rather a regulatory approach
to facilitate a more efficient use of spectrum that is assigned by allowing additional licensed users
under a sharing framework.
Licensed shared access is therefore a regulatory framework for licensed sharing of bands that are
already assigned to a user(s) where the additional user is granted access through an individual
authorisation scheme following the terms set out in the Authorisation Directive18
. This framework as
elaborated in draft ECC documents and the ETSI system reference document has the following key
features:
Voluntary: The terms and conditions of any access to the band by a new user(s) would be agreed
between the incumbent user, the new user(s) and the regulator on a voluntary basis. The terms
and conditions will indicate access to the band in terms of the time, location and frequencies used
and the technical conditions governing use.
Mutually beneficial: Both the incumbent and the new user(s) need to have incentives to engage
in a sharing arrangement. For the new user(s) the incentives will be given by the benefits arising
from additional spectrum use, under the agreed terms and conditions. For the incumbent there
may be a financial payment or other forms of compensation (e.g. access to new services) from
the new licensee(s).
Legal certainty and quality of service: The new user in the band has exclusive licensed access to
the spectrum on the terms and conditions specified in its licence. Incumbent and new user(s)
systems will receive protection from harmful emissions. The new licensee(s) would be of equal
status to the incumbent. This gives the new user legal certainty over its rights, including their
tenure and a guaranteed quality of service, so that there is an incentive to invest in infrastructure
and place orders for devices supporting the band.
Harmonised bands: To create and take advantage of scale economies, the bands in question are
likely to be harmonised for uses requiring significant additional spectrum access, in particular for
mobile broadband services.
18
Directive 2002/20/EC

© Plum, 2013 8
Compatible with European regulation: The involvement of the regulator is required to ensure the
terms and conditions of access are compatible with the Authorisation Directive and any EU or
ECC measures prescribing least restrictive technical conditions for use of the band.
It is important to be clear that LSA is not about opportunistic access to a band through cognitive radio
or radio environment sensing, unlicensed access to a band, access to a band on a secondary basis or
spectrum trading. It is envisaged that LSA would mainly be applied in bands where incumbent users
do not have tradable spectrum rights but where they may be able to provide third parties with access
to a significant amount of spectrum on a long-term basis.
LSA can in principle be implemented in any underutilised band that can be shared in time, geography
and/or frequency. However, the particular application of the framework considered in this report is to
bands that are or may be harmonised and standardised for use by mobile broadband services.
The administrative and functional implementation of LSA in the 2.3 GHz band is envisaged to be as
shown in Figure 1-1 and Figure 1-2, respectively.
Figure 1-1: Administrative implementation of LSA
Source: Draft ECC Report 205
Figure 1-2: Functional implementation of LSA
Source: Draft ECC Report 205

© Plum, 2013 9
As shown in Figure 1-2 spectrum access is governed by the LSA repository, which contains
information received from the incumbent user(s) on spectrum availability/unavailability and the sharing
framework agreed with the regulator. The repository may be managed by the incumbent, the regulator
or be delegated to an independent trusted third party.
The firewalls shown between the incumbent user and the repository and the repository and the
licensee are required in order to provide a secure environment for information about incumbent
spectrum use and for operation of the LSA licensee’s network. Transmissions from a mobile user’s
device are only possible if they are activated by the LSA licensee19
.
1.3 Study approach
The key issues for the study are:
What is the extent of the spectrum sharing opportunity at 2.3 GHz?
What applications and business models might be supported by LSA at 2.3 GHz?
What are the benefits and costs of LSA at 2.3 GHz?
There is no publicly available information on the extent of current use of the 2.3 GHz band in terms of
what frequencies are used, over what geography and for what fraction of time. Hence the extent of
“spare” spectrum that might be accessed by mobile services is not known. To address this issue we
conducted interviews with incumbent users and/or regulators in seven CEPT countries, namely
Finland, France, Germany, Ireland, Italy, Sweden and the UK. The interviews provided information on
current use and the potential for sharing and this is reported in Section 2.
We considered the business models that might be supported by the available spectrum and this
allowed identification of the potential benefits and costs of LSA in the band (see Section 3). These
benefits and costs are quantified in the spreadsheet modelling which is reported in Section 4 and
Appendices A-E.
19
3GPP devices are only allowed to transmit when granted an uplink transmission slot by the base station. In the absence of
such transmission grants, they do not transmit.

© Plum, 2013 10
2 Use of the 2.3 GHz band now and in future
2.1 Global situation
Although the 2.3 GHz band was identified for IMT services at a global level at WRC-07 and has been
standardised for LTE TDD by 3GPP it is not yet widely used to provide mobile broadband services
using LTE technology. The main global region in which the spectrum has been assigned for this
purpose is the Asia Pacific region. For example, it has been assigned in Australia, China, Hong Kong,
India, Malaysia, New Zealand and Singapore. The GSA reports that there are 8 commercial LTE
deployments using the band as of July 201320
.
There are 147 single and multi-band devices that support the TDD implementation21
in the 2.3 GHz
band including some smartphones as well as dongles. In addition, the latest iPhone supplied to some
Asia-Pacific operators supports the 2.3 GHz band22
.
2.2 European situation
2.2.1 Uses of the band
In Europe the 2.3 GHz band is currently harmonised for fixed and mobile services on a primary basis
and for amateur and radiolocation services on a secondary basis23
. Current and expected future use
of the band was surveyed by CEPT in 2012. The survey showed that current use varies by country
and includes one or more government uses (e.g. military, including aeronautical telemetry, emergency
services, wireless video link) and PMSE applications (video links, ENG) and amateur services
(secondary)24
. In terms of future use of the band the CEPT survey showed that of the 40 countries
surveyed:
30% had no plans to change the use of the band
43% planned to use part or all of the band for mobile, BWA or on a technology and service neutral
basis and they accounted for around 36% of the population in the countries that responded to the
survey
27% were uncertain about the future long term use of the band.
LSA can facilitate the introduction of mobile/BWA services in the 2.3 GHz band in countries that have
not planned on releasing the entire band on an exclusive basis. The possibility of sharing the 2.3 GHz
spectrum under LSA in these countries makes it easier for a harmonised introduction of mobile service
in the band in Europe to take place, which would benefit all countries. In particular it would increase
substantially the potential market size in Europe and so stimulate the production of low-cost handsets
and other devices for the European market.
20
GSA, Status of the global LTE TDD market, July 20 2013 21
http://www.gsacom.com/news/gsa_385.php 22
http://www.apple.com/iphone/LTE/ 23
European Table of Frequency Allocations, ECC Report 25, http://www.erodocdb.dk/Docs/doc98/official/pdf/ercrep025.pdf 24
The current and intended use in 40 CEPT countries is given in the ECC document FM(12)017rev1, 13 April 2012.

© Plum, 2013 11
2.2.2 Quantifying current use and the sharing opportunity
The extent of current use of the band by frequency, geography and time is not reported by the CEPT
survey. To quantify the scale of current use and so the sharing opportunity, we contacted stakeholders
in the countries shown in Table 2-1. The countries chosen show a mix of current use and include
some with no plans to allow mobile use and others that would expect to allow mobile use once the
relevant harmonisation measures were in place.
Table 2-1: Country interviews
Country Interviewees Main current uses (plus amateur on a secondary basis)
Plans (as of April 2013)
Finland FICORA, Digita, YLE Wireless cameras, video links
No change anticipated
France ANFR, Ministry of Defence Aeronautical telemetry, video links
Possible sharing with aeronautical telemetry on a geographic basis
Germany BNetzA Defence applications (including radiolocation), Aeronautical telemetry, video links
No change anticipated
Ireland Comreg, Department of Communications, Energy and Natural Resources
Rural telecoms service, video links
Release 100MHz but with continued operation of the existing services
Italy Ministry of Defence, Ministry of Economy
Aeronautical telemetry, fixed links, studio to transmitter links
No change anticipated
Sweden PTS Aeronautical telemetry – very small amount of use
Release 100MHz on technology and service neutral basis
UK Ofcom, Ministry of Defence Defence Release 40 MHz on an exclusive basis
Source: Plum interviews
In the case of Germany, there is a significant amount of incumbent use and no specific activity to
address sharing through LSA at this stage25
. The incumbents and regulators we interviewed in the
other six case study countries were positive about the prospects for applying LSA and in the case of
incumbents were prepared to discuss release or sharing of spectrum when there is acknowledgement
of their use requirements. All parties recognised that the balance of obligations and incentives is a key
enabler for a successful outcome for LSA, and that there are practical problems that need to be
addressed for LSA to work (e.g. concerning the exchange of information and setting up the
repository). There would appear to be a willingness to overcome these issues in the study countries.
The nature of the sharing arrangements envisaged in each country is as shown in Table 2-2.
25
See FM52(13)23 - Germany - Frequency utilisation of the band 2300 - 2400 MHz. http://www.cept.org/Documents/fm-
52/10612/FM52(13)23_Frequency-utilisation-in-Germany-ofthe-band-2300-%E2%80%93-2400-MHz)

© Plum, 2013 12
Table 2-2: Access to the 2.3 GHz band under LSA in six case study countries
Country Nature of sharing envisaged
Role of LSA Availability for mobile services
Finland Sharing by frequency, location and time
To protect incumbent PMSE use
85 MHz available for 90% of the time; 15 MHz on a geographically limited basis
France Sharing by frequency and location
To protect incumbent defence use
80% band in areas covering 80% population
Ireland None – incumbent uses not expected to remain
None 100MHz for all population
Italy Sharing by frequency To protect incumbent defence and fixed use
85MHz on a national basis and 15Mhz on a geographically shared basis
Sweden Sharing by frequency and location
To protect incumbent defence use
100MHz in all inhabited areas – exclusion in uninhabited area
UK None None expected before 2022
40 MHz exclusive, sharing for 20MHz only considered in the longer term
Source: Interviews with stakeholders, Plum analysis
In all cases except Finland a static sharing scenario is envisaged. In Finland, the LSA licensee would
have to accommodate dynamic intermittent use of the band by PMSE as well static exclusion zones
around TV studios and theatres. We understand that for 3-4 weeks of the year there is high PMSE use
of the band associated with several major sporting and other events that mainly occur in southern
Finland. In a worst case scenario there would be limited mobile access to the band in the main cities
at these times, and so traffic on the mobile networks would need to utilise other bands.
There is currently a trial in Ylivieska to test communications between the LSA repository and controller
in which LTE mobile use of the band is curtailed on a dynamic basis by an instruction which shuts
down the mobile service in 20 seconds and the traffic on the mobile network is offloaded to WiFi26
.
The trial is to be extended in 2014 to involve an LTE network rather than just a single base station and
to assess interference issues. Success of the trial could pave the way for sharing between PMSE and
mobile services.
2.3 Potential future availability of the band in Europe
In this section we consider the availability of the band with and without LSA. In the absence of LSA the
countries that have stated they will release some or all of the band for mobile services include:
Albania, Belarus, Denmark, Estonia, Georgia, Hungary, Ireland, Latvia, Lithuania, Macedonia,
Moldova, Montenegro, Norway, Poland, Sweden, the Ukraine and the UK (40MHz). While there are
numerous countries here most of them are small in terms of population and/or GDP. This group of
countries is unlikely to provide sufficient scale for device manufacturers and multi-country operators to
support the band in terms of terminals sold in Europe. However, with LSA much of the band could
become available in the majority of European countries giving the necessary scale while allowing
incumbent use by government and/or PMSE to continue in the band.
26
Key contributors to the trial include: Turku University, VTT, Centria, NSN, Fair Spectrum, FICORA, and PPO (Elisa).
https://tapahtumat.tekes.fi/event/triallsaworkshop

© Plum, 2013 13
To estimate the possible availability of the band across Europe we have extrapolated from the CEPT
survey results and our interview findings. The generic assumptions made for countries where we have
not gathered specific data are as follows:
PMSE usage leads to availability of the spectrum to 100% of the population 90% of the time.
Defence radiolocation use means that 2.3 GHz spectrum being available to 80% of the population
100% of the time.
Other defence and PPDR use means the 2.3 GHz band is available 95% of the time to 100% of
the population.
Fixed usage means that the 2.3 GHz band is available to 90% of the population 100% of the time.
Table 2-3 shows the availability - in terms of bandwidth and equivalent population coverage27
of the
spectrum - that can be expected for CEPT (less Russia, Turkey and CIS states)28
on average. The
first year of availability of the 2.3 GHz spectrum is taken to be 2015. The equivalent population
coverage increases over time as some applications (e.g. fixed and some defence uses) use spectrum
more efficiently and/or are migrated to other bands.
The 2.3GHz band is assumed to be deployed in TDD mode, for which it is assumed that 2/3 of the
total bandwidth is available for equivalent downlink capacity.
Table 2-3: Comparison of estimated population x time coverage of 80 MHz29
of the 2.3 GHz
band with and without LSA implementation
Parameter 2015 2020 2025 2030
Equivalent population coverage with LSA
71% 83% 84% 84%
Equivalent population coverage without
LSA30
1% 17% 17% 17%
Source: Plum analysis
27
Equivalent coverage population is population coverage that takes into account the amount of time that the spectrum is
available for use in the coverage area. For instance, if the spectrum is shared with PMSE incumbents, who need the spectrum
10% of the time on an exclusive basis across the country, and the population coverage of the spectrum is 100%, then the
equivalent population coverage is 90% of the time x 100% of population = 90%. 28
Only some CEE countries are included in our CEPT region. These are Albania, Belarus, Bosnia & Herzegovina, Bulgaria,
Croatia, Czech Republic, Estonia, Georgia, Hungary, Latvia, Lithuania, Macedonia, Moldova, Montenegro, Poland, Slovak
Republic, Slovenia and Ukraine. Western European countries that we include in our definition of the CEPT region are Austria,
Belgium, Cyprus, Denmark, Finland, France, Germany, Greece, Iceland, Ireland, Italy, Luxembourg, Malta, Andorra, Gibraltar,
Netherlands, Norway, Portugal, Spain, Sweden, Switzerland, Liechtenstein, Monaco, United Kingdom and Greenland. 29
To allow for an appropriate ratio of uplink and downlink capacities over TDD frequencies, we assume 2/3 of the bandwidth is
used for downlink transmission. Therefore, given a total of 80 MHz of usable bandwidth in the 2.3 GHz band, 53 MHz is the
downlink bandwidth. 30
A few relatively small countries (e.g. Ireland and Sweden) have plans to release the entire band.

© Plum, 2013 14
3 The case for LSA at 2.3 GHz
The case for LSA at 2.3 GHz rests on the following three propositions:
There is demand for additional harmonised spectrum for mobile broadband, such as the 2.3 GHz
band
It is not possible to release the band on an exclusive basis for mobile broadband in the major
European markets
Incumbents at 2.3 GHz can provide access to the band on terms and conditions that would be
attractive to mobile broadband operators.
Below we examine each of these propositions and conclude there are likely to be significant benefits
from implementing LSA at 2.3 GHz.
3.1 There is potential demand for 2.3 GHz spectrum
3.1.1 General considerations
Exponential growth in mobile traffic is forecast for all regions of the world driven by rising take-up and
use of laptop PCs, smartphones and tablets coupled with adoption of higher-speed applications,
notably video. In recognition of the need for additional spectrum to meet these demands (together with
denser networks and technology enhancements) the European Commission adopted a first Radio
Spectrum Policy Programme (RSPP) on 20 September 201031
, under which 1200 MHz of spectrum
would be identified for wireless broadband services by 2015.
Responding to this requirement and the need to identify bands for the forthcoming WRC-15, RSPG
published in June 2013 its Opinion on “Strategic challenges facing Europe in addressing the growing
spectrum demand for wireless broadband”.32
The Opinion identifies the following frequency bands for
wireless broadband services in the 2013-2020 timeframe – 700 MHz, 1452-1492 MHz, 2300-2400
MHz. Other bands are also listed, i.e. 1.5 GHz33
, 1980-2010/2170-2200MMz, 3800-4200 MHz and 5
GHz.34
Of these bands the 2.3 GHz band has the potential for earliest availability for commercial
deployment. This is because it is already harmonised globally for mobile broadband services and is
supported in LTE devices. We expect that the band could start to be deployed in 2015, assuming the
relevant European harmonisation measure is developed by mid-2014 as currently planned.
31
The European Parliament and Council approved the RSPP on 15 February 2012. 32
https://circabc.europa.eu/sd/d/c7597ba6-f00b-44e8-b54d-f6f5d069b097/RSPG13-521_RSPG%20Opinion_on_WBB.pdf 33
This involves the 1350–1375, 1375–1400, 1427–1452 and 1492–1518 MHz bands. 34
5350-5470 MHz, 5725-5875 MHz, 5875-5925 MHz
© Plum, 2013 15
3.1.2 Traffic forecasts
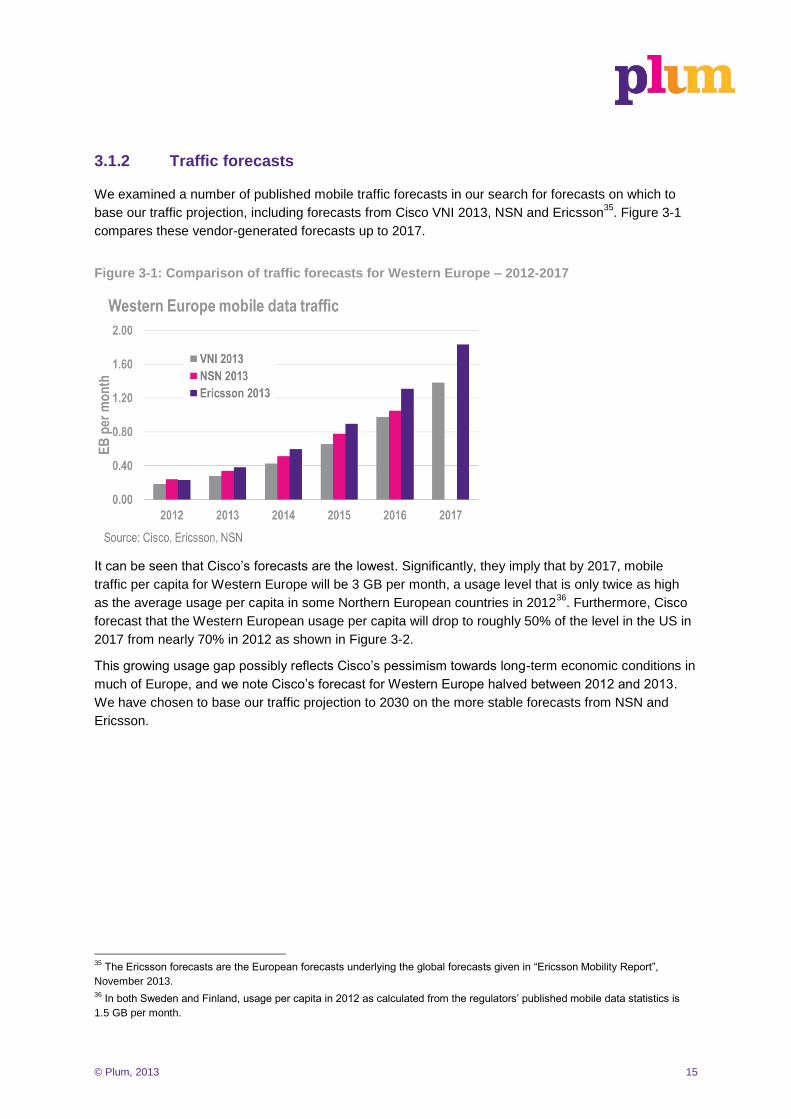
We examined a number of published mobile traffic forecasts in our search for forecasts on which to
base our traffic projection, including forecasts from Cisco VNI 2013, NSN and Ericsson35
. Figure 3-1
compares these vendor-generated forecasts up to 2017.
Figure 3-1: Comparison of traffic forecasts for Western Europe – 2012-2017
It can be seen that Cisco’s forecasts are the lowest. Significantly, they imply that by 2017, mobile
traffic per capita for Western Europe will be 3 GB per month, a usage level that is only twice as high
as the average usage per capita in some Northern European countries in 201236
. Furthermore, Cisco
forecast that the Western European usage per capita will drop to roughly 50% of the level in the US in
2017 from nearly 70% in 2012 as shown in Figure 3-2.
This growing usage gap possibly reflects Cisco’s pessimism towards long-term economic conditions in
much of Europe, and we note Cisco’s forecast for Western Europe halved between 2012 and 2013.
We have chosen to base our traffic projection to 2030 on the more stable forecasts from NSN and
Ericsson.
35
The Ericsson forecasts are the European forecasts underlying the global forecasts given in “Ericsson Mobility Report”,
November 2013. 36
In both Sweden and Finland, usage per capita in 2012 as calculated from the regulators’ published mobile data statistics is
1.5 GB per month.

© Plum, 2013 16
Figure 3-2: Cisco Western Europe and USA per-capita traffic forecast comparison
The traffic projection that we use in assessing the demand for the 2.3 GHz band is shown in Figure
3-3. We generate these numbers by fitting a Gompertz curve to the average of NSN and Ericsson’s
Western Europe forecasts to 2017 plus estimates for Eastern European countries that are members of
the CEPT37
. In making these projections we take into consideration the existence of traffic off-loading
over WiFi, and the numbers shown do not include WiFi traffic generated by mobile devices. In the
modelling reported in Section 4, we also test the sensitivity of the estimated benefits to increased and
decreased traffic demand as shown in Figure 3-4.
Figure 3-3: Mobile traffic projections – medium case
37
Here we exclude Turkey and Russia to ensure that our analysis is not skewed by countries with large land area for which we
have little network or traffic information.

© Plum, 2013 17
Figure 3-4: Traffic projections for high, medium and low scenarios
3.1.3 Spectrum supply in other bands
By 2015 and over the following 10 years other frequency bands will also be in use for the supply of
mobile broadband services. Our view of the bands and their likely available capacity for a mobile
downlink for Europe on average is shown in Table 3-1. Only the downlink is shown as we assume that
the majority of traffic continues to be in the downlink (and not the uplink) and hence this is where
networks encounter capacity constraints.
Table 3-1: Downlink spectrum available38
for mobile broadband by band (excluding 2.3 GHz)
Spectrum band Number of MHz - 2015 Number of MHz -2020 Number of MHz - 2025
700 MHz 0 30 30
800 MHz 30 30 30
900 MHz 20 30 30
1400 MHz 20 40 40
1800 MHz 20 50 75
2100 MHz 60 60 60
2600 MHz TDD39
30 30 30
2600 MHz 70 70 70
Total 240 330 355
38
The quantum stated for each band is assumed to be the quantum deployed on each site and is ready for use for capacity. 39
We assume for TDD frequencies, 2/3 of the bandwidth is used for downlink transmission and two guard bands of 10 MHz for
(at least) two unsynchronised TDD networks.

© Plum, 2013 18
In addition to the bands shown the 3.5 GHz band will be harmonised and there is likely to be additional
spectrum available at 5 GHz to support WiFi offload. We assume that a 3.5 GHz macro layer in mobile
networks is deployed in hotspots and dense urban areas and accounts for 2% of the total traffic in
2020; this percentage is further assumed to rise to 22% by 2030. As mentioned above, we make the
projections considering the existence of traffic off-loading (WiFi), and the traffic numbers that we use
(as shown above) do not include WiFi traffic generated by mobile devices.
In Section 4 we find, using the traffic forecasts and spectrum supply assumptions given above, that
there will be a shortfall in capacity to meet the projected traffic demand and hence value in deploying
the 2.3 GHz band.
3.2 The band cannot be released Europe-wide on an exclusive
basis for mobile broadband
In many countries there is little scope to migrate the two main incumbent uses of the band, namely
defence and PMSE, in the short term and in some cases the long term. These limitations apply as a
minimum to the following countries in Europe: Austria, Belgium, France, Germany, Greece, the
Netherlands, Spain and 60% of the band in the UK which together account for over 50% of the EU
population and around 70% of its GDP. It is for this reason we consider that without LSA at 2.3GHz
there would not be the market scale required for multi-country operators to take-up the band or for
vendors to produce attractive consumer devices for a European market.
Our interviews with incumbents indicated a willingness to provide access to the band on terms and
conditions that would be attractive for suppliers of mobile broadband services, subject to incumbents’
access rights being protected. The propagation characteristics of the 2.3 GHz band are such that it
can be expected to be mainly deployed to provide capacity at times of peak demand (i.e. the busy
hour) in urban areas. Some defence uses of the band are in rural areas. In these cases sharing is not
likely to greatly impact on the capacity required by mobile operators. Where governmental use
requires national coverage or there is PMSE use of the band mobile operators are unlikely to have
100% availability in urban areas in the busy hour. In these circumstances traffic on the mobile network
may be offloaded to other exclusive licensed bands, or even complementary solutions such as WiFi,
as determined by the operator’s load balancing algorithms.
3.3 Access to the band offers benefits
Access to the 2.3 GHz band will be on a shared basis, with a known bandwidth, location and timing.
Incumbent use can be accommodated with certainty at any given location or point in time, while
providing sufficient, meaningful capacity for sharers.
The capacity may be used to either substitute for infrastructure costs or to support additional traffic
through new service offerings. The latter could in principle occur either through new offerings from
MNOs or from new entry. Although it is our view that the business case for new entry will be
challenging given the costs of new network build, the likely need for other frequency bands in the
event the 2.3 GHz band is not available, competition from existing MNOs and the fact that WiFi is
supported by most consumer devices.

© Plum, 2013 19
3.3.1 Reducing infrastructure costs
The cost reduction use case is well understood by MNOs as a basis for acquiring spectrum. MNOs (of
any size) or a capacity wholesaler to MNOs may seek to acquire the spectrum to complement other
frequency ranges used to support peak demands on their networks. In mobile networks the location of
the peak load can vary by time of the day as people move to/from work or education and to/from
leisure locations – this phenomenon is sometimes referred to as the “bouncing busy hour”. Our
modelling does not capture these daily population movements. The modelling is therefore likely to
underestimate peak demands and so underestimate the value of additional spectrum. While the 2.3
GHz band is not necessarily available for 100% of the time our research suggests it will be available
for 90% or more of the time in most countries and as such could be used to carry a lot of the peak
traffic load.
The avoided costs from deploying 2.3 GHz LSA mean there could be lower prices than would
otherwise be the case as competition forces operators to pass on their cost savings to customers. The
knock-on impact of reduced costs on potential increased demand is not taken into account in our
analysis.
3.3.2 New data plans to stimulate demand
Rather than using the 2.3 GHz band to reduce the cost of serving existing demand, the relatively
cheap extra capacity from installing 2.3 GHz radio frequency units and antennas on an MNO’s sites
could also be used to support new data service offerings and capture a new market.
One example of such products is a new supplementary data plan that encourages existing customers
to extend their data consumption beyond the level offered through their normal plan. This offering may
be packaged as a favourably priced add-on bundle to existing customers’ monthly price plans that
allows a large-volume usage on top of their normal plan data allowance. However, traffic will be routed
through the 2.3 GHz network, which may have restrictions on geographic coverage and time
availability, if regular user’s traffic already fills up the exclusive spectrum.
Alternatively, the product could also be marketed as a complement to WiFi. WiFi hotspots do not offer
ubiquity, and the fragmented nature of the market means that there are still many WiFi Not-Spots40
for
many mobile device users. The 2.3 GHz band could be used to provide mobile capacity in such areas.
Because it can lead to a better quality of service overall, the operator may be in the position to charge
a higher monthly subscription.
As we have mentioned, new entry is unlikely, and this is expected to also be true for the case of new
service offerings. This is due to the high costs of setting up a network to compete effectively with
established MNOs. Although infrastructure sharing with MNOs is possible, the difficulty in coming to a
commercial sharing agreement (potentially of both active and passive infrastructure) is likely to make
operating such a business unattractive to new entry. Therefore, we only consider the case where
MNOs become providers of these new service offerings in our analysis.
40
These are locations where the mobile network is capacity constrained but WiFi (offered to an MNO’s customers through a
WiFi provider partner) is also not available. Examples of such locations are hotspots and urban areas in big European cities
including London and Paris.
© Plum, 2013 20
3.4 Conclusions
In conclusion, we find that:
There will be potential demand for spectrum at 2.3 GHz to support future mobile broadband
traffic.
Without LSA only a minority of countries in Europe will be able to offer access to the 2.3 GHz
band, once the necessary ECC harmonisation measure is in place.
This market will not be sufficient for major operators to deploy the band and for vendors to
manufacture European handsets supporting the band because it does not include some core
European markets e.g. Germany, France, Spain and the Netherlands.
The benefits offered to MNOs by LSA and the 2.3 GHz band are reduced network costs or the
opportunity to generate additional revenue from customers interested in high capacity/low cost
plans in urban locations. In the latter case, the new product would generate benefits in the form of
increased consumer surplus.
Hence shared use of 2.3 GHz will complement planned exclusive release of the band in parts of
Europe to deliver the scale that European operators need to implement the 2.3 GHz band and place
orders for devices that support the band.

© Plum, 2013 21
4 Benefits and costs of LSA at 2.3 GHz
4.1 Approach
We have evaluated the benefits and costs of use of the 2.3 GHz band under LSA. It is assumed that
without LSA the 2.3 GHz band is unlikely to be used in Europe, because of a lack of scale. We
modelled two alternative types of benefit from the additional capacity made available at 2.3 GHz,
namely:
Avoided costs: 2.3 GHz deployment leads to a reduction in investment in additional base
stations. Once mobile broadband demand exceeds network capacity, more capacity can be
added by deploying the 2.3 GHz band on an LSA basis on existing base station sites. This means
that operators can “avoid” building new base station sites immediately, when faced with capacity
shortfall. Hence, they are able to “avoid” the higher costs of having to immediately install new
base stations. The scale of this benefit depends primarily on how quickly demand for mobile
broadband grows in each CEPT country and how much spectrum is made available for mobile
broadband use.
Consumer surplus from new product: Instead of using the band to reduce investment
requirements, operators may use the additional capacity that the 2.3 GHz band provides to offer a
new service, which stimulates further mobile data demand. This additional demand can come
from existing customers or a new user base. One example of this type of business model is the
use of the band to provide LTE-grade low-priced data bundles that could be purchased by
existing mobile subscribers to expand their monthly data quota. The extent of this benefit will be
determined by the exact nature of the service. We describe our approach to estimating benefits
from new products in Section 4.4.
The costs incurred include the costs of the LSA repository and controller and the administrative costs
associated with defining new rights and issuing licences. There are commercial entities working on the
development of prototype repositories and controllers and from discussion with these organisations we
expect that the costs will be relatively small – perhaps EUR 50 million for all of Europe41
.
Administrative costs are also expected to be relatively small. Therefore, these costs are not
considered in our models.
4.2 Benefits arising from infrastructure cost savings
4.2.1 Approach
Figure 4-1 illustrates our approach to modelling the net present value of the benefits of avoided costs
the 2.3 GHz band for Europe and the 5 study countries, namely Finland, France, Italy, Sweden and
the UK.
41
One industry estimate was EUR 0.5-1 million for constructing a standalone repository we multiply this by 50 to give a
European number.

© Plum, 2013 22
Figure 4-1: Approach to estimating economic benefits from avoided costs of 2.3 GHz LSA
The key assumptions that underpin the modelling are as follows:
The 2.3 GHz band spectrum would be made available for mobile LSA use in tranches from 2015
on in Europe42
The growth in mobile broadband traffic for the CEPT region is as specified for NSN/Ericsson-
based forecast in Figure 3-343
There are on average four mobile network operators in each country
Two operators with a combined subscriber and traffic market share of 60% gain access to the
spectrum and can use the bandwidth to reduce their costs
The guard band for each of the operators sharing the 2.3 GHz spectrum is 10 MHz per operator,
assuming unsynchronised networks.
Mobile operators continue to add base station sites to their networks up to 2014 to enhance
coverage. Thereafter, new network infrastructure deployment is driven by demand for capacity.
This means that when demand for mobile broadband exceeds capacity the mobile operator
upgrades existing base stations with a 2.3 GHz LSA rather than using the more expensive option
of building additional base stations.
The minimum expected user data throughput over the network rises from 1 Mbps in 2013 to 18
Mbps in 203044
.
42
The timing of release and the exact quantum available of the 2.3 GHz spectrum in each of the 5 study countries can be found
in Appendix C. 43
The growth trend of mobile data demand in each study country is given in Appendix C. 44
These throughput rates are assumed to ensure there is reasonable growth in expected speed over the modelling period. The
model then channelizes to the total available bandwidth at these throughput rates, whereas under real operating conditions data
packets are multiplexed statistically. Therefore, these assumptions will give rise to a higher throughput rate in reality.

© Plum, 2013 23
Once the additional capacity from the 2.3 GHz band is used up, the mobile operator deploys new
base stations which are more cost effective. We estimate that, by 2020, a new base station which
uses the 2.3 GHz band might offer around 20% more downlink capacity for only 4% greater cost,
when compared with a new base station without the band.
Net present values are calculated over a 15-year period from 2015 using a 4% per annum social
discount rate.
Appendices A and B contain more details on the technical/network, economic and market assumption
parameters used.
4.2.2 Results for Europe
Figure 4-2 displays the net present values of the benefits (in 2015 prices) from deploying 2.3 GHz LSA
to support demand for spectrum over the period 2015 to 2030 for the CEPT region (excluding Russia
and Turkey) for the three traffic scenarios (illustrated in Figure 3-4). As can be seen the values span a
wide range, from EUR 6.5 billion – EUR 20 billion, with a medium value of around EUR 12 billion.
Figure 4-2: Net present value of avoided-cost benefits for CEPT by traffic demand scenarios
(2015 prices)
4.2.3 Results for five study countries
We also estimate the benefits at the country level for five of the study countries for which we could
obtain country specific data. We use country-level traffic projections as shown in Figure 4-3 as the
demand-side input into our benefit calculation. Further country-specific assumptions can be found in
Appendix C.

© Plum, 2013 24
Figure 4-3: Demand projections by country
The projections are derived using historical 2012 data from Cisco VNI 2013 for France, the UK and
Italy and historical data published by the national regulators for Finland and Sweden as shown in
Table 4-1. We use these data as the starting points and project forward mobile traffic volume to 2030
assuming that traffic in each country grows at the same rate as the aggregate traffic for the CEPT
region under medium traffic scenario.
Table 4-1: Total monthly mobile traffic in 2012 for five study countries
Country UK France Italy Sweden Finland
2012 mobile traffic (PB/month)
39 14 23 15 8
From the traffic demand projections, we derive the benefits arising from avoided infrastructure costs.
Figure 4-4 shows the benefits (in 2015 NPV) in each of the study countries. Countries that have a high
mobile data demand forecast will benefit the most from the additional spectrum, as we assume the
availability of other frequency bands is the same in all countries.
© Plum, 2013 25
Figure 4-4: Net present value of avoided-cost benefits by country (2015 prices)
4.2.4 Different stages of development in the mobile data market in different
countries can affect results
Although we assume that mobile data consumption in the different countries will grow at a uniform
rate, it is conceivable that this may not be the case. Different markets may be at different stages of
development due to differences in market dynamics that have so far driven their growth. In particular,
it is likely that a number of countries may still be behind the curve and experience a higher annual
growth than the average for the CEPT region in future. Therefore, the assumption of the same growth
across the board may lead to an underestimation of the long-term data traffic consumption.
One study country to which this underestimation may well apply is France. It is worth noting in Table
4-1 that France’s total traffic in 2012 was only comparable to that of Sweden, despite the fact that its
population is more than six times the size of the Swedish population. Nevertheless, it is expected that
mobile data consumption will continue to grow at nearly 70% per annum in 201345
. By contrast, our
data usage growth for the CEPT region derived from the medium traffic projection shown in Figure 3-4
is below 60% per annum.
We therefore, also model France using an initial growth of 70%. In this projection, we also assume
that by 2030, France’s per-capita mobile data usage will roughly be equal to the average per-capita
consumption across the CEPT region. Figure 4-5 compares the forecast that we use to generate
France’s country result in section 4.2.3 with this new projection.
45
http://www.arcep.fr/?id=36

© Plum, 2013 26
Figure 4-5: Higher-growth projection vs CEPT-average-growth projection
In this higher traffic scenario for France benefits of up to EUR 1.4 billion (in 2015 NPV terms) from the
use of the 2.3 GHz band under LSA could come from avoided costs. Figure 4-6 compares the total
benefits for France assuming that annual traffic growth mirrors the CEPT and benefits under this
higher traffic growth scenario.
Figure 4-6: Benefits for France assuming CEPT growth vs benefits assuming higher growth
4.2.5 Benefits increase with the size of bandwidth
In general, the greater the size of the 2.3 GHz spectrum bandwidth that can be shared under LSA, the
greater the benefits from avoided costs that could be expected. We illustrate this using the example of
the UK.
The UK MOD has announced plans for exclusive access to 40 MHz of 2.3 GHz spectrum. In addition
20 MHz of 2.3 GHz spectrum could be considered for shared access beyond 2022. If a value of 50

© Plum, 2013 27
MHz under LSA is used in the model instead of 20 MHz it increases the value by around EUR 0.6
billion in NPV terms (2015 NPV). This translates to an increase of EUR 9 per capita. Figure 4-7
compares the total benefits for the UK assuming that 20 MHz will be available and benefits under the
assumption that 50 MHz will be made available.
Figure 4-7: Benefits with 20 MHz vs benefits with 50 MHz
4.3 Benefits under alternative mobile data growth scenario
In our medium forecast, per-capita consumption in Europe lags behind the US throughout the entire
modelling period, although per-capita usage in Europe does not drops below 60% of the US level.
Qualcomm, NSN and Ericsson asked Plum to assess the benefits from use of an alternative traffic
growth scenario.
In this alternative scenario we assume faster data growth in Europe so that per-capita consumption of
mobile data in Europe catches up with the US46
by the year 2018 and thereafter per-capita mobile
traffic follows the trajectory of US traffic growth. Figure 4-8 compares the total traffic forecast implied
by this assumption and our medium forecast for the CEPT region.
46
We extrapolate Cisco VNI 2013’s US traffic forecasts to 2030 by assuming a gradually falling annual growth rate. Between
2013 and 2017, Cisco’s numbers are used. The resulting CAGR between 2017 and 2030 is 19% per annum. To obtain US’s
per-capita consumption for each year, we divide each individual year’s traffic projection by the UN’s population projection
(medium fertility scenario of the World Population Prospects: The 2012 Revision).

© Plum, 2013 28
Figure 4-8: Higher-growth scenario’s traffic vs Plum’s medium traffic projections
Higher traffic as depicted in this scenario could be driven by a rise in the quality of service. In
particular, a higher throughput speed may potentially accelerate the growth of mobile data traffic
consumption.47
However, this is also contingent on extra network investment being made that would
enable more frequency bands in MNOs existing portfolios to deliver service at a higher speed. In
addition, MNOs will also need to undertake demand stimulation measures that make it attractive for
customers to take up these higher-speed connections.
Overall, under this scenario the benefits amount to EUR 30 billion. Figure 4-9 compares the benefits
derived using this alternative traffic scenario with the benefits from the medium traffic scenario in
section 3.1.2.
Figure 4-9: Medium traffic benefits vs Per-cap US-convergence traffic benefits
47
According to Ofcom, speed seems to be a significant constraint on data consumers can use on the internet on fixed
broadband network: http://stakeholders.ofcom.org.uk/market-data-research/other/telecoms-research/broadband-
speeds/infrastructure-report-2012/

© Plum, 2013 29
4.4 Consumer surplus from new product
The 2.3 GHz band under LSA offers the opportunity to provide capacity more cheaply through the
installation of new 2.3 GHz radio frequency units and antennas on existing sites. Two examples of
this new service offering are discussed in section 3.3.2. These are cheap LTE data bolt-on bundles
and an LTE-grade data service that helps to complement/extend WiFi coverage. Either service could
be considered a new product with its own market. Consumption of these products leads to an increase
in consumer surplus represented by the grey triangle in Figure 4-10. In this illustration, total
consumption of the new product is QNP and the unit price is PNP.
Figure 4-10: Illustration of consumer surplus arising from a new product
From Figure 4-10, it can be seen that we compute the consumer surplus generated from this new
product using the following formula:
where e is the price elasticity of a product (expressed as the absolute value). This approach was used
to estimate the economic value of mobile services in the US in an academic study48
and in studies for
Ofcom on the economic impact of spectrum49
.
To quantify the increase in consumer surplus under this approach we need the following:
An estimate of total revenue from new data services provided over the 2.3 GHz spectrum under
LSA
The price elasticity of demand of this new product.
For revenue, we assume for simplicity (and to be conservative) that it equals the costs of providing the
service which we estimate as the additional cost of deploying the spectrum by installing 2.3 GHz RF
and antennas on existing sites50
. This means that the total cost of upgrading sites to provide the 2.3
GHz capacity is equal to the yellow rectangle in Figure 4-10, which represents the total revenue from
the new product.
48
Jerry Hausman. 2002. “Mobile Telephone”, Handbook of Telecommunications Economics, Volume 1, Elsevier. 49
Europe Economics. 2006. “Economic Impact of the use of radio spectrum in the UK”. 50
We, therefore, also assume that the operator is supplying only as much additional capacity as it can create using the 2.3 GHz
RF and antennas on existing sites.
© Plum, 2013 30
The elasticity of demand used here is -0.5 for the reason that we assume the new product to be a
mobile-broadband type offering (bolt-on data bundle or LTE-grade WiFi extension). We clarify our
choice of this value of elasticity of demand in Appendix D. Additionally; we discuss the suitability of a
constant elasticity of demand in Appendix E.
In total, the net present value of benefits in terms of increase in consumer surplus for the CEPT region
(excluding Russia and Turkey)51
could be in the region of EUR 2.3 billion (in 2015 prices). It is
important to note that to derive this result, we additionally assume that the data traffic from the new
service can be supported by existing spare capacity in the network up to the point at which all existing
base stations in each respective geotype become capacity constrained. Therefore, the cost of the 2.3
GHz upgrade is not incurred immediately but only when demand excluding demand from new
products cause the network to become capacity constrained.
However, if high demand for the new product is anticipated or observed from the start, operators may
use the 2.3 GHz band to support the service earlier to ensure that quality of service to customers of
existing mobile service is not compromised. The new product is then served entirely by the 2.3 GHz
band under LSA. Therefore, high demand for the new product may make operators install new RF and
antennas to support the band on all existing sites at an earlier stage, which will increase the cost.
Since we assume that revenue generated will be equal to the cost, this would also lead to a consumer
surplus of more than the value of EUR 2.3 billion stated.
In reality, we would expect the deployment to be a combination of the two cases outlined. Operators
may anticipate or experience high demand in certain areas and deploy the 2.3 GHz band before the
network in that geotype becomes capacity-constrained. In other geotypes, demand may be low, and
existing spare capacity may be sufficient to serve the demand for this new product. Therefore, our
estimates could be conservative as they reflect slow take-up of the new service.
4.5 Summary of the net benefits of 2.3 GHz LSA
In summary, the availability of 2.3 GHz with LSA on a harmonised basis across Europe is estimated to
yield significant net benefits. The costs of making the spectrum available are relatively small – around
EUR 50 million plus administrative costs while our medium estimate of the benefits from savings in
infrastructure costs is around EUR 12 billion. The estimated value of cost savings range from EUR
6.5-22 billion.
We find the need for the band to help support peak traffic demands varies considerably by country,
largely because of differences in traffic levels. In circumstances where operators are not capacity
constrained the band might be used by an incumbent or new entrant to stimulate demand through a
low cost, high capacity service. A conservative estimate of the consumer benefits this service might
offer if it was widely deployed is EUR 2.3 billion. However, it should be noted that this benefit cannot
be directly added to the benefits from infrastructure cost savings, as operators can either use the
spectrum to relieve capacity constraints or serve a new product market.
It should also be observed that the benefits are sizeable partly because much of the band can be
made available under LSA in a relatively short time frame – from 2015 – assuming the necessary
harmonisation measures and national regulation for implementing LSA in the band are in place by
then.
51
The complete list of countries can be found in the footnote for section 2.3.
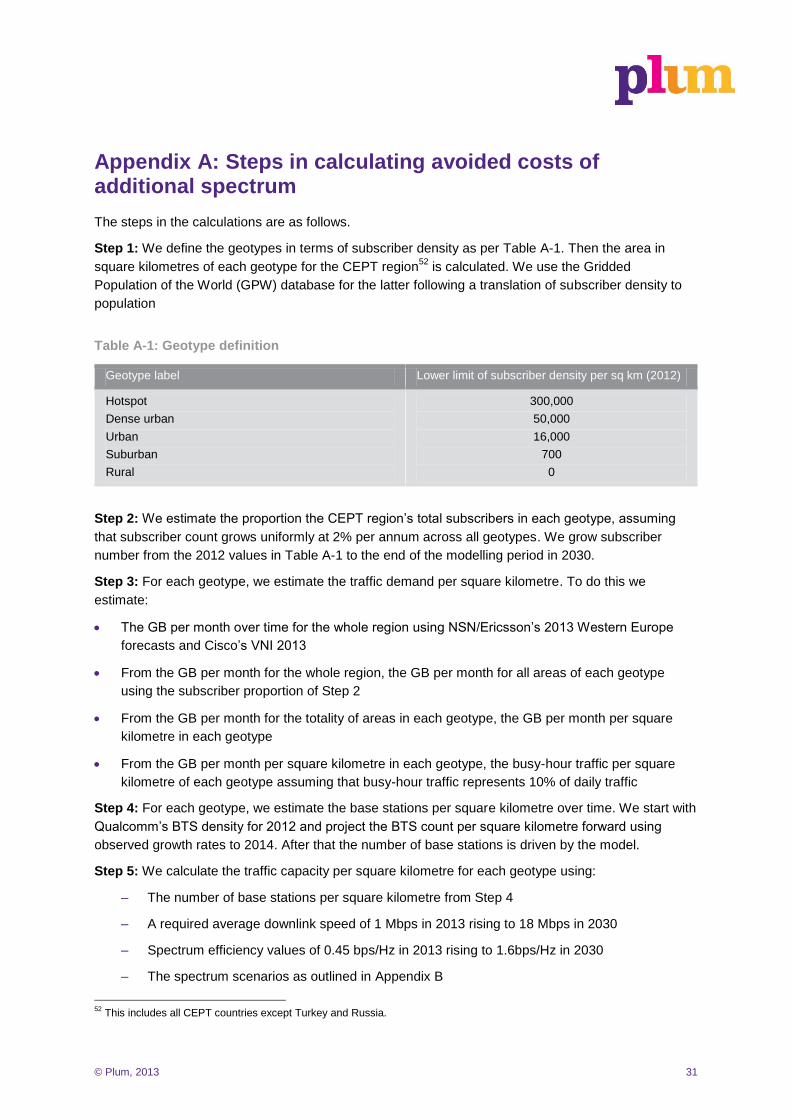
© Plum, 2013 31
Appendix A: Steps in calculating avoided costs of additional spectrum
The steps in the calculations are as follows.
Step 1: We define the geotypes in terms of subscriber density as per Table A-1. Then the area in
square kilometres of each geotype for the CEPT region52
is calculated. We use the Gridded
Population of the World (GPW) database for the latter following a translation of subscriber density to
population
Table A-1: Geotype definition
Geotype label Lower limit of subscriber density per sq km (2012)
Hotspot
Dense urban
Urban
Suburban
Rural
300,000
50,000
16,000
700
0
Step 2: We estimate the proportion the CEPT region’s total subscribers in each geotype, assuming
that subscriber count grows uniformly at 2% per annum across all geotypes. We grow subscriber
number from the 2012 values in Table A-1 to the end of the modelling period in 2030.
Step 3: For each geotype, we estimate the traffic demand per square kilometre. To do this we
estimate:
The GB per month over time for the whole region using NSN/Ericsson’s 2013 Western Europe
forecasts and Cisco’s VNI 2013
From the GB per month for the whole region, the GB per month for all areas of each geotype
using the subscriber proportion of Step 2
From the GB per month for the totality of areas in each geotype, the GB per month per square
kilometre in each geotype
From the GB per month per square kilometre in each geotype, the busy-hour traffic per square
kilometre of each geotype assuming that busy-hour traffic represents 10% of daily traffic
Step 4: For each geotype, we estimate the base stations per square kilometre over time. We start with
Qualcomm’s BTS density for 2012 and project the BTS count per square kilometre forward using
observed growth rates to 2014. After that the number of base stations is driven by the model.
Step 5: We calculate the traffic capacity per square kilometre for each geotype using:
– The number of base stations per square kilometre from Step 4
– A required average downlink speed of 1 Mbps in 2013 rising to 18 Mbps in 2030
– Spectrum efficiency values of 0.45 bps/Hz in 2013 rising to 1.6bps/Hz in 2030
– The spectrum scenarios as outlined in Appendix B
52
This includes all CEPT countries except Turkey and Russia.
© Plum, 2013 32
Step 6: We compare the traffic capacity per square kilometre from Step 5 with the traffic demand per
square kilometre from Step 3. Note that we modelled downlink capacity only. This is the binding
constraint – i.e. downlink capacity is what constrains the network’s capability to handle traffic.
Step 7: Where demand is greater than network capacity, we add infrastructure for each geotype.
There are two scenarios here:
– Scenario 1 in which there is no 2.3 GHz LSA and base stations are added
– Scenario 2 in which, initially, a 2.3 GHZ LSA is deployed to expand capacity. So capacity is
first increased by upgrading existing BTS with the 2.3 GHz band and then by adding
additional base stations (with the 2.3 GHz LSA) until capacity matches traffic demand.
Step 8: We calculate the net present cost of adding a base station under Scenario 1, and then the net
present cost of a 2.3 GHz LSA upgrade and of an additional BTS under Scenario 2
Step 9: We multiply the net present costs from Step 8 by the amount of additional infrastructure
required from Step 7 to get the additional infrastructure costs and then calculate the difference
between the two scenarios. This is the avoided cost per square kilometre by geotype.
Step 10: We repeat Steps 2 to 9 for all geotypes and aggregate the cost savings to get the NPV of the
avoided cost benefit for the country.
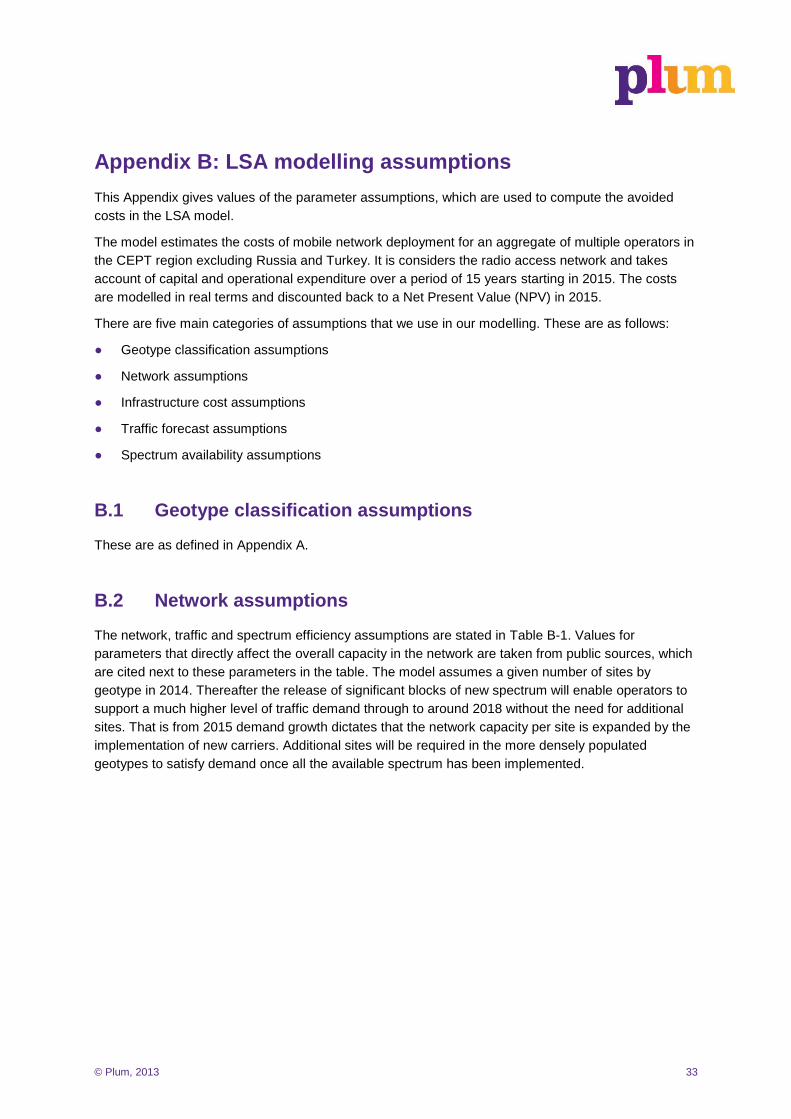
© Plum, 2013 33
Appendix B: LSA modelling assumptions
This Appendix gives values of the parameter assumptions, which are used to compute the avoided
costs in the LSA model.
The model estimates the costs of mobile network deployment for an aggregate of multiple operators in
the CEPT region excluding Russia and Turkey. It is considers the radio access network and takes
account of capital and operational expenditure over a period of 15 years starting in 2015. The costs
are modelled in real terms and discounted back to a Net Present Value (NPV) in 2015.
There are five main categories of assumptions that we use in our modelling. These are as follows:
● Geotype classification assumptions
● Network assumptions
● Infrastructure cost assumptions
● Traffic forecast assumptions
● Spectrum availability assumptions
B.1 Geotype classification assumptions
These are as defined in Appendix A.
B.2 Network assumptions
The network, traffic and spectrum efficiency assumptions are stated in Table B-1. Values for
parameters that directly affect the overall capacity in the network are taken from public sources, which
are cited next to these parameters in the table. The model assumes a given number of sites by
geotype in 2014. Thereafter the release of significant blocks of new spectrum will enable operators to
support a much higher level of traffic demand through to around 2018 without the need for additional
sites. That is from 2015 demand growth dictates that the network capacity per site is expanded by the
implementation of new carriers. Additional sites will be required in the more densely populated
geotypes to satisfy demand once all the available spectrum has been implemented.

© Plum, 2013 34
Table B-1: Network assumptions
Parameter Value used Source Comments
Percentage of traffic in busy hour 10% Estimated based on Heikkinen and Berger
53: the range
is 8%-17% for European countries, but for 10 out of 12 studied countries it is 8%-12%.
Percentage of traffic in the downlink
2012
2015
2020
2025
2030
86%
89%
90%
90%
90%
Plum 2011 study for Ericsson and Qualcomm
Percentage of network capacity that is usable accounting for mismatch of supply and demand in some locations
80% Plum’s estimate
Average total sites54
per sqkm for each geotype:
Hotspot
Dense urban
Urban
Suburban
Rural
40
10
3
0.3
0.01
Based on Qualcomm 2012 data for the UK and OFCOM’s Sitefinder database
Sectors per BTS 3
Average number of operators sharing one site
255
Plum’s estimate
Percentage of traffic carried over 3.5 GHz macro layer and excluded from the modelling
2015
2020
2025
2030
______ _____
0%
2%
12%
22%
______ ______
Plum’s estimates
______ ______
Note the 3.5GHz macro layer is assumed to be deployed in hotspots and dense urban areas only
Spectrum efficiency(bps/Hz/cell)56
2013
2030
0.45
1.6
Plum’s estimate based on vendors’ view
53
http://dspace.mit.edu/bitstream/handle/1721.1/62579/MIT-CSAIL-TR-2011-028.pdf?sequence=1 54
A site that is shared by multiple operators is counted as multiple sites. 55
This means that there are only half the number of sites as reported by operators, but each site is able equipped with the
combined portfolio of spectrum of both operators. 56
The lower value is for 2012 and the higher value is for 2022.
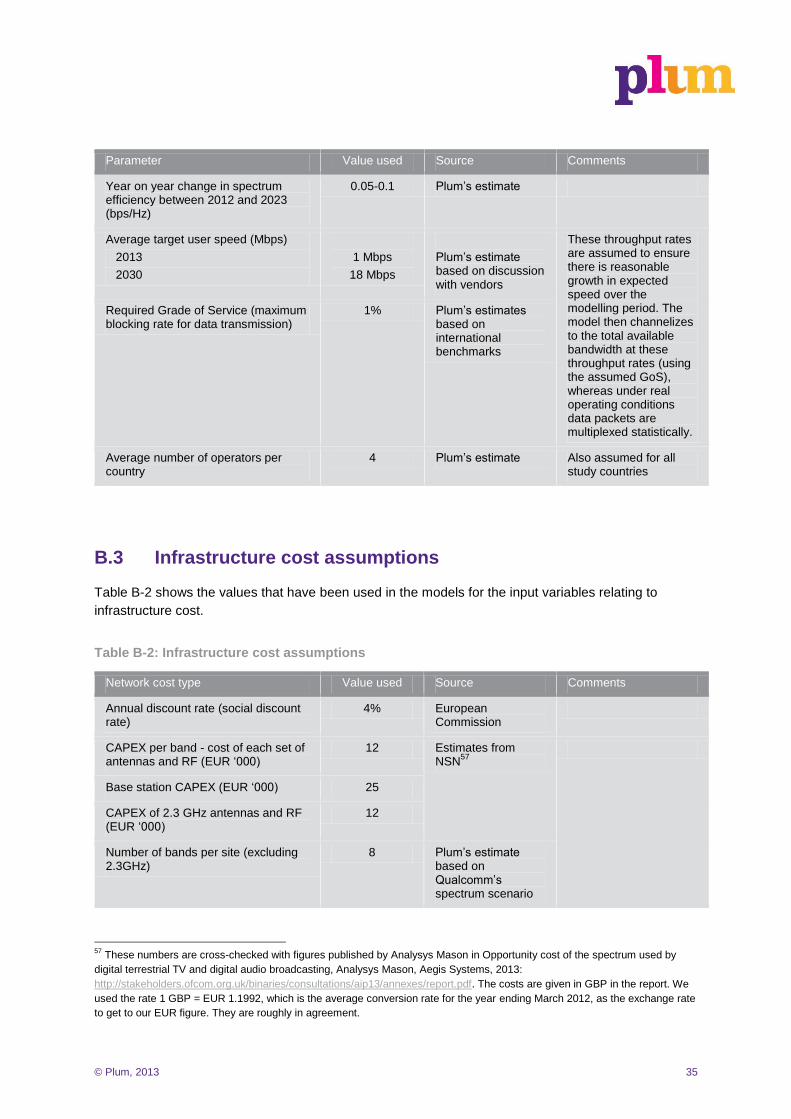
© Plum, 2013 35
Parameter Value used Source Comments
Year on year change in spectrum efficiency between 2012 and 2023 (bps/Hz)
0.05-0.1 Plum’s estimate
Average target user speed (Mbps)
2013
2030
1 Mbps
18 Mbps
Plum’s estimate based on discussion with vendors
These throughput rates are assumed to ensure there is reasonable growth in expected speed over the modelling period. The model then channelizes to the total available bandwidth at these throughput rates (using the assumed GoS), whereas under real operating conditions data packets are multiplexed statistically.
Required Grade of Service (maximum blocking rate for data transmission)
1% Plum’s estimates based on international benchmarks
Average number of operators per country
4 Plum’s estimate Also assumed for all study countries
B.3 Infrastructure cost assumptions
Table B-2 shows the values that have been used in the models for the input variables relating to
infrastructure cost.
Table B-2: Infrastructure cost assumptions
Network cost type Value used Source Comments
Annual discount rate (social discount rate)
4% European Commission
CAPEX per band - cost of each set of antennas and RF (EUR ‘000)
12 Estimates from NSN
57
Base station CAPEX (EUR ‘000) 25
CAPEX of 2.3 GHz antennas and RF (EUR ‘000)
12
Number of bands per site (excluding 2.3GHz)
8 Plum’s estimate based on Qualcomm’s spectrum scenario
57
These numbers are cross-checked with figures published by Analysys Mason in Opportunity cost of the spectrum used by
digital terrestrial TV and digital audio broadcasting, Analysys Mason, Aegis Systems, 2013:
http://stakeholders.ofcom.org.uk/binaries/consultations/aip13/annexes/report.pdf. The costs are given in GBP in the report. We
used the rate 1 GBP = EUR 1.1992, which is the average conversion rate for the year ending March 2012, as the exchange rate
to get to our EUR figure. They are roughly in agreement.

© Plum, 2013 36
Network cost type Value used Source Comments
Site establishment cost (EUR ‘000)
Civil works
Installation and commissioning
70
9
Estimates from NSN
58
Backhaul
Urban (fibre-based product)
Suburban/rural (microwave)
18
15
Analysys Mason, Plum’s estimates based on conversations with vendors
OPEX as % of CAPEX
Non-backhaul
Backhaul
Urban
Suburban/rural
5%
30%
15%
Analysys Mason, Plum’s estimates based on conversations with vendors
Site rental per year (EUR ‘000)
Urban
Suburban/rural
25
5
Plum’s estimate
The discount rate used is the social discount rate as proposed by the European Commission rather
than a higher commercial discount rate. This is because the benefits calculated are being used to
inform a policy and not a commercial decision. The European Impact Assessment Guidelines (2009)
propose a social discount rate of 4% p.a. (in real terms i.e. taking account of inflation)59
. This is the
correct discount to use because the modelling uses the costs expressed in real terms - i.e. 2015
prices.
B.4 Traffic forecast assumptions
Table B-3, Table B-4 and Table B-5 show the values of the projected mobile data traffic volume (both
uplink and downlink) that has been used in the model for the three traffic scenarios – low, medium and
high60
. The medium estimate is based largely on NSN/Ericsson forecasts. This is used as our traffic
inputs for our base case results. The high and low traffic forecasts are be used for sensitivity analysis
and are constructed by respectively raising and lowering the medium forecasts by 25%.
58
Opportunity cost of the spectrum used by digital terrestrial TV and digital audio broadcasting, Analysys Mason, Aegis
Systems, 2013: http://stakeholders.ofcom.org.uk/binaries/consultations/aip13/annexes/report.pdf. The costs are given in GBP in
the report. We used the rate 1 GBP = EUR 1.1992, which is the average conversion rate for the year ending March 2012, as the
exchange rate to get to our EUR figure. 59 http://ec.europa.eu/governance/impact/commission_guidelines/docs/iag_2009_en.pdf ; http://ec.europa.eu/governance/impact/commission_guidelines/docs/ia_guidelines_annexes_en.pdf 60
The values tabulated have been adjusted so that they reflect traffic that would only fall on macro- and microcell networks.
Therefore, the traffic excludes mobile traffic carried by WiFi, pico- and femtocells. To do this we assume that the percentage of
the total projected mobile traffic routed through these networks increase from 2% in 2020 to 22% in 2030.
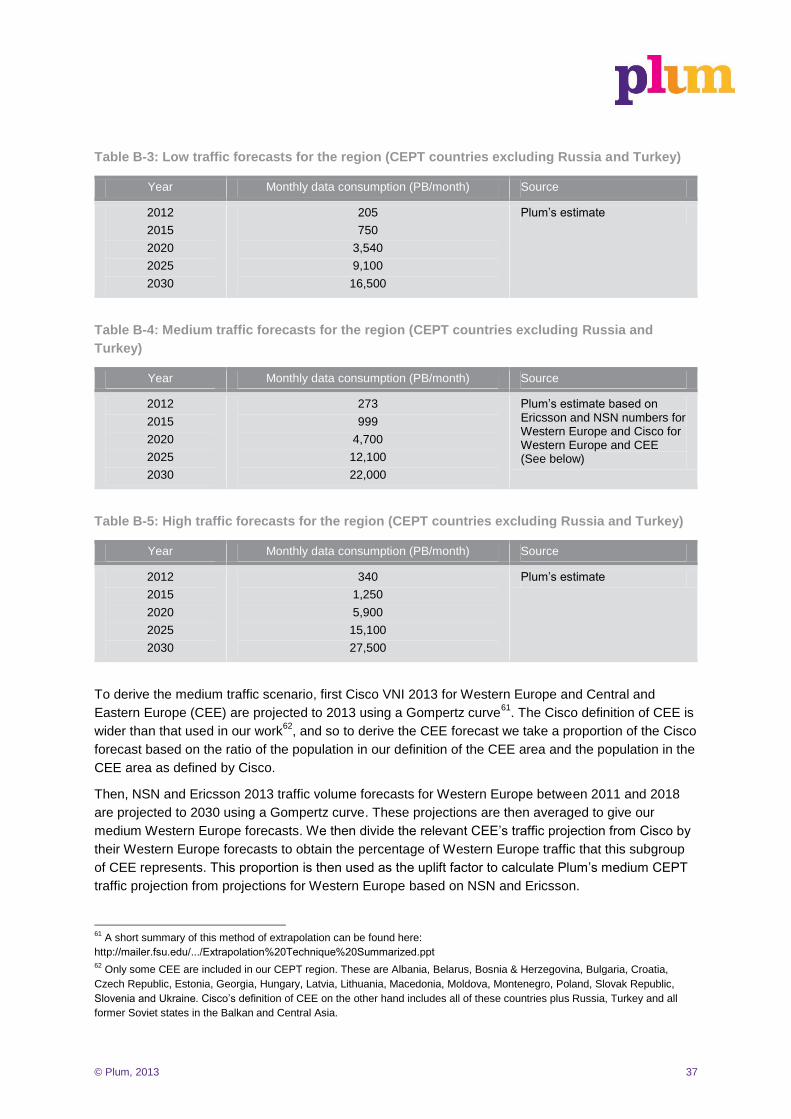
© Plum, 2013 37
Table B-3: Low traffic forecasts for the region (CEPT countries excluding Russia and Turkey)
Year Monthly data consumption (PB/month) Source
2012
2015
2020
2025
2030
205
750
3,540
9,100
16,500
Plum’s estimate
Table B-4: Medium traffic forecasts for the region (CEPT countries excluding Russia and
Turkey)
Year Monthly data consumption (PB/month) Source
2012
2015
2020
2025
2030
273
999
4,700
12,100
22,000
Plum’s estimate based on Ericsson and NSN numbers for Western Europe and Cisco for Western Europe and CEE (See below)
Table B-5: High traffic forecasts for the region (CEPT countries excluding Russia and Turkey)
Year Monthly data consumption (PB/month) Source
2012
2015
2020
2025
2030
340
1,250
5,900
15,100
27,500
Plum’s estimate
To derive the medium traffic scenario, first Cisco VNI 2013 for Western Europe and Central and
Eastern Europe (CEE) are projected to 2013 using a Gompertz curve61
. The Cisco definition of CEE is
wider than that used in our work62
, and so to derive the CEE forecast we take a proportion of the Cisco
forecast based on the ratio of the population in our definition of the CEE area and the population in the
CEE area as defined by Cisco.
Then, NSN and Ericsson 2013 traffic volume forecasts for Western Europe between 2011 and 2018
are projected to 2030 using a Gompertz curve. These projections are then averaged to give our
medium Western Europe forecasts. We then divide the relevant CEE’s traffic projection from Cisco by
their Western Europe forecasts to obtain the percentage of Western Europe traffic that this subgroup
of CEE represents. This proportion is then used as the uplift factor to calculate Plum’s medium CEPT
traffic projection from projections for Western Europe based on NSN and Ericsson.
61
A short summary of this method of extrapolation can be found here:
http://mailer.fsu.edu/.../Extrapolation%20Technique%20Summarized.ppt 62
Only some CEE are included in our CEPT region. These are Albania, Belarus, Bosnia & Herzegovina, Bulgaria, Croatia,
Czech Republic, Estonia, Georgia, Hungary, Latvia, Lithuania, Macedonia, Moldova, Montenegro, Poland, Slovak Republic,
Slovenia and Ukraine. Cisco’s definition of CEE on the other hand includes all of these countries plus Russia, Turkey and all
former Soviet states in the Balkan and Central Asia.

© Plum, 2013 38
Figure B-1: Traffic projections for different traffic demand scenarios
B.5 Spectrum availability assumptions
Table B-6 shows the spectrum availability assumptions for bands other than the 2.3 GHz. It should be
noted that the bandwidth stated relates to downlink spectrum only. This spectrum portfolio is used for
the counterfactual scenario, to which the 2.3 GHz spectrum is added for the benefit calculation.
Table B-6: Quantum of downlink spectrum available for mobile broadband in each non-2.3 GHz
band in MHz
Spectrum band Number of MHz - 2015 Number of MHz -2020 Number of MHz - 2025
700 MHz 0 30 30
800 MHz 30 30 30
900 MHz 20 30 30
1400 MHz 20 40 40
1800 MHz 20 50 75
2100 MHz 60 60 60
2600 MHz TDD 30 30 30
2600 MHz 70 70 70
Total 240 330 355
Table B-7 shows the availability - in terms of bandwidth and population coverage of the spectrum -
that can be expected for our CEPT region on average. The first year of availability of the 2.3 GHz

© Plum, 2013 39
spectrum is taken to be 2015. The 2.3GHz band is assumed to be deployed in TDD mode, and so 2/3
of the total bandwidth is available for downlinks transmission. The values are chosen based on a
spectrum scenario, population coverage and time availability provided by Qualcomm. The calculation
method for the values in Table B-7 for each year is outlined below.
Table B-7: Equivalent population coverage of the 80 MHz63
of the 2.3 GHz band
Parameter 2015 2020 2025 2030
Equivalent population coverage with LSA
71% 83% 84% 84%
To calculate the equivalent population coverage of the band in each year, we first work out the total
amount of MHzPop64
available in each country. We then multiply this MHzPop figure by the time
availability of the bandwidth – i.e. the percentage of time that the quantum of shared spectrum will not
be occupied by the incumbents. We call this the restricted MHzPop. This is done as follows:
In the Czech Republic, we assume 30MHz of the band is available to 80% of the population 100%
of the time, while the remaining 70MHz is available to 100% of the population 90% of the time.
Therefore the MHzPop value is: [30MHz x 80% x 10.7million x 100%] + [70MHz x 100% x
10.7million x 90%] = 913.5 million MHz
We then calculate the unrestricted MHzPop for Czech Republic is 1,074 million MHz (10.7million x
100MHz), where unrestricted MHzPop refers to the total MHzPop that would be available if all the
population had access to all the available spectrum in the 2.3GHz band 100% of the time.
These calculations were performed for all countries. Next the individual-country restricted MHzPop
numbers as well as the individual-country unrestricted MHzPop numbers are aggregated across the
CEPT region. We then assume that on average 100MHz will be available for the entire CEPT region.
To estimate the percentage of the population to whom this 100MHz of the 2.3GHz is available, we
divide the region-wide sum of restricted MHzPop by the region-wide sum of unrestricted MHzPop for
our CEPT region.
63
We assume that to allow appropriate ratio of uplink and downlink capacities over TDD frequencies, 2/3 of the bandwidth
needs used for downlink transmission. Therefore, given a total of 80 MHz of usable bandwidth in the 2.3 GHz band, 53 MHz is
the equivalent downlink bandwidth. 64
This is a product of the bandwidth in MHz and the population count. Therefore the unit is in MHz, since the number of people
has no unit.

© Plum, 2013 40
Appendix C: Assumptions specific to study countries
C.1 Network assumptions
Table C-1 shows Plum’s estimates of the number of sites per square kilometre in each geotype for
each of the 5 study countries based on site density information supplied by Qualcomm, NSN and
Ericsson.
Table C-1: Network assumptions
Parameter UK France65
Italy66
Sweden Finland
Average total sites67
per sqkm for each geotype:
Hotspot
Dense urban
Urban
Suburban
Rural
__
40
10
3
0.3
0.01
__
40
10
3
0.3
0.01
__
40
10
3
0.3
0.01
__
N/A
N/A
13
0.3
0.03
__
N/A
N/A
5
0.6
0.02
C.2 Traffic forecast assumptions
Below are Plum’s projections of traffic in the 5 study countries based on publicly available information.
For the UK, France and Italy, we use, our as starting points, Cisco VNI 2013 traffic in 2012. We then
project these numbers forward to 2030 by assuming that the growth rates will mirror those for our
CEPT projection based on NSN/Ericsson’s Western Europe traffic forecasts. For Sweden and Finland,
we have historical traffic data to 2012 from the national regulator. Therefore, we project our forecasts
for these countries from these real 2012 data points by assuming that traffic grows at the same rate as
that for our NSN/Ericsson-based CEPT traffic projection.
Table C-2: Country’s traffic forecasts (PB/month)
Year UK France Italy Sweden Finland
2012
2015
2020
2025
2030
62
143
675
1,730
3,150
21
50
230
600
1,100
23
76
360
930
1,680
15
54
254
650
1,190
8
29
140
360
650
65
France’s site density is the same as the UK’s according to Qualcomm. 66
Qualcomm suggests that we use the same set of site densities that we use in France for Italy. 67
A site that is shared by multiple operators is counted as multiple sites.

© Plum, 2013 41
C.3 Spectrum availability at 2.3 GHz
The assumed spectrum availability at 2.3 GHz is as shown in the following table. All other bands are
assumed to be equally available in the study countries.
Table C-3: Access to the 2.3 GHz band under LSA in the five modelled countries
Country Nature of sharing envisaged Availability for mobile services
Finland Sharing by frequency, location and time
85 MHz available for 90% of the time; 15 MHz on a geographically limited basis
France Sharing by frequency and location
80% of the band in areas covering 80% population
Italy Sharing by frequency 85MHz on a national basis and 15MHz on a geographically shared basis
Sweden Sharing by frequency and location
100MHz in all inhabited areas – exclusion in uninhabited area
UK None 40 MHz exclusive, sharing for 20MHz only possible in the longer term
Source: Interviews with stakeholders, Plum analysis

© Plum, 2013 42
Appendix D: Elasticity of demand for mobile broadband
To determine the consumer benefits from a new mobile data service arising from the use of 2.3GHz,
we survey the literature on demand for telecommunications services. Most of the extant literature on
demand has been on mobile services rather than mobile broadband. While the focus in this study is on
mobile broadband, it is also important to recognise fixed-mobile substitution effects and that demand
for mobile services is related the availability of substitutes in the country or region concerned. The
studies summarised below involve countries with varying levels of GDP. We have grouped them
according to low and middle income countries (Table D-1) and high income countries (Table D-2).
The price elasticity range for mobile services is quite wide as shown below. However price elasticity
for low-middle income countries is generally higher compared to high income countries. Since the bulk
of the CEPT region consists of medium- to high-income countries, we use price elasticity value of -0.5.
Table D-1: Summary of literature for low-middle income countries
Authors Countries Price elasticity of demand for mobile services
Karacuka et al (2012)68
Turkey -0.72 (post-paid)
-0.33 (pre-paid)
Ward and Zheng (2012)69
China -0.59 (1)
Gasmi et al. (2009) 70
South Africa -1.3 to -3.8 (voice)
-1.2 to -3.2 (SMS)
Garbacz and Thompson Jr (2007)
71
53 developing countries (GDP per capita below $8000 in year 2000)
-1.25
Frontier Economics (2005)
72
50 emerging markets -0.54 (post-paid)
-0.76 (pre-paid)
21 Africa and Middle East countries
(2)
-0.24 (post-paid)
-0.89 (pre-paid)
Waverman et al (2005)73
102 low and middle income countries
-1.5
68
Justus Haucap, Ulrich Heimeshoff and Mehmet Karauka (2011). Competition in Turkish mobile telecommunications markets:
price elasticities and network substitution. Telecommunications Policy, 35, 202-210. 69
Michael R Ward and Shilin Zheng (2012). Mobile and fixed substitution for telephone service in China. Telecommunications
Policy, 36, 301-310. 70
Farid Gasmi, Marc Ivaldi and Laura Recuero Virto (2009). An empirical analysis of cellular demand in South Africa. Toulouse
School of Economics, Working Paper Series, 09-091. http://ideas.repec.org/p/cpr/ceprdp/7153.html 71
Christopher Garbacz and Herbert G Thompson Jr (2007). Demand for telecommunication services in developing countries.
Telecommunication Policy, 31, 276-289. 72
GSMA Mobile Tax Report (2005) http://www.ictregulationtoolkit.org/en/Publication.3376.html 73
Leonard Waverman, Meloria Meschi and Melvyn Fuss (2005). The Impact of Telecoms in Economic Growth in Developing
Countries. Vodafone Public Policy Paper Series 2.
http://www.vodafone.com/content/dam/vodafone/about/public_policy/policy_papers/public_policy_series_2.pdf

© Plum, 2013 43
Table D-2: Summary of literature for high income countries
Authors Countries Price elasticity of demand for mobile services
Srinuan et al (2012)74
Sweden -0.479 to -3.623 (mobile broadband) (1)
Hazlett and Munoz (2009)75
US -1.12
Dewenter and Haucap (2008)
76
Austria -0.74 (business customers)
-0.36 (consumers)
Cadman and Dineen (2008)
77
28 OECD countries (mainly high income)
-0.43 (broadband) (2)
Hausman and Sidak (2007)
78
Ireland -0.84
Europe Economics (2006)
79
UK -0.3 to -0.47
Garbacz and Thompson Jr (2005)
80
Developed countries -0.5
Ida and Kuroda (2005)81
Japan -0.564 to -0.783 (3G)
-0.231 to -0.303 (2G)
Notes: (1) Price elasticity for mobile broadband higher in areas where 3 or 4 alternatives broadband options (e.g. DSL, cable, fibre) are available. Price elasticity for mobile broadband lower in rural areas where broadband infrastructures are underdeveloped. Mobile broadband considered a significant substitute for DSL in rural areas. (2) Long run elasticity.
74
Pratompong Srinuan, Chalita Srinuan and Erik Bohlin (2012). Fixed and mobile broadband substitution in Sweden.
Telecommunications Policy, 36, 237-251. 75
Thomas Hazlett and Robert Munoz (2009). A welfare analysis of spectrum allocation policies. RAND Journal of Economics,
40(3), 424-454. 76
Ralf Dewenter and Justus Haucap (2008). Demand elasticities for mobile telecommunications in Austria. Jahrbucher fur
Nationalokonomie und Statistik, 228. 77
Richard Cadman and Chris Dineen (2008). Price and income elasticity of demand for broadband subscriptions: a cross-
sectional model of OECD countries. http://spcnetwork.eu/uploads/Broadband_Price_Elasticity.pdf 78
Jerry A Hausman and J Gregory Sidak (2007). Evaluating Market Power Using Competitive Benchmark Prices Instead of the
Herfindahl-Hirschman Index. http://papers.ssrn.com/sol3/papers.cfm?abstract_id=971114 79
Europe Economics (2006). Economic impact of the use of radio spectrum in the UK.
http://stakeholders.ofcom.org.uk/binaries/research/spectrum-research/economic_impact.pdf 80
Christopher Garbacz and Herbert G Thompson Jr (2005). Universal telecommunication service: a world perspective.
Information Economics and Policy, 17, 495-512. 81
Takanori Ida and Toshifumi Kuroda (2005). Discrete choice model analysis of mobile telephone service demand in Japan.
Kyoto University. http://www.kier.kyoto-u.ac.jp/coe21/dp/81-90/21COE-DP090.pdf

© Plum, 2013 44
Appendix E: Improved quality of service benefits
The formula we have used to do estimate the increase in consumer surplus from a new product is
The revenue is assumed to be equal to the cost of 2.3 GHz upgrade. The value for e, the absolute
elasticity of demand is derived from the range of values in Appendix D.
However, estimates of consumer surplus are highly dependent on the assumed shape of the demand
curve. The subsections below examine the cases of linear and constant elasticity demand curves and
indicate that the proposed approach is conservative.
E.1 Linear demand curve
Figure E-1 shows a linear demand curve; although the demand curve is linear, elasticity varies along
the curve. Elasticity is 1 in the middle of the curve, more elastic to the left of this and inelastic to the
right. If the demand curve is defined as:
Where q is quantity, p is price and A and b are constants. Consumer surplus (CS) is given by:
Where e is the absolute value of the price elasticity of demand and R is revenue.
Figure E-1: Linear demand curve
E.1.1 Constant elasticity demand curve
Although the linear demand curve allows the increase in consumer surplus to be easily calculated it
may not be an accurate approximation of reality. There is also a risk that this assumption may result in

© Plum, 2013 45
overestimates of consumer surplus. This is because demand curve may be convex, so that the area
above the revenue rectangle is less than the area of the consumer surplus triangle in Figure E-1.
A constant elasticity demand curve, with specified choke price, as illustrated in Figure E-2, may give a
more accurate reflection of demand.
Figure E-2: Constant elasticity demand curve
The equation for the consumer surplus with a constant elasticity demand curve and a choke price is82
:
[ (
)
]
And if we assume that the choke price is a fixed multiple of the current price, i.e. , then
consumer surplus is as follows:
[
]
If the elasticity is one, then:
E.2 Implications for the 2.3 GHz LSA analysis
Table E-1 shows the consumer surplus, as a multiple of revenue, for different assumptions about the
demand curve. We show values for elasticities of -0.5 and -1 as these are used in our modelling. For
the constant elasticity demand curve values for several ratios of the choke price to the current price, c,
are shown.
82
When the elasticity is one, the formula is

© Plum, 2013 46
We have not found any evidence on the size of the ratio of the choke price to the current price for
mobile broadband services. Crandall et al (2002)83
estimate that for broadband services in the US it is
3 times the current price. Although some individuals may be willing to pay many times the current
price they will not be representative of the whole population. Therefore we propose testing the impact
of a choke price of between 3 and 5 times the current price.
Table E-1: Change in consumer surplus under different assumptions
CS Elasticity, e
0.5
2.3 GHz LSA analysis
Linear – constant elasticity assumed
R
Demand curve
Linear – constant price 2R
Constant elasticity c=3 1.46R
c=5 2.5R
The first line of the table shows the estimated consumer surplus for the approach used in this study.
The other three rows give estimates based on other assumptions. As can be seen by comparing the
results in the first row with those in the other three rows the approach we have taken is conservative
under a reasonable set of assumptions.
83
Robert Crandall, Robert Hahn and Timothy Tardiff (2002). The benefits of broadband and the effects of regulation. Chapter 13
in Robert Crandall and James Alleman (eds) Broadband: how should we regulate high-speed internet access? Washington,
D.C.: Brookings Institution Press.