Embed Size (px)
Citation preview
The Importance of the Suckler Cow to the Irish Economy 0
2018
Thia Hennessy Justin Doran Joe Bogue Lana Repar
The Economic and Societal
Importance of the Irish Suckler
Beef Sector
Professor,
Head of the Cork
University Business School,
University College Cork
Professor,
Head of the
Department of Food
Business and
Development,
University College Cork
Dr,
Assistant Lecturer in
the Department of
Food Business and
Development,
University College Cork
Dr,
Director of the Spatial
and Regional Economics
Research Centre and a
lecturer in the
Department of
Economics,
University College Cork
The Economic and Societal Importance of the Irish Suckler Beef Sector 1
The Economic and Societal
Importance of the Irish Suckler
Beef Sector
August 2018
Thia Hennessy Justin Doran Joe Bogue Lana Repar
Professor,
Dean of the Cork
University Business School,
University College Cork
Professor,
Head of the
Department of Food
Business and
Development,
University College Cork
Dr,
Assistant Lecturer in
the Department of
Food Business and
Development,
University College Cork
Dr,
Director of the Spatial
and Regional
Economics Research
Centre and a lecturer
in the Department of
Economics,
University College Cork
The Economic and Societal Importance of the Irish Suckler Beef Sector 2
Acknowledgements
This Report has been peer reviewed. The authors hereby acknowledge the efforts and constructive
feedback from Kenneth J. Thompson (Professor Emeritus, Department of Geography and
Environment, University of Aberdeen), Trevor Donnellan (Rural Economy Research Centre, Teagasc)
and Alan Renwick (Professor, Lincoln University, New Zealand). Any remaining errors or omissions
are the responsibility of the authors. The authors are grateful for the financial support provided by the
Irish Farmers’ Association for this research.
The Economic and Societal Importance of the Irish Suckler Beef Sector 3
TABLE OF CONTENTS
List of Tables ........................................................................................................................................... 5
List of Figures ......................................................................................................................................... 5
Executive Summary ............................................................................................................................ 8
Chapter1: Introduction and Overview ...................................................................................... 11
Chapter 2: The Current State of the Beef Sector in Ireland ......................................... 12
2.1 Introduction ................................................................................................................................... 12
2.2 Prevalence of Suckler Cow Farming in Ireland ...................................................................... 12
2.3 Beef and Dairy Cow Breeds ....................................................................................................... 15
2.4 The Economic Situation of Suckler Cow Farms .................................................................... 16
2.5 The Beef Supply Chain ................................................................................................................. 18
2.6 Value and Destination of Export Markets ............................................................................... 22
2.7 Live Exports from Ireland ........................................................................................................... 25
2.8 Estimating the Total Value of the Beef Sector ....................................................................... 27
2.9 Conclusions .................................................................................................................................... 27
Chapter 3: Policy Developments and Challenges Facing the Irish Beef Sector ... 28
3.1 Introduction ................................................................................................................................... 28
3.2 Climate Change Policy ................................................................................................................. 28
3.3 Brexit ............................................................................................................................................... 29
3.4 Common Agricultural Policy (CAP) Reform .......................................................................... 30
3.5 Mercosur ........................................................................................................................................ 31
3.6 Consumer Trends ........................................................................................................................ 32
3.7 Conclusions .................................................................................................................................... 34
Chapter 4: Wider Economic Impacts of the Beef Sector in Ireland .......................... 35
4.1 Introduction ................................................................................................................................... 35
4.2 Estimating the Output and Employment Impact of Agriculture Using Multiplier Analysis
................................................................................................................................................................. 37
4.3 Estimating the Output and Employment Impact of Agriculture, Forestry and Fishing on
a Regional Basis Using Multiplier Analysis ...................................................................................... 39
4.4 Conclusions .................................................................................................................................... 40
Chapter 5: Societal Impact of the Beef Sector in Ireland ............................................... 42
5.1 Introduction ................................................................................................................................... 42
5.2 Presence in Rural Areas and Contribution to a Vibrant Rural Society ............................ 42
5.3 Public Goods .................................................................................................................................. 44
5.4 Public Goods and Tourism ......................................................................................................... 46
The Economic and Societal Importance of the Irish Suckler Beef Sector 4
5.4 Conclusions .................................................................................................................................... 48
Chapter 6: Environmental Sustainability of Irish Beef ..................................................... 49
6.1 Introduction ................................................................................................................................... 49
6.2 The Carbon Footprint of Beef Production ............................................................................. 49
6.3 The Water Footprint of Beef Production ............................................................................... 52
6.4 Nitrogen Balance .......................................................................................................................... 55
6.5 Animal Welfare Performance of Irish Beef Production Relative to Beef Production
Globally .................................................................................................................................................. 57
6.6 Perspectives on the Quality of Irish Beef ................................................................................ 61
6.7 Conclusions .................................................................................................................................... 62
Chapter 7: The Economic Impact of a Potential Contraction in the Suckler Cow
Herd .......................................................................................................................................................... 63
7.1 Introduction ................................................................................................................................... 63
7.2 The Economic Impact of a Contraction in the Suckler Cow Herd ................................... 63
7.3 Agriculture Resilience - Can the Sector Resist and Recover from Shocks?.................... 64
7.4 The Potential for Dairy Beef to Displace Suckler Beef ........................................................ 66
7.5 Conclusions .................................................................................................................................... 66
Chapter 8: Conclusions .................................................................................................................... 68
References .............................................................................................................................................. 70
Appendices ............................................................................................................................................. 79
Technical Appendix 1: Regionalisation of Multipliers .................................................................. 79
Technical Appendix 2: Calculation of Resilience Indicators ...................................................... 81
Technical Appendix 3: Biosector and Non-biosector Industries .............................................. 82
The Economic and Societal Importance of the Irish Suckler Beef Sector 5
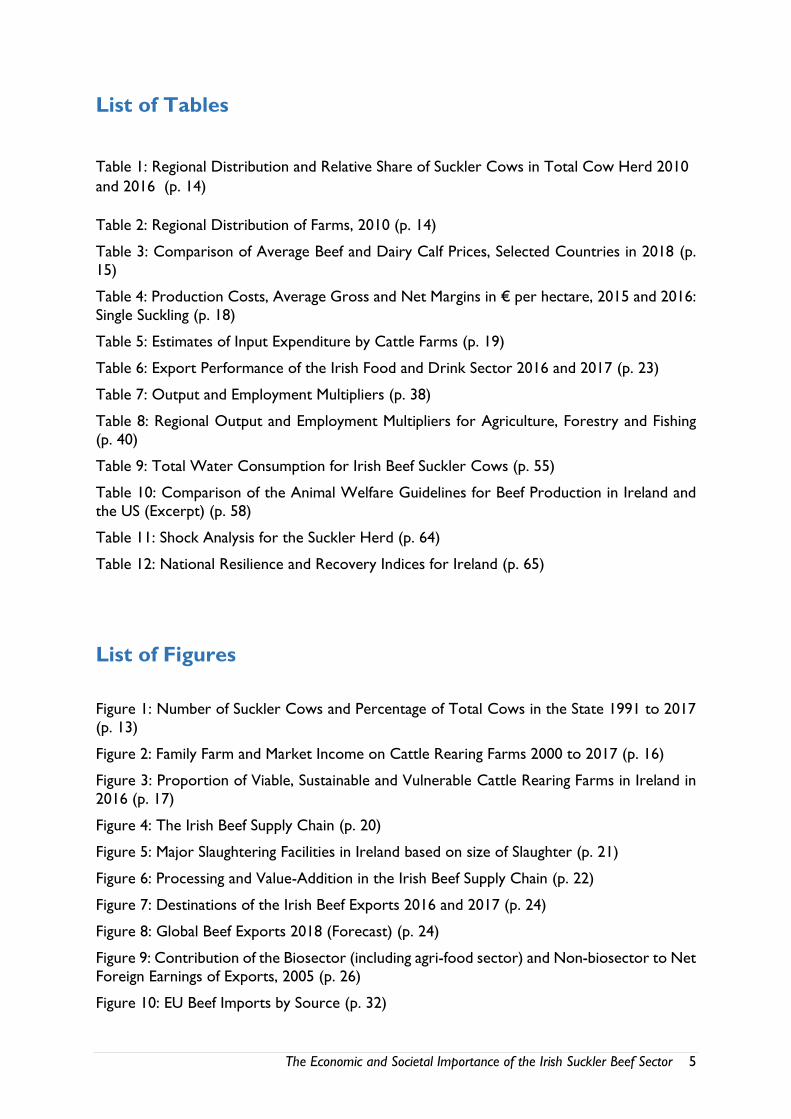
List of Tables
Table 1: Regional Distribution and Relative Share of Suckler Cows in Total Cow Herd 2010
and 2016 (p. 14)
Table 2: Regional Distribution of Farms, 2010 (p. 14)
Table 3: Comparison of Average Beef and Dairy Calf Prices, Selected Countries in 2018 (p.
15)
Table 4: Production Costs, Average Gross and Net Margins in € per hectare, 2015 and 2016:
Single Suckling (p. 18)
Table 5: Estimates of Input Expenditure by Cattle Farms (p. 19)
Table 6: Export Performance of the Irish Food and Drink Sector 2016 and 2017 (p. 23)
Table 7: Output and Employment Multipliers (p. 38)
Table 8: Regional Output and Employment Multipliers for Agriculture, Forestry and Fishing
(p. 40)
Table 9: Total Water Consumption for Irish Beef Suckler Cows (p. 55)
Table 10: Comparison of the Animal Welfare Guidelines for Beef Production in Ireland and
the US (Excerpt) (p. 58)
Table 11: Shock Analysis for the Suckler Herd (p. 64)
Table 12: National Resilience and Recovery Indices for Ireland (p. 65)
List of Figures
Figure 1: Number of Suckler Cows and Percentage of Total Cows in the State 1991 to 2017
(p. 13)
Figure 2: Family Farm and Market Income on Cattle Rearing Farms 2000 to 2017 (p. 16)
Figure 3: Proportion of Viable, Sustainable and Vulnerable Cattle Rearing Farms in Ireland in
2016 (p. 17)
Figure 4: The Irish Beef Supply Chain (p. 20)
Figure 5: Major Slaughtering Facilities in Ireland based on size of Slaughter (p. 21)
Figure 6: Processing and Value-Addition in the Irish Beef Supply Chain (p. 22)
Figure 7: Destinations of the Irish Beef Exports 2016 and 2017 (p. 24)
Figure 8: Global Beef Exports 2018 (Forecast) (p. 24)
Figure 9: Contribution of the Biosector (including agri-food sector) and Non-biosector to Net
Foreign Earnings of Exports, 2005 (p. 26)
Figure 10: EU Beef Imports by Source (p. 32)
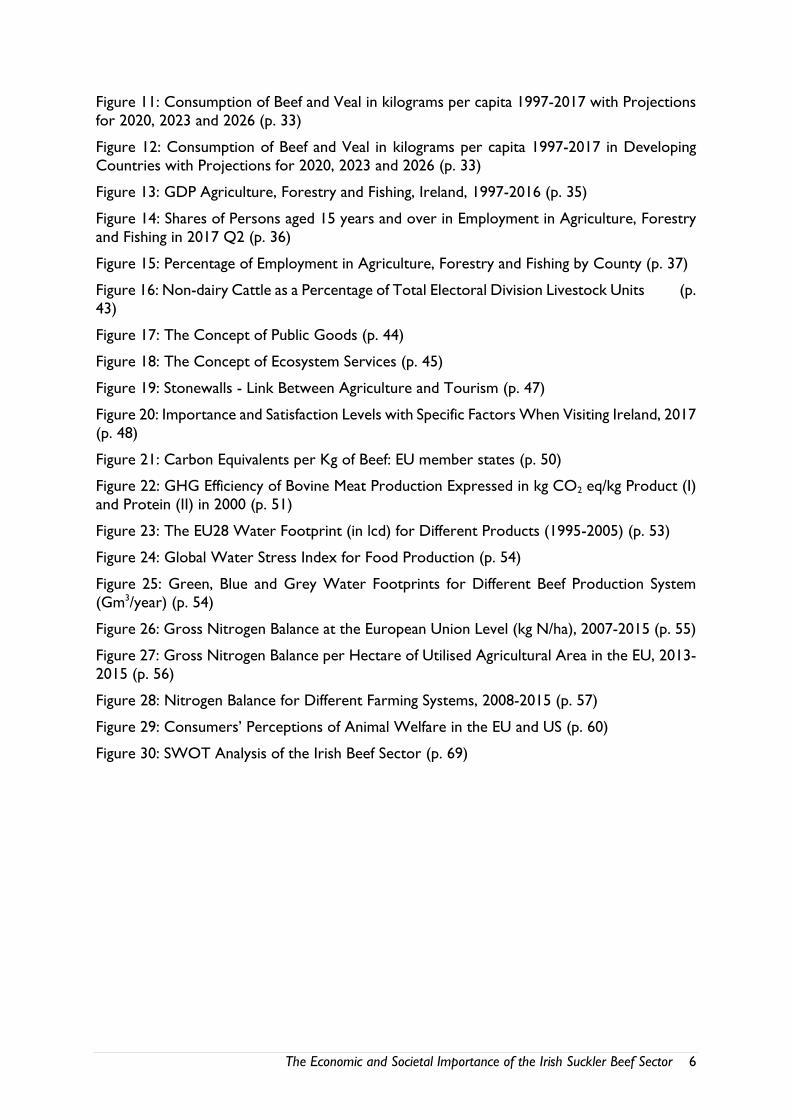
The Economic and Societal Importance of the Irish Suckler Beef Sector 6
Figure 11: Consumption of Beef and Veal in kilograms per capita 1997-2017 with Projections
for 2020, 2023 and 2026 (p. 33)
Figure 12: Consumption of Beef and Veal in kilograms per capita 1997-2017 in Developing
Countries with Projections for 2020, 2023 and 2026 (p. 33)
Figure 13: GDP Agriculture, Forestry and Fishing, Ireland, 1997-2016 (p. 35)
Figure 14: Shares of Persons aged 15 years and over in Employment in Agriculture, Forestry
and Fishing in 2017 Q2 (p. 36)
Figure 15: Percentage of Employment in Agriculture, Forestry and Fishing by County (p. 37)
Figure 16: Non-dairy Cattle as a Percentage of Total Electoral Division Livestock Units (p.
43)
Figure 17: The Concept of Public Goods (p. 44)
Figure 18: The Concept of Ecosystem Services (p. 45)
Figure 19: Stonewalls - Link Between Agriculture and Tourism (p. 47)
Figure 20: Importance and Satisfaction Levels with Specific Factors When Visiting Ireland, 2017
(p. 48)
Figure 21: Carbon Equivalents per Kg of Beef: EU member states (p. 50)
Figure 22: GHG Efficiency of Bovine Meat Production Expressed in kg CO2 eq/kg Product (I)
and Protein (II) in 2000 (p. 51)
Figure 23: The EU28 Water Footprint (in lcd) for Different Products (1995-2005) (p. 53)
Figure 24: Global Water Stress Index for Food Production (p. 54)
Figure 25: Green, Blue and Grey Water Footprints for Different Beef Production System
(Gm3/year) (p. 54)
Figure 26: Gross Nitrogen Balance at the European Union Level (kg N/ha), 2007-2015 (p. 55)
Figure 27: Gross Nitrogen Balance per Hectare of Utilised Agricultural Area in the EU, 2013-
2015 (p. 56)
Figure 28: Nitrogen Balance for Different Farming Systems, 2008-2015 (p. 57)
Figure 29: Consumers’ Perceptions of Animal Welfare in the EU and US (p. 60)
Figure 30: SWOT Analysis of the Irish Beef Sector (p. 69)
The Economic and Societal Importance of the Irish Suckler Beef Sector 7
Abbreviations
AHC
AWA
AWI
CHP
CSO
CW
CAP
DAFM
ENRD
FDA
GAP
GDP
GHG
GNP
GVA
ICBF
n.a.
NFS
American Humane Association
Animal Welfare Approved
Animal Welfare Index
Certified Humane Programme
Central Statistics Office
Carcass weight
Common Agricultural Policy
Department of Agriculture, Food and the Marine
European Network for Rural Development
Food and Drug Administration
Global Animal Partnership
Gross domestic product
Greenhouse gas
Gross national product
Gross value added
Irish Cattle Breeding Federation
Not available
National Farm Survey
The Economic and Societal Importance of the Irish Suckler Beef Sector 8
Executive Summary
The beef sector in Ireland is very significant accounting for over one-third of all agricultural output and over 20 percent of total Irish food and drink exports. The agri-food sector in
general provides direct and indirect employment to over 300,000 people with over 13,000
employed in the meat processing sector alone. The value of beef exports is growing and
exceeded €2.6 billion in 2017. Domestic consumption of Irish beef accounted for a further
€230 million last year. In all, the value of the Irish beef sector is estimated to be almost €2.9
billion.
The large and productive beef sector is supported by a suckler cow herd of approximately 1
million cows according to CSO data, although recent reports based on the DAFM Animal
Movement Identification System put the figure closer to 900,000. The suckler cow herd is
distributed throughout the country but particularly dominating in the West. The important
regional presence of the suckler cow sector is reflected in the fact that suckler cows account
for over 80 percent of cows in the West, with the figure in excess of 90 percent in some
counties.
Cattle farmers make a considerable contribution to the Irish local economy both through the
inputs they purchase and the outputs produced. There are 77,738 specialist cattle farms in
Ireland. It is estimated that cattle farmers spend over €1.5 billion annually on agri-inputs, most
of which is spent in the local rural economy.
The economic impact of agriculture and beef in particular is considerable and exceeds that of
many other sectors in the Irish economy, meaning that an increase in output in the beef sector
generates relatively more economic activity than a comparable increase in other industrial
sectors. Indeed, the multiplier effect for the beef sector is greater than that of the agriculture
sector in general, that is to say that a €1million increase in beef sector output would generate
a further €2.11 million in the wider economy and support an additional 16 jobs. The
comparative figure for the agriculture sector more generally is €1.44 million.
Direct payments made to farmers also make a substantial contribution to the wider rural
economy as farmers use these payments to purchase inputs and to generate output that leads to further economic activity. Previous research has estimated that every €1 of direct
payments to cattle farmers supports €4.28 of output in the wider economy.
In addition to the economic impact, suckler farmers contribute to wider societal sustainability,
particularly as they are often located in marginal or economically disadvantaged areas, where
their presence is vital to the social fabric and cultural capital. They produce public goods such
as protection of the environment and biodiversity and the preservation of the landscape and
unique features such as stonewalls and hedgerows all of which positively contribute to the
The Economic and Societal Importance of the Irish Suckler Beef Sector 9
image of rural Ireland and rural tourism. Previous research has shown that extensive grass
based farm systems, such as suckler cow farming, deliver higher levels of public goods.
For a small island on the edge of Europe, Ireland punches above its weight when it comes to
beef exports. Ireland is the largest exporter of beef in the EU and the sixth largest exporter
of beef in the world. The national suckler herd is of fundamental importance to Ireland’s
reputation as a major exporter of high quality prime beef. Cattle from the suckler herd
generally have a superior grading profile and heavier weight for age resulting in higher saleable
meat yield and higher value cuts.
The prevalence of Irish-owned companies in the beef sector and the relatively low reliance of
beef farming and meat processing on imported inputs means that beef exports make a major
contribution to net foreign earnings in the Irish economy. It is estimated that every €100 of
exports from the biosector, which includes beef, generates €48 in net foreign earnings, while
the non-biosector contributes €19.
Consumers worldwide are becoming increasingly concerned about the sustainability of food
production. This provides a unique opportunity for Ireland as we produce some of the world’s
most sustainable beef. The carbon footprint of beef production in Ireland is well below the
European average, it is the fifth lowest in Europe and is almost one-quarter of the Brazilian
footprint. The Beef Data and Genomics Programme (BDGP) is delivering further carbon
efficiencies with the ICBF estimating that by 2030 the genetic gain achieved through the
programme will reduce greenhouse gas emissions by 14 percent per kilogram of beef
produced.
There are many positives around the sustainable system of Irish beef production. The UN
placed Ireland as the most water efficient producer of food globally with a 0.2 percent stress
rating. Other international studies have shown that Ireland is the most nitrogen efficient
producer of livestock products in Europe. Animal welfare in Ireland is extremely high by global
standards, growth promoters and hormone treatments are forbidden and our clean, green
image is a major marketing strength internationally. Furthermore, grass-fed beef has been
proved to be healthier, lower in fat with a content of two to six times more Omega-3 fatty
acids and as such demand for grass-fed beef is growing especially in affluent markets.
The economic outlook is for continued growth in the global demand for beef with the
OECD/FAO projecting that global consumption of beef will grow by 9 percent by 2026.
Ireland is well positioned to exploit this opportunity given our strong sustainability credentials
and export focus. The recent opening of the Chinese and American markets for Irish beef is
also a positive development especially in light of the potential threats posed by Brexit.
Notwithstanding the economic importance of the beef sector to the wider Irish economy and
its continued success on international export markets, the beef industry is underpinned by a
farm sector facing considerable economic difficulties. The income situation on cattle farms in
Ireland remains challenging with the Teagasc National Farm Survey showing an average farm
The Economic and Societal Importance of the Irish Suckler Beef Sector 10
income of just €12,529 on cattle rearing farms in 2017. On average, costs of production
exceed market prices, and the reliance on direct payments is critical. Without a substantial
increase in beef prices and/or improvements in efficiency levels the vast majority of cattle
farmers will continue to rely on direct payments.
Furthermore, a number of threats loom on the horizon for the future of the Irish beef sector.
Brexit and other international trade agreements such as Mercosur, threaten future trade
patterns and ultimately farm-level prices. The impending reform of the Common Agricultural
Policy may also impact on the value of direct payments to farmers. The impact of climate
change policy on the ability of the sector to exploit future market opportunities is a further
threat as Ireland is committed to a number of international agreements to reduce greenhouse
gas emissions. In the context of sustainable food production however, international carbon
leakage is a major concern. Carbon leakage occurs if Ireland reduces the production of beef
to meet international policy commitments, but less carbon efficient countries increase beef
production to satisfy growing international demand.
The very difficult income situation on Irish suckler farms is unsustainable and is already
resulting in individual farmers reducing animal numbers leading to a loss in beef output, export
values and employment. It is estimated that a 10 percent contraction in the suckler cow herd
would lead to a loss in beef output of €145 million and a loss of total output in the economy
of €305 million. A contraction in the Irish suckler cow herd may also lead to land
abandonment in marginal areas, causing a loss of natural landscape features, biodiversity and
a contracting rural community.
The Irish suckler cow sector is at a critical juncture. A number of factors threaten its future
development and sustainability. Without positive action it is most likely that these factors will
lead to a contracting national suckler cow herd. This will have implications for the large
farming community engaged in suckler farming, the vibrancy of rural areas, the agri-input
sector, employment in the beef processing sector and the value of exports from Ireland. These
negative implications will be most harshly felt in the West of Ireland and particularly in local
economies and communities where there may be limited alternative economic opportunities.
The Economic and Societal Importance of the Irish Suckler Beef Sector 11
Chapter1: Introduction and Overview
This report provides an assessment of the current status of the Irish suckler beef sector and
its importance in terms of economic and non-economic outputs and impacts. Commissioned
by the Irish Farmers Association and conducted by University College Cork, the report aims
to offer a basis for informed decision making and policy design that will influence the direction
of the Irish beef sector in the coming years.
THE KEY OBJECTIVES OF THIS REPORT ARE TO:
Assess the importance of the suckler cow herd in the context of Irish agriculture, the
Irish beef sector and the Irish economy;
Examine the economic and social impact of the suckler cow herd, especially in terms of people and employment; and
Explore environmental and policy issues related to the suckler cow herd.
Throughout this report references are made to the beef sector, farm level sector, cattle farms,
suckler herd, processing sector and agri-food sector. The following section provides some
clarification to the frequently used terms and concepts in this report.
The primary agricultural sector in Ireland is comprised of 139,860 farms according to the
Central Statistics Office (CSO). It is estimated that over 100,000 of these farms stock beef
animals but just 77,738 are specialist beef cattle farms. The value of beef output generated by the primary agricultural sector is approximately €2.4 billion, this includes beef meat arising
from dairy and beef breed animals. In this report non-dairy breed cows are referred to as
suckler cows and the term suckler beef refers to the meat produced by non-dairy breed cows
and their progeny. The Teagasc NFS is the official source of farm income data but represents
just 84,599 farms, with the smallest farms excluded. The Teagasc National Farm Survey (NFS)
distinguish between two types of specialist cattle farms; ‘cattle-rearing’ which includes farms
stocking suckler cows and producing beef breed animals and ‘cattle other’ which includes
farms fattening and finishing both beef and dairy breed animals. The Teagasc NFS represents
19,952 cattle-rearing farms and 27,025 cattle other farms. The beef sector, as referred to in
this report, includes both the primary agricultural sector and the beef-meat processing sector.
The Economic and Societal Importance of the Irish Suckler Beef Sector 12
Chapter 2: The Current State of the Beef Sector in Ireland
2.1 Introduction
The agri-food sector is one of Ireland’s most important indigenous sectors, accounting for
over 10 percent of national exports with an export value of €12.6 billion, while at the same
time providing direct and indirect employment to over 300,000 people. Beef is one of the
major subsectors accounting for over a third of total primary agricultural output in 2017.
With a total farm–level output value of almost €2.5 billion, the beef sector includes the
progeny of both beef breed suckler cows and dairy cows. The value of beef-meat exports is
growing and exceeded €2.6 billion in 2017 with domestic consumption of Irish beef accounting for a further €230 million. In all, the value of the Irish beef sector is estimated to be almost
€2.9 billion. This chapter assesses the current state of the Irish beef sector with an emphasis
on the size, location and importance of the suckler herd.
2.2 Prevalence of Suckler Cow Farming in Ireland
This section of the report considers the number of suckler cows in Ireland, their regional
location and the importance of cattle farming to certain regions. The Central Statistics Office
(CSO) publish the national statistics on cow numbers. The national herd is comprised of dairy
cows and what the CSO refer to as “other cows”. The dataset does not specifically identify
suckler cows as such, but “other cows” can be considered to be comprised of mostly suckler
cows, although it is possible that there is a small number of non-sucklers in this group. Hence
forth in this report, the CSO series “other cows” will be referred to as suckler cows.
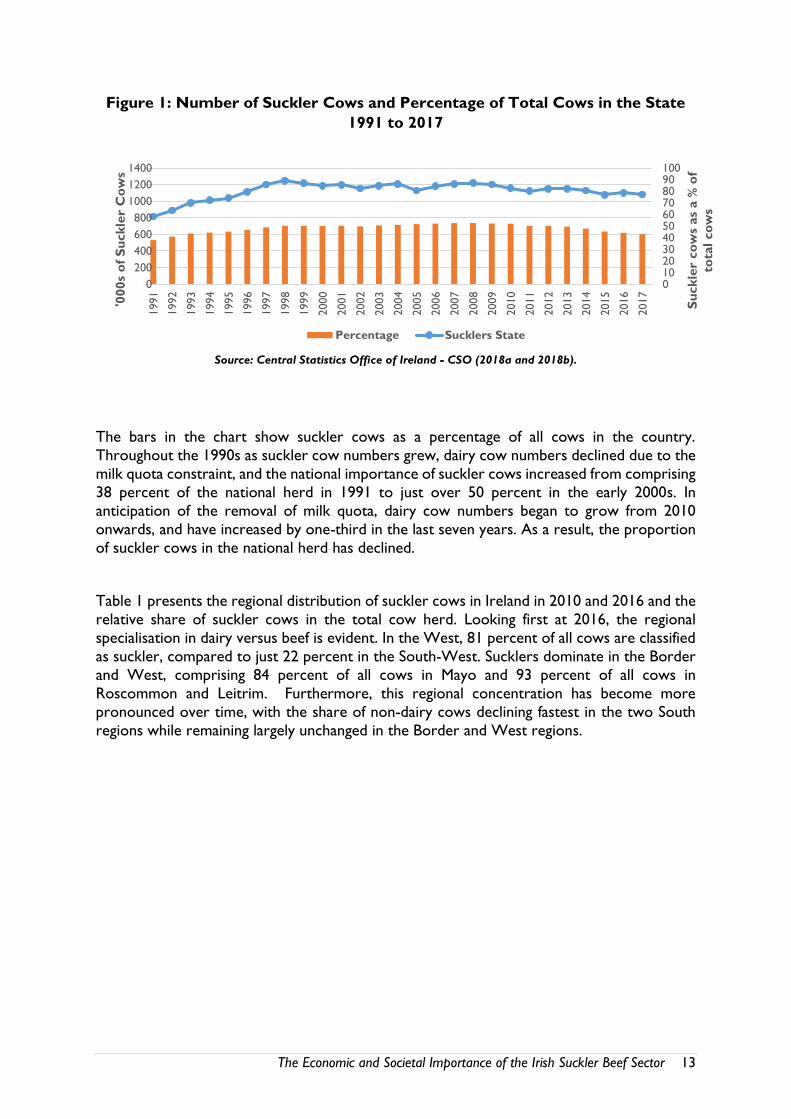
Figure 1 shows the number of suckler cows in Ireland from 1991 to 2017 as recorded in June
of each year. Throughout the 1990s, during the Mac Sharry reforms of the Common
Agricultural Policy when coupled payments were introduced, the number of suckler cows
increased. Suckler cow numbers peaked in 1998 at 1.248 million cows. The introduction of
decoupling in 2004 led to an initial stagnation in suckler cow numbers, with numbers declining more considerably since 2008. The total reduction in the number of suckler cows from 2008
to 2017 was 12 percent or a loss of 139,000 cows.1
1 While the CSO produce the official statistics on cow numbers in Ireland, the Department of Agriculture, Food and Marine
also publish data from their Animal Identification Movement System (AIMS) each year. In AIMS suckler cows are defined as
“beef/beef cross female aged more than or equal to 18 months on December 31 of every year between 2010 and 2017 and
registered as the dam of a calf born in the profile year”. According to the AIMS database there were 870,000 suckler cows
in Ireland in December of 2017.
The Economic and Societal Importance of the Irish Suckler Beef Sector 13
Figure 1: Number of Suckler Cows and Percentage of Total Cows in the State
1991 to 2017
Source: Central Statistics Office of Ireland - CSO (2018a and 2018b).
The bars in the chart show suckler cows as a percentage of all cows in the country.
Throughout the 1990s as suckler cow numbers grew, dairy cow numbers declined due to the
milk quota constraint, and the national importance of suckler cows increased from comprising
38 percent of the national herd in 1991 to just over 50 percent in the early 2000s. In
anticipation of the removal of milk quota, dairy cow numbers began to grow from 2010
onwards, and have increased by one-third in the last seven years. As a result, the proportion
of suckler cows in the national herd has declined.
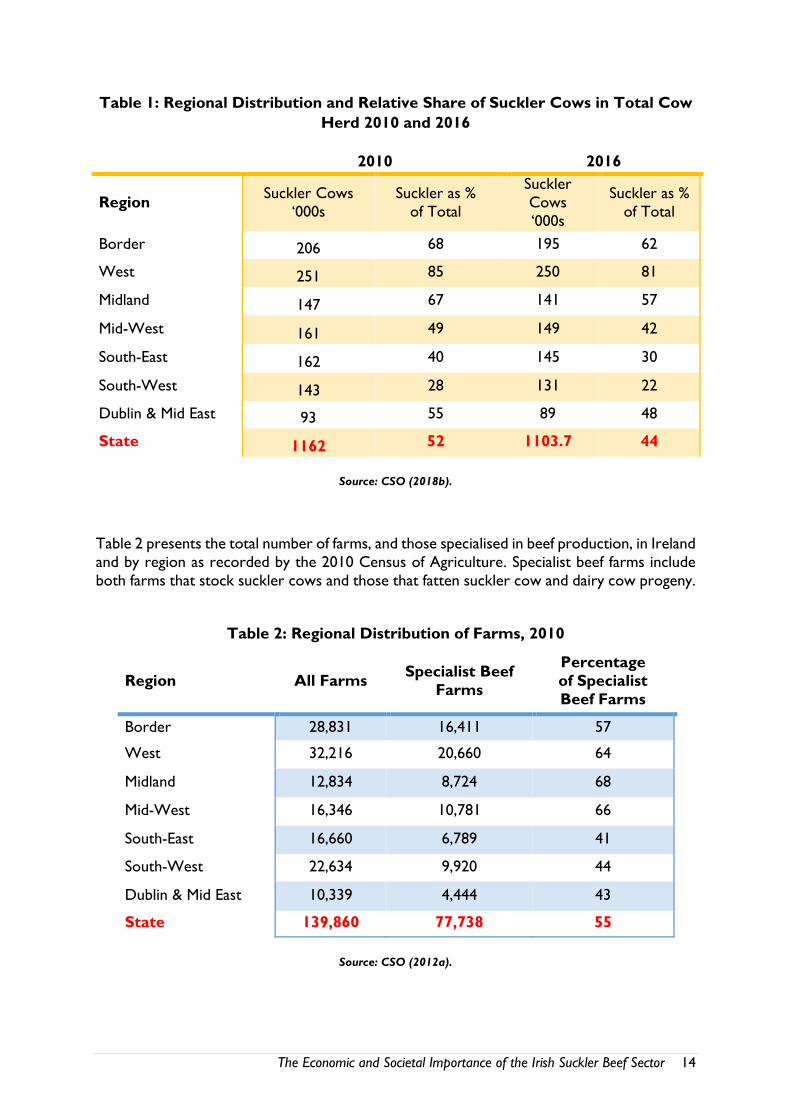
Table 1 presents the regional distribution of suckler cows in Ireland in 2010 and 2016 and the
relative share of suckler cows in the total cow herd. Looking first at 2016, the regional
specialisation in dairy versus beef is evident. In the West, 81 percent of all cows are classified
as suckler, compared to just 22 percent in the South-West. Sucklers dominate in the Border
and West, comprising 84 percent of all cows in Mayo and 93 percent of all cows in
Roscommon and Leitrim. Furthermore, this regional concentration has become more
pronounced over time, with the share of non-dairy cows declining fastest in the two South
regions while remaining largely unchanged in the Border and West regions.
0102030405060708090100
0
200
400
600
800
1000
1200
1400
1991
1992
1993
1994
1995
1996
1997
1998
1999
2000
2001
2002
2003
2004
2005
2006
2007
2008
2009
2010
2011
2012
2013
2014
2015
2016
2017
Su
ckle
r co
ws
as
a %
of
tota
l co
ws
'000s
of
Su
ckle
r C
ow
s
Percentage Sucklers State
The Economic and Societal Importance of the Irish Suckler Beef Sector 14
Table 1: Regional Distribution and Relative Share of Suckler Cows in Total Cow
Herd 2010 and 2016
2010 2016
Region Suckler Cows
‘000s
Suckler as %
of Total
Suckler
Cows
‘000s
Suckler as %
of Total
Border 206 68 195 62
West 251 85 250 81
Midland 147 67 141 57
Mid-West 161 49 149 42
South-East 162 40 145 30
South-West 143 28 131 22
Dublin & Mid East 93 55 89 48
State 1162 52 1103.7 44
Source: CSO (2018b).
Table 2 presents the total number of farms, and those specialised in beef production, in Ireland
and by region as recorded by the 2010 Census of Agriculture. Specialist beef farms include
both farms that stock suckler cows and those that fatten suckler cow and dairy cow progeny.
Table 2: Regional Distribution of Farms, 2010
Region All Farms Specialist Beef
Farms
Percentage
of Specialist
Beef Farms
Border 28,831 16,411 57
West 32,216 20,660 64
Midland 12,834 8,724 68
Mid-West 16,346 10,781 66
South-East 16,660 6,789 41
South-West 22,634 9,920 44
Dublin & Mid East 10,339 4,444 43
State 139,860 77,738 55
Source: CSO (2012a).
The Economic and Societal Importance of the Irish Suckler Beef Sector 15
In summary, the number of suckler cows in Ireland has been in decline over the last decade,
down 12 percent from 2008 to 2017. Recently, with the dairy herd expanding, the share of
suckler cows has declined more rapidly, making up 44 percent of all cows in 2016 compared
to 52 percent in 2010. Furthermore, the regional concentration has become more
pronounced over time: in the West 81 percent of all cows are sucklers compared to just 22
percent in the South-West. In the counties of Galway, Mayo, Sligo, Roscommon and Leitrim,
suckler farming is the predominant system, with suckler cows comprising over 80 and in some
cases 90 percent of the cows in these counties.
2.3 Beef and Dairy Cow Breeds
The Irish beef sector is comprised of suckler cows and their progeny, and dairy cows and
their progeny. Across Europe, more than two thirds of the cattle raised for beef originate
from dairy, as opposed to suckler herds. However, according to Burke (2016), the national
suckler herd is of fundamental importance to Ireland’s reputation as an exporter of high-
quality prime beef and live cattle as cattle bred from the suckler herd tend to be significantly
more valuable than dairy-bred animals due to their superior grading profile.
Calves of beef and dairy breed cows differ in their average weight and value, with the average
weight of beef calves (both male and female) exceeding that of dairy. The average weight of a
beef cow is 356 kg and of a dairy cow 298 kg. Similarly, the average weight of a beef bull is
494 kg and of a dairy bull 379 kg. Data extracted from Bord Bia (2018) shows the average
price of a male beef calf in Ireland in 2018 was €219.7 (excluding VAT) and that of a dairy calf
was €136. Internationally beef breed calves also tend to command higher prices than dairy.
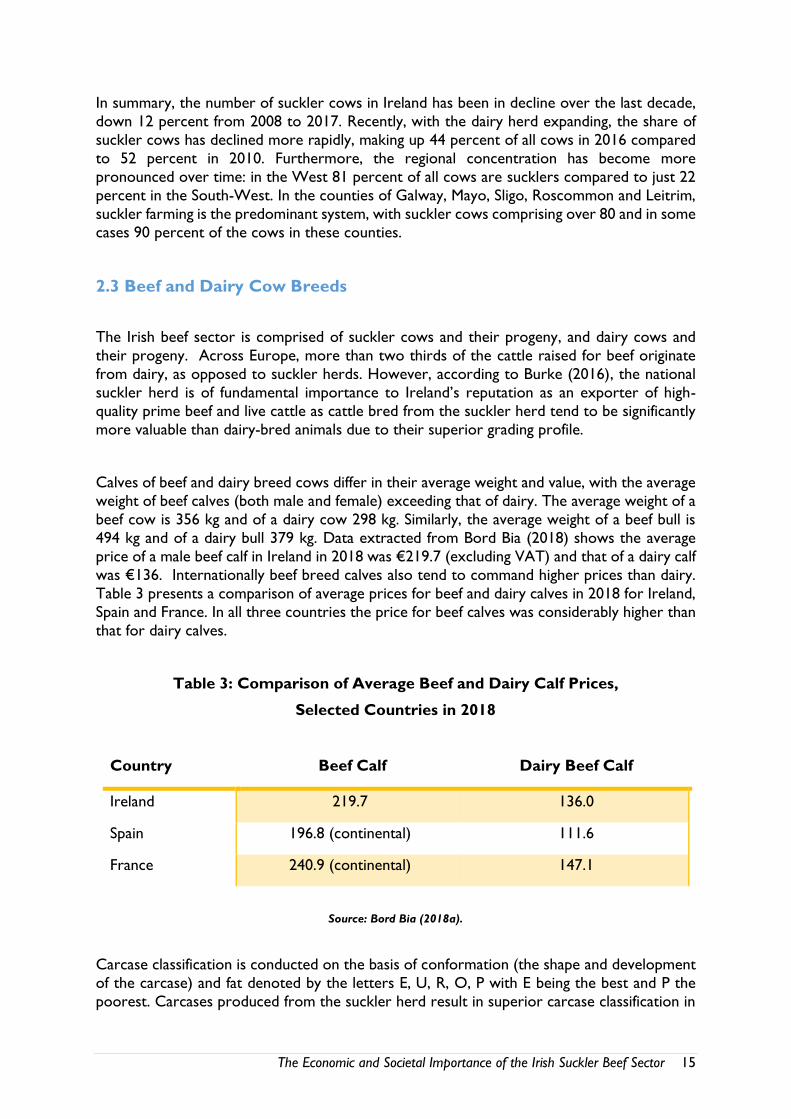
Table 3 presents a comparison of average prices for beef and dairy calves in 2018 for Ireland,
Spain and France. In all three countries the price for beef calves was considerably higher than
that for dairy calves.
Table 3: Comparison of Average Beef and Dairy Calf Prices,
Selected Countries in 2018
Country Beef Calf Dairy Beef Calf
Ireland 219.7 136.0
Spain 196.8 (continental) 111.6
France 240.9 (continental) 147.1
Source: Bord Bia (2018a).
Carcase classification is conducted on the basis of conformation (the shape and development
of the carcase) and fat denoted by the letters E, U, R, O, P with E being the best and P the
poorest. Carcases produced from the suckler herd result in superior carcase classification in
The Economic and Societal Importance of the Irish Suckler Beef Sector 16
terms of conformation, and the resulting yield of saleable meat generates higher-value cuts
(Burke, 2016). Suckler-origin cattle are typically sold at U or R grade in comparison to dairy
origin cattle which typically sell at O and P grades. For a steer at an average fat class of 3, the
price per kg varied from 354 cent per kg for P grade to 423 cent per kg for the U grade. This
represents a 20 percent price premium for the suckler product.
Due to the expansion of the dairy sector the number of beef animals coming from the dairy
herd is expected to increase and it is predicted that by 2025 dairy cow numbers will reach
1.7 million with an average herd size of over 100 cows (Teagasc, 2016a; DAFM, 2015a). A
knock-on effect is that the additional dairy cows are expected to increase beef output by 5 to
10 percent (DAFM, 2015b). It is important to note that dairy-breed beef is sold at a lower
price and, if dairy beef displaces suckler beef, then the overall value of the beef sector will
decline, other things being equal.
2.4 The Economic Situation of Suckler Cow Farms
The Teagasc National Farm Survey (NFS) is the official source of data on farm income in
Ireland. The NFS classifies farms into six farm types based on the Standard Output of the
Farm.2 Cattle rearing farms include those that stock suckler cows and produce beef breed
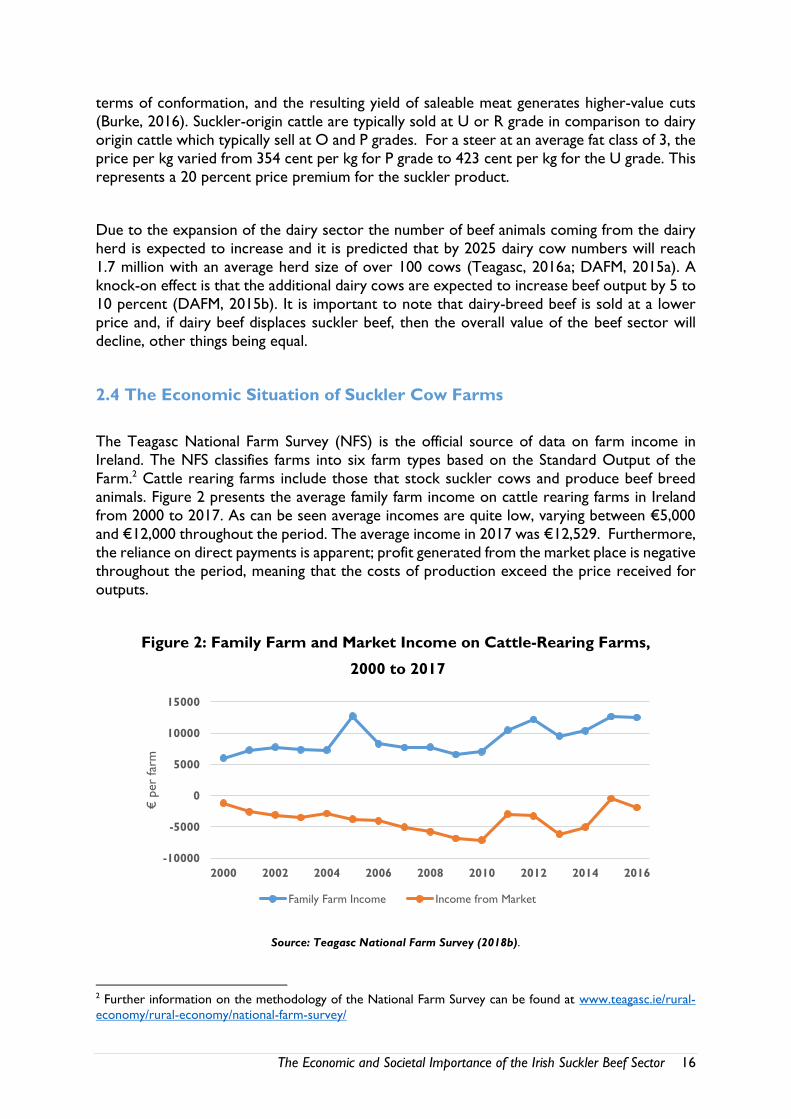
animals. Figure 2 presents the average family farm income on cattle rearing farms in Ireland
from 2000 to 2017. As can be seen average incomes are quite low, varying between €5,000
and €12,000 throughout the period. The average income in 2017 was €12,529. Furthermore,
the reliance on direct payments is apparent; profit generated from the market place is negative
throughout the period, meaning that the costs of production exceed the price received for
outputs.
Figure 2: Family Farm and Market Income on Cattle-Rearing Farms,
2000 to 2017
Source: Teagasc National Farm Survey (2018b).
2 Further information on the methodology of the National Farm Survey can be found at www.teagasc.ie/rural-
economy/rural-economy/national-farm-survey/
-10000
-5000
0
5000
10000
15000
2000 2002 2004 2006 2008 2010 2012 2014 2016
€per
farm
Family Farm Income Income from Market
The Economic and Societal Importance of the Irish Suckler Beef Sector 17
In addition to examining income levels it is also useful to consider the viability of cattle rearing
farms. The viability framework employed by the Teagasc National Farm Survey defines a farm
as being economically viable if the farm income can remunerate family labour at the minimum
agricultural wage and provide a 5 percent return on the capital invested in non-land assets.
Farms that are not economically viable are defined as sustainable if the farmer or the spouse
has an off-farm job. Farms that are neither economically viable nor sustainable are classified
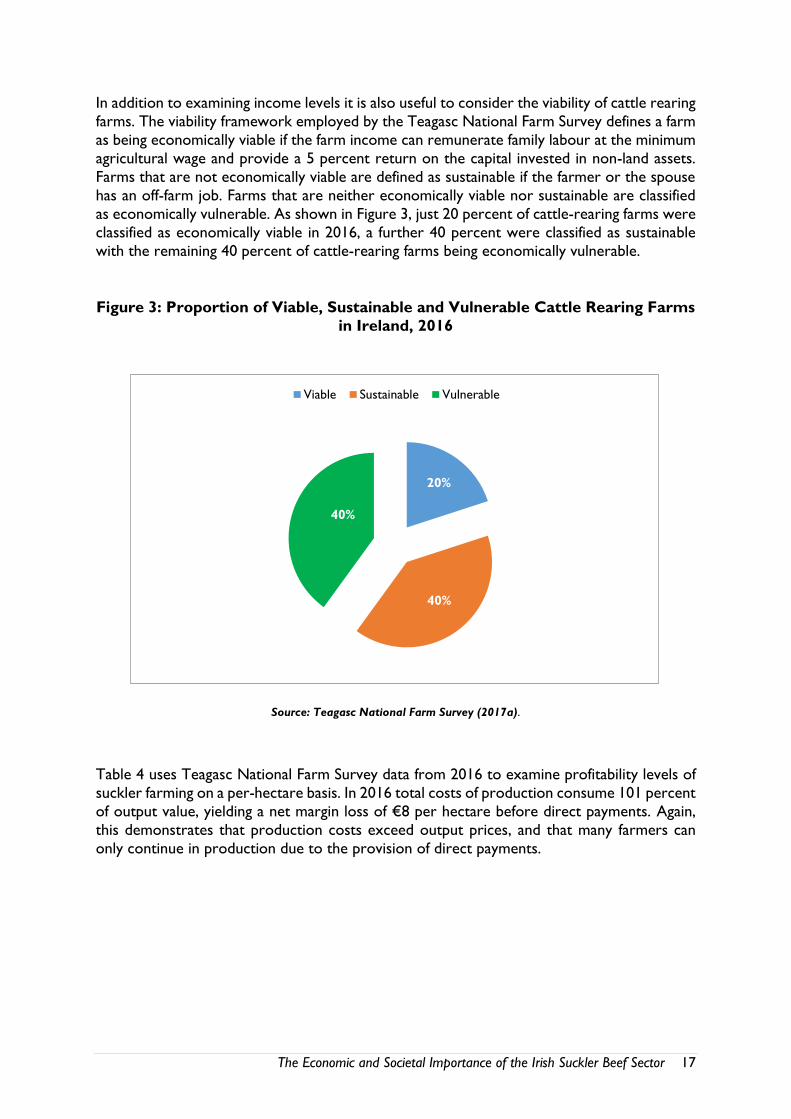
as economically vulnerable. As shown in Figure 3, just 20 percent of cattle-rearing farms were
classified as economically viable in 2016, a further 40 percent were classified as sustainable
with the remaining 40 percent of cattle-rearing farms being economically vulnerable.
Figure 3: Proportion of Viable, Sustainable and Vulnerable Cattle Rearing Farms
in Ireland, 2016
Source: Teagasc National Farm Survey (2017a).
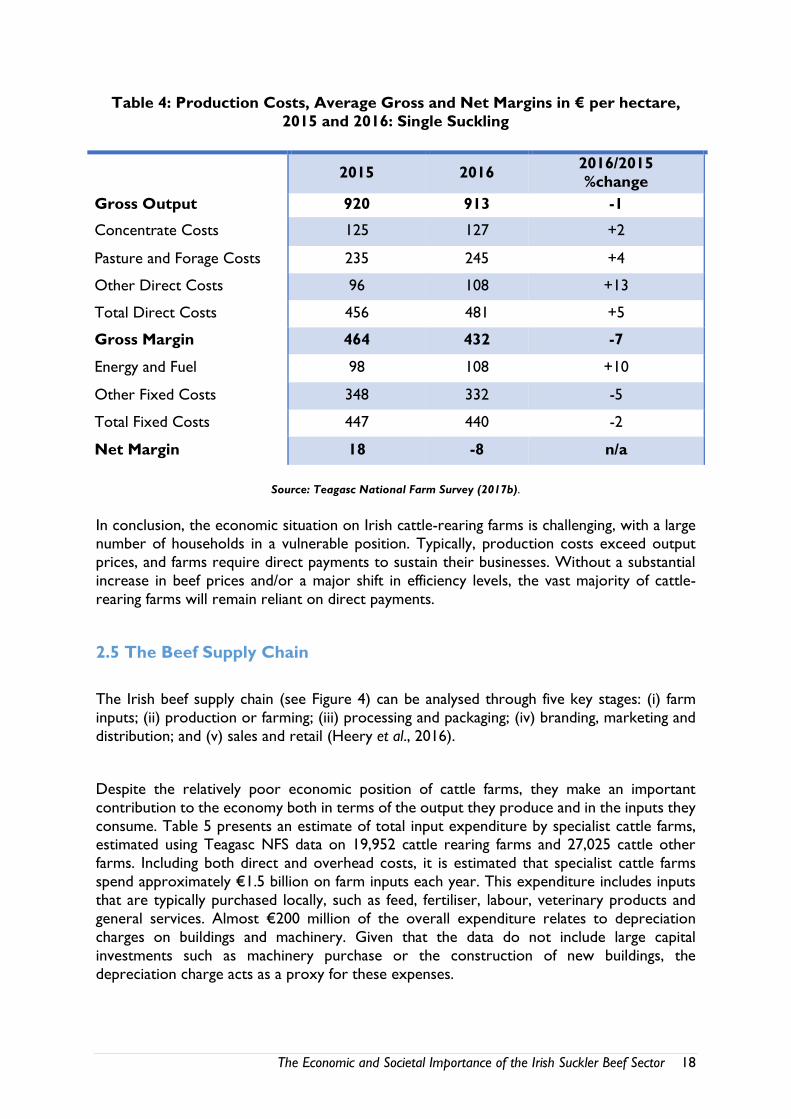
Table 4 uses Teagasc National Farm Survey data from 2016 to examine profitability levels of
suckler farming on a per-hectare basis. In 2016 total costs of production consume 101 percent
of output value, yielding a net margin loss of €8 per hectare before direct payments. Again,
this demonstrates that production costs exceed output prices, and that many farmers can
only continue in production due to the provision of direct payments.
20%
40%
40%
Viable Sustainable Vulnerable
The Economic and Societal Importance of the Irish Suckler Beef Sector 18
Table 4: Production Costs, Average Gross and Net Margins in € per hectare,
2015 and 2016: Single Suckling
2015 2016
2016/2015
%change
Gross Output 920 913 -1
Concentrate Costs 125 127 +2
Pasture and Forage Costs 235 245 +4
Other Direct Costs 96 108 +13
Total Direct Costs 456 481 +5
Gross Margin 464 432 -7
Energy and Fuel 98 108 +10
Other Fixed Costs 348 332 -5
Total Fixed Costs 447 440 -2
Net Margin 18 -8 n/a
Source: Teagasc National Farm Survey (2017b).
In conclusion, the economic situation on Irish cattle-rearing farms is challenging, with a large number of households in a vulnerable position. Typically, production costs exceed output
prices, and farms require direct payments to sustain their businesses. Without a substantial
increase in beef prices and/or a major shift in efficiency levels, the vast majority of cattle-
rearing farms will remain reliant on direct payments.
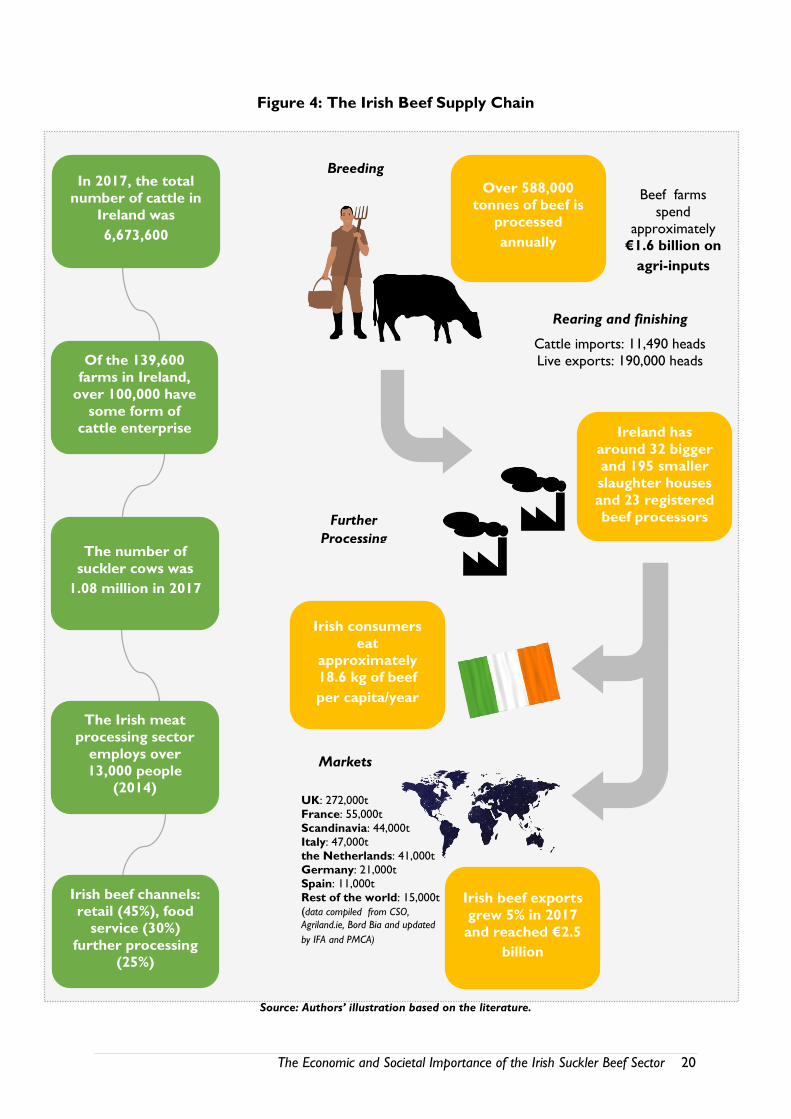
2.5 The Beef Supply Chain
The Irish beef supply chain (see Figure 4) can be analysed through five key stages: (i) farm
inputs; (ii) production or farming; (iii) processing and packaging; (iv) branding, marketing and
distribution; and (v) sales and retail (Heery et al., 2016).
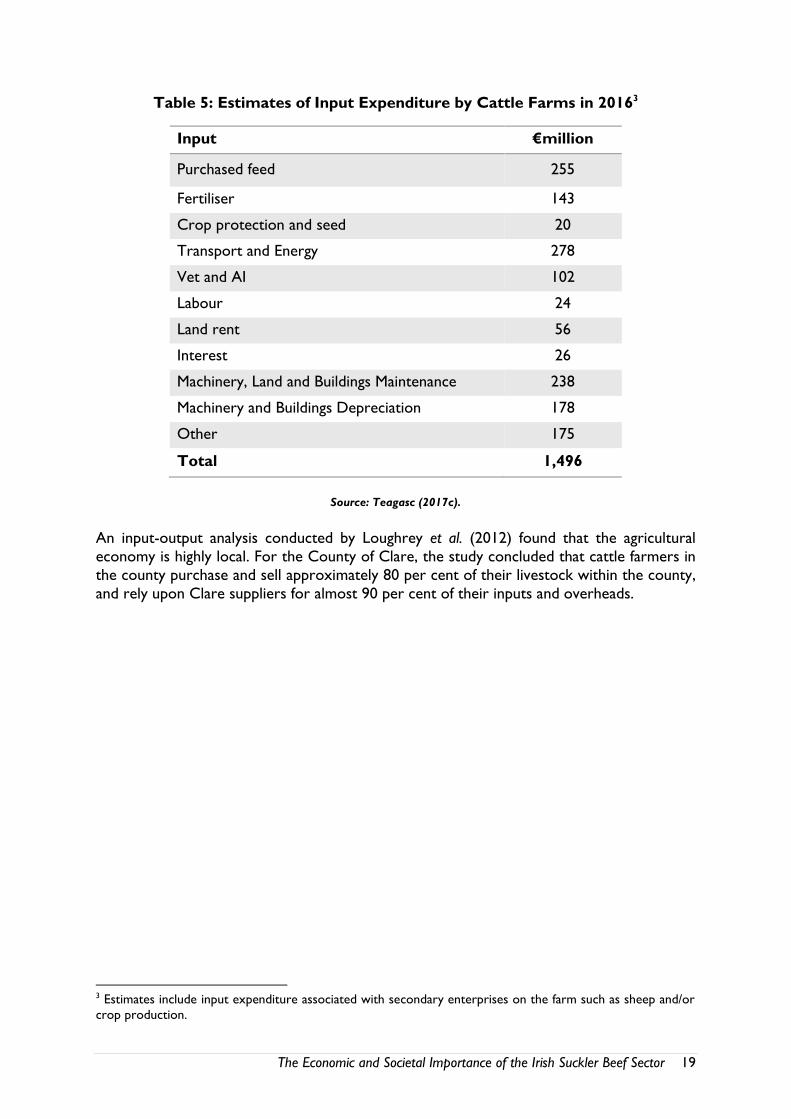
Despite the relatively poor economic position of cattle farms, they make an important
contribution to the economy both in terms of the output they produce and in the inputs they
consume. Table 5 presents an estimate of total input expenditure by specialist cattle farms, estimated using Teagasc NFS data on 19,952 cattle rearing farms and 27,025 cattle other
farms. Including both direct and overhead costs, it is estimated that specialist cattle farms
spend approximately €1.5 billion on farm inputs each year. This expenditure includes inputs
that are typically purchased locally, such as feed, fertiliser, labour, veterinary products and
general services. Almost €200 million of the overall expenditure relates to depreciation
charges on buildings and machinery. Given that the data do not include large capital
investments such as machinery purchase or the construction of new buildings, the
depreciation charge acts as a proxy for these expenses.
The Economic and Societal Importance of the Irish Suckler Beef Sector 19
Table 5: Estimates of Input Expenditure by Cattle Farms in 20163
Input €million
Purchased feed 255
Fertiliser 143
Crop protection and seed 20
Transport and Energy 278
Vet and AI 102
Labour 24
Land rent 56
Interest 26
Machinery, Land and Buildings Maintenance 238
Machinery and Buildings Depreciation 178
Other 175
Total 1,496
Source: Teagasc (2017c).
An input-output analysis conducted by Loughrey et al. (2012) found that the agricultural
economy is highly local. For the County of Clare, the study concluded that cattle farmers in
the county purchase and sell approximately 80 per cent of their livestock within the county,
and rely upon Clare suppliers for almost 90 per cent of their inputs and overheads.
3 Estimates include input expenditure associated with secondary enterprises on the farm such as sheep and/or
crop production.
The Economic and Societal Importance of the Irish Suckler Beef Sector 20
Figure 4: The Irish Beef Supply Chain
Source: Authors’ illustration based on the literature.
UK: 272,000t
France: 55,000t
Scandinavia: 44,000t
Italy: 47,000t
the Netherlands: 41,000t
Germany: 21,000t
Spain: 11,000t
Rest of the world: 15,000t
(data compiled from CSO,
Agriland.ie, Bord Bia and updated
by IFA and PMCA)
Ireland has
around 32 bigger
and 195 smaller
slaughter houses
and 23 registered
beef processors
Irish consumers
eat
approximately
18.6 kg of beef
per capita/year
Irish beef exports
grew 5% in 2017
and reached €2.5
billion
Of the 139,600
farms in Ireland,
over 100,000 have
some form of
cattle enterprise
Irish beef channels:
retail (45%), food
service (30%)
further processing
(25%)
The number of
suckler cows was
1.08 million in 2017
The Irish meat
processing sector
employs over
13,000 people
(2014)
Further
Processing
Markets
Rearing and finishing
Cattle imports: 11,490 heads
Live exports: 190,000 heads
Over 588,000
tonnes of beef is
processed
annually
In 2017, the total
number of cattle in
Ireland was
6,673,600
Breeding
Beef farms
spend
approximately
€1.6 billion on
agri-inputs
The Economic and Societal Importance of the Irish Suckler Beef Sector 21
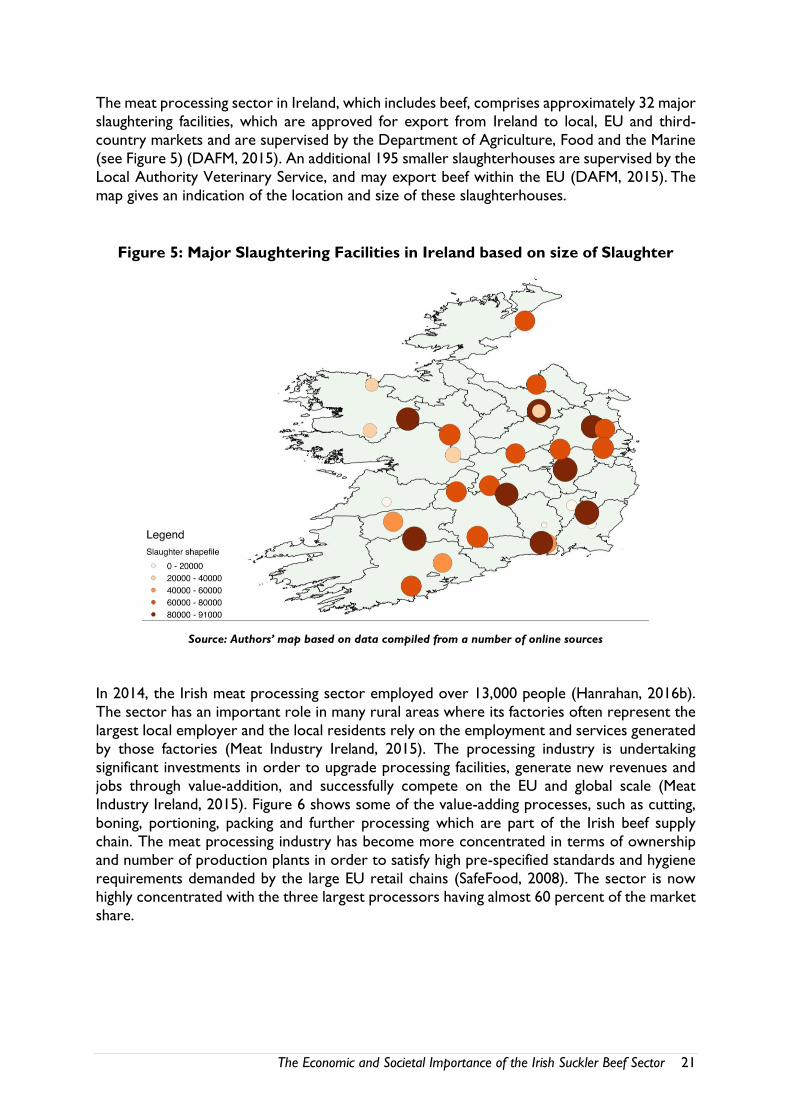
The meat processing sector in Ireland, which includes beef, comprises approximately 32 major
slaughtering facilities, which are approved for export from Ireland to local, EU and third-
country markets and are supervised by the Department of Agriculture, Food and the Marine
(see Figure 5) (DAFM, 2015). An additional 195 smaller slaughterhouses are supervised by the
Local Authority Veterinary Service, and may export beef within the EU (DAFM, 2015). The
map gives an indication of the location and size of these slaughterhouses.
Figure 5: Major Slaughtering Facilities in Ireland based on size of Slaughter
Source: Authors’ map based on data compiled from a number of online sources
In 2014, the Irish meat processing sector employed over 13,000 people (Hanrahan, 2016b).
The sector has an important role in many rural areas where its factories often represent the
largest local employer and the local residents rely on the employment and services generated
by those factories (Meat Industry Ireland, 2015). The processing industry is undertaking
significant investments in order to upgrade processing facilities, generate new revenues and
jobs through value-addition, and successfully compete on the EU and global scale (Meat
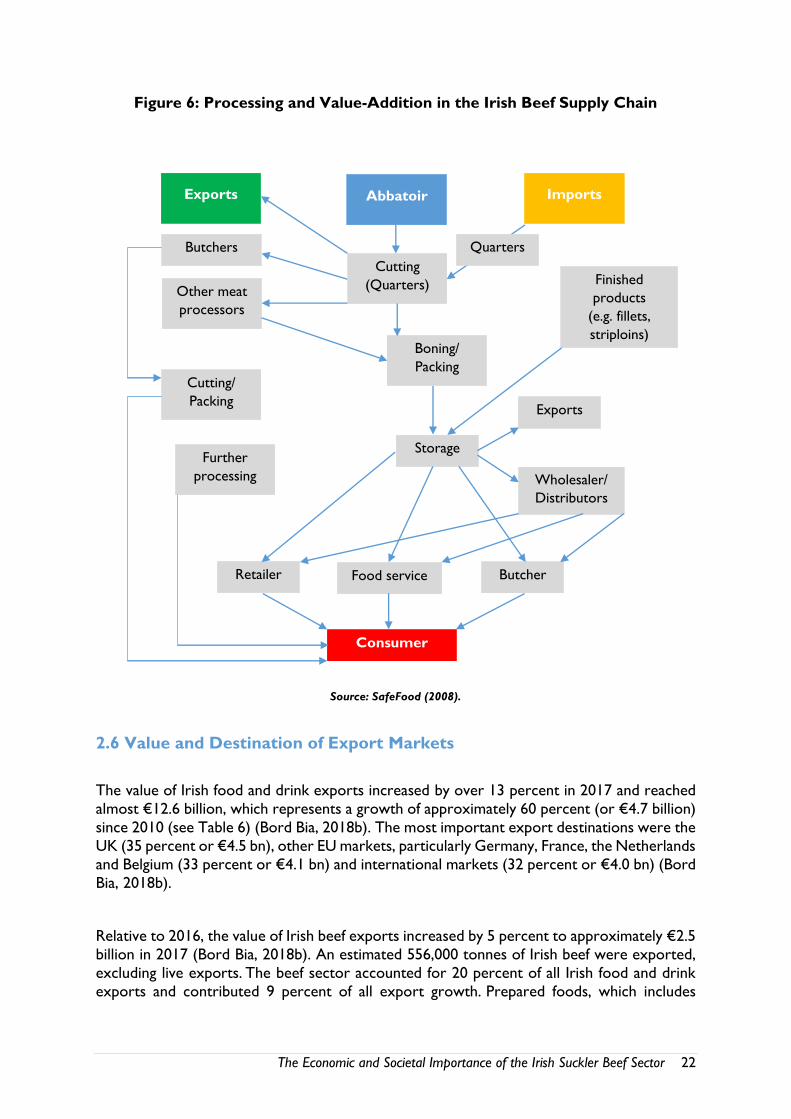
Industry Ireland, 2015). Figure 6 shows some of the value-adding processes, such as cutting,
boning, portioning, packing and further processing which are part of the Irish beef supply
chain. The meat processing industry has become more concentrated in terms of ownership
and number of production plants in order to satisfy high pre-specified standards and hygiene
requirements demanded by the large EU retail chains (SafeFood, 2008). The sector is now highly concentrated with the three largest processors having almost 60 percent of the market
share.
The Economic and Societal Importance of the Irish Suckler Beef Sector 22
Figure 6: Processing and Value-Addition in the Irish Beef Supply Chain
Source: SafeFood (2008).
2.6 Value and Destination of Export Markets
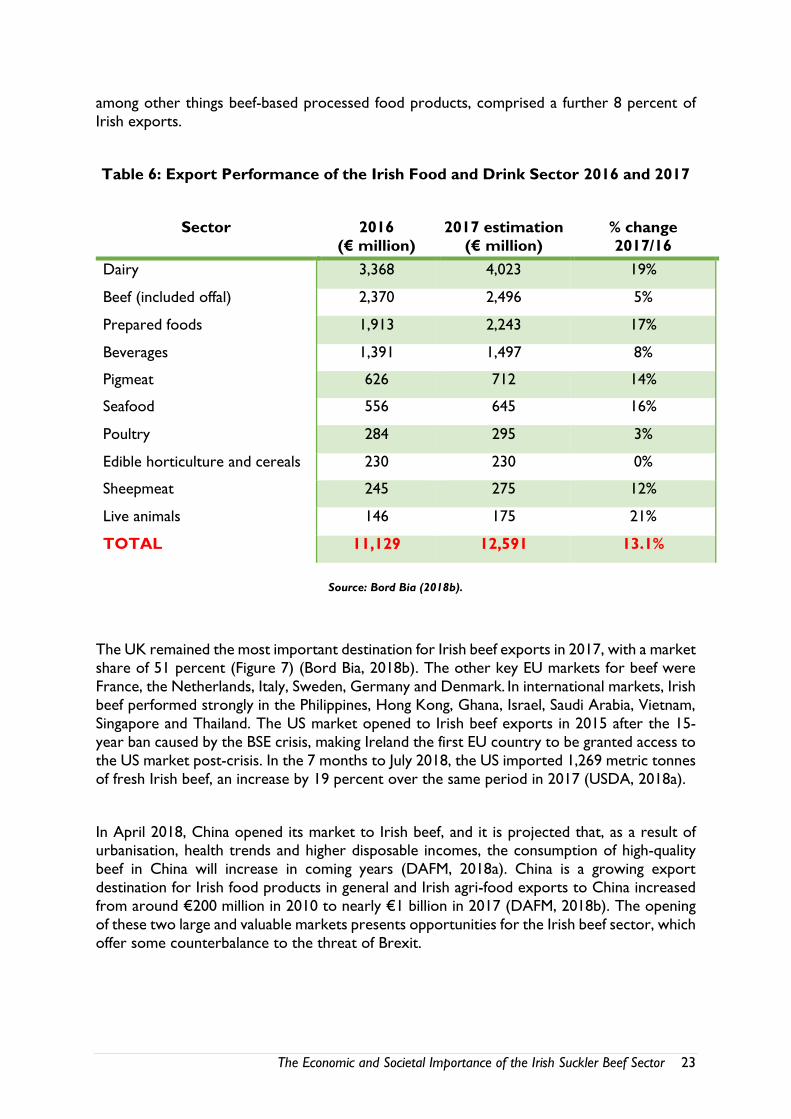
The value of Irish food and drink exports increased by over 13 percent in 2017 and reached
almost €12.6 billion, which represents a growth of approximately 60 percent (or €4.7 billion)
since 2010 (see Table 6) (Bord Bia, 2018b). The most important export destinations were the
UK (35 percent or €4.5 bn), other EU markets, particularly Germany, France, the Netherlands
and Belgium (33 percent or €4.1 bn) and international markets (32 percent or €4.0 bn) (Bord
Bia, 2018b).
Relative to 2016, the value of Irish beef exports increased by 5 percent to approximately €2.5
billion in 2017 (Bord Bia, 2018b). An estimated 556,000 tonnes of Irish beef were exported,
excluding live exports. The beef sector accounted for 20 percent of all Irish food and drink
exports and contributed 9 percent of all export growth. Prepared foods, which includes
Abbatoir Imports Exports
Cutting
(Quarters)
Butchers
Other meat
processors
Boning/
Packing
Finished
products
(e.g. fillets,
striploins)
Exports
Storage
Wholesaler/
Distributors
Butcher Food service Retailer
Consumer
Further
processing
Cutting/
Packing
Quarters
The Economic and Societal Importance of the Irish Suckler Beef Sector 23
among other things beef-based processed food products, comprised a further 8 percent of
Irish exports.
Table 6: Export Performance of the Irish Food and Drink Sector 2016 and 2017
Sector 2016
(€ million)
2017 estimation
(€ million)
% change
2017/16
Dairy 3,368 4,023 19%
Beef (included offal) 2,370 2,496 5%
Prepared foods 1,913 2,243 17%
Beverages 1,391 1,497 8%
Pigmeat 626 712 14%
Seafood 556 645 16%
Poultry 284 295 3%
Edible horticulture and cereals 230 230 0%
Sheepmeat 245 275 12%
Live animals 146 175 21%
TOTAL 11,129 12,591 13.1%
Source: Bord Bia (2018b).
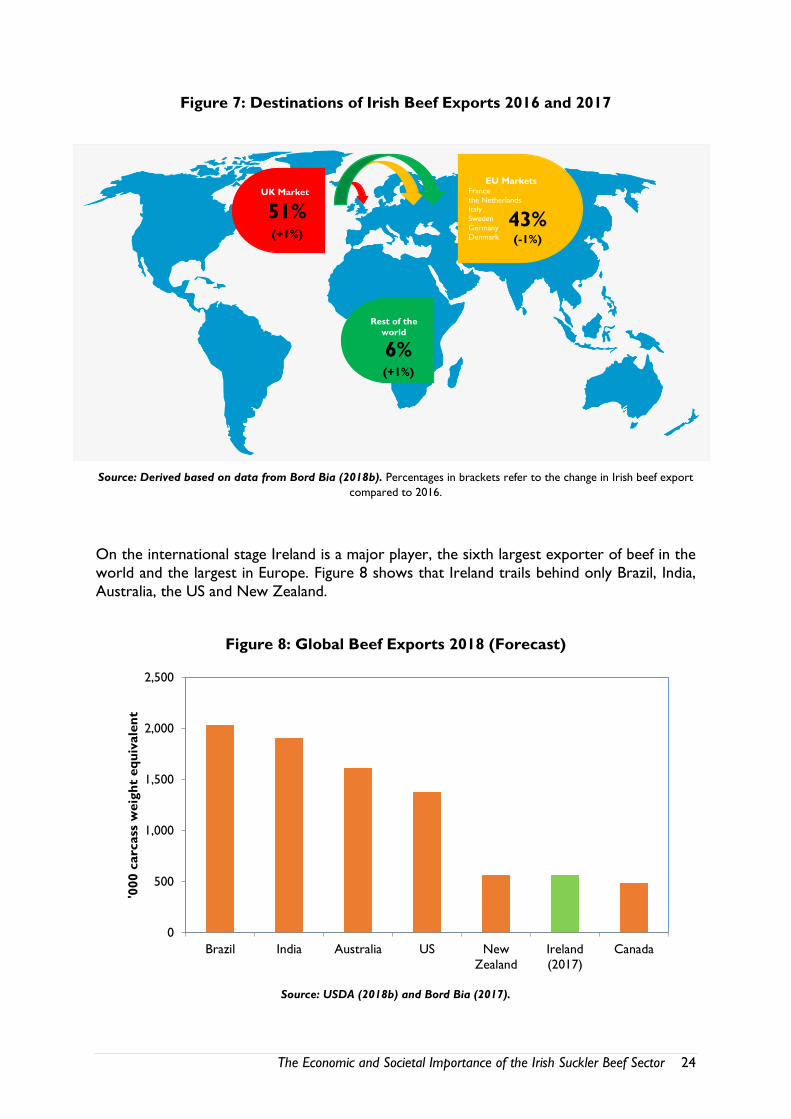
The UK remained the most important destination for Irish beef exports in 2017, with a market
share of 51 percent (Figure 7) (Bord Bia, 2018b). The other key EU markets for beef were
France, the Netherlands, Italy, Sweden, Germany and Denmark. In international markets, Irish
beef performed strongly in the Philippines, Hong Kong, Ghana, Israel, Saudi Arabia, Vietnam,
Singapore and Thailand. The US market opened to Irish beef exports in 2015 after the 15-
year ban caused by the BSE crisis, making Ireland the first EU country to be granted access to
the US market post-crisis. In the 7 months to July 2018, the US imported 1,269 metric tonnes
of fresh Irish beef, an increase by 19 percent over the same period in 2017 (USDA, 2018a).
In April 2018, China opened its market to Irish beef, and it is projected that, as a result of urbanisation, health trends and higher disposable incomes, the consumption of high-quality
beef in China will increase in coming years (DAFM, 2018a). China is a growing export
destination for Irish food products in general and Irish agri-food exports to China increased
from around €200 million in 2010 to nearly €1 billion in 2017 (DAFM, 2018b). The opening
of these two large and valuable markets presents opportunities for the Irish beef sector, which
offer some counterbalance to the threat of Brexit.
The Economic and Societal Importance of the Irish Suckler Beef Sector 24
Figure 7: Destinations of Irish Beef Exports 2016 and 2017
Source: Derived based on data from Bord Bia (2018b). Percentages in brackets refer to the change in Irish beef export
compared to 2016.
On the international stage Ireland is a major player, the sixth largest exporter of beef in the
world and the largest in Europe. Figure 8 shows that Ireland trails behind only Brazil, India,
Australia, the US and New Zealand.
Figure 8: Global Beef Exports 2018 (Forecast)
Source: USDA (2018b) and Bord Bia (2017).
0
500
1,000
1,500
2,000
2,500
Brazil India Australia US New
Zealand
Ireland
(2017)
Canada
'000 c
arc
ass
weig
ht
eq
uiv
ale
nt
EU Markets France
the Netherlands
Italy
Sweden
Germany
Denmark
43% (-1%)
UK Market
51% (+1%)
Rest of the
world
6% (+1%)
The Economic and Societal Importance of the Irish Suckler Beef Sector 25
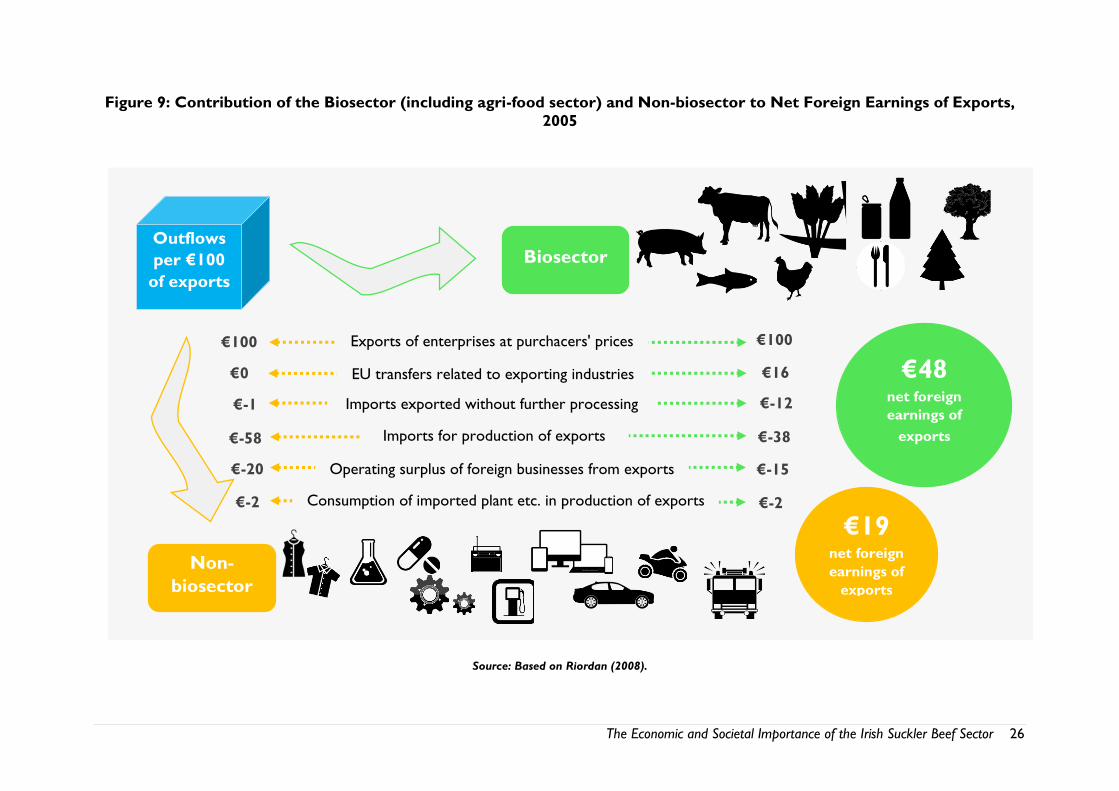
As pointed out above, the agri-food sector accounts for just over 10 percent of goods exports
from Ireland. However, analysis conducted by Riordan (2008) demonstrated that the agri-
food sector is a much larger contributor to foreign earnings. Riordan’s analysis showed that
every €100 of exports from the biosector, which includes agri-food, generated €48 in net
foreign earnings, while the non-biosector contributed only €19 (Riordan, 2008) (Figure 9 and
see the Appendix 3 for exhaustive list of industries in biosector and non-biosector taken into
consideration in the analysis). The key reasons for such a large contribution from the
biosector were lower import requirements per euro of exports, the prevalence of Irish-
owned companies, and higher receipts of EU payments.
2.7 Live Exports from Ireland
The beef export figures cited above do not include the value of beef animals exported live
from Ireland. Live cattle exports represent a significant market outlet and source of
competition for certain categories of stock, particularly for male dairy calves, as well as high-
quality weanlings from the suckler herd (Burke, 2016). The total number of beef animals
exported live from Ireland fell from a record high of almost 350,000 in 2010 to less than
150,000 in 2016. In 2017, approximately 190,000 head were exported, of which calves were
the most significant category (53 percent), followed by weanlings (15 percent), adult or
finished cattle (14 percent) and store cattle (13 percent) (Bord Bia, 2018b). Irish calf exports
increased by 40 percent compared to 2016 and reached about 101,000 head (Bord Bia, 2017).
Cattle live exports in 2017 were valued at approximately €115 million. Adding this to the
€2.5 billion of beef exports outlined brings the total value of beef exports to a figure in excess
of €2.6 billion.
The key markets for Irish calves included the Netherlands (42,000 head), Spain (43,000 head),
Belgium (5,000 heads) and France (in decline) (Bord Bia, 2018b). Although live cattle exports
to Great Britain dropped by 6 percent in 2017 and reached only 6,000 head, this was offset
by the 12 percent increase in cattle exported to Northern Ireland (27,000 head) and almost
30,000 animals exported to Turkey, which now accounts for 16 percent of Irish live cattle
trade (Bord Bia, 2018b).
The Economic and Societal Importance of the Irish Suckler Beef Sector 26
Figure 9: Contribution of the Biosector (including agri-food sector) and Non-biosector to Net Foreign Earnings of Exports,
2005
Source: Based on Riordan (2008).
Outflows
per €100
of exports
Biosector
Non-
biosector
€19 net foreign
earnings of
exports
€48 net foreign
earnings of
exports
Exports of enterprises at purchacers' prices
EU transfers related to exporting industries
Imports exported without further processing
Imports for production of exports
Operating surplus of foreign businesses from exports
Consumption of imported plant etc. in production of exports
€100
€-2 €-2
€100
€0 €16
€-1 €-12
€-58 €-38
€-20 €-15
The Economic and Societal Importance of the Irish Suckler Beef Sector 27
2.8 Estimating the Total Value of the Beef Sector
Beef exports, including product and live exports, are valued in excess of €2.6 billion, and it is
estimated that approximately 50,000 tonnes of Irish beef is consumed in Ireland. Based on the
value secured for exported beef, it is estimated that domestic consumption of Irish beef is
worth €230 million. This puts the overall output value of the Irish beef sector at €2.83 billion.
2.9 Conclusions
The beef sector in Ireland is a considerable one, accounting for over a third of all agricultural
output and for over 20 percent of Irish food and drink exports. The agri-food sector in general
accounts for 9 percent of total employment in Ireland and supports employment in a number
of ancillary sectors, with over 13,000 employed in the meat processing sector. Beef exports
are worth over €2.5 billion and are on the increase, with the recent opening of the Chinese
and American markets for Irish beef.
The large beef sector is supported by over 1 million suckler cows. The suckler cow herd is
scattered throughout the country but particularly dominates in the West. Over 80 percent
of cows in the west are suckler cows, and over 90 percent in some counties, demonstrating
the important regional presence of this sector.
There are 77,738 specialised beef farms in Ireland. The economic situation on these farms is
challenging. On average, costs of production exceed output prices, and the reliance on direct
payments is high. Without a substantial increase in beef prices and/or significant improvement
in efficiency levels, the vast majority of cattle farms will continue to rely on direct payments.
Despite the poor economic situation, cattle farms make a considerable contribution to the
local economy. It is estimated that cattle farms spend almost €1.5 billion annually on agri-
inputs.
The Economic and Societal Importance of the Irish Suckler Beef Sector 28
Chapter 3: Policy Developments and Challenges Facing the
Irish Beef Sector
3.1 Introduction
There are a number of challenges and policy developments looming in the short and medium
term for the agri-food sector in general and the beef sector in particular. The following
chapter examined some of these issues and discusses implications for the beef sector.
3.2 Climate Change Policy
Feeding the world’s growing population while also trying to limit the impact of agriculture on
climate change is one of the greatest challenges facing modern society. Ireland has signed up
to a number of agreements that aim to reduce greenhouse gas emissions. Under the EU Effort
Sharing Decision (Decision No 406/2009/EC), Ireland was given a legally binding target to
reduce non-ETS (emission trading scheme) greenhouse gas emissions to 20 percent below
the 2005 level by 2020. However, estimates by the EPA (2017) suggest that the country is
likely to achieve only a 4 to 6 percent reduction by 2020, and that Ireland will be financially
penalised for not meeting these targets. In the longer term, Ireland is committed to reducing
greenhouse gas emissions further.
Almost one third of greenhouse gas emissions generated in Ireland comes from the
agricultural sector. Ireland is relatively unusual in this regard as on average the agricultural
sector accounts for 10 percent of emissions across the EU28. The Irish position reflects the
fact that the agricultural sector is large relative to other sectors, and is dominated by livestock
which is more emissions-intensive than crops. Furthermore, the animal population is large
relative to the human population, making emissions from the transport and residential sectors
relatively smaller.
With agriculture being such a large emitter of greenhouse gas emissions, it is clear that the
sector will have to become a part of Ireland’s efforts to tackle climate change. Enteric
fermentation by cows is one of the principal sources of greenhouse gas emissions, and as such,
greenhouse gas emissions per animal or per food product are coming under scrutiny. Due to
the high levels of methane emitted by cows, animal-based food products are relatively carbon-
intensive.
Government policy currently aims at improving the carbon footprint of beef production
through programmes such as the Beef Data Genomics Programme. Such programmes have
been relatively successful, and by international standards the carbon footprint of beef
production in Ireland is quite low, rated the fifth lowest in Europe in 2010 (Leip et al., 2010).
These programmes and the carbon performance of the beef sector are discussed in more
detail in Chapter 6. Despite relatively low carbon footprint in Ireland, the absolute level of
greenhouse gas emissions remains a problem, especially with the dairy sector in expansion
mode and dairy cow numbers and their progeny continuing to grow, and further policy
The Economic and Societal Importance of the Irish Suckler Beef Sector 29
options are likely to be considered in the near future. Debate continues on how best to tackle
this issue in a way that allows Ireland to meet its environmental commitments and gives the
agri-food sector and rural Ireland the opportunity to prosper.
3.3 Brexit
On 23 June 2016 the majority of the British voters supported Britain’s withdrawal from the
European Union. Negotiations on exactly how this exit will occur commenced on 29 March
2017 when the UK triggered Article 50 of the Treaty on European Union issuing notice to
withdraw from the Union. Negotiations on Phase 1 concluded in December 2017. This Phase
considered the financial terms of the withdrawal, the rights of EU citizens living in the EU, and
the border between Ireland and Northern Ireland. At the time of writing, negotiations on
Phase 2 are underway; this Phase covers the arrangements for transition towards the UK's
withdrawal, together with a framework for the future UK/EU relationship. A transition period up to December 2020 has been agreed between the UK and EU, during which time the UK
will remain part of the single market and customs union. The UK will be free to negotiate
new trade deals during this period, but such deals will not come into effect until 2021 at the
earliest.
The degree to which the UK will develop new trade deals and deviate from the existing single
market arrangements will determine the magnitude of the impact of Brexit on the Irish beef
sector. The final agreement will fall somewhere along the spectrum of the Soft to Hard Brexit.
The Copenhagen Economics Group in their 2016 report analysed four long-term scenarios
which effectively encompass the best to worst case scenarios. The two extreme scenarios
are:
European Economic Area (EEA) scenario: trade arrangements similar to those
between the EU and Norway and Iceland, including duty-free trade on most products,
with tariffs on some sensitive products such as food. Even under this scenario border
inspections on EU-UK trade will add customs costs, but the risk of regulatory
divergence for both goods and services is low.
World Trade Organisation (WTO) Scenario: trade governed by WTO rules, whereby the UK and the EU will impose Most Favoured Nation (MFN) tariffs on each
other’s goods where these are not bound by existing plurilateral agreements or
arrangements. In addition, the EU and the UK will continue to use tariff rate quotas
both between them and with third countries.
The Copenhagen Economics report concludes that Brexit will have negative economic
implications for the Irish economy in all scenarios analysed. Even in the best case (EEA)
scenario, Irish GDP contracts by 2.8 percent and exports by 3.3 percent, while in the worst
case (WTO) scenario Irish GDP contracts by 7 percent and exports by 7.7 percent.
The Irish agri-food sector is particularly vulnerable to a Hard Brexit because of the volume of
trade between Ireland and the UK, the very high WTO MFN tariffs that apply to food
The Economic and Societal Importance of the Irish Suckler Beef Sector 30
products, and the reliance of the sector on direct payment support which is funded from the
EU budget. In 2017, Ireland exported €4.5 billion of food products to the UK, comprising
approximately 35 percent of all food exports in 2017. This was a slight reduction on previous
years due to growth in other markets and due to currency movements reducing the value of
exports to the UK. Almost 51 percent of beef exports went to the British market in 2017,
making this sector particularly vulnerable to a change in trade agreements under a Hard Brexit
scenario. The sector is also vulnerable to a contraction of the EU budget. The UK is a net
contributor to the EU budget and it is estimated by Matthews (2018) that the UK’s withdrawal
from the EU will lead to a 10 percent reduction in the funding available for the Common
Agricultural Policy, assuming that contributions from other Member States do not increase
to bridge the difference.
Analysis conducted by Teagasc (2017d) estimated the impact of price and direct payment
shocks, arising from a Hard Brexit scenario, on farm income in Ireland. The static analysis
used price shock information from Van Berkum et al. (2016) for various agricultural
commodities, and assumed a 10 percent pro rata reduction in the value of direct payments made to farmers. The results show a 36 percent reduction in income levels on cattle-rearing
farms under a Hard Brexit scenario. It should be borne in mind that this reduction comes on
already very low-income levels. The analysis concludes that the percentage of economically
viable cattle-rearing farms would fall from approximately 20 percent in the no-Brexit situation
to about 10 percent under a Hard Brexit scenario. Clearly Brexit represents a major challenge
for the Irish beef sector.
3.4 Common Agricultural Policy (CAP) Reform
On 1 June 2018, the European Commission presented legislative proposals on the future of
food and farming. Given the budgetary pressures arising from Brexit and the demands to
spend more on Union-level defence, security and migration, the announcement included an
indication that the funding for the CAP would reduce by approximately 5 percent. The proposals are centred around 9 objectives: fair incomes for farmers, increased competiveness,
realanced power in the food chain, climate change action, environmental care, landscape and
biodiversity preservation, generational renewal, vibrant rural areas and food and health quality
protection.
The proposal aims for better targeted support by:
reducing direct payments to farmers in excess of €60,000 and capping for payments
above €100,000 per farm (labour costs will be taken fully into account)
providing a higher level of support per hectare for small and medium-sized farms
allocating a minimum of 2 percent of direct support payments for young farmers, these
can include an increased ‘installation allowance’ of up to €100,000
ensuring that only genuine farmers receive support
The Economic and Societal Importance of the Irish Suckler Beef Sector 31
The proposal aims for improved environmental outcomes by:
preserving carbon-rich soils through protection of wetlands and peatlands,
introducing obligatory nutrient management tools to improve water quality, reduce ammonia and nitrous oxide levels, and
crop rotation instead of crop diversification.
Direct payments will be conditional on enhanced environmental and climate requirements.
Furthermore, farmers will have the possibility to contribute further and be rewarded for going
beyond mandatory requirements. EU countries will develop voluntary eco-schemes to
support and incentivise farmers to observe agricultural practices beneficial for the climate and
the environment. Member states will also have the option to transfer up to 15 percent of their CAP allocations between direct payments (Pillar 1) and rural development (Pillar II) –
and in either direction – to “ensure that their priorities and measures can be funded”.
A 5 percent reduction in the CAP budget will translate into lower direct payments. The
magnitude of the reduction in direct payments is difficult to estimate at this stage, as it will
depend on (i) how the overall reduction in the budget will be allocated at a Member State
level, (ii) what is clawed back from recipients of large payments and (iii) the allocation between
Pillar 1 and II. In any case, it is most possible that payments to suckler farmers in Ireland will
decline, and this will have a direct negative impact on farm incomes.
On a positive note, recent research conducted by the European Commission suggests that
there is broad and strong support for retaining and expanding the CAP. A Eurobarometer
study conducted in December 2017 examined the attitudes of over 28,000 EU citizens, 1,000
of which were Irish, to agriculture and the Common Agricultural Policy. More than 90 percent
of EU citizens think that agriculture and rural areas are important to the future of Europe,
with 53 percent saying very important. The sentiment is even stronger in Ireland, with 57
percent stating that agriculture and rural areas are very important. A majority of respondents
believed that agriculture and food policy was best managed at a European level rather than
national level. Furthermore, 61 percent of EU citizens and 64 percent of Irish citizens strongly
agreed that the CAP benefits all citizens and not only farmers. Only 10 percent of Irish citizens
disagreed with this statement. In relation to the financial support provided to farmers, survey
participants were given information about the aggregate size of the budget for the CAP and
were asked if they felt it was appropriate. In response, 44 percent of EU and 43 percent of
Irish citizens felt that support to farmers should increase, nd only 8 percent of Irish citizens
felt that support to farmers should decrease. When questioned about the role of farmers,
participants replied that in their opinion producing high-quality, safe food and ensuring the
welfare of animals were the two most important functions of farmers.
3.5 Mercosur
At the time of writing, the EU and the Mercosur (Argentina, Brazil, Paraguay, Uruguay and
Venezuela) countries are engaged in trade negotiations. Together, these Mercosur countries
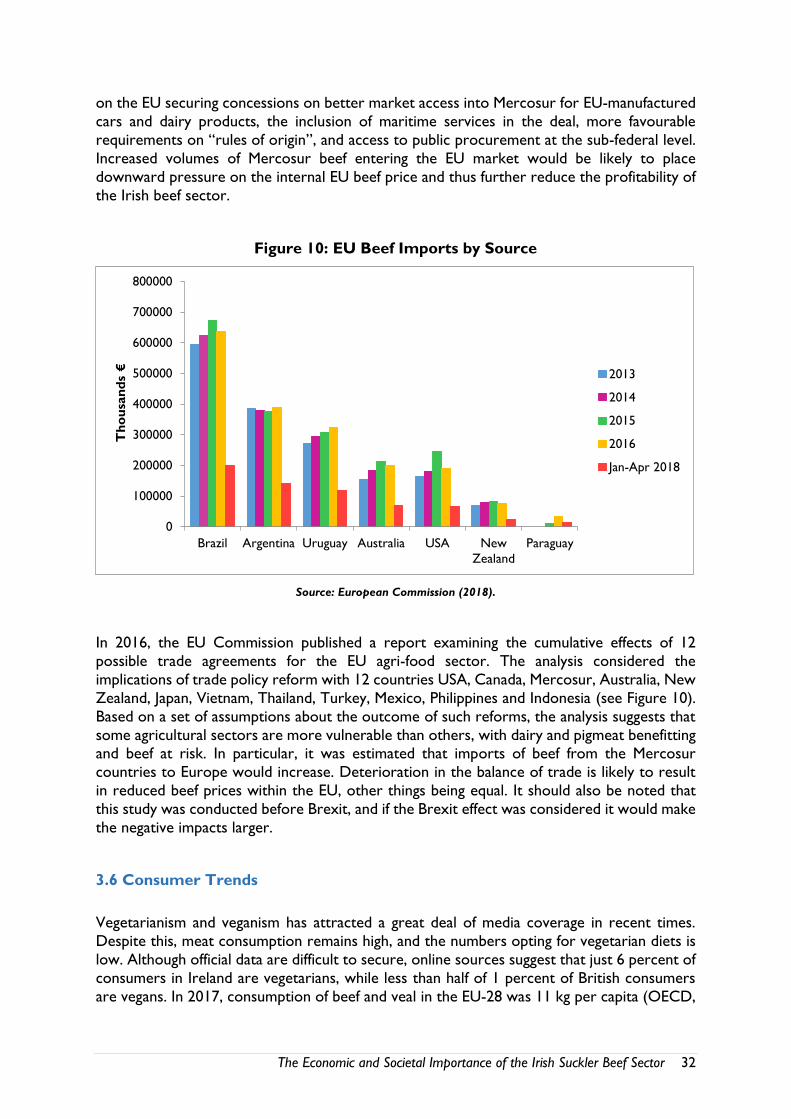
represent the world’s seventh largest economy. It seems that the EU is prepared to offer an increase in market access for Mercosur beef to the European market, but this is contingent
The Economic and Societal Importance of the Irish Suckler Beef Sector 32
on the EU securing concessions on better market access into Mercosur for EU-manufactured
cars and dairy products, the inclusion of maritime services in the deal, more favourable
requirements on “rules of origin”, and access to public procurement at the sub-federal level.
Increased volumes of Mercosur beef entering the EU market would be likely to place
downward pressure on the internal EU beef price and thus further reduce the profitability of
the Irish beef sector.
Figure 10: EU Beef Imports by Source
Source: European Commission (2018).
In 2016, the EU Commission published a report examining the cumulative effects of 12
possible trade agreements for the EU agri-food sector. The analysis considered the
implications of trade policy reform with 12 countries USA, Canada, Mercosur, Australia, New
Zealand, Japan, Vietnam, Thailand, Turkey, Mexico, Philippines and Indonesia (see Figure 10).
Based on a set of assumptions about the outcome of such reforms, the analysis suggests that
some agricultural sectors are more vulnerable than others, with dairy and pigmeat benefitting and beef at risk. In particular, it was estimated that imports of beef from the Mercosur
countries to Europe would increase. Deterioration in the balance of trade is likely to result
in reduced beef prices within the EU, other things being equal. It should also be noted that
this study was conducted before Brexit, and if the Brexit effect was considered it would make
the negative impacts larger.
3.6 Consumer Trends
Vegetarianism and veganism has attracted a great deal of media coverage in recent times.
Despite this, meat consumption remains high, and the numbers opting for vegetarian diets is
low. Although official data are difficult to secure, online sources suggest that just 6 percent of
consumers in Ireland are vegetarians, while less than half of 1 percent of British consumers
are vegans. In 2017, consumption of beef and veal in the EU-28 was 11 kg per capita (OECD,
0
100000
200000
300000
400000
500000
600000
700000
800000
Brazil Argentina Uruguay Australia USA New
Zealand
Paraguay
Th
ou
san
ds
€
2013
2014
2015
2016
Jan-Apr 2018
The Economic and Societal Importance of the Irish Suckler Beef Sector 33
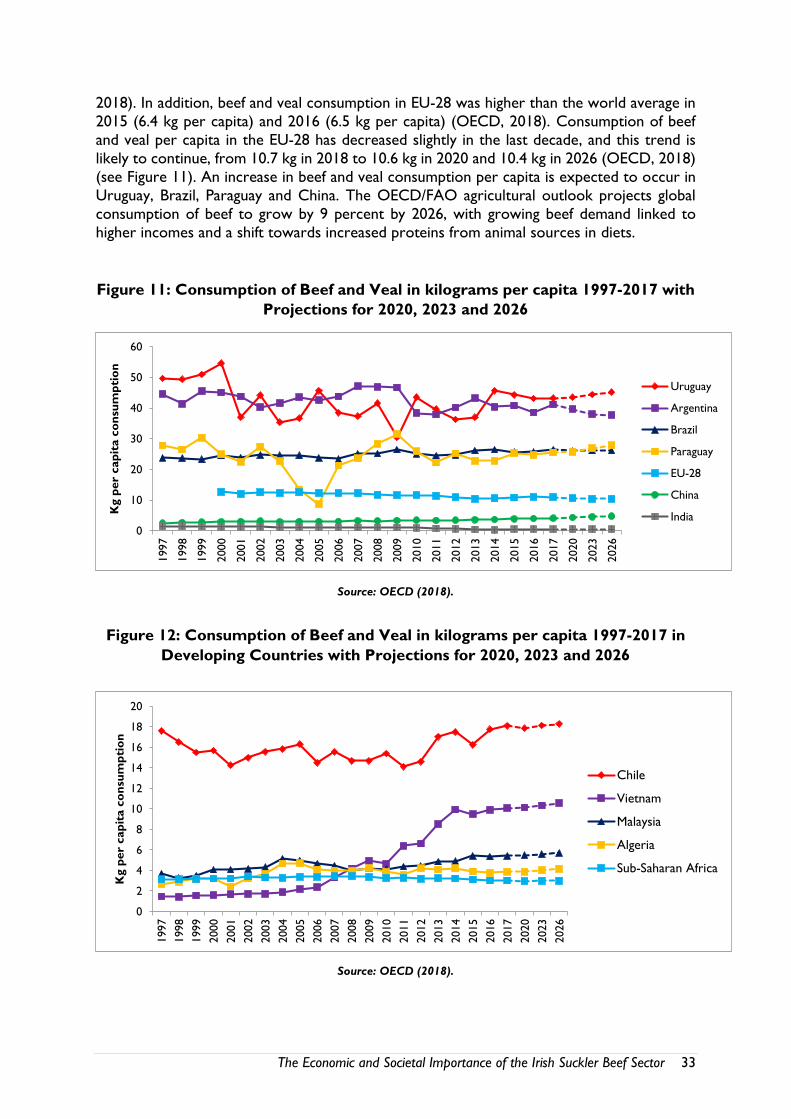
2018). In addition, beef and veal consumption in EU-28 was higher than the world average in
2015 (6.4 kg per capita) and 2016 (6.5 kg per capita) (OECD, 2018). Consumption of beef
and veal per capita in the EU-28 has decreased slightly in the last decade, and this trend is
likely to continue, from 10.7 kg in 2018 to 10.6 kg in 2020 and 10.4 kg in 2026 (OECD, 2018)
(see Figure 11). An increase in beef and veal consumption per capita is expected to occur in
Uruguay, Brazil, Paraguay and China. The OECD/FAO agricultural outlook projects global
consumption of beef to grow by 9 percent by 2026, with growing beef demand linked to
higher incomes and a shift towards increased proteins from animal sources in diets.
Figure 11: Consumption of Beef and Veal in kilograms per capita 1997-2017 with
Projections for 2020, 2023 and 2026
Source: OECD (2018).
Figure 12: Consumption of Beef and Veal in kilograms per capita 1997-2017 in
Developing Countries with Projections for 2020, 2023 and 2026
Source: OECD (2018).
0
10
20
30
40
50
60
1997
1998
1999
2000
2001
2002
2003
2004
2005
2006
2007
2008
2009
2010
2011
2012
2013
2014
2015
2016
2017
2020
2023
2026
Kg
per
cap
ita c
on
sum
pti
on
Uruguay
Argentina
Brazil
Paraguay
EU-28
China
India
0
2
4
6
8
10
12
14
16
18
20
1997
1998
1999
2000
2001
2002
2003
2004
2005
2006
2007
2008
2009
2010
2011
2012
2013
2014
2015
2016
2017
2020
2023
2026
Kg p
er
cap
ita c
on
sum
pti
on
Chile
Vietnam
Malaysia
Algeria
Sub-Saharan Africa
The Economic and Societal Importance of the Irish Suckler Beef Sector 34
Despite this expected slight decline in beef and veal consumption in the EU-28, a growth in
beef and veal consumption is projected for developing countries, where consumption has
fluctuated over the past 20 years but is expected to increase steadily between 2020 and 2026
(OECD, 2018) (see Figure 12). Middle-class world population is projected to grow from
3.2bn in 2017 to 5.2bn in 2030 and spending on meat and poultry consumption to rise from
$35 trillion in 2017 to $51 trillion by 2030 according to Bord Bia. For example, Chile already
has higher beef and veal consumption per capita compared to EU-28 (in 2017, 18 kg and 11
kg respectively) and the demand for beef and veal is likely to increase. Vietnam has
experienced spikes in consumption since 2013, and in 2026 beef and veal consumption per
capita will surpass the levels in the EU (OECD, 2018). Growing beef markets in third countries
present significant opportunities for the Irish beef sector, especially in the context of the
mature nature of the EU market and potential issues in the British market following Brexit.
3.7 Conclusions
There are a number of issues looming that may impact negatively or positively on the future
development of the beef sector in Ireland. The future evolution of climate change policy is a
major unknown on the horizon. Decisions that the Irish government must make in order to
ensure compliance with international agreements may impact negatively on the future
sustainability of the sector. Brexit is another major threat to the beef sector - the significant
reliance of the beef sector on the UK market makes it more vulnerable to changes in trade
policy. The ultimate impact of Brexit is as yet unknown until there is certainty about future UK/EU trade policy. On the positive side, a number of international markets have recently
opened for Irish beef and the outlook for beef consumption globally is positive.
The Economic and Societal Importance of the Irish Suckler Beef Sector 35
Chapter 4: Wider Economic Impacts of the Beef Sector in
Ireland
4.1 Introduction
This chapter considers the wider economic impact of the beef sector. It begins by providing
some context of the importance of the agricultural sector to the wider Irish economy. It then
presents a series of multipliers to identify the impact of the sector on the Irish economy.
Specifically, it is used to consider the impact of an expansion or contraction in the output of
the agricultural sector, and beef in particular, on the output of the wider economy and on
employment at both national and regional levels.
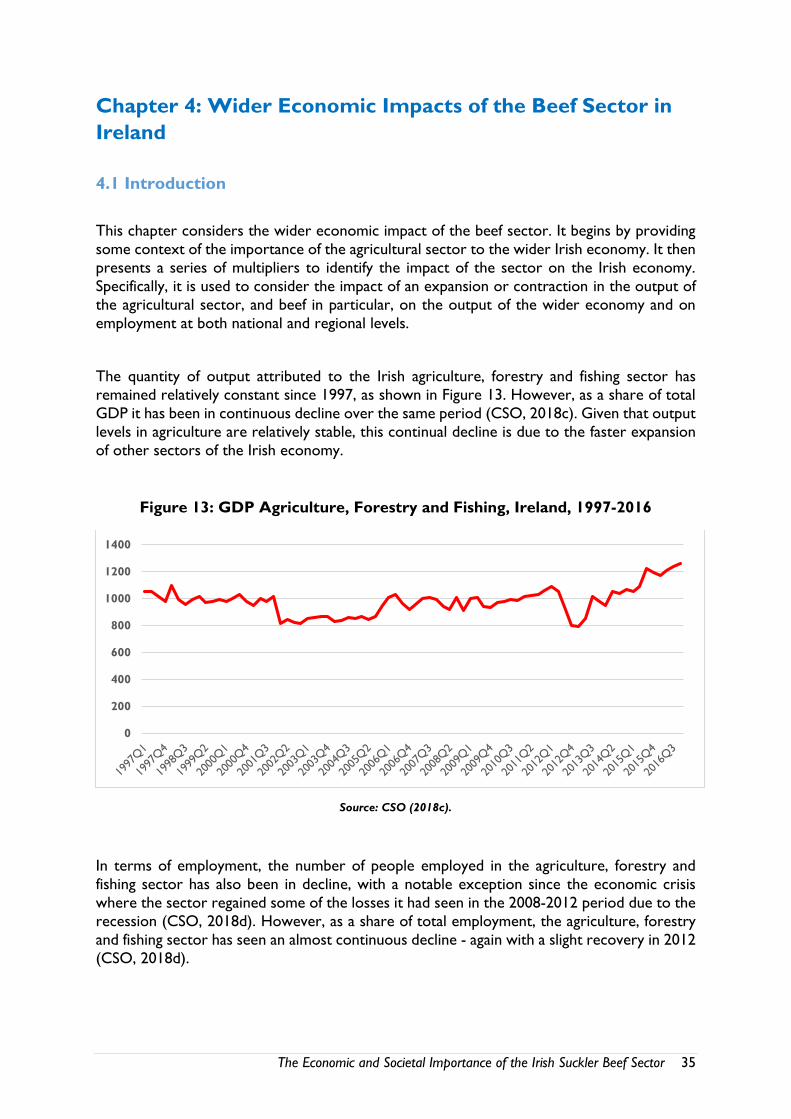
The quantity of output attributed to the Irish agriculture, forestry and fishing sector has
remained relatively constant since 1997, as shown in Figure 13. However, as a share of total
GDP it has been in continuous decline over the same period (CSO, 2018c). Given that output
levels in agriculture are relatively stable, this continual decline is due to the faster expansion
of other sectors of the Irish economy.
Figure 13: GDP Agriculture, Forestry and Fishing, Ireland, 1997-2016
Source: CSO (2018c).
In terms of employment, the number of people employed in the agriculture, forestry and
fishing sector has also been in decline, with a notable exception since the economic crisis
where the sector regained some of the losses it had seen in the 2008-2012 period due to the
recession (CSO, 2018d). However, as a share of total employment, the agriculture, forestry
and fishing sector has seen an almost continuous decline - again with a slight recovery in 2012
(CSO, 2018d).
0
200
400
600
800
1000
1200
1400
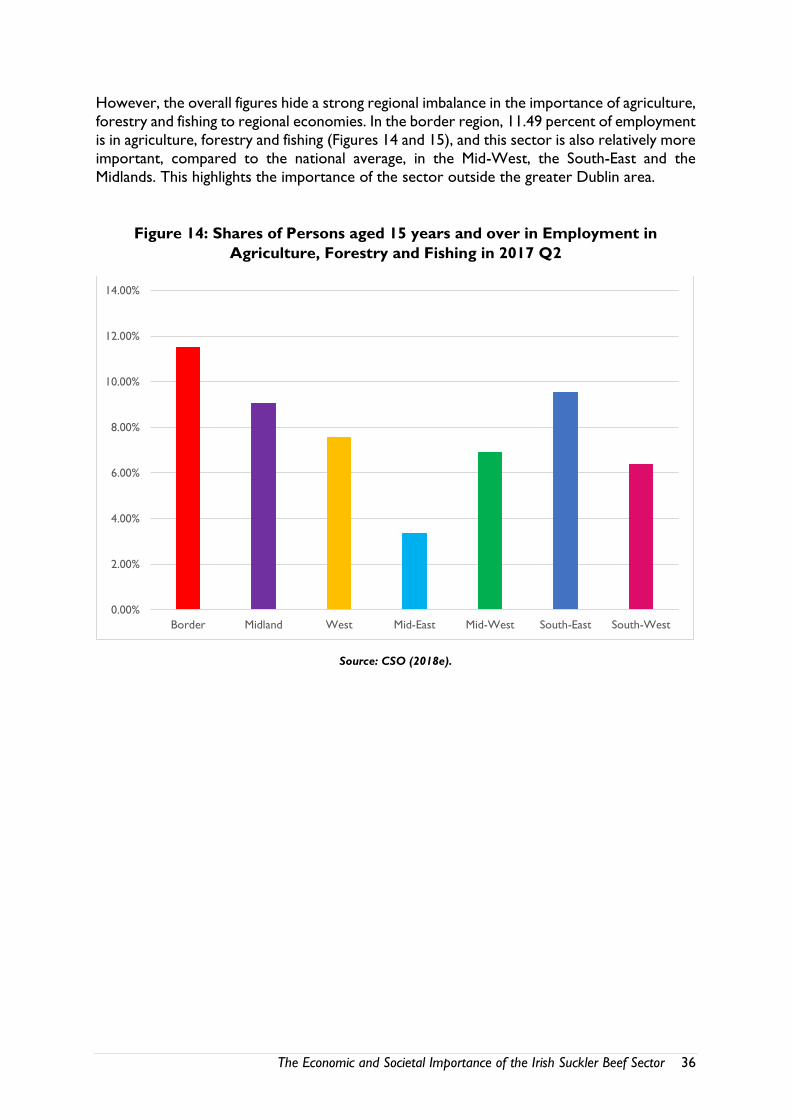
The Economic and Societal Importance of the Irish Suckler Beef Sector 36
However, the overall figures hide a strong regional imbalance in the importance of agriculture,
forestry and fishing to regional economies. In the border region, 11.49 percent of employment
is in agriculture, forestry and fishing (Figures 14 and 15), and this sector is also relatively more
important, compared to the national average, in the Mid-West, the South-East and the
Midlands. This highlights the importance of the sector outside the greater Dublin area.
Figure 14: Shares of Persons aged 15 years and over in Employment in
Agriculture, Forestry and Fishing in 2017 Q2
Source: CSO (2018e).
0.00%
2.00%
4.00%
6.00%
8.00%
10.00%
12.00%
14.00%
Border Midland West Mid-East Mid-West South-East South-West
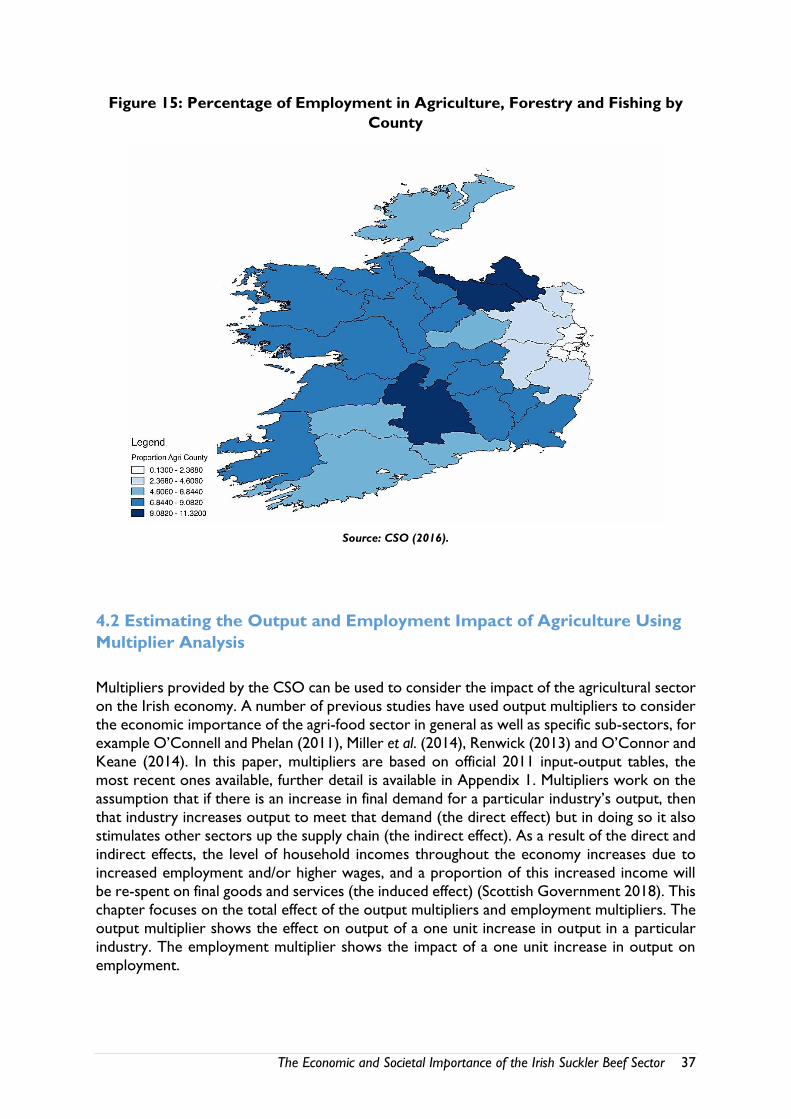
The Economic and Societal Importance of the Irish Suckler Beef Sector 37
Figure 15: Percentage of Employment in Agriculture, Forestry and Fishing by
County
Source: CSO (2016).
4.2 Estimating the Output and Employment Impact of Agriculture Using
Multiplier Analysis
Multipliers provided by the CSO can be used to consider the impact of the agricultural sector
on the Irish economy. A number of previous studies have used output multipliers to consider
the economic importance of the agri-food sector in general as well as specific sub-sectors, for
example O’Connell and Phelan (2011), Miller et al. (2014), Renwick (2013) and O’Connor and
Keane (2014). In this paper, multipliers are based on official 2011 input-output tables, the
most recent ones available, further detail is available in Appendix 1. Multipliers work on the
assumption that if there is an increase in final demand for a particular industry’s output, then
that industry increases output to meet that demand (the direct effect) but in doing so it also
stimulates other sectors up the supply chain (the indirect effect). As a result of the direct and
indirect effects, the level of household incomes throughout the economy increases due to
increased employment and/or higher wages, and a proportion of this increased income will
be re-spent on final goods and services (the induced effect) (Scottish Government 2018). This
chapter focuses on the total effect of the output multipliers and employment multipliers. The
output multiplier shows the effect on output of a one unit increase in output in a particular
industry. The employment multiplier shows the impact of a one unit increase in output on
employment.
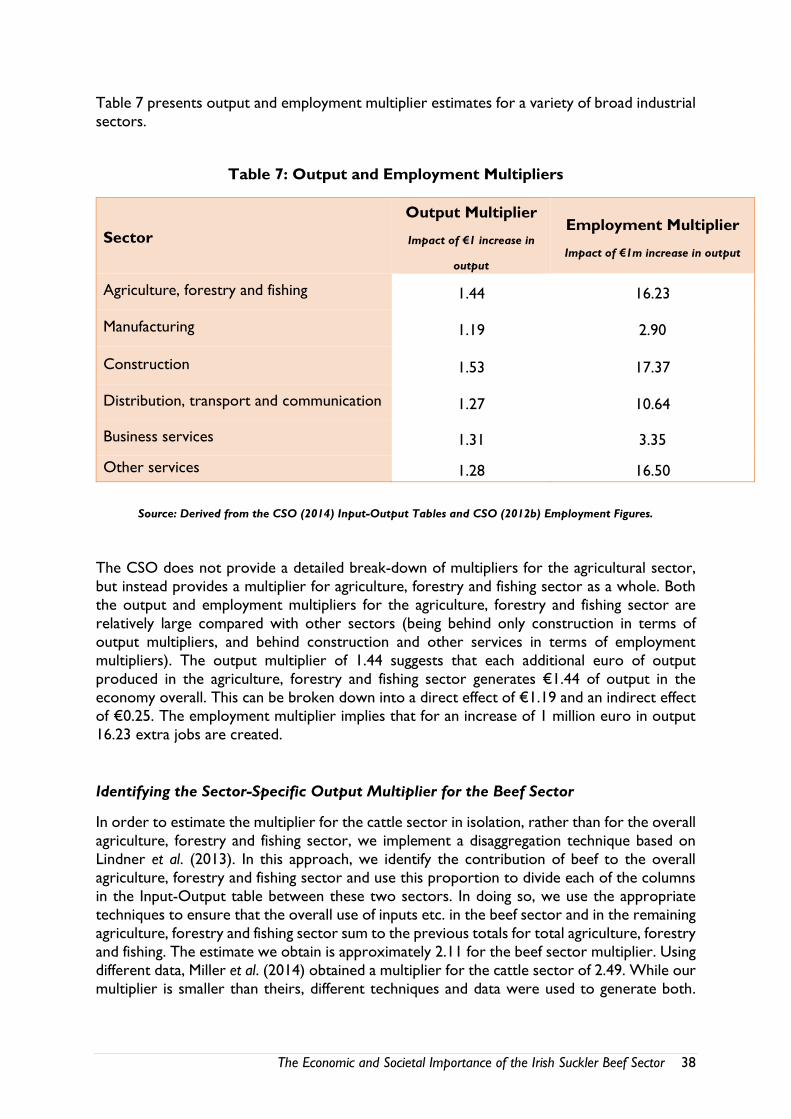
The Economic and Societal Importance of the Irish Suckler Beef Sector 38
Table 7 presents output and employment multiplier estimates for a variety of broad industrial
sectors.
Table 7: Output and Employment Multipliers
Sector
Output Multiplier
Impact of €1 increase in
output
Employment Multiplier
Impact of €1m increase in output
Agriculture, forestry and fishing 1.44 16.23
Manufacturing 1.19 2.90
Construction 1.53 17.37
Distribution, transport and communication 1.27 10.64
Business services 1.31 3.35
Other services 1.28 16.50
Source: Derived from the CSO (2014) Input-Output Tables and CSO (2012b) Employment Figures.
The CSO does not provide a detailed break-down of multipliers for the agricultural sector,
but instead provides a multiplier for agriculture, forestry and fishing sector as a whole. Both
the output and employment multipliers for the agriculture, forestry and fishing sector are
relatively large compared with other sectors (being behind only construction in terms of
output multipliers, and behind construction and other services in terms of employment
multipliers). The output multiplier of 1.44 suggests that each additional euro of output
produced in the agriculture, forestry and fishing sector generates €1.44 of output in the
economy overall. This can be broken down into a direct effect of €1.19 and an indirect effect
of €0.25. The employment multiplier implies that for an increase of 1 million euro in output
16.23 extra jobs are created.
Identifying the Sector-Specific Output Multiplier for the Beef Sector
In order to estimate the multiplier for the cattle sector in isolation, rather than for the overall
agriculture, forestry and fishing sector, we implement a disaggregation technique based on
Lindner et al. (2013). In this approach, we identify the contribution of beef to the overall
agriculture, forestry and fishing sector and use this proportion to divide each of the columns
in the Input-Output table between these two sectors. In doing so, we use the appropriate
techniques to ensure that the overall use of inputs etc. in the beef sector and in the remaining
agriculture, forestry and fishing sector sum to the previous totals for total agriculture, forestry
and fishing. The estimate we obtain is approximately 2.11 for the beef sector multiplier. Using
different data, Miller et al. (2014) obtained a multiplier for the cattle sector of 2.49. While our
multiplier is smaller than theirs, different techniques and data were used to generate both.
The Economic and Societal Importance of the Irish Suckler Beef Sector 39
This suggests that a one euro change in output in the beef sector will have (based on our
figures) approximately a €2.11 impact on the economy.
In his 2013 study Renwick states that each €1 of support in direct payments to cattle farms
underpins €4.28 of aggregate output in the Irish economy. He arrives at this estimate by
applying his estimated output multiplier to beef output arriving at an aggregate output figure
of €5.18 billion in 2012 and dividing this by €1.21 billion of direct payments which includes
the total SPS payments plus a share of other payments made in 2012. Using a similar approach,
the equivalent output figure based on the analysis here is €4.98 billion, based on a beef sector
output of €2.361 billion and a multiplier of 2.11, suggesting each euro of direct payments still
underpins in excess of €4 of aggregate output in the Irish economy.
4.3 Estimating the Output and Employment Impact of Agriculture,
Forestry and Fishing on a Regional Basis Using Multiplier Analysis
Given the uneven regional distribution of agricultural employment across regions, as
emphasised in Figure 14, it is worth considering regional output and employment multipliers
to assess whether the importance of the sector varies spatially in stimulating local regions.
However, no spatially disaggregated multipliers are produced by the CSO. A number of
authors have generated spatially disaggregated multipliers but these have been at a very
aggregated spatial level (McFeely, 2011). Here we create regional multipliers for agriculture, forestry and fishing sector for Ireland at the NUTS3 level of regional disaggregation. The
method used is that of the simple location quotient. The technical appendix provides an
overview of how this process was completed. Table 8 presents the regional agriculture,
forestry and fishing multipliers for Ireland. Again both output and employment multipliers are
generated.
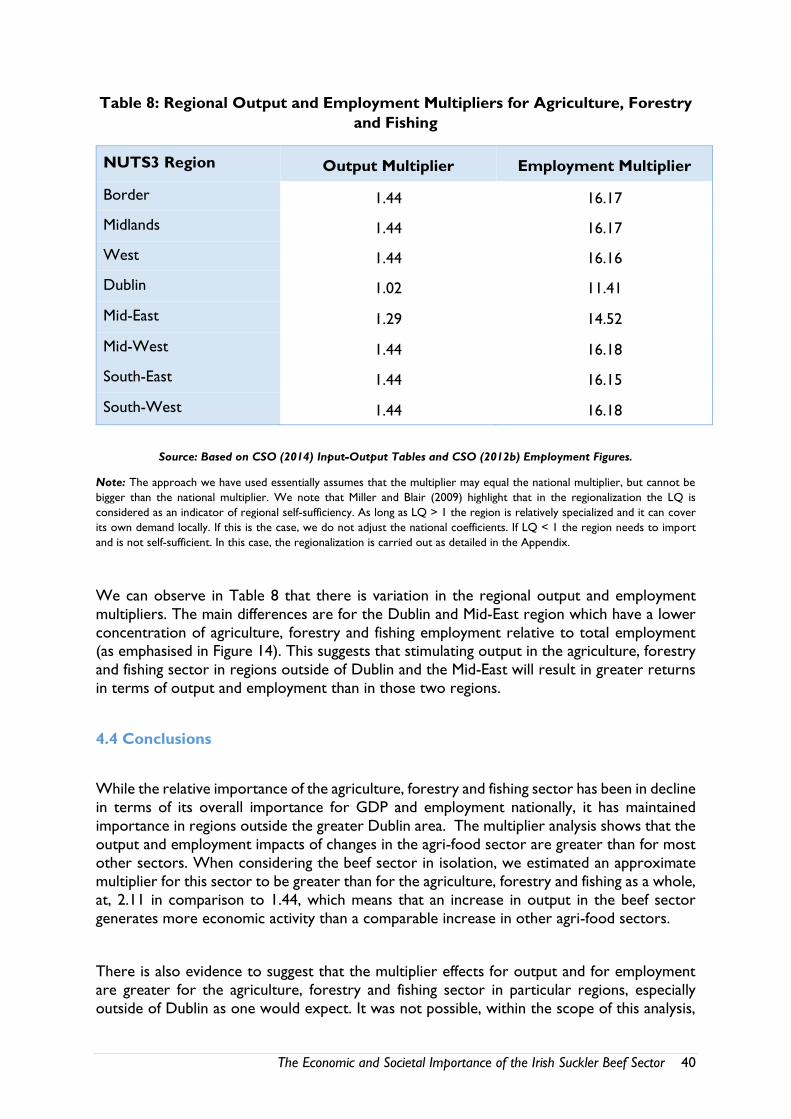
The Economic and Societal Importance of the Irish Suckler Beef Sector 40
Table 8: Regional Output and Employment Multipliers for Agriculture, Forestry
and Fishing
NUTS3 Region Output Multiplier Employment Multiplier
Border 1.44 16.17
Midlands 1.44 16.17
West 1.44 16.16
Dublin 1.02 11.41
Mid-East 1.29 14.52
Mid-West 1.44 16.18
South-East 1.44 16.15
South-West 1.44 16.18
Source: Based on CSO (2014) Input-Output Tables and CSO (2012b) Employment Figures.
Note: The approach we have used essentially assumes that the multiplier may equal the national multiplier, but cannot be
bigger than the national multiplier. We note that Miller and Blair (2009) highlight that in the regionalization the LQ is
considered as an indicator of regional self-sufficiency. As long as LQ > 1 the region is relatively specialized and it can cover
its own demand locally. If this is the case, we do not adjust the national coefficients. If LQ < 1 the region needs to import
and is not self-sufficient. In this case, the regionalization is carried out as detailed in the Appendix.
We can observe in Table 8 that there is variation in the regional output and employment
multipliers. The main differences are for the Dublin and Mid-East region which have a lower
concentration of agriculture, forestry and fishing employment relative to total employment (as emphasised in Figure 14). This suggests that stimulating output in the agriculture, forestry
and fishing sector in regions outside of Dublin and the Mid-East will result in greater returns
in terms of output and employment than in those two regions.
4.4 Conclusions
While the relative importance of the agriculture, forestry and fishing sector has been in decline
in terms of its overall importance for GDP and employment nationally, it has maintained
importance in regions outside the greater Dublin area. The multiplier analysis shows that the
output and employment impacts of changes in the agri-food sector are greater than for most
other sectors. When considering the beef sector in isolation, we estimated an approximate
multiplier for this sector to be greater than for the agriculture, forestry and fishing as a whole,
at, 2.11 in comparison to 1.44, which means that an increase in output in the beef sector
generates more economic activity than a comparable increase in other agri-food sectors.
There is also evidence to suggest that the multiplier effects for output and for employment
are greater for the agriculture, forestry and fishing sector in particular regions, especially
outside of Dublin as one would expect. It was not possible, within the scope of this analysis,
The Economic and Societal Importance of the Irish Suckler Beef Sector 41
to disaggregate the regional sector multipliers into subsectoral ones in order to show the
regional impact of changes in the cattle sector. However, one would expect that the beef
multiplier for the regions would also be greater than general sector multiplier.
The Economic and Societal Importance of the Irish Suckler Beef Sector 42
Chapter 5: Societal Impact of the Beef Sector in Ireland
5.1 Introduction
The economic contribution of the beef sector is evident from the analyses presented in
previous chapters. This is especially so in the marginal areas in Ireland, along the Western
seaboard and in the Border region, where beef farming is most prevalent and often where
there is little other economic activity. In addition to the important economic contributions
that suckler farming makes to these marginal areas, considerable non-economic benefits are
also generated for wider societal gain. This chapter explores the non-economic impact of the
Irish beef sector. Particular emphasis is paid to the importance of the positive impact that
farmers have on rural society, the public goods emerging from agricultural production, and
how these public goods support rural tourism.
5.2 Presence in Rural Areas and Contribution to a Vibrant Rural Society
It is sometimes quoted anecdotally that there is a suckler farmer in “every parish in Ireland”.
Of course, it is difficult to prove this with verifiable data, but the map in Figure 16 taken from
Thorne et al. (2016) shows the prevalence of non-dairy cattle at an electoral division level
across the country. It is undoubted that the suckler sector is prevalent, and that suckler
farmers are located in almost every electoral division in Ireland.
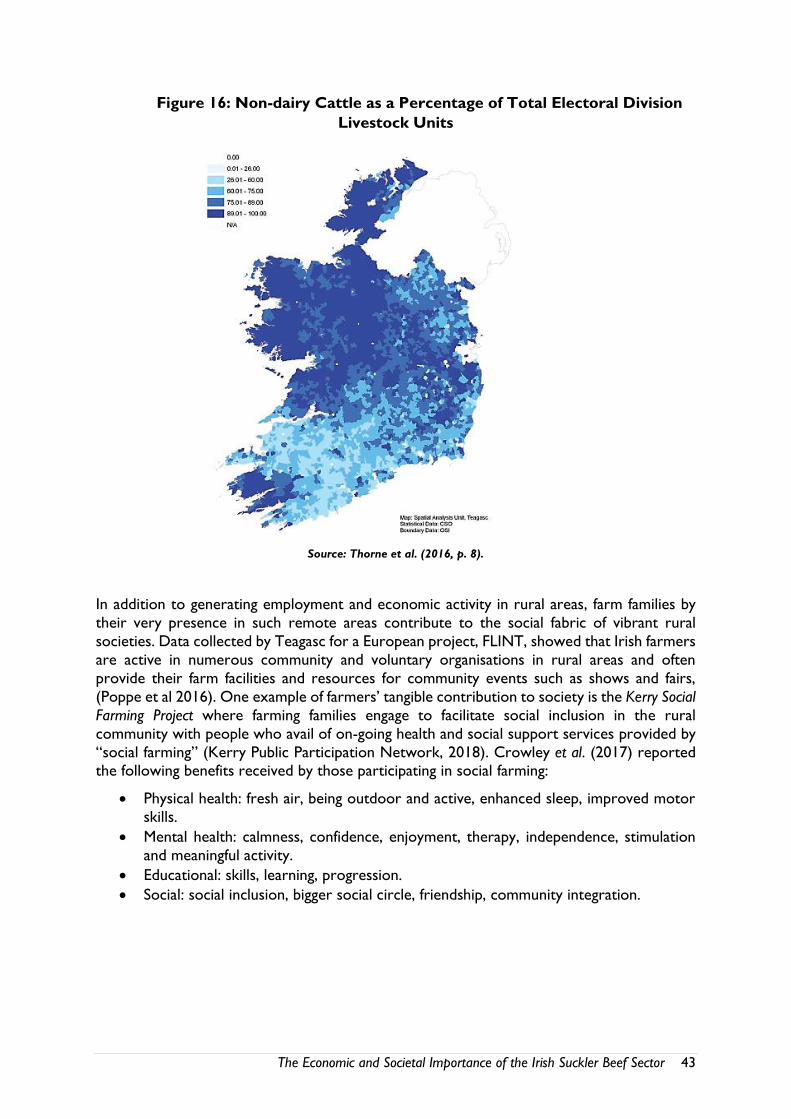
The Economic and Societal Importance of the Irish Suckler Beef Sector 43
Figure 16: Non-dairy Cattle as a Percentage of Total Electoral Division
Livestock Units
Source: Thorne et al. (2016, p. 8).
In addition to generating employment and economic activity in rural areas, farm families by
their very presence in such remote areas contribute to the social fabric of vibrant rural
societies. Data collected by Teagasc for a European project, FLINT, showed that Irish farmers
are active in numerous community and voluntary organisations in rural areas and often
provide their farm facilities and resources for community events such as shows and fairs,
(Poppe et al 2016). One example of farmers’ tangible contribution to society is the Kerry Social
Farming Project where farming families engage to facilitate social inclusion in the rural
community with people who avail of on-going health and social support services provided by
“social farming” (Kerry Public Participation Network, 2018). Crowley et al. (2017) reported the following benefits received by those participating in social farming:
Physical health: fresh air, being outdoor and active, enhanced sleep, improved motor
skills.
Mental health: calmness, confidence, enjoyment, therapy, independence, stimulation
and meaningful activity.
Educational: skills, learning, progression.
Social: social inclusion, bigger social circle, friendship, community integration.
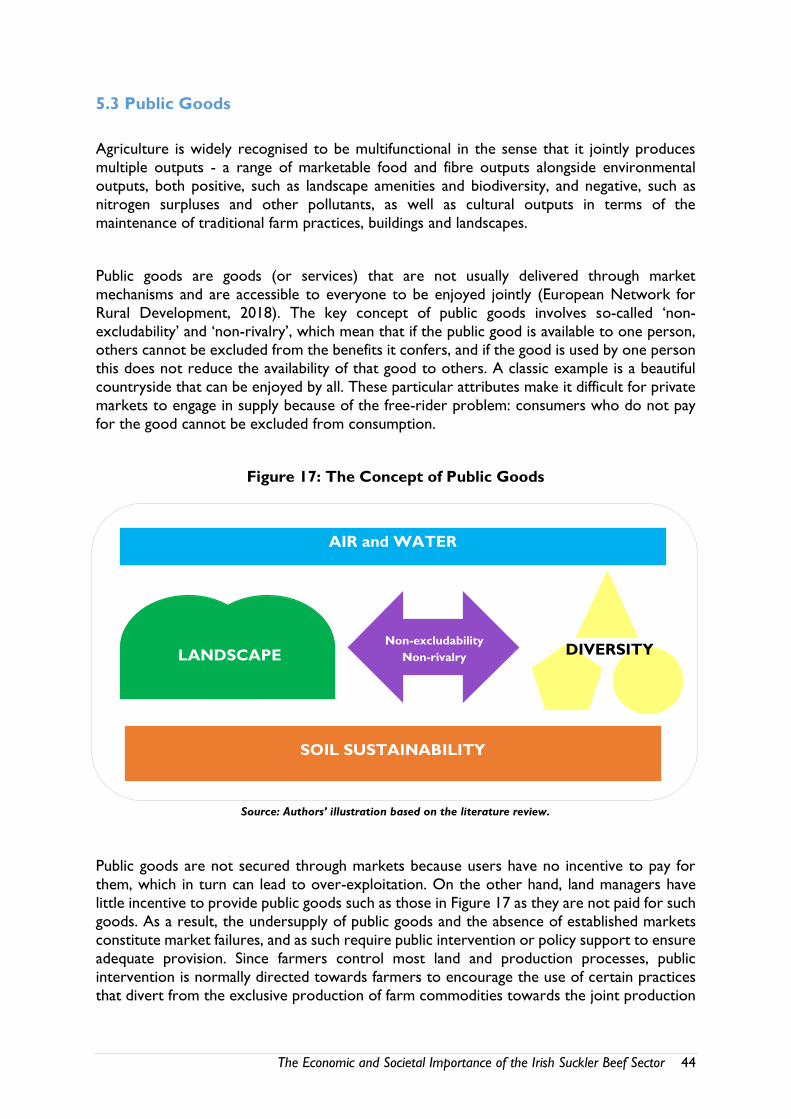
The Economic and Societal Importance of the Irish Suckler Beef Sector 44
5.3 Public Goods
Agriculture is widely recognised to be multifunctional in the sense that it jointly produces
multiple outputs - a range of marketable food and fibre outputs alongside environmental
outputs, both positive, such as landscape amenities and biodiversity, and negative, such as
nitrogen surpluses and other pollutants, as well as cultural outputs in terms of the
maintenance of traditional farm practices, buildings and landscapes.
Public goods are goods (or services) that are not usually delivered through market
mechanisms and are accessible to everyone to be enjoyed jointly (European Network for
Rural Development, 2018). The key concept of public goods involves so-called ‘non-
excludability’ and ‘non-rivalry’, which mean that if the public good is available to one person,
others cannot be excluded from the benefits it confers, and if the good is used by one person
this does not reduce the availability of that good to others. A classic example is a beautiful
countryside that can be enjoyed by all. These particular attributes make it difficult for private
markets to engage in supply because of the free-rider problem: consumers who do not pay
for the good cannot be excluded from consumption.
Figure 17: The Concept of Public Goods
Source: Authors’ illustration based on the literature review.
Public goods are not secured through markets because users have no incentive to pay for
them, which in turn can lead to over-exploitation. On the other hand, land managers have
little incentive to provide public goods such as those in Figure 17 as they are not paid for such
goods. As a result, the undersupply of public goods and the absence of established markets
constitute market failures, and as such require public intervention or policy support to ensure
adequate provision. Since farmers control most land and production processes, public
intervention is normally directed towards farmers to encourage the use of certain practices
that divert from the exclusive production of farm commodities towards the joint production
AIR and WATER
SOIL SUSTAINABILITY
LANDSCAPE DIVERSITY Non-excludability
Non-rivalry
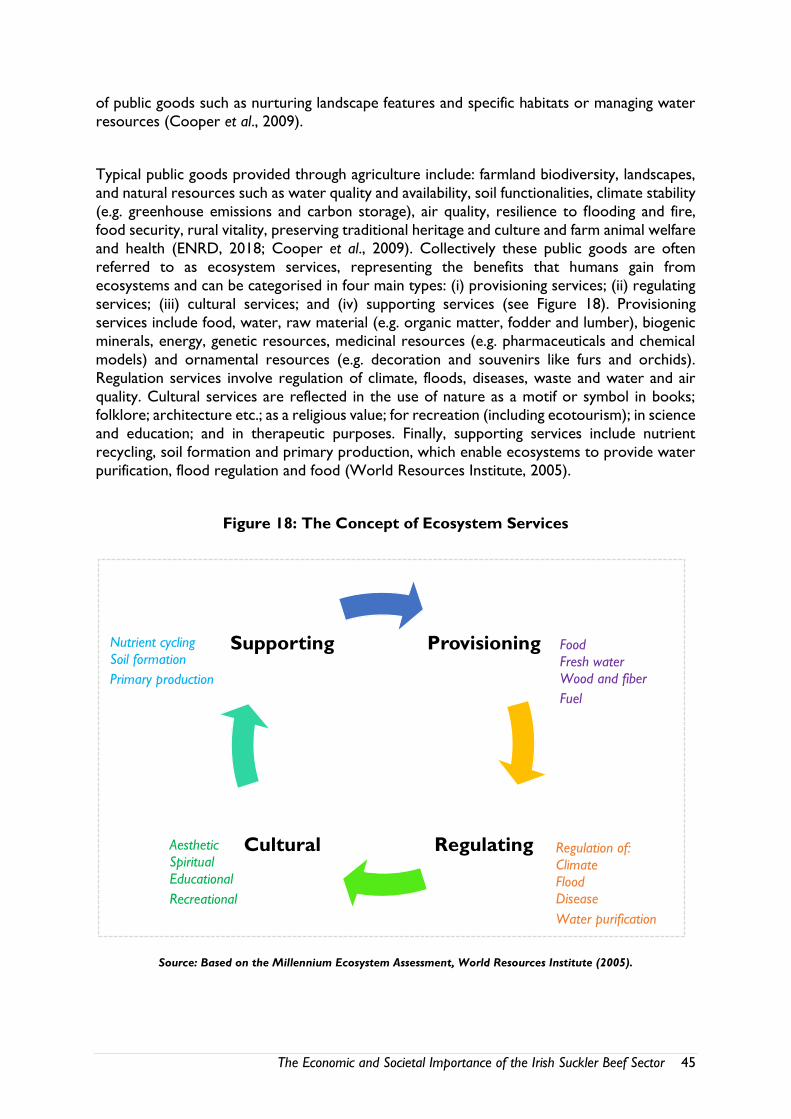
The Economic and Societal Importance of the Irish Suckler Beef Sector 45
of public goods such as nurturing landscape features and specific habitats or managing water
resources (Cooper et al., 2009).
Typical public goods provided through agriculture include: farmland biodiversity, landscapes,
and natural resources such as water quality and availability, soil functionalities, climate stability
(e.g. greenhouse emissions and carbon storage), air quality, resilience to flooding and fire,
food security, rural vitality, preserving traditional heritage and culture and farm animal welfare
and health (ENRD, 2018; Cooper et al., 2009). Collectively these public goods are often
referred to as ecosystem services, representing the benefits that humans gain from
ecosystems and can be categorised in four main types: (i) provisioning services; (ii) regulating
services; (iii) cultural services; and (iv) supporting services (see Figure 18). Provisioning
services include food, water, raw material (e.g. organic matter, fodder and lumber), biogenic
minerals, energy, genetic resources, medicinal resources (e.g. pharmaceuticals and chemical
models) and ornamental resources (e.g. decoration and souvenirs like furs and orchids).
Regulation services involve regulation of climate, floods, diseases, waste and water and air
quality. Cultural services are reflected in the use of nature as a motif or symbol in books; folklore; architecture etc.; as a religious value; for recreation (including ecotourism); in science
and education; and in therapeutic purposes. Finally, supporting services include nutrient
recycling, soil formation and primary production, which enable ecosystems to provide water
purification, flood regulation and food (World Resources Institute, 2005).
Figure 18: The Concept of Ecosystem Services
Source: Based on the Millennium Ecosystem Assessment, World Resources Institute (2005).
Provisioning
RegulatingCultural
Supporting Food
Fresh water
Wood and fiber
Fuel
Regulation of:
Climate
Flood
Disease
Water purification
Aesthetic
Spiritual
Educational
Recreational
Nutrient cycling
Soil formation
Primary production
The Economic and Societal Importance of the Irish Suckler Beef Sector 46
Clearly farmers have an important role to play in the production of public goods and
ecosystem services. However, the type and system of farming is an important influence on
the quantity and quality of public goods generated. Highly intensive indoor livestock systems
produce very low rates of public goods while at the opposite end of the spectrum low-
intensity grazing systems are the principal form of management of large areas of valued
pastoral landscape and are critical to the maintenance of “High Nature Value” farmland in
Europe (Baldock et al., 1993). Grazing systems such as suckler cow farming are often
associated with high levels of public goods. Furthermore, cultural and archaeological heritage
is often well preserved in extensive grassland systems because low stocking densities have
resulted in relatively little structural change or soil disturbance. Hedgerows, field margins and
drainage ditches along boundaries are often present in lowland beef systems, though perhaps
at a lower density where the management is more intensive.
Active and appropriate management of the landscape is a key ecosystem service provided by
farmers. Over or under-grazing of lands can negatively impact on biodiversity, that is the
variety of plants and animals that are located in a habitat, on resilience to flooding and fires and the level of susceptibility to erosion by wind and water. Studies of the BurrenLife project,
for example, have shown the key positive influences of appropriate grazing management on
the preservation of this unique landscape and flora.
The difficult economic situation on many suckler farms coupled with the adverse production
conditions in marginal areas, means that the risk of considerable de-stocking of animals and/or
abandonment of land may be significant, and growing. Land abandonment is a serious concern
for society as it can result in a change in the natural landscape, a loss of heritage features such
as stone walls and native breeds of livestock, a loss of biodiversity, and a contraction of the
rural population and communities.
5.4 Public Goods and Tourism
Even in areas where agriculture’s contribution to the rural economy and employment is small,
farming often continues to play an important social and cultural role. Culture and heritage can
be typified by the physical features found in rural areas, and the traditional customs and
practices that survive to this day. Many traditional customs, crafts, cuisine and music in rural
parts of Europe are intrinsically linked to farming and agriculture, and as such farmers play a critical role in ensuring the future survival of such customs for all in society to enjoy, (Cooper
et al 2009).
It is widely acknowledged that maintaining farmers on the land and supporting traditional
farming practices is important for preserving heritage. The maintenance of stonewalls in the
west of Ireland, farmhouses and working yards and traditional animal breeds are all examples
of traditional agriculture that provides a unique identity and sense of place to a region (Figure
19). Such stonewalls mainly survive today because they continue to have a role in containing
livestock but in doing so they continue to provide a link to past agricultural systems and
important to local history.
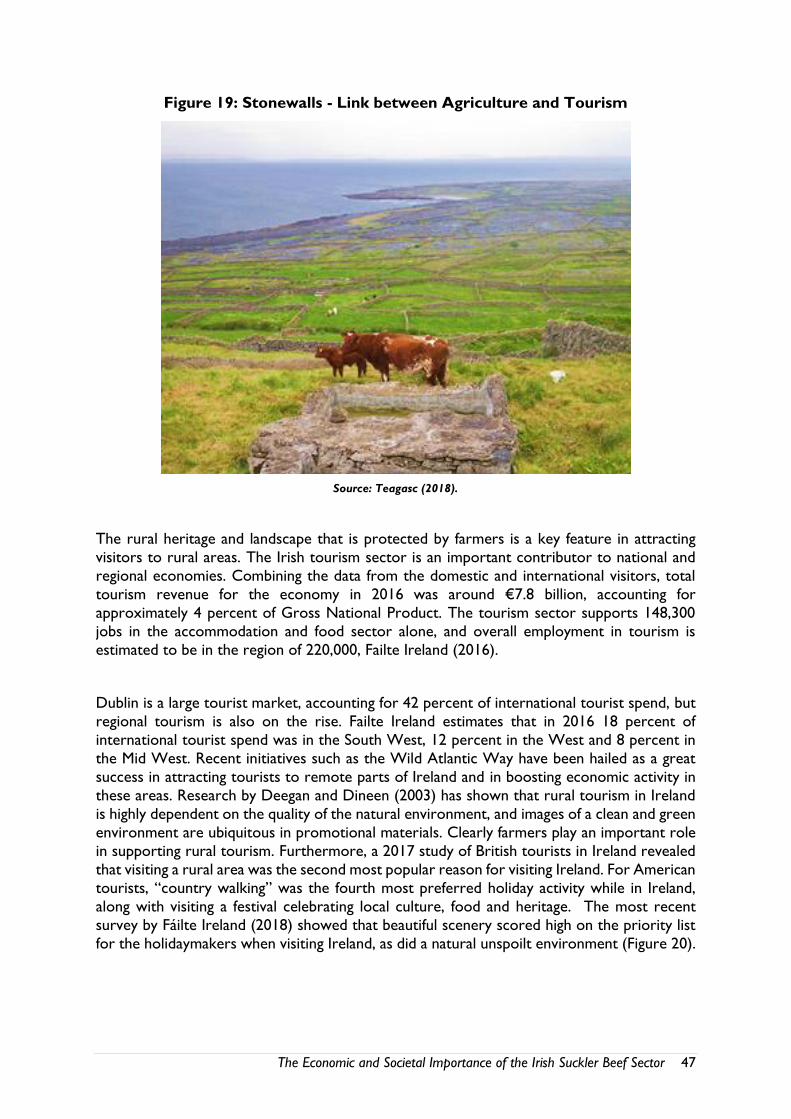
The Economic and Societal Importance of the Irish Suckler Beef Sector 47
Figure 19: Stonewalls - Link between Agriculture and Tourism
Source: Teagasc (2018).
The rural heritage and landscape that is protected by farmers is a key feature in attracting
visitors to rural areas. The Irish tourism sector is an important contributor to national and
regional economies. Combining the data from the domestic and international visitors, total
tourism revenue for the economy in 2016 was around €7.8 billion, accounting for
approximately 4 percent of Gross National Product. The tourism sector supports 148,300
jobs in the accommodation and food sector alone, and overall employment in tourism is
estimated to be in the region of 220,000, Failte Ireland (2016).
Dublin is a large tourist market, accounting for 42 percent of international tourist spend, but
regional tourism is also on the rise. Failte Ireland estimates that in 2016 18 percent of
international tourist spend was in the South West, 12 percent in the West and 8 percent in
the Mid West. Recent initiatives such as the Wild Atlantic Way have been hailed as a great
success in attracting tourists to remote parts of Ireland and in boosting economic activity in
these areas. Research by Deegan and Dineen (2003) has shown that rural tourism in Ireland
is highly dependent on the quality of the natural environment, and images of a clean and green
environment are ubiquitous in promotional materials. Clearly farmers play an important role
in supporting rural tourism. Furthermore, a 2017 study of British tourists in Ireland revealed
that visiting a rural area was the second most popular reason for visiting Ireland. For American
tourists, “country walking” was the fourth most preferred holiday activity while in Ireland,
along with visiting a festival celebrating local culture, food and heritage. The most recent
survey by Fáilte Ireland (2018) showed that beautiful scenery scored high on the priority list
for the holidaymakers when visiting Ireland, as did a natural unspoilt environment (Figure 20).
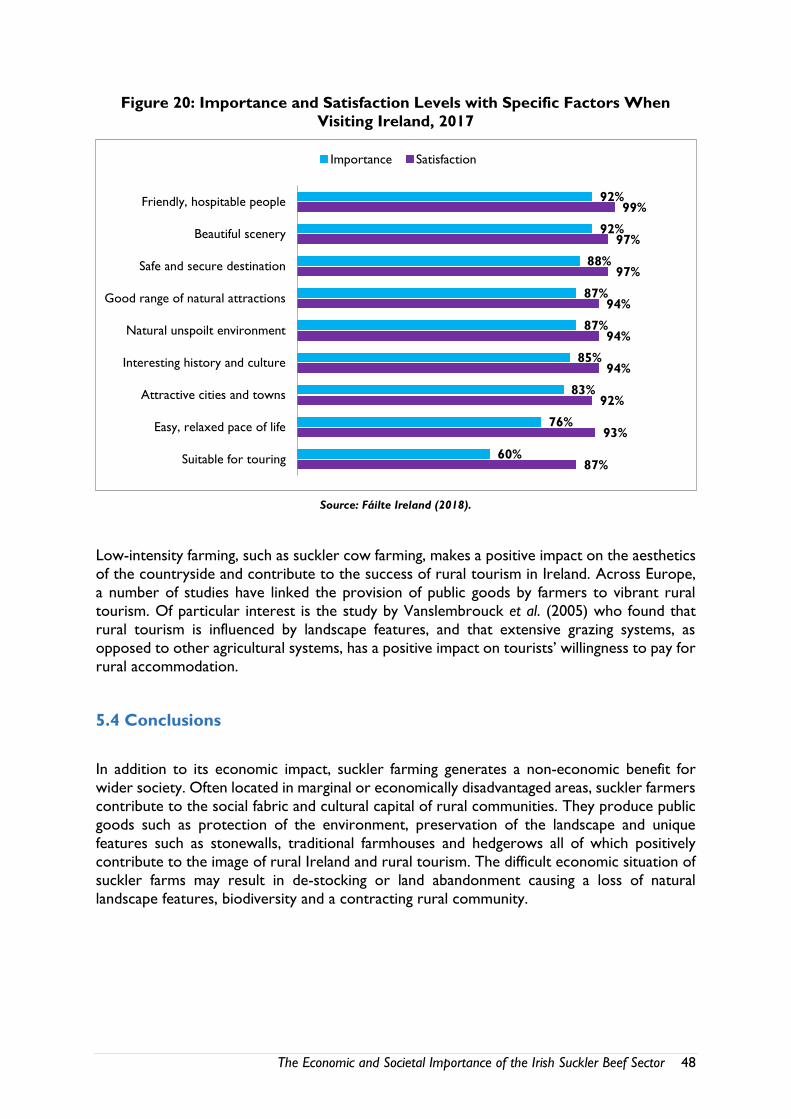
The Economic and Societal Importance of the Irish Suckler Beef Sector 48
Figure 20: Importance and Satisfaction Levels with Specific Factors When
Visiting Ireland, 2017
Source: Fáilte Ireland (2018).
Low-intensity farming, such as suckler cow farming, makes a positive impact on the aesthetics
of the countryside and contribute to the success of rural tourism in Ireland. Across Europe,
a number of studies have linked the provision of public goods by farmers to vibrant rural
tourism. Of particular interest is the study by Vanslembrouck et al. (2005) who found that
rural tourism is influenced by landscape features, and that extensive grazing systems, as
opposed to other agricultural systems, has a positive impact on tourists’ willingness to pay for
rural accommodation.
5.4 Conclusions
In addition to its economic impact, suckler farming generates a non-economic benefit for
wider society. Often located in marginal or economically disadvantaged areas, suckler farmers
contribute to the social fabric and cultural capital of rural communities. They produce public
goods such as protection of the environment, preservation of the landscape and unique
features such as stonewalls, traditional farmhouses and hedgerows all of which positively
contribute to the image of rural Ireland and rural tourism. The difficult economic situation of
suckler farms may result in de-stocking or land abandonment causing a loss of natural
landscape features, biodiversity and a contracting rural community.
92%
92%
88%
87%
87%
85%
83%
76%
60%
99%
97%
97%
94%
94%
94%
92%
93%
87%
Friendly, hospitable people
Beautiful scenery
Safe and secure destination
Good range of natural attractions
Natural unspoilt environment
Interesting history and culture
Attractive cities and towns
Easy, relaxed pace of life
Suitable for touring
Importance Satisfaction
The Economic and Societal Importance of the Irish Suckler Beef Sector 49
Chapter 6: Environmental Sustainability of Irish Beef
6.1 Introduction
Stemming from environmental and health concerns, the concept of sustainable diets is gaining
traction. A sustainable diet seeks to optimise health and nutritional considerations,
affordability, and cultural acceptability, while minimising the negative environmental impact of
the diet. A Eurobarometer survey conducted in 2014 revealed that almost all Europeans
stated that the protection of the environment was important to them, and 85 percent of the
respondents believed that they could play a role in its protection (Eurobarometer, 2014). In
addition, about four-fifths of the respondents agreed that the efficient use of natural resources
could boost economic growth, and six out of ten advocated environmentally friendly considerations over cost considerations when it came to public authority decisions about the
environment (Eurobarometer, 2014).
Many of the food attributes that sustainability-conscious consumers seek are embodied in
Irish beef production, and as such the move to more sustainable diets may represent a major
opportunity for Ireland’s food industry in general and beef in particular. This chapter reviews
the environmental performance of beef production in Ireland especially in relation to other
key beef producing and exporting countries. The Irish beef carbon and water footprint are
examined as well as the levels of nitrogen surpluses. The chapter concludes with an overview
of the animal welfare performance of the Irish beef sector.
6.2 The Carbon Footprint of Beef Production
As discussed in Chapter 3, growing concerns about climate change and policy initiatives aimed
at reducing agriculture’s contribution to greenhouse gas emissions have drawn increased
attention to the carbon footprint of food production globally. In this section, the carbon
footprint of beef production in Ireland is compared to other key beef producing countries.
In a European context, the Irish beef sector can be considered quite carbon-efficient. A
comprehensive assessment of the contribution of the European livestock sector to GHG
emissions was conducted by the European Commission in 2010. The study evaluated the full
net carbon emissions of a range of livestock products, taking account of all on-farm emissions
related to livestock rearing and the production of animal feed (even where this feed
production takes place outside the EU), as well as emissions caused by providing inputs of
mineral fertilizers, pesticides, energy, and land for the production of feed. Figure 21 illustrates
the carbon footprint of beef across various Member States. Ireland has the fifth lowest carbon
footprint for beef production in Europe: only Italy, the Netherlands, Austria and Slovakia are
more carbon-efficient. Irish beef has a carbon footprint of 19 kg CO2-eq/kg beef which is
below the EU average of 22.1 kg CO2-eq/kg beef. Importantly, France and Germany, the EU’s
largest beef producers, producing over one-third of European beef between them, are less
carbon-efficient than Irish beef production.
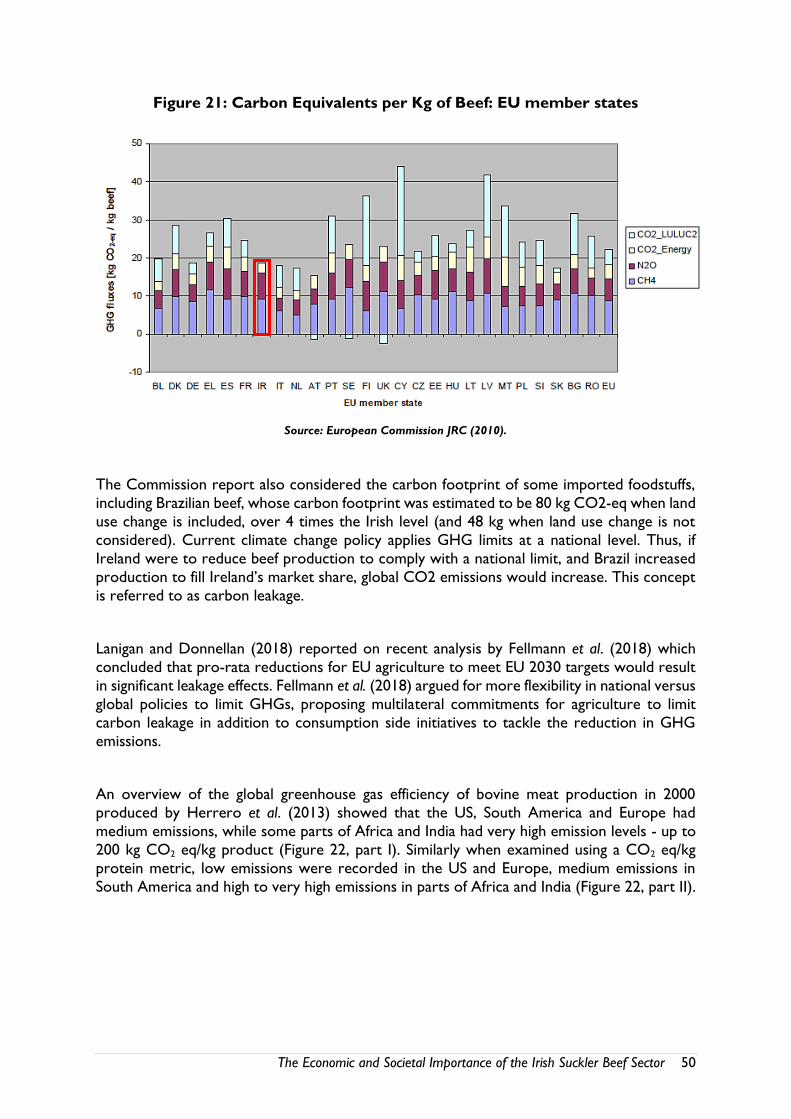
The Economic and Societal Importance of the Irish Suckler Beef Sector 50
Figure 21: Carbon Equivalents per Kg of Beef: EU member states
Source: European Commission JRC (2010).
The Commission report also considered the carbon footprint of some imported foodstuffs,
including Brazilian beef, whose carbon footprint was estimated to be 80 kg CO2-eq when land
use change is included, over 4 times the Irish level (and 48 kg when land use change is not
considered). Current climate change policy applies GHG limits at a national level. Thus, if
Ireland were to reduce beef production to comply with a national limit, and Brazil increased
production to fill Ireland’s market share, global CO2 emissions would increase. This concept
is referred to as carbon leakage.
Lanigan and Donnellan (2018) reported on recent analysis by Fellmann et al. (2018) which
concluded that pro-rata reductions for EU agriculture to meet EU 2030 targets would result
in significant leakage effects. Fellmann et al. (2018) argued for more flexibility in national versus
global policies to limit GHGs, proposing multilateral commitments for agriculture to limit
carbon leakage in addition to consumption side initiatives to tackle the reduction in GHG
emissions.
An overview of the global greenhouse gas efficiency of bovine meat production in 2000
produced by Herrero et al. (2013) showed that the US, South America and Europe had
medium emissions, while some parts of Africa and India had very high emission levels - up to
200 kg CO2 eq/kg product (Figure 22, part I). Similarly when examined using a CO2 eq/kg
protein metric, low emissions were recorded in the US and Europe, medium emissions in
South America and high to very high emissions in parts of Africa and India (Figure 22, part II).
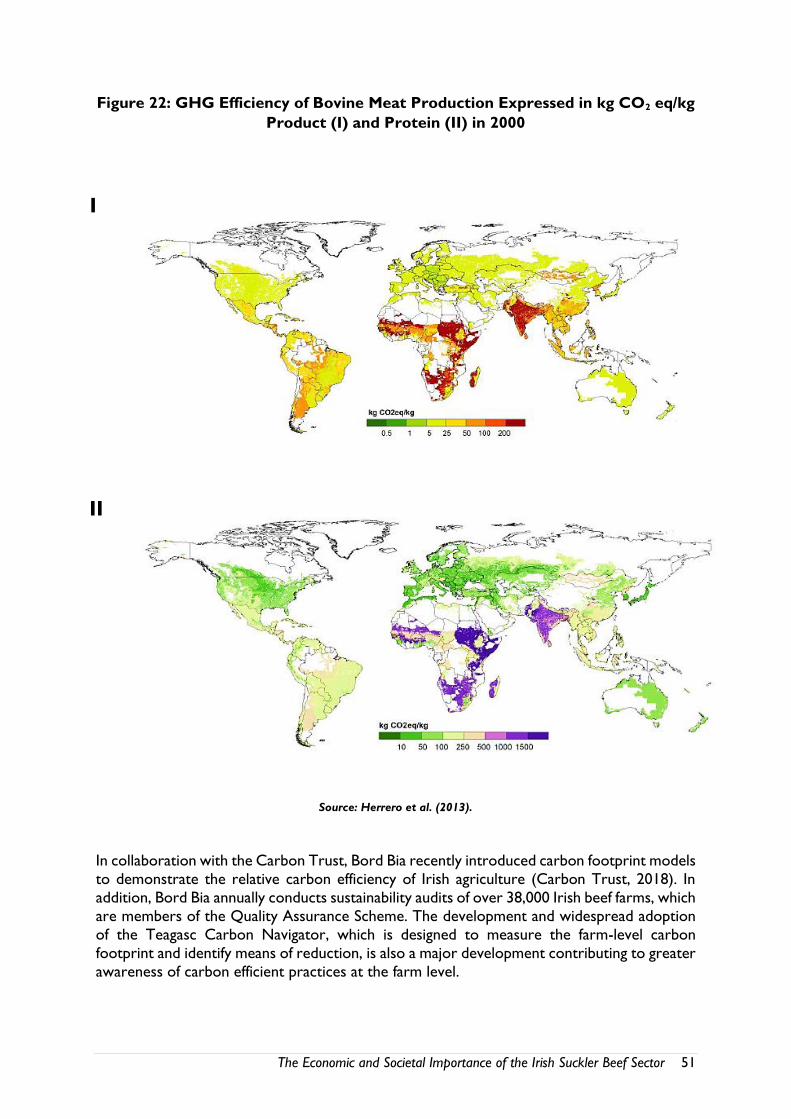
The Economic and Societal Importance of the Irish Suckler Beef Sector 51
Figure 22: GHG Efficiency of Bovine Meat Production Expressed in kg CO2 eq/kg
Product (I) and Protein (II) in 2000
Source: Herrero et al. (2013).
In collaboration with the Carbon Trust, Bord Bia recently introduced carbon footprint models
to demonstrate the relative carbon efficiency of Irish agriculture (Carbon Trust, 2018). In
addition, Bord Bia annually conducts sustainability audits of over 38,000 Irish beef farms, which
are members of the Quality Assurance Scheme. The development and widespread adoption
of the Teagasc Carbon Navigator, which is designed to measure the farm-level carbon
footprint and identify means of reduction, is also a major development contributing to greater
awareness of carbon efficient practices at the farm level.
I
II
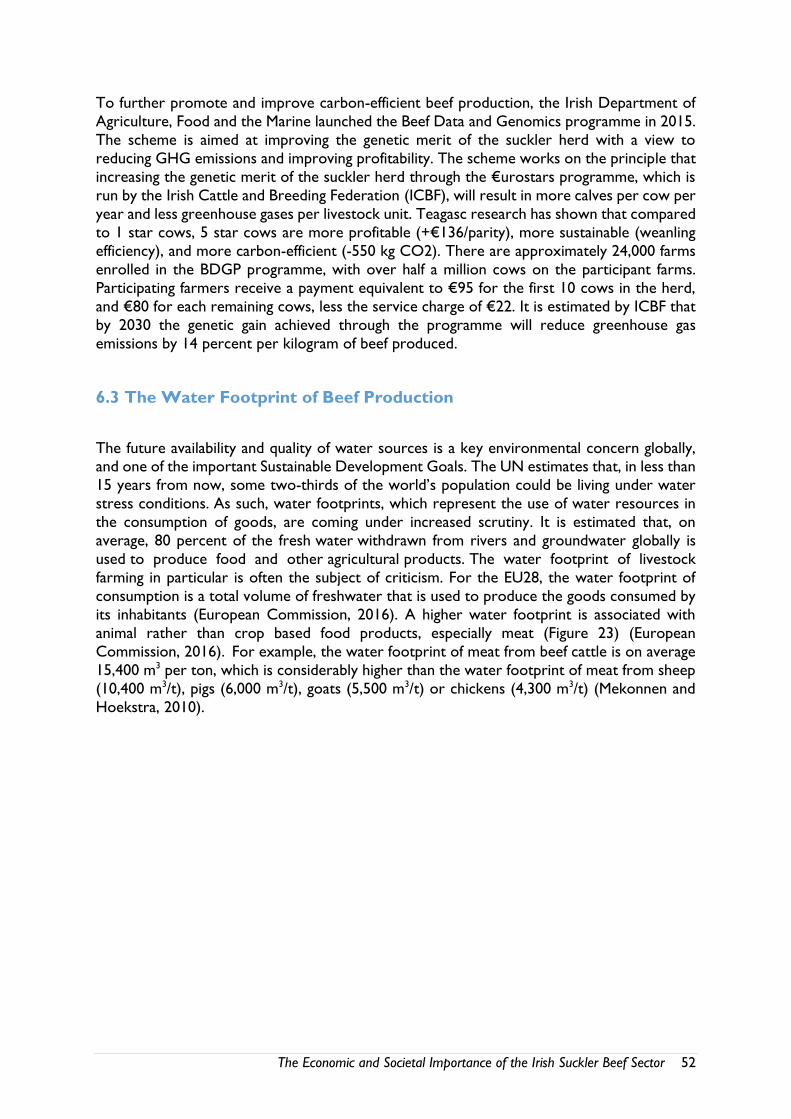
The Economic and Societal Importance of the Irish Suckler Beef Sector 52
To further promote and improve carbon-efficient beef production, the Irish Department of
Agriculture, Food and the Marine launched the Beef Data and Genomics programme in 2015.
The scheme is aimed at improving the genetic merit of the suckler herd with a view to
reducing GHG emissions and improving profitability. The scheme works on the principle that
increasing the genetic merit of the suckler herd through the €urostars programme, which is
run by the Irish Cattle and Breeding Federation (ICBF), will result in more calves per cow per
year and less greenhouse gases per livestock unit. Teagasc research has shown that compared
to 1 star cows, 5 star cows are more profitable (+€136/parity), more sustainable (weanling
efficiency), and more carbon-efficient (-550 kg CO2). There are approximately 24,000 farms
enrolled in the BDGP programme, with over half a million cows on the participant farms.
Participating farmers receive a payment equivalent to €95 for the first 10 cows in the herd,
and €80 for each remaining cows, less the service charge of €22. It is estimated by ICBF that
by 2030 the genetic gain achieved through the programme will reduce greenhouse gas
emissions by 14 percent per kilogram of beef produced.
6.3 The Water Footprint of Beef Production
The future availability and quality of water sources is a key environmental concern globally, and one of the important Sustainable Development Goals. The UN estimates that, in less than
15 years from now, some two-thirds of the world’s population could be living under water
stress conditions. As such, water footprints, which represent the use of water resources in
the consumption of goods, are coming under increased scrutiny. It is estimated that, on
average, 80 percent of the fresh water withdrawn from rivers and groundwater globally is
used to produce food and other agricultural products. The water footprint of livestock
farming in particular is often the subject of criticism. For the EU28, the water footprint of
consumption is a total volume of freshwater that is used to produce the goods consumed by
its inhabitants (European Commission, 2016). A higher water footprint is associated with
animal rather than crop based food products, especially meat (Figure 23) (European
Commission, 2016). For example, the water footprint of meat from beef cattle is on average
15,400 m3 per ton, which is considerably higher than the water footprint of meat from sheep
(10,400 m3/t), pigs (6,000 m3/t), goats (5,500 m3/t) or chickens (4,300 m3/t) (Mekonnen and
Hoekstra, 2010).
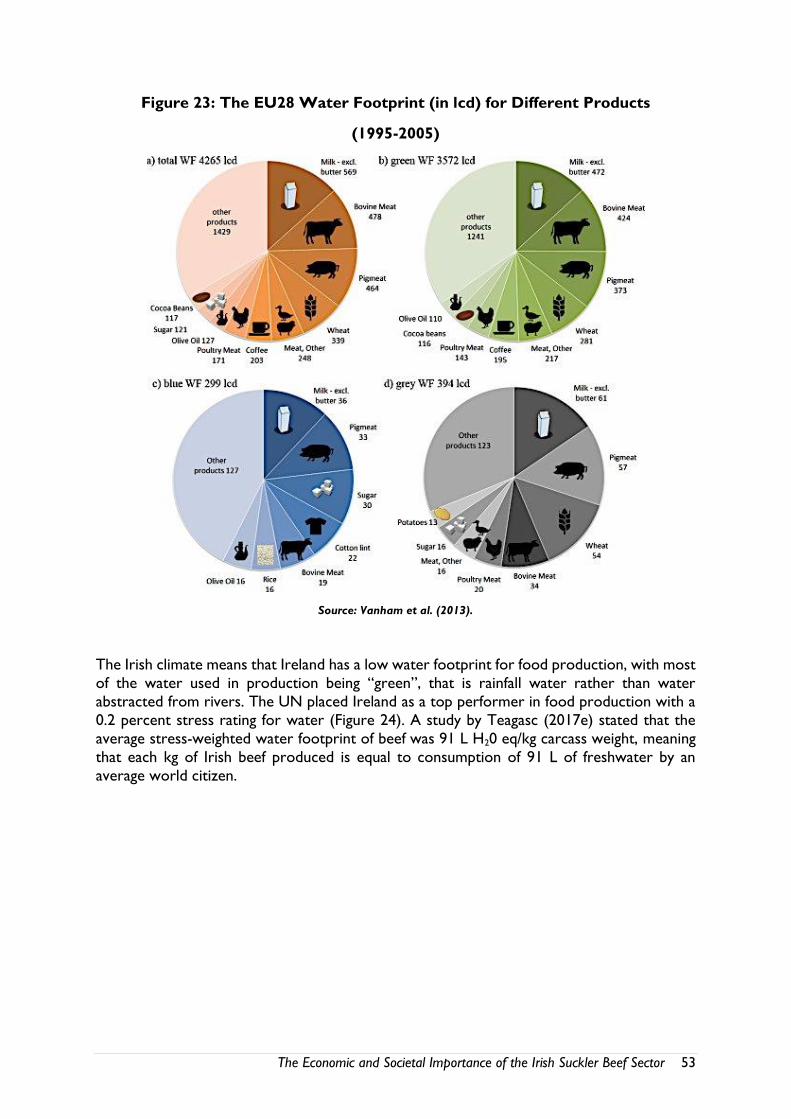
The Economic and Societal Importance of the Irish Suckler Beef Sector 53
Figure 23: The EU28 Water Footprint (in lcd) for Different Products
(1995-2005)
Source: Vanham et al. (2013).
The Irish climate means that Ireland has a low water footprint for food production, with most
of the water used in production being “green”, that is rainfall water rather than water
abstracted from rivers. The UN placed Ireland as a top performer in food production with a
0.2 percent stress rating for water (Figure 24). A study by Teagasc (2017e) stated that the
average stress-weighted water footprint of beef was 91 L H20 eq/kg carcass weight, meaning
that each kg of Irish beef produced is equal to consumption of 91 L of freshwater by an
average world citizen.
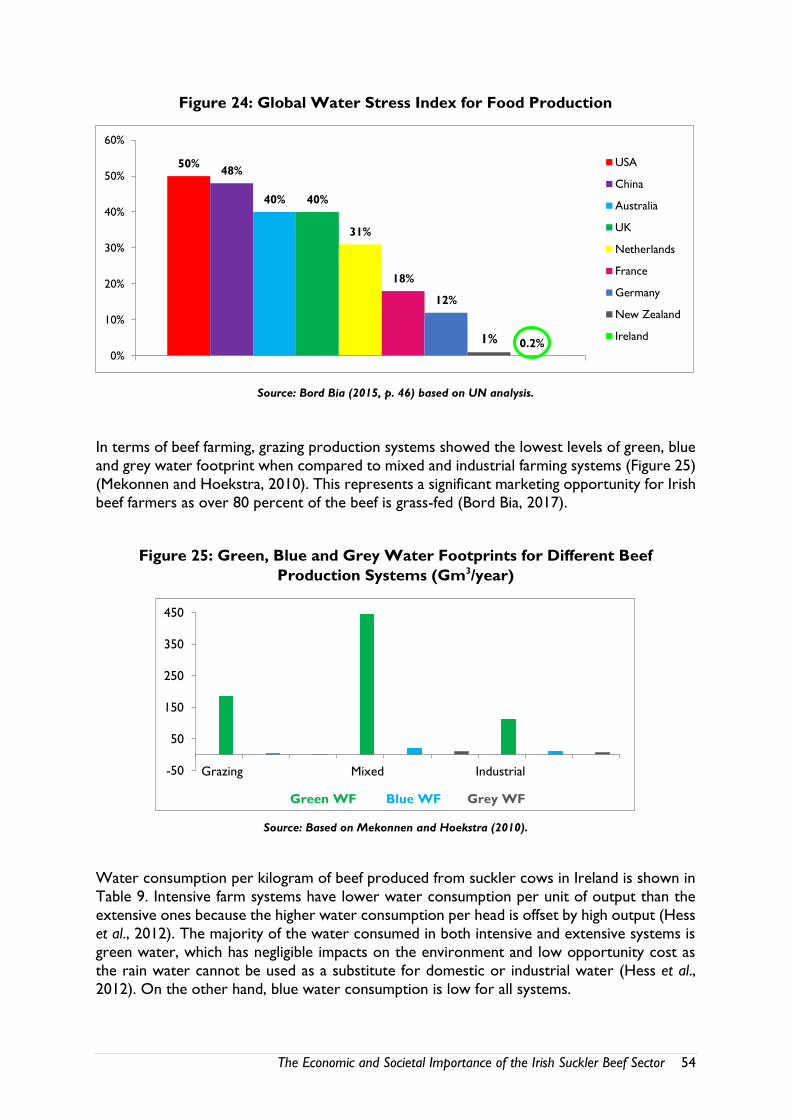
The Economic and Societal Importance of the Irish Suckler Beef Sector 54
Figure 24: Global Water Stress Index for Food Production
Source: Bord Bia (2015, p. 46) based on UN analysis.
In terms of beef farming, grazing production systems showed the lowest levels of green, blue
and grey water footprint when compared to mixed and industrial farming systems (Figure 25)
(Mekonnen and Hoekstra, 2010). This represents a significant marketing opportunity for Irish
beef farmers as over 80 percent of the beef is grass-fed (Bord Bia, 2017).
Figure 25: Green, Blue and Grey Water Footprints for Different Beef
Production Systems (Gm3/year)
Source: Based on Mekonnen and Hoekstra (2010).
Water consumption per kilogram of beef produced from suckler cows in Ireland is shown in
Table 9. Intensive farm systems have lower water consumption per unit of output than the
extensive ones because the higher water consumption per head is offset by high output (Hess
et al., 2012). The majority of the water consumed in both intensive and extensive systems is
green water, which has negligible impacts on the environment and low opportunity cost as
the rain water cannot be used as a substitute for domestic or industrial water (Hess et al.,
2012). On the other hand, blue water consumption is low for all systems.
50%48%
40% 40%
31%
18%
12%
1% 0.2%0%
10%
20%
30%
40%
50%
60%
USA
China
Australia
UK
Netherlands
France
Germany
New Zealand
Ireland
-50
50
150
250
350
450
Grazing Mixed Industrial
Green WF Blue WF Grey WF
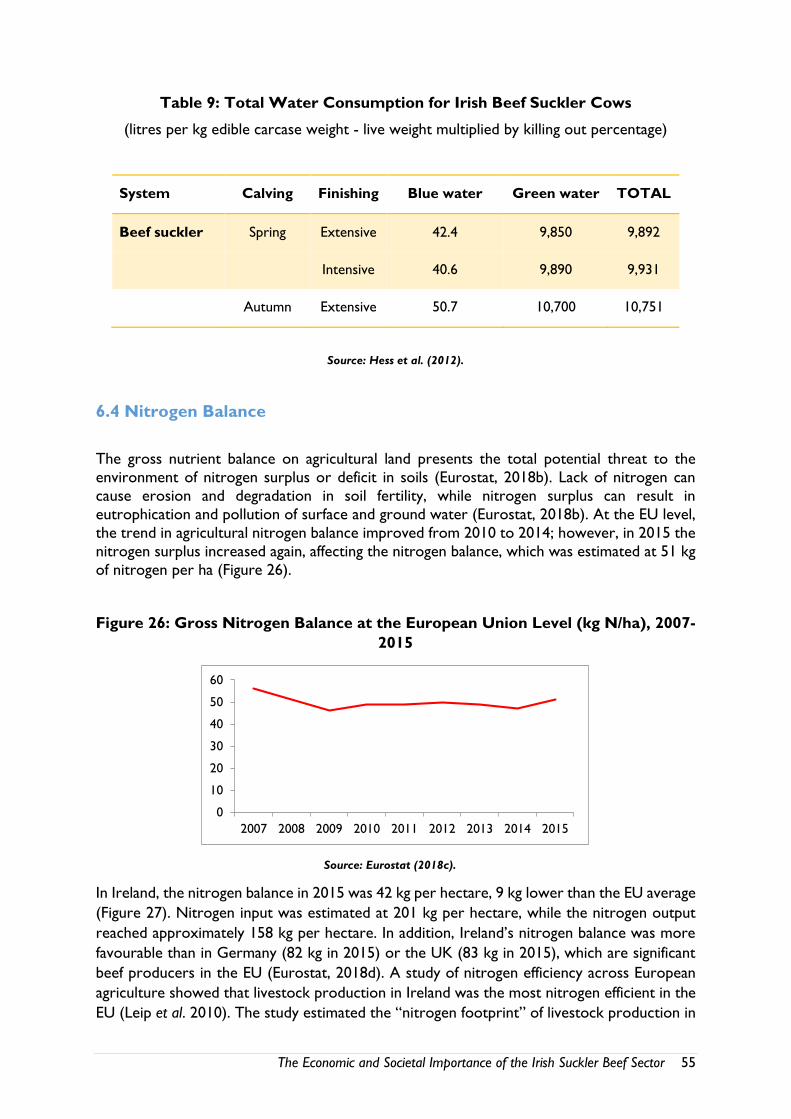
The Economic and Societal Importance of the Irish Suckler Beef Sector 55
Table 9: Total Water Consumption for Irish Beef Suckler Cows
(litres per kg edible carcase weight - live weight multiplied by killing out percentage)
System Calving Finishing Blue water Green water TOTAL
Beef suckler Spring Extensive 42.4 9,850 9,892
Intensive 40.6 9,890 9,931
Autumn Extensive 50.7 10,700 10,751
Source: Hess et al. (2012).
6.4 Nitrogen Balance
The gross nutrient balance on agricultural land presents the total potential threat to the
environment of nitrogen surplus or deficit in soils (Eurostat, 2018b). Lack of nitrogen can
cause erosion and degradation in soil fertility, while nitrogen surplus can result in
eutrophication and pollution of surface and ground water (Eurostat, 2018b). At the EU level,
the trend in agricultural nitrogen balance improved from 2010 to 2014; however, in 2015 the
nitrogen surplus increased again, affecting the nitrogen balance, which was estimated at 51 kg
of nitrogen per ha (Figure 26).
Figure 26: Gross Nitrogen Balance at the European Union Level (kg N/ha), 2007-
2015
Source: Eurostat (2018c).
In Ireland, the nitrogen balance in 2015 was 42 kg per hectare, 9 kg lower than the EU average
(Figure 27). Nitrogen input was estimated at 201 kg per hectare, while the nitrogen output
reached approximately 158 kg per hectare. In addition, Ireland’s nitrogen balance was more
favourable than in Germany (82 kg in 2015) or the UK (83 kg in 2015), which are significant
beef producers in the EU (Eurostat, 2018d). A study of nitrogen efficiency across European
agriculture showed that livestock production in Ireland was the most nitrogen efficient in the
EU (Leip et al. 2010). The study estimated the “nitrogen footprint” of livestock production in
0
10
20
30
40
50
60
2007 2008 2009 2010 2011 2012 2013 2014 2015
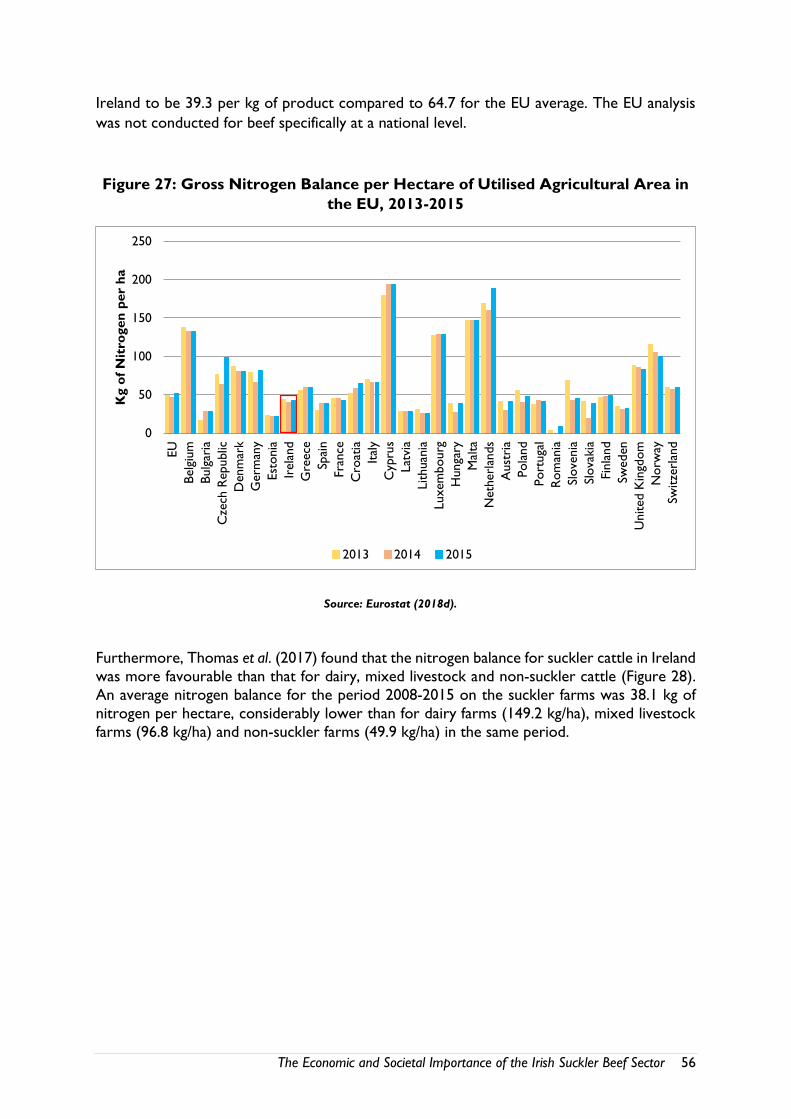
The Economic and Societal Importance of the Irish Suckler Beef Sector 56
Ireland to be 39.3 per kg of product compared to 64.7 for the EU average. The EU analysis
was not conducted for beef specifically at a national level.
Figure 27: Gross Nitrogen Balance per Hectare of Utilised Agricultural Area in
the EU, 2013-2015
Source: Eurostat (2018d).
Furthermore, Thomas et al. (2017) found that the nitrogen balance for suckler cattle in Ireland
was more favourable than that for dairy, mixed livestock and non-suckler cattle (Figure 28).
An average nitrogen balance for the period 2008-2015 on the suckler farms was 38.1 kg of
nitrogen per hectare, considerably lower than for dairy farms (149.2 kg/ha), mixed livestock
farms (96.8 kg/ha) and non-suckler farms (49.9 kg/ha) in the same period.
0
50
100
150
200
250
EU
Belg
ium
Bulg
aria
Cze
ch R
epublic
Denm
ark
Germ
any
Est
onia
Irela
nd
Gre
ece
Spai
n
Fra
nce
Cro
atia
Ital
y
Cyp
rus
Lat
via
Lithuan
ia
Luxem
bourg
Hunga
ry
Mal
ta
Neth
erl
ands
Aust
ria
Pola
nd
Port
uga
l
Rom
ania
Slove
nia
Slova
kia
Fin
land
Sweden
United K
ingd
om
Norw
ay
Switze
rlan
d
Kg o
f N
itro
gen
per
ha
2013 2014 2015
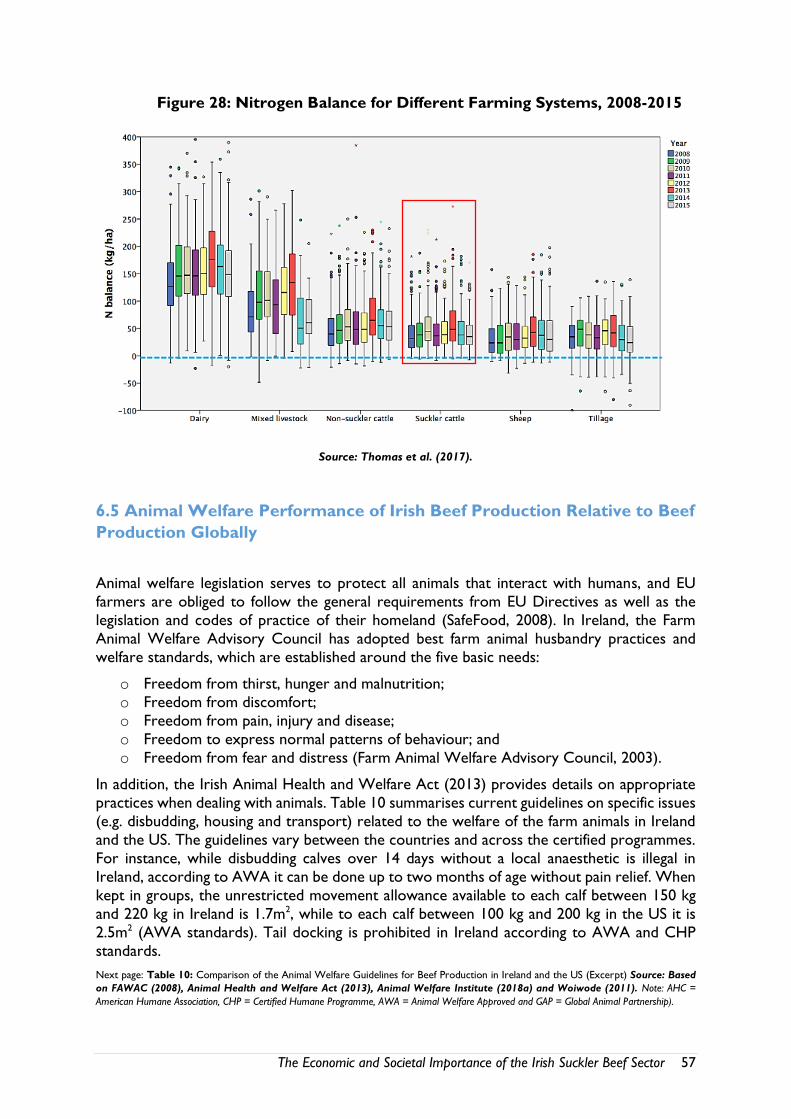
The Economic and Societal Importance of the Irish Suckler Beef Sector 57
Figure 28: Nitrogen Balance for Different Farming Systems, 2008-2015
Source: Thomas et al. (2017).
6.5 Animal Welfare Performance of Irish Beef Production Relative to Beef
Production Globally
Animal welfare legislation serves to protect all animals that interact with humans, and EU
farmers are obliged to follow the general requirements from EU Directives as well as the
legislation and codes of practice of their homeland (SafeFood, 2008). In Ireland, the Farm
Animal Welfare Advisory Council has adopted best farm animal husbandry practices and
welfare standards, which are established around the five basic needs:
o Freedom from thirst, hunger and malnutrition;
o Freedom from discomfort;
o Freedom from pain, injury and disease;
o Freedom to express normal patterns of behaviour; and
o Freedom from fear and distress (Farm Animal Welfare Advisory Council, 2003).
In addition, the Irish Animal Health and Welfare Act (2013) provides details on appropriate
practices when dealing with animals. Table 10 summarises current guidelines on specific issues
(e.g. disbudding, housing and transport) related to the welfare of the farm animals in Ireland
and the US. The guidelines vary between the countries and across the certified programmes.
For instance, while disbudding calves over 14 days without a local anaesthetic is illegal in
Ireland, according to AWA it can be done up to two months of age without pain relief. When
kept in groups, the unrestricted movement allowance available to each calf between 150 kg
and 220 kg in Ireland is 1.7m2, while to each calf between 100 kg and 200 kg in the US it is
2.5m2 (AWA standards). Tail docking is prohibited in Ireland according to AWA and CHP
standards.
Next page: Table 10: Comparison of the Animal Welfare Guidelines for Beef Production in Ireland and the US (Excerpt) Source: Based
on FAWAC (2008), Animal Health and Welfare Act (2013), Animal Welfare Institute (2018a) and Woiwode (2011). Note: AHC =
American Humane Association, CHP = Certified Humane Programme, AWA = Animal Welfare Approved and GAP = Global Animal Partnership).
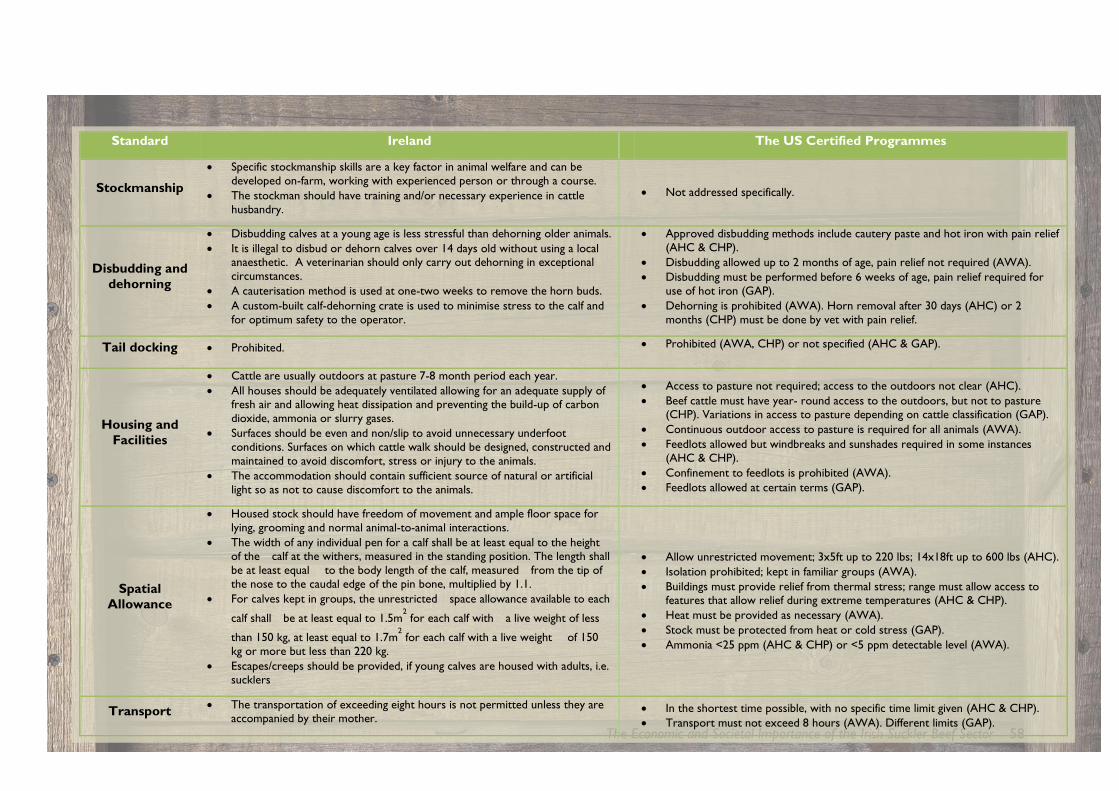
The Economic and Societal Importance of the Irish Suckler Beef Sector 58
Standard Ireland The US Certified Programmes
Stockmanship
Specific stockmanship skills are a key factor in animal welfare and can be
developed on-farm, working with experienced person or through a course.
The stockman should have training and/or necessary experience in cattle
husbandry.
Not addressed specifically.
Disbudding and
dehorning
Disbudding calves at a young age is less stressful than dehorning older animals.
It is illegal to disbud or dehorn calves over 14 days old without using a local anaesthetic. A veterinarian should only carry out dehorning in exceptional
circumstances.
A cauterisation method is used at one-two weeks to remove the horn buds.
A custom-built calf-dehorning crate is used to minimise stress to the calf and
for optimum safety to the operator.
Approved disbudding methods include cautery paste and hot iron with pain relief
(AHC & CHP).
Disbudding allowed up to 2 months of age, pain relief not required (AWA).
Disbudding must be performed before 6 weeks of age, pain relief required for
use of hot iron (GAP).
Dehorning is prohibited (AWA). Horn removal after 30 days (AHC) or 2
months (CHP) must be done by vet with pain relief.
Tail docking Prohibited. Prohibited (AWA, CHP) or not specified (AHC & GAP).
Housing and
Facilities
Cattle are usually outdoors at pasture 7-8 month period each year.
All houses should be adequately ventilated allowing for an adequate supply of fresh air and allowing heat dissipation and preventing the build-up of carbon
dioxide, ammonia or slurry gases.
Surfaces should be even and non/slip to avoid unnecessary underfoot
conditions. Surfaces on which cattle walk should be designed, constructed and
maintained to avoid discomfort, stress or injury to the animals.
The accommodation should contain sufficient source of natural or artificial
light so as not to cause discomfort to the animals.
Access to pasture not required; access to the outdoors not clear (AHC).
Beef cattle must have year- round access to the outdoors, but not to pasture (CHP). Variations in access to pasture depending on cattle classification (GAP).
Continuous outdoor access to pasture is required for all animals (AWA).
Feedlots allowed but windbreaks and sunshades required in some instances
(AHC & CHP).
Confinement to feedlots is prohibited (AWA).
Feedlots allowed at certain terms (GAP).
Spatial
Allowance
Housed stock should have freedom of movement and ample floor space for
lying, grooming and normal animal-to-animal interactions.
The width of any individual pen for a calf shall be at least equal to the height of the calf at the withers, measured in the standing position. The length shall
be at least equal to the body length of the calf, measured from the tip of
the nose to the caudal edge of the pin bone, multiplied by 1.1.
For calves kept in groups, the unrestricted space allowance available to each
calf shall be at least equal to 1.5m2 for each calf with a live weight of less
than 150 kg, at least equal to 1.7m2 for each calf with a live weight of 150
kg or more but less than 220 kg.
Escapes/creeps should be provided, if young calves are housed with adults, i.e. sucklers
Allow unrestricted movement; 3x5ft up to 220 lbs; 14x18ft up to 600 lbs (AHC).
Isolation prohibited; kept in familiar groups (AWA).
Buildings must provide relief from thermal stress; range must allow access to features that allow relief during extreme temperatures (AHC & CHP).
Heat must be provided as necessary (AWA).
Stock must be protected from heat or cold stress (GAP).
Ammonia <25 ppm (AHC & CHP) or <5 ppm detectable level (AWA).
Transport The transportation of exceeding eight hours is not permitted unless they are
accompanied by their mother.
In the shortest time possible, with no specific time limit given (AHC & CHP).
Transport must not exceed 8 hours (AWA). Different limits (GAP).
The Economic and Societal Importance of the Irish Suckler Beef Sector 59
In Ireland, cattle are usually outdoors at pasture 7-8 months per year, which is considered as
one of the advantages for the premium quality of Irish beef. American standards are not clear
when it comes to access to pasture, ranging from: (i) no access required (AHC); (ii) access to
outdoors but not the pasture required (CHP); (iii) or continuous access to pasture (AWA).
Animal welfare remains an important issue for many citizens of the EU (see Figure 29). A
Eurobarometer survey published in March 2016 showed that an absolute majority of
Europeans (94 percent) are of the view that it is important to protect the welfare of farmed
animals. Almost two thirds of Europeans (64 percent) indicated that they would like to have
more information about the conditions under which farmed animals are treated in their
country, and 59 percent of EU citizens mentioned that they would be prepared to pay more
for products sourced from animal welfare-friendly production systems. The opinions of the
US consumers on the welfare of farm animals are similar to European consumers (see Figure
28). Americans want good living conditions for farm animals (80 percent), demand to know
more about how farmers ensure animal care (68 percent), and are willing to pay more for the
welfare-certified animal products (66 percent).
When questioned about animal welfare standards in the EU and the rest of the world, nine
out of ten European respondents (90 percent) agree that it is important to establish animal
welfare standards that are recognised across the world, and a larger number again, 93 percent,
strongly agree that imported products from outside the EU should respect the same animal
welfare standards as those applied in the EU.
To investigate animal welfare performance in Irish beef production, Mazurek et al. (2010)
conducted an on-farm study of beef suckler herds using an animal welfare index (AWI). The
authors assessed 194 beef suckler farms throughout 13 counties, and found that the mean
AWI was 65 percent, with a range of 54 to 83 percent (Mazurek et al., 2010). In the study, 70
percent of the farms were rated as ‘Very Good’ or ‘Excellent’, which is relevant considering
that improving animal welfare is an important factor in livestock production due to increased
consumers’ concern about the source of animal products and practices related to animal
husbandry (Mazurek et al, 2010). In 2011, the DAFM assessed the animal welfare scheme for
suckler herds and concluded that it had a positive impact in bringing a long-term change to
welfare practices (DAFM, 2011). It found that the animal welfare measures directly
contributed to improved prices for weanlings and also improved the reputation for Irish beef
and live exports in key markets. Most importantly, the measures encouraged significant
attitudinal and behavioural change by suckler farmers, which is hoped to result in continuous
implementation of animal welfare practices even in the absence of a scheme (DAFM, 2011).
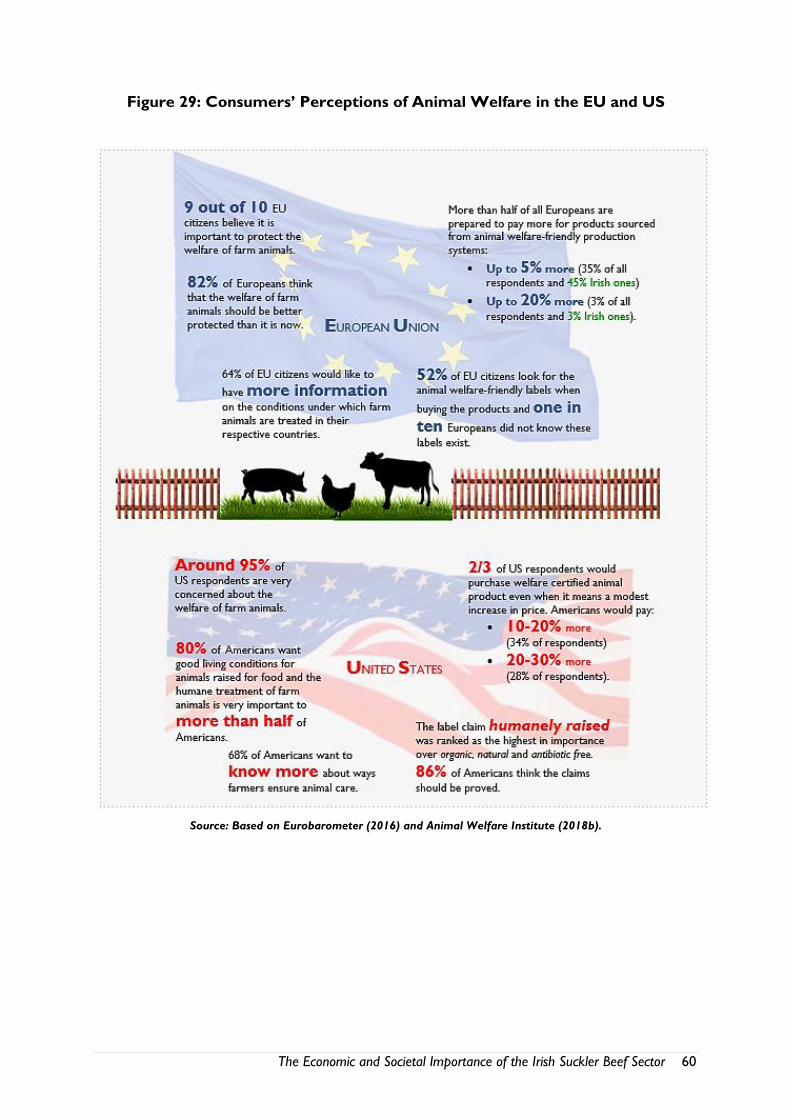
The Economic and Societal Importance of the Irish Suckler Beef Sector 60
Figure 29: Consumers’ Perceptions of Animal Welfare in the EU and US
Source: Based on Eurobarometer (2016) and Animal Welfare Institute (2018b).
The Economic and Societal Importance of the Irish Suckler Beef Sector 61
In terms of the use of hormones in beef production, EU Directive 96/22/EEC prohibited the
use of substances, e.g. testosterone, progesterone, zeranol, oestradiol 17ß and others, that
have a hormonal action enhancing the growth in farm animals. This Directive applied to all EU
Member States and also to imports from third countries. The European Parliament and
Council revised the Directive in 2003, and amended the rules applying to the use in stock
farming of certain substances with drastically reduced circumstances under which oestradiol
17ß can be administered for other purposes to food-producing animals. This Directive,
however, is not compatible with the U.S. Food and Drug Administration (FDA) law, according
to which a number of steroid hormone drugs and implants, including natural estrogen,
progesterone, testosterone and their synthetic versions, are approved in beef cattle
production (FDA, 2017). These drugs are available for over-the-counter purchase but are not
allowed for growth purposes in dairy cows, veal calves, pigs or poultry.
Under the EU legislation, each member country has to implement and submit the results of a
residue monitoring plan on a yearly basis for the approval of the European Commission. The
latest results of Irish National Residue Plan in 2016 showed a high level of compliance with
the EU Directive. The overall level of non-compliance was only 0.2 percent, which means that
just 40 out of 19,250 samples were non-compliant (DAFM, 2017). This high level of
compliance has been consistent over the last few years, and demonstrates the responsible
approach to food production that the vast majority of Irish farmers adopted (DAFM, 2017).
In recent times, there have been a number of scandals about animal welfare, production and
food safety standards of the some of the Mercosur countries, Brazil in particular. In March
2017, news broke of a major bribery and corruption case in Brazil. “Operation Weak Flesh,”
as it was named by Brazil’s federal police, involved allegations of bribery by two major
exporting companies. Police accused more than 100 workers of taking bribes in exchange for
clearing rancid meat for export with all the necessary paperwork. In May 2017, an EU Food
and Veterinary Office (FVO) report concluded that competent authorities in Brazil were
signing export report certificates despite being unable to ascertain the veracity of certain
statements therein, and went on to pronounce that the Brazilian Competent Authority was
not in a position to guarantee that the relevant export requirements were met. In June 2017,
the U.S. Department of Agriculture suspended imports of all fresh beef from Brazil because
of recurring food safety problems.
6.6 Perspectives on the Quality of Irish Beef
Moloney and Allen (2016) note that almost 90 percent of the beef produced in Ireland is
exported into highly competitive markets, and this is evidence that its quality compares
favourably with beef from other sources. They note that the unique selling points of Irish beef include the “green” image of Ireland, the grass-fed production system which gives the meat a
distinctive flavour and a more healthy fatty acid profile than the concentrate-based diets
common in continental Europe and the US. Most Irish beef is from steers and heifers
compared to beef from cows and young bulls, which is common in many European countries,
and would generally be of inferior eating quality. Grass-fed cattle roam free on pastures, while
grain-fed cattle are often confined in feed lots. However, the most significant difference
between the two systems is in the finishing stage where grass-fed cattle remain on the pasture
The Economic and Societal Importance of the Irish Suckler Beef Sector 62
and are finished on a diet that is mostly grass or other forages. Grass-fed beef tends to have
lower fat than grain-fed beef. In addition, grass-fed beef has two to six times more omega-3
fatty acids, is a rich source of conjugated linoleic acid (CLA), and does not contain artifical
hormones.
Grass-fed beef is increasingly commanding a price premium on markets in developed and
affluent countries. Fresh grass-fed beef commanded a 71 percent premium over conventional
beef (net of discounts) at the US retail level in 2016 (Stone Barns Center for Food and
Agriculture, 2017). Market research has shown that from a consumer’s point of view, grass-
fed beef has three major potential benefits: health and nutrition (Duckett et al., 1993), animal
welfare (Morrow-Tesch 2000), and ecosystem-friendly farming practices (Horrigan et al.,
2002). According to Nielsen (2017), US and Canadian consumers are willing to pay more for
meat that is ethically raised (31 percent US, 35 percent Canada) and clearly labelled with
transparent claims such as 'antibiotic-free' (27 percent US) and 'grass-fed' (17 percent US). In
2016, sales of grass-fed beef in the US reached €272 million (Bord Bia, 2018d). The increased
US demand for grass-fed beef represents a great opportunity for the Irish beef sector as Ireland has first-mover advantage due to the fact that it is the first EU country to re-gain entry
to the US market (Department of Foreign Affairs and Trade, 2015).
6.7 Conclusions
Consumers are becoming increasingly concerned about the environmental sustainability of
food production, and Ireland produces some of the world’s most environmentally sustainable
beef. The carbon footprint of beef production in Ireland is the fifth lowest in Europe, and
almost one-quarter of the Brazilian footprint. However, if Ireland reduces beef production to
meet GHG commitments, then carbon leakage is a major concern as less carbon-efficient
countries may increase beef production to satisfy growing consumer demand globally. Ireland
is a highly water-efficient producer of food, with a 0.2 percent stress rating, and international
studies have also shown that Ireland is the most nitrogen-efficient producer of livestock
products in Europe. Modern consumers demand transparency and increasingly care about the
source of the animal products and the welfare of farm animals. Animal welfare standards in
Ireland are high, and in accordance with the European Union requirements. In addition, over
80 percent of Irish beef is grass-fed, which translates into better conditions for the animals
and meat that is lower in fat but high in omega-3 fatty acids.
The Economic and Societal Importance of the Irish Suckler Beef Sector 63
Chapter 7: The Economic Impact of a Potential Contraction
in the Suckler Cow Herd
7.1 Introduction
Brexit, the future of the Common Agricultural Policy, and climate change policy all pose
threats to the future development of the beef sector in Ireland. If not handled proactively, these challenges could lead to a reduction in direct payments and/or beef prices, and in turn
to a contraction in the national suckler cow herd. This chapter explores the economic impact
of a number of potential negative shocks to the suckler cow herd.
7.2 The Economic Impact of a Contraction in the Suckler Cow Herd
This analysis assumes a shock to the beef sector arising from one of a number of policy and
market related challenges on the horizon. According to the CSO the value of beef output
generated by the primary agricultural sector was approximately €2.36 billion in 2017, this
includes beef meat arising from dairy and beef breed animals. Official data are not available
on the output generated by the suckler herd, instead it is estimated here that approximately
60 percent of total beef output comes from the suckler herd and its progeny. This estimate
is based on suckler cows comprising 44 percent of all cows nationally and the progeny of
suckler cows being more valuable than dairy cows as discussed in Chapter 2. This results in
an assumed national output for the suckler herd of €1.45 billion.
The multiplier and employment coefficients presented previously are used to approximate
the economic impact of shocks on output and employment. Technical Appendix 1 details the
process used to obtain these hypothetical impacts. It is important to note that this analysis is
static in that it assumes the suckler herd contracts and that there is no further adjustment to
this shock. As noted above the output multiplier for the beef sector is calculated to be
approximately 2.11. If we assume that this multiplier holds for the disaggregated sucker sector
Table 11 provides a summary of the impact of a series of shocks to the suckler herd on the
national economy. We assume three different levels of shocks to the suckler heard; 5, 10 and
20 percent.
To give an illustrative example, consider the impact of a 5 percent reduction in output. Total output for the suckler herd is €1.45b. A 5 percent reduction in this would be €0.0725b.
However, given the multiplier of 2.11 this would have an indirect effect on related and
interconnected sectors resulting in a total drop in national output of approximately €0.153b.
This analysis is also conducted for a shock of 10 percent and 20 percent.
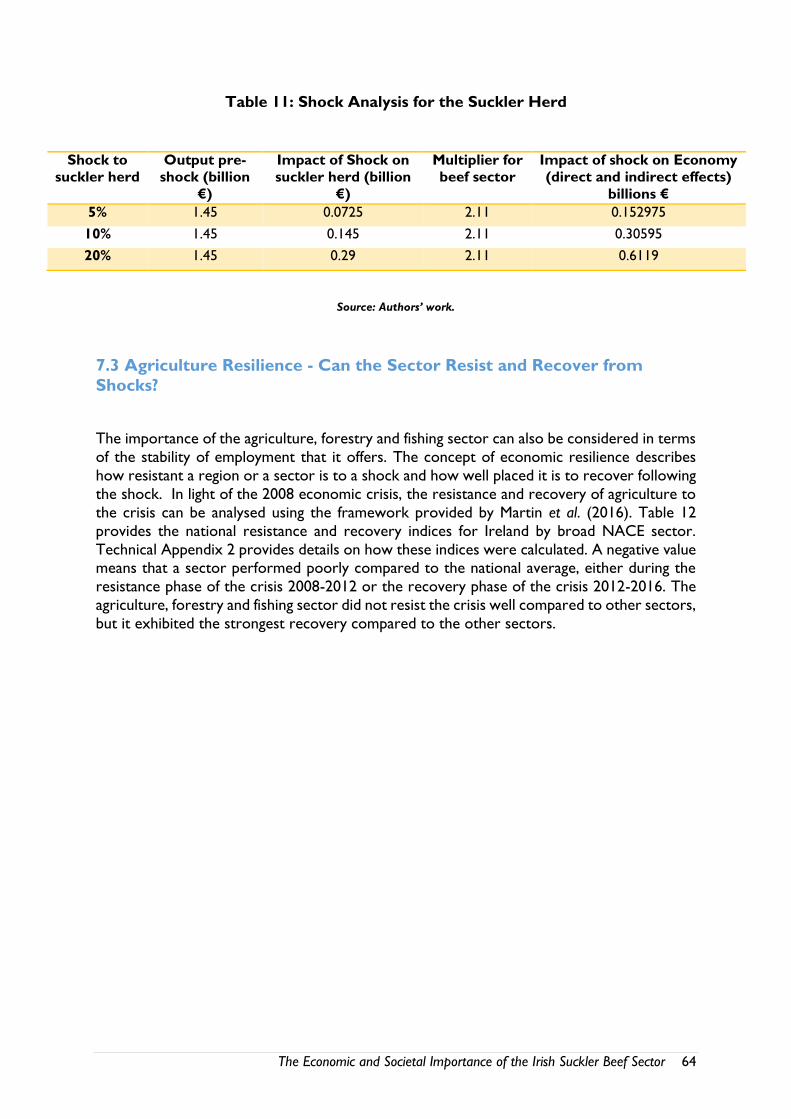
The Economic and Societal Importance of the Irish Suckler Beef Sector 64
Table 11: Shock Analysis for the Suckler Herd
Shock to
suckler herd
Output pre-
shock (billion
€)
Impact of Shock on
suckler herd (billion
€)
Multiplier for
beef sector
Impact of shock on Economy
(direct and indirect effects)
billions €
5% 1.45 0.0725 2.11 0.152975
10% 1.45 0.145 2.11 0.30595
20% 1.45 0.29 2.11 0.6119
Source: Authors’ work.
7.3 Agriculture Resilience - Can the Sector Resist and Recover from
Shocks?
The importance of the agriculture, forestry and fishing sector can also be considered in terms
of the stability of employment that it offers. The concept of economic resilience describes
how resistant a region or a sector is to a shock and how well placed it is to recover following
the shock. In light of the 2008 economic crisis, the resistance and recovery of agriculture to
the crisis can be analysed using the framework provided by Martin et al. (2016). Table 12
provides the national resistance and recovery indices for Ireland by broad NACE sector.
Technical Appendix 2 provides details on how these indices were calculated. A negative value means that a sector performed poorly compared to the national average, either during the
resistance phase of the crisis 2008-2012 or the recovery phase of the crisis 2012-2016. The
agriculture, forestry and fishing sector did not resist the crisis well compared to other sectors,
but it exhibited the strongest recovery compared to the other sectors.
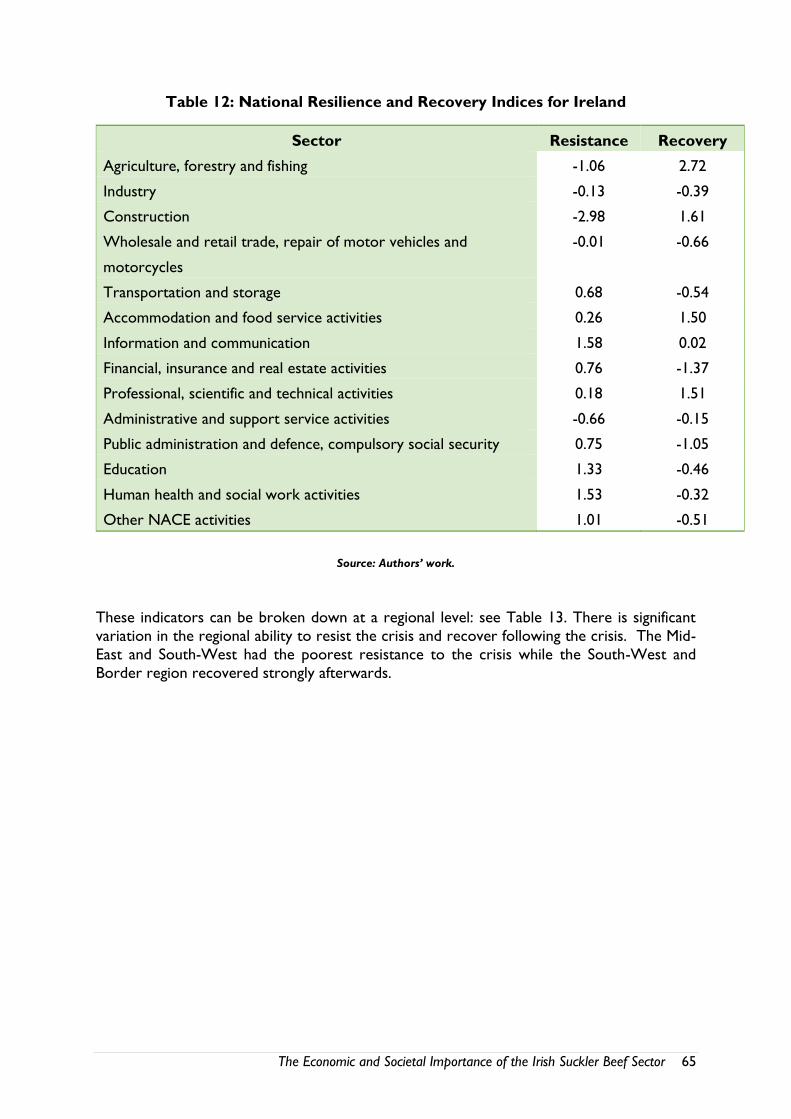
The Economic and Societal Importance of the Irish Suckler Beef Sector 65
Table 12: National Resilience and Recovery Indices for Ireland
Sector Resistance Recovery
Agriculture, forestry and fishing -1.06 2.72
Industry -0.13 -0.39
Construction -2.98 1.61
Wholesale and retail trade, repair of motor vehicles and
motorcycles
-0.01 -0.66
Transportation and storage 0.68 -0.54
Accommodation and food service activities 0.26 1.50
Information and communication 1.58 0.02
Financial, insurance and real estate activities 0.76 -1.37
Professional, scientific and technical activities 0.18 1.51
Administrative and support service activities -0.66 -0.15
Public administration and defence, compulsory social security 0.75 -1.05
Education 1.33 -0.46
Human health and social work activities 1.53 -0.32
Other NACE activities 1.01 -0.51
Source: Authors’ work.
These indicators can be broken down at a regional level: see Table 13. There is significant
variation in the regional ability to resist the crisis and recover following the crisis. The Mid-
East and South-West had the poorest resistance to the crisis while the South-West and
Border region recovered strongly afterwards.
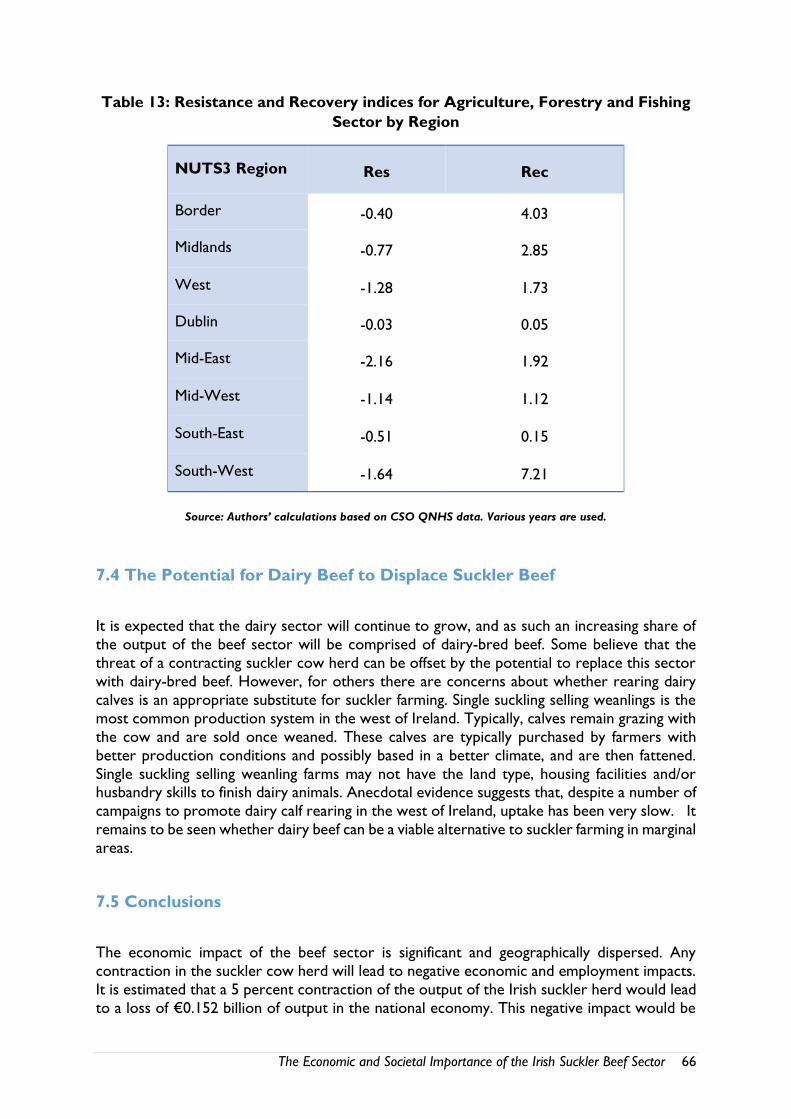
The Economic and Societal Importance of the Irish Suckler Beef Sector 66
Table 13: Resistance and Recovery indices for Agriculture, Forestry and Fishing
Sector by Region
NUTS3 Region Res Rec
Border -0.40 4.03
Midlands -0.77 2.85
West -1.28 1.73
Dublin -0.03 0.05
Mid-East -2.16 1.92
Mid-West -1.14 1.12
South-East -0.51 0.15
South-West -1.64 7.21
Source: Authors’ calculations based on CSO QNHS data. Various years are used.
7.4 The Potential for Dairy Beef to Displace Suckler Beef
It is expected that the dairy sector will continue to grow, and as such an increasing share of
the output of the beef sector will be comprised of dairy-bred beef. Some believe that the
threat of a contracting suckler cow herd can be offset by the potential to replace this sector
with dairy-bred beef. However, for others there are concerns about whether rearing dairy
calves is an appropriate substitute for suckler farming. Single suckling selling weanlings is the
most common production system in the west of Ireland. Typically, calves remain grazing with
the cow and are sold once weaned. These calves are typically purchased by farmers with
better production conditions and possibly based in a better climate, and are then fattened.
Single suckling selling weanling farms may not have the land type, housing facilities and/or husbandry skills to finish dairy animals. Anecdotal evidence suggests that, despite a number of
campaigns to promote dairy calf rearing in the west of Ireland, uptake has been very slow. It
remains to be seen whether dairy beef can be a viable alternative to suckler farming in marginal
areas.
7.5 Conclusions
The economic impact of the beef sector is significant and geographically dispersed. Any
contraction in the suckler cow herd will lead to negative economic and employment impacts.
It is estimated that a 5 percent contraction of the output of the Irish suckler herd would lead
to a loss of €0.152 billion of output in the national economy. This negative impact would be
The Economic and Societal Importance of the Irish Suckler Beef Sector 67
more apparent in sectors dependent on agriculture. Regarding the ability of the sector to
recover after shocks, based on evidence after the general 2008 economic crisis, the
agriculture, forestry and fishing sector is less resistant to shocks than other sectors but has a
strong ability to recover following a shock. This positive ability to recover suggests the
potential for the sector to bounce back following an external shock. However, this varies
significantly across regions. For instance agriculture, forestry and fishing sector in the border
regions showed strong ability to resist and recover following the 2008 economic crisis while
a region such as the South-West was very negatively affected by the shock but subsequently
recovered strongly. This suggests that across different regions the impact of any shock is likely
to be felt to varying degrees.
The Economic and Societal Importance of the Irish Suckler Beef Sector 68
Chapter 8: Conclusions
In this final chapter a SWOT (Strengths, Weaknesses, Opportunities and Threats) analysis is
used to summarise the key findings of this report and put the current state of the Irish beef
sector, and the suckler sector in particular, into context. SWOT analysis is a strategic planning
technique used to assess the internal and external factors that impact a sector and could
potentially determine the success of that sector in a short to mid-term period. It provides an
insight into the sector’s most prosperous and vulnerable parts, and enables informed decision-
making for important strategic steps. SWOT analysis includes factors shaping the internal and
external environment. The internal Strength and Weakness factors are controllable, while the
Opportunity and Threat factors in the external areas are related to, for example, the state
economy, global supply and demand and competition, and thus cannot be controlled.
As seen in Figure 30, the Irish suckler sector has a number of major strengths, including the
size of the sector and its importance in terms of the other sectors it supports, job creation
(directly and indirectly) and generating foreign earnings. The very high sustainability status of
Irish beef is a major strength. Consumers’ increasing awareness of sustainability issues,
coupled with growing global demand for beef and more liberalised trade, are all strengths that
will allow Ireland to capitalise on its image of clean, green, grass-fed beef.
Despite the economic significance of the suckler cow sector, the grave and difficult economic
situation at the farm level is a major weakness. The very low market prices relative to
production costs mean that this large farm sector is almost entirely reliant on direct payments.
This obviously makes the sector, and indeed the entire supply chain, extremely vulnerable in
light of the proposed cuts to the CAP budget. Any negative price shocks arising from threats
such as Brexit or international trade deals will exacerbate the economic situation at the farm
level making farmers even more reliant on payments. Climate change policy also remains a
major threat for the future beef sector. Despite the very positive carbon performance by Irish
beef farms, the absolute levels of emissions from agriculture remains a problem.
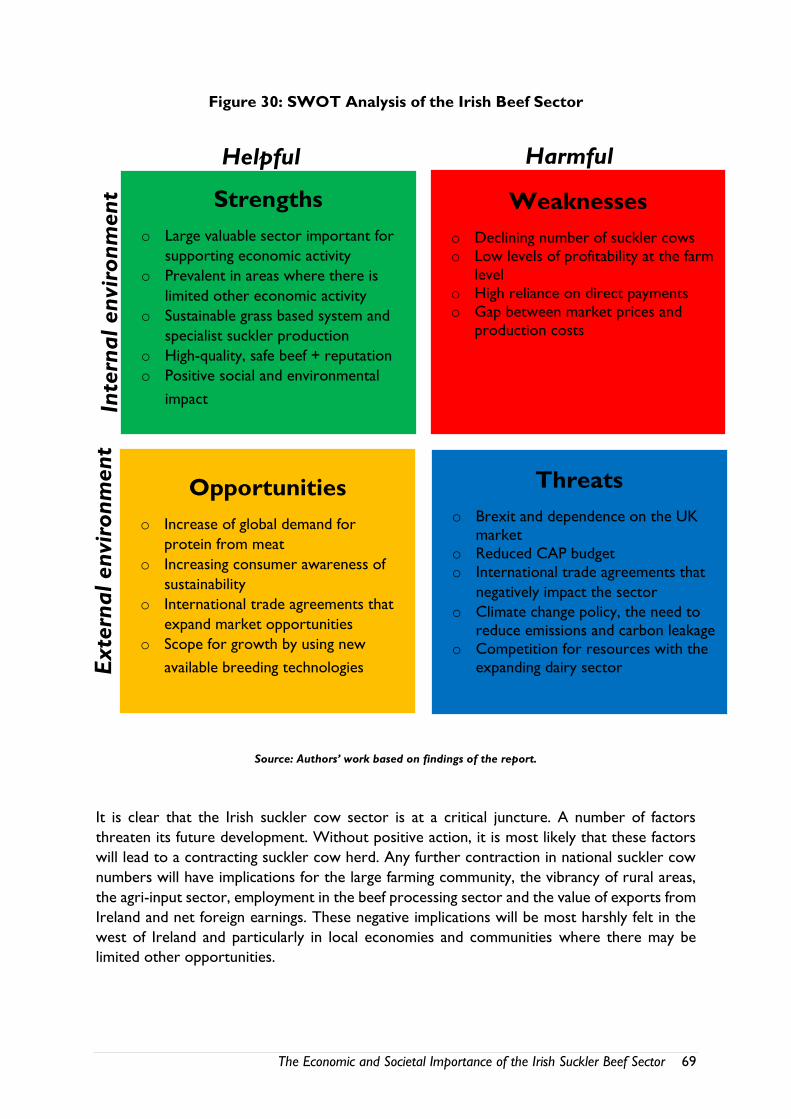
The Economic and Societal Importance of the Irish Suckler Beef Sector 69
Figure 30: SWOT Analysis of the Irish Beef Sector
Source: Authors’ work based on findings of the report.
It is clear that the Irish suckler cow sector is at a critical juncture. A number of factors
threaten its future development. Without positive action, it is most likely that these factors
will lead to a contracting suckler cow herd. Any further contraction in national suckler cow
numbers will have implications for the large farming community, the vibrancy of rural areas,
the agri-input sector, employment in the beef processing sector and the value of exports from
Ireland and net foreign earnings. These negative implications will be most harshly felt in the
west of Ireland and particularly in local economies and communities where there may be
limited other opportunities.
Helpful Harmful
Inte
rnal envi
ronm
ent
Exte
rnal envi
ronm
ent
Strengths
o Large valuable sector important for
supporting economic activity
o Prevalent in areas where there is
limited other economic activity
o Sustainable grass based system and
specialist suckler production
o High-quality, safe beef + reputation
o Positive social and environmental
impact
Weaknesses
o Declining number of suckler cows
o Low levels of profitability at the farm
level
o High reliance on direct payments
o Gap between market prices and
production costs
Opportunities
o Increase of global demand for
protein from meat
o Increasing consumer awareness of
sustainability
o International trade agreements that
expand market opportunities
o Scope for growth by using new
available breeding technologies
Threats
o Brexit and dependence on the UK
market
o Reduced CAP budget
o International trade agreements that
negatively impact the sector
o Climate change policy, the need to
reduce emissions and carbon leakage
o Competition for resources with the
expanding dairy sector
The Economic and Societal Importance of the Irish Suckler Beef Sector 70
References
1) Agri Aware (2017). The Irish Beef Processing Industry.
http://agriaware.ie/uploads/files/Farm%20Walk%20and%20Talk%20Beef%20notes%20
2017.pdf
2) Agriland (2017). Analysis: Why the future’s looking increasingly black and white for
beef farmers, by Seán Cummins (online, July 23, 2017).
https://www.agriland.ie/farming-news/analysis-why-the-futures-looking-increasingly-
black-and-white-for-beef-farmers/
3) Agriland (2018). Suckler cows are keeping people in jobs in rural Ireland, by Conor
Finnerty (online, January 23, 2018). http://www.agriland.ie/farming-news/suckler-
cows-are-keeping-people-in-jobs-in-rural-ireland/ 4) Animal Health and Welfare Act 2013 (2013).
http://www.irishstatutebook.ie/eli/2013/act/15/enacted/en/html
5) Animal Welfare Institute - AWI (2018a). Animal Welfare Standards: A
Comparison of Industry Guidelines and Independent Labels.
https://awionline.org/sites/default/files/uploads/documents/FA-AWI-
standardscomparisontable-070816.pdf
6) Animal Welfare Institute - AWI (2018b). Consumer Perceptions on Farm
Animal Welfare. https://awionline.org/sites/default/files/uploads/documents/fa-
consumer_perceptionsoffarmwelfare_-112511.pdf
7) Baldock, D., Beaufoy, G., Benne, G. and Clark, J. (1993). Nature conservation
and new directions in the Common Agricultural Policy. IEEP London.
8) Bord Bia (2015). Sustainability Report 2015.
https://www.origingreen.ie/globalassets/publications/origin-green-sustainability-
report-2015.pdf
9) Bord Bia (2017). US Government approves Bord Bia marketing claims for Irish
Beef. https://www.bordbia.ie/corporate/press/2017/pages/usgovbeefapproval.aspx
10) Bord Bia (2018a). EU Calf (Male) Prices.
https://www.bordbia.ie/industry/farmers/pricetracking/cattle/pages/calves.aspx
11) Bord Bia (2018b). Export Performance and Prospects for 2017-2018.
https://www.bordbia.ie/industry/manufacturers/insight/publications/MarketReviews/Pa
ges/ExportPerformanceProspects2018.aspx.
12) Bord Bia (2018c). Market Outlook for Irish Beef Sector.
https://www.agriculture.gov.ie/media/migration/farmingsectors/beef/beefroundtable/fe
b2018/1BordBiaPresentation090218.pdf
13) Bord Bia (2018d). Six Organic and Sustainable Food Trends to look out for in
2018.
https://www.bordbia.ie/industry/manufacturers/insight/alerts/pages/sixorganicsustaina
blefoodtrendstolookoutforin2018.aspx
14) Bourke, J. (2016). Beef Marketing, Section 1, Chapter 4. In: Beef Manual by Bord
Bia. https://www.teagasc.ie/media/website/publications/2016/Beef-Manual-
Section1.pdf 15) Carbon Trust (2018). Bord Bia. https://www.carbontrust.com/our-clients/b/bord-
bia/
16) Carey, M. A. and Johnson, T. G. (2017). Ireland’s Input-Output Framework -
Where Are the Regions? The Journal of Spatial Planning in Ireland, August, p. 47 - 59.
The Economic and Societal Importance of the Irish Suckler Beef Sector 71
17) Central Statistics Office - CSO (2012a). Census of Agriculture 2010 - Final
Results.
https://www.cso.ie/en/media/csoie/releasespublications/documents/agriculture/2010/f
ull2010.pdf
18) Central Statistics Office - CSO (2012b). Quarterly National Household Survey Q1.
https://www.cso.ie/en/media/csoie/releasespublications/documents/labourmarket/201
1/qnhs_q12011.pdf
19) Central Statistics Office - CSO (2014). Supply and Use and Input-Output Tables
for Ireland 2011. https://www.cso.ie/en/releasesandpublications/ep/p-
sauio/supplyanduseandinput-outputtablesforireland2011/
20) Central Statistics Office - CSO (2015). Farm Structure Survey 2013.
https://www.cso.ie/en/releasesandpublications/ep/p-
fss/farmstructuresurvey2013/keyfindings/
21) Central Statistics Office - CSO (2016). Life in 1916 Ireland: Stories from
statistics. https://www.cso.ie/en/releasesandpublications/ep/p-
1916/1916irl/economy/ag/
22) Central Statistics Office - CSO (2017). Crops and Livestock Survey June Final
Results.
https://www.cso.ie/en/releasesandpublications/er/clsjf/cropsandlivestocksurveyjunefin
al2016/
23) Central Statistics Office - CSO (2018a). Number of Livestock in June by
Region, Type of Animal, and Year (1991 - 2004).
https://www.cso.ie/px/pxeirestat/statire/SelectVarVal/Define.asp?MainTable=AAA01&
PLanguage=0&PXSId=0
24) Central Statistics Office - CSO (2018b). Number of Livestock in June by
Region, Type of Animal, and Year.
https://www.cso.ie/px/pxeirestat/statire/SelectVarVal/Define.asp?MainTable=AAA07&
PLanguage=0&PXSId=0
25) Central Statistics Office - CSO (2018c). National Accounts Quarterly.
https://www.cso.ie/px/pxeirestat/Database/eirestat/National%20Accounts%20Quarte
rly/National%20Accounts%20Quarterly_statbank.asp?SP=National%20Accounts%20
Quarterly&Planguage=0 26) Central Statistics Office - CSO (2018d). Quarterly National Household Survey.
https://www.cso.ie/px/pxeirestat/Database/eirestat/Quarterly%20National%20House
hold%20Survey%20Main%20Results/Quarterly%20National%20Household%20Survey
%20Main%20Results_statbank.asp?SP=Quarterly%20National%20Household%20Surv
ey%20Main%20Results&Planguage=0
27) Central Statistics Office - CSO (2018e). Persons aged 15 years and over in
Employment (ILO) (Thousand) by NACE Rec 2 Economics Sector.
https://www.cso.ie/multiquicktables/quickTables.aspx?id=qnq03
28) Central Statistics Office - CSO (2018f). Person aged 15 years and over in
Employment by Sex, NACE Rev 2 Economic Sector, Quarter and Statistic.
https://www.cso.ie/px/pxeirestat/Statire/SelectVarVal/saveselections.asp
29) Cooper, T., Hart, K. and Baldock, D. (2009). Provision of Public Goods through
Agriculture in the European Union. https://ec.europa.eu/agriculture/external-
studies/public-goods_en
30) Crowley, C., O'Sullivan, S. and O'Keeffe, B. (2017). An Evaluation of Kerry
Social Farming 2017. http://www.southkerry.ie/wp-content/uploads/2017/07/Kerry-
Social-Farming-Evaluation-Report-2017.pdf
The Economic and Societal Importance of the Irish Suckler Beef Sector 72
31) Deegan, J. and Dineen, D. J. (2003). The Changing Contribution of Tourism in a
Dynamic Economy: The Case of Ireland. Tourism Economics, 9 (2), p. 147164.
32) Department of Foreign Affairs and Trade (2015). Minister Coveney Visits
Washington DC for Irish beef Launch. https://www.dfa.ie/irish-embassy/usa/news-and-
events/2015/minister-coveney-washington-dc-irish-beef-launch/
33) Department of Agriculture, Food and the Marine - DAFM (2011). Value for
Money. Animal Welfare, Recording and Breeding Scheme for Suckler Herds.
https://publicspendingcode.per.gov.ie/wp-
content/uploads/2012/02/SucklerVFMReview310112.pdf
34) Department of Agriculture, Food and the Marine - DAFM (2015a). 2025
Agri-Food Strategy Background Paper. Section: Meat.
https://www.agriculture.gov.ie/2025strategy/
35) Department of Agriculture, Food and the Marine - DAFM (2015b). Food
Wise 2025.
https://www.agriculture.gov.ie/media/migration/foodindustrydevelopmenttrademarke
ts/agri-foodandtheeconomy/foodwise2025/report/FoodWise2025.pdf 36) Department of Agriculture, Food and the Marine - DAFM (2017). Results
of National Residue Plan Show Continuing Trend of High Levels of Compliance.
https://www.agriculture.gov.ie/press/pressreleases/2017/july/title,110275,en.html
37) Department of Agriculture, Food and the Marine - DAFM (2018a). Creed
Announces Chinese Market Opened to Irish Beef.
https://www.agriculture.gov.ie/press/pressreleases/2018/april/title,116160,en.html
38) Department of Agriculture, Food and the Marine - DAFM (2018b).
Minister Creed Meets China Customs in Beijing.
https://www.agriculture.gov.ie/press/pressreleases/2018/may/title,117124,en.html
39) Dillon, E., Hennessy, T., Lynch, J. and Brennan, M. (2018). For the public
good. Teagasc Research, vol. 13. no. 1, Spring 2018, pp. 28-29.
40) Duckett, S. K., Wagner, D.G., Yates, L. D., Dolezal, H. G. and May, S. G.
(1993). Effects of Time on Feed on Beef Nutrient Composition. Journal of Animal
Science, 71(8), p. 2079-2088.
41) Environmental Protection Agency - EPA (2016). Chapter 12: Environment
and Agriculture. In: Ireland's Environment - An Assessment 2016.
http://www.epa.ie/media/Chapter12_Environment_Agriculture.pdf
42) Environmental Protection Agency - EPA (2017). Ireland’s Greenhouse Gas
Emission Projections 2016-2035.
http://www.epa.ie/pubs/reports/air/airemissions/ghgprojections/EPA_2017_GHG_Em
ission_Projections_Summary_Report.pdf
43) Environmental Protection Agency - EPA (2018). Ireland’s Provisional
Greenhouse Gas Emissions in 2016.
http://www.epa.ie/pubs/reports/air/airemissions/ghgemissions2016/
44) EU Directive (2003). Directive 2003/74/EC of the European Parliament and of the
Council of 22 September 2003 amending Council Directive 96/22/EC concerning the
prohibition on the use in stockfarming of certain substances having a hormonal or
thyrostatic action and of beta-agonists. https://eur-lex.europa.eu/legal-
content/EN/ALL/?uri=CELEX:32003L0074
45) Eurobarometer (2014). Attitudes of European Citizens towards the Environment. Special Eurobarometer 416. Report.
http://ec.europa.eu/commfrontoffice/publicopinion/archives/ebs/ebs_416_en.pdf
The Economic and Societal Importance of the Irish Suckler Beef Sector 73
46) Eurobarometer (2016). Attitudes of Europeans towards Animal Welfare. Report.
http://eurogrourb.cluster020.hosting.ovh.net/wp-content/uploads/Eurobarometer-
2016-Animal-Welfare.pdf
47) European Commission (2016). The water footprint of the EU for different diets.
https://ec.europa.eu/jrc/en/news/water-footprint-eu-different-diets-9674
48) European Commission (2018). Meat Market Observatory - Beef and Veal. EU
Bovine Trade, Imports in Thousand EUR.
https://ec.europa.eu/agriculture/sites/agriculture/files/market-
observatory/meat/beef/doc/eu-trade_en.pdf
49) European Commission Joint Research Centre - JRC (2010). Evaluation of the
livestock sector’s contribution to the EU greenhouse gas emissions (GGELS). Final report.
https://ec.europa.eu/agriculture/sites/agriculture/files/external-studies/2010/livestock-
gas/full_text_en.pdf
50) European Environment Agency - EEA (2017). Agricultural land: nitrogen balance.
https://www.eea.europa.eu/airs/2017/natural-capital/agricultural-land-nitrogen-
balance#tab-based-on-indicators 51) European Environment Agency - EEA (2017). Food consumption - animal based
protein. https://www.eea.europa.eu/data-and-maps/indicators/13.2-development-in-
consumption-of-2/assessment-1
52) European Network for Rural Development - ENRD (2018). Public goods and
public intervention in Agriculture. https://enrd.ec.europa.eu/public-goods_en
53) Eurostat (2018a). Greenhouse gas emissions by economic activity, 2015.
http://ec.europa.eu/eurostat/statistics-
explained/index.php/File:Greenhouse_gas_emissions_by_economic_activity,_2015_(t
housand_tonnes_of_CO2_equivalents)_YB17.png
54) Eurostat (2018b). Gross Nutrient Balance on Agricultural Land.
http://ec.europa.eu/eurostat/web/products-datasets/-/t2020_rn310
55) Eurostat (2018c). Gross Nutrient Balance per hectare.
http://appsso.eurostat.ec.europa.eu/nui/show.do?dataset=aei_pr_gnb&lang=en
56) Eurostat (2018d). http://ec.europa.eu/eurostat/statistics-
explained/index.php?title=File:Gross_nitrogen_balance_on_agricultural_land,_2004-
2015,_kg_N_per_ha_UAA.png
57) Fáilte Ireland (2018). Tourism Facts 2017. Preliminary.
http://www.failteireland.ie/FailteIreland/media/WebsiteStructure/Documents/3_Resea
rch_Insights/5_International_Tourism_Trends/Failte-Ireland-s-Tourism-Facts-2017-
preliminary.pdf?ext=.pdf
58) Farm Animal Welfare Advisory Council - FAWAC (2008). Animal Welfare
Guidelines for Beef Farmers.
http://www.fawac.ie/media/fawac/content/publications/animalwelfare/RevisedAnimal
WelfareGuidelineforBeefFarmers2008.pdf
59) Fellmann, T., Witzke, P., Weiss, F., van Doorslaer, B., Drabik, D., Huck,
I., Salputra, G., Jansson, T. and Leip, A. (2018). Major challenges of integrating
agriculture into climate change mitigation policy frameworks. Mitigation and
Adaptation Strategies for Global Change, 23(3), p. 451-468.
60) Food and Drug Administration - FDA (2017). Steroid Hormone Implants Used
for Growth in Food-Producing Animals. https://www.fda.gov/animalveterinary/safetyhealth/productsafetyinformation/ucm0554
36.htm
The Economic and Societal Importance of the Irish Suckler Beef Sector 74
61) Food Harvest 2020 (2010).
https://www.agriculture.gov.ie/media/migration/foodindustrydevelopmenttrademarke
ts/agri-
foodandtheeconomy/foodharvest2020/2020FoodHarvestExeSummary240810.pdf
62) Government of Ireland (2018). Fact Sheet on Irish Agriculture. January 218.
https://www.agriculture.gov.ie/media/migration/publications/2018/January2018Factshe
et120118.pdf
63) Han, Y. and Goetz, S.J. (2013). Predicting the Economic Resilience of US
Counties from Industry Input-Output Accounts. Paper presented at the 2013
Southern Regional Science Association Annual Meeting, Washington, DC, USA, April
5.
http://www.nardep.info/uploads/Predicting_the_Economic_Resilience_of_US_Counti
es_by_Han_and_Goetz_SRSA_2013B.pdf
64) Hanrahan, K. (2016). The Significance of Beef. Section 1, Chapter 1. In: Teagasc
Beef Manual. https://www.teagasc.ie/media/website/publications/2016/Beef-Manual-
Section1.pdf 65) Heery, D., O’Donoghue, C. and Ó Fathartaigh, M. (2016). Pursuing Added
Value in the Irish Agri-Food Sector: An Application of the Global Value Chain
Methodology. International Journal on Food System Dynamics, Proceedings in System
Dynamics and Innovation in Food Networks 2016, pp. 161-179.
66) Hennessy, T. (2017). Climate change is an issue for every link in the food chains - not
just farmers (online at Independent, November 17, 2017)
https://www.independent.ie/business/farming/agri-business/climate-change-is-an-issue-
for-every-link-in-the-food-chain-not-just-farmers-36315745.html
67) Herrero, M., Havlik, P., Valin, H., Notenbaert, A., Rufino, M. C.,
Thornton, P. K., Blümmel, M., Weiss, F., Grace, D. and Obersteiner, M.
(2013). Biomass use, production, feed efficiencies, and greenhouse gas emission
from global livestock systems. Supporting information. Proceedings of the National
Academy of Sciences of the United States of America, December 24, 2013, Vol. 110, No.
52, p. 20888-20893.
http://www.pnas.org/content/pnas/suppl/2013/12/12/1308149110.DCSupplemental/sa
pp.pdf
68) Hess, T., Chatterton, J. and Williams, A. (2012). The Water Footprint of Irish
Meat and Dairy Products.
https://dspace.lib.cranfield.ac.uk/bitstream/handle/1826/8756/The_Water_Footprint_
of_Irish_Meat_and_Dairy_Products-2012.pdf?sequence=3&isAllowed=y
69) Horrigan, L., Lawrence, R. S. and Walker, P. (2002). How Sustainable
Agriculture Can Address the Environmental and Human Health Harms of Industrial
Agriculture. Environmental Health Perspectives, 110 (5), p. 445-456.
70) Irish Cattle Breeding Federation (2017). Beef and Dairy Breed Statistics 2017.
https://www.icbf.com/wp/?page_id=313
71) Irish Farmer Monthly - IFM (2018). Review of the Irish Agri-Food Industry
2017-2018. Report. http://www.asaireland.ie/wp-content/uploads/2018/01/IFM-Agri-
Review18-LoRes.pdf
72) Kerry Public Participation Network (2018). Kerry Social Farming Project.
https://www.kerryppn.ie/communities/kerry-social-farming-project/ 73) Kronenberg, T. (2009). Construction of Regional Input-Output Tables Using
Nonsurvey Methods: The Role of Cross-Hauling. International Regional Science
Review, 32(1), p. 40-64.
The Economic and Societal Importance of the Irish Suckler Beef Sector 75
74) Lanigan, G. J. and Donnellan, T. (2018). An Analysis of Abatement Potential of
Greenhouse gas Emissions in Irish Agriculture 2021-2030. Prepared by the Teagasc
Greenhouse Working Group.
https://www.teagasc.ie/media/website/publications/2018/An-Analysis-of-Abatement-
Potential-of-Greenhouse-Gas-Emissions-in-Irish-Agriculture-2021-2030.pdf
75) Leip, A., Weiss, F., Wassenaar, T., Perez, I., Fellmann, T., Loudjani, P.,
Tubiello, F., Grandgirard, D., Monni, S. and Biala, K. (2010). Evaluation of the
livestock sector’s contribution to the EU greenhouse gas emissions (GGELS). Final report.
European Commission, Joint Research Centre.
https://ec.europa.eu/agriculture/sites/agriculture/files/external-studies/2010/livestock-
gas/full_text_en.pdf
76) Lindner, S, Legault, J and Guan, D (2013) Disaggregating the electricity sector
of China's input-output table for improved environmental life-cycle assessment.
Economic Systems Research, 25 (3). 300 - 320. ISSN 0953-5314
77) Loughrey, J., O’Donohue, C., Meredith, D., Shanahan, U. and Miller, A. C.
(2012). Report on the Impact of Cattle Farming upon the Economy of County Clare.
78) MacFeely, S. (2011). Compilation and Analysis of Integrated Regional Input-
Output Tables for NUTS 2 Regions in Ireland, PhD Thesis, University College Cork,
Ireland. https://cora.ucc.ie/handle/10468/703
79) Martin, R. (2010). Roepke Lecture in Economic Geography - Rethinking Regional
Path Dependence: Beyond Lock-in to Evolution. Economic Geography, 86, p. 1-27.
80) Martin, R., Sunley, P., Gardiner, B. and Tyler, P. (2016). How Regions React
to Recessions: Resilience and the Role of Economic Strucure. Regional Studies, 50:4,
p. 561-585.
81) Matthews, A. (2018). Implications of Brexit for food and agriculture in developing
countries. TEP Working paper No. 0318.
https://www.tcd.ie/Economics/TEP/2018/tep0318.pdf
82) Mazurek, M., Prendiville, D. J., Crowe, M. A., Veissier, I. and Earley, B.
(2010). An on-farm investigation of beef suckler herds using an animal welfare index
(AWI). BMC Veterinary Research, 6:55, p. 1-10.
83) Meat Industry Ireland (2015). Submission to Low Pay Commission.
http://www.lowpaycommission.ie/consultations/meat-industry-ireland.pdf
84) Mekonnen, M. M. and Hoekstra, A. Y. (2010). The Green, Blue and Grey Water
Footprint of Farm Animals and Animal Products. Report, Volume 1, Research Report
Series No. 48. UNESCO-IHE Institute for Water Education.
http://waterfootprint.org/media/downloads/Report-48-WaterFootprint-
AnimalProducts-Vol1_1.pdf
85) Meredith, D. (2011). Recent Trends in Employment and Unemployment: Assessing the
impact of the economic downturn on part-time farmers. REDP Working Paper Series 11-
WP-RE-03.
https://www.researchgate.net/publication/244484261_Recent_Trends_in_Employme
nt_and_Unemployment_Assessing_the_impact_of_the_economic_downturn_on_pa
rt-time_farmers
86) Miller, A. C., Matthews, A., Donnellan, T. and O’Donoghue, C. (2014). The
employment effects of Food Harvest 2020 in Ireland. Irish Journal of Agricultural and Food Research, 53 (2), p. 149-169.
The Economic and Societal Importance of the Irish Suckler Beef Sector 76
87) Moloney, A. and Allen, P. (2016). Quality beef for the consumer. In: Teagasc
Beef Manual. Section 1, Chapter 5.
https://www.teagasc.ie/media/website/publications/2016/Beef-Manual-Section1.pdf
88) Morrow-Tesch, J. (2000). Farm Animal Behavior Becoming More Critical to the
Bottom Line. Paper presented at Beltsville Symposium, Beltsville, Maryland.
89) Nielsen (2017). When it Comes to Protein, North Americans still Flock to Meat. Online.
http://www.nielsen.com/us/en/insights/news/2017/when-it-comes-to-protein-
americans-still-flock-to-meat.print.html
90) O’Brien, D. (2017). GHG emissions, Beef carbon footprint and other environmental
issues. Teagasc, Moorepark, presentation.
https://www.slideshare.net/idele_institut_de_l_elevage/cop23-life-beef-icarbon-eu-
side-events-ghg-emissions-beef-carbon-footprint-and-other-environmental-issues
91) O’Connell, J. and Phelan, J. (2011). The Importance of Agriculture and the Food
industry to the Irish Economy. Report commissioned by the Irish Farmers’ Association.
https://www.ucd.ie/t4cms/UCD%20Project%20JP-JOC.pdf
92) O’Connor, D. and Keane, M. (2014). Future Expansion of the Dairy Industry in Cork: Economic benefits and Infrastructural Requirements. Report prepared for Cork
County Council.
http://www.cit.ie/contentfiles/PDFs/Publications/Dairy%20Industry_Infrastructure%20
Report%20Dec%202014%20w.pdf
93) Organisation for Economic Co-operation and Development - OECD
(2018). Meat consumption. https://data.oecd.org/agroutput/meat-consumption.htm
94) Palaskas, T., Psycharis, Y., Rovolis, A. and Stoforos, C. (2015). The
Asymmetrical Impact of the Economic Crisis on Unemployment and Welfare in
Greek Urban Economies. Journal of Economic Geography, 15 (5), p. 973 - 1007.
95) Renwick, A. (2013). The Importance of the Cattle and Sheep Sectors to the Irish
Economy. University College Dublin.
96) Richards, K. G., Jahangir, M. M. R., Drennan, M., Lenehan, J.J. and
Connolly, J. (2015). Effect of an agri-environmental measure on nitrate leaching
from a beef farming system in Ireland. Agriculture, Ecosystems and Environment, 202, p.
17-24.
97) Riordan, B. (2008). The Net Contribution of the Agri-Food Sector to the Inflow of Funds
into Ireland: a New Estimate. A report commissioned by the Department of
Agriculture, Fisheries and Food.
https://www.agriculture.gov.ie/media/migration/publications/2008/NetContributionof
Agri-food2Funds_NewEstimate.pdf
98) Rural Ireland 2025 (2005). Joint publication NUI Maynooth, University College
Dublin and Teagasc.
http://www.coford.ie/media/coford/content/publications/projectreports/Foresight.pdf
99) SafeFood (2008). A Review of the Beef Food Chain. Report.
http://www.safefood.eu/SafeFood/media/SafeFoodLibrary/Documents/Publications/Re
search%20Reports/Beef_CFR_3.pdf
100) Statista (2018). Share of people who follow a vegetarian diet worldwide as of 2016, by
region. https://www.statista.com/statistics/597408/vegetarian-diet-followers-
worldwide-by-region/
101) Stone Barns Center For Food & Agriculture (2017). Back to Grass: The Market Potential for U.S. Grassfed Beef. Report by Stone arns Center for Food &
Agriculture, Bonterra Partners and SLM. https://www.stonebarnscenter.org/wp-
content/uploads/2017/10/Grassfed_Full_v2.pdf
The Economic and Societal Importance of the Irish Suckler Beef Sector 77
102) Teagasc (2015). Beef production System Guidelines.
https://www.teagasc.ie/media/website/publications/2015/Beef-Production-System-
Guidelines.pdf
103) Teagasc (2016a). Sectoral Road Map: Dairying.
https://www.teagasc.ie/media/website/publications/2016/Road-map-2025-Dairy.pdf
104) Teagasc (2016b). National Farm Survey. 2016 Results.
https://www.teagasc.ie/media/website/publications/2017/NFS-2016-Final-Report.pdf
105) Teagasc (2017a). National Farm Survey: 2016 Farm Viability Report.
https://www.teagasc.ie/media/website/publications/2017/2016-NFS-Viability-
Report.pdf
106) Teagasc (2017b). National Farm Survey: Single Suckling Enterprise.
https://www.teagasc.ie/media/website/publications/2017/NFS-2016-Single-Suckling-
Factsheet.pdf
107) Teagasc (2017c). National Farm Survey: Income expenditure.
https://www.teagasc.ie/media/website/publications/2017/NFS-2016-Final-Report.pdf
108) Teagasc (2017d). Brace for Brexit. https://www.teagasc.ie/media/website/publications/2017/16-Brace-for-Brexit.pdf
109) Teagasc (2017e). Water footprint of dairy, beef ad sheep farms in Ireland.
https://www.teagasc.ie/media/website/publications/2018/6190_TechnologyUpdae_Joh
nUpton_WaterConservation.pdf
110) Teagasc (2018). Agriculture in Ireland.
https://www.teagasc.ie/rural-economy/rural-economy/agri-food-
business/agriculture-in-ireland/
111) The Irish Farmers' Association (IFA) (2018). Address by IFA President Joe Healy
to the Joint Oireachtas Committee on Agriculture, Food and the Marine. Opening
Statement,13 February 2018.
https://www.oireachtas.ie/parliament/media/committees/agriculture/Opening-
Statement,-IFA,-13-02-18.pdf
112) Thomas, I., Buckley, C. Kelly, E., Dillon, E., Lynch, J., Moran, B.,
Hennessy, T. and Murphy, P. (2017). Benchmarking nationally representative
N and P farm-gate balances and use efficiencies of Irish farms to encourage
sustainable management. 22nd International Conference on Environmental
Indicators (ICEI), 1-5 August 2017, Helsinki, Finland.
http://www.environmentalindicators.org/2017/Documents/Ian%20Thomas.pdf
113) Thorne, F., Hanrahan, K. and Kinsella, A. (2016). How competitive is Ireland
as a beef producer? Section 1, chapter 2. In: Teagasc Beef Manual.
https://www.teagasc.ie/media/website/publications/2016/Beef-Manual-Section1.pdf
114) Tourism Ireland (2018.). Stonewalls in Aran Islands.
https://www.travelchannel.com/destinations/ireland/photos/things-to-do-in
ireland#item-12
115) United States Department of Agriculture - USDA (2018a). Imported Meat
Passed for Entry in the U.S. by Country.
https://www.ams.usda.gov/mnreports/lswimpe.pdf
116) United States Department of Agriculture - USDA (2018b). Livestock and
Poultry: World Markets and Trade.
https://apps.fas.usda.gov/psdonline/circulars/livestock_poultry.pdf 117) van Berkum, S., Jongeneel, R. A., Vrolijk, H. C. J., van Leeuwen, M. G. A.
and Jager, J. H. (2016). Implications of a UK exit from the EU for British agriculture.
https://www.nfuonline.com/assets/61142
The Economic and Societal Importance of the Irish Suckler Beef Sector 78
118) Vanham, D., Mekonnen, M. M. and Hoekstra, A. Y. (2013). The water
footprint of the EU for different diets. Ecological Indicators, vol. 32, pp. 1-8.
119) Vanslembrouck, I., Van Huylenbroeck, G. and Van Meensel, J. (2005).
Impact of Agriculture on Rural Tourism: A Hedonic Pricing Approach. Journal of
Agricultural Economics, 56 (1), p. 17-30.
120) Woiwode, R. H. (2011). Standards for the Humane Handling and Care of
Animals. An Overview of Four Certification Programs. AH Conference. Colorado
State University.
https://www.meatinstitute.org/index.php?ht=a/GetDocumentAction/i/73511
121) World Animal Protection (2014). United States of America - Animal
Protection Index 2014 Ranking.
https://api.worldanimalprotection.org/sites/default/files/api_us_report.pdf
122) World Resources Institute (2005). Millennium Ecosystem Assessment. Ecosystems
and Human Well-being: Synthesis.
https://www.millenniumassessment.org/documents/document.356.aspx.pdf
The Economic and Societal Importance of the Irish Suckler Beef Sector 79
Appendices
Technical Appendix 1: Regionalisation of Multipliers
Multipliers are derived from input-output tables, which essentially present money flows to
and from businesses, households and governments within a national or regional economy.
Following Carey and Johnson (2017), if we assume n business sectors, we can represent input
output tables mathematically as:
(𝑰 − 𝑨)𝒙 = 𝒇
And if we solve for x we are left with:
𝒙 = (𝑰 − 𝑨)−𝟏𝒇
Where we can define each of the components as follows:
x is a vector of gross output
A is an n*n input-output coefficient matrix
I is the identity matrix (1 on the diagonal and 0 elsewhere)
(𝐼 − 𝐴)−1 is the ‘Leontief’ inverse of a n*n square matrix
f is a vector of final demand
The Leontief inverse (𝐼 − 𝐴)−1 shows the change in output in each sector due to a unit change
in final demand: this is the multiplier effects. The direct multipliers show the impact of a change
in demand in sector n on output in sector n. The indirect multipliers show the impact of a
change in demand in sector n on output in all other sectors. The total multiplier is the sum of
the direct and indirect multiplier.
Normally these multipliers are calculated at a national level due to input-output tables being
provided only at that national level. However, it is possible to provide approximations of
regional multipliers, using one of a series of alternative techniques. FOr this study, we followed
the non-survey statistical approach detailed by Kronenberg (2009) on the use of ‘simple’
location quotients (LQs) to regionalise multipliers. Carey and Johnson (2017) note that the
different developments of the LQ approach do not provide an advance on the traditional
simple LQ approach.
The Economic and Societal Importance of the Irish Suckler Beef Sector 80
The LQ approach assumes that each regional input-output coefficient is related to its national
counterpart in the following way:
𝒂𝒊,𝒋𝑹 = 𝒕𝒊,𝒋𝒂𝒊,𝒋
𝑵
Where 𝑎𝑖,𝑗𝑅 is the regional input-output coefficients, 𝑎𝑖,𝑗
𝑁 is the national input-output
coefficient, and 𝑡𝑖,𝑗 is referred to as the ‘trading coefficient’. There are various ways of
estimating 𝑡𝑖,𝑗 and the simple LQ method does so by calculating a LQ for each industry i and
using it to proxy for 𝑡𝑖,𝑗 . We define the LQ as:
𝑳𝑸𝒊 =𝑳𝒊𝑹/𝑳𝑹
𝑳𝒊𝑵/𝑳𝑵
Where each term is defined as follows:
𝐿𝑖𝑅 is employment in region R in sector i
𝐿𝑅 is employment in region R
𝐿𝑖𝑁 is employment in the nation in sector i
𝐿𝑁 is employment in the nation
As noted by Kronenberg (2009), “[a]ssuming equal labor productivity, 𝐿𝑄𝑖 indicates whether industry i is ‘‘overrepresented’’ or ‘‘underrepresented” within a region. If the LQ is less than
one then it is assumed that local production is not sufficient to supply local demand, which
implies that within the region no exports are possible and imports are needed. In this instance
the 𝐿𝑄𝑖 value is substituted for the 𝑡𝑖,𝑗 . However, if the 𝐿𝑄𝑖 term is greater than one this
implies excess supply within a region and the region can export some of the supply from
industry i. In this case we assume that 𝑡𝑖,𝑗 is equal to one. In this way we can generate a
matrix containing the regional input-output coefficients, given as A. The end result is the
possibility to derive regional multipliers based on estimates of regional input output
coefficients using employment to disaggregate these regionally.
The Economic and Societal Importance of the Irish Suckler Beef Sector 81
Technical Appendix 2: Calculation of Resilience Indicators
We focus on two elements of resilience; resistance and recovery, relying on Martin et al.
(2016), Martin (2010) and Palaskas et al. (2015). Resistance is the ability of a regional economy
to resist the initial impact of the crisis while recovery is the ability to recover following the
shock (Han and Goetz, 2013). Following, broadly, Han and Goetz (2013) and Martin et al.
(2016), our indices for resistance and recovery are given by equations (1) and (2) respectively.
𝑹𝒆𝒔𝒊𝒔𝒊 =(𝚫𝐲𝒊
𝒄)−(𝚫�̂�𝒊𝒄)
𝐄𝒊𝟐𝟎𝟎𝟔 (1)
𝑹𝒆𝒄𝒐𝒗𝒊 =(𝚫𝐲𝒊
𝒓)−(𝚫�̂�𝒊𝒓)
𝐄𝒊𝟐𝟎𝟎𝟔 (2)
In (1), is the change in employment in region i during the contraction period of the
economic crisis, and in (2) is employment change in region i during the post-crisis
recovery period. In contrast to these actual employment changes, is the expected
counterfactual employment change during contraction, and is the counterfactual change
during recovery. For both resistance and recovery, the difference between actual and
expected employment change over the periods of contraction, 2006-2011, and recovery,
2011-2016, are scaled by the level of employment in 2006. For both indices, a zero value indicates that a region’s employment changed in line with the counterfactual (based on the
national change), a negative value shows relatively weak resistance/recovery, and a positive
value indicates stronger resistance/recovery relative to the national performance.
c
iy
r
iy
ˆ c
iy
ˆ r
iy
The Economic and Societal Importance of the Irish Suckler Beef Sector 82
Technical Appendix 3: Biosector and Non-biosector Industries
In Riordan (2008), the following industries are considered:
A) Biosector
Agriculture
Forestry
Fishing
Food and beverages
Tobacco
B) Non-biosector
Mining and quarrying
Textiles
Wearing apparel
Leather and leather products
Wood and wood products (excluding furniture)
Pulp, paper and paper products
Printed matter and recorded media
Petroleum and other fuels
Chemical products and man-made fibres (including pharmaceuticals)
Rubber and plastics
Other non-metallic mineral products
Basic metals
Fabricated metal products
Machinery and equipment n.e.c.
Office machinery and computers
Electrical machinery and apparatus n.e.c.
Radio, television and communications apparatus
Medical, precision and optical instruments
Motor vehicles and trailers
Other transport equipment
Other manufactures
Recycling