Embed Size (px)
Citation preview

THE ECONOMIC AND SOCIALRESEARCH INSTITUTE
Memorandum Series No. 164.
Agricultural Planning in Ireland
Robert O’Connor
Paper given to the annual conference of the Agricultural Economics Society
of Ireland,, October 1982
December 1983 Price IR£2
Confidential: Not to be quoted
until the permission of the Author
and the Institute is obtained.

Agricultural Planning in Ireland
by
R. O’Connor
Introduetion
In his classic work "Agriculture in an Unstable :Economy" :Prof. T.W. Schultz
(1945) said that " A great part of the farm problem is likely to arise through business
fluctuations and the unbalanced expansion of the economy. Farm prices and farm incomes
are affected by the decisions and policies of workers and households, of business firms
and of government agents. The basic causes of the farm problem - the low earnings
of most farm people and the greaLunstabiltty ,of Income from farming are not,within
agriculture but elsewhere in our economy."
These views were expressed at a time when support policies for farm produce were
not widely adopted and when most farm prices were subject to all the vagaries of
the market. Since then protectionist policies for agriculture have been widely adopted
throughout the world but despite these, agricultural prices and farmers incomes can
never be fully independent of the business cycle. Even within the Common Market which
has a very highly developed system of agricultural price supports we are still liable to
get wide fluctuations from year to year. Despite intervention prices for pig meat, the
pig cycle in Europe is probably more severe than in pre - EEC days and there are many
years when producers margins are squeezed to zero. Similarly with the cattle prices.
The Cattle Crisis in 1974 was associated with the oil problem of that year and the
subsequent world depression.¯ The present difficulties of farmers are related to the
current depression and high non-farm inflation rates. Hence we must agree with Schultz
that a great part of the farm problem is likely to come from outside the farm sector, from
an area over which the farmer has no control. Agricultural planners should therefore keep
this in mind and not be too disappointed if their projections do not always work out, if
problems arise which they have not forseen or if despite carefully thought-out policies
growth is erratic or non-existant. The fluctuations in the business cycle are likely to
dominate all farm plans at least in the short-term. We may well ask therefore, why do
we go to the trouble of planning at all ?
Schultz T.W. 1945 Agriculture in and Unstable Economy, McGraw Hill Book Co. Inc.New York.

Why do we plan
We make plans in order to bring a ~ertain amount of order into the chaos which is
all round us. If we adopt a "laissez faire" (leave it alone) attitude the economic system
will work automatically but the results may not be what the Government desires either
economically or socially. The price system will tend to allocate resources in the most
efficient way possible but this may have very undesirable side effects particularly for
the poorer members of society who do not have the resources available to benefit from the
system. Under this type of free enterprise regime the rich tend to get richer and the
poor poorer. This breeds dissatisfaction and discontent and may in the ultimate lead to
civil strife. We have had war in Ireland about land division in previous centuries.
Planning attempts to create more egalatarian Conditions whereby the trade offs
between efficienoy, (income growth) equity, (income distribution) and stability in price
levels are balanced in some acceptable way. Some economists would argue that in a
democratic society we cannot do this; that powerful market forces will prevail regardless,
and that we are only deluding ourselves if we think that by indicative planning we can
control these forces at work. According to these commentators the planner is as pathetic
as King Canute of old who stood with a saucepan trying to keep back the inrushing tide.
I’m afraid I do not hold with this school of economists. I believe that governments,
through sensible monetary and fiscal policies, can control to some extent the wild market
forces which prevail. Enlightened taxatioa and social welfare policies can be used to
redistribute income from the richer to the poorer sections of society; life can be made
easier for the old, the infirm and for those who cannot cope. In the long run, of course,
the meritocracy will win out but despite this the less able can always be helped. I believe
that planning should be used to control the free market system, and that it can work,
if not perfectly, at least to some reasonable extent.
How do we plan at the macro level
Normally a macro agricultural plan is one element in an overall national
plan but it is possible to prepare an agricultural plan on its own with0ut fitting it into
the wider framework. If this is to be an effective exercise however the government
must be prepared to accept the targets set and implement whatever policies are suggested
for the implementation of the plan. But whether or not the agricultural plan is part of a

-- 3 --
national plan, the planning m’ethod is the same.
In making an agricultural plan two procedures are possible. The planner can set
an overall growth target for the sector based usually on past trends, and then arrange
the growth of the individual enterprises to ~)roduce this target. He can also start at
the other end by reviewing the major enterprises, setting targets for these and aggregating
these targets to give the seotoral target. Usually the experienced planner does both
these things simultaneously. In setting targets for the individual enterprises he has in
mind an overall growth target and he arranges the pieces to give him the desired whole.
This may appear like cheating but one could be very far out if one added up
individual projections without taking into account an overall eontraint. Normally growth
in the Agricultural Sector in all developed countries is slow - around2 per cent per annum
in volume of gross output. There is little point therefore in specifying a very much
higher rate; it is not likely to be achieved. Indeed unless some exceptional technical or
economic development is expected to take place during the planning period the overall
growth rate should be based fairly closely on historical trends. There is no~ point in
being too optimistic, though there will be political pressure on the plm~ners to
set unrealistically high trends. Politicians like to be optimistic but they can also be
quite devastating if their optimism is not shown to be correct. There are examples of
statisticians being liquidated because they showed that targets had not been met.
As a preclude to planning, the individual enterprises should be reviewed carefully
to see what has been happening in these areas in recent years. Since it is the individual
enterprises which give the overall growth the constraints or~ these are very important.
The constraints can be technical or economic and a vital part of the exercise is to
examine these constraints in order to see if they can be alleviated. For example on the
technical side a major constraint may be plant or animal disease, soil erosion, water
logging, drought conditions, deficient machines etc. These deficiencies will come to light
in the reviews and suggestions for their alleviation should be included in the plan. In
making these suggestions however some kind of a cost/benefit analysis should be undertaken
to determine if the removal of a constraint can be recommended on economic grounds, i.e.,
can large land reclamation, ch’ainage, irrigation, or disease eradication proposals be
justified. Indeed in some cases the whole plan may consist of a cost/rbenefit analysis of
some binding constraint which if removed, would revolutionise the whole economy of a
country.

Theeconomic constraints are likely to be at the market end. ~?he planner must
determine where extra output will be sold and at what kind of price. Will this price be
sufficiently attractive to bring forth the desired output, and if not, can price supports be
introduced 7 It is here that the agricultural plan impinges very much on national policy
issues and for that reason some fairly senior member of the Ministry of Finance should
always be included in the planning team. He will give the other members some idea
of the finances which may be available to implement the plan while these members in
turn may be able to convince the finance person that certain expenditures are worthwhile,
if not from an economic, at least from a social point of view.
The important point to be kept in mind is that in setting targets for the individual
enterprisesthe capacitytohandle the increased output and the marketing channels must
be specified while the policies required to achieve the targets should be enunciated in
detail. These points should all be brought together in writing up the plan and the total
policy and other costs aggregated so that both the planners and financial authorities can
compare the projected returns with the costs.
Brief Review of Agricultural :Planning in Ireland
First Programme for Economic Expansion
The first programme for economic expansion (Whitaker 1958~has been rightly
hailed as a major departure in Irish planning. At the time of its introduction in the late
1950’s modern planning theories were just beginning to be articulated and for that reason
it is not surprising that the planning ideas put forward were not very sophisticated. In
fact the programme while devoting considerable attention to the analyses of past policies
did not have a formal planning methodology behind it. It envisaged an annual increase in
GNP at constant prices of two per cent for the coming five years but did not give a break
down of the figures between different sectors of the economy.
The main objective of the agricultural part of the programme was to obtain a
substantial increase in cattle output, since beef was the most important agricultural
product in the country, and one which could be sold on export markets without a subsidy.
The increased output was to be obtained through a dynamic grassland policy, brought about
by increased use of subsidised fertilisers. Except for the latter, little attention was paid
Whitaker, T.K. 1958 Economic Development, Dublin~ Stationery Office.
........................... -5 ~- ..................
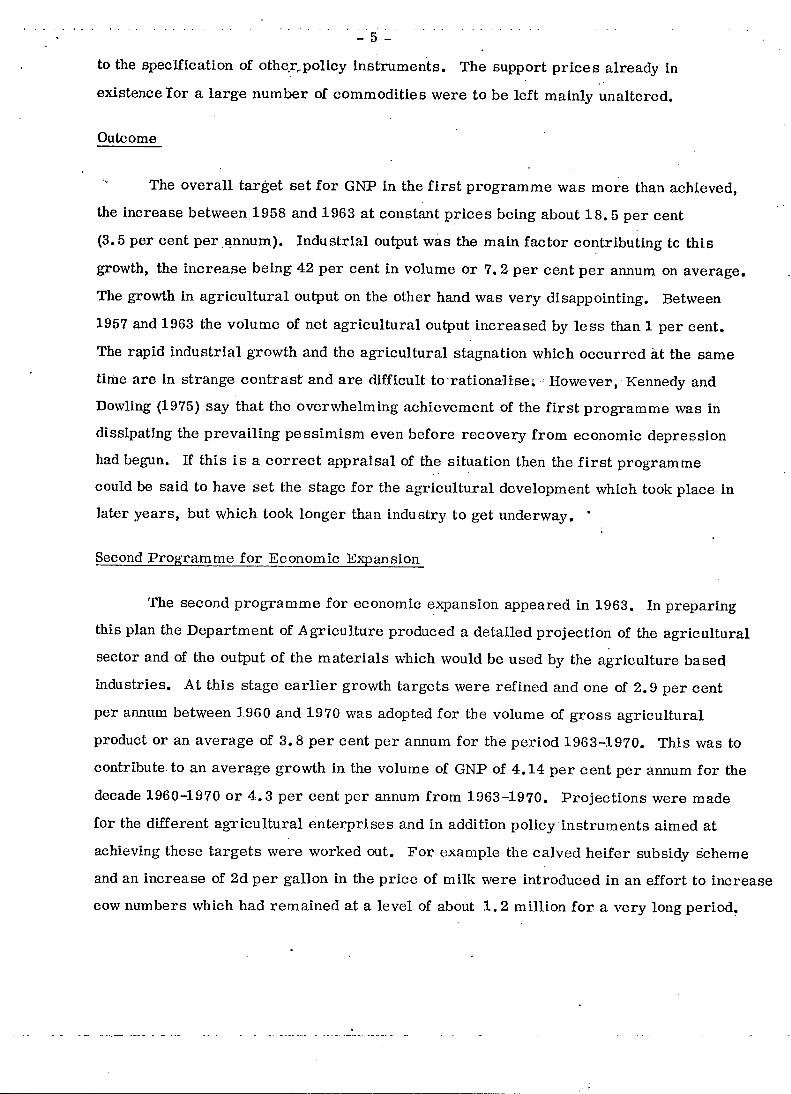
to the specification of othe.r.policy Instruments. The support prices already in
existence tor a large number of commodities were to be left mainly unaltered.
Outcome
The overall target set for GN-P in the first programme was more than achieved,
the increase between 1958 and 1963 at constant prices being about 18.5 per cent
(3.5 per cent per annum). Industrial output was the main factor contributing tc this
growth, the increase being 42 per cent in volume or 7.2 per cent per annum on average.
The growth in agricultural output on the other hand was very disappointing. Between
1957 and 1963 the volume of net agricultural output increased by less than 1 per cent.
The rapid industrial growth and the agricultural stagnation which occurred at the same
time are in strange contrast and are difficult’ to’rationa, lise~, However,: Kennedy and
Dowling (1975) say that the overwhelming achievement of the first programme was in
dissipating the prevailing pessimism even before recovery from economic depression
had begun. If this is a correct appraisal of the situation then the first programme
could be said to have set the stage for the agricultural development which took place in
later years, but which took longer than industry to get underway.
Second Programme for Economic Expansion
The second programme for economic expansion appeared in 1963. In preparing
this plan the Department of Agriculture produced a detailed projection of the agricultural
sector and of the output of the materials which would be used by the agriculture based
industries. At this stage earlier growth targets were refined and one of 2.9 per cent
per annum between 1960 and 1970 was adopted for the volume of gross agricultural
product or an average of 3.8 per cent per annum for the period 1963-1970. This was to
contribute to an average growth in the volume of GNP of 4.14 per cent per annum for the
decade 1960-1970 or 4.3 per cent per annum from 1963-1970. :Projections were made
for the different agricultural enterprises and in addition policy instruments aimed at
achieving these targets were worked out. For example the calved heifer subsidy scheme
and an increase of 2d per gallon in the price of milk were introduced in an effort to increase
cow numbers which had remained at a level of about 1.2 million for a very long period.
". -- 6 ~ ...................
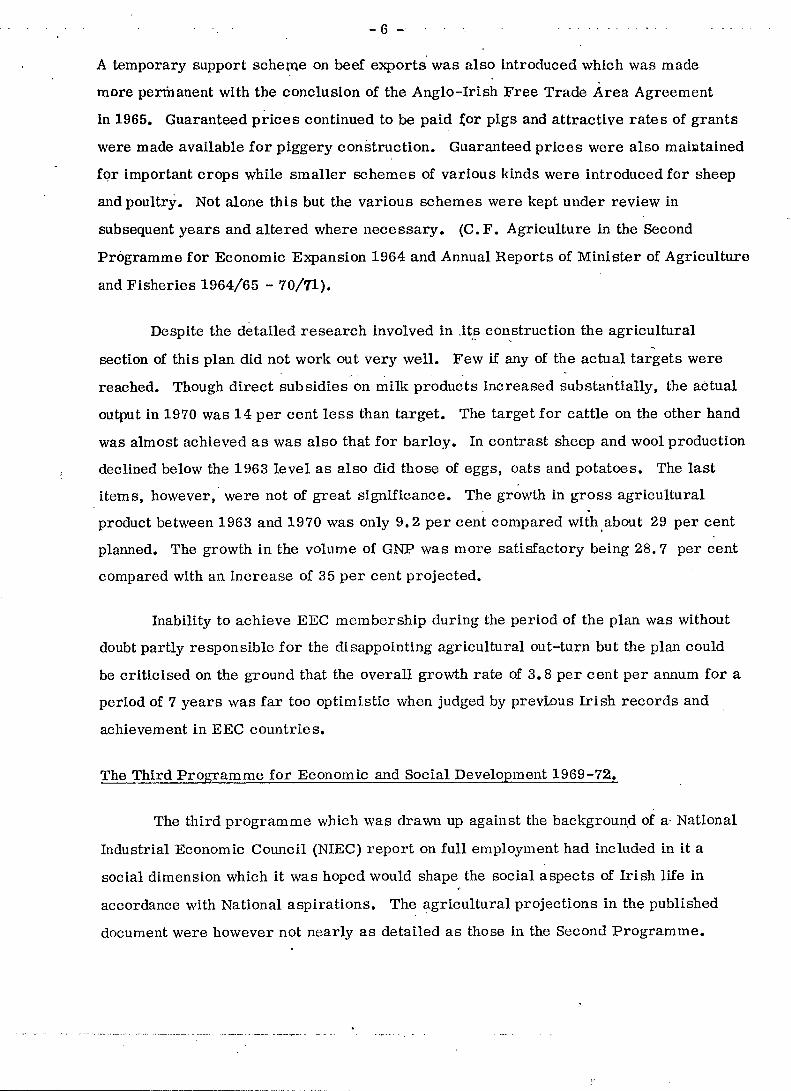
A temporary support sche[ae on beef exports was also introduced which was made
more perrhanent with the conclusion of the Anglo-Irish Free Trade ,~rea Agreement
In 1965. Guaranteed prices continued to be paid for pigs and attractive rates of grants
were made available for piggery construction. Guaranteed prices were also maintained
for important crops while smaller schemes of various kinds were introduced for sheep
and poultry. Not alone this but the various schemes were kept under review in
subsequent years and altered where necessary. (C. F. Agriculture in the Second
Prbgramme for Economic Expansion 1964 and Annual Reports of Minister of Agriculture
and Fisheries 1964/65 - 70/TI).
Despite the detailed research involved in ,its construction the agricultural
section of this plan did not work out very well. Few if any of the actual targets were
reached. Though direct subsidies 0n milk products increased substantially, the actual
output in 1970 was 14 per cent less than target. The target for cattle on the other hand
was almost achieved as was also that for barley. In contrast sheep and wool production
declined below the 1963 level as also did those of eggs, oats and potatoes. The last
items, however, were not of great significance. The growth in gross agricultural
product between 1963 and 1970 was only 9.2 per cent compared with about 29 per cent
planned. The growth in the volume of GN:P was more satisfactory being 28.7 per cent
compared with an increase of 35 per cent projected.
Inability to achieve EEC membership during the period of the plan was without
doubt partly responsible for the disappointing agricultural out-turn but the plan could
be criticised on the ground that the overall growth rate of 3.8 per cent per annum for a
period of 7 years was far too optimistic when judged by prev[gus Irish records and
achievement in EEC countries.
The Third Programme for Economic and Social Development 1969-72.
The third programme which was drawn up against the background of a- National
Industrial Economic Council (NIEC) report on full employment had included in it a
social dimension which it was hoped would shape the social aspects of Irish life in
accordance with National aspirations. The agricultural projections in the published
document were however not nearly as detailed as those in the Second :Programme.

....................... ,7_ ..................
As ff learning a lesson from the first and second programmers those drafting
the third programme were far more modest in their outlook for agriculture. The
average annual rate of growth in gross agricultural product aimed at was 1~- per cent
or just over 7 per cent for the whole period. This was estimated as being equiv~tlent
to an increase of 11 per cent in the volume of gross agricultural output over the period
or 2.7 per cent per annum. The volume of GNP was projected to increase by 17 per
cent over the four year period while the accompanying rate of increase in employment
(16,000) was expected to reduce emigration to an average annual level of 12,000-13,000.
The programme stated that the commodities envisaged as likely to make the greatest
contribution to growth were cattle and pigs; an expansion in sheep and wool output
was also envisaged but prospects for expansion in the output of poultry, eggs and crops
¯ were not considered as being very¯bright. No targets however were set for the different
enterprises and we cannot therefore ..make detailed comparisons of achievements with
projections.
Production Incentives
In May 1968 it was announced that the government intended to terminate the
Calved Heifer scheme on 30 June 1969. To replace this the gover~ment introduced a
new Beef Cattle incentive scheme, the purpose of which was to expand beef production
without at the same time increasing commercial milk production. The scheme which
came into operation on the 1 April 1969 applied to herds not engaged in the commercial
production of milk and provided for the payment of an annual grant of £8 for each calved
cow in excess, of two in such.herds. The scheme was designed.to offer a definite
incentive for increased beef production vis-a-vis milk on which a state subsidy of over
£25 million was paid in 1968/69.
Other incentives for the cattle sector were an improvement in artificial .
insemination service, grants for the improvement of meat export premises and increased
emphasis by An Foras Taluntais on research in relation to beef, and cattle feeding.
The Minister for Agriculture also announced the establishment of a livestock and meat
export promotional board (CBF) which would be concerned with the export of cattle,
sheep, beef, mutton and lamb and take over responsibilities for promotional activities
in connection with all meat export marketing.
On the dairying side emphasis was placed on the improvement of milk quality and
the rationalisation of the milk processing sector through amalgamation of the smaller

co-operatives !nto larger units. Heavy State subsidation of milk quality production
was also to continue but through rather a controversial two tier price system whereby
higher prices per gallon were paid to smaller rather than larger producers.
Guaranteed minimum prices for pigs were increased and a farrowed sow scheme
which had been in operation from 1966 to 1968 was replaced by a scheme applicable to
the westerr~ counties only..4 new scheme was also introduced designed to encourage
the establishment of large scale pig fattening units. It replaced a previous system of
guaranteed loans, by the provision of outright grants. On the pig marketing side grading
of pigs was to be brought under review and incentives were to be made available for the
establishment of factories for the production of diversified pig meat products. Various
other grants and incentives were introduced also but those listed above are the more
important.
Outcome of the Third Programme
The overall targets aimed at in the third programme were ~ore than achieved.
Between 1968 and 1972 gross agricultural product increased by 1~. 5 per cent as
against 7 per cent planned while gross agricultural output increased by 13.6 per cent
as against 11 per cent planned. There were also substantial increases in cow and
cattle numbers, but sheep numbers declined. Pigs also increased in the first two years
but then started to decline in the usual cyclical manner. The barley acreage also
increased but total tillage declined.
The increase in the overall growth rate was no doubt influenced by our impending
entry to the EEC. Agricultural prices rose considerably over the period and there was
a general air of optimism among farmers. It was also a boom period for business
generally. The volume of GNP rose by 18.5 per cent between 1969 and 1972 compared
with a projected expansion of 17per cent.
The Accession of Ireland to the EEC
When the negotiations for Ireland’s accession to the EEC were nearing completion,
the Government issued a white paper. (The Accession Of Ireland to the European
Communities January 1972) explaining the outcome of the negotiations, the terms agreed
and the Government’s assessment of these terms.
On the agricultural front the volume of gross agricultural output was projected to
increases by one third between 1970 and 1978 and it was estimated that this rise together
with the movement to :EEC prices could mean a doubling of farm incomes at 1970/71
EEC prices, over the same period. It was expected that cattle, beef, milk and dairy
products generally would account for the major part of the agricultural expansion but
some increase in sheep and pig outputs were also expected. The acreage under tillage
was considered unlikely to change appreciably with an increase in barley and some fall
in wheat.
The annual growth rate in the output of manufacturing industry was estimated
to average 8½ per cent per annum compared with a rate of 6½ per cent in the 1960’ s.
The overall national growth in volume of GNP was estimated to average nearly 5 per
cent per annum.
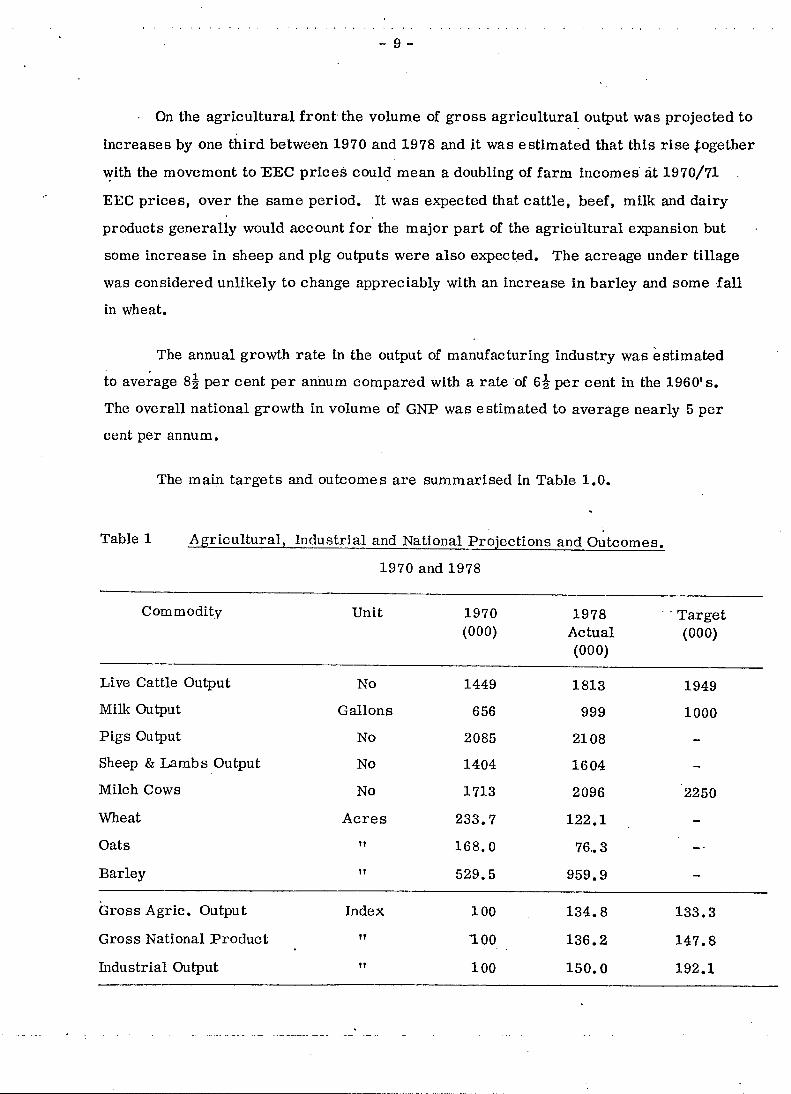
The main targets and outcomes are summarised in Table 1.0.
Table 1 Agricultural, Industrial and National Proiections and Outcomes.
1970 and 1978
Commodity Unit 1970 1978(000) Actual
(ooo)
¯ " Target
(000)
Live Cattle Output No 1449 1813
Milk Output Gallons 656 999
Pigs Output No 2085 2108
Sheep & Lambs Output No 1404 1604
Milch Cows No 1713 2096
Wheat Acres 233.7 122.1
Oats " 168.0 76.3
Barley " 529.5 959.9
1949
1000
m
2250
Gross Agric. Output
Gross National :Product
Industrial Output
index
I1
I00
"tO0
100
134.8
136.2
150.0
133.3
147.8
192.1

.......... ¯ kl0- .............
This table,shows that the vblume of gross agricultural output turned out almost as
projected. Looking at the different enterprises we see that the output of live cattle
while increasing substantially on the 1970 level fell somewhab short of target. Similarly
with the number of milch cows. The shortfall in these enterprises was no doubt dUe to
the severe cattle crisis in 1974,though it could also be argued that the crisis was
exacerbated by the rapid expansion in cattle numbers which had taken place in
anticipation of EEC entry. Milk output reached target over the period due to both increases
in dairy cow numbers and expansion in milk yields. Output of sheep, lambs, and pigs
also increased somewhat but the acreage under wheat and oats declined. The acreage
under barley on the other hand increased substantially. There was also a considerable
expansion on manufacturing industry (50%) though not to the extent expected (92%). GNP
also fell short of target, the growth being 36 per.cent as,against about 48 per cent planned.
This shortfall howaver was not surprising when account is taken of the 1973 oil crisis and
the subsequent depression generated.
Economic and Social Development 1976 - 1980-"
This green paper which was produced in September 1976 reviewed the present
economic situation and its causes, stressing in particular the world wide recession and
inflation following the oil crisis in 1973. FollowI ng this review the paper attempted to
forsee the situation towards which the economy would tend (in the light of expected
international developments) ff action were not taken to redirect it. From this
examination it was concluded that uncontrolled movement would,lead,to continuinghigh
inflation, mounting balance of payments deficits, drastic cuts in public expenditure,
an unacceptable level of taxation, an impossible borrowing requirement and gro~Sng
unemployment. The economy could not for long be allowed to move towards this situation¯
and means were therefore suggested aimed at avoiding such unacceptable prospects.
The first priority in this situation was to keep the economy competitive. This
meant getting the rate of increase in manufacturing wage costs down to about 4½ per
cent a year which would bring price rises in Ireland down to the target rates of competing
countries. :Policy measures aimed at reducing the rate of inflation were also discussed.
On the assumption that cost competitiveness could be maintained and that policies
could be re-oriented to support increased investment, the growth potential of the
economy was assessed and the results incorporated into a projection of reasonable growth

-11"
for the period up to 1980. It was projected that gross output in manufacturing industry
could expand at an average annual rate of some 9 per cent over the period 1976-1980.
If this growth rate could be obtained employment in manufacturing industry could rise
by about 50,000 over the period.
A detailed assessment of the likely growth in the output for individual commodities
showed that it would be possible to achieve a growth rate of 6 per cent a year in gross
agricultural output in 1977-1980 compared with 3.2 per cent in the period 1971-1976.
Growth at this rate would require a substantial increase in the put of farm materials
particularly of fertilisers and feed, so that the net result would be a growth rate of 4.7
per cent a year in the seetoral product of agriculture. The agricultural labour force was
expected to decline over the period to 198Oby3500 a year which wouldbe well:under half
the rate in the 1960’s.
A number of measures were suggested to achieve these projections. Among them
were agreement with the Social partners on wdge restraipt, a reorganisation of the tax
rate to reduce the liability on business and certain individuals, expansion of training
and retaining programmes, the establishment of an Industrial Development Corporation
to exercise a supervisory and co-ordinating role over the activities of existing
promotional agencies, measures to promote productivity by associating employees more
closely with the enterprises such as worker participation schemes etc.
On the agricultural front the paper mentioned more productive use of grasslands,
increased milk yields, an expansion of tillage and activity by the Government to influence
the EEC policies to the advantage of Irish Farmers. Beyond this no specific policy
instruments were mentioned.
The projections in the green paper and estimated outcomes are summarised in
Table 2 which shows that the industry and service targets for employment were realised
whereas the industrial,production m~d GNP targets weI:e not. Agricultural output and
employment also fell below the projected levels.

- 12-
Table. 2: Agricultural Indu strial and National. Projections and Outcome s
(Where Available) 1977-1980
Item
input Output or Number
1980
1976 Actual Target
Gross Agricultural Output
Output of Manufacturing Industry
Gross Domestic Product
Employment in
Agricultural Forestry Fishing .............
Industry
Service s
Index 1 O0 115 126
" 100 122 141
,, 100 117 126
No 242 ~ 220 228
" 304 372 359
" 488 571 508
Total ,, -" 1034 1163 1095
Other Government Development Programmes
Since 1976 there have been three further White Papers on National Development.
The first, National Development 1977-1980, set targets similar to those for the 1976-
1980 programme with, of course, the same results. Outcomes fell well short of targets.
Policies in this paper not mentioned in previous programmes were the establishment of
a Land Development Authority which would be responsible for structural reform, and
the encouragement of long term leasing to assist young farmers in acquiring land. The
second Whi~te Paper was entitled Programme for National Development 1978-1981. This
made very slight revisions to the 1977-1980 Programme and set sectoral targets for increase
employment of 25,000 per annum and GNP of 6 per cent per annum for the period 1979-
1981. As a result of the depression these targets have not been realised and there is little
point in discussing them further. The third White Paper "Investment in N~tional
Development 1979-1983" set a target of 3-4 per cent per annum for gross Agricultural
Output, a target of 6 per cent per annum for crop output mainly barley, and a gro~h rate
of 3 per cent per annum for livestock numbers. Again, because of the depression these
targets are unlikely to be achieved.

¯ .. . . .....
13
The ACO~ Programme 1981-1986
All the programmes discussed above were prepared for the Government by
the Civil Service, sometimes, though n¢Jt always, in consultation with outside experts.
A departure from this procedure which is worthy of recording was made in the case
of the ACOT programme.
When ACOT was set up as a semi-state organisation in 1980 it was asked by
the Taoiseach to prepare a national agricultural programme. This innovation had
certain merits. The advisory service would have a more positive say than heretofore
in the planning exercise, new points of view could be put forward and it could be argued
that if advisors were associated¯with.the programme £hey wouldbe very interested in its
implementation.
The disadvantage of such an approach are, of course, obvious. The programme
would have to be approved by both the Civil Service and the Government and if either
felt in any way hostile or disapproved of the findings the chances of implementation
would be remote.
The procedure adopted in preparing the ACOT programme was as follows:-
(1) An expert steering group of ten people was appointedby the Council
of ACOT to prepare the report. This group which was chaired by Dr. J.
Callaghan of ACOT consisted of people from the Department of Agriculture,
CSO, ACOT, AFT, ICOS, Bord Bainne, UCD and ESRI. These members
were selected on the basis of their own expertise and not as representatives
of their organisations.
(2) The expert steering group in turn set up a number of working groups to
prepare reports on the different commodities and sectors based on terms of
reference supplied by the steering group. Twelve such groups were established
for the following commodities or sectors:- cattle/beef, dairying, cereals,
horticulture/tillage, sheep, pigs, poultry, horses, farm development schemes,
The Common Agricultural :Policy, land use, and services for agriculture.
Each group submitted a report to the steering committee.
(3) When the commodity and other reports were received they were reviewed
by the steering group which then prepared the programme on the basis of these

- 14-
papers. The programme consisted of a table showing current agricultural
outputs and expenditure, projections for 1986 and short reviews of the various
sectors, together with policy recommendations. An Appendix was included
¯ giving a brief cost/benefit analysis of the policies proposed.
It might be mentioned that in the course of preparing the final reports two
preliminary reports were submitted to the Government outlining the problems then
facing farmers and making suggestions for their alleviation. Most of these suggestions
were adopted by the Government. Unfortunately the final report was not published and
for that reason I give as an AppendLx to this paper the table of projections given in it.
As can be seen Gross Agricultural Output was projected to increase by 2.1per cent
per annum between 1980 and 1986 and income arising by 2.4 per cent per annum. As
might be expected the bulk of the increase, if it comes about, will have to come from
cattle and milk.and the group spent considerable time in thinking of ways and means
whereby cattle production could be made less.risky and more profitable. The recommend-
ations in this regard are set forth in th~ report and need implementation if Irish
agriculture is to progress.
Though everybody might not agree with the projections, or with the policies
recommended for their attainment, the report is in many ways the most comprehensive
and best researched document on Irish agriculture yet produced. The Commodity
Committees reviewed all the available research in their areas and this knowledge
together with their own expertise ensured in depth contributions on all sectors. Copies
of the commodity reviews are available from ACOT.
It should be mentioned however that the preparation of the report was not all
smooth sailing. The exercise was begun in 1980 at a time when Irish agriculture was
undergoing one of the worst recessions since the 1930s. T.here was "gloom and doom"
on all sides and the steering group was not immune. Indeed in the early stages some
members argued that it was impossible to make forward plans in the circumstances
prevailing and suggested that the exercise be deferred until some kind of a reasonable
recovery had taken place.
As time progressed, however, conditions improved somewhat and the pressure
for postponement decreased. I mention this to indicate how the economic climate can

-15-
affect the attitude of planners. Indeed an important point raised at Some of the earlier
meetings might be discussed here, namely:- whether or not it is possible to make
realistie plans when the economic outlook is bad.
Other Plans
As mentioned above, the ACOT programme, though submitted to the Government,
was never published. Instead two further plans were prepared or are currently in
course of preparation. One is being produced in the Department of Agriculture with
the assistance of a small group of outside experts and will form part of a comprehensive
economic plan for the whole economy. I understand that thispIan lays down broad
guidelines for future agricultural policies but it does not go into much detail regarding the
different commodities.
The second plan iS being prepared by ~ representative group composed of people
from Government departments, institutions, semi-state bodies and farmers organisations.
It is expected that this will be a very comprehensive programme and considering the
constitution of the group it is hard to see how it can differ greatly from the ACOT Report.
Summary and Conclusions
In the period of the first programme, the projection for GNP was more than
fulfilled whereas there was very little movement in agricultural[output. In the period of the
second programme, the projection for GNP was not achieved and there were also
large shortfalls in GAP and GAO. In the third programme all the targets were achieved,
the out-turn for GAP being almost twice that projected. The achievement for GNP in the
EEC Accession White Paper fell far short of target due no doubt to the 1974/75 recession
but the target for GAO was just over achieved. In the final period between 1976 and
1981 both the GNP and agricultural achievements were much less than the targets.
It is difficult to draw any firm conclusions from these figures as to the success
or failure of the planners. Certainly in the early years from 1958 to 1967 the
agricultural growth rate Was very slow and it looked as if the planners who had taken a
very optimistic view, were widely off target. After this date, however, things seemed
to pick up on the agricultural front and there was a reasonable concordance between

- 16 -
target and turn-out over the next 10 years or so. Ireland’s proposed and actual
accession to EEC was mainly responsible for these favourable results; the planners’
optimism was justified.
Now that we are full members of the EEC however and the transitional price
rise period is over, it would seem that growth rates in agriculture are going to be much
lower than in the 1970-80 decade. Hence, it would appear that very optimistic
projections cannot be justified in future years. :Policy makers however should not
feel too badly about this situation. Normally agriculture is a slow growing sector in all
countries. The Irish conditions over the period 1970 to 1978 were abnormal and we
cannot hope for their continuance.

Appendix:
- 17 -
AGRICULTURAL OUTPUT EXPENSES AND PRODUCT 1980 AND 1986
VALUED AT 1980 PRICES
unit Quantity ValueProduct of ( ,ooo) %
Quantity 1980 1986 1980 1986 Change
Cattle (ooo) I, 644 1,870 593,815 644,450 8.4
MillMilk 18.2
gal.1,006 1,190 539, 612 638,000
Sheep (ooo) I, 483 I, 780 53,185 65,462 23.1
Wool Tonnes 5,893 6, 875 5,392 6, 609 22.6
Pigs (ooo) 2,166 2,500 131,463 150, 581 14.5
Horses (ooo) 12 12 8, 145 9, 000 22.8
Poultry 48, 762 59, 132 21.3
Eggs Million 450 .., 505 18,689 20, 973 12.2
Other Products 2, 032 2,200 8.3
Wheat Tonnes 239 312 21,496 28, 061 30.5
(0o9)Oats 41 4O 3,624 3,536 -2.4
Barley It 1,247 1,371 107, 031 117, 674 9.9
Oil Seed Rape l! - 15 - 3,800
Sugar Beet II 1,154 1,300 32,504 36, 616 12.7
Potatoes I! 327 313 29,233 27, 981 -4.3
Fruit & Vegetables56,455 58,650 3.9
and other crops
Turf (farmers) Tonnes 914 84O 14,179 13,031 -8.1
(ooo)
Total Gross Output i, 665,617 I, 885,756 13.2 (2.1)
Feed, Seed and Fertiliser 502, 772 580, 000 15.4
Net Output including livestock changes 1,162,845 1,305, 756 12.3 (2.0)
Expenses of Agriculture 471, 000 527, 670
Net Output less Expenses 691,845 778, 086
Plus subsidies not related to sales 48,000 75, 000
Income arising (Net Agricultural Product) 739, 845 853,086 15.3 (2.4)