Embed Size (px)
Citation preview

CONGRESS OF THE UNITED STATESCONGRESSIONAL BUDGET OFFICE FEBRUARY 1988
The Economic and Budget Outlook:Fiscal Years 1989-1993
A Report to theSenate and House Committeeson the Budget—Part I
As Required by Public Law 93-344
1988 ANNUAL REPORT

THE ECONOMIC AND BUDGET OUTLOOK:
FISCAL YEARS 1989 -1993
The Congress of the United StatesCongressional Budget Office
For sale by the Superintendent of Documents, U.S. Government Printing OfficeWashington, DC 20402

NOTES
Unless otherwise indicated, all years referred to in Chapter I are calendaryears and all years in Chapter II are fiscal years.
Unemployment rates throughout the report are calculated on the basis of thecivilian labor force.
Details in the text and tables of this report may not add to totals because ofrounding.
Figures showing periods of recession (indicated by a shaded area) reflect thepeak (P) and trough (T) of the recession.
The Balanced Budget and Emergency Deficit Control Act of 1985 (popularlyknown as Gramm-Rudman-Hollings) is also referred to in this volume morebriefly as the Balanced Budget Act.

PREFACE
This volume is one of a series of reports on the state of the economy and the budgetissued periodically by the Congressional Budget Office (CBO). It satisfies the re-quirements of sections 202(0 and 308(c) of the Congressional Budget Act of 1974 tosubmit an annual report to the Committees on the Budget with respect to fiscalpolicy and to provide five-year baseline projections for the federal budget. In accor-dance with CBO's mandate to provide objective and impartial analysis, the reportcontains no recommendations.
Work on this report was initiated under the direction of Edward M. Gramlich,who also made valuable comments on its many drafts. Paul N. Van de Waterprepared the Summary of the report.
The analysis of the economic outlook presented in Chapter I was prepared bythe Fiscal Analysis Division under the direction of Jacob S. Dreyer, with the assis-tance of Robert Dennis, Victoria S. Farrell, George Iden, and John F. Peterson.Important contributions were made by Trevor Alleyne, Katherine Barnum, JohnCanally, Jr., Suzanne Cooper, Douglas R. Hamilton, James Kiefer, Stephen Miller,Frank S. Russek, Jr., John Sabelhaus, Matthew A. Salomon, John R. Sturrock,Stephan S. Thurman, and Bragi Valgeirsson.
The baseline outlay projections presented in Chapter II were prepared by thestaff of the Budget Analysis Division, under the supervision of James L. Blum, C.G.Nuckols, Michael A. Miller, Charles E. Seagrave, Robert A. Sunshine, and Paul N.Van de Water. The revenue estimates were prepared by the staff of the TaxAnalysis Division, under the supervision of Rosemary D. Marcuss and Kathleen M.O'Connell. Principal staff contributors are listed in Appendix H.
Chapter II was written by Kathy A. Ruffing, with contributions by RosemaryMarcuss, Paul Christy, Paul Cullinan, Danila Girerd, Richard Krop, and KathleenO'Connell. The appendixes were written by Paul Van de Water (Appendix A),Matthew Salomon (Appendix B), Robert Dennis, (Appendix C), Paul Christy(Appendix D), Richard Krop (Appendixes E and G), and David Elkes (Appendix F).
Paul L. Houts supervised the editing and production of this report, assisted byNancy H. Brooks. Major portions were edited by Amanda Balestrieri, Francis S.Pierce, and Sherry Snyder. The authors owe special thanks to Debra BlagburnLinda Brockman, Marion Curry, Janice Johnson, Dorothy J. Kornegay, and L. RaeRoy, who typed the many drafts. Kathryn Quattrone prepared the report forpublication.
James L. BlumActing Director
February 1988

CONTENTS
SUMMARY xiii
I THE ECONOMIC OUTLOOK 1
The Policy Environment 2Fiscal Policy 14The State of the Economy 18The Forecast and Projections 37
H THE BUDGET OUTLOOK 49
The Baseline Concept 52A Closer Look at 1989 60Economic Uncertainty and
the Deficit 62Spending Projections by
Major Category 67Baseline Revenue Projections 79Baseline Credit Projections 86
APPENDIXES
A Analysis of CongressionalBudget Estimates 91
B Methodology of Medium-TermEconomic Projections 101
C Uncertainty in EconomicForecasts and Projections 107
D Baseline Concepts andAdjustments 115
E Baseline Spending and CreditProjections by Budget Function 123

vi THE ECONOMIC AND BUDGET OUTLOOK February 1988
F Federal Receipts and Expendituresin the National Income andProduct Accounts 129
G Historical Budget Data 133
H Major Contributors to the Revenueand Spending Projections 145

CONTENTS
TABLES
S-l. Baseline Deficit Projections for 1988-1990 xv
S-2. CBO Forecast for 1988 and 1989 xviii
S-3. Baseline Budget Projections andUnderlying Assumptions xxi
I-1. Net Savings and Investment Flows asa Percentage of GNP 5
1-2. Baseline Standardized-EmploymentDeficit 16
1-3. Current Indicators of Business FixedInvestment and Surveys of CapitalSpending Plans for 1988 21
1-4. State and Local GovernmentPurchases and Budget Balances 31
1-5. Nominal Wage and Compensation Ratesin the Nonfarm Business Sector 34
1-6. The CBO Forecast for 1988 and 1989 41
1-7 Medium-Term Economic Projections forCalendar Years 1990 through 1993 43
1-8. Medium-Term Economic Projections forFiscal Years 1990 through 1993 44
E-l. CBO Baseline Budget Projections 50
H-2. CBO Baseline Deficits Adjusted for TaxReform and One-Time Outlay Savings 51
H-3. CBO Baseline Projections for On-Budgetand Off-Budget Revenues and Outlays 52
II-4. Comparison of Budget Summit BaselineDeficit with CBO August 1987 Estimates 54

viii THE ECONOMIC AND BUDGET OUTLOOK February 1988
II-5. Changes in CBO Baseline EstimatesSince November 56
II-6. Effects on CBO Baseline Budget Projectionsof Selected Changes in Economic Assumptions 63
H-7. CBO Baseline Outlay Projections forMajor Spending Categories 68
II-8. CBO Baseline Outlay Projections forEntitlements and Other MandatorySpending Categories 73
H-9. Budget Financing and Debt 78
11-10. CBO Baseline Revenue Projectionsby Source 80
11-11. Revenue Effects of Major Legislation 83
n-12. CBO Baseline Credit Projections 87
A-1. Congressional Budget Resolutionsand Actual Budget Totals 92
A-2. Sources of Differences between ActualBudget Totals and First Budget ResolutionEstimates for Fiscal Years 1980-1987 94
A-3. Policy Differences between Actual BudgetTotals and First Budget ResolutionEstimates for Fiscal Years 1980-1987 95
A-4. Economic Differences between ActualBudget Totals and First Budget ResolutionEstimates for Fiscal Years 1980-1987 96
A-5. Technical Differences between ActualBudget Totals and First Budget ResolutionEstimates for Fiscal Years 1980-1987 98
B-l. Projected Potential GDP and Actual GDP 103

CONTENTS
B-2. Estimates of Potential GNP, Real PotentialGDP, NAIRU, and the Standardized-Employment Deficit 104
C-l. Forecast Errors in the Budget Year GNP 109
D-l. Calculation of Inflation Factors for theProjection of Discretionary Accounts 118
D-2. Effect of Alternative Program Assumptionson Revenue and Spending Estimates 121
E-l. CBO Baseline Budget AuthorityProjections by Function 125
E-2. CBO Baseline Outlay Projections by Function 126
E-3. CBO Baseline Credit Projections byBudget Function 127
F-1. Relationship of the Budget to theFederal Sector of the National Incomeand Product Accounts 131
F-2. Projections of Baseline Revenues andExpenditures on a National Incomeand Product Accounts Basis 132
G-l. Revenues, Outlays, Deficits, and DebtHeld by the Public, Fiscal Years 1962-1987(In billions of dollars) 136
G-2. Revenues, Outlays, Deficits, and DebtHeld by the Public, Fiscal Years 1962-1987(As a percentage of GNP) 137
G-3. Revenues by Major Source, Fiscal Years1962-1987 (In billions of dollars) 138
G-4. Revenues by Major Source, Fiscal Years1962-1987 (As a percentage of GNP) 139

x THE ECONOMIC AND BUDGET OUTLOOK February 1988
G-5. Outlays for Major Spending Categories,Fiscal Years 1962-1987(In billions of dollars) 140
G-6. Outlays for Major Spending Categories,Fiscal Years 1962-1987(Asa percentage of GNP) 141
G-7. Outlays for Entitlements and OtherMandatory Spending, Fiscal Years1962-1987 (In billions of dollars) 142
G-8. Outlays for Entitlements and OtherMandatory Spending, Fiscal Years1962-1987 (As a percentage of GNP) 143
FIGURES
S-1. Deficit Adjusted for Tax Reform Actand One-Time Savings xvi
S-2. Major Economic Assumptions xxii
1-1. Interest Rates and the Exchange Rate 4
1-2. International Comparison ofStructural Deficits 6
1-3. The Spread Between Long-Term andShort-Term Interest Rates 8
1-4. Financial Market Indicators 9
1-5. Money Growth and Targets in 1987 11
1-6. The Standardized-Employment Deficit 17
1-7. Capacity Utilization 22
1-8. Housing 25

CONTENTS xi
1-9.
1-10.
1-11.
1-12.
1-13.
1-14.
1-15.
n-i.
n-2.
BOXES
n-i.
n-2.
n-3.
Construction Cost Index andMedian Price of New Homes
The Real Trade Balance
Foreign and U.S. Import Prices
Private Nonfarm Employment
Productivity and Unit Labor Costs
Measures of Inflation
Income Shares
Outlays by Category as Shares of GNP
Revenues by Source as Shares of GNP
The Budget Summit
The Balanced Budget Reaffirmation Act
Trust Funds in the Budget
26
27
28
32
35
36
45
69
81
58
61
76


SUMMARY
In the closing days of 1987, the Congress and the Administrationnegotiated and largely put in place a plan to reduce the budget deficitfor 1988 and 1989. At the same time, in the wake of the stock marketcollapse, signs of some temporary weakness in the economy began toemerge. The Congressional Budget Office (CBO) now anticipates thatthe economy will experience a pronounced slowdown in growth inearly 1988, but will regain strength in the second half of 1988 and in1989. On the basis of CBO's economic assumptions and a continuationof current budgetary policies, the federal deficit is projected to risefrom $150 billion in 1987 to $157 billion in 1988 and $176 billion in1989, before dropping to $167 billion in 1990.
These baseline budget projections assume that revenues, off-setting receipts, and entitlement spending are projected according tothe laws now on the statute books. Defense and nondefense discretion-ary appropriations are assumed to be held constant in real terms. Thebaseline projections are, therefore, not forecasts of future budgets,which will doubtless include numerous policy changes. This year CBOhas made minor changes in its baseline to make it identical to the bud-get base as specified in the Balanced Budget and Emergency DeficitControl Reaffirmation Act of 1987 (Public Law 100-119). Having asingle baseline is intended to help focus attention on the fundamentalsof the budget situation and reduce any confusion stemming fromminor conceptual differences.
THE SHORT-RUN BUDGET SITUATION
On November 16, as required by the Balanced Budget ReaffirmationAct of 1987, CBO reported that the budget deficit for 1988 would be$180 billion under laws then in effect. It also projected a deficit of$186 billion in 1989 and $166 billion in 1990. These estimates werebased on CBO's August economic and technical estimating assump-tions. How have the budget estimates changed since November?

xiv THE ECONOMIC AND BUDGET OUTLOOK February 1988
On November 20, Congressional leaders and the President an-nounced that they had reached a budget agreement covering the nexttwo fiscal years. This agreement, or budget summit, was intended toreduce the deficit by $30 billion in 1988 and $46 billion in 1989 fromthe Balanced Budget Act baseline. The results of the budget summitwere almost entirely incorporated in two bills-the continuing resolu-tion of appropriations (Public Law 100-202) and the Omnibus BudgetReconciliation Act of 1987 (Public Law 100-203)-signed by the Presi-dent on December 22. These laws reduced the 1988 deficit by an esti-mated $34 billion, comprising $23 billion in lower spending and $11billion in additional revenues. The projected deficit reduction willthen swell to $36 billion in 1989 and $40 billion in 1990, assumingthat spending programs subject to annual appropriation action areallowed to grow by only the rate of inflation (see Summary Table 1).
While policymakers were working hard to reduce the deficit,however, a deterioration in the economic outlook was eroding some oftheir improvements. CBO's updated economic assumptions add $9billion to the deficit in 1988, $21 billion in 1989, and $33 billion in1990, compared with the November estimates. In 1988 and 1989, mostof these changes result from lower tax revenues brought on by theforecast of a slowdown in economic growth. By 1990, however, theprimary factor is a projected increase in interest rates, which adds tothe costs of servicing the national debt.
Changes in technical estimating methods and assumptions haveincreased the projected deficit slightly-by $2 billion in 1988, $6 billionin 1989, and $8 billion in 1990-since CBO's November report. Thesereestimates result primarily from newly available data that permit abetter estimate of the effects of the Tax Reform Act of 1986 (PublicLaw 99-514). Technical revisions in outlay estimates, while large forsome individual programs, are negligible in total in most years.
The recent policy actions and economic and technical reestimateshave not changed the pattern of the deficit: it fell sharply in 1987, willrise in 1988 and 1989, and will fall again in 1990. This jagged shape islargely the result of the phase-in of the Tax Reform Act of 1986 and ofvarious one-time outlay savings. Tax reform added $22 billion torevenues in 1987 but reduces tax collections by $10 billion in 1988 and$16 billion in 1989. Asset sales and other one-time spending cuts holddown outlays by $15 billion in 1987 and $7 billion in 1988. The 1988

SUMMARY
savings result from loan prepayments permitted by the recentappropriation and reconciliation bills. Were it not for these specialfactors, the pattern of the deficits would be much smoother, as shownin Summary Figure 1. The deficit would have fallen less sharply in1987-to about $187 billion-and would then fall further to about $160billion, where it would remain for several years.
SUMMARY TABLE 1. BASELINE DEFICIT PROJECTIONSFOR 1988-1990 (By fiscal year)
Actual1986 1987 1988
Projections1989 1990
In Billions of Dollars
November 1987Base Deficit forBalanced Budget Act 221 150 180
Changes for:Enacted legislation -- - -34Updated economic
assumptions - — 9Technical reestimates - - 2
Total changes - - -23
February 1988Baseline Deficit 221 150 157
Adjustments for:Tax reform -- 22 -10One-time outlay
savings 2 15 7Total adjustments 2 37 -3
Adjusted Deficit 223 187 154
As a Percentage of GNP
Baseline Deficit 5.3 3.4Adjusted Deficit 5.4 4.2
3.43.3
186
-36
216
-10
176
-16
a/-17
159
3.53.2
166
-40
3381
167
-4
a/-4
163
3.13.1
SOURCE: Congressional Budget Office,
a. Less than $500 million.

xvi THE ECONOMIC AND BUDGET OUTLOOK February 1988
The baseline deficits of $176 billion in 1989 and $167 billion in1990 are well above the Balanced Budget Reaffirmation Act targets of$136 billion and $100 billion. The amount of deficit reductionrequired in 1989 is limited by law to $36 billion. Implementing therest of the budget summit in 1989 would produce about $3 billion inadditional outlay reductions in discretionary appropriations from the1989 baseline and $0.4 billion in additional revenues resulting fromfurther increases in Internal Revenue Service enforcement resources.But even with these further savings, another $32 billion in deficit re-duction would still be required. (Asset sales of $3.5 billion, althoughrequired by the budget summit, may not be counted as savings underthe terms of the Balanced Budget Reaffirmation Act.) If the Office ofManagement and Budget (OMB) comes up with similar estimates thissummer, across-the-board cuts would be required of roughly 9 percentin defense programs and 13 percent in nondefense programs fromtheir baseline levels.
Summary Figure 1.Deficit Adjusted forTax Reform Act andOne-Time Savings
240
220
„ 200
180
160
140
120'
1986
Baseline Deficit
Adjusted Deficit
I
SOURCE: Congressional Budget Office.
1987 1988 1989
Fiscal Years
1990

SUMMARY
These cuts could be avoided if OMB's estimate of the deficit werewithin $10 billion of the target-that is, less than $146 billion. Whileusing more favorable economic assumptions could reduce the projecteddeficit to that level, relying on this approach to get through the 1989budget year would make the 1990 deficit reduction task that muchharder. Taking no action this year beyond that required by the budgetsummit would leave the 1990 deficit around $160 billion, according toCBO's current estimates. With a 1990 deficit target of $100 billion,the excess deficit would be $60 billion, almost double the amount ofdeficit reduction achieved in the first year of the summit.
THE SHORT-TERM ECONOMIC OUTLOOK
Just as the budget summit agreement for 1988 and 1989 wasprompted by the stock market collapse of October 19, so will budgetarydevelopments for 1988 and 1989 be driven by the economic aftermathof the crash. The drop in share values wiped out hundreds of billionsof dollars of consumer wealth and contributed to a drop in consump-tion. Excluding automobiles, real personal consumption fell at a 1percent rate in the fourth quarter of 1987-the first decline since 1981.
As a result of the weakness in consumption, business piled upunsold inventories throughout 1987, but especially in the fourthquarter. CBO expects that the attempt to reduce inventory accumula-tion will act as a drag on the economy in early 1988. Real federalpurchases of goods and services are also expected to fall, reflecting suc-cessive years of budgetary stringency.
Some brighter signs, however, suggest that the economy willavoid a recession. Real net exports have started to improve as a resultof three years of dollar depreciation, and net exports are likely to bethe major engine of growth in 1988 and 1989. Because the saving ratehas already increased substantially, further declines in consumptionare not anticipated.
The financial crisis was the impetus for a major shift in monetarypolicy. From the Louvre accord in February 1987 through October,the Federal Reserve's stated aims were to support the value of the

xviii THE ECONOMIC AND BUDGET OUTLOOK February 1988
dollar and to dampen inflationary expectations. In pursuing theseaims, the Federal Reserve was forced to keep up interest rates. Afterthe crash, however, it permitted interest rates to fall even at the costof a depreciating dollar. This situation is likely to create inflationarypressures by the end of 1988 that will cause the central bank to shiftback to a less accommodating stance.
CBO's short-run economic forecast for 1988 and 1989 is shown inSummary Table 2. In addition to the monetary policy just described,the forecast assumes that federal fiscal policies are consistent withCBO's baseline revenue and outlay projections. The immediate out-look for the economy is substantially weaker than CBO expected inAugust. With a sluggish first half, real gross national product (GNP)is expected to grow by only 1.8 percent in 1988 (measured from fourthquarter to fourth quarter). The unemployment rate will average 6.2percent for 1988 as a whole, the same as the previous year. In 1989,
SUMMARY TABLE 2. CBO FORECAST FOR 1988 AND 1989(By calendar year)
Actual Forecast1987 1988 1989
Fourth Quarter to Fourth Quarter(Percent change)
Real Gross National Product 3.8 1.8 2.6
GNP Deflator 3.3 3.9 4.2
Consumer Price Index (CPI-W) 4.5 4.9 4.8
Calendar-Year Average(Percent)
Three-Month Treasury Bill Rate 5.8 6.2 6.7
Ten-Year Government Note Rate 8.4 9.3 9.5
Civilian Unemployment Rate 6.2 6.2 6.1
SOURCE: Congressional Budget Office.

SUMMARY
growth is expected to return to a 2.6 percent rate, roughly the same asthat assumed in CBO's summer projections and only slightly lowerthan in the last three years. Consumer price inflation, which totaled4.5 percent in 1987, is expected to reach 4.9 percent in 1988 and 4.8percent in 1989. The GNP deflator is expected to increase more slowlythan the Consumer Price Index, since the step-up in inflation is drivenmainly by import prices, which do not add to the GNP deflator.
As a result of the slow real growth and the Federal Reserve'saccommodative stance in the first half of 1988, there will be littleimmediate pressure on interest rates. Later in the year, the three-month Treasury bill rate should begin to rise in response to the higherinflation rate. For the year as a whole, CBO projects that the bill ratewill average 6.2 percent. Ten-year government note yields will riseeven more sharply, averaging 9.3 percent for the year, as theyincorporate expectations of still greater inflation in the futureresulting from the accommodative monetary policy. In 1989, theresumption of growth and the Federal Reserve's anticipatedtightening will cause short-term real interest rates to continue rising.Long-term rates in 1989, however, are projected to be relatively flat.
Like all economic forecasts, this one is very uncertain. For onething, it depends on the success of the Federal Reserve in supplyingthe economy with enough credit to avoid a recession, withoutreigniting inflation or undermining the dollar. It also assumes thatthe long-awaited improvement in net exports has finally arrived andwill accelerate in 1988. On the other hand, the economy could provestronger than in this forecast if CBO has overestimated the extent ofconsumer retrenchment.
Another way of addressing the uncertainty of the forecast is tolook at the historical record. For fiscal years 1978 through 1987, two-thirds of CBO's forecasts of nominal GNP for the budget year werewithin 2.8 percent of the actual outcome. Because 10 years is a verysmall sample on which to base a conclusion, however, CBO has alsodeveloped an uncertainty measure using a statistical approach. Thismeasure produces a somewhat higher margin of uncertainty--4.2percent of GNP. Based on this second measure of uncertainty, there isa two-thirds chance that the 1989 deficit will fall within $49 billion ofthe level projected by CBO.

xx THE ECONOMIC AND BUDGET OUTLOOK February 1988
LONGER-RUN BASELINE PROJECTIONS
Beyond 1989, CBO's economic assumptions are not a forecast of futureconditions but are projections based on historical trends. The pro-jections do not include business cycles. They assume that theeconomy's long-term growth depends largely on the growth of thelabor force and that output per worker will grow at about the samerate it has in recent years. CBO's five-year economic projections andthe corresponding baseline budget projections are presented inSummary Table 3.
In the projections, real GNP grows at an average annual rate ofabout 2.7 percent from 1989 to 1993, while the civilian unemploymentrate falls to about 5.3 percent (see Summary Figure 2). As measuredby the GNP deflator, inflation stays at 4 percent, close to the postwaraverage. Consumer price inflation is slightly higher, however,because of further declines in the dollar and increases in import pricesover the medium term. After 1989, real interest rates decline to levelsconsistent with their average since exchange rates began floating in1971. Cyclical changes will presumably affect the level of activityduring the projection years, but there is no way of predicting whenthey will occur or what will precipitate them. Thus, the projectionsshould be considered as an average of a number of possible paths theeconomy might take.
Under these longer-run assumptions, the baseline deficit is pro-jected to decline slowly from $176 billion in 1989 to $134 billion in1993. The deficit shrinks because revenues are boosted by both in-flation and real growth, while outlays rise only slightly faster than therate of inflation. Compared with the size of the nation's economy, thebaseline deficit falls from 3.1 percent of the gross national product in1990 to 2.1 percent in 1993.
This report attempts to quantify for the first time the uncertaintyinherent in these long-term economic and budget projections. The ap-proach used is an extension of the analysis in CBO's report of lastsummer of the accuracy of budget-year estimates. The analysis sug-gests that there are about two chances in three that the level of realGNP in 1993 will turn out to be within 7 percent of its projected value,

SUMMARY
SUMMARY TABLE 3. BASELINE BUDGET PROJECTIONSAND UNDERLYING ASSUMPTIONS
Actual1987 1988 1989 1990 1991 1992 1993
Budget Projections(By fiscal year, in billions of dollars) a/
854 897 953 1,036 1,112 1,181 1,262
1,005 1,055 1,129 1,203 1,269 1,332 1,396
Revenues
Outlays
Deficit
Nominal GNPGrowth(percent change)
Real GNP Growth(percent change)
Implicit GNPDeflator(percent change)
CPI-W b/(percent change)
CivilianUnemploymentRate (percent)
Three-MonthTreasury Bill Rate(percent)
Ten-YearGovernmentNote Rate(percent)
150 157 176 167 158 151
Economic Assumptions(By calendar year)
5.9
2.9
5.8
2.3
6.8
2.6
6.8
2.6
6.8
2.6
3.0 3.4 4.1 4.1 4.1 4.1
134
6.9 6.9
2.7 2.7
4.1
3.6 4.5 4.9 4.6 4.4 4.4 4.4
6.2 6.2 6.1 6.0 5.9 5.9 5.8
5.8 6.2 6.7 6.6 6.4 6.1 5.9
8.4 9.3 9.5 9.0 8.4 7.8 7.4
SOURCE: Congressional Budget Office.a. The baseline estimates include Social Security, which is off-budget.b. Consumer Price Index for urban wage earners and clerical workers.

xxii THE ECONOMIC AND BUDGET OUTLOOK February 1988
Summary Figure 2.Major Economic Assumptions
Real GNP Growth
6 -
I 3 -
1980 1985 1990
Civilian Unemployment Rate
1980 1985 1990
12
15
13
11
9
7
5
0
InflationHistory
I
Forecast
CPI
GNP Deflator
I i i i1980 1985 1990
Interest Rates
History Forecast
Three-MonthTreasury Bills
Ten-YearGovernment -Bonds
1980 1985 1990
SOURCES: Congressional Budget Office; Department of Commerce, Bureau of Economic Analysis;Department of Labor, Bureau of Labor Statistics; Federal Reserve Board.
SUMMARY
or that the average real growth rate between 1987 and 1993 will bebetween 1.6 percent and 3.6 percent. As a result, there is a two-in-three chance that the 1993 deficit will be within $125 billion of itsprojected value of $134 billion. This large degree of uncertainty illus-trates the point made earlier that the longer-run projections should beviewed only as a general indicator of budgetary trends and not as aforecast of future budgets.


CHAPTER I
THE ECONOMIC OUTLOOK
Last year was the fifth year of economic expansion since the1981-1982 recession. Growth continued unabated, however, at aboutthe same rate as in the two preceding years. It also became more bal-anced as a gradual improvement in the foreign trade balance (in realterms) led to a rapid expansion of manufacturing output. Toward theend of 1987, the unemployment rate fell to a level not seen in sevenyears. Inflation, though higher than in 1986, remained moderate.
Last year, however, is likely to be remembered not so much for theperformance of the economy as for the extraordinary turbulence infinancial markets, culminating in the worldwide collapse of stockmarket prices in mid-October. The stock market crash and the fears offinancial chaos it generated forced the Federal Reserve to ease itsmonetary stance and reinvigorated efforts to work out measuresaimed at reducing the federal budget deficit. The events ofmid-October also altered the economic landscape by suddenly wipingout hundreds of billions of dollars in consumer wealth and possiblyweakening consumer and business confidence in the sustainability ofthe current economic expansion.
These developments increased the likelihood of an economic slow-down in early 1988. The Congressional Budget Office (CBO) sees thisweakness as temporary. The economy should regain strength in thesecond half of 1988 and keep expanding through 1989. The unemploy-ment rate mirrors this pattern, in CBO's forecast, rising slightly in thefirst half of the year but falling as growth picks up again. Inflation inconsumer prices is expected to increase noticeably, however, primarilyas a result of higher import prices.
The sources of demand growth in the next two years will be quitedifferent from those earlier in the expansion, when spending by con-sumers and the federal government was growing rapidly while thetrade sector constituted a drag on growth. In 1987, consumer demandslowed and fiscal policy turned restrictive. At the same time, the

2 THE ECONOMIC AND BUDGET OUTLOOK February 1988
improvement in the real trade balance began to contribute to growth.These trends in the composition of aggregate demand can be expectedto prevail, and even strengthen, in the next two years.
This outlook for the economy is contingent on the success of theFederal Reserve in steering between a policy of supplying the economywith enough credit, on the one hand, and maintaining interest rateshigh enough to defend the dollar, on the other hand. In contrast to theassumptions about monetary policy underlying the forecast of lastAugust, CBO now assumes that the Federal Reserve will be for sometime more tolerant of a depreciating dollar, mainly to counter theshort-term deflationary consequences of the stock market crash.While this posture will allow short-term interest rates to go somewhatlower than forecast last August, it is also expected to engender grow-ing inflationary pressures, rising inflationary expectations, and high-er nominal long-term rates by the end of 1988, compelling the FederalReserve to adopt somewhat tighter monetary policy at that time. Theincreasing monetary restraint anticipated for 1989 should not, how-ever, be severe enough to interrupt the expansion.
THE POLICY ENVIRONMENT
The enormous trade imbalances between the United States and itstrading partners stem largely from policy decisions made in thiscountry and abroad during the past decade. The size and persistence ofthese imbalances have changed the environment in which policiesmust be carried out. In particular, U.S. monetary policy is now moreconstrained by international considerations than it was before, andhence interest rates are likely to be higher than they would otherwisehave been. Moreover, the growing international openness of the U.S.economy has meant a multiplication of economic forces and players,making it harder for policymakers to anticipate the economy's future.
The effect of the continued imbalances on the economy is now evi-dent to all: the accumulated current account deficits of the past fiveyears have already changed the United States from the world's largestnet creditor to its largest net debtor. Were the deficits to continue atthis level, the need to finance them while also servicing the ac-cumulated debt would require foreigners to continue to acquire U.S.

CHAPTER I THE ECONOMIC OUTLOOK 3
assets at an unsustainably high rate. Foreigners, whether private in-vestors or monetary authorities, will not be willing to increase the pro-portion of their assets held in dollars indefinitely, and the growth rateof U.S. debt held by foreigners will ultimately have to fall.
The reluctance of foreign private investors to accumulate dollarsin 1986 and 1987 at the same pace as in the two previous years hasalready put downward pressure on the dollar. The fall in the dollar hastended to raise interest rates and engender inflationary expectationsin the United States. This situation, in turn, contributed to the col-lapse of financial markets in October. To alleviate these pressures, thetrade deficit must shrink. But it is unlikely to shrink fast enough inthe short run to keep the dollar from falling further and interest ratesfrom remaining high.
To facilitate a smooth reduction in its trade deficit, the UnitedStates is now trying to reduce its federal budget deficit while encour-aging Germany and Japan to increase theirs. Monetary policies hereand abroad are currently aimed at stabilizing the dollar or at least re-ducing the speed of its decline. It is hoped that this will prevent areemergence of inflation in the United States and will improve pros-pects for growth abroad. At the same time, monetary authorities areaware that stabilizing the dollar by pushing interest rates up maycause a recession. This path is particularly difficult to negotiate giventhe new constraints placed on policymakers by the size of the U.S.trade deficit, growing U.S. foreign indebtedness, and the recent rapidgrowth of money supply in other industrial nations.
Development of the Trade Problem
U.S. policymakers today face a situation that has its roots in monetaryand fiscal actions taken here and abroad during the 1980-1986 period.Late in 1979, the Federal Reserve initiated a restrictive monetarypolicy to reduce the rate of inflation, which had risen above 13 percent.Other countries took similar steps soon afterward, but their policieswere less restrictive and were accompanied by a tightening of fiscalpolicy. As a consequence, U.S. real (inflation-adjusted) interest ratesrose more than foreign rates in 1980 and 1981 (see Figure 1-1). The

4 THE ECONOMIC AND BUDGET OUTLOOK February 1988
Figure 1-1.
Interest Rates andthe Exchange Rate
Real Long-Term Interest Rates
1976 1978 1980 1982 1984 1986
SOURCES: Congressional BudgetOffice; Federal ReserveBoard; InternationalMonetary Fund.
10
5
-5
The Real Exchange Rate andRelative Interest Rates
Exchange Rate—""•-••.^ (right scale)
\
T P
Interest-RateDifferential(left scale)
1 1 1
100
80
60
40
20
1976 1978 1980 1982 1984 1986
NOTE: The real exchange rate is a trade-weighted average of dollar exchange rates adjusted for consumerprice inflation. Expected inflation is proxied by a two-year centered moving average of actual andprojected CPI inflation. The foreign real interest rate is a GDP-weighted average of the rates ofother major industrial countries. The interest-rate differential is the U.S. rate less the foreign rate.

CHAPTER I THE ECONOMIC OUTLOOK 5
TABLE 1-1. NET SAVINGS AND INVESTMENT FLOWSAS A PERCENTAGE OF GNP (NIPA basis)
1950-19591960-19691970-1979
19801981198219831984198519861987
(1)Net
PrivateDomesticSavings
7.58.18.1
6.46.65.55.76.85.75.34.3
(2)Stateand
LocalSurplus
-0.20.00.8
1.01.11.11.41.71.61.31.0
(3)FederalDeficit
-0.10.31.7
2.22.14.65.24.54.94.83.4
(4)Net Domestic
SavingsAvailable
for DomesticInvestment:(l) + (2)-(3)
7.87.87.2
5.25.62.01.94.02.41.81.9
(5)Net
PrivateDomestic
Investment
7.57.16.9
4.95.52.03.16.65.15.15.3
(6)Net Domestic
SavingsShortfalls(5) - (4) =
Net CapitalInflows
-0.3-0.7-0.3
-0.3-0.10.01.22.62.73.33.4
SOURCES: Congressional Budget Office; Department of Commerce, Bureau of Economic Analysis.
relatively high real interest rates here contributed decisively to theincrease in demand for dollar-denominated assets; consequently, thedollar began to appreciate.
By the end of 1982, monetary policy had eased both here andabroad, but U.S. fiscal policy had become stimulative. Taxes were cutin several stages, and real federal spending on goods and servicesbegan to rise at a rate reminiscent of the buildup during the VietnamWar. As a result, the federal deficit rose from 2.1 percent of potentialgross national product (GNP) in 1981 to 4.9 percent in 1985. Consu-mer spending boomed, partly because of personal income tax cuts andpartly because the strong dollar made imported goods unusuallyattractive. The consumption boom even outstripped income growth, sothat the personal saving rate fell dramatically. Investment in plantand equipment was also stimulated by changes in the tax laws. In the1981-1985 period, these developments-the larger federal deficit, thefall in the personal saving rate, and the surge in fixed investment--were creating a net saving deficit at home, while foreign fiscal policywas becoming more restrictive (see Table 1-1 and Figure 1-2). Contrac-

6 THE ECONOMIC AND BUDGET OUTLOOK February 1988
Figure 1-2.
International Comparisonof Structural Deficits
SOURCES: Congressional BudgetOffice; Organization ofEconomic Cooperationand Development. 1970 1975 1980 1985
NOTE: The levels of the structural budget deficits (deficits adjusted for the budgetary effects of the businesscycle) as a percent of GNP depend on the assumed size of the gap between actual and potentialGNP—an uncertain and controversial measure. The change in the ratio of structural deficits topotential GNP from year to year is less sensitive to assumptions about the level of potential output,and is a more useful gauge of discretionary fiscal policy. All data, including that for the United States,were obtained from published and unpublished OECD sources, and include all levels of government on aNational Accounts basis.
tionary foreign fiscalpolicies caused investment to slacken abroad,freeing additional foreign private savings for investment in U.S.financial assets. Real long-term interest rates in the United Statescontinued to be higher than those overseas, capital continued to flowinto dollar-denominated assets, and the dollar continued to appre-ciate.],/
The substantial increase in the value of the dollar in the early1980s severely weakened the competitiveness of U.S. exporters andimport-competing industries. Export growth stagnated and importssurged. Industries producing tradable goods suffered in 1984 even asthe rest of the economy was experiencing rapid growth. The currentaccount worsened rapidly, falling from a surplus in 1981 to a $107 bil-lion deficit in 1984.
The developing-nation debt crisis, which started in 1982, also strengthened the dollar as capitalflowed out of those countries to the safe haven of dollar-denominated assets.

CHAPTER I THE ECONOMIC OUTLOOK 7
Late in 1984, U.S. monetary policy was easing and the differentialbetween foreign and U.S. real long-term interest rates was declining.Also, as the U.S. current account continued to register larger deficits,it was becoming ever clearer that the resulting pace of accumulationof net claims against the United States (measured in inflation-adjusted, foreign-currency terms) was unsustainable. Had it contin-ued, it would have required dollar-denominated assets to make up anever-increasing share of foreign private portfolios. Nevertheless,demand for the dollar remained strong for a number of months, evenafter the real interest-rate differential had begun to decline. Finally,in early 1985, the dollar started to fall.2/
Policymakers welcomed the initial fall in the dollar, since thegrowing trade deficits were encouraging protectionist sentiment inthe United States. The Plaza Accord of September 22, 1985, was aconcerted effort by the United States and its major trading partners todepress the value of the dollar. In 1986, however, the speed of thedecline in the dollar began to raise concerns about inflation in theUnited States and the abrupt loss of markets by foreign exporters.Instead of selling, foreign central bankers began to buy dollars to keepthe dollar from falling precipitously.
By the end of 1986, the dollar had fallen an average of 33 percentagainst the currencies of 10 major U.S. trading partners from its peakin early 1985; both the real and the nominal trade deficits were con-tinuing to increase; and the rate of growth of private demand for dollarassets had fallen off. Fears of a dollar collapse began to haunt finan-cial markets. The stage was set for the turbulent events of 1987 thatcreated the environment in which policymakers must operate today.
The Dollar, Monetary Policy, and Financial Markets in 1987
Meeting in the Louvre in February 1987, financial representatives ofthe major industrial countries agreed that further substantial shifts inexchange rates in the short run would hamper efforts to increase eco-nomic growth and promote adjustment within their own countries.
2. Weaknesses in the U.S. financial system (failures of thrift institutions, and problem loans inenergy and agriculture) may have helped to erode confidence in the dollar.

8 THE ECONOMIC AND BUDGET OUTLOOK February 1988
Figure 1-3.
The Spread BetweenLong-Term and Short-Term Interest Rates
SOURCES: Congressional BudgetOffice; Federal ReserveBoard.
NOTE: The spread is the differencebetween the ten-year constant-maturity Treasury bond yieldand the three-month Trea-sury bill rate on a bond equiva-lent yield basis.
£
1987
Participants in the Louvre meeting agreed that the dollar should bestabilized for a period to determine the responsiveness of the U.S.trade deficit to the devaluation that had already taken place, and thattheir currencies were then "within ranges broadly consistent with un-derlying economic fundamentals. "3/
But despite exceptionally high levels of dollar purchases by themonetary authorities of major countries, the dollar dropped sharply inApril and May. This drop was accompanied by a large increase ininterest rates in the United States, as an apparent increase in infla-tionary expectations drove up bond yields and the Federal ReserveBoard tightened monetary policy (see Figures 1-3 and I-4).4/ Interestrates in foreign countries eased. The resulting spread in domestic andforeign interest rates partially reversed the decline of the dollar, withlittle additional direct intervention in currency markets.
3. Organization for Economic Cooperation and Development, Economic Outlook (June 1987), p. 59.
4. The reported annual rates of change of the Consumer Price Index and the Producer Price Index forthe first three months of 1987 were 5.7 percent and 6.2 percent. This was a sharp increase from therates prevailing in late 1986.

CHAPTER I THE ECONOMIC OUTLOOK 9
Figure 1-4.Financial Market Indicators
Standard & Poor's 500 Index Crash
300 - I
200
100
J_L _LJ_ fe.l
340
300
260
2201955 1960 1965 1970 1975 1980 1985 Weekly 1987
Standard & Poor's 500 Earnings/Price Ratio14 r-
12
^ 10C
£ 8
6
4
1955 1960 1965 1970 1975 1980 1985 Monthly 1987
Ten-Year Treasury Bond Rate16
- 7
1955 1960 1965 1970 1975 1980 1985 Weekly 1987
SOURCES: Congressional Budget Office; Standard & Poor's Corporation; Federal Reserve Board.

10 THE ECONOMIC AND BUDGET OUTLOOK February 1988
The stock market did not fall in response to the April increase ininterest rates. Instead, it continued to rise rapidly during the summer,widening the discrepancy between stock and bond returns. By lateAugust, the Dow Jones Industrial Average and the Standard & Poor's500 Index had reached record highs; the price-to-book value ratio forthe Standard & Poor's 400 Industrials was over 2.3, high by historicalstandards; and the earnings-price ratio of the Standard & Poor's 500had fallen to 4.3 percent (see Figure 1-4).
During the summer, though, foreign monetary authorities, partic-ularly in Germany and Japan, became more concerned about the pos-sibility of inflation. To slow the growth in their money supplies thatwas associated with their intervention in support of the dollar, a num-ber of foreign industrial countries allowed their interest rates torise.5/ The Federal Reserve Board was then forced to allow U.S. in-terest rates to rise to keep the dollar from falling.
The stock market weakened in response to the run-up in rates—incontrast to its behavior when interest rates increased in April. TheDow Jones Industrial Average fell 126 points from its mid-Augustpeak through the end of September.
The extent of Federal Reserve tightening in the first three quar-ters of 1987 is now clear. The broader monetary aggregates, whichhad entered the year growing above their announced target ranges,slowed markedly as the year progressed. By the end of the third quar-ter, M2 was well below its target range and M3 was also expandingslowly (see Figure 1-5). Also, the spread between the federal fundsrate and the discount rate widened after February as the FederalReserve sought to soften the drop in the dollar and ease fears of re-newed inflation. To underscore this move, the Federal Reserve raisedthe discount rate half a percentage point in early September.
After a brief period of stability, another run-up in rates in earlyOctober contributed to a substantial decline in the stock market dur-ing the week that preceded the October 19 crash. That weekend, Trea-sury Secretary Baker issued a statement that West Germany had
5. Buying dollars from the private sector in exchange for domestic currencies tends to increase themoney supplies of foreign countries.

CHAPTER I THE ECONOMIC OUTLOOK 11
Figure 1-5.
Money Growth andTargets in 1987
3100
3000 -
2900 -
SOURCES: Congressional BudgetOffice; Federal ReserveBoard.
NOTE: Dotted lines refer togrowth bands that theFederal Reserve Boardconsiders consistent withits targets.
Target Range is 51/2% to 81/2% _
I I I I I I I I I I
*' Target Range
Target Range is 5'/z% to 872%
I I I I I I I I I
<= 3600 -
10 12

12 THE ECONOMIC AND BUDGET OUTLOOK February 1988
violated the spirit of the international agreement by maintaining highinterest rates. His remarks carried the implication that the UnitedStates would no longer allow its interest rates to follow foreign ratesupward. His statement also created the impression that conflictbetween inflation-fighting and recession-fighting goals had spelledthe end of coordinated international efforts to support the dollar.
The stock market then dropped 26 percent—more than 600 pointson the Dow Jones average-in two trading days. Contributing factorswere the early October rise in interest rates, bad news on the rate ofimprovement in the trade deficit, and concern over the future course ofthe dollar. Institutional factors, such as program trading and portfolioinsurance, are thought to have contributed to the^ steepness of thedrop.6/ In terms of the Wilshire 5000 Index, the loss in value was ap-proximately $900 billion. Foreign stock markets collapsed at thesame time.
Interest rates dropped sharply in the wake of the stock marketcollapse as foreign monetary authorities quickly relaxed their policies,and the Federal Reserve set aside its policy of supporting the dollarand turned instead to add liquidity to the financial markets.?/ Short-term Treasury bill rates dropped, and long-term Treasury bond yieldsalso fell as expectations of future economic growth and inflation wererevised downward after the crash. In response, the dollar fell 11 per-cent against the currencies of its major trading partners over the nextseveral weeks.
The stock market crash was the most important economic event of1987, not just because of the dramatic size of the sell-off but also be-cause it caused a fundamental restructuring of policy. It reorderedeconomic priorities both in the United States and abroad, and in-creased the level of uncertainty for consumers, producers, and govern-ment policymakers alike.
6. See Report of the Presidential Task Force on Market Mechanisms (January 1988).
7. Reserveis were pumped into the system to augment a credit supply that threatened to becomestrained during the crash. The announced willingness of the Federal Reserve to provide addition-al liquidity, as stated by Chairman Greenspan, also played a role in calming financial markets.

CHAPTER I THE ECONOMIC OUTLOOK 13
Current Monetary Policy and the Outlook for the Dollar
Prospects for weaker growth reduced inflationary expectations andlong-term interest rates early in 1988. If, as expected by CBO, theperiod of economic weakness is brief, inflation is likely to increase andthe dollar again come under pressure as the economy strengthenslater in the year. This will put monetary authorities here and abroadin a difficult situation. On the one hand, U.S. monetary policy willhave to be tight enough to prevent both a resurgence of inflationaryexpectations and further steep declines in the dollar. On the otherhand, given the potentially deflationary effects of the stock marketcrash and the continuation of the fiscal restraint that began in 1987,overly tight monetary policy could cause a recession. The FederalReserve would find its task easier in the short run if foreign monetaryauthorities continued to loosen their monetary policies, but manycountries already have experienced rapid real monetary growth andare reluctant to risk the potentially inflationary consequences of fur-ther monetary stimulation.
Given these constraints, CBO assumes that monetary policy willbe slightly accommodative through 1988, allowing only moderateincreases in short-term interest rates as a reflection of higher infla-tion. Long-term rates, however, are likely to rise this year as they in-corporate higher reported inflation and increased inflationary expec-tations resulting from the accommodative monetary policy. By theend of 1988, the major deflationary effects of the crash should havepassed, and CBO assumes that in 1989 monetary policy will becomesomewhat less accommodative because of rising inflation and infla-tionary expectations. Foreign monetary policies are assumed to be-come somewhat less accommodative after the first quarter of 1988because of the need to counter high rates of money supply growth as-sociated with intervention in support of the dollar. The foregoingmonetary policy assumptions are speculative, of course, but they ap-pear reasonable given the constraints the monetary authorities arelikely to face.
The dollar is expected to weaken in 1988 and 1989 as high, thoughshrinking, U.S. current account deficits (in nominal terms) cause in-vestors' confidence in the dollar to remain weak. Furthermore, for-eign central bankers, fearful of inflation, will be unable to continueintervening in the currency exchange markets at recent rates. As a

14 THE ECONOMIC AND BUDGET OUTLOOK February 1988
result, CBO expects the dollar to decline by about 10 percent againstthe major key currencies between early 1988 and the end of 1989, andto continue to depreciate over the projection horizon.
The turbulent events of 1987 were global in both their causes andeffects. They demonstrated the openness of the U.S. economy, and thedegree to which conditions in the United States are influenced notonly by domestic economic policy but by foreign fiscal, monetary, andexchange rate policies as well as by foreign private investors oper-ating in global financial markets. The result is increased uncertainty,both here and abroad, as investors and consumers around the worldreact to the developments of 1987. It has become more difficult nowthan at any time in the recent past to foresee fundamental economictrends, the responses of policymakers to those trends, and the out-comes of the policies themselves.
FISCAL POLICY
In contrast to the fiscal policies of a number of other major countries,U.S. fiscal policy moved toward restraint in 1987, following severalyears of stimulus. With the enactment of the tax and spending poli-cies embodied in the late 1987 budget agreement between the Con-gress and the Administration, the outlook for domestic fiscal policy isfor continued, but mild, restraint. This course may dampen economicgrowth somewhat, but ultimately it should help to improve the U.S.trade balance—especially if other countries pursue more stimulativefiscal policies—and free additional savings for productive uses.
The Baseline Forecast
The federal budget deficit declined from $221 billion in 1986 to $150billion in 1987, a record drop. More than a third of this decline, how-ever, reflected temporary budgetary effects of the Tax Reform Act of1986 and other special factors that, as shown in Summary Table 1,shifted some of the deficit from 1987 into other years, especially 1988and 1989.87 Given the economic outlook described in this report and
8. Despite the large decline in the federal deficit, the net national rate of saving did not increase in1987 because nonfederal saving decreased relative to GNP (see Table 1-1). Consequently, U.S.demand for financing from abroad did not diminish.

CHAPTER I THE ECONOMIC OUTLOOK 15
the budget policies now in place, CBO estimates federal deficits of$157 billion in 1988 and $176 billion in 1989. Thereafter, the federaldeficit is projected to decline gradually to a level of $134 billion by1993 (based on CBO's medium-term economic assumptions and acontinuation of current budget policies). The publicly held federaldebt is projected to rise from 43.0 percent of GNP in 1987 to 44.7 per-cent in 1990, then fall to 43.4 percent by 1993.
The CBO baseline budget projections reflect the deficit reductionsenacted after the November budget agreement between the Adminis-tration and the Congress, which amount to $34 billion in 1988 and $36billion in 1989, according to CBO estimates. These budget savingsinclude $8 billion of loan prepayments in 1988 along with revenue in-creases of $11 billion in 1988 and $16 billion in 1989. Additional defi-cit reductions in 1989, however, are contemplated under the Novem-ber agreement, including $3.5 billion of asset sales. But these may notbe sufficient to avoid sequestration next year under the Balanced Bud-get and Emergency Deficit Control Reaffirmation Act of 1987 (PublicLaw 100-119), which alters the Balanced Budget Act of 1985. Amongother changes, the Balanced Budget Reaffirmation Act of 1987 ex-tends the target year for a balanced budget to 1993. It also enables se-questration to be avoided in 1989 if the estimated 1989 federal deficitdoes not exceed $146 billion, or if action is taken to reduce the 1989deficit by at least $36 billion after January 1,1988.9/
The Standardized-Employment Deficit
The path of discretionary fiscal policy is clearer when the baselinebudget projections are adjusted for the budgetary effects of the busi-ness cycle. Slower economic growth automatically increases the defi-cit by reducing revenues and by increasing outlays for transfer pro-grams such as Unemployment Insurance. These automatic deficitincreases do not indicate discretionary policy actions.
A commonly used gauge of discretionary fiscal policy is the stan-dardized-employment, or structural, deficit—a calculation that ex-cludes the cyclical component of the deficit. According to this mea-
9. Chapter II discusses both the Reaffirmation Act of 1987 and the summit agreement between theAdministration and the Congress, as well as CBO's baseline budget projections.

16 THE ECONOMIC AND BUDGET OUTLOOK February 1988
TABLE 1-2. BASELINE STANDARDIZED-EMPLOYMENT DEFICIT(By fiscal year, on a budget basis)
Actual
RevenuesOutlaysDeficit
1986
793980187
1987
880999118
1988
In Billions
9211,051
130
1989
of Dollars
9791,125
146
1990
1,0601,199
140
1991
1,1321,266
133
1992
1,1971,329
131
1993
1,2721,393
120
As a Percentage of Potential GNP
RevenuesOutlaysDeficit
18.622.94.4
19.622.22.6
19.422.1
2.7
19.322.22.9
19.622.22.6
19.722.0
2.3
19.521.72.1
19.521.3
1.8
SOURCES: Congressional Budget Office; Department of Commerce, Bureau of Economic Analysis.
NOTE: This measure of the deficit substantially overstates the degree of restrictiveness in fiscal year1987, and understates the restraint between 1987 and 1989. See text.
sure, presented in Table 1-2 and Figure 1-6, fiscal policy was quiterestrictive last year as the structural component of the deficit declinedfrom 4.4 percent of potential output in 1986 to 2.6 percent in 1987.The same data suggest that for the next two years fiscal policy isslightly stimulative, since the standardized-employment deficit risesrelative to potential output. After 1989, the outlook is for persistentbut gradual restraint through 1993.
The slightly stimulative appearance of fiscal policy between 1987and 1989 is misleading, however. It reflects the nonrecurring effects oftax reform and other special factors, which alter the measured changein fiscal policy but may have little impact on aggregate demand andemployment. In particular, the 1987 deficit was lowered substantiallyby asset sales, by the shifting of certain outlays by a few days into1988, by the retroactive repeal of the investment tax credit, and by anonrecurring bulge in capital gains tax revenues as gains were real-ized before the rate was increased on January 1, 1987. When outlaysand revenues are adjusted for such factors, the standardized-employ-ment deficit clearly declines between 1987 and 1989, indicating fiscalrestraint during the forecast period.10/ Moreover, federal purchasesof goods and services decline relative to potential output, and relative
10. After removing the nonrecurring effects of tax reform, revenues rise relative to potential outputsince personal tax cuts are more than offset by corporate tax increases, the 1988 increase in SocialSecurity tax rates, and the revenue-raising provisions of the November summit agreement.

CHAPTER I THE ECONOMIC OUTLOOK 17
to transfer payments. This change in the composition of spendingmakes the budget outlook more restrictive, because the impact ofpurchases on aggregate demand generally is thought to be greaterthan that of the transfer payments.
The mildly depressing effect of current fiscal policy restraint onoutput and employment can be lessened somewhat if major U.S.trading partners put into place fiscal measures that increase growthrates in the rest of the world and consequently the demand for U.S.exports. At the same time, U.S. real trade balances with those coun-tries would improve as their currencies appreciate, making this coun-try's exports relatively less expensive and its imports from abroadrelatively more expensive.
The outlook for foreign fiscal policy during 1988 and 1989 is un-certain, although recent pronouncements suggest some additionaleasing may occur. By themselves, however, foreign efforts are notlikely to contribute much to a reduction of the U.S. trade deficit.
Figure 1-6.The Standardized-Employment Deficit
0. ^
a
I 3
1970 1975 1980 1985 1990Fiscal Years
SOURCES: Congressional Budget Office; Department of Commerce, Bureau of Economic Analysis.
NOTE: This measure of the deficit substantially overstates the degree of restrictiveness in fiscal year 1987,and understates the restraint between fiscal years 1987 and 1989.

18 THE ECONOMIC AND BUDGET OUTLOOK February 1988
THE STATE OF THE ECONOMY
The 2.9 percent growth of real output in 1987 was about the same asthat of the previous two years, but growth increased during the yearand the unemployment rate fell sharply. In contrast to 1986, real netexports stimulated output growth, and the growth was accompaniedby a rapid accumulation of inventories. Consumption may have beenweakened temporarily by the stock market crash; if so, the combina-tion of large inventories and slower consumption growth should leadto a moderate inventory correction in 1988.
The rate of inflation increased last year, but the increase appearedto represent largely a turnaround in energy prices and not an increasein the underlying rate of inflation. This year, however, consumer priceinflation will probably increase even if energy prices fall slightly. Theincrease will result from an anticipated acceleration in import prices,emerging constraints on capacity in some industries, and tighteningmarkets for raw materials.
The Composition of Demand
The growth in real final sales (total demand excluding inventorychange) slowed from 2.8 percent in 1986 to 2.1 percent last year. Un-derlying this change was a dramatic shift in the composition ofdemand: real net exports rose while the growth of personal consump-tion, construction, and government expenditures slowed. Net exportgains alone accounted for 0.4 of a percentage point of the growth inreal final sales in 1987, unlike 1986 when a decline in real net exportsweakened final sales growth by 0.9 of a percentage point. CBO anti-cipates that growth in real final sales in 1988 will be driven even moreby net exports, as growth in personal consumption and constructioncontinues to be slow and federal purchases decline.
Consumption. Consumer spending, which was relatively strong from1983 to early 1986, has been growing slowly since then and is likely tocontinue to grow slowly through the forecast period.
Consumer spending grew 1.8 percent in real terms in 1987. Thiswas less than half the pace of the four preceding years, but it still ex-ceeded the growth of disposable income in 1987. As a result, in a

CHAPTER I THE ECONOMIC OUTLOOK 19
continuation of a six-year trend, the personal saving rate fell. Thisdownward trend in the saving rate is likely to be reversed in 1988 asconsumers face the need to service a relatively high level of debt,coupled with a reduction in household wealth as a result of the stockmarket crash. The recent and projected decline in the value of the dol-lar will cause faster growth in consumer prices, and personal income isnot expected to keep pace. As a result, real personal income growth isforecast to slow slightly. Disposable income growth is expected toincrease, however, because of lower taxes-the net effect of the Janu-ary reduction in personal income tax rates and the increase in SocialSecurity taxes.
The low personal saving rates of the last few years were associatedwith an increase in consumer debt, which has raised concern over thefinancial health of the household sector. Total debt of the householdsector as a percentage of disposable income has risen dramaticallysince 1982. Though the carrying costs of the debt are not as high inrelation to income as they were in the mid-1970s, the debt load makeshouseholds vulnerable to a downturn and may increase their cautionin the face of a possible recession.
The stock market crash may depress consumption, particularly inthe short run. The strong growth in spending relative to income inrecent years has been attributed in part to the growth in the value ofhousehold wealth. The personal saving rate declined from 6.1 percentin 1984 to 4.3 percent in 1986. Over those years, household wealth in-creased by 18.6 percent because of gains in the stock and bond marketsand in real estate. Since the growth in asset values helped them meettheir savings goals, households may have been encouraged to save alower proportion of their incomes.
The decline in the stock market after August quickly reduced thelevel of household wealth. Based on the Wilshire 5000 Index, the mar-ket value of common stocks held by households fell almost 30 percent,or over $500 billion, from August to December 1987.11/ Many econo-metric models indicate that such a loss of wealth should cause realconsumption in 1988 to be about $15 billion to $25 billion less than ifthe stock market had remained at its August level.
11. Bond market wealth increased after the crash, but it was still below its early 1987 peeik.

20 THE ECONOMIC AND BUDGET OUTLOOK February 1988
A further consideration, in addition to the effect on wealth, is howconsumers interpret the meaning of the stock market drop. The twomost observed indexes of consumer sentiment and buying plans indi-cate that consumers may reduce spending to lessen their financial ex-posure in an uncertain future. If they do so, such pessimism about thefuture may be self-fulfilling.
Real consumption fell sharply in the fourth quarter of 1987.Though a large part of the drop was caused by the end of incentives forautomobile sales, consumption excluding autos fell at a 1 percent an-nual rate-the first decline since 1981, and a highly unusual event.Thus, consumers appear to have cut back already, perhaps in partbecause of the effects of the October stock market crash. In light of therecent strong growth in real disposable income and a further increaseanticipated this quarter because of personal tax changes, further re-ductions in consumption are not anticipated. The annual rate ofgrowth of real consumption between 1987 and 1988 is expected to beonly slightly below the 1.8 percent growth between 1986 and 1987.
Business Fixed Investment. Before the stock market crash, businessfixed investment was improving, largely because capacity utilizationhad improved significantly. Investment outlays were considerablystronger in the last half of 1987 than in the previous year and a half,but investment grew by less than 1 percent for 1987 as a whole. CBOanticipates stronger growth in real fixed nonresidential investment in1988, but the stock market crash has made the outlook less promisingand more uncertain.
The near-term indicators look reasonably good (see Table 1-3).New orders for nondefense capital goods, a volatile series, were muchhigher after the first quarter of 1987. A rise in orders portends a risein shipments after a slight lag. Also, the industrial production indexfor capital goods at the end of 1987 was up more than 6 percent from ayear earlier. The Federal Reserve Board's Index of Capacity Utiliza-tion rose from under 80 percent in the first quarter to 82 percent bythe end of the year. Corporate profits and cash flow, while not risingstrongly, have been holding at relatively high levels.

CHAPTER I THE ECONOMIC OUTLOOK 21
TABLE 1-3. CURRENT INDICATORS OF BUSINESS FIXED INVESTMENTAND SURVEYS OF CAPITAL SPENDING PLANS FOR 1988
1986 19871987
III IV
Real NondefenseCapital Goods Orders(Billions of 1982dollars per month) 30.0
Manufacturers'Capital Appropriations(Billions of dollars,quarterly rate) 21.4
Current Indicators
33.5 30.1
21.4
33.4
32.3
34.8 35.5
30.9
Capacity Utili-zation (Percent) 79.4
Corporate EconomicProfits (Billions ofdollars, annual rate) a/ 284
Corporate Cash Flow(Billions of dollars,annual rate) b/ 375
Corporate AAABond Rate(Percent) 9.0
Standard & Poor's500 Stock Index(Percent change,annual rate) 26.5
Surveys of
Department of Commerce c/McGraw-Hill d/
80.7 79.5 79.9
305 294 297
370 367 365
9.4 8.4 9.2
21.4 72.6 21.6
Capital Spending Plans for 1988(Percent increase)
Nominal Real
7.3 7.36.2 2.0
81.2 82.0
315 316
375 375
9.8 10.2
40.6 -59.2
SOURCES: Congressional Budget Office; Department of Commerce, Bureau of Economic Analysis;McGraw-Hill, Inc.; Conference Board; Federal Reserve Board.
NOTE: n.a. = not available.
a. Economic profits are adjusted for inventory valuation and capital consumption allowances.
b. Corporate cash flow is the sum of retained earnings, capital consumption allowances at book value,and the inventory valuation adjustment.
c. Conducted in October and November 1987.
d. Conducted in September and October 1987.

22 THE ECONOMIC AND BUDGET OUTLOOK February 1988
Several factors account for the recent upturn in investment andsuggest moderate growth in 1988. First, a substantial improvementin the real trade balance during 1987 (which is expected to continueduring the forecast period) helped the prospects for corporate profits inmanufacturing, where profits had been severely depressed. Second,and related to these improved prospects, industrial production hasbeen increasing at a rapid rate (in December the Federal ReserveBoard index for manufacturing was up 5.3 percent from a year ago),bringing the FRB index of capacity utilization for manufacturing to itshighest level since 1980 (see Figure 1-7). Third, a partial recovery inoil prices reversed the decline in oil field drilling. Finally, after apause, the important computer industry showed renewed vitality andgrowth during 1987.
The most important uncertainties in the outlook for business fixedinvestment are the effect of the stock market crash and, to a lesserextent, the large overbuilding of commercial structures that tookplace in the mid-1980s. For commercial building, the only question ishow severe the downturn will be and when the turnaround will takeplace. Recent data suggest that the vacancy rate for office buildingshas at least leveled off; vacancies remain very high, however, espe-
Figure 1-7.Capacity Utilization
90
80
70
60j I i i i i j_
NondurableManufacturing
/Manufacturing
,' Durable Manufacturing
i I i i1970 1975 1980
SOURCES: Congressional Budget Office; Federal Reserve Board.
1985

CHAPTER I THE ECONOMIC OUTLOOK 23
cially in suburban areas and in the South and West.1.2/ Anotherimportant component of business structures is construction of retailspace, which is apt to be dampened by the slowdown in residentialconstruction.
The crash in the stock market has several negative implicationsfor investment. First, it raises the cost of equity as a source offinancing. Second, it reduces the demand for final output. Third, theslower economy diminishes corporate profits and cash flow, which arealternative sources of investment financing. Fourth, the fall in thestock market raises the relative attractiveness of acquisitions andstock buy-backs relative to investment in physical capital. Fifth, thecrash may have a negative effect on business confidence.
The most critical aspect of the stock market decline is its potentialeffect on consumption and corporate profits. If consumption falters inearly 1988, and is not offset by an increase in net exports or othercomponents of final sales, then investment will also falter after a lag.The improvement in the trade balance is a positive factor, but con-sumption is a much larger category of final demand.
The other potential effects of the crash on investment are morenebulous and difficult to evaluate. If the rise in the cost of equityfinancing has a negative effect, it may be partially offset by the reduc-tion in interest rates. The effects of the crash on business confidenceare also unlikely to be large. The market fell after having risen rapid-ly during the first eight months of the year, and many people,including business executives, were skeptical that such high valua-tions could be sustained. The shock of the fall lay largely in its sud-denness; so far, at least, the market has not plunged so low as to shat-ter business confidence.
Surveys of business plans for capital spending show substantialstrength in 1988, but these surveys may not fully reflect the stockmarket crash. The Commerce Department's survey, taken in Octoberand November, found that business expected to increase capital
12. In September, the national rate for office vacancies in metropolitan areas, compiled by ColdwellBanker, stood at 20.9 percent-down slightly from a peak of 21.5 percent in March 1987, but upmore than five percentage points from four years earlier. The office vacancy rate for downtownmetropolitan areas, which is available over a longer period, is up more than 12 percentage pointsfrom 1980.
24 THE ECONOMIC AND BUDGET OUTLOOK February 1988
spending by 7.3 percent in 1988. Because the method used by the Com-merce Department for forecasting changes in prices of plant andequipment indicates no inflation in capital goods prices in 1988, theCommerce survey implies that real capital spending would also in-crease 7.3 percent. Manufacturers anticipated slightly larger in-creases than did nonmanufacturers, apparently because of theimprovement in the trade balance. The largest increases wereplanned in nondurable goods manufacturing industries such as paperand chemicals, where capacity utilization rates have been relativelyhigh. A significant increase in petroleum industry investment repre-sented a turnaround after a decline in capital spending of almost one-third in 1986 and virtually no growth in 1987. The McGraw-Hill sur-vey, which is based on a smaller sample than the Commerce Depart-ment's and was taken before the stock market crash, showed anincrease of 6.2 percent in intended capital spending in 1988. It foundthat business expected capital goods prices to increase by 4.2 percent,implying an increase of only 2 percent in real spending.
Housing. Since early 1986, changes in the tax treatment of rentalhousing have made it a significantly less attractive investment; as aresult, the rate of new multifamily construction fell dramaticallythroughout 1986 and 1987 (see Figure 1-8).
The sharply reduced rate of multifamily construction has not ledto widespread shortages, however, because the demand for such hous-ing has grown slowly. The vacancy rate for rental units is near the topof its historical range, and rents have recently been increasing at justbelow the underlying rate of inflation (about 4 percent). Growth indemand for this housing segment—and for housing in general—hasslackened as the majority of the baby-boom population passed the ageof peak household formation. In the next few years, the rate of house-hold formation is likely to fall further-perhaps by as much as 20 per-cent or 25 percent. Since young households disproportionately choosemultifamily housing, this sector of construction will be affected muchmore than construction for single families. Indeed, multifamilyhousing construction fell sharply in December, though the fall mayhave been exacerbated by temporary factors.
Construction for single families, less affected by the recent demo-graphic and tax changes, remained quite flat most of 1987 at a rate of

CHAPTER I THE ECONOMIC OUTLOOK 25
Figure 1-8.
HousingNew Single-Family and Multifamily Housing Starts
g I I Etl I I I I I I I I E l I I I ti I I I I Itll H..I I I I I I
1960 1965 1970 1975 1980 1985
SOURCES: Congressional BudgetOffice; Department ofCommerce, Bureau ofthe Census.
4 -„>!
Vacancy Rate for Rental UnitsP T P T P fP T
i i l i I I I I I I <1960 1965 1970 1975 1980 1985
81-615 - - 2

26 THE ECONOMIC AND BUDGET OUTLOOK February 1988
about 1.1 million starts; it was a little higher at the beginning of theyear when interest rates were lowest, and dropped to about 1 millionunits in December. The reported median price of a new home jumped16 percent during 1987. This rapid increase apparently reflected achange in the type of housing sold, however, since construction costsonly increased at the recent trend rate of about 4 percent (see Figure1-9). Some analysts ascribe the shift toward more expensive homes tothe reduced importance of new household formation in housing sales—so that a larger proportion of new homes are bought by people tradingup. Also, the relative decline of new home construction in the South-west means that a larger proportion of new homes are being built inthe Northeast where land and construction costs are higher.
The declining rate of household formation, and the expectedincrease in interest rates in 1988, are likely to dampen housing startsin 1988 and 1989, even as real income continues to grow moderately.Real residential investment, which fell slightly in 1987, is expected todecline in 1988 also. If interest rates increase more rapidly than cur-rently projected, housing activity could be cut further. Most reces-sions since World War IE have begun with a sharp interest-rate in-crease and a collapse of housing starts to less than 1.2 million unitsoverall, compared with the recent rate of 1.4 to 1.8 million.
Figure 1-9.Construction CostIndex and MedianPrice of New Homes
SOURCES: Congressional BudgetOffice; Department ofCommerce, Bureau ofthe Census.
1.4
1.0
0.6
0.2
- -----
i i i i
T P
1 1
MedianPrice(right scale)
1 1 1
TP
Construction-Cost Index(left scale)
1 1 1 1 1
120
80
a*o
i
40.
1965 1970 1975 1980 1985

CHAPTER I THE ECONOMIC OUTLOOK 27
Figure 1-10.
The Real Trade Balance
1970 1975 1980 1985
SOURCES: Congressional Budget Office; Department of Commerce, Bureau of Economic Analysis.
"Nonpetroleum, nonagricultural merchandise.
Foreign Trade. The real trade balance made its long-awaitedturnaround in 1987 (see Figure 1-10). On a National Income andProduct Accounts (NIPA) basis, constant dollar net exports (a measureof the difference between exports and imports adjusted for inflation)improved by $12 billion in 1987, and the rate of improvement was in-creasing as the year progressed. At year end, net exports were almost$21 billion greater at an annual rate than a year earlier. CBO fore-casts that real net exports will continue to grow vigorously over thenext two years. This forecast is based on the recent and projected de-preciation of the dollar and an assumption that average economicgrowth among U.S. trading partners will be higher than in the UnitedStates.13/ Capacity constraints in some exporting industries could,however, limit the rate of improvement in net exports. Slower growthin domestic demand will keep capacity constraints from becomingwidespread, but some of the industries that made solid export gains in1987 are already running at high utilization rates.
13. Average growth among the industrialized trading partners is expected to be comparable to that ofthe United States over the next two years; growth among the developing-country trade partners isforecast to be significantly stronger, however.

28 THE ECONOMIC AND BUDGET OUTLOOK February 1988
Nonagricultural, nonpetroleum import prices have increasedabout 14 percent since early 1985, which is not as much as one mightexpect given the 40 percent decline in the dollar. Real production costsmay have fallen in some foreign countries because of technologicaladvances, particularly in the newly industrializing countries of thePacific Basin, and this lowering of costs may have offset part of the fallin the dollar.
The slower growth in foreign prices does not explain much of thesmall response of import prices to the dollar depreciation, however,because prices of goods imported into the United States grew at amuch slower rate than foreign prices in U.S. dollar terms (see FigureI-11). The reasons for the gap are not well understood, but several con-tributing factors have been suggested:
o Prices of nontraded goods and services are rising faster thanprices of traded goods in many foreign countries. Becausesuch goods and services are not included in U.S. imports,U.S. import prices are not increasing as fast as foreign con-sumer prices.
Figure 1-11.Foreign andU.S. Import Prices
SOURCES: Congressional BudgetOffice; Department ofCommerce, Bureau ofEconomic Analysis;International MonetaryFund.
125
100Oo
IIo
I 75Xu•ae
50
25
0
Foreign Prices9
U.S. ImportPrices"
i i i i i i I I I I1965 1970 197S 1980 198S
a Foreign consumer prices converted to U.S. dollars for 18 countries weighted by shares in U.S. non-petroleum imports.Fixed-weight price index for nonpetroleum merchandise imports.

CHAPTER I THE ECONOMIC OUTLOOK 29
o Exporters to the United States have resisted raising theirprices; they have preferred to cut profit margins instead tomaintain their share of the U.S. market.
o Evidence shows a switch in the source of some importedgoods away from countries with currencies that have appre-ciated the most against the dollar, toward those suppliers,such as the newly industrializing countries of the PacificBasin, whose currencies have not experienced comparableappreciation.
Whatever the reasons for the moderate increase in import pricesin the past, further durable improvement in the trade balance willprobably require that import prices rise substantially relative todomestic prices. That increase may occur after a further decline in theexchange rate, or as a result of a passthrough of the exchange ratedecline that has already occurred, or both.
Growth in real merchandise imports slowed sharply in 1987, asnonpetroleum merchandise imports rose at less than half the rate ofthe previous year. The increase in import prices since 1985 explainsmost of the decline in import growth. A fall in real nonpetroleum mer-chandise imports is anticipated over the next two years in response toa more rapid increase in import prices.
Despite a surge in oil imports in the middle of 1987 that wasprompted by concerns over possibly higher prices and a shutdown ofsupplies from the troubled Persian Gulf area, annual real oil importsrose only 5.1 percent over 1986. Heavy imports in the third quartercombined with only modest growth in oil demand to push year-endstocks to high levels, which should depress the demand for oil importsin early 1988 while the excess stocks are being worked off. The pros-pects are good for only moderate growth of real petroleum importsover the forecast period.
Both real agricultural and nonagricultural merchandise exportsgrew strongly in 1987 because of lower agricultural prices and thecheaper dollar. Agricultural exports rose 17 percent in 1987 and non-agricultural merchandise exports by 15 percent. CBO expects thattotal merchandise exports will continue to grow in 1988 at almost the1987 rate, in response to the depreciating dollar and relatively faster

30 THE ECONOMIC AND BUDGET OUTLOOK February 1988
income growth among U.S. trading partners. In 1989, some-whatfaster increases in export prices will partly offset the effects of thedepreciating dollar, so that real nonagricultural export growth rateswill slow down but still remain strong.
Real net services exports are expected to increase slightly in both1988 and 1989. The services trade balance in the national incomeaccounts consists of net factor service income (the inflow of interestand profit income earned on U.S.-owned assets located abroad, less theoutflow of income earned by foreign residents on foreign-owned assetsin the United States), and the net nonfactor service income from trans-portation, tourism, insurance, and other services. The balance onfactor services has been trending down since 1982, primarily becauseof the increase in interest payments on the rapidly rising U.S. foreignindebtedness. The net factor income component of services trade is ex-pected to continue to shrink over the forecast horizon because of thesteadily increasing debt.14/ The nonfactor service balance, however,is expected to grow steadily. The improvement in that component ofthe services balance is expected to more than offset the steady deteri-oration in factor services throughout the forecast period.
The State and Local Sector. Real purchases by states and localgovernments rose 3.2 percent last year, compared with growth of 4.8percent in 1986 (see Table 1-4). Most of the slowdown resulted from areduced rate of construction spending after the extraordinary 12.5percent growth recorded in 1986. Further slowing in the growth ofstate and local purchases is expected during the forecast period, re-flecting a reduction in the level of real construction expenditures.
The budgets of state and local governments (excluding social in-surance trust funds) registered an estimated deficit of $6.3 billion in1987, the first annual deficit since 1982 and the second largest onrecord. The outlook is for little improvement over the forecast period,despite a slower growth of purchases. 157 With only a moderate growth
14. By the end of 1987, U.S. net foreign liabilities probably exceeded $400 billion, and by the end of1988 they are likely to be well above $500 billion.
15. Because the NIPA definition of state and local budgets (excluding social insurance trust funds)incorporates bond-financed capital spending, these budgets need not show a balance over timedespite requirements by most states and localities to balance current account receipts and outlays.In fact, these budgets were in deficitfrom 1958 to 1971.

CHAPTER I THE ECONOMIC OUTLOOK 31
in trust fund surpluses, the overall surpluses of states and localitieswill be much less of an offset to the federal deficit than was the caseduring the 1984-1986 period when the surpluses (excluding trustfunds) averaged $14.4 billion a year.
The Labor Market
Rapid employment growth in 1987, which was widespread amongindustries, caused the unemployment rate to decline to levels not seensince 1979. Nevertheless, wages continued to behave moderately,showing only slight acceleration. Productivity growth was high inmanufacturing, though only mediocre in the nonfarm business sector.Unit labor costs in manufacturing actually fell, helping, along withthe depreciation of the dollar, to make U.S. goods more competitiveinternationally.
TABLE 1-4. STATE AND LOCAL GOVERNMENT PURCHASESAND BUDGET BALANCES
1985 1986 1987 1987:1 1987:11 1987:111 1987:IV
In Billions of 1982 Dollars
Total PurchasesStructuresAll other
Total PurchasesStructuresAll other
402.7 422.1 435.6 432.348.4 54.4 55.3 56.7
354.4 367.7 380.3 375.6
Percent Change(Annual rate)
4.16.63.7
4.812.53.8
3.21.73.4
5.017.23.3
434.155.3
378.8
1.7-9.53.5
435.453.7
381.7
1.2-11.1
3.1
440.555.6
384.9
4.814.93.4
In Billions of Dollars
Total SurplusSocial insurance
trust fundsOther funds
63.1
47.116.0
56.8
49.47.4
45.4
51.7-6.3
41.0
50.2-9.1
50.6
51.0-0.4
46.5
52.1-5.6
43.4
53.4-10.0
SOURCES: Congressional Budget Office; Department of Commerce, Bureau of Economic Analysis.

32 THE ECONOMIC AND BUDGET OUTLOOK February 1988
Employment and Unemployment. Payroll employment grew at arobust 3.0 percent rate during 1987, compared with the 1.9 percentrate in 1986 (see Figure 1-12). The growth also occurred in more in-dustries than in 1986. Seventy-three percent of the industries in theBureau of Labor Statistics' Diffusion Index had gains in payrolls in1987, compared with approximately 50 percent in 1986. Employmentin service-producing industries continued to increase more rapidlythan in the nonfarm economy as a whole, although financial servicesshowed signs of slowing. Manufacturing payrolls, reflecting an im-proved competitive position internationally, began to share in thegrowth after a period of weakness in 1985 and 1986. In December1987, manufacturing payrolls were up approximately 400,000 fromDecember 1986, compared with a decrease of 162,000 during theprevious 12 months.
Although the labor force continued to grow at a moderate 1.8percent pace during 1987, employment grew more rapidly so that ci-vilian unemployment fell from 6.7 percent in late 1986 to 5.8 percentin late 1987.
Figure 1-12.
Private NonfarmEmployment
10
o
I -BSOURCES: Congressional Budget
Office; Departmentof Labor, Bureau ofLabor Statistics,establishment surveydata.
-10
Service-Producing -I
Total
iii
Goods-Producing
1980 1982 1984 1986

CHAPTER I THE ECONOMIC OUTLOOK 33
An unemployment rate below 6 percent causes some economists tobe concerned that labor markets have become tight enough to stimu-late inflationary pressures. As was discussed in the August report,CBO does not expect significant price pressures from labor markets atcurrent unemployment rates. Significant demographic changes sincethe late 1970s have reduced the intensity of wage pressures at thislevel of unemployment.16/ In addition, income transfer programs,such as unemployment insurance, have been tightened up consider-ably during the 1980s, and labor and management now appear to bemuch more concerned about staying competitive than they were dur-ing the 1970s.
Employment growth in the manufacturing sector, particularly insuch basic industries as iron and steel and chemicals, has until re-cently been relatively weak compared with previous economic expan-sions, in part because of the severity of the recession that preceded thisexpansion and because of unusually intense foreign competition. Forthese reasons, unemployment remained relatively high in the so-called smokestack industries of the Midwest. But during 1987, em-ployment in manufacturing rose, and labor market slack declined sig-nificantly. In fact, recent surges in demand in some manufacturingindustries may even be causing slowdowns in production because ofshortages in the supply of some skilled workers.
Wages, Productivity, and Unit Labor Costs. The lack of inflationarypressure in the labor market can be seen in Table 1-5. Growth in com-pensation per hour in the nonfarm business sector has not accelerated.In fact, nominal compensation did not keep pace with the cost of livingduring 1987.17/ Compensation per hour deflated by the CPI fell 1.6percent from the end of 1986 to the end of 1987.
Wage growth in 1987 remained in the 3 percent to 4 percent rangeof the previous three years. Wages have been rising more slowly inunionized industries, blue-collar occupations, and goods producingindustries. As previously stated, labor market slack became somewhatmore evenly distributed in 1987, so these patterns of differential wage
16. Congressional Budget Office, The Economic and Budget Outlook: An Update (August 1987), pp.14-15.
17. Compensation per hour includes wages and salaries, supplements, employer contributions toemployee benefit plans, and employer-paid payroll taxes.

34 THE ECONOMIC AND BUDGET OUTLOOK February 1988
increases may not persist. If labor supply problems do develop in somemanufacturing industries, the pattern may even be reversed.
Productivity growth in the manufacturing sector continued tosignificantly outpace productivity growth in the nonfarm business
TABLE 1-5. NOMINAL WAGE AND COMPENSATION RATESIN THE NONFARM BUSINESS SECTOR(Percent change over fourth quarter of previous year)
1984 1985 1986 1987IV IV IV IV
Compensation
Compensation per Hour a/ 4.2 4.8 3.4 2.8
Employment Cost Index b/ 4.9 3.9 3.2 3.3Union 4.3 2.6 2.1 2.8Nonunion 5.2 4.6 3.6 3.6
Wages and Salaries
Average Hourly Earnings Index c/ 2.8 3.1 2.3 2.7
Employment Cost Index b/UnionNonunion
ManufacturingNonmanufacturing
Service-producingGoods-producing
White-collarBlue-collar
4.13.44.5
4.44.0
4.43.8
4.43.6
4.13.14.6
3.64.5
4.73.5
4.93.4
3.12.03.5
3.33.0
3.03.2
3.42.5
3.32.63.6
3.43.4
3.53.2
3.73.0
SOURCE: Congressional Budget Office; Department of Labor, Bureau of Labor Statistics.
a. Quarterly data, not adjusted for overtime or for changes in the mix of industries or occupations.
b. Adjusted for overtime and for changes in the mix of industries and occupations; not seasonallyadjusted.
c. Adjusted for overtime in manufacturing and for changes in the mix of industries.

CHAPTER I THE ECONOMIC OUTLOOK 35
sector as a whole in 1987. Productivity was up 1.4 percent in the non-farm business economy, and 3.3 percent in manufacturing. Given themoderate pace of wage increases, this growth in productivity meantthat unit labor costs rose at a relatively slow pace for the overallnonfarm business economy (see Figure 1-13). In manufacturing,which is of particular relevance for international trade, unit laborcosts have actually been falling; at the end of 1987, they were down 2.2percent from a year earlier.
Figure 1-13.Productivity and Unit Labor Costs
Manufacturing
1965 1970 1975 1980
Nonfarm Business
1985
15
g 10sa.
I 5
S 0
^
/V1
r\ UnitLabor Cost
V Productivity
I i i
1965 1970 1975 1980 1985
SOURCES: Congressional Budget Office; Department of Labor, Bureau of Labor Statistics.

36 THE ECONOMIC AND BUDGET OUTLOOK February 1988
Inflation
The Consumer Price Index for Urban Consumers (CPI-U) increased4.4 percent between December 1986 and December 1987, comparedwith only 1.1 percent during the previous year. But the upturn wascaused almost entirely by the 8.2 percent increase in energy prices.When energy and other volatile components of the price index (foodand used cars) are left out, CPI-U growth has remained relativelystable at about 4£ percent since 1983 (see Figure 1-14). This under-lying stability can be ascribed largely to moderate wage increases,leading many forecasters to project similar moderation in consumerprices for 1988.
Though increases in food and energy prices are likely to be small,three factors suggest that the underlying inflation rate for consumergoods will rise in the near future. First, as already noted, importprices are likely to rise more quickly in 1988 than in 1987. Second,prices for crude materials and intermediate goods have increasedsharply over the past year. Although these higher prices have not yet
Figure 1-14.Measures of Inflation
12
j I
Stripped CPIa
CPIb
i i I
1965 1970 1975 1980 1985
SOURCE'S: Congressional Budget Office; Department of Labor, Bureau of Labor Statistics.a CPI-U excluding food, energy, and used cars.
CPI-U from January 1983 to present; before that time the series incorporates a measure of home-ownership conceptually similar to that of the current CPI-U.
CHAPTER I THE ECONOMIC OUTLOOK 37
been reflected in finished goods, they can be expected to affect con-sumer prices this year. Third, rates for manufacturing capacity utili-zation are generally above average, and those for nondurable manu-facturing (particularly chemicals, paper and products, and textiles)are at especially high levels.
Energy Prices. Energy prices rose sharply in the first quarter of 1987and continued to increase throughout most of the year. BetweenDecember 1986 and the end of 1987, energy prices rose 8.2 percent andgasoline prices rose 18.6 percent.
In late 1987, however, crude oil inventories rose above normallevels in the United States. This increase was a factor in the 15 per-cent fall in the spot price of petroleum between August 1987 andJanuary 1988. Although the war in the Persian Gulf could disruptsupply, jumps in oil prices seem less likely. The forecast assumes thatthe refiners' acquisition price of imported oil will increase slowly, fromabout $16.50 per barrel in early 1988 to about $18 by the end of 1989.
THE FORECAST AND PROJECTIONS
CBO's economic projection has two parts: a short-term forecast ofeconomic conditions through 1989, contingent on specific policy as-sumptions; and a medium-term projection through 1993 based on his-torical trends and other assumptions about economic growth.
The Short-Run Forecast
The events described earlier in this chapter, in particular the Octoberstock market collapse and the financial turbulence that surrounded it,have substantially changed the outlook for the economy since CBO'slast report (August 1987). Consumption boomed in the third quarter,in part because of incentives for auto sales, and then dropped in thefourth quarter. To the extent that the apparent increase in stockmarket wealth had fueled the boom in consumption, the market'scollapse may have been in part responsible for the fourth quarter'sdrop in nonautomobile consumption—the first since 1981. Weaknessin consumption, on its own, would lower GNP forecasts. But the finan-

38 THE ECONOMIC AND BUDGET OUTLOOK February 1988
cial crisis also apparently led to a (possibly temporary) shift in theemphasis of monetary policy that permitted interest rates to fall, evenat the cost of a sharp fall in the dollar at the end of 1987. Since theturn of the year, long-term interest rates have fallen by about 100basis points, but the dollar has strengthened. Even though the moneysupply has not grown since October, interest rates are now substan-tially below their pre-crash levels.
Although monetary policy coordination among the industrialcountries is commonly thought to be necessary to manage a smoothtransition to a lower U.S. trade deficit, it may prove hard to achieve.The dollar needs to fall gradually to a level that will correct trade im-balances, permitting smooth adjustment by countries losing exportsand reducing the risk of higher inflation in the United States. Asmentioned earlier, however, some governments are concerned thattheir intervention in support of the dollar may increase their own in-flation. Should they decide to allow their own interest rates to rise,the risk of a further slide in the dollar or an increase in U.S. interestrates would be heightened.
Most forecasters see these possibilities as substantially increasingthe probability of a recession. Almost all postwar recessions havebeen preceded (and, many economists argue, precipitated) by financialrestraint.18/ In addition, some forecasters note that the sharp dollardecline in late 1987 may lead to more rapid increases in consumerprices before the end of 1988, possibly causing the Federal Reserve tomove further toward financial restraint. Finally, a few early indi-cators seem to suggest problems developing at the end of 1987 and thebeginning of 1988: large inventory increases, a sharp upturn in initialunemployment claims, a sharp drop in housing starts, and the declinein real personal consumption expenditures in the last quarter of 1987.
Several factors argue, however, against a recession in 1988:
o The drop in the exchange rate over the last three years alsopromises to bring a large improvement in real net exports.
18. See Otto Eckstein and Allen Sinai, "The Mechanisms of the Business Cycle of the Postwar Era," inRobert Gordon, ed., The American Business Cycle: Continuity and Change (Chicago: University ofChicago Press, 1986).

CHAPTER I THE ECONOMIC OUTLOOK 39
o Interest rates since the crash have fallen to levels that pre-vailed before the sharp run-up in the third quarter of 1987—perhaps before the rate spike could have serious effects onreal economic activity. Long-term rate declines were partic-ularly sharp in January, reflecting lower prospects for short-run growth and somewhat increased confidence in the short-term stability of the dollar. Some economists argue that thefinancial crisis actually reduced the likelihood of recessionby correcting financial misalignments that might otherwisehave precipitated a recession. Moreover, interest rates havefallen around the world, improving growth prospects every-where.
o Though inflation will probably increase in 1988, the increaseis likely to be lessened by the current weakness of the oilmarket—which may reduce the necessity for a tightening ofmonetary policy.
For these reasons, CBO does not forecast a recession, though theoutlook for the economy is substantially weaker and riskier than thatpresented in the CBO summer report. Real GNP is expected to growat a rate of 1.8 percent in 1988 and 2.6 percent in 1989 (measured fromfourth quarter to fourth quarter). Inflation is expected to averageabout 4.9 percent as measured by the Consumer Price Index. TheGNP deflator is expected to increase more slowly than the CPI, sincethe step-up in inflation is driven mainly by import prices. The unem-ployment rate, which fell sharply at the end of 1987, will rise as GNPgrowth slows, reaching about 6.2 percent on average in 1988 beforedropping slightly in 1989.
The expected slowing of economic growth in 1988 largely reflects asharp decline in the rate of accumulation of inventories. Inventorieswere built up throughout 1987, until in the fourth quarter inventorygrowth accounted for practically all of the increase in GNP. The re-turn to more normal rates of accumulation will reduce output growthsharply, particularly in the first half of 1988.
Other components of domestic demand are also expected to beweaker than they were in the first three quarters of 1987. Consumershave already cut back, pushing up the personal saving rate in thefourth quarter of 1987 to a level last seen in early 1986; the growth of

40 THE ECONOMIC AND BUDGET OUTLOOK February 1988
consumption in 1988 and 1989 is expected to be limited by slow growthin real disposable income. Because of higher interest rates expectedlater in the year, together with the slowing of household formation inthe next few years, it is unlikely that housing activity will rise muchabove current levels. Surveys done around the time of the marketcrash showed that businesses were planning to increase real invest-ment on plant and equipment by 2 percent to 7 percent, but these sur-veys probably did not reflect the impact of the crash on spendingplans. Federal purchases of goods and services have been a majordirect contributor to the growth of aggregate demand over the last fiveyears, but in 1988 real federal purchases will decline substantially.
The only significant source of growth will be the trade sector. Thesluggishness of its response so far to the fall in the dollar has puzzledeconomists, but most forecasters agree that the recent upturn in realnet exports will continue.
The short-term forecast (Table 1-6) extends through the end of1989, and is based on the following assumptions:
o Fiscal Policy: Federal tax and spending policies are con-sistent with the CBO baseline described in Chapter II, im-plying a moderately restrictive fiscal stance in 1988.
o Interest Rates: Interest rates rise in 1988 from current levels,reflecting both higher expectations of inflation (which par-ticularly affects long rates) and also efforts to slow thedecline of the dollar. The increase in rates is delayed untilthe second half of 1988 because of slow real growth in thefirst part of the year.
o Exchange Rates: Although the nominal trade deficit beginsto improve, it remains high enough to exert downward pres-sure on the exchange rate. The dollar depreciates by nearly10 percent between early 1988 and the end of 1989.
o Oil Prices: The refiners' acquisition price of imported oildrops from about $18.30 per barrel in the fourth quarter of1987 to about $16.50 per barrel in the current quarter, andthen returns to about $18 by the end of 1989.

CHAPTER I THE ECONOMIC OUTLOOK 41
CBO expects growth of both nominal and real GNP to slowsubstantially in 1988. The level of nominal GNP in 1988 is nowexpected to be about 1 percent lower than forecast last summer; thisdrop will be only partly made up in 1989 by a slight increase inprojected inflation for that year. Interest rates, particularly long-termrates, will be substantially higher than those forecast last summer,reflecting the constraints on monetary policy that now appear muchtighter than they did last summer.
Medium-Term Projections
The medium-term projections (1990-1993) are based on methodsdescribed in Appendix B. The projections reflect the assumptions that,apart from business cycles, the economy's growth depends largely onthe growth of the labor force, and that—again apart from businesscycles—the growth of the economy relative to the labor force will be
TABLE 1-6. THE CBO FORECAST FOR 1988 AND 1989
Actual Forecast1986 1987 1988 1989
Fourth Quarter to Fourth Quarter(Percent change)
Nominal GNP 4.5 7.2 5.7 6.9Real GNP 2.2 3.8 1.8 2.6Implicit GNP Deflator 2.2 3.3 3.9 4.2CPI-Wa/ 0.9 4.5 4.9 4.8
Calendar-Year Averages(Percent)
Unemployment RateThree-Month Treasury Bill RateTen- Year Government Bond Rate
7.06.07.7
6.25.88.4
6.26.29.3
6.16.79.5
SOURCE: Congressional Budget Office; Department of Commerce, Bureau of Economic Analysis;Department of Labor, Bureauof Labor Statistics; Federal Reserve Board.
a. Consumer Price Index for urban wage earners and clerical workers.

42 THE ECONOMIC AND BUDGET OUTLOOK February 1988
about what it has been in recent years. Cyclical changes will pre-sumably affect the level of activity during the projection years, butCBO does not attempt to predict when they will occur or what willprecipitate them. Thus, the medium-term outlook should be thoughtof as an average of a number of possible paths of the economy.
In the projections, real GNP grows at an average annual rate ofabout 2.7 percent from 1989 to 1993, while the civilian unemploymentrate falls to about 5.8 percent (see Tables 1-7 and 1-8). This rate is stilla little above the level that might increase inflation. As measured bythe GNP deflator, inflation stays at 4.1 percent, close to its historicalaverage of 4.3 percent since 1950, though a little below the short-termforecast for the end of 1989 (which assumes a sharp decline in the dol-lar between 1987 and 1989). The CPI growth rate is expected on aver-age to be held above the growth of the GNP deflator by further de-clines in the dollar over the medium term. Interest rates also declinefrom their forecast levels in 1989 to levels consistent with the histori-cal average of real interest rates in the period since exchange ratesbegan floating.
The Tax Base
The tax base from which federal revenues are drawn has risen duringthe 1980s relative to the economy as a whole, for three reasons:
o Personal interest income has grown, in association with in-creasing federal net interest payments and the rapid ac-cumulation of household debt; 197
o Federal subsidies for agriculture have risen; and
19. Household debt creates both interest payments and interest receipts. These interest paymentswere tax deductible under previous tax laws, though the calculation of tax bases in the NationalIncome and Product Accounts (NIPA) does not reflect this fact. The interest receipts go directly tobanks, but (given net business interest payments) they eventually increase personal interestincome. Net interest payments by business are factor income payments included in GNP, whilepersonal interest payments are treated as transfers that are not included in GNP but are includedin the NIPA tax base. Thus, an increase in personal interest payments raises the NIPA tax baserelative to GNP. This increase has little effect on tax revenues.

CHAPTER I THE ECONOMIC OUTLOOK 43
o Economic depreciation has decreased relative to GNP,mainly because of a relative decline in the prices of capitalgoods (especially computers).
The tax base is projected to grow at only about the same rate asGNP in the next few years (see Figure 1-15). The scheduled increases
TABLE 1-7. MEDIUM-TERM ECONOMIC PROJECTIONSFOR CALENDAR YEARS 1990 THROUGH 1993
Actual Forecast1987 1988 1989
Nominal GNP(Billions of dollars) 4,486 4,744 5,068
Nominal GNP(Percent change) 5.9 5.8 6.8
Real GNP(Percent change) 2.9 2.3 2.6
Implicit GNPDeflator(Percent change) 3.0 3.4 4.1
CPI-W(Percent change) 3.6 4.5 4.9
UnemploymentRate (Percent) 6.2 6.2 6.1
Three-MonthTreasury BillRate (Percent) 5.8 6.2 6.7
Ten-YearGovernmentBond Rate(Percent) 8.4 9.3 9.5
Tax Bases(Percent of GNP)
Corporate profits 6.8 6.4 6.4Wage and salary
disbursements 49.3 49.4 49.6Other taxable
income 21.2 21.2 21.2
Total 77.3 77.0 77.2
Proiected1990 1991 1992 1993
5,414 5,782 6,179 6,606
6.8 6.8 6.9 6.9
2.6 2.6 2.7 2.7
4.1 4.1 4.1 4.1
4.6 4.4 4.4 4.4
6.0 5.9 5.9 5.8
6.6 6.4 6.1 5.9
9.0 8.4 7.8 7.4
6.3 6.2 6.2 6.2
49.7 49.7 49.8 49.8
21.3 21.3 21.2 21.0
77.3 77.3 77.2 77.0
SOURCE: Congressional Budget Office.

44 THE ECONOMIC AND BUDGET OUTLOOK February 1988
in Social Security taxes in 1988 and 1990 reduce the bases of othertaxes. Federal subsidies to business are expected to fall. Consumerssave more and borrow less, thus sharply reducing the growth of per-sonal interest payments. Federal net interest payments grow relativeto GNP through 1989, both because of the continued accumulation of
TABLE 1-8. MEDIUM-TERM ECONOMIC PROJECTIONSFOR FISCAL YEARS 1990 THROUGH 1993
Actual1987
Nominal GNP(Billions of dollars) 4,409
Nominal GNP(Percent change) 5.2
Real GNP(Percent change) 2.5
Implicit GNPDeflator(Percent change) 2.7
CPI-W(Percent change) 2.7
UnemploymentRate (Percent) 6.4
Three-MonthTreasury BillRate (Percent) 5.6
Ten-YearGovernmentBond Rate(Percent) 7.9
Tax Bases(Percent of GNP)
Corporate profits 6.7Wage and salary
disbursements 49.4Other taxable
income 21.0
Total 77.1
Forecast Projected1988 1989 1990 1991 1992 1993
4,678 4,984 5,326 5,687 6,077 6,497
6.1 6.5 6.9 6.8 6.8 6.9
2.8 2.4 2.6 2.6 2.7 2.7
3.3 4.0 4.1 4.1 4.1 4.1
4.4 5.0 4.7 4.4 4.4 4.4
6.1 6.1 6.0 6.0 5.9 5.8
6.1 6.7 6.7 6.4 6.1 5.9
9.1 9.6 9.2 8.6 8.0 7.5
6.5 6.4 6.4 6.3 6.2 6.2
49.4 49.5 49.7 49.7 49.8 49.8
21.2 21.2 21.3 21.3 21.2 21.1
77.1 77.1 77.3 77.3 77.2 77.1
SOURCE: Congressional Budget Office.

CHAPTER I THE ECONOMIC OUTLOOK 45
Figure 1-15.Income Shares
56
54
5 52O
I 50
48
Wage and Salary Disbursements
\
T P :¥ T P T
I I I
P T P T P TP T
14
12
10
1950 1955 1960 1965 1970 1975 1980 1985 1990
Corporate ProfitsP T P T P T
4 -
„£.
P T P T P TP T
* * * » » *
I I I I I
1950 1955 1960 1965 1970 1975 1980 1985 1990
Nonwage Income Share£3
23
1 21
Per
cent
of
CB
17
n
p
*v
V.
-
N 1 1
i;
II
-xj:
™
T P
^V /
1 1 1
8
1
:|:|
|
T P
y
1 |
|
|
1
j
b
T P
"^X.
1 1 1 1 1 1 1 1
w
T P
V1 1
kI
T P
^
1 1 1 1 I
rp
"V
f
T
-
f^J * * * * * » _J\ J
^r-
i , , , ,41950 1955 1960 1965 1970 1975 1980 1985 1990
SOURCES: Congressional Budget Office; Department of Commerce, Bureau of Economic Analysis.

46 THE ECONOMIC AND BUDGET OUTLOOK February 1988
federal liabilities and because of rising interest rates. After 1990,however, federal debt grows somewhat more slowly than GNP (underthe baseline fiscal assumptions), interest rates fall, and federal netinterest payments fall relative to GNP.
The projected changes in federal interest payments affect thenonwage income tax base, which rises relative to GNP through 1990and falls thereafter to around its 1987 level. These changes, however,do not significantly affect expected tax collections. The wage tax baserises slightly relative to GNP, partly because of the slow growth of theeconomy in 1988, and partly because real wage rates are projected toincrease slightly in the medium term, rather than decline as theyhave done throughout much of the 1980s. The economic profits taxbase is expected to be reduced by scheduled Social Security tax in-creases, one of which went into effect in the first quarter of 1988, aswell as by the upward trend in wages relative to GNP. The growth ofnet U.S. indebtedness will also tend to reduce economic profits, by in-creasing payments to foreigners of profits generated in the UnitedStates.
The Uncertainty of Economic Forecasts and Projections
Economic forecasts are always uncertain. Economists have consid-erably less than complete understanding of the world; the assump-tions that underlie forecasts prove wrong to a greater or a lesser de-gree; and truly novel events may occur-whether in the Persian Gulfor on Wall Street. One way to address this uncertainty in advance isto list the areas and assumptions that seem particularly uncertain, ashas been done in preceding paragraphs. Another approach is to ex-tract from the historical record some measure of how wrong any fore-cast could be, given about average luck. This tack was taken in theCBO report of last August, with respect to short-term forecasts of GNPand some related variables. Appendix C updates these estimates andextends a similar analysis to projections of real GNP for the currentand next five fiscal years. In projecting federal deficits, the main eco-nomic uncertainty in the short run seems to be the level of nominalGNP, while in the medium term it seems to be the level of real GNPsince the effects of inflation on revenues and outlays tend to canceleach other over time.

CHAPTER I THE ECONOMIC OUTLOOK 47
o Short Run. There are about two chances in three that thelevel of nominal GNP for fiscal year 1989 will be within $211billion, or 4.2 percent, of the forecast values. Given the infla-tion forecast, this range would imply real growth in fiscalyears 1988 and 1989 averaging between 0.3 percent—whichwould mean a substantial recession-and 4.6 percent, whichwould be less than the economy's performance in the 1982 to1985 period.
o Medium Term. There are about two chances in three thatthe level of real GNP in 1993 will turn out to be within 7 per-cent of its projected value, or that the average real growthrate between 1987 and 1993 will be between 1.6 percent and3.6 percent.
This approach assumes, as noted, that the forecaster has aboutaverage luck. Recent events, in particular the turmoil in financialmarkets, suggest that forecasting may be even more difficult now thanit usually is. First, the multiplication of economic forces and playersthat has accompanied the growing international openness of theUnited States make it more difficult to foresee the outcomes of eco-nomic policy decisions. Second, little is known yet about the responseof the economy to the October crash. Finally, the most recentexperience with a sudden massive fall in the stock market was the1929 crash. Fortunately, the economy has changed substantiallysince 1929 (the increased and stabilizing role of government is par-ticularly important); moreover, the policy responses that followed the1929 crash, and that helped precipitate the Great Depression, are notbeing followed now. Consequently, economists have no close his-torical parallel with which to gauge the likely course of the economyin 1988. In short, that useful tool of the forecaster-reasoning byhistorical analogy—is of less service now than usual.


CHAPTER II
THE BUDGET OUTLOOK
At $150 billion, the federal government's deficit in fiscal year 1987was well below the projections of most analysts. But the good news isalready past: under current policies, the deficit will most likely re-bound to $157 billion in 1988 and $176 billion in 1989, decliningslowly to $134 billion in 1993. As a percentage of gross national prod-uct (GNP), the deficit is projected to decline gradually after 1989.These stubborn deficits would be even higher were it not for recentspending cuts and tax increases carrying out the budget summitagreement that was reached last fall between Congressional leadersand the Administration. Table II-l summarizes the latest Congres-sional Budget Office (CBO) projections for federal government reve-nues, outlays, deficits, and debt.
Events since last summer have affected the deficit projections inopposing ways. The Congress and the Administration set new deficittargets, negotiated a major deficit reduction package, and enacted itinto law. But projected slower economic growth in the short run andhigher medium- and long-term interest rates have worsened the defi-cit outlook.
The rise in the deficit between 1987 and 1988 stems largely fromseveral special factors. Tax reform and a variety of one-time outlaysavings, such as asset sales and timing shifts, lowered 1987's deficit.But on balance, these same factors increase the deficit in 1988 through1990. As shown in Table II-2, if the revenue effects of the Tax ReformAct and various one-time outlay savings enacted in 1986 and 1987 areexcluded, the 1987 deficit is much higher at $187 billion, while deficitsfor 1988 through 1992 are virtually constant in the range of $154billion to $163 billion. This adjusted deficit declines steadily inrelation to GNP.
Economists, financial market participants, and others generallyfocus on the federal government's overall deficit because it determinesborrowing needs and affects economic activity. The Balanced Budget

50 THE ECONOMIC AND BUDGET OUTLOOK February 1988
and Emergency Deficit Control Reaffirmation Act of 1987, like itspredecessor passed in 1985, emphasized the importance of the overalldeficit and set dollar targets and procedures for automatic cutbackswhen the targets appear unlikely to be met otherwise. Nevertheless,certain programs are, by law, segregated and considered to be off-budget. The 1985 act placed the two Social Security trust funds (Old-Age and Survivors Insurance and Disability Insurance, referred to col-lectively as OASDI) off-budget immediately. The large and growingSocial Security surpluses contribute substantially to holding down theoverall deficit (see Table II-3). An earlier law, the Social SecurityAmendments of 1983, took Medicare's Hospital Insurance Trust Fundoff-budget starting with the fiscal year 1993 budget. The surplus inthe Medicare trust funds, while smaller than Social Security, is stillsignificant. (Social Security and Medicare are two examples of trustfunds that take in more than they spend. Further analysis of these
TABLE II-l. CBO BASELINE BUDGET PROJECTIONS(By fiscal year)
1987 1988 ProjectionsActual Base 1989 1990 1991 1992 1993
In Billions of Dollars
Revenues 854 897 953 1,036 1,112 1,181 1,262Outlays 1,005 1,055 1,129 1,203 1,269 1,332 1,396Deficit 150 157 176 167 158 151 134Debt Held by the Public 1,897 2,041 2,216 2,382 2,537 2,687 2,820
As a Percentage of GNP
Revenues 19.4 19.2 19.1 19.4 19.5 19.4 19.4Outlays 22.8 22.5 22.7 22.6 22.3 21.9 21.5Deficit 3.4 3.4 3.5 3.1 2.8 2.5 2.1Debt Held by the Public 43.0 43.6 44.5 44.7 44.6 44.2 43.4
Reference: GNP (Inbillions of dollars) 4,409 4,678 4,984 5,326 5,690 6,082 6,502
SOURCE: Congressional Budget Office.

CHAPTER II THE BUDGET OUTLOOK 51
two funds appears later in Box II-3, which also shows how other trustfunds contribute to the deficit or surplus.)
The Congress adjourned in late December thinking that it hadnailed down budget policies for two years. The deteriorating outlookfor the deficit, however, makes it unlikely that the Balanced BudgetAct targets can be met without further reductions. A later section ofthis chapter focuses on the fiscal year 1989 budget, explaining how theact will shape the coming debate.
Budget estimates depend closely on economic assumptions, whichare highly uncertain. This chapter describes the bands of uncertaintyaround the five-year deficit estimates and presents rough rules ofthumb for gauging the effect of individual economic variables such as
TABLE II-2. CBO BASELINE DEFICITS ADJUSTED FOR TAXREFORM AND ONE-TIME OUTLAY SAVINGS(By fiscal year)
1986 1987 1988 1989 1990 1991 1992 1993
In Billions of Dollars
Baseline Deficit 221 150 157 176 167 158 151 134
AdjustmentsTax reform
(Revenue effects)One-time outlay
savings a/
Subtotal
Adjusted Base-line Deficit
_2
2
223
22
15
37
187
-10
_7
-3
154
-16
_b/
-17
159
-4
_b/
-4
163
3
3
160
3
3
154
4
4
138
As a Percentage of GNP
Adjusted Base-line Deficit 5.4 4.2 3.3 3.2 3.1 2.8 2.5 2.1
SOURCE: Congressional Budget Office.
a. Includes assets sales and loan prepayments, timing shifts, and other factors (such as escrowreleases for the Outer Continental Shelf).
b. Less than $500 million.

52 THE ECONOMIC AND BUDGET OUTLOOK February 1988
TABLE II-3. CBO BASELINE PROJECTIONS FOR ON-BUDGETAND OFF-BUDGET REVENUES AND OUTLAYS(By fiscal year, in billions of dollars)
1987 1988Actual Base
Projections1989 1990 1991 1992 1993
RevenuesOutlaysDeficit
RevenuesOutlaysSurplus
641811170
21319420
657852195
On-Budget
694916222
753978225
Off-Budget(Social Security)
24020337
25921346
Total
28322558
8051,034
229
30723671
SOURCE: Congressional Budget Office.
8541,086232
32724681
9091,140231
35325697
RevenuesOutlaysDeficit
8541,005
150
8971,055
157
9531,129
176
1,0361,203
167
1,1121,269
158
1,1811,332
151
1,2621,396
134
real growth, inflation, and interest rates on the budget estimates. Thechapter concludes with more detailed descriptions of CBO's five-yearspending, revenue, and credit projections.
THE BASELINE CONCEPT
Baseline projections show the expected consequences of current bud-getary policies. They are not a forecast of budget outcomes, how-ever—especially beyond the current year—since the future will includemany policy changes. Rather, the baseline serves as a benchmark foranalyzing possible policy changes. Because many factors can cause

CHAPTER H THE BUDGET OUTLOOK 53
the deficit to grow or shrink from one year to the next, the baseline isconsidered more useful than a comparison with the previous year'snumbers for judging the effects of budget decisions.
The CBO baseline follows the specifications set forth in the re-vised Balanced Budget Act. The projections assume that current tax-ing and spending policies will continue unchanged. Projections arebased on the two-year economic forecast and the longer-run economicassumptions described in the preceding chapter. For revenues and forentitlement programs such as Social Security, the baseline is projectedaccording to current laws, with a few exceptions. In a departure fromthe act, a few large programs, such as Food Stamps and GuaranteedStudent Loans, are assumed to be extended after their currentlyscheduled expirations. On the revenue side, following the act's specifi-cations, excise taxes dedicated to four trust funds (the Airport and Air-way Trust Fund, the Leaking Underground Storage Tank Trust Fund,the Hazardous Substance Superfund, and the new Vaccine InjuryCompensation Trust Fund) are extended beyond their scheduled ex-pirations in 1990 through 1992. All other programs that expire undercurrent law are permitted to expire.
In contrast to entitlement programs, many government activitiesare controlled by funding levels set annually in appropriation acts.For these programs, the baseline assumes that future appropriationskeep pace with inflation. Offsetting receipts (for example, receiptsfrom Medicare premiums and oil leases) are estimated in light of cur-rent law and policy, and net interest in light of the assumed interestrates and deficits.
The specifications contained in the Balanced Budget Act, whichthe Office of Management and Budget (OMB) and CBO must follow,are close to the way CBO has long projected its baseline, with only twosignificant exceptions. First, for discretionary programs, the two bud-get agencies (in the absence of full-year appropriations) must extra-polate the previous year's funding levels using a single measure ofinflation, the implicit price deflator for gross national product. In thepast, CBO has often used special inflation rate assumptions suited toparticular programs; CBO has also assumed that a few activities growby more or less than inflation for special reasons (for example, extrafunding to carry out the decennial census). Appendix D describesprograms for which the use of such special assumptions remains a pos-sible alternative to the act's specifications.

54 THE ECONOMIC AND BUDGET OUTLOOK February 1988
The second change lies in the treatment of personnel costs. Theact requires the two agencies to use the overall inflation rate to projectpay raises for government employees as well as other spending. (If thePresident has formally proposed, or the Congress has enacted, a dif-ferent amount for the upcoming pay raise, this rate supersedes thegeneral inflation measure.) Previously, CBO assumed pay raises tiedto economywide average wage growth, generally slightly higher thaninflation. The act also requires OMB and CBO to assume that federal.agencies must absorb about one-fifth of the pay raise's initial cost outof their operating budgets. These more stringent specifications causeestimated costs of federal pay to grow less rapidly than previouslyassumed.
CBO developed a baseline using these specifications to aid in thesummit negotiations. Table II-4 shows how the baseline that was usedby the negotiators differed from CBO's projections of last August.
TABLE II-4. COMPARISON OF BUDGET SUMMIT BASELINEDEFICIT WITH CBO AUGUST 1987 ESTIMATES(By fiscal year, in billions of dollars)
1988 1989 1990 1991 1992
CBO August Baseline Deficit 183 192 176 165 151
Policy DifferencesRevenuesPay raisesOther programmatic
assumptionsMedicare premiumsDebt service
Total Differences
Budget Summit Baseline Deficit
—-1
-2-1a/
-3
180
—-2
-3-1-1
-6
186
—-3
-4-1-1
-10
166
a/-5
-4-1-2
-12
152
a/-8
-4-1-3
-16
135
SOURCE: Congressional Budget Office,a. Less than $500 million.

CHAPTER H THE BUDGET OUTLOOK 55
CHANGES IN THE ESTIMATESSINCE THE BUDGET SUMMIT
Even though the Congress substantially carried out the terms of1987's budget summit, the next five years are likely to be marked bypersistently high deficits unless there are further changes in bud-getary policy. In fact, the newest projections show some short-termbut little long-term improvement in the deficits that were projected byCBO last fall. The savings from implementing the budget summitagreement are virtually offset by reestimates attributable to revisedeconomic and technical assumptions (see Table II-5).
Recent Legislation: Carrying Out the Budget Summit Agreement
Legislation passed to carry out the summit agreement mainly reflectstwo omnibus bills-the reconciliation bill (Public Law 100-203) and acontinuing resolution (Public Law 100-202). These two laws changedboth revenues and outlays. Together, they raised revenues by $11 bil-lion in 1988 and by more in later years (see Table II-5). The reconcili-ation bill contributed most of the increases; roughly one-half of thebill's revenue gain comes from corporate taxes, one-quarter from ex-cise taxes, and the remainder from a variety of individual income, pay-roll, and estate tax provisions. By strengthening the enforcement re-sources of the Internal Revenue Service, the continuing resolution isexpected to contribute about $2 billion a year in extra revenues. Thetax provisions are described in more detail later in the chapter.
Legislation carrying out the summit agreement cut outlays in avariety of programs—including Medicare, farm price supports, anddefense and nondefense discretionary programs—and also permitted anumber of one-time savings such as loan prepayments. Box II-l de-scribes the savings already achieved under the budget summit as wellas those measures awaiting further action.
Some of the savings agreed to by the summit negotiators remainto be carried out and are not included in the new baseline. The agree-ment called for capping growth in discretionary appropriations—bothdefense and nondefense-below the amounts that would be required tocover inflation. The CBO baseline does not reflect these caps, how-

56 THE ECONOMIC AND BUDGET OUTLOOK February 1988
TABLE II-5. CHANGES IN CBO BASELINE ESTIMATES SINCENOVEMBER (By fiscal year, in billions of dollars)
1988 1989 1990 1991 1992
Revenues
November 1987 Estimate
Enacted LegislationEconomic ReestimatesTechnical Reestimates
Total
Current Estimate
November 1987 Estimate
Enacted LegislationEconomic Reestimates
Interest ratesCost-of-living adjustmentsDebt serviceOther
Subtotal
Technical Reestimates
Total
Current Estimate
November 1987 Estimate
Enacted LegislationEconomic ReestimatesTechnical Reestimates
Total
Current Estimate
897
11-7-3
S/
897
Outlays
1,077 1
-23
a/alaJ
_§/
1
a/
-22
1,055 1
Deficit
180
-349
_2
-23
157
954
16-12-5
-1
953
,140
-19
8-22
_1
8
_1
-11
,129
186
-3621_6
-10
176
1,036
18-13-5
S/
1,036
1,202
-22
18-342
20
3
1
1,203
166
-4033
_8
1
167
1,115
17-15-5
-3
1,112
1,267
-25
21-37
_2
27
a/
2
1,269
152
-4242_5
5
158
1,195
13-20-6
-13
1,181
1,330
-29
21-311
__3
31
al
3
1,332
135
-42517
16
151
SOURCE: Congressional Budget Office,a. Less than $500 million.

CHAPTER II THE BUDGET OUTLOOK 57
ever, because they will not be carried out until the 1989 appropriationprocess. Similarly, the baseline includes neither the asset sales in1989 that remain to be specified under the terms of the budget summitnor the additional revenues resulting from extra resources for enforce-ment.
Economic and Technical Changes
Recent legislation, in sum, has substantially met the goals of thebudget summit agreement. But these reductions are largely offset byrevisions stemming from new economic assumptions.
As discussed in Chapter I, CBO expects slow growth in the firsthalf of 1988. Projected revenues are about $7 billion lower in 1988,and $12 billion to $20 billion lower each year thereafter, because ofthe revised economic outlook (see Table II-5). Interest rates-espe-cially medium- and long-term rates-rose sharply between August andOctober before declining in the wake of the stock market crash. CBOforecasts that interest rates will climb gradually in the second half of1988 and will remain well above the levels assumed last August.These higher interest rates have little immediate effect but are ex-pected to raise outlays by $8 billion in 1989 and $21 billion in 1992.Partly mitigating the effect of lower growth and higher interest ratesare smaller cost-of-living adjustments in Social Security and otherretirement and disability programs, which reduce outlays by $2 bil-lion to $3 billion a year beginning in 1989, relative to earlier esti-mates. Smaller changes occur in other programs that are sensitive tothe economy, such as Medicare and Medicaid, Unemployment Insur-ance, and oil lease receipts.
Technical revisions, which primarily reflect more informationabout the effects of the Tax Reform Act of 1986, reduce projected reve-nues by $3 billion in 1988 and by slightly larger amounts in lateryears; these revisions are explained in a later section. Outlays, in theaggregate, are affected little by technical changes.

58 THE ECONOMIC AND BUDGET OUTLOOK February 1988
BOX H-lTHE BUDGET SUMMIT
Soon after the stock market crash of October 19, Congressionalleaders from both parties and representatives of the Adminis-tration began negotiations aimed at reducing the budget deficit.On November 20, the President and the negotiators announcedan agreement to cut the deficit by $30 billion in 1988 and $46billion in 1989. A month later, the Congress passed two laws-an appropriation measure and a reconciliation bill-carrying outthe agreement. The accompanying table summarizes the deficitreduction achieved in the two bills and in a few other, smallerpieces of legislation.
The summit agreement contains a novel feature: separatetwo-year limits on both defense and nondefense discretionaryappropriations. These appropriation caps, found in Section8001 of the Omnibus Budget Reconciliation Act of 1987 (PublicLaw 100-203), are to serve as the basis for the committee spend-ing allocations in the 1989 budget resolution. In the Senate, itwill not be in order to consider a 1989 budget resolution that isinconsistent with the caps, unless the point of order is over-ridden by a three-fifths vote.
The deficit reduction figures shown in the table do notreflect the 1989 savings from the appropriation cap becausethese savings remain to be enacted. Instead, they reflect 1989appropriations at the baseline level-that is, the 1988 amountsadjusted for inflation of roughly 4 percent. The caps, in con-trast, allow increases in budget authority of only 2.5 percent fordefense and 2.0 percent for nondefense programs. Adhering tothese limits would further reduce 1989 outlays by roughly $1billion in defense and $2 billion in nondefense programs. Sec-tion 8005 of the reconciliation bill calls for selling an additional$3.5 billion of assets in 1989. Finally, $0.4 billion in revenueswould result from further boosts in IRS enforcement resources.Together with the resulting savings in debt service costs, thesemeasures would save $7 billion, bringing the total 1989 deficitreduction to $43 billion.

CHAPTER H THE BUDGET OUTLOOK 59
Revenues
TaxesIRS Compliance (Gross)User Fees
Total Revenues
Outlays
National DefenseNondefense DiscretionaryEntitlements and Other Mandatory Spending
MedicareFarm price supportsPostal Service and Civil ServicePension Benefit Guaranty
Corporation premiumsVeterans Administration loan
sales and feesGuaranteed Student Loan balancesOther
Subtotal
Other User Fees (Offsetting receipts)Asset Sales and PrepaymentsDebt Service
Total Outlays
Deficit Reduction
Total Reduction to Date
1988
9.21.8
-0.5
10.5
5.12.5
2.11.20.8
0.4
0.80.20.2
5.7
0.87.71.3
23.1
33.6
1989
14.22.5
-0.6
16.1
7.41.6
3.80.90.6
0.4
0.8—
-0.4
6.2
0.9—
3.4
18.9
35.6
60 THE ECONOMIC AND BUDGET OUTLOOK February 1988
A CLOSER LOOK AT 1989
The key provisions and deadlines in the Balanced BudgetReaffirmation Act, which will shape the budget debate in the comingmonths, are summarized in Box II-2. The act requires across-the-board spending cutbacks, or sequestration, unless the Office of Man-agement and Budget projects a fiscal year 1989 deficit of less than$146 billion-the official $136 billion target plus a $10 billion margin.Alternatively, the Congress and the Administration can avoid auto-matic cuts by enacting $36 billion in deficit reductions between nowand October. The Congress could meet these targets in part by carry-ing out the budget summit's cap on discretionary appropriationgrowth, saving an additional $3 billion. The legislators could alsopass and carry out a budget resolution containing other deficit reduc-tion measures. The act, however, forbids counting certain types ofdeficit reductions toward the requirement. The budget summit agree-ment, for example, contemplates $3.5 billion of asset sales or loan pre-payments in 1989 that are yet to be specified; under the act, however,such asset sales or prepayments would not count as deficit reductions.
What would a 1989 sequestration look like based on today's pro-jections? CBO currently estimates the 1989 deficit at $176 billion, $40billion above the act's target. The maximum sequestration allowedunder the law, however, is $36 billion. Cutting $36 billion whollythrough sequestration would require reductions of approximately 9percent in defense programs and 13 percent in nondefense, nonexemptprograms. These required reductions are quite high, both because somuch of the budget is exempt and because spending lags necessitatelarge reductions in budget resources to achieve given savings in out-lays.
Estimates of across-the-board reductions at this time are merelypreviews. Ultimately, any cutbacks will depend on estimates made bythe Office of Management and Budget in August and October. Bythen, of course, the economic outlook may have changed again. As dis-cussed in the next section, such changes could have significant effectson the budget estimates.

CHAPTER H THE BUDGET OUTLOOK 61
BOX II-2THE BALANCED BUDGET REAFFIRMATION ACT
The Balanced Budget and Emergency Deficit Control Reaffirmation Act of1987 (Public Law 100-119) set new deficit targets for fiscal years 1988 through1993. The act also modified the automatic spending reduction, or sequestra-tion, procedures of the original Balanced Budget Act (Public Law 99-177) inorder to make them pass constitutional muster. The new deficit targetsestablished by the act are (by fiscal year, in billions of dollars):
Fiscal Year Billions of Dollars
1988 1441989 1361990 1001991 641992 281993 0
For 1989, across-the-board cancellation of budgetary resources would be trig-gered automatically if the deficit estimated on October 10,1988, exceeds $146billion (the $136 billion target plus a $10 billion margin of error) and if deficitreduction measures achieved since January 1,1988, total less than $36 billion.
Under the Balanced Budget Reaffirmation Act, the Director of the Officeof Management and Budget (OMB) determines each year whether or notsequestration is necessary and how large the cuts must be. TheCongresssional Budget Office (CBO) provides OMB and the Congress withadvisory reports, which provide a benchmark against which the Congress andothers may assess the OMB calculations. If either OMB or CBO projects realeconomic growth to be less than zero for any two consecutive quarters, or if theDepartment of Commerce reports actual real growth to have been less than 1percent for two consecutive quarters, the Congress may suspend many of theprovisions of the act. This year's timetable for the two agencies' reports andthe sequestration orders is as follows:
Snapshot date for initial reports August 15Initial CBO report August 20Initial OMB report August 25Initial sequestration order August 25Revised CBO report October 10Revised OMB report October 15Final sequestration order October 15

62 THE ECONOMIC AND BUDGET OUTLOOK February 1988
ECONOMIC UNCERTAINTY AND THE DEFICIT
Federal revenues and outlays are closely tied to economic conditions.Revenues depend heavily on taxable incomes-that is, wages and sal-aries, nonwage income such as interest, and corporate profits. Manyspending programs (for example, Social Security) contain explicit in-flation adjustments, while the baseline assumes that funding for otherprograms will be adjusted for overall inflation. Finally, interest costson the government's large and growing debt depend on interest rates.
Uncertainty surrounding these economic assumptions feeds theuncertainty about the budget estimates. Last summer, CBO analyzedpast Congressional budget resolutions and found that overly opti-mistic economic assumptions, on average, contributed about $23 bil-lion to errors in the deficit forecast for the following year, the largestsingle source of error. That report also described the statistical uncer-tainty of deficit forecasts done one year ahead. This section updatesand expands last summer's analysis to describe the uncertainty of thelong-run deficit forecast. But first it describes how economic variablesaffect the budget estimates and presents rough rules of thumb togauge their effects.
Rules of Thumb
Four economic variables—real economic growth, unemployment, infla-tion, and interest rates-have particularly strong effects on budgetprojections. Table II-6 shows the estimated budgetary effects of a onepercentage-point change beginning in January 1988 in each of thesefour variables. Such illustrations of the economy's effect on budget es-timates are commonly termed rules of thumb.
Real economic growth has powerful effects on the budget pro-jections. The baseline forecast assumes that real growth during the1988-1993 period averages about 2.6 percent a year. The first rule ofthumb shows what happens if real growth is one percentage pointlower each year. Wages and salaries, profits, and other incomes growless rapidly than in the baseline. After six years of subpar growth,both real and nominal GNP in 1993 are about 6 percent below their

CHAPTER H THE BUDGET OUTLOOK 63
TABLE II-6. EFFECTS ON CBO BASELINE BUDGET PROJECTIONSOF SELECTED CHANGES IN ECONOMIC ASSUMPTIONS(By fiscal year, in billions of dollars)
1988 1989 1990 1991 1992 1993
Real Growth: Effect of One-Percentage-PointLower Annual Rate Beginning January 1988
Change in Revenues -5 -18 -34 -52Change in Outlays 1 3 7 13Change in Deficit 6 21 41 64
Unemployment: Effect of One- Percentage- PointHigher Annual Rate Beginning January 1988
Change in Revenues -21 -35 -38 -40Change in Outlays 4 7 11 15Change in Deficit 24 42 48 55
Inflation: Effect of One-Percentage-PointHigher Annual Rate Beginning January 1988
Change in Revenues 4 16 27 41Change in Outlays 3 14 26 39Change in Deficit -1 -1 -1 -2
-711990
-421961
5552-3
-9128
119
-432467
7266-7
Interest Rates: Effect of One-Percentage-PointHigher Annual Rates Beginning January 1988, All Maturities
Change in RevenuesChange in Outlays 3 11 16 21 26 30Change in Deficit 3 11 16 21 26 30
Interest Rates: Effect of One-Percentage-PointHigher Annual Rates Beginning January 1988,
Medium and Long Maturities Only
Change inChange inChange in
RevenuesOutlaysDeficit
—11
—66
-1010
-1414
--1818
-2121
SOURCE: Congressional Budget Office.

64 THE ECONOMIC AND BUDGET OUTLOOK February 1988
baseline levels in this path. The most important effect of slowergrowth is on federal revenues, which are lower by $5 billion in 1988and $91 billion in 1993 (see Table IL-6). Higher unemployment alsoadds to spending, including unemployment compensation and pro-grams for the needy. After a year or two, however, the major spendingincrease associated with sluggish economic growth occurs in the fed-eral government's interest costs: bigger deficits add to borrowingneeds and hence to the costs of servicing the debt.
The second rule of thumb shows the budgetary effects of an in-crease of one percentage point in the unemployment rate. As in thefirst rule of thumb, higher unemployment and lower economic growthdepress revenues and raise federal government spending. This illus-tration differs, however, in that it does not posit an ever-widening gapbetween the economy's potential and its performance. A well-knowngeneralization (Okun's law) links a 1.0 percentage-point change in theunemployment rate to a change of about 2.5 percentage points in eco-nomic growth. Thus, GNP in the higher-unemployment case is always2.5 percent below the baseline—much lower in 1988, but much higherby 1993, than in the first rule of thumb.
A third rule of thumb summarizes the budgetary effects of a one-percentage-point increase in inflation. Inflation boosts federal gov-ernment revenues mainly by increasing taxable incomes. The pro-gressive structure of the personal income tax causes revenues to out-pace inflation. This effect was curtailed by indexation of the personalincome tax brackets, which began in 1985, was suspended for twoyears during the phase-in of tax reform, and will resume in 1989.While revenues grow with inflation, outlays react almost as fast.Nearly all benefit programs, which account for over 40 percent offederal spending, provide cost-of-living adjustments or otherwiserespond more or less automatically to inflation. Discretionary pro-grams, both defense and nondefense, contain no automatic inflationadjustments; the rule of thumb assumes, however, that annual fund-ing keeps pace with inflation to avoid squeezing the real resources ofthese programs. Finally, federal government interest costs respond tothe higher interest rates that would almost certainly accompanyhigher inflation. As Table IT-6 shows, total outlays go up about as

CHAPTER H THE BUDGET OUTLOOK 65
much as revenues, leaving the deficit almost unchanged. With highernominal GNP, both the deficit-to-GNP and debt-to-GNP ratios arelower than in the baseline.
The last two rules of thumb describe the budget's response tohigher interest rates. Interest costs on the government's large andgrowing debt are highly sensitive to market interest rates. Raisingthe assumed interest rates by one percentage point for all maturi-ties—short, medium, and long—would increase outlays by $3 billion in1988. By 1993, almost the entire debt bears the higher rates; withmost of the pre-1988 debt refinanced and almost $1 trillion in newdebt added during the past six years, outlays are $30 billion higher.(Besides interest on the debt, these estimates reflect small changes inother interest-sensitive programs, such as Guaranteed StudentLoans.) For simplicity, Table II-6 shows no revenue effects of higherinterest rates.
In recent years, the Treasury has concentrated its borrowing inmedium- and long-term maturities, and CBO assumes that this prac-tice will continue. Anticipating future rates on such Treasury securi-ties (known as notes and bonds) is therefore especially important tobudget projections. The last rule of thumb in Table II-6 shows the sen-sitivity of projections to a one percentage-point increase in medium-and long-term rates only-that is, maturities of two to thirty years.Outlays are $1 billion higher in 1988 and $21 billion higher in 1993.
While these rules of thumb clearly show the link between eco-nomic assumptions and budget estimates, they have their limitations.Economic variables are related to one another, and sustained changesin one rarely occur in isolation. CBO does not use rules of thumb toproject the budget, looking instead at dozens of economic and othervariables that have important budgetary effects. Furthermore, TableII-6 shows one percentage-point changes as a convenience and not toreflect typical forecasting errors, since some variables are notoriouslyharder to predict than others. For example, a one percentage-pointerror in the interest rate assumptions is much more likely than a onepercentage-point error in projecting real economic growth over a five-year horizon.

66 THE ECONOMIC AND BUDGET OUTLOOK February 1988
Estimating the Uncertainty of Budget Projections
The Congressional Budget Office, the Administration, the Congress,and many others must make specific deficit projections or set targetsfor as many as five years. Yet the economic assumptions underlyingthese estimates are highly uncertain. Understanding the variabilityin budget outcomes that stems from economic developments is ex-tremely important for policymakers—helping them, for example, tointerpret deficit announcements and to set reasonable goals for fiscalpolicy. Is there a way to describe this uncertainty?
As discussed in Chapter I, CBO has developed a statistical ap-proach for describing the uncertainty of short-run GNP forecasts.Recognizing the randomness and unpredictability of economic perfor-mance, this method conducts thousands of simulations and analyzesthe results. The uncertainty of GNP estimates was summarized inChapter I, and this section presents the associated uncertainty of defi-cit estimates. This line of inquiry describes only the uncertaintyassociated with the economic forecast; of course, the deficit may alsodiffer from the baseline projections because of policy actions and tech-nical factors. (Appendix A tells how inaccurate economic assump-tions, policy assumptions, and technical estimating errors have con-tributed to past errors in Congressional deficit forecasts.)
The single most influential economic variable affecting the nextyear's deficit estimates is the level of nominal gross national product.Historically, the largest source of error in Congressional budget esti-mates traceable to economic factors stems from revenue projections,especially corporate and individual income taxes and social insurancetaxes. These errors are strongly related to errors in the assumptionabout nominal GNP. As noted in Chapter I, there is about a two-thirds chance that fiscal year 1989 GNP will fall within 4.2 percent ofthe level assumed by CBO. Based on this uncertainty about GNP,there is about a two-thirds chance that the deficit will fall within $49billion of the level projected by CBO.
The uncertainty of longer-run deficit forecasts is greater than thatof short-term forecasts. The main uncertainty in longer-run budgetprojections stems not from nominal but from real economic growth. Asshown above in the discussion of rules of thumb, higher inflationessentially leaves the deficit unchanged, whereas real growth has

CHAPTER H THE BUDGET OUTLOOK 67
powerful effects on the projections. Appendix C describes how CBOextended the analysis to encompass five years of uncertain GNPgrowth. The results suggest that there is about a two-thirds chancethat the 1993 deficit under current policies will lie within $125 billionof CBO's projections, corresponding to a range for real GNP that is 7percent lower or higher than the level projected by CBO. Besidesshowing the response of revenues to lower (or higher) GNP, this esti-mate reflects the additional interest costs incurred (or saved) on debtborrowed during the intervening five years.
SPENDING PROJECTIONS BY MAJOR CATEGORY
Total outlays are likely to reach $1,055 billion in 1988, an increase of5 percent over 1987. Even this increase—small by recent years' stan-dards—may be overstated, since a variety of one-time outlay reduc-tions held down spending in 1987. During the next five years, outlaysunder current policies are projected to grow by about 6 percent a year.Outlays rise by 7 percent in 1989 as one-time savings that shrink 1988outlays disappear, but growth tapers off thereafter, helped by a slow-ing of interest growth.
Baseline outlay projections for five broad categories that are com-monly used by the Congress to address aggregate spending are shownin Table II-7. These five categories-defense, nondefense discretionaryspending, entitlements, interest, and offsetting receipts—are definedin more detail in Appendix G, which also shows historical spending bycategory. Yet another way to portray federal government spendinguses 19 budget functions describing particular national needs-defense, transportation, health, and so forth-that are addressed bygovernment programs. Baseline projections by function are shown inAppendix E.
National Defense
Spending for national defense is dominated by Defense Departmentprograms, but also includes defense activities of other agencies such asthe Energy Department's nuclear weapons programs and the General

68 THE ECONOMIC AND BUDGET OUTLOOK February 1988
Services Administration's stockpile activities. The continuing resolu-tion for fiscal year 1988 granted defense budget authority of $291billion, an increase of only 2 percent over 1987. The baseline assumesthat budget authority will increase by about 4 percent to 5 percentannually in 1989 and beyond to reflect overall inflation. Future payraises for both uniformed and civilian employees match the inflationrate, after a 2 percent increase in 1988. Outlays grow somewhat moreslowly than budget authority. As a share of GNP, defense outlays aredown from their early- and mid-1980s peak but continue to represent alarger share than in the 1970s (see Figure II-l).
TABLE H-7. CBO BASELINE OUTLAY PROJECTIONS FORMAJOR SPENDING CATEGORIES (By fiscal year)
Spending Category1987 1988
Actual BaseProjections
1989 1990 1991 1992 1993
National DefenseNondefense Discre-
tionary SpendingEntitlements and Other
Mandatory SpendingNet InterestOffsetting Receipts
Total
National DefenseNondefense Discre-
tionary SpendingEntitlements and Other
In Billions of Dollars
282 287 295 306
164 175 193 202
474 497139 151-54 -55
533166-58
572184-61
320
207
610196-63
333
215
3.7 3.7
345
221
649 693201 206-66 -69
1,005 1,055 1,129 1,203 1,269 1,332 1,396
As a Percentage of GNP
6.4 6.1 5.9 5.8 5.6 5.5 5.3
3.9 3.8 3.6 3.5 3.4
Mandatory SpendingNet InterestOffsetting Receipts
Total
10.83.1
-1.2
22.8
10.63.2
-1.2
22.5
10.73.3
-1.2
22.7
10.73.4
-1.1
22.6
10.73.4
-1.1
22.3
10.73.3
-1.1
21.9
10.73.2
-1.1
21.5
SOURCE: Congressional Budget Office.

CHAPTER II THE BUDGET OUTLOOK 69
Figure 11-1.Outlays by Category as Shares of GNP
National Defense
12 -
10 -
8
I 6
4
Actual I Proj.
ILL1965 1970 1975 1980 1985 1990
Fiscal Years
Nondefense Discretionary Spending
12 -
10 -
v
I 6
Actual Proj.
0 I i i I M i i I i i M I i i i i I i i i i I i ill i I i i
1965 1970 1975 1980 1985 1990
Fiscal Years
Entitlements andOther Mandatory Spending
12
10
1 6
Actual Proj.
1965 1970 1975 1980 1985 1990
Fiscal Years
Net Interest
12
10
8ecuu
I 6
4
Actual Proj.
1965 1970 1975 1980 1985 1990
Fiscal Years
SOURCE: Congressional Budget Office.

70 THE ECONOMIC AND BUDGET OUTLOOK February 1988
Actual defense spending depends not just on the total amount ofbudget authority but on its mix. Some defense activities are markedby long lags between appropriations, obligations, and actual spending.Shifting $1 billion in budget authority from procurement to operationsand maintenance, for example, might raise outlays by about $600 mil-lion to $700 million in the first year because the former is a slow-spending and the latter a fast-spending category. The baselineassumes that the relative priorities in the 1988 appropriations-pro-curement, operations and maintenance, research and development,and so forth-will continue. But the Congress and the Administrationmay well emphasize particular activities. The massive defense build-up of the early and mid-1980s and the subsequent retrenchment, forexample, did not treat all categories of spending equally; two activi-ties—procurement and construction—received both the biggest in-creases and the sharpest reductions in annual funding.
While the 1988 appropriation bill fell short of adjusting the de-fense budget for inflation, it roughly preserved the previous year's mixof programs. Most major activities received just enough to cover infla-tion or only slightly less. Procurement, though, fell short by 3 percent,and only military construction received an increase greater than in-flation—about 5 percent more.
The recent budget accord between the Congress and the Admin-istration called for restraining growth in 1989 appropriations. Carry-ing out the summit's goal would further reduce the baseline budgetauthority for defense by about $8 billion and defense outlays by about$1 billion in 1989.
Defense outlays were reduced by about $3 billion in one-timesavings in 1987, reflecting the delay of paychecks from September 30to October 1, 1987. (The net budgetary effect was somewhat smallerbecause the timing shift lowered revenues as well.) This shift in paydates affects outlays in 1988 and beyond only negligibly.
Nondefense Discretionary Spending
Like the defense budget, nondefense discretionary programs cover awide variety of federal activities, including international affairs,

CHAPTER n THE BUDGET OUTLOOK 71
transportation, veterans' medical care, and the operations of theInternal Revenue Service. Slightly over a fifth of these outlays pro-vide pay and benefits for civilian agency employees, and about a thirdreflect grants to state and local governments.
This spending category bore the brunt of budget restraint in the1980s, declining from almost 6 percent of GNP at the start of thedecade to about 4 percent at present (see Figure II-l). Not all func-tions fared equally. Programs in training, social services, employ-ment, energy, natural resources and environment, and communitydevelopment have grown less than the average and in some cases haveeven declined. Over the next five years, baseline outlays for non-defense discretionary programs increase by about 4 percent or 5 per-cent a year while continuing to decline slightly as a share of GNP.
As noted earlier in Box 11-2, the budget summit agreement pro-vides for an aggregate limit on nondefense discretionary appropria-tions in 1989. The cap covers only those discretionary programs thatare under the jursidiction of the Appropriations Committees—$187 bil-lion out of $193 billion in baseline outlays for the total category. Theremaining $6 billion consists primarily of outlays for revolving loanfunds, which are subject to appropriated loan limits. Adhering to the$185 billion cap would reduce 1989 outlays by almost $2 billion rela-tive to the baseline.
Nondefense discretionary outlays would have been about $7 bil-lion higher in 1987 were it not for various one-time savings, primarilyasset sales and prepayments of loans. Spending in 1988 likewisereflects more than $9 billion in temporary savings, mainly from pre-payments of loans by participants in Rural Electrification Adminis-tration and Foreign Military Sales programs. These temporary ac-tions, though, do not reduce the deficit in later years.
Entitlements and Other Mandatory Spending
Entitlements pay benefits to any person, business, or unit of gov-ernment that seeks payments and meets the eligibility rules set by thelaw. The Congress thus controls spending for these programs in-directly, by choosing the eligibility criteria and the benefit or paymentformula, rather than directly through the appropriation process.

72 THE ECONOMIC AND BUDGET OUTLOOK February 1988
Virtually all of the major federal benefit programs are entitlements.This category encompasses some less obvious programs, such as farmprice supports, because they also pay benefits to anyone who qualifies.Finally, included in this category are mandatory spending programs—for example, to meet the insurance obligations of the Federal DepositInsurance Corporation.
Means-Tested Programs. Only a sixth of entitlement spending goes topeople who must prove eligibility based on need (see Table II-8).These means-tested entitlements grow from $82 billion in 1988 to$117 billion in 1993. Medicaid grants to the states is the largest pro-gram in this category and grows by an average of 11 percent annuallyfrom 1988 to 1993. Medicaid covers people who qualify by virtue oftheir participation in certain income support programs (the categori-cally eligible) as well as applicants with greater incomes but hugemedical bills (the medically needy). Rising costs of medical care andgreater use of covered services fuel the program's growth. The statesand the federal government jointly administer another program,Family Support Payments (primarily Aid to Families with DependentChildren). Means-tested programs also include Food Stamps, Supple-mental Security Income for the aged, blind, and disabled, and severalother programs summarized in Table H-8.
Non-Means-Tested Programs. Most entitlement spending is notmeans-tested, and Social Security and Medicare dominate this cate-gory. Social Security now pays monthly cash benefits to 38 millionretired and disabled workers and their spouses, dependents, and sur-vivors. The baseline projections reflect growth in the beneficiarypopulation of about 2 percent a year as well as rising average benefits,mainly because of cost-of-living adjustments. Medicare, a smaller pro-gram, nevertheless grows much faster than Social Security. Driven bygrowth in the beneficiary population, rising costs of medical care, andgreater use of covered services, Medicare spending virtually doublesbetween 1987 and 1993 in the absence of further policy changes.Medicare's Hospital Insurance program derives most of its funds frompayroll taxes, while the Supplementary Medical Insurance program,which covers physicians' services, is funded approximately one-quarter by beneficiary premiums and three-quarters by general

CHAPTER H THE BUDGET OUTLOOK 73
TABLE II-8. CBO BASELINE OUTLAY PROJECTIONS FOR ENTITLE-MENTS AND OTHER MANDATORY SPENDINGCATEGORIES (By fiscal year, in billions of dollars)
Category1987 1988 Projections
Actual Base 1989 1990 1991 1992 1993
Means-Tested Programs
MedicaidFood StampsSupplemental Security IncomeFamily SupportVeterans' PensionsChild NutritionEarned Income Tax CreditGuaranteed Student LoansOther
Total, Means-Tested Programs
Social SecurityMedicare
Subtotal
Other Retirementand Disability
Federal civilian a/MilitaryOther
Subtotal
Unemployment Compensation
Other ProgramsVeterans' benefits b/Farm price supportsSocial servicesOther
Subtotal
Total, Non-Means-Tested Programs
2712111144131
74
3112131144332
82
3413131145432
89
3813131245432
94
Non-Means-Tested Programs
205.80.
285
2618_5
49
17
13234
_9
49
400
217_87
304
2719_5
51
15
14184
_8
45
415
232
327
2920_5
54
16
14185
10
47
444
249107
356
3222_5
58
17
14185
_9
47
478
4214151245532
101
266119
385
3323_5
61
17
15175
_9
45
509
4714161236532
108
283133
416
3624_5
65
18
15145
42
541
5216171336532
117
300147
447
3826_5
69
19
16135
_8
41
576
All Entitlements and OtherMandatory Spending 474
Total
497 533 572 610 649 693
SOURCE: Congressional Budget Office.a. Includes Coast Guard retirement.b. Includes veterans' compensation, readjustment benefits, life insurance, and housing programs.
81-615 - - 3

74 THE ECONOMIC AND BUDGET OUTLOOK February 1988
revenues. Social Security and Medicare are operated as trust funds;the contributions of these and other trust funds to budget totals aresummarized in Box II-3.
Other retirement and disability programs are dominated by thefederal government's retirement plans for both civilian and militaryemployees and the Railroad Retirement program. Indexed to the costof living, these programs grow only slightly faster than inflation.Another large entitlement-unemployment compensation-grows littleunder the baseline assumptions about the labor force, unemploymentrates, and average benefits.
Outlays for the remaining entitlement and mandatory programsgrow little or shrink under current policies. The largest program,farm price support payments, peaked in mid-decade; projected outlays,while still high, reflect improvements in the supply and demandbalance and in the farm export outlook.
Entitlement outlays were lowered by about $1 billion in 1987 bytiming shifts for the final general revenue-sharing payment andMedicare. Stretching out lump-sum refunds under the Civil ServiceRetirement program, as mandated in the recent reconciliation act,reduces outlays in 1988 and 1989 but has no long-run impact.
Net Interest
Net interest costs grow rapidly as the government continues to borrowto finance its deficits. Increases in interest rates in the CBO short-term forecast further boost interest outlays. While the governmentpays interest to investors holding its $2 trillion debt, it also collects in-terest from several sources, primarily its cash balances and loans.This interest income is virtually flat over the next five years, re-flecting asset sales and prepayments as well as sluggish new lending.
Net interest outlays grow by about $12 billion in 1988, $15 billionin 1989, and $18 billion in 1990 before gradually leveling off. In mostof these years, the government borrows approximately $150 billion innew money and must also refinance its maturing debt, often at higherinterest rates. In fiscal year 1987, in contrast, net interest outlaysbarely grew at all because of huge savings on the refinancing of old,

CHAPTER H THE BUDGET OUTLOOK 75
high-coupon debt at lower rates. One-time savings—mainly about $1billion in interest receipts on Outer Continental Shelf escrow re-leases—also dampened interest growth in 1987.
Net interest, of course, is highly sensitive to assumptions aboutinterest rates. Interest also depends on the assumed deficits. If thegovernment must borrow an extra $10 billion a year—for example,because of slower revenue growth or greater noninterest outlays—thecost of servicing the extra debt, small at first, grows to almost $6 bil-lion in 1993.
The baseline projections of federal debt are shown in Table II-9.Federal government borrowing—the figure most watched by creditmarket participants—is about equal to the annual deficits, except thatit reflects other means of financing such as drawdowns in the Trea-sury's cash balance. Such other means of financing are unimportantin the long run; ultimately, the Treasury must finance deficits byborrowing. Total debt held by the public grows from about $1.9 tril-lion at the end of 1987 to $2.8 trillion at the end of 1993.
While debt held by the public best measures the economic im-portance of federal borrowing, many people are more familiar with alarger figure—the gross federal debt. Gross debt includes Treasurysecurities held by federal trust funds and certain other funds (see BoxII-3). Interest payments on these funds' holdings are intragovern-mental and do not affect the deficit. Gross federal debt is very similarto the figure voted on by the Congress when it enacts a new statutorydebt limit. The Congress last September approved an increase in theceiling to $2.8 trillion, which is expected to suffice through mid-1989.
Clouding the calculation of federal debt is the treatment of zero-coupon bonds that the Treasury Department will soon issue to Mexicoas part of a debt restructuring. Expected to raise about $2 billion, thebonds will carry a face value of about $10 billion payable in 20 years.The baseline counts only $2 billion as borrowing from the public,treating the Mexican bonds like any other debt issue; based on indica-tions from the Treasury Department, however, it counts the full $10billion in debt subject to statutory limit. The Mexican bonds will sub-stitute for other debt issues; sold at competitive rates, they will havelittle or no effect on the interest projections.

.1—11
76 THE ECONOMIC AND BUDGET OUTLOOK February 1988
BOX II-3TRUST FUNDS IN THE BUDGET
The federal government operates many trust funds to finance particularprograms. In fact, the total deficit reflects large and growing trust fund sur-pluses offset by even larger deficits in the general fund. In 1988, the baselinedeficit of $157 billion comprises a $97 billion trust fund surplus and a $254billion federal funds deficit. The entire improvement in the baseline deficitfrom 1988 to 1993 occurs in trust fund programs; as shown in the tablebelow, the federal funds deficit actually grows. Large surpluses are mirroredin these funds' investments in Treasury securities, which increase from $431billion at the end of 1987 to $1.2 trillion in 1993.
Under the Balanced Budget and Emergency Deficit Control Act of 1985,receipts and outlays of the two Social Security trust funds—Old-Age andSurvivors Insurance (OASI) and Disability Insurance (DI)—are not includedin unified budget totals. The Social Security Amendments of 1983 movedMedicare's Hospital Insurance Trust Fund off-budget as well in 1993. TheBalanced Budget Act nevertheless requires that the total deficit-includingoff-budget items-be used when calculating required deficit reductions,because the total deficit determines the government's demands on creditmarkets. All other trust funds are on-budget.
Trust funds vary greatly in size and importance: Social Security willspend about $220 billion in 1988, while many small funds, such as the HarryS Truman Scholarship Fund, spend less than $1 million annually. Trustfunds also vary in their source of funding. Social Security, the HospitalInsurance portion of Medicare, and Unemployment Insurance derive most oftheir funding from payroll taxes, while the airport and highway fundsreceive excise tax collections on airline tickets and motor fuels. Medicare'sSupplementary Medical Insurance program gets about one-fourth of itsfunds from voluntary premiums and the rest from general revenues. CivilService Retirement collects funds from employee contributions, agencymatching contributions, and general funds; Military Retirement, anoncontributory program, is funded from the Defense Department budgetand general funds.

CHAPTER H THE BUDGET OUTLOOK 77
An important source of funds for most trust funds is interest earned ontheir holdings of government securities, which is expected to increase from$45 billion in 1988 to $90 billion in 1993. In essence, when trust funds runsurpluses, the Treasury borrows the money and issues securities to the trustfunds in lieu of borrowing in the credit markets. In the future, these securi-ties will give the trust funds the right to spend more than they take in-forexample, during economic downturns or adverse demographic trends. Onemeasure of funding adequacy for trust funds is the ratio of fund balances toexpected spending needs. At the start of 1993, Social Security's balances willstand at about 118 percent of annual outlays, Hospital Insurance at about150 percent, and the Airport and Airways fund at more than 450 percent.
Legislation that reduces outlays or raises taxes for trust fund programshelps to reduce the federal deficit. Thus, for example, the Social Securitysolvency package of 1983 and the Medicare provisions that have appeared inalmost every reconciliation bill since 1982 have held down the deficit. In thisrespect, programs financed by trust funds are no different from other federalgovernment programs. But a key difference is that such actions contributeto growing trust fund surpluses. Ultimately, large surpluses may lead topressure to raise spending or cut taxes for particular programs. Conversely,the prospect of depleting trust funds has generally led legislators to reduceoutlays or raise taxes.
Annual Surpluses InvestmentsTrust Fund 1988 1989 1990 1991 1992 1993 (End of 1993)
Social Security 37 46 58 71 81 97 456Medicare 15 17 16 16 16 16 153Military Retirement 14 15 16 17 18 19 130Civilian Retirement 18 19 20 22 23 24 306
Unemployment 6 4 1 3 2 1 4 6Highway a n d Airport 3 3 3 3 3 3 4 0Other _3 _J. _2 _1 _J, _2 57
Total Surplus 97 106 116 132 144 161 1,188
Federal Funds Deficit 254 282 283 290 295 295
Total Deficit 157 176 167 158 151 134
r~T

78 THE ECONOMIC AND BUDGET OUTLOOK February 1988
TABLE II-9. BUDGET FINANCING AND DEBT (By fiscal year)
On-Budget DeficitOff-Budget Surplus
1987Actual
1988Base
Projections1989
Borrowing(In billions of dollars)
170 195 22220 37 46
1990
22558
1991
22971
1992
23281
1993
23197
Total Deficit
Means of FinancingOther Than Borrowing
Borrowing fromthe Public
Debt Held bythe Public
Debt Held byGovernment Accounts
Total, GrossFederal Debt
Debt Subject toStatutory Limit
Debt Held bythe Public
150 157 176 167 158 151 134
a/ -13 -1 -1 -2 -1
151 144 175 166 155 150 133
Debt Outstanding(In billions of dollars)
1,897 2,041 2,216 2,382 2,537 2,687 2,820
457 557 663 781 914 1,059 1,222
2,354 2,598 2,880 3,163 3,452 3,746 4,041
2,336 2,592 2,879 3,168 3,456 3,750 4,045
As a Percentage of GNP
43.0 43.6 44.5 44.7 44.6 44.2 43.4
SOURCE: Congressional Budget Office based on data from the Department of the Treasury,
a. Less than $500 million.

CHAPTER II THE BUDGET OUTLOOK 79
Offsetting Receipts
Offsetting receipts include certain business-type and intragovern-mental transactions that are recorded as negative outlays. Unlikerevenues, they do not result from the federal government's taxingpower. As shown in Table II-7, offsetting receipts rise from $55 billionin 1988 to $69 billion in 1993. Over half of offsetting receipts areintragovernmental, reflecting payments made by federal agencies toretirement funds on behalf of their employees. (The agencies' costs areincluded in defense or nondefense discretionary spending, and the off-setting receipts category reflects the offset to ensure that there is nonet effect on the deficit.) The remaining offsetting receipts come fromthe public. The largest source—Medicare premiums—represents pay-ments from enrollees in the Supplementary Medical Insurance pro-gram and from some otherwise ineligible enrollees in Hospital Insur-ance. Medicare premiums grow from $9 billion in 1988 to $13 billionin 1993. Other receipts from the public include payments from oil,timber, and mineral leases, proceeds from selling electric power, andsimilar transactions. One-time savings boosted offsetting receipts in1987 by more than $3 billion from the sale of Conrail and the earlyrelease of disputed Outer Continental Shelf escrows.
BASELINE REVENUE PROJECTIONS
Baseline revenues are projected to reach $897 billion in 1988 andincrease to $953 billion in 1989 (see Table 11-10). Revenues will claima higher share of GNP in 1988 and 1989-19.2 percent and 19.1 per-cent, respectively—than in any year since 1982, except .for the specialcase of 1987 (see Figure II-2). Revenues in fiscal year 1987 weresignificantly boosted by two factors related to the 1986 Tax ReformAct that affected calendar year 1986 tax liabilities: the realization ofextraordinary amounts of capital gains in late 1986 prompted by thepending increase in the tax rate in January 1987, and the retroactivecomponent of the repeal of the investment tax credit. These twosources added nearly $25 billion to 1987 receipts and raised the reve-nue share of GNP by 0.6 percent, to 19.4 percent.
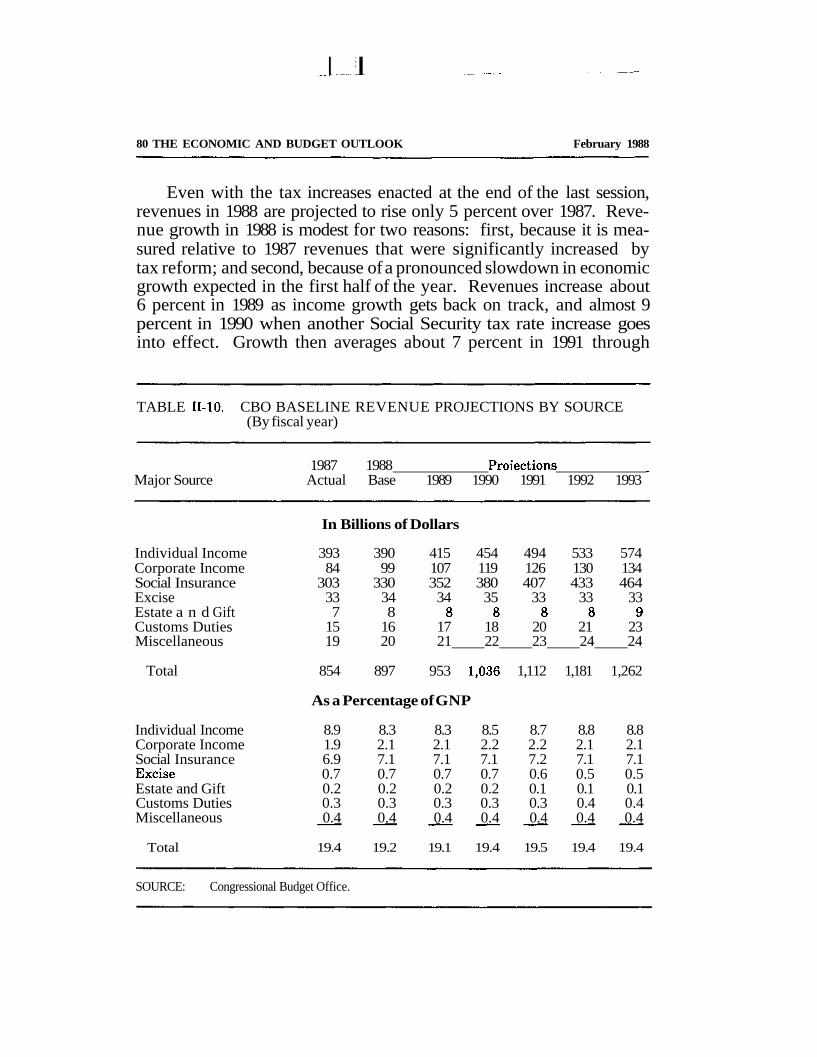
80 THE ECONOMIC AND BUDGET OUTLOOK February 1988
Even with the tax increases enacted at the end of the last session,revenues in 1988 are projected to rise only 5 percent over 1987. Reve-nue growth in 1988 is modest for two reasons: first, because it is mea-sured relative to 1987 revenues that were significantly increased bytax reform; and second, because of a pronounced slowdown in economicgrowth expected in the first half of the year. Revenues increase about6 percent in 1989 as income growth gets back on track, and almost 9percent in 1990 when another Social Security tax rate increase goesinto effect. Growth then averages about 7 percent in 1991 through
TABLE 11-10. CBO BASELINE REVENUE PROJECTIONS BY SOURCE(By fiscal year)
1987 1988 ProjectionsMajor Source Actual Base 1989 1990 1991 1992 1993
In Billions of Dollars
Individual Income 393 390 415 454 494 533 574Corporate Income 84 99 107 119 126 130 134Social Insurance 303 330 352 380 407 433 464Excise 33 34 34 35 33 33 33Estate a n d Gift 7 8 8 8 8 8 9Customs Duties 15 16 17 18 20 21 23Miscellaneous 19 20 21 22 23 24 24
Total 854 897 953 1,036 1,112 1,181 1,262
As a Percentage of GNP
Individual Income 8.9 8.3 8.3 8.5 8.7 8.8 8.8Corporate Income 1.9 2.1 2.1 2.2 2.2 2.1 2.1Social Insurance 6.9 7.1 7.1 7.1 7.2 7.1 7.1Excise 0.7 0.7 0.7 0.7 0.6 0.5 0.5Estate and Gift 0.2 0.2 0.2 0.2 0.1 0.1 0.1Customs Duties 0.3 0.3 0.3 0.3 0.3 0.4 0.4Miscellaneous 0.4 0.4 0.4 0.4 0.4 0.4 0.4
Total 19.4 19.2 19.1 19.4 19.5 19.4 19.4
SOURCE: Congressional Budget Office.

CHAPTER H THE BUDGET OUTLOOK 81
1993. The revenue share of GNP rises to 19.4 percent by 1990 andstays there through 1993.
Revenues and the Economy
With 80 percent of federal taxes based directly on personal income andanother 11 percent based on corporate income, the outlook for reve-nues is closely tied to assumptions about overall economic activity andthe income it generates. Of the major taxable incomes, wages andsalaries total roughly half of GNP, other taxable personal income(such as interest and self-employment income) roughly 20 percent,and economic profits another 6 percent.
Figure 11-2.Revenues by Source as Shares of GNP
20
15
Actual Projected
:'x-X'X-x-x-X'X-:-x-v-:-: individual income faxes vXyX-x-XvX-x-XvXvX-l':10
Excise Taxes and All Other Revenuest
1965 1970 1975 1980Fiscal Years
1985 1990
SOURCE: Congressional Budget Office.

LJ
82 THE ECONOMIC AND BUDGET OUTLOOK February 1988
As discussed in Chapter I, CBO projects a marked slowing of eco-nomic growth in the first half of this year, with real GNP growing only1.8 percent in 1988 (measured from fourth quarter to fourth quarter).Real GNP growth returns to 2.6 percent in 1989, and CBO's long-range assumptions posit continued growth of 2.6 percent to 2.7 percentafter 1989.
Wage and salary growth is projected by CBO to drop significantlybelow trend during the first half of 1988 but to move back to a healthyrate by the end of the year. For 1988 as a whole, economic profits fallbelow the 1987 level. Incomes are assumed to grow steadily after1988. Personal income, both wages and salaries and other income,exhibit the strongest growth. Economic profits resume growing, butat a moderate rate by historical standards.
The Effects of Legislation on Revenues
Many changes in tax law, some of which were enacted several yearsago, are scheduled to take effect in 1988 through 1993 and thereforeaffect the revenue projections. Legislated changes in Social Securitytax rates, continued base broadening (including the recent tighteningin accounting rules for businesses), and extension of the telephoneexcise and the Federal Unemployment Tax Act (FUTA) taxes add sig-nificantly to revenues in 1988 through 1993. Nevertheless, some ofthe scheduled changes will help to stimulate the economy. The second(and final) step in the reduction of income tax rates under the TaxReform Act took effect in January. This significant reduction in liabil-ity follows last year's tax reform-induced surge in revenues, and helpsto spur the economy in 1988 (see Table 11-11).
Recent Legislation: The Budget Summit. The Omnibus BudgetReconciliation Act of 1987 (Public Law 100-203), enacted after the fallbudget summit agreement, met the negotiators' targets for revenueincreases. The act raises revenues by $9 billion in 1988 and $14 bil-lion in 1989. The revenue gain peaks at $15 billion in 1990 and tapersoff thereafter as some of the provisions expire (see Table IE-11).
Roughly half of the revenue raised in the reconciliation act coniesfrom higher corporate income taxes. Another quarter of the tax in-creases in the first three years comes from excise taxes, mainly the

CHAPTER II THE BUDGET OUTLOOK 83
extension of the telephone excise tax through 1990. A variety of per-sonal tax provisions account for the rest of the law's revenue increases.
The budget summit also called for stepped-up enforcement by theInternal Revenue Service (IRS). In response, the continuing resolu-tion (Public Law 100-202) increased funding for the IRS up to the levelrequested by the President last January. These funds enable the IRSto add nearly 8,000 new staff positions—primarily tax examiners andcollections staff—and to purchase new equipment. These extra re-sources are expected to yield $2 billion to $3 billion per year.
TABLE H-ll. REVENUE EFFECTS OF MAJOR LEGISLATION(By fiscal year, in billions of dollars)
1987 1988 1989 1990 1991 1992 1993
Omnibus BudgetReconciliationAct of 1987
Other (Mostlyincreased IRSappropriation)
Tax Reform Actof 1986
Social Security RateIncrease EffectiveJanuary 1,1988
Social Security RateIncrease EffectiveJanuary 1,1990 a/
Legislation Enacted in 1987
9 14 15 14 11
- 2 2 2 2 3
Previously Enacted Legislation
2 2 - 1 0 - 1 6 - 4 3 3
10 14 15 17 18 19
SOURCE: Congressional Budget Office.
a. Includes income tax effects of deductibility of Self-Employed Contributions Act taxes.

II84 THE ECONOMIC AND BUDGET OUTLOOK February 1988
Legislation enacted last fall also increased and reclassified someuser fees that previously appeared on the revenue side of the budget.Customs user fees and Nuclear Regulatory Commission fees now ap-pear as offsetting receipts. This change has no effect on the deficit.
Previous Legislation. Legislation enacted before 1987 also affects the1988-1993 revenue projections, as shown in Table 11-11.
The Tax Reform Act of 1986 included several provisions that werephased in over two or more years. Rate reductions for both individualsand corporations were instituted in two steps. For individuals, start-ing in 1988 the rate schedule includes only the 15 percent and 28 per-cent brackets, with the 15 percent bracket phased out for upper-income taxpayers. Standard deductions are bigger in 1988: $5,000 forjoint returns ($3,000 for single) versus $3,760 for joint returns ($2,540for single) in 1987. For corporations, the statutory rate dropped to 34percent in July 1987, making 1988 the first full year at the lower rate.Measured at annual rates, these reductions in individual and corpo-rate tax rates decrease liabilities by about $30 billion. Base-broad-ening measures and other changes partly offset these reductions andshrink the fiscal year 1988 revenue loss to $10 billion.
An increase of 0.72 percent (employer plus employee) in the SocialSecurity tax rate, enacted in 1983, took effect on January 1, 1988. Afurther 0.28 percent (employer plus employee) increase, also enactedin 1983, takes place in 1990. Tax increases for the self-employed occuron the same dates. As Table 11-11 shows, the scheduled Social Securi-ty increases will raise large amounts of revenue and will add to thetrust fund's surpluses.
Changes in the Revenue Estimates Since August
Baseline revenues for fiscal years 1988 through 1992 estimated byCBO last August were used as a starting point by the budget summitnegotiators in November. Legislation enacted in December raisesrevenues in each year, while the new economic assumptions and otherrevisions reduce revenues below the levels projected last August. Onbalance, these changes leave revenues in 1988 through 1990 at almostthe same levels as projected by CBO last summer, but reduce revenuesin 1991 and 1992 (see Table H-5).

CHAPTER H THE BUDGET OUTLOOK 85
The revenue effects of the reconciliation bill and the continuingresolution were discussed above. Changes in the economic assump-tions and other revisions since last August are discussed below.
Changed Economic Conditions. CBO now forecasts much slowergrowth during the first half of 1988, followed by healthy growth inpersonal incomes but only moderate growth in profits. Nominal GNPis lower in all years. These revised economic assumptions cause reve-nues to fall below the August projections in all years: a reduction of$12 billion in 1989 and $20 billion in 1992 (see Table H-5).
Even as growth resumes in the second half of 1988, total wagesand salaries remain below last August's forecast through 1992, re-ducing individual income taxes and social insurance revenues. Otherpersonal income exceeds last August's estimates after 1988, adding torevenues.
Last year's extraordinary turbulence in financial markets—par-ticularly the stock market crash and subsequent end of the stockmarket boom, at least for now-affects the revenue outlook. Capitalgains are now projected at levels below those expected last August,when the stock market boom showed no clear signs of slowing. Thisdevelopment lowers projected revenues for 1989 and beyond. Reve-nues in 1988, however, are expected to benefit from the burst of gainsrealized in transactions in the recently volatile market.
Projected economic profits are well below last August's assump-tions, and the drop is expected to be reflected in taxable profits. As aresult, corporate income taxes are lower by $7 billion in 1989 and bysomewhat larger amounts thereafter.
Other Revisions. Newly available information from tax returns andongoing research are factored into the revenue baseline and result infurther revisions. In total, these technical reestimates reduce reve-nues below last August's projections by about $5 billion in each year(see Table H-5).
One such revision affects the estimated revenue gains from thenew accounting rules enacted in the Tax Reform Act, particularlythose rules governing the capitalization of production costs. These

86 THE ECONOMIC AND BUDGET OUTLOOK February 1988
revisions lower the share of production costs incorporated into inven-tory values under the new rules, thereby increasing business deduc-tions for tax purposes and lowering revenues.
Revisions in the estimated timing of tax payments and other tax-related behavior, such as the realization of capital gains, are also clas-sified as technical reestimates (distinguishing them from changes intax liability related to changes in income). New data for 1986 and1987 indicate that realizations of capital gains at the end of 1986exceeded CBO's August estimate. A portion of the higher 1986 reali-zations is assumed to have been borrowed from 1988 and 1989, re-ducing revenues slightly in those years.
BASELINE CREDIT PROJECTIONS
The federal government affects the allocation of credit by borrowing tofinance deficits, by regulation, by lending money directly, and byguaranteeing loans extended by others. The credit budget summarizesthese last two activities.
The credit budget supplements the unified budget's description ofdirect lending. The budget generally shows direct lending on a cash-flow basis; that is, it reflects loans disbursed and repayments col-lected. Thus, programs with huge volumes of transactions may showvery small net outlays. The credit budget shows the amount of grosslending by these same programs. Direct loan obligations are expectedto total $37 billion in 1988, as shown in Table 11-12, with theCommodity Credit Corporation accounting for much of the total. TheFarmers Home Administration, the Rural Electrification Administra-tion, and the Export-Import Bank also account for large volumes ofdirect lending. For future years, the baseline assumes that direct loanprograms subject to annual loan limits in appropriation bills areadjusted for inflation; projections of programs without such limitsrepresent CBO's best estimate of loan demand. Direct lending totals$34 billion in 1993, assuming no change in current policies.
Commitments for guaranteed loans total $167 billion in 1988 and$185 billion in 1993; housing loan guarantees by the Federal HousingAdministration and the Veterans Administration dominate this

CHAPTER H THE BUDGET OUTLOOK 87
activity. Other major loan guarantors include the Guaranteed Stu-dent Loan program and the Export-Import Bank.
Both CBO and the Administration have long argued that currentbudgetary treatment paints a misleading picture of federal creditactivity. Cash-based accounting of direct loans—that is, counting asoutlays new loans minus repayments—obscures the subsidy value ofcredit programs, which generally lend money at favorable rates or toriskier clients. Cash-based accounting also permits asset sales andloan prepayments to count as deficit reductions when these actionsdepress budget totals only temporarily. The budget records outlays forguaranteed loans only in the event of default, while counting anyguarantee fees immediately. In the Balanced Budget and EmergencyDeficit Control Reaffirmation Act of 1987, the Congress asked CBO tostudy the budget's treatment of credit programs, and CBO will issue areport later this year.
TABLE 11-12. CBO BASELINE CREDIT PROJECTIONS(By fiscal year, in billions of dollars)
1988 ProjectionsCredit Activity Base 1989 1990 1991 1992 1993
Direct Loan Obligations
Commodity Credit Corporation 16 15 14 13 12 12
Other 21 20 20 21 21 22
Subtotal 37 35 34 34 33 34
Primary Loan Guarantees
Federal Housing Administrationand Veterans Administration
Other
Subtotal
Total
90
40
130
167
80
31
111
146
90
32
122
156
99
33
132
166
109
33
142
175
117
34
151
185
SOURCE: Congressional Budget Office.


APPENDIXES


APPENDIX A
ANALYSIS OF CONGRESSIONAL
BUDGET ESTIMATES
The first (and, since fiscal year 1986, the only) Congressional budgetresolution is adopted in late spring or early summer. The resolution isa plan for guiding spending and taxing decisions for the fiscal yearbeginning the following October. Subsequent authorization and ap-propriation action is required to turn the plan into law. In fiscal years1976 through 1979, the actual deficit at the end of the year turned outto be lower than the first budget resolution estimate. Since 1980, how-ever, the actual deficit has consistently exceeded the planned amount.
In its August 1987 report, The Economic and Budget Outlook: AnUpdate, the Congressional Budget Office analyzed the sources of errorin budget resolution estimates during the 1980s. The figures for 1987were preliminary, however, because the fiscal year was not yet over.This appendix updates the major tables in CBO's August report toreflect the final data on revenues and outlays for fiscal year 1987.
Table A-l shows the budget resolution estimates of outlays, reve-nues, and the deficit and compares them with the actual outcomes.The budget resolution estimates are predicated on three types of as-sumptions:
o Policy assumptions, which specify the laws and administra-tive practices that are expected to apply-for some programs,those currently in force; for others, some proposed departure.
o Economic assumptions affecting revenues and spending;these include dozens of variables, but most importantlyincome and employment, inflation, and interest rates.
o Technical assumptions, which encompass all the remainingstatistical and judgmental techniques used to turn the policyand economic assumptions into budget estimates.

J92 THE ECONOMIC AND BUDGET OUTLOOK February 1988
TABLE A-l. CONGRESSIONAL BUDGET RESOLUTIONSAND ACTUAL BUDGET TOTALS(In billions of dollars)
Fiscal Year
Fiscal Year 1976First resolutionSecond resolutionActual
Fiscal Year 1977First resolutionSecond resolutionThird resolutionThird resolution amendedActual
Fiscal Year 1978First resolutionSecond resolutionActual
Fiscal Year 1979First resolutionSecond resolutionRevised second resolutionActual
Fiscal Year 1980First resolutionSecond resolutionRevised second resolutionActual
Fiscal Year 1981First resolutionSecond resolutionRevised second resolutionActual
Fiscal Year 1982First resolutionRevised second resolutionActual
Revenues
298.2300.8299.2
362.5362.5347.7356.6356.9
396.3397.0401.1
447.9448.7461.0465.9
509.0517.8525.7520.1
613.8605.0603.3602.6
657.8628.4617.8
Outlays
367.0374.9364.8
413.3413.1417.5409.2401.9
461.0458.3449.9
498.8487.5494.5493.7
532.0547.6572.7579.6
613.6632.4661.4660.5
695.4734.1728.4
Surplus orDeficit (-)
-68.8-74.1-65.6
-50.8-50.6-69.8-52.6-45.0
-64.6-61.3-48.8
-50.9-38.8-33.4-27.7
-23.0-29.8-47.0-59.6
0.2-27.4-58.0-57.9
-37.6-105.7-110.7
(Continued)

APPENDIX A ANALYSIS OF CONGRESSIONAL BUDGET ESTIMATES 93
TABLE A-l. (Continued)
Surplus orFiscal Year Revenues Outlays Deficit (-)
Fiscal Year 1983First resolution 665.9 769.8 -103.9Revised second resolution a/ 604.3 807.4 -203.1Actual 600.6 796.0 -195.4
Fiscal Year 1984First resolution b/ 679.6 851.2 -171.6Revised second resolution 672.9 845.6 -172.7Actual 666.5 841.8 -175.3
Fiscal Year 1985First resolution c/ 750.9 932.0 -181.2Revised second resolution c/ 736.5 935.9 -199.4Revised second resolution d/ 736.5 946.3 -209.8Actual c/ 734.1 936.8 -202.8Actual d/ 734.1 946.3 -212.3
Fiscal Year 1986First resolution 795.7 967.6 -171.9Actual 769.1 989.8 -220.7
Fiscal Year 1987First resolution 852.4 995.0 -142.6Actual 854.1 1,002.9 -148.8
Fiscal Year 1988First resolution e/ 921.6 1,055.4 -133.8
SOURCE: Congressional Budget Office.
NOTE: Actual totals have been adjusted where necessary to agree with the budgetary treatment ofvarious items for the budget resolutions and may, therefore, differ from the totals shown else-where in this report. Data for fiscal year 1984 and earlier years exclude outlays (primarily Fed-eral Financing Bank, Strategic Petroleum Reserve, and Postal Service) that were consideredoff-budget before enactment of the Balanced Budget and Emergency Deficit Control Act of 1985.
a. Outlays exclude amounts reserved pursuant to section 2 of the Congressional Budget and Im-poundment Control Act.
b. Adjusted for enactmentof reserve fund programs.c. On-budget only; see note.d. On- and off-budget combined; see note.e. Using CBO assumptions of February 1987.
ir~~r

94 THE ECONOMIC AND BUDGET OUTLOOK February 1988
Table A-2 divides the differences between the budget resolution esti-mates of revenues, outlays, and the deficit and the actual outcomes forfiscal years 1980 through 1987 into those resulting from policy, eco-nomic, and technical assumptions. Tables A-3, A-4, and A-5 providefurther details on the three sources of error.
TABLE A-2. SOURCES OF DIFFERENCES BETWEEN ACTUALBUDGET TOTALS AND FIRST BUDGET RESOLUTIONESTIMATES FOR FISCAL YEARS 1980-1987(In billions of dollars)
AverageAverage AbsoluteDiffer- Differ-
1980 1981 1982 1983 1984 1985 1986 1987
PolicyAssumptions 6.2
EconomicAssumptions 8.4
TechnicalAssumptions -3.5
Revenues
-3.7 13.0 -4.6 -13.7 -0.2 -1.5 22.1
5.0 -51.9 -58.0 4.5 -20.0 -23.0 -27.0
-12.6 -1.1 -2.7 -3.9 3.3 -2.1 6.7
TotalDifferences 11.1 -11.2 -40.0 -65.3 -13.1 -16.8 -26.6
Outlays
1.7
PolicyAssumptions 19.6
EconomicAssumptions 12.4
TechnicalAssumptions 15.6
TotalDifferences 47.6
24.5 1.2 17.6 1.5 22.8 14.2 6.8
6.4 24.1 0.5 7.1 -5.2 -12.1 -11.9
16.0 7.7 8.1 -18.0 -12.9 20.1 13.0
46.9 32.9 26.2 -9.4 4.8 22.2
Deficit
7.9
2.2
-20.3
-2.0
-20.0
13.5
2.7
6.2
22.4
8.1
24.7
4.5
23.2
13.5
10.0
13.9
24.7
PolicyAssumptions
EconomicAssumptions
TechnicalAssumptions
TotalDifferences
13.4
4.0
19.1
36.6
28.2
1.4
28.6
58.1
-11.8
76.0
8.8
73.0
22.2
58.5
10.8
91.5
15.2
2.7
-14.1
3.7
23.0
14.8
-16.2
21.6
15.7
10.9
22.2
48.8
-15.3
15.1
6.3
6.2
11.3
22.9
8.2
42.4
18.1
22.9
15.8
42.4
SOURCE: Congressional Budget Office.

APPENDIX A ANALYSIS OF CONGRESSIONAL BUDGET ESTIMATES 95
TABLE A-3. POLICY DIFFERENCES BETWEEN ACTUAL BUDGETTOTALS AND FIRST BUDGET RESOLUTION ESTIMATESFOR FISCAL YEARS 1980-1987 (In billions of dollars)
1980 1981 1982 1983 1984 1985 1986 1987
AverageDiffer-ence
AverageAbsolute
Differ-ence
Revenues
Revenues
NationalDefense
EntitlementsFarm pricesupports
MedicareSocialSecurity
Unemploy-ment com-pensation
Public housingfinancing
Means-testedprograms
Other
Subtotal
NondefenseDiscretionary
Net InterestDebt serviceOther
Subtotal
OffsettingReceipts
Total
Deficit
6.2
5.9
0.81.8
-1.3
1.8
-
1.82.1
6.9
5.8
0.8_II_
0.8
0.1
19.6
13.4
-3.7
4.5
0.31.3
-0.2
1.4
-
0.83.5
7.1
9.9
2.30.4
2.7
0.3
24.5
28.2
13.0
-3.9
-1.7-0.1
5.1
-
-
-0.1-0.2
3.1
1.1
-1.70.9
-0.8
1.7
1.2
-11.8
-4.6
2.6
1.71.6
-0.4
5.9
-
1.1_a/_
9.9
5.7
1.0-3,2
-2.2
1.6
17.6
22.2
-13.7
Outlays
-0.7
-0.3
-
1.3
1.0
-0.3PJL
2.7
-2.0
0.7M.
0.7
0.8
1.5
Deficit
15.2
-0.2
0.9
2.6
—
-0.1
0.2
13.9
-02
16.8
1.2
1.2M.
1.3
2.6
22.8
23.0
-1.5
-0.8
5.80.4
-
-0.1
0.9
-0.3<LL6.8
2.3
0.9-1.7
-0.9
6.7
14.2
15.7
22.1
0.7
3.3-1.6
-
a/-
a/0.8
2.6
2.2
-0.6_^_
-0.6
1.9
6.8
-15.3
2.2
1.2
1.60.5
0.4
1.3
2.0
0.40.8
7.0
3.3
0.6-0.4
0.1
2.0
13.5
11.3
8.1
2.5
2.00.9
0.9
1.3
2.0
0.60.9
7.0
3.8
1.10.8
1.2
2.0
13.5
18.1
SOURCE: Congressional Budget Office,
a. Less than $50 million.
ITT

..1—11
96 THE ECONOMIC AND BUDGET OUTLOOK February 1988
TABLE A-4. ECONOMIC DIFFERENCES BETWEEN ACTUAL BUDGETTOTALS AND FIRST BUDGET RESOLUTION ESTIMATESFOR FISCAL YEARS 1980-1987 (In billions of dollars)
1980 1981 1982 1983 1984 1985 1986 1987
AverageDiffer-ence
AverageAbsolute
Differ-ence
RevenuesIndividual
IncomeCorporate
IncomeSocial
4.4
2.8
Insurance -0.8Windfall
ProfitsOther
Total
EntitlementsMedicareGuaranteed
StudentLoans
Indexedretirementand disabilityprograms
Unemploymentcompen-sation
Medicaid, FoodStamps, andpublicassistance
OtherSubtotal
NondefenseDiscretionary
Net InterestInterest ratesDebt service
Subtotal
OffsettingReceipts
—2.0
8.4
0.5
0.4
3.7
1.3
0.8..
IT?
-
5.50.25.8
..
Total 12.4
Deficit 4.0
10.8
-4.4
0.6
-5.43.4
5.0
0.1
0.8
1.3
-0.2
0.60.43.0
0.1
2.80.63.4
..
6.4
1.4
-13.1
-13.8
-10.8
-14.2__
-51.9
-0.2
0.2
-1.5
5.2
1.1..
lL9
0.1
12.46.7
19.1
..
24.1
76.0
-18.5
-16.4
-12.4
-8.4-2.3
-58.0
-0.8
-0.5
-1.9
3.3
0.40.10.6
0.1
-4.24.0
-0.2
..
0.5
58.5
5.3
-4.7
0.1
-1.14.8
4.5
Outlays
-0.3
0.8
-
-5.8
-0.3-0.1-5.6
0.3
12.30.2
12.5
..
7.1
Deficit
2.7
-7.2
-7.0
-3.9
-0.7-1.2
-20.0
—
-0.5
0.5
1.7
-0.2..
T4
a/
-7.91.3
-6.6
._
-5.2
14.8
-11.6
-6.6
-2.3
-2.80.3
-23.0
—
-0.5
-1.9
a/
-0.50.1
-2.8
§/
-10.30.8
-9.5
0.3
-12.1
10.9
-4.4
-18.7
-1.8
-2.30.2
-27.0
—
-0.5
-1.4
-0.1
-0.3a/
-2.3
§/
-11.01.1
-9.9
0.3
-11.9
15.1
-4.3
-8.6
-3.9
-4.40.9
-20.3
-0.1
a/
-0.1
0.7
0.20.10.7
0.1
a/1.91.8
0.1
2.7
22.9
9.4
9.3
4.1
4.41.8
24.7
0.2
0.5
1.5
2.2
0.50.13.4
0.1
8.31.98.4
0.1
10.0
22.9
SOURCE: Congressional Budget Office,a. Less than $50 million.

APPENDIX A ANALYSIS OF CONGRESSIONAL BUDGET ESTIMATES 97
Actual revenues for 1987 were only $1 billion more than theAugust estimate and $2 billion more than the budget resolution.Weaker economic growth and other errors in economic assumptionswould have caused revenues to fall $27 billion short of the budget re-solution estimate. More than offsetting this, however, was a $22 bil-lion gain in revenues caused by tax reform and other legislation notassumed in the budget resolution and an error of $7 billion in tech-nical and other estimating assumptions. Information that has becomeavailable since August has allowed some of the technical error to beattributed to economic or policy assumptions, thereby reducing thetechnical error by $4 billion.
On a basis comparable to the budget resolution, 1987 outlays to-taled $1,002.9 billion. This figure exceeds by $0.8 billion the amountreported in the Final Monthly Treasury Statement (for fiscal year1987), which contained an error in outlays for the Federal Crop Insur-ance Fund. It is $1.7 billion less than the amount to be shown in thecurrent budget, which treats the Thrift Savings Fund and FederalSavings and Loan Insurance Corporation notes differently than thebudget resolution.
Outlays in 1987, as adjusted, were $7 billion less than CBO'sAugust estimate. The major difference was in nondefense discre-tionary spending, which came in $7 billion below the August estimateand $9 billion below the budget resolution. While outlays still exceed-ed the budget resolution estimate by $13 billion as a result of errors intechnical assumptions, the size of the technical estimating errors wassubstantially less than the $21 billion foreseen in August. Outlay er-rors resulting from policy and economic assumptions were littlechanged from the August estimate and, on balance, partly offset thetechnical errors.
The adjusted deficit for 1987 proved to be $149 billion-$9 billionless than the August estimate and only $6 billion above the budgetresolution target. Erroneous economic and technical assumptions to-gether added $21 billion to the deficit, but tax reform and other policychanges subtracted $15 billion. Midway through the fiscal year it hadappeared that the deficit would reach $176 billion (as estimated byCBO in February 1987) or more (as various private forecasters con-tended). In the final analysis, however, the difference between theactual outcome and the budget resolution estimate was the secondsmallest of the 1980s.

I J98 THE ECONOMIC AND BUDGET OUTLOOK February 1988
TABLE A-5. TECHNICAL DIFFERENCES BETWEEN ACTUAL BUDGETTOTALS AND FIRST BUDGET RESOLUTION ESTIMATESFOR FISCAL YEARS 1980-1987 (In billions of dollars)
AverageAverage Absolute
1980 1981 1982 1983 1984 1985 1986 1987Differ-ence
Differ-ence
RevenuesIndividual
Income 5.7Corporate
Income -8.5Social
Insurance 0.2Other Revenue
Sources -0.9Unallocated
by SourceAccounting
Change -
Total -3.5
NationalDefense 5.2
EntitlementsIMF, exchange
stabilizationfund and FMStrust fund -0.3
Farm pricesupports -1.7
FDIC andFSLIC 1.3
Medicare andMedicaid 0.9
SocialSecurity -0.9
Unemploymentcompen-sation 1.0
AFDC.SSI,andEITC 0.7
Other 0.7
Subtotal 1.7
NondefenseDiscretionary 9.2
Net InterestDebt service 1.2Other -0.1
Subtotal 1.1
-3.1
-1.8
-2.4
-2.3
-3.0
..
-12.6
1.4
0.7
2.3
0.7
4.0
-1.1
-0.3
1.03.1
10.3
5.2
3.106
3.7
0.1
2.2
-0.5
1.0
-
-3.9
-1.1
2.7
0.4
11.0
-0.8
3.8
-1.7
-0.1
a/-0.1
12.5
-4.8
a/-3.7
-3.6
3.0
-1.1
-1.0
0.3
-3.9
._
-2.7
-4.6
-1.3
10.6
1.0
0.9
2.0
-2.6
-0.22.3
12.6
-2.5
-0.1-3.5
-3.6
-0.5
-2.5
-0.1
-0.8
-
..
-3.9
Outlays
-11.9
0.1
-1.2
1.4
-4.0
1.1
-3.0
1.1-0,2
-4.6
-2.9
-2.51.1
-1.4
S/
2.4
1.5
-0.6
-
_.
3.3
-12.4
-0.8
2.4
0.2
0.3
-0.5
-0.4
1.1-0.1
2.1
-2.0
-1.42.2
0.9
-3.7
-2.3
1.7
2.1
-
__
-2.1
7.0
-3.0
10.3
2.7
1.8
-0.2
0.3
0.80.1
12.7
-6.0
0.63,5
4.0
5.8
-5.9
3.2
3.6
-
..
6.7
2.2
-0.4
1.0
4.1
4.6
-0.8
0.5
0.91.0
10.9
-9.2
1.04.4
5.4
0.9
-2.2
0.3
0.3
-0.9
-0.5
-2.0
-1.3
-0.6
4.3
1.3
1.5
-0.3
-0.6
0.70.9
7.3
-1.6
0.20.6
0.8
2.7
3.3
1.3
1.5
0.9
0.5
4.5
5.9
0.9
5.1
1.5
2.5
1.0
1.0
0.71.0
8.4
5.2
1.22.4
3.0
(Continued)

APPENDIX A ANALYSIS OF CONGRESSIONAL BUDGET ESTIMATES 99
TABLE A-5. (Continued)
1980 1981 1982 1983 1984 1985 1986 1987
AverageAverage AbsoluteDiffer- Differ-
OffsettingReceipts
Timber andmineralreceipts
OCSreceipts
Other
Subtotal
AccountingChange
Total
Outlays(Continued)
-0.2
-1.2-0.2
-1.6
-
15.6
0.2
-5.10.3
-4.6
-
16.0
1.3
3.5a/
4.8
-3.9
7.7
1.6
3.906
6.1
-
8.1
0.7
1.70.4
2.7
-
-18.0
0.2
-0.8-0.8
-1.5
-
-12.9
0.2
3.2-1.1
2.2
-
20.1
0.3
2.3LI
3.7
-
13.0
0.5
0.9a/
1.5
-0.5
6.2
0.6
2.70.6
3.4
0.5
13.9
Deficit 19.1 28.6
Deficit
8.8 10.8 -14.1 -16.2 22.2 6.3 8.2 15.8
SOURCE: Congressional Budget Office.
NOTE: IMF = International Monetary Fund; FMS = Foreign Military Sales; FDIC = Federal DepositInsurance Corporation; FSLIC = Federal Savings and Loan Insurance Corporation; AFDC =Aid to Families with Dependent Children; SSI = Supplemental Security Income; EITC =Earned Income Tax Credit; OCS = Outer Continental Shelf.
a. Less than $50 million.
The revisions in the 1987 figures have little effect on the con-clusions reached in CBO's August report. During the 1980s, Congres-sional budget resolutions underestimated the actual deficits by anaverage of $42 billion (instead of the $44 billion estimated in August).Inaccurate economic assumptions are still estimated to account for$23 billion of the average error. The average policy and technical dif-ferences are $11 billion and $8 billion respectively, slightly lower thanthe corresponding differences in the August estimate.

il

APPENDIX B
METHODOLOGY OF MEDIUM-TERM
ECONOMIC PROJECTIONS
To a substantial degree, the Congressional Budget Office medium-term projections covering the years 1990 through 1993 reflect his-torically normal trend values and relationships among economicseries. The projections are therefore unconditional—that is, they donot depend specifically on any policy regime or economic theory, otherthan being compatible with the results of standard economic growththeory. The main reason for using this procedure is that, as discussedin Appendix C, much uncertainty surrounds six-year economic projec-tions. Given the current imperfect state of knowledge about economicprocesses, projections based on any finely specified theoretical struc-ture risk being highly inaccurate.
The methods used for the CBO projections are described morefully below. In this discussion, gross domestic product (GDP) andgross national product (GNP) are real (corrected for inflation) unlessotherwise noted.
PROJECTING REAL OUTPUT
CBO uses GDP as the basic output variable. GDP is GNP less netservice factor income (that is, income earned abroad by U.S. residentsless income earned in the United States by nonresidents). GDP is pre-ferred to GNP as a measure of output because employment is moreclosely related to the domestic measure and projections of net servicefactor income are especially uncertain at this time.
The CBO projection of GDP reflects the historically typical diverg-ence between potential aggregate supply and actual aggregate de-mand and focuses on a projection of potential GDP—defined as thelevel of GDP consistent with a constant (nonaccelerating) rate of infla-tion. Potential GDP represents an aggregate supply constraint for theeconomy; trying to produce above that level will result in increases in
Ill
102 THE ECONOMIC AND BUDGET OUTLOOK February 1988
the rate of inflation, rather than sustainable increases in real output.The economy does not typically operate at potential, however: onaverage, actual GDP has historically been 0.5 percent lower thanpotential GDP. Thus, steady growth beyond 1989 is assumed to nar-row the gap between actual GDP and potential GDP until the gapreaches its historical average of 0.5 percent in 1993 (see Table B-l).
GNP is then determined by adding to GDP the projection of netservice factor income. The projected GNP that results grows at anaverage rate of about 2.7 percent per year from 1989 to 1993.
Projecting potential GDP first requires an estimate of historicalpotential GDP and potential labor force (see Table B-2). The recenttrend rate of growth for potential GDP per labor force member(GDP/L) is derived from these estimates and used for the projection.Potential GDP/L summarizes trends in the workweek, composition ofoutput, and productivity by industry. Together with projections oflabor force growth made by the Bureau of Labor Statistics (BLS), thetrend rate for GDP/L determines the projected growth of potentialGDP. This method of estimating potential GDP was described in de-tail in previous CBO reports.!./
The following equation describes the result of estimating GDP/Lusing quarterly data available through the third quarter of 1987:
In (GDP/L) = 3.0901 + .0072(T53) + .0237(T57)+ .0200(T60) + .0024(T69) +.0031(T73)+ .0013(T8o) +.0110(T8i)-.0181(U-U*),
where the TIS represent separate time trends beginning at the cyclicalpeaks 1953:11 (the second quarter of 1953), 1957:111, 1960:11, 1969:IV,1973:IV, 1980:1, and 1981:111, and
GDP = real GDP,L = civilian labor force,U = civilian unemployment rate,U* = nonaccelerating-inflation rate of
unemployment (NAIRU).
Congressional Budget Office, The Economic and Budget Outlook: Fiscal Years 1988-1992 (January1987), pp. 147-151, and The Economic and Budget Outlook: An Update (August 1987), pp. 97-102.

APPENDIX B METHODOLOGY OF MEDIUM-TERM ECONOMIC PROJECTIONS 103
The equation separates the influences of cyclical factors and trends insummarizing the course of GDP/L. The difference between the actualunemployment rate and the NAIRU (U-U*) represents the influenceof cyclical factors. As defined above, potential GDP is the level of GDPat the NAIRU: thus, setting U equal to U* in the equation and solvingfor GDP/L gives the cycle-free trend level of potential GDP/L. Coeffi-cients on the TIS represent trend exponential growth rates of potentialGDP/L during the respective periods between cyclical peaks. To pro-ject potential GDP/L, the coefficient of the time trend representing themost recent peak (Tgi) is used.
The projection has been modified in two ways from that describedin earlier CBO reports. First, as can be seen from the coefficient onTgi, new data imply that potential GDP/L will grow less rapidly thanwas estimated in August—at 1.10 percent per year, rather than theearlier estimate of 1.15 percent per year. Second, the current estimateuses the BLS high labor force growth projection rather than themoderate growth projection, since recent labor force growth has typ-ically been higher than the BLS moderate growth projections. As aresult, the average 1987-1993 growth rate projected for the potentiallabor force is 1.34 percent per year. Together these changes implythat the average annual rate of growth for potential GDP from 1987 to1993 will be 2.46 percent.
TABLE B-l. PROJECTED POTENTIAL GDP ANDACTUAL GDP (In billions of 1982 dollars)
Year
1987198819891990199119921993
PotentialGDP
3,8613,9634,0644,1644,2644,3654,468
ActualGDP
3,7973,8873,9934,1014,2124,3274,444
Gap(As a percentage of
potential GDP)
1.61.91.81.51.20.90.5
SOURCE: Congressional Budget Office.
IT"

104 THE ECONOMIC AND BUDGET OUTLOOK February 1988
TABLE B-2. ESTIMATES OF POTENTIAL GNP, REALPOTENTIAL GDP, NAIRU, AND THESTANDARDIZED-EMPLOYMENT DEFICIT
FiscalYears
19561957195819591960196119621963196419651966196719681969197019711972197319741975197619771978197919801981198219831984198519861987
Potential GNP(In billionsof currentdollars)
408435459484511535565597628665709760816892977
1,0611,1551,2531,3981,5851,7611,9762,1782,4472,7343,0583,3653,5943,8284,0504,2724,496
Growthof Real
Potential GDP(In percent)
2.62.62.93.13.23.63.73.73.73.73.73.73.73.73.53.13.13.13.13.03.03.03.03.02.61.92.62.72.72.72.72.7
Standardized-Employment Deficit (-)
NAIRU(In percent) a/
5.15.15.05.15.25.25.35.45.55.65.65.65.65.65.65.75.85.85.96.06.06.05.95.95.96.05.95.95.85.85.85.7
In Billionsof Dollars
232
-933
-3-1-5-3
-11-17-35-8-7
-20-20-22-11-33-46-34-53-40-51-47-51
-106-131-172-187-117
As a Percentage ofPotential GNP
0.60.60.4
-1.90.60.7
-0.5-0.1-0.8-0.4-1.6-2.3-4.3-0.9-0.7-1.9-1.7-1.7-0.8-2.1-2.6-1.7-2.4-1.6-1.9-1.6-1.5-3.0-3.4-4.2-4.4-2.6
Projections
198819891990199119921993
4,7615,0765,4125,7626,1366,537
2.72.62.52.42.42.4
5.75.75.65.65.55.5
-130-146-140-133-131-120
-2.7-2.9-2.6-2.3-2.1-1.8
SOURCES: Congressional Budget Office; NAIRU data through 1980 from Robert J. Gordon, Macroeco-nomics (New York: Little, Brown, 1984), pp. xviii-xxi.
NOTE: In 1976, the commencement of the fiscal year was adjusted from July 1 to October 1. The growthrate in the table for real potential GDP in fiscal year 1977 has been annualized to account forthe effect of the transition quarter (1976:111).
a. The NAIRU (nonaccelerating-inflation rate of unemployment) was referred to in some previousCBO publications as the stable inflation rate of unemployment.

APPENDIX B METHODOLOGY OF MEDIUM-TERM ECONOMIC PROJECTIONS 105
PROJECTING PRICES AND INTEREST RATES
The GNP deflator is projected to grow at 4.1 percent from 1989through 1993. This is nearly equal to its average rate of inflationsince 1950 of 4.3 percent and equal to its rate in 1989, the last year ofthe forecast period. Unlike the GNP deflator, the Consumer PriceIndex (CPI) contains the price of imports. Given the projected trenddecline in the foreign exchange rate of the dollar, the CPI is projectedto rise 4.4 per- cent per year, more rapidly than the GNP deflator.
Interest rates were determined by assuming that the rate on91-day Treasury bills after adjusting for CPI inflation would revert to1.5 percent, which is approximately its average value since the in-ception of floating exchange rates in the early 1970s.2/ Given CPIinflation, the nominal bill rate falls to 5.9 percent by 1993. In turn, itwas assumed that by 1993, the difference in yield between the bill rateand the 10-year government bond rate would revert to 1.5 percentagepoints—the average difference that has prevailed since floating ex-change rates. This sets the bond rate at 7.4 percent in 1993.
2. The calculation used a CPI series (constructed by CBO) that adjusts the published series to beconsistent with revisions made in 1983 in the treatment of housing costs in the CPI.
81-615 - 88 - A
T.'"V

I..J

APPENDIX C
UNCERTAINTY IN ECONOMIC
FORECASTS AND PROJECTIONS
The economic forecasts and longer-term projections presented inChapter I of this report are by nature imprecise, and it is important toexamine the likelihood of large differences between the forecasts (andlonger-term projections) and the outcomes. The last CongressionalBudget Office economic and budget update described CBO's trackrecord in its short-term forecast, and presented a method for evaluat-ing the possibility of error in the forecast of federal revenues resultingfrom uncertainty in the economic forecast.!/ This appendix updatesthe evaluation for the fiscal year 1989 forecast, and extends it to thelonger-term economic projections.
Inaccurate forecasts of nominal gross national product (GNP)have been by far the largest source of CBO's economic errors in deficitforecasts for the following fiscal year. The next largest source of erroris in the forecast of interest rates, which affect federal interest pay-ments. In principle, of course, other types of economic errors couldsometimes be important: for example, errors in forecasting the rela-tionship between profits and wages, or the division of GNP growthinto price and real components. However, in practice these have notproved as important. (Deficit forecasts can err for reasons unrelated tothe economic forecast: for example, technical errors and policychanges that CBO does not try to predict.) For projections beyond thenext fiscal year, it seems likely that errors in the projection of realGNP will prove to be more important, since, as discussed in Chaptern, both revenues and expenditures are likely to be about equallyaffected by movements in broad price indexes.
There is about a two-thirds chance that nominal GNP will notdiffer by more than about 4.2 percent from the forecasts presented inChapter I, which corresponds to a possible error of about $49 billion in
1. Congressional Budget Office, The Economic and Budget Outlook: An Update (August 1987).

L.J
108 THE ECONOMIC AND BUDGET OUTLOOK February 1988
the deficit forecast for fiscal year 1989. The uncertainty of the realGNP projection for fiscal year 1993 is substantially larger (about 7percent of GNP), and the probability that real GNP will not differ bymore than 7 percent from the projected value is also about two-thirds.This uncertainty corresponds to a possible error of about $125 billionin the deficit.
EVALUATING THE UNCERTAINTYOF THE FISCAL YEAR 1989 FORECAST
The nominal GNP forecasts made by CBO for the fiscal years 1978through 1987 erred by an average of 2.8 percent of GNP (see TableC-l). Two-thirds of the errors were no greater than 2.8 percent, but inthree of the ten years (1981, 1982, and 1983, years of recession andearly recovery) the errors were substantially larger. CBO's generalperformance was similar to that of other forecasters, both in the aver-age size of errors and in the circumstances in which particularly largeerrors were made.
This retrospective view gives one measure of the past uncertaintyof CBO's nominal GNP forecasts, and would also give a good idea ofthe uncertainty attached to the GNP forecast for fiscal year 1989, if itwere known that errors in the future would be similar to those madein this 10-year period. It is hard, however, to base any strong con-clusions on only 10 forecasts.
Past errors in CBO's forecasts of nominal GNP for the followingfiscal year seem to have a similar pattern to those that would havebeen made using one of a group of related models known as univariatetime-series models.2/ A simple time-series model was therefore usedto calculate an independent estimate of possible forecast errors.
The time-series model is a first-order autoregression in the growthof nominal GNP, with moving-average terms at lags of one and twoquarters. The uncertainty of the fiscal year 1989 forecast dependsboth on the uncertainty of the coefficients of the model and on the
2. Ibid., pp. 63-86.

APPENDIX C UNCERTAINTY IN ECONOMIC FORECASTS AND PROJECTIONS 109
TABLE C-l. FORECAST ERRORS IN THE BUDGET YEAR GNP
FiscalYear
Government and Private ForecastersCBO OMB CHASE DRI
Mechanical ModelsAverage
WEFA of 42 a/ ARIMA b/
1978197919801981198219831984198519861987
Percentage Errors(Forecast Minus Actual as a Percentage of Actual)
-2.8-2.8-0.2-3.15.96.1
-2.32.0
-0.12.2
-0.3-1.7-0.6-3.25.36.4
-2.61.40.83.0
-4.5-3.7-3.4-4.16.27.3
-1.41.3
-0.60.6
-1.6-2.9-1.8-2.55.76.2
-2.00.4
-1.9-0.1
-0.7-1.8-2.4-3.46.66.8
-1.41.7
-0.31.3
-4.3-3.20.7
-0.14.58.9
-2.2-1.91.24.5
-7.8-6.9-5.2-4.81.82.7
-3.4-1.6-0.93.4
Summary Statistics
MeanPercentageError
1978-871980-87
0.51.3
0.81.3
-0.20.7
c/0.5
0.61.1
0.81.9
-2.3-1.0
Mean AbsolutePercentageError
1978-871980-87
2.82.7
2.52.9
3.33.1
2.52.6
2.63.0
3.23.0
3.83.0
SOURCES: Forecasts are those usually constructed in late January of the previous calendar year.Forecast series for CBO and OMB were obtained from published reports and fromunpublished quarterly forecast tables. Other institutional forecasts were obtained frompublished reports. Complete details of sources were published in CBO, The Economic andBudget Outlook: An Update (August 1987), p. 92. Forecasts are compared with thenominal GNP estimate published by the Commerce Department in the November followingthe close of the fiscal year.
a. This is the average of 42 univariate autoregressive forecasts. See The Economic and BudgetOutlook: An Update (August 1987), Appendix A.
b. Second-order autoregressive model in the growth of nominal GNP, with moving-average terms atlags of one and two quarters.
c. Less than 0.5 in absolute value.
IT 1

I.. II110 THE ECONOMIC AND BUDGET OUTLOOK February 1988
likely distribution of future events not captured by the model ("inno-vations"). The 5,000 simulations used to evaluate the overall uncer-tainty of the forecast took both these sources into account.3/
Errors in nominal GNP forecasts translate into errors in thedeficit forecast principally through their impact on revenue estimates.For this reason, an average marginal tax rate (estimated as 23 per-cent) was used to convert the GNP errors into derived deficit errors.
EVALUATING THE UNCERTAINTY OFTHE FISCAL YEAR 1993 PROJECTION
The CBO economic projections for 1993 are not based-as is theshort-term forecast-on empirical models of the dynamic behavior ofthe economy. Instead, the real GNP projections are constructed usinglimited historical information-typically long-period averages-andclearly defined rules that are described in some detail in Appendix B.Thus, even though CBO does not have a long-enough track record inlong-term projections to make evaluation worthwhile, the uncertaintyinherent in the current set of procedures can be estimated byexamining how those procedures would have fared had they been usedfor a long period. In this way, a synthetic track record is constructed.
Using the Six-Year Projection Rulesto Derive a Synthetic Track Record
The general idea was to simulate six-year projections of real grossdomestic product (GDP), in each case comparing the results of the pro-cedure described in Appendix B with the outcome six years later. Foreach set of projections, the basic GDP per labor force member (GDP/L)regression, which appears in Appendix B, was reestimated using only
3. See unpublished staff working paper, in process, on uncertainty in economic forecasts andprojections, which describes the criteria for model selection and the simulation procedures.

APPENDIX C UNCERTAINTY IN ECONOMIC FORECASTS AND PROJECTIONS 111
the information that would have been available at the time.4/ Thispro- vides an estimate of the growth of potential GDP relative to thepoten- tial labor force. The projected level of potential GDP was thencalcu- lated as the product of projected potential GDP/L and anestimate of the cyclically adjusted labor force (which was assumed tobe known in advance). The projected level of real GDP after six yearswas assumed to differ from potential GDP by the average percentageof GDP from the data available at the time. The exercise was repeatedfor 95 sue- cessive starting quarters, beginning in the first quarter of1958, and thus generated a synthetic track record consisting of 95 setsof six- year projection errors.
Strictly speaking, this procedure evaluates only the errors in theprojection of GDP/L at the end of the six-year period. Labor forceprojections are also uncertain. However, it appears that the addition-al uncertainty in GDP projections arising from this source may besmall. This is perhaps because unpredicted shifts in labor forceparticipation seem to have been correlated with unpredicted shifts inthe opposite direction in productivity growth, and consequently thetwo movements tended to cancel each other out.
The deficit uncertainty for 1993 resulting from the uncertainty ofreal GNP was calculated, once again, under the assumption that themajor source of economic errors in deficit projections is the effect oferrors in nominal GNP on the calculation of revenues. Thus, realGNP errors were multiplied by the CBO projection of the GNP deflatorto convert them to nominal GNP errors, and then revenue errors werecalculated using a marginal tax rate of 23 percent, the rate used in theshort-term analysis. This calculation yields an estimated uncertaintyof the primary deficit (deficit less interest payments) for fiscal year1993 of about $108 billion in 1993 dollars or $92 billion in 1989dollars. The calculation is not complete, however: deficit errors for1993 depend also on the errors for fiscal years 1988 through 1992,since these will affect debt service costs in 1993. Taking into account
4. In the first quarter of 1958 (1958:1), real GDP was assumed to be known through 1957:IV.However, the real GDP for 1957:IV actually reported in early 1958 differs substantially from thatnow reported by the Bureau of Economic Analysis for the same period, in large part because ofconceptual revision and the use of a different price base for real values. Most of these revisionsshould not, in principle, change long-term deficit projections, and thus the most recently reviseddata were used consistently. Some revisions, such as those resulting from the incorporation of newdata sources, would have changed long-term projections. However, it is not easy to isolate theseimportant revisions.

112 THE ECONOMIC AND BUDGET OUTLOOK February 1988
the uncertainty of real GNP in these intermediate years, and usingthe CBO projections of interest rates, the uncertainty of the totaldeficit for fiscal year 1993 rises to about $125 billion in 1993 dollars,or $107 billion in 1989 dollars.
THE IMPRECISION OF UNCERTAINTY ESTIMATES
The discussion above has attempted to give an idea of the degree ofconfidence that is to be attached to economic projections. Differentmeasures of uncertainty could be emphasized.
In the case of the short-term forecast for nominal GNP in fiscalyear 1989, the alternatives are either to rely on the sparse historicalrecord of CBO forecasts—which yields quite a small confidence inter-val of plus or minus 2.8 percent of GNP—or to use the standard devia-tion of forecasts from a model. The model used here gives a confidenceinterval of 4.2 percent of GNP, which is somewhat larger than CBO'shistorical record of forecasts but might be taken as an indication of theinherent difficulty of forecasting.
The confidence interval for the long-term projection of real GNPfor fiscal year 1993 is reported as plus or minus 7 percent, reflectingthe whole of the synthetic sample of 95 projections. These projectionsoverlap, however, so the projections are not independent of each otherand the sample is not, in fact, very large. As a result, different sub-samples yield quite a wide range of estimates of the confidence inter-val, from about 5 percent to about 10 percent.
The extent of uncertainty implied by the confidence intervalsdiscussed here is similar to that implied by the alternative sets of eco-nomic projections that CBO published until recently. For example, inJanuary 1987 the high and low alternative projections implied thatnominal GNP in the second calendar year of the forecast would be re-spectively 2.7 percent above and 9.2 percent below the baseline-asomewhat wider range than the plus or minus 4.2 percent confidenceinterval proposed in this report for nominal GNP in fiscal year 1989.57(The low path included a severe recession, with low inflation.) The
5. The Economic and Budget Outlook: Fiscal Years 1988-1992 (January 1987), pp. 8 and 9.

APPENDIX C UNCERTAINTY IN ECONOMIC FORECASTS AND PROJECTIONS 113
same alternative projections called for real GNP after six years to berespectively 9.6 percent above and 6.3 percent below the baselineprojection—also a wider range than the plus or minus 7 percent confi-dence interval proposed in the current baseline projection for realGNP in fiscal year 1993.


APPENDIX D
BASELINE CONCEPTS AND ADJUSTMENTS
The Congressional Budget Office budget baseline is designed to showthe pattern federal government revenues and spending would takeduring the next five years if current policies were continued withoutchange. This appendix describes the baseline concepts behind therevenue and spending projections presented in this report.
Since last year, CBO has modified its baseline definition to con-form in most respects to the definition of the budget base in the Bal-anced Budget and Emergency Deficit Control Act of 1985 (Public Law99-177, more commonly referred to as the Balanced Budget Act) asamended by the Balanced Budget and Emergency Deficit Control Re-affirmation Act of 1987 (Public Law 100-119, known more briefly asthe Balanced Budget Reaffirmation Act). For 1989, the CBO baselinedeficit estimate is identical to CBO's estimate used for computing theexcess deficit as part of the sequestration process.
This appendix is presented in two sections: the first defines therevenue and spending components of the budget, and the second de-scribes how the baseline projections would differ under alternative as-sumptions about certain federal programs.
DEFINITION OF THE BUDGET BASELINE
The CBO baseline includes revenues generated under current tax law.Excise taxes dedicated to trust funds scheduled to expire during theprojection period are extended at current rates through the end of theperiod, as specified for the Balanced Budget Act baseline.
Four such extensions are assumed. Airport and Airway TrustFund taxes are extended beyond their scheduled expiration date ofDecember 31, 1990; Leaking Underground Storage Tank (LUST)Trust Fund taxes and Hazardous Substance (Superfund) taxes are
IT ' T

116 THE ECONOMIC AND BUDGET OUTLOOK February 1988
extended beyond December 31, 1991; and the newly enacted VaccineInjury Compensation (VIC) Trust Fund taxes are extended beyondDecember 31,1992.
The Congress provides funding for certain federal programs di-rectly, in authorization and other substantive legislation. All otherfederal spending is subject to annual review through the appropri-ation process.
Direct Spending
Federal programs whose funding is provided in authorization andother legislation constitute the first category of spending; provision forthem is considered mandatory in each year's budget. Section 401(c)(2)of the Congressional Budget and Impoundment Control Act of 1974(Public Law 93-344), as amended by the Balanced Budget Act, recog-nizes several types of direct spending authority, including permanentappropriations for entitlement programs, such as Social Security andUnemployment Insurance, and for interest on the public debt.
The direct spending category also includes appropriated enti-tlements, which are funded in annual appropriation acts. Amongthese are benefit programs such as Medicaid, Supplemental SecurityIncome, Aid to Families with Dependent Children, veterans' compen-sation and pension spending, and other programs. In the past, the bud-getary treatment of these programs has been at issue; the Office ofManagement and Budget has considered them as appropriations andCBO has treated them as entitlements. The Balanced Budget Re-affirmation Act clarified the treatment, and designated the programsas entitlements. The CBO baseline projects full funding for each pro-gram in the 1989-1993 period.
In addition to appropriated entitlements, CBO, OMB, and theHouse and Senate Budget Committees have developed a common listof appropriations that are considered mandatory for purposes of theBalanced Budget Act. These mandatory appropriations include FoodStamps, child nutrition, and Unemployment Insurance Trust Fundoutlays for training and employment services and for administrativeexpenses.

APPENDIX D BASELINE CONCEPTS AND ADJUSTMENTS 117
The baseline projections for direct spending programs representCBO's current estimate of future spending under the baseline eco-nomic assumptions. The CBO baseline concepts for direct spendingare consistent with the Balanced Budget Reaffirmation Act, with onlythree exceptions to the general rule that certain provisions of law pro-viding section 402(c)(2) spending authority expire as scheduled: FoodStamps and Nutrition Assistance to Puerto Rico are extended beyondtheir scheduled expiration in 1990, Guaranteed Student Loans for newborrowers are extended beyond 1991, and Trade Adjustment Assist-ance is extended beyond 1991.
Annual Appropriations
Funding for appropriated programs may take the form of current bud-get authority, limitations on obligations, and limitations on directloans and loan guarantees. Baseline projections for this type of spend-ing assume constant real funding levels in each year—that is, the base-year funding is raised by amounts that allow for annual price in-creases. The Balanced Budget Reaffirmation Act specifies that theseannual increments are to be derived separately for the nonpersonneland personnel portions of spending in each program. The non-personnel portion is inflated by the economywide change in prices, ap-proximated by the GNP deflator. The personnel portion is inflated bya more complex process that takes into account the impact of payraises, pay absorption (funding a portion of the increase in pay coststhrough federal agencies' other appropriations), and the increased re-tirement costs under the Federal Employees' Retirement System(FERS).
The calculation of these inflators is shown in Table D-l. The levelof nonpersonnel budget authority in an appropriated account for fiscalyear 1989, for example, is derived by increasing the fiscal year 1988appropriation by 4 percent, which is CBO's projected 1989 growth ratefor the GNP implicit deflator. If the account includes spending forcivilian personnel, such as an agency's salary and expenseappropriation, the fiscal year 1989 level for that portion would becalculated as follows: the fiscal year 1988 level would be increased by
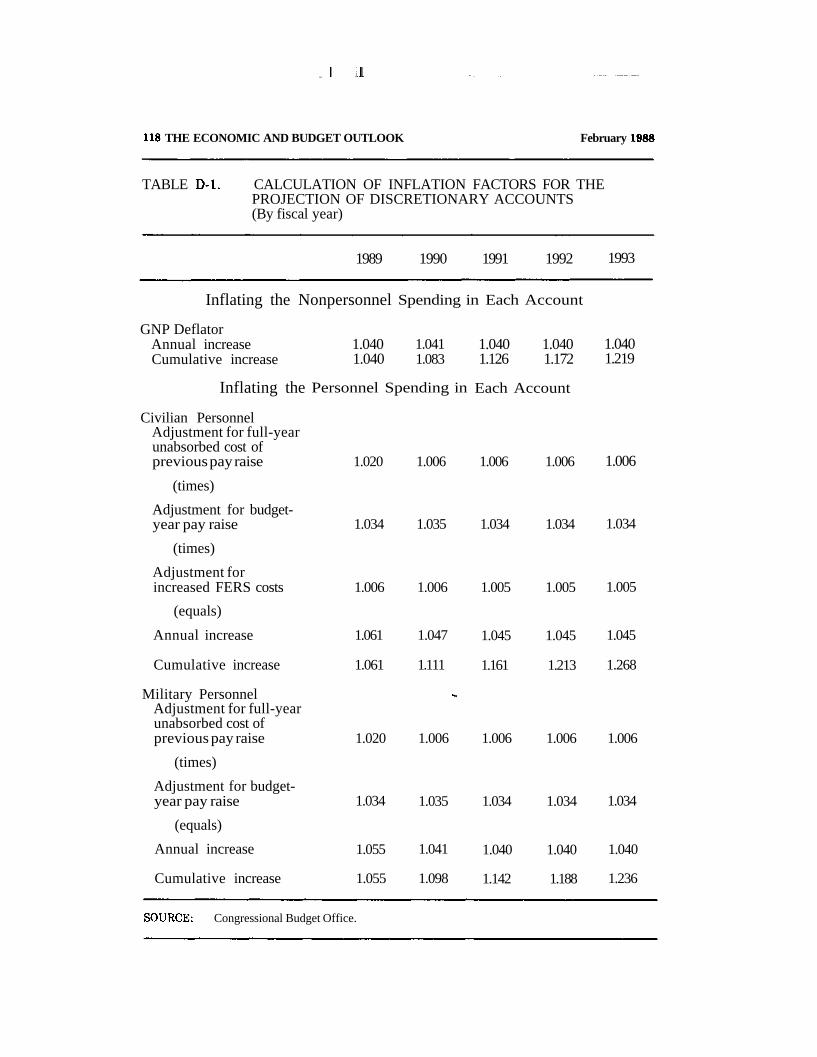
.1... il
118 THE ECONOMIC AND BUDGET OUTLOOK February 1988
TABLE D-l. CALCULATION OF INFLATION FACTORS FOR THEPROJECTION OF DISCRETIONARY ACCOUNTS(By fiscal year)
1989
Inflating the Nonpersonnel
GNP DeflatorAnnual increaseCumulative increase
Inflating the
Civilian PersonnelAdjustment for full-yearunabsorbed cost ofprevious pay raise
(times)
Adjustment for budget-year pay raise
(times)
Adjustment forincreased FERS costs
(equals)
Annual increase
Cumulative increase
Military PersonnelAdjustment for full-yearunabsorbed cost ofprevious pay raise
(times)
Adjustment for budget-year pay raise
(equals)
Annual increase
Cumulative increase
1.0401.040
1990 1991 1992 1993
Spending in Each Account
1.0411.083
Personnel Spending in
1.020
1.034
1.006
1.061
1.061
1.020
1.034
1.055
1.055
1.006
1.035
1.006
1.047
1.111
1.006
1.035
1.041
1.098
1.040 1.0401.126 1.172
Each Account
1.006 1.006
1.034 1.034
1.005 1.005
1.045 1.045
1.161 1.213
1.006 1.006
1.034 1.034
1.040 1.040
1.142 1.188
1.0401.219
1.006
1.034
1.005
1.045
1.268
1.006
1.034
1.040
1.236
SOURCE: Congressional Budget Office.

APPENDIX D BASELINE CONCEPTS AND ADJUSTMENTS 119
2 percent to adjust for the 1989 cost of the January 1988 pay raise,then by an additional 3.4 percent to account for CBO's projected 4percent fiscal year 1989 civilian pay raise with a 22 percent payabsorption rate applied to 70 percent of the costs; the result would beincreased by 0.6 percent to adjust for the added FEES costs that wouldaccompany the higher pay levels.
In most cases, the level of projected outlays for each account isthen calculated by applying an appropriate spendout rate-that is, ameasure of how current budget authority is converted into a givenyear's outlays-and adding any outlays that can be made in the givenyear from budget authority appropriated in previous years.
The CBO baseline follows this method of calculating inflation forall appropriated accounts except one: additional budget authority isassumed to be provided to cover the extension of subsidized housingcontracts (Section 8 Rental Assistance) that expire in 1991 and inlater years.
THE EFFECT OF ALTERNATIVE PROGRAMASSUMPTIONS ON REVENUE AND SPENDING ESTIMATES
The estimates made by CBO for revenues and for certain spendingprograms over the 1989-1993 period differ slightly from the levels thatwould have been projected under previous years' baseline concepts.
Under baseline concepts used before the Balanced Budget Reaf-firmation Act, revenues earmarked for two trust funds—the LeakingUnderground Storage Tank Trust Fund (intended to defray the clean-up costs of environmental pollution from leaking petrochemical stor-age tanks) and the Vaccine Injury Compensation Trust Fund—wouldnot have been extended at current rates. Both are relatively new pro-grams with no history of legislated extensions, and both providefunding for programs of specified dimensions which will terminatewhen certain limits are reached. The law provides that LUST taxeswill terminate before their scheduled expiration date if cumulativenet revenues have reached a total of $500 million. The VIC excise taxprovides funding for awards to persons injured by the administrationof vaccines; once a maximum number of awards has been made andpaid for by the tax, the program will terminate. The extension of these
IT V

120 THE ECONOMIC AND BUDGET OUTLOOK February 1988
two trust funds has no effect on revenues before 1991, and quite smalleffects each year from 1991 through 1993.
The spending projections for a few programs differ slightly fromthe projections that would have been made under the baseline con-cepts CBO used prior to the enactment of the Balanced Budget Reaf-firmation Act. For several reasons, the base-year (fiscal year 1988)budget authority for these programs does not reflect the amountsneeded in future years to continue the trend of current programoperations.
For example, unspent funds from previous years or transfers fromother programs reduced the base-year funding requirements for cer-tain federal programs. Accordingly, the Congress lowered the appro-priations in fiscal year 1988 for these programs. In the budget yearand beyond, however, when these prior balances and transfers are notavailable, additional appropriations would be required to maintainthe 1988 program level. The spending levels projected from this temp-orary reduction in funding therefore underestimate program needs.
In the past, CBO ended or limited spending for another group ofprograms in future years as authorizations expired or as spendingreached ceilings provided in the authorizing legislation. Under thenew methodology, the calculation of future budget authority from thebase-year values overestimates spending in these programs.
For a third group of programs, the modified baseline conceptsyield anomalous projections that ignore significant program charac-teristics. For example, the baseline projections do not include theexpenses involved in conducting the decennial census, and do not re-flect the Congress's intent to fill the Strategic Petroleum Reserve atthe minimum rate specified in the Omnibus Budget Reconciliation Actof 1986 (Public Law 99-509).
Table D-2 shows how projected revenues, budget authority, andoutlays would differ if the program changes noted above were incor-porated in the CBO baseline. Revenues would not be affected untilfiscal year 1991, and thereafter would be reduced by small amounts.Spending would be changed for about 41 out of roughly 1,200 accountsin the CBO baseline; the effect on total outlays would exceed $200 mil-lion only in fiscal year 1990, when spending for the decennial censuswould add $1 billion.
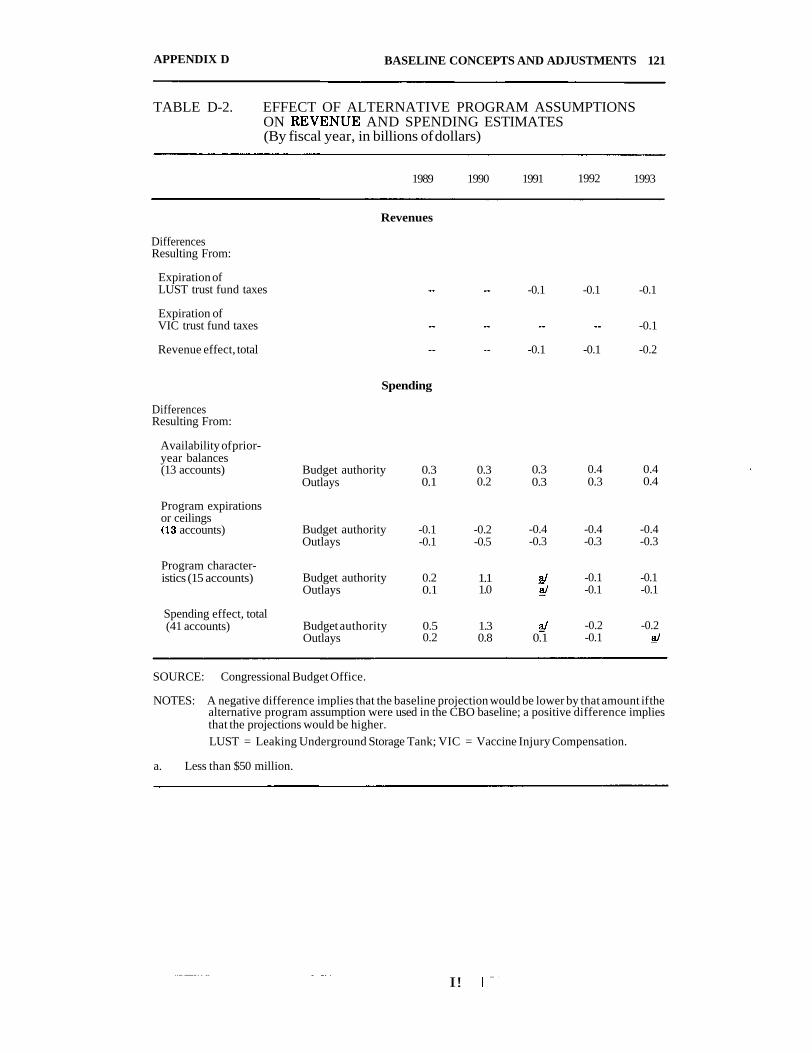
APPENDIX D BASELINE CONCEPTS AND ADJUSTMENTS 121
TABLE D-2. EFFECT OF ALTERNATIVE PROGRAM ASSUMPTIONSON REVENUE AND SPENDING ESTIMATES(By fiscal year, in billions of dollars)
1989 1990 1991 1992 1993
DifferencesResulting From:
Expiration ofLUST trust fund taxes
Expiration ofVIC trust fund taxes
Revenue effect, total
Revenues
-0.1
-0.1
-0.1
-0.1
-0.1
-0.1
-0.2
Spending
DifferencesResulting From:
Availability of prior-year balances(13 accounts)
Program expirationsor ceilings(13 accounts)
Program character-istics (15 accounts)
Spending effect, total(41 accounts)
Budget authorityOutlays
Budget authorityOutlays
Budget authorityOutlays
Budget authorityOutlays
0.30.1
-0.1-0.1
0.20.1
0.50.2
0.30.2
-0.2-0.5
1.11.0
1.30.8
0.30.3
-0.4-0.3
a/§/
aJ0.1
0.40.3
-0.4-0.3
-0.1-0.1
-0.2-0.1
0.40.4
-0.4-0.3
-0.1-0.1
-0.2§/
SOURCE: Congressional Budget Office.
NOTES: A negative difference implies that the baseline projection would be lower by that amount if thealternative program assumption were used in the CBO baseline; a positive difference impliesthat the projections would be higher.LUST = Leaking Underground Storage Tank; VIC = Vaccine Injury Compensation.
a. Less than $50 million.
I! T


APPENDIX E
BASELINE SPENDING AND CREDIT
PROJECTIONS BY BUDGET FUNCTION
Five broad categories of outlays-defense, entitlements and other man-datory spending, nondefense discretionary spending, net interest, andoffsetting receipts—used in the body of this report are designed toreflect the way in which the Congress has approached spending deci-sions in recent budget resolutions. In this appendix, federal spendingand credit projections are classified according to 19 budget functions.
The Congressional Budget Act of 1974, as amended, requires theCongress to include estimates of budget authority, outlays, new directloan obligations, and new guaranteed loan commitments for eachmajor budget function in its annual budget resolutions. The func-tional classification is a means of presenting spending estimates interms of the broad national needs that federal programs are intendedto address. Within a function, the programmatic objectives may beachieved in a variety of ways, including spending from Congressionalappropriations, loans to private borrowers, and spending from ear-marked trust funds.
National needs are grouped into 17 broad budget functions rang-ing from national defense, international affairs, energy, and agricul-ture programs to education, health, income security, and general gov-ernment. The two remaining functions-net interest and undistrib-uted offsetting receipts-do not address national needs but are in-cluded to make the budget complete. Two functions—general purposefiscal assistance to state and local governments, and allowances-areno longer shown separately. General purpose fiscal assistance is nowincluded in the general government function. The cost of future payraises for federal civilian employees that had been in the allowancefunction is now distributed throughout the remaining functions in thebaseline projections.

.1 —i i
124 THE ECONOMIC AND BUDGET OUTLOOK February 1988
Some outlays are excluded from the on-budget totals by law. TheBalanced Budget and Emergency Deficit Control Act of 1985 providesthat the outlays (and revenues) of the Social Security trust funds areto be excluded from the on-budget aggregates. Outlays for the SocialSecurity retirement, survivors, and disability programs are classifiedin budget function 650. Most spending in this function-representingthe outlays of the Old-Age and Survivors Insurance and DisabilityInsurance trust funds for benefit payments, administrative expenses,and other miscellaneous costs—is treated as off-budget. Off-budgetoutlays in net interest (function 900) reflect the interest earned by theSocial Security trust funds on their investments in Treasury secur-ities, while the off-budget portion of function 950 (undistributed off-setting receipts) reflects the payroll tax paid by federal governmentagencies on behalf of workers covered under the program.
Since 1980, Congressional budget resolutions have also included aseparate credit budget. The spending budget, which generally oper-ates on a cash-flow basis, cannot accurately reflect the full impact offederal budgetary policies on the allocation of credit in the U.S. econ-omy. In the spending budget, loans are recorded on a net basis—thatis, new loans less repayments. Loan guarantees do not appear exceptin the case of a default. The credit budget remedies some of theseshortfalls by presenting the gross amounts of new loans and loan guar-antees. Most credit budget activity is concentrated in a few budgetfunctions: international affairs, agriculture, commerce and housingcredit, education, and veterans' programs.
The CBO baseline projections for budget authority, outlays, andcredit are presented by budget function in Tables E-l, E-2, and E-3,respectively.

APPENDIX E PROJECTIONS BY BUDGET FUNCTION 125
TABLE E-l. CBO BASELINE BUDGET AUTHORITY PROJECTIONSBY FUNCTION (By fiscal year, in billions of dollars)
1988Budget Function Base
050 National Defense150 International Affairs250 General Science, Space,
and Technology270 Energy300 Natural Resources
and Environment350 Agriculture370 Commerce and
Housing Credit400 Transportation450 Community and Regional
Development500 Education, Training,
Employment, andSocial Services
550 Health570 Medicare600 Income Security650 Social Security
On-budgetOff-budget
Subtotal700 Veterans' Benefits
and Services750 Administration
of Justice800 General Government900 Net Interest
On-budgetOff-budget
Subtotal950 Undistributed
Offsetting ReceiptsOn-budgetOff-budget
Subtotal
On-budget subtotalOff-budget subtotal
Total 1
29117
116
1524
1528
10
354595
169
5252257
28
89
158-7
151
-31-4
-36
938240
,179
Projections1989
30819
116
1626
1329
8
3751
104175
5274280
29
910
177-11166
-33-5
-37
999259
1,258
1990
32020
126
1726
1429
8
3855
114180
5304309
30
911
199-16184
-34-5
-39
1,059283
1,343
1991
33320
126
1823
930
7
3961
126217
5334339
30
1011
218-21196
-35-6
-41
1,140307
1,447
1992
34721
136
1923
1029
8
3967
138218
5361366
31
1111
229-28201
-36-6
-43
1,188327
1,516
1993
36122
136
1921
829
8
4173
152229
6394400
32
1112
240-34206
-37-7
-45
1,244353
1,597
SOURCE: Congressional Budget Office.

126 THE ECONOMIC AND BUDGET OUTLOOK February 1988
TABLE E-2. CBO BASELINE OUTLAY PROJECTIONS BY FUNCTION(By fiscal year, in billions of dollars)
1988Budget Function Base
050 National Defense150 International Affairs250 General Science, Space,
and Technology270 Energy300 Natural Resources
and Environment350 Agriculture370 Commerce and
Housing Credit400 Transportation450 Community and Regional
Development500 Education, Training,
Employment, andSocial Services
550 Health570 Medicare600 Income Security650 Social Security
On-budgetOff-budget
Subtotal700 Veterans' Benefits
and Services750 Administration
of Justice800 General Government900 Net Interest
On-budgetOff-budget
Subtotal950 Undistributed
Offsetting ReceiptsOn-budgetOff-budget
Subtotal
On-budget subtotalOff-budget subtotal
2879
113
1522
627
6
334480
131
5214219
29
89
158-7
151
-31-4
-36
852203
Total 1,055
Projections1989
29517
115
1622
728
7
364987
139
5229234
29
810
177-11166
-33-5
-37
916213
1,129
1990
30616
125
1722
729
7
375598
146
5246251
30
910
199-16184
-34-5
-39
978225
1,203
1991
32016
124
1821
430
7
3860
110154
5263268
31
1011
218-21196
-35-6
-41
1,034236
1,269
1992
33317
124
1818
531
7
3966
122162
5280285
31
1011
229-28201
-36-6
-43
1,086246
1,332
1993
34517
135
1917
332
7
4072
136172
6297303
32
1111
240-34206
-38-7
-45
1,140256
1,396
SOURCE: Congressional Budget Office.

APPENDIX E PROJECTIONS BY BUDGET FUNCTION 127
TABLE E-3. CBO BASELINE CREDIT PROJECTIONS BYBUDGET FUNCTION (By fiscal year, in billions of dollars)
Budget Function
150
270
300
350
370
400
450
500
550
600
700
InternationalAffairs
Energy
Natural Resourcesand Environment
Agriculture
Commerce andHousing Credit
Transportation
Communityand RegionalDevelopment
1988Base
DLPG
DLPG
DL
DLPG
DLPG
DLPG
DLPG
Education, Training,Employment, and DLSocial Services PG
Health
Income Security
Veterans' Benefitsand Services
Total b/
DLPG
DL
DLPG
DLPG
615
32
a/
186
472
a/a/
1§/
210
al§/
§/
222
37130
Projections1989
79
2§/
§/
166
464
§/0
1§/
210
a/§/
0
220
35111
1990
710
2§/
§/
156
467
§/0
1a/
210
§/a/
0
126
34122
1991
810
2§/
a/
146
474
a/0
1§/
210
a/§/
0
129
34132
1992
810
2§/
§/
147
480
a/0
1§/
210
a/§/
0
132
33142
1993
811
2§/
§/
147
487
al0
1§/
210
al§/
0
134
34151
SOURCE: Congressional Budget Office.NOTES: DL = New direct loan obligations.
PG = New primary loan guarantee commitments.
a. Less than $500 million.b. Direct Loan totals include DL for guarantee claims.


APPENDIX F
FEDERAL RECEIPTS AND EXPENDITURES
IN THE NATIONAL INCOME AND PRODUCT
ACCOUNTS
Both the budget and the federal sector of the National Income andProduct Accounts (NIPA) measure the receipts and expenditures ofthe federal government. The national income accounts measure cur-rent income and production and are the most widely used indicator ofcurrent economic activity. As a rule, the NEPA federal sector is moreuseful than the budget for analyzing the economic impact of federalgovernment activity. The NEPA estimates of federal governmentactivity differ from those of the budget in four ways: timing of trans-actions, netting and grossing of receipts against spending, treatmentof financial activities, and coverage.
Timing differences occur because the budget records transactions(except interest owed to the public) on a cash-paid or cash-receivedbasis, while the NIPA federal sector may use a cash, accrual, or otherbasis, depending on the type of transaction. On the receipts side, themost important timing difference is the recording of corporate profittaxes in the NIPA at the time the tax liability is incurred, which maybe months (or years) before the tax payment is deposited in theTreasury. On the expenditure side, the only major timing differenceis that some large defense purchases are recorded in the NEPA at thetime of delivery rather than at the time payment is made. Other tim-ing differences are generally small.
Differences in netting and grossing arise because the budgettreats certain types of receipts as offsets to outlays. For example,agency payments to the Civil Service Retirement Trust Fund andother federal employee benefit plans are counted as a negative outlayin the budget, exactly offsetting agency expenditures elsewhere. Inthe NEPA, this amount is added to both receipts and expenditures inorder to provide a more accurate measure of personal income and out-lays. Other netting and grossing adjustments in the NEPA are madefor funds collected by the government in the course of business-typetransactions—such as Medicare premiums, timber sales, and rentsand royalties arising from the Outer Continental Shelf leases.

il130 THE ECONOMIC AND BUDGET OUTLOOK February 1988
Lending and financial transactions that involve only the ex-change of existing assets and liabilities are generally excluded fromthe NTPA, since they generate no current income or output. For ex-ample, the sale of a governmental asset such as Conrail reduces thebudget deficit but has no effect on the NIPA deficit. Similarly, directlending by the Small Business Administration and other agencies isreflected in the budget but is excluded from the NIPA. Interest paid orreceived in the course of financial transactions, though, is reflected inthe NIPA federal sector. Moreover, nonrecourse agricultural commod-ity loans are recorded by the NIPA as purchases of goods rather thanlending.
Coverage differences largely reflect the exclusion of Puerto Rico,the Virgin Islands, and other territories for purposes of computing thegross national product and related data series in the NIPA.
The major differences between the budget and the federal sector inthe NIPA are detailed in Table F-l. Table F-2 shows estimates offederal sector receipts and expenditures on a NIPA basis, consistentwith current CBO baseline budget projections.
As anticipated in CBO's January 1987 baseline report (TheEconomic and Budget Outlook: Fiscal Years 1988-1992), the delay ofthe final military paycheck of fiscal year 1987 into fiscal year 1988increased the defense timing adjustment,which measures the differ-ence between the value of goods delivered and cash outlays. Since thefederal budget generally records spending transactions on a cash bas-is, the paycheck's delay into 1988 reduced the 1987 budget deficit.However, employee compensation is recorded on an accrual basis bythe NIPA; hence, the pay delay added to the 1987 defense timing ad-justment. This decision differs from the tentative Bureau of EconomicAnalysis approach, which would have allowed the pay delay to reduceNIPA defense purchases in fiscal year 1987.

APPENDIX F FEDERAL RECEIPTS AND EXPENDITURES IN THE NIPA 131
TABLE F-l. RELATIONSHIP OF THE BUDGET TO THE FEDERALSECTOR OF THE NATIONAL INCOME AND PRODUCTACCOUNTS (By fiscal year, in billions of dollars)
1988 ProjectionsBase 1989 1990 1991 1992 1993
Total Revenues
DifferencesGovernment contributions
for employee retirementMedicare premiumsOther netting and grossingGeographic exclusionsOther
Total Federal SectorNIPA Receipts
Total Outlays
Receipts
897 953 1,036 1,112 1,181 1,262
38910-3-4
401010-3-1
431111-3a/
451210-31
481210-33
511311-33
947 1,009 1,097 1,177 1,252 1,337
Expenditures
1,055 1,129 1,203 1,269 1,332 1,396
DifferencesLending and financial
transactionsGovernment contributions
for employee retirementMedicare premiumsOther netting and grossingDefense timing adjustmentBonuses on Outer Continental
Shelf land leasesGeographic exclusionsOther
Total Federal SectorNIPA Expenditures
2
389
105
1-6-5
1,109
-9
4010103
1-6-3
1,176
-8
4311113
1-7-2
1,256
-7
4512103
1-7-3
1,323
-6
4812103
1-7-3
1,391
-4
5113113
1-8-3
1,460
SOURCE: Congressional Budget Office,
a. Less than $500 million.

132 THE ECONOMIC AND BUDGET OUTLOOK February 1988
TABLE F-2. PROJECTIONS OF BASELINE REVENUES ANDEXPENDITURES ON A NATIONAL INCOMEAND PRODUCT ACCOUNTS BASIS(By fiscal year, in billions of dollars)
Personal Tax andNontax Receipts
Corporate ProfitsTax Accruals
Indirect Business Taxand Nontax Accruals
Contributions forSocial Insurance
Total Receipts
1988Base 1989
Receipts
401 424
113 126
57 59
375 400
947 1,009
Projections1990
463
140
62
432
1,097
1991
503
148
61
465
1,177
1992
542
152
62
496
1,252
1993
584
158
65
531
1,337
Expenditures
Purchases of Goodsand Services
DefenseNondefense
Transfer Payments
Grants-in-Aid to Stateand Local Governments
Net Interest Paid
Subsidies Less Current Surplusof Government Enterprises
Total Expenditures
Deficit
385 397293 300
92 97
434 466
109 116
151 166
30 31
1,109 1,176
Deficit
-162 -167
413312101
504
122
183
35
1,256
-159
430327104
538
128
194
33
1,323
-146
448341107
575
136
199
33
1,391
-139
466355111
614
144
203
32
1,460
-123
SOURCE: Congressional Budget Office.

APPENDIX G
HISTORICAL BUDGET DATA
The budget policies of the federal government and the role of the bud-get in the national economy have changed in many ways over the past26 years. This appendix analyzes some of these changes by examininghistorical trends in revenues, outlays, and federal debt and comparingthem with projected levels. Actual budget data for fiscal years 1962through 1987, both in nominal dollars and as a percentage of grossnational product (GNP), are provided in Tables G-l through G-8.
Federal revenues, outlays, deficit or surplus, and debt held by thepublic are shown in Tables G-l and G-2. Revenues and outlayscontain both on- and off-budget components. All federal governmentreceipts and outlays are on-budget except those for Social Security,which appear off-budget. Social Security is excluded from the on-budget aggregates under provisions of the Balanced Budget andEmergency Deficit Control Act of 1985. The act specifies, though, thatthe total deficit—including receipts and outlays for Social Security-must be considered in determining whether the federal government islikely to exceed the statutory deficit targets. The amount of the totaldeficit is also critical in establishing the federal government'sborrowing re- quirements. Debt held by the public represents theamount borrowed by the federal government over the years, and it in-creases each year by roughly the amount of the total deficit.
The major sources of federal revenue (including off-budget reve-nues) are presented in Tables G-3 and G-4. These sources are individ-ual and corporate income taxes, social insurance taxes and contribu-tions, excise taxes, estate and gift taxes, customs duties, and mis-cellaneous receipts. Social insurance taxes and contributions includeemployer and employee payments for Social Security, Medicare, Rail-road Retirement, and Unemployment Insurance, and pension contri-butions by federal workers. Excise taxes are levied on certain prod-ucts and services, such as gasoline, alcohol, and air travel. The wind-

134 THE ECONOMIC AND BUDGET OUTLOOK February 1988
fall profit tax on domestic oil producers was enacted in 1980, and isclassified as an excise tax. Miscellaneous receipts consist mainly ofdeposits of earnings by the Federal Reserve System.
Total on- and off-budget outlays for major spending categories areshown in Tables G-5 and G-6. These categories are national defense,entitlements and other mandatory spending, nondefense discretionaryspending, net interest, and offsetting receipts.
National defense and net interest are identical to the budget func-tions with the same titles (budget functions 050 and 900, respective-ly). The historical data for national defense have been adjusted to in-clude imputed accruals for military retirement and are consistentwith the definition of national defense used in the baseline projections.
Entitlements and other mandatory spending include programs forwhich spending is governed by laws making all who meet certainrequirements eligible to receive payments. (Additional detail on enti-tlement spending is found in Tables G-7 and G-8.) Many entitlementprograms require that recipients have incomes below a certain level.The largest such means-tested program is Medicaid. Other means-tested entitlements include Food Stamps, Aid to Families with Depen-dent Children, and Supplemental Security Income.
Most entitlement programs are not means-tested, Social Securityand Medicare being the largest such programs. Other retirement anddisability programs include federal civilian and military retirement,Railroad Retirement, payments to disabled coal miners, and severalsmaller programs. Unemployment compensation, another non-means-tested program, is especially large during recessions, such asthe one in 1981 and 1982. Other non-means-tested entitlementsinclude farm price supports, general revenue sharing, revolving fundssuch as the Federal Deposit Insurance Corporation, and a large num-ber of smaller trust funds.
Nondefense discretionary spending consists of all programs, otherthan defense and entitlements, controlled through the appropriationprocess. Examples include most direct federal spending for energy, theadministration of justice, foreign economic and military aid, space,and natural resources. Federal grants-in-aid to state and local gov-

APPENDIX G HISTORICAL BUDGET DATA 135
ernments for transportation, education, housing, and community de-velopment are also considered to be discretionary.
Offsetting receipts include the federal government's contributiontoward employee retirement, fees and charges such as Medicare pre-miums, and receipts from the use of federally controlled land and off-shore territory. The bulk of these receipts from the use of federal prop-erty are rents and royalties from oil, gas, and other mineral devel-opment and proceeds from timber and power sales.
The historical data in Tables G-l through G-8, as well as the base-line projections discussed in Chapter n, incorporate minor changes tothe spending categories. The largest change shifts the administrativeexpenses of certain entitlement programs (Family Support Admin-istration, Unemployment Trust Fund) from the entitlement and othermandatory spending category to the nondefense discretionary spend-ing category. The administrative expenses of other entitlementprograms have long been included in the nondefense discretionary cat-egory. In addition, certain transportation subsidies have been movedto the nondefense discretionary category from entitlements and othermandatory spending. The purpose of these changes is to have the non-defense discretionary spending category correspond with the defini-tion of discretionary spending in the Balanced Budget and EmergencyDeficit Control Act of 1985.
The 1986 budget totals reflect a change in the treatment of de-mand notes issued by the Federal Deposit Insurance Corporation;included in the totals is $443 million in notes that previously had notbeen treated as outlays. For 1987, the Office of Management and Bud-get is treating notes payable issued by the Federal Savings and LoanInsurance Corporation as outlays; they are not treating these notes asoutlays in previous years.

136 THE ECONOMIC AND BUDGET OUTLOOK February 1988
TABLE G-l. REVENUES, OUTLAYS, DEFICITS, AND DEBTHELD BY THE PUBLIC, FISCAL YEARS 1962-1987(In billions of dollars)
RevenuesFiscalYear
1962196319641965
19661967196819691970
19711972197319741975
19761977197819791980
19811982198319841985
19861987
On-Budget
87.492.496.2100.1
111.7124.4128.1157.9159.3
151.3167.4184.7209.3216.6
231.7278.7314.2365.3403.9
469.1474.3453.2500.4547.9
568.9640.8
Off-Budget
12.314.216.416.7
19.124.424.929.033.5
35.839.946.153.962.5
66.476.885.498.0113.2
130.2143.5147.3166.1186.2
200.2213.4
Total
99.7106.6112.6116.8
130.8148.8153.0186.9192.8
187.1207.3230.8263.2279.1
298.1355.6399.6463.3517.1
599.3617.8600.6666.5734.1
769.1854.1
On-Budget
93.396.4102.8101.7
114.8137.0155.8158.4168.0
177.3193.8200.1217.3271.9
302.2328.5369.1403.5476.6
543.0594.3661.2686.0769.5
806.8810.7
OutlaysOff-
Budget
13.515.015.716.5
19.720.422.325.227.6
32.836.945.652.160.4
69.680.789.7100.0114.3
135.2151.4147.1165.8176.8
183.5193.9
Total
106.8111.3118.5118.2
134.5157.5178.1183.6195.6
210.2230.7245.7269.4332.3
371.8409.2458.7503.5590.9
678.2745.7808.3851.8946.3
990.31,004.6
Deficit(-)or
Surplus
-7.1-4.8-5.9-1.4
-3.7-8.6
-25.23.2-2.8
-23.0-23.4-14.9-6.1-53.2
-73.7-53.6-59.2-40.2-73.8
-78.9-127.9-207.8-185.3-212.3
-221.2-150.4
DebtHeldby thePublic
248.4254.5257.6261.6
264.7267.5290.6279.5284.9
304.3323.8343.0346.1396.9
480.3551.8610.9644.6715.1
794.4929.4
1,141.81,312.61,509.9
1,745.61,896.9
SOURCE: Congressional Budget Office.

APPENDIX G HISTORICAL BUDGET DAT A 137
TABLE G-2. REVENUES, OUTLAYS, DEFICITS, AND DEBTHELD BY THE PUBLIC, FISCAL YEARS 1962-1987(As a percentage of GNP)
RevenuesFiscalYear
1962196319641965
19661967196819691970
19711972197319741975
19761977197819791980
19811982198319841985
19861987
SOURCE:
On-Budget
15.715.715.314.9
15.115.715.117.016.1
14.314.514.414.814.2
13.614.414.514.915.1
15.715.113.613.613.9
13.614.5
Off-Budget
2.22.42.62.5
2.63.12.93.13.4
3.43.53.63.84.1
3.94.03.94.04.2
4.44.64.44.54.7
4.84.8
Total
17.918.117.917.4
17.718.718.020.119.5
17.718.018.018.618.3
17.618.418.418.919.4
20.119.718.118.118.6
18.319.4
On-Budget
16.716.416.315.1
15.517.218.317.017.0
16.816.815.615.317.9
17.817.017.016.517.8
18.218.919.918.619.5
19.218.4
OutlaysOff-
Budget
2.42.52.52.5
2.72.62.62.72.8
3.13.23.63.74.0
4.14.24.14.14.3
4.54.84.44.54.5
4.44.4
Total
19.218.918.817.6
18.219.821.019.819.8
19.920.019.219.021.8
21.921.221.120.622.1
22.723.824.323.124.0
23.622.8
Deficit(-)or
Surplus
-1.3-0.8-0.9-0.2
-0.5-1.1-3.00.3
-0.3
-2.2-2.0-1.2-0.4-3.5
-4.3-2.8-2.7-1.6-2.8
-2.6-4.1-6.3-5.0-5.4
-5.3-3.4
DebtHeld
by thePublic
44.543.340.938.9
35.833.734.230.128.8
28.828.126.824.426.1
28.328.528.126.326.8
26.629.634.435.638.3
41.643.0
Congressional Budget Office.

138 THE ECONOMIC AND BUDGET OUTLOOK February 1988
TABLE G-3. REVENUES BY MAJOR SOURCE, FISCAL YEARS1962-1987 (In billions of dollars)
SocialIndi- Corpo- Insurance
vidual rate Taxes and Estate Cus- Miscel- TotalFiscal Income Income Contri- Excise and Gift toms laneous Reve-Year Taxes Taxes butions Taxes Taxes Duties Receipts nues
1962196319641965
19661967196819691970
19711972197319741975
19761977197819791980
19811982198319841985
19861987
45.647.648.748.8
55.461.568.787.290.4
86.294.7103.2119.0122.4
131.6157.6181.0217.8244.1
285.9297.7288.9298.4334.5
349.0392.6
20.521.623.525.5
30.134.028.736.732.8
26.832.236.238.640.6
41.454.960.065.764.6
61.149.237.056.961.3
63.183.9
17.019.822.022.2
25.532.633.939.044.4
47.352.663.175.184.5
90.8106.5121.0138.9157.8
182.7201.5209.0239.4265.2
283.9303.3
12.513.213.714.6
13.113.714.115.215.7
16.615.516.316.816.6
17.017.518.418.724.3
40.836.335.337.436.0
32.932.5
2.02.22.42.7
3.13.03.13.53.6
3.75.44.95.04.6
5.27.35.35.46.4
6.88.06.16.06.4
7.07.5
1.11.21.31.4
1.81.92.02.32.4
2.63.33.23.33.7
4.15.26.67.47.2
8.18.98.711.412.1
13.315.0
0.81.01.11.6
1.92.12.52.93.4
3.93.63.95.46.7
8.06.57.49.312.7
13.816.215.617.018.5
19.919.3
99.7106.6112.6116.8
130.8148.8153.0186.9192.8
187.1207.3230.8263.2279.1
298.1355.6399.6463.3517.1
599.3617.8600.6666.5734.1
769.1854.1
SOURCE: Congressional Budget Office.

APPENDIX G HISTORICAL BUDGET DATA 139
TABLE G-4. REVENUES BY MAJOR SOURCE, FISCAL YEARS1962-1987 (As a percentage of GNP)
SocialIndi- Corpo- Insurance
vidual rate Taxes and Estate Cus- Miscel- TotalFiscal Income Income Contri- Excise and Gift toms laneous Reve-Year Taxes Taxes butions Taxes Taxes Duties Receipts nues
1962196319641965
19661967196819691970
19711972197319741975
19761977197819791980
19811982198319841985
19861987
8.28.17.77.3
7.57.78.19.49.1
8.28.28.18.48.0
7.78.28.38.99.1
9.69.58.78.18.5
8.38.9
3.73.73.73.8
4.14.33.43.93.3
2.52.82.82.72.7
2.42.82.82.72.4
2.01.61.11.51.6
1.51.9
3.13.43.53.3
3.54.14.04.24.5
4.54.64.95.35.6
5.35.55.65.75.9
6.16.46.36.56.7
6.86.9
2.22.22.22.2
1.81.71.71.61.6
1.61.31.31.21.1
1.00.90.80.80.9
1.41.21.11.00.9
0.80.7
0.40.40.40.4
0.40.40.40.40.4
0.40.50.40.40.3
0.30.40.20.20.2
0.20.30.20.20.2
0.20.2
0.20.20.20.2
0.20.20.20.20.2
0.20.30.20.20.2
0.20.30.30.30.3
0.30.30.30.30.3
0.30.3
0.20.20.20.2
0.30.30.30.30.3
0.40.30.30.40.4
0.50.30.30.40.5
0.50.50.50.50.5
0.50.4
17.918.117.917.4
17.718.718.020.119.5
17.718.018.018.618.3
17.618.418.418.919.4
20.119.718.118.118.6
18.319.4
SOURCE: Congressional Budget Office.
IT'

140 THE ECONOMIC AND BUDGET OUTLOOK February 1988
TABLE G-5. OUTLAYS FOR MAJOR SPENDING CATEGORIES,FISCAL YEARS 1962-1987 (In billions of dollars)
FiscalYear
1962196319641965
19661967196819691970
19711972197319741975
19761977197819791980
19811982198319841985
19861987
Entitlementsand Other
National MandatoryDefense Spending
52.353.454.850.6
58.171.481.982.581.7
78.979.276.779.386.5
89.697.2
104.5116.3134.0
157.5185.3209.9227.4252.7
273.4282.0
30.533.034.334.5
37.245.052.158.466.2
80.694.2
110.3124.0155.8
182.2197.2217.5235.7278.2
321.0357.5399.0394.8437.8
455.4474.1
NondefenseDiscretionary Net
Spending Interest
24.125.329.132.5
38.441.143.841.245.1
50.156.059.565.983.3
93.0106.5124.3134.8156.6
170.3155.1157.5165.7175.8
174.1163.9
6.97.78.28.6
9.410.311.112.714.4
14.815.517.321.423.2
26.729.935.442.652.5
68.785.089.8
111.1129.4
136.0138.6
OffsettingReceipts
-7.0-8.1-7.8-8.0
-8.5-10.3-10.8-11.1-11.6
-14.2-14.2-18.1-21.3-18.5
-19.7-21.6-23.0-26.1-30.3
-39.3-37.2-47.8-47.2-49.5
-48.6-54.1
TotalOutlays
106.8111.3118.5118.2
134.5157.5178.1183.6195.6
210.2230.7245.7269.4332.3
371.8409.2458.7503.5590.9
678.2745.7808.3851.8946.3
990.31,004.6
SOURCE: Congressional Budget Office.

APPENDIX G HISTORICAL BUDGET DATA 141
TABLE G-6. OUTLAYS FOR MAJOR SPENDING CATEGORIES,FISCAL YEARS 1962-1987 (As a percentage of GNP)
Entitlementsand Other Nondefense
FiscalYear
1962196319641965
19661967196819691970
19711972197319741975
19761977197819791980
19811982198319841985
19861987
SOURCE:
NationalDefense
9.49.18.77.5
7.99.09.68.98.2
7.56.96.05.65.7
5.35.04.84.85.0
5.35.96.36.26.4
6.56.4
Mandatory Discretionary NetSpending Spending Interest
5.55.65.45.1
5.05.76.16.36.7
7.68.28.68.8
10.2
10.710.210.09.6
10.4
10.711.412.010.711.1
10.910.8
4.34.34.64.8
5.25.25.24.44.6
4.74.94.64.75.6
5.55.55.75.55.9
5.74.94.74.54.5
4.23.7
1.21.31.31.3
1.31.31.31.41.5
1.41.31.31.51.5
1.61.51.61.72.0
2.32.72.73.03.3
3.23.1
OffsettingReceipts
-1.3-1.4-1.2-1.2
-1.2-1.3-1.3-1.2-1.2
-1.3-1.2-1.4-1.5-1.2
-1.2-1.1-1.1-1.1-1.1
-1.3-1.2-1.4-1.3-1.3
-1.2-1.2
TotalOutlays
19.218.918.817.6
18.219.821.019.819.8
19.920.019.219.021.8
21.921.221.120.622.1
22.723.824.323.124.0
23.622.8
Congressional Budget Office.

142 THE ECONOMIC AND BUDGET OUTLOOK February 1988
TABLE G-7. OUTLAYS FOR ENTITLEMENTS AND OTHERMANDATORY SPENDING, FISCAL YEARS 1962-1987(In billions of dollars)
FiscalYear
1962196319641965
19661967196819691970
19711972197319741975
19761977197819791980
19811982198319841985
19861987
Medi-caid
0.10.20.20.3
0.81.21.82.32.7
3.44.64.65.86.8
8.69.9
10.712.414.0
16.817.419.020.122.7
25.027.4
OtherMeans-Tested
Pro-grams
4.24.64.85.0
5.05.05.76.47.4
10.011.711.513.918.9
22.224.025.327.132.6
37.838.140.641.643.7
45.946.5
SocialSecurity
14.115.516.317.1
20.221.323.026.529.4
34.839.047.954.563.1
72.283.291.8
101.9117.1
138.0154.1168.6176.1186.5
196.7205.2
Medi-care
——~
0.03.25.16.36.8
7.58.49.0
10.814.1
17.020.725.028.933.9
41.349.255.561.069.8
74.279.9
OtherRetire-mentand
Disability
2.62.93.33.5
4.14.85.75.26.6
8.29.5
11.513.616.4
18.621.223.227.331.5
36.639.841.943.344.0
46.749.2
Unemploy-ment
Compen-sation
3.53.63.42.7
2.22.32.22.33.1
5.86.74.95.6
12.8
18.614.310.89.8
16.9
18.322.229.716.815.8
16.117.1
OtherNon-
Means-Tested
Programs
5.96.36.35.9
4.97.28.79.4
10.2
10.914.321.019.823.6
25.124.030.728.432.2
32.236.743.636.055.4
50.748.9
TotalEntitle-ments
and OtherMandatorySpending
30.533.034.334.5
37.245.052.158.466.2
80.694.2
110.3124.0155.8
182.2197.2217.5235.8278.2
321.0357.5399.0394.8437.8
455.4474.1
SOURCE: Congressional Budget Office.

APPENDIX G HISTORICAL BUDGET DATA 143
TABLE G-8. OUTLAYS FOR ENTITLEMENTS AND OTHERMANDATORY SPENDING, FISCAL YEARS 1962-1987(As a percentage of GNP)
FiscalYear
1962196319641965
19661967196819691970
19711972197319741975
19761977197819791980
19811982198319841985
19861987
Medi-caid
0.00.00.00.0
0.10.10.20.20.3
0.30.40.40.40.4
0.50.50.50.50.5
0.60.60.60.50.6
0.60.6
OtherMeans-Tested
Pro-grams
0.80.80.80.7
0.70.60.70.70.7
0.91.00.91.01.2
1.31.21.21.11.2
1.31.21.21.11.1
1.11.1
SocialSecurity
2.52.62.62.5
2.72.72.72.93.0
3.33.43.73.84.1
4.34.34.24.24.4
4.64.95.14.84.7
4.74.7
Medi-care
——~
0.00.40.60.70.7
0.70.70.70.80.9
1.01.11.11.21.3
1.41.61.71.71.8
1.81.8
OtherRetire-mentand
Disability
0.50.50.50.5
0.60.60.70.60.7
0.80.80.91.01.1
1.11.11.11.11.2
1.21.31.31.21.1
1.11.1
Unemploy-ment
Compen-sation
0.60.60.50.4
0.30.30.30.20.3
0.50.60.40.40.8
1.10.70.50.40.6
0.60.70.90.50.4
0.40.4
OtherNon-
Means-Tested
Programs
1.11.11.00.9
0.70.91.01.01.0
1.01.21.61.41.6
1.51.21.41.21.2
1.11.21.31.01.4
1.21.1
TotalEntitle-ments
and OtherMandatorySpending
5.55.65.45.1
5.05.76.16.36.7
7.68.28.68.8
10.2
10.710.210.09.6
10.4
10.711.412.010.711.1
10.910.7
SOURCE: Congressional Budget Office.

11 "1"

APPENDIX H
MAJOR CONTRIBUTORS TO THE
REVENUE AND SPENDING PROJECTIONS
The following analysts prepared the revenue and spending projectionsin this report:
Revenue Projections
Mark Booth Corporate income taxes,Federal Reserve System earnings
Jon Hakken Windfall profit taxRichard Kasten Individual income taxesJeffrey Miller Excise taxesKathleen O'Connell Individual income taxes,
estate and gift taxesMarianne Page Customs duties,
miscellaneous receiptsLinda Radey Social insurance contributions,
excise taxesFrank Sammartino Individual income taxes
Spending Projections
Defense and International Affairs
Eugene Bryton DefenseKent Christensen International affairsRay Hall DefenseBarbara Hollinshead DefenseWilliam Myers DefenseAmy Plapp DefenseJoseph Whitehill International affairsBen Wolters Defense

146 THE ECONOMIC AND BUDGET OUTLOOK February 1988
Spending Projections (continued)
Human Resources
Paul CullinanRichard Curley
Carmela Dyer
Alan FairbankHolly HarveyDeborah KalcevicJean KayserJulia IsaacsDonald MuseMichael NamianJanice Peskin
Michael Pogue
Kathleen Shepherd
Social SecuritySupplemental Security Income,
veterans' educationPublic Health Service,
federal retirementHospital InsuranceSupplementary Medical InsuranceEducationHealth programsFood Stamps, child nutritionMedicaid, MedicareSocial servicesAid to Families with Dependent
Children, child supportenforcement
Unemployment Insurance,training programs
Veterans' benefits
Natural and Physical Resources
Kim CawleyCarol Cohen
Douglas Criscitello
Peter FontaineTheresa Gullo
James Hearn
Hsin-Hui HsuMary Maginniss
Eileen Manfredi
EnergyCommunity and regional
developmentCommerce, disaster relief and
insuranceEnergyWater resources, conservation, and
land managementGeneral government, Agriculture
Credit Insurance Fund, OuterContinental Shelf receipts
AgriculturePostal Service, deposit insurance,
Small Business AdministrationAgriculture

APPENDIX H MAJOR CONTRIBUTORS 147
Spending Projections (continued)
Natural and Physical Resources (continued)
Marjorie MillerAndrew MortonDeborah Reis
Mitchell RosenfeldBrent ShippMichael Sieverts
Other
Janet AirisEdward BlauPaul ChristyDavid Elkes
Betty EmbreyKenneth FarrisDanila GirerdGlen GoodnowVernon HammettSandra HoffmanRichard KropFritz MaierRoy MeyersKathy Ruffing
Robert SempseyRobert SeilerJeffSwerseyKarlaTrujilloPaula Williams
o
TransportationAgricultureRecreation, pollution control,
water transportationAir transportation, justiceHousing and mortgage creditScience and space, justice,
other natural resources
Appropriation billsAppropriation billsOther interestNational Income and
Product AccountsAppropriation billsComputer supportCredit analysisAuthorization billsComputer supportComputer supportCivlian agency payComputer supportBudget processTreasury borrowing,
interest, and debtAppropriation billsBudget processComputer supportAppropriation billsComputer support
81-615 (176)