Embed Size (px)
Citation preview

CONGRESS OF THE UNITED STATESCONGRESSIONAL BUDGET OFFICE JANUARY 1991
The Economic and Budget Outlook:Fiscal Years 1992-1996A Report to theSenate and House Committeeson the Budget
NOTICEThis Document is Not Available
for Public Release Until70:00 a.m. (EST)
Wednesday, January 30, 1991.
1991 ANNUAL REPORT

CBO Publication#534
CONGRESSIONAL
BUDGET OFFICE
Second and D Streets, S.W.
Washington, D.C. 20515
S U M M A R
January 1991
CBO ECONOMIC AND BUDGET OUTLOOK
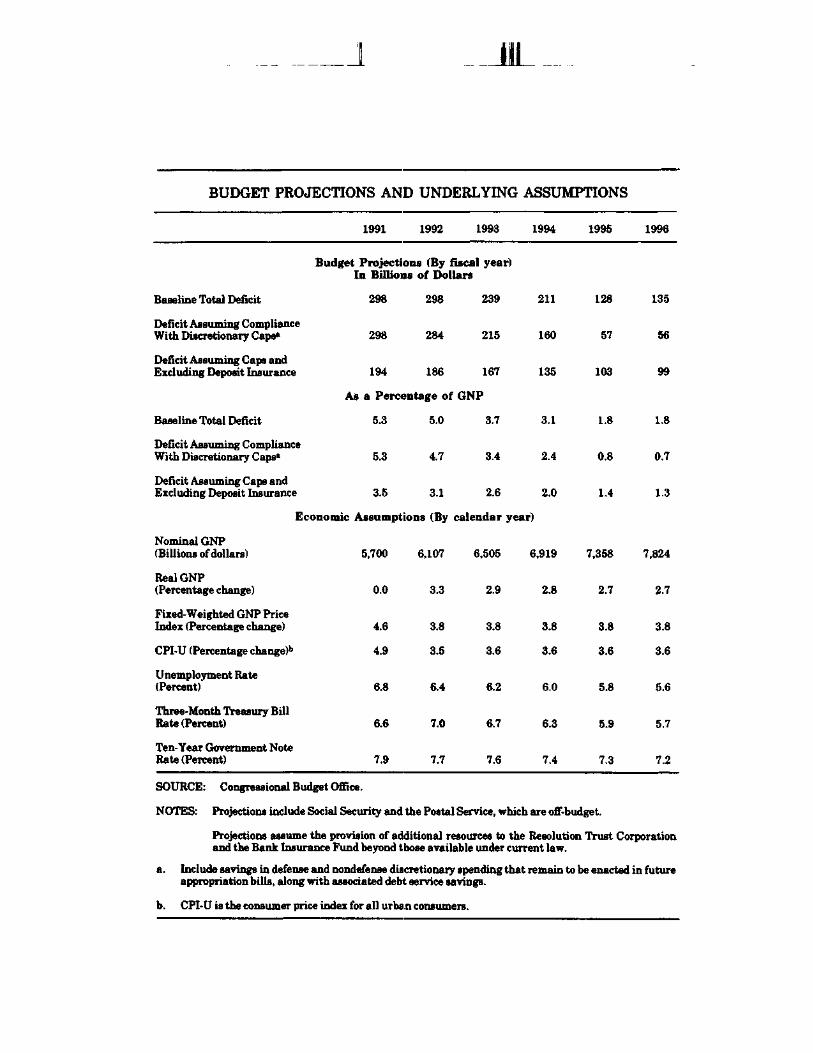
The federal deficit is projected to approach $300 billion in both 1991 and 1992,according to the Congressional Budget Office's report, The Economic and BudgetOutlook: Fiscal Years 1992-1996. But two temporary factors balloon the deficit:the recession, and huge outlays (estimated at about $100 billion in both 1991 and1992) to address insolvent savings and loan institutions and commercial banks.Not reflected in these estimates, but sure to swell the deficit further in 1991, arethe extra costs associated with the war in the Persian Gulf region. As thesetemporary factors fade, the budget picture brightens. By 1995, assuming thatthe new legal limits on discretionary spending are maintained, CBO estimatesthat the deficit will fall under $100 billion for the first time in 15 years--andbelow 1 percent of GNP for the first time in two decades.
Last fall's budget agreement significantly curbed future deficits. In total, theagreement trimmed deficits over the 1991-1995 period by $482 billion. Abouttwo-thirds of the reduction is already in place, through a combination of taxincreases, spending cuts, and savings on debt service. The rest must still beaccomplished by passing annual appropriation bills that comply with thediscretionary spending caps. The agreement also mandated major changes in thebudget process and targets, and CBO's report contains a useful, nontechnicalsummary of these changes.
CBO's projections assume that the U.S. economy is now in a brief recession,which will continue into the spring. After that, the prospects for a moderaterecovery with low inflation are good. After 1991, real growth averages nearly 3percent a year. Inflation subsidies to less than 4 percent a year, and interest ratesfall slightly. The economic outlook, though, is even more murky than usualbecause of the conflict in the Persian Gulf and uncertainty over the availabilityof credit.
Questions concerning the budget projections should be directed to CBO's BudgetAnalysis Division (202-226-2880), and inquiries about the economic forecast tothe Fiscal Analysis Division (202-226-2750). The Office of IntergovernmentalRelations is CBO's Congressional liaison office and can be reached at 202-226-2600. For additional copies of the report, please call the Publications Office at202-226-2809.
IT'
J
BUDGET PROJECTIONS AND UNDERLYING ASSUMPTIONS
1991 1992 1993 1994 1995 1996
Budget Projections (By fiscal year)In Billions of Dollars
Baseline Total Deficit
Deficit Assuming ComplianceWith Discretionary Caps"
Deficit Assuming Caps andExcluding Deposit Insurance
298
298
194
298
284
186
As a Percentage of
Baseline Total Deficit
Deficit Assuming ComplianceWith Discretionary Caps"
Deficit Assuming Caps andExcluding Deposit Insurance
Economic
Nominal GNP(Billions of dollars)
Real GNP(Percentage change)
Fixed-Weighted GNP PriceIndex (Percentage change)
CPI-U (Percentage change)b
Unemployment Rate(Percent)
Three-Month Treasury BillRate (Percent)
Ten- Year Government NoteRate (Percent)
5.3
5.3
3.5
Assumptions
5.0
4.7
3.1
(By
5,700 6,107
0.0
4.6
4.9
6.8
6.6
7.9
3.3
3.8
3.5
6.4
7.0
7.7
239
215
167
GNP
3.7
3.4
2.6
calendar
6,505
2.9
3.8
3.6
6.2
6.7
7.6
211
160
135
3.1
2.4
2.0
year)
6,919
2.8
3.8
3.6
6.0
6.3
7.4
128
57
103
1.8
0.8
1.4
7,358
2.7
3.8
3.6
5.8
5.9
7.3
135
56
99
1.8
0.7
1.3
7,824
2.7
3.8
3.6
5.6
5.7
7.2
SOURCE: Congressional Budget Office.
NOTES: Projections include Social Security and the Postal Service, which are off-budget.
Projections assume the provision of additional resources to the Resolution Trust Corporationand the Bank Insurance Fund beyond those available under current law.
a. Include savings in defense and nondefense discretionary spending that remain to be enacted in futureappropriation bills, along with associated debt service savings.
b. CPI-U is the consumer price index for all urban consumers.
THE ECONOMIC AND BUDGET OUTLOOK:FISCAL YEARS 1992-1996
The Congress of the United StatesCongressional Budget Office
For sale by the Superintendent of Documents, U.13. Government Printing OfficeWashington, D.C. 20402
38-033 0 - 91 — 1 : QL 3
1H IT"

NOTES
Unless otherwise indicated, all years referred to in Chapter I are calendaryears and all years in Chapters II through V are fiscal years.
Unemployment rates throughout the report are calculated on the basis of thecivilian labor force.
Details in the text and tables of this report may not add to totals because ofrounding.
Figures showing periods of recession (indicated by a shaded area) reflect thepeak and trough of the recession.
The Balanced Budget and Emergency Deficit Control Act of 1985 (commonlyknown as Gramm-Rudman-Hollings) is also referred to in this volume morebriefly as the Balanced Budget Act. This act was amended by the OmnibusBudget Reconciliation Act of 1990, referred to in this volume as OBRA or thereconciliation act.

PREFACE
This volume is one of a series of reports on the state of the economy andthe budget issued periodically by the Congressional Budget Office(CBO). It satisfies the requirements of sections 202(f) and 308(c) of theCongressional Budget Act of 1974 to submit an annual report to theCommittees on the Budget with respect to fiscal policy and to providefive-year baseline projections for the federal budget. It also satisfiesthe requirement of section 254(d) of the Budget Enforcement Act of1990 to provide a sequestration preview report regarding the status ofthe discretionary spending limits, pay-as-you-go requirements, andmaximum deficit targets based on laws enacted through January 30,1991. In accordance with CBO's mandate to provide objective and im-partial analysis, the report contains no recommendations.
The analysis of the economic outlook presented in Chapter I wasprepared by the Fiscal Analysis Division under the direction ofFrederick C. Ribe, Robert A. Dennis, arid John F. Peterson. MatthewSalomon wrote the chapter, and Robert Arnold and John F. Petersoncarried out the forecast that is described therein. Background analysiswas carried out by Trevor Alleyne, Victoria Farrell, Douglas RHamilton, George Iden, Kim Kowalewski, Joyce Manchester, AngeloMascaro, Frank S. Russek, Jr., John Sturrock, and Stephan SThurman. Research assistance was provided by Dan Covitz, NicholasDugan, Thomas Steinbach, and Patricia Wahl.
The baseline outlay projections were prepared by the staff of theBudget Analysis Division under the supervision of James L. Blum,C.G. Nuckols, Michael Miller, Charles Seagrave, Robert Sunshine, andPaul N. Van de Water. The revenue estimates were prepared by thestaff of the Tax Analysis Division under the direction of Rosemary D.Marcuss and Kathleen M. O'Connell. Chapters II and III were writtenby Paul N. Van de Water, who also prepared the summary of thereport. Chapter IV was written by Kathy A. Ruffing, and Chapter Vwas written by Rosemary D. Marcuss and Kathleen M. O'Connell. Theappendixes were written by Paul Van de Water (Appendix A), EugeneBryton and Michael Miller (Appendix B), David Elkes (Appendix C),
IT"
iv THE ECONOMIC AND BUDGET OUTLOOK January 1991
and Richard Krop (Appendix D). Gail Del Balzo and John Sturrockprepared the glossary.
Paul L. Houts supervised the editing and production of the report.Major portions were edited by Amanda Balestrieri, Sheila Harty,Francis S. Pierce, and Sherry Snyder. Nancy H. Brooks providededitorial support during production. The authors owe special thanks toMarion Curry, Janice Johnson, Dorothy Kornegay, Verlinda Lewis, L.Rae Roy, and Simone Thomas, who typed the many drafts. With theassistance of Martina Wojak, Kathryn Quattrone prepared the reportfor publication.
Robert D. ReischauerDirector
January 1991

CONTENTS
ISUMMARY
THE ECONOMIC OUTLOOK
xiii
1
Recent Economic Developments 2CBO's Economic Forecast 27
II THE NEW BUDGET PROCESS 43
Budgetary Rules 44Enforcement of the Rules 50Budget Timetable 52Implications of the New Process 55
HI THE BUDGET OUTLOOK 59
The Budget Outlook Through 1996 60Changes in the Outlook Since July 65Measuring the Deficit 71The Economy and the Budget 75
IV THE OUTLOOK FORFEDERAL SPENDING 79
Discretionary Programs and the Caps 80Mandatory Spending and the
Pay-As-You-Go Rules 90Net Interest 96The Outlook for Deposit
Insurance Spending 99Credit Reform and the
Spending Projections 104
vi THE ECONOMIC AND BUDGET OUTLOOK January 1991
V THE REVENUE OUTLOOK 111
Baseline Projections andRevenue Trends 112
The Omnibus Budget ReconciliationAct of 1990 119
The Changing Distribution of Taxes 123
APPENDIXES
A Sequestration Preview Report 129
B Report on Balances Paid fromExpired Accounts 135
C The Federal Sector of the NationalIncome and Product Accounts 137
D Historical Budget Data 143
E Major Contributors to the Revenueand Spending Projections 157
GLOSSARY 161

CONTENTS
TABLES
S-l.
S-2.
S-3.
S-4.
1-1.
1-2.
1-3.
1-4.
1-5.
1-6.
m-i.
III-2.
m-3.
CBO Deficit Projections
Changes in CBO Deficit ProjectionsSince July
Comparison of CBO and plue ChipShort-Run Economic Forecasts
Medium-Term Economic Projectionsfor Calendar Years 1993Through 1996
The Fiscal Policy Outlook
CBO Forecast and Alternatives
Forecasts for 1991 and 1992
Medium-Term Economic Projections forCalendar Years 1993 Through 1996
Medium-Term Economic Projections forFiscal Years 1993 Through 1996
Growth in Labor Productivity in theNonfarm Business Sector
CBO Projections of Total FederalRevenues, Outlays, and Deficits
CBO Estimates of Difscre^ionarySpending Caps
Effects of Recent Policy (Changes onCBO Deficit Projections
xiv
xvii
xix
xxi
17
28
35
37
38
40
63
64
66

JLU_
viii THE ECONOMIC AND BUDGET OUTLOOK January 1991
III-4. Changes in CBO Budget ProjectionsSince July 69
III-5. Alternative Measures of the Deficit 72
III-6. CBO Projections of Trust Fund Surpluses 74
IH-7. Effects on CBO Budget Projections ofSelected Changes in Economic Assumptions 76
IV-1. Outlays By Category, Assuming ComplianceWith Discretionary Spending Caps 82
IV-2. CBO Baseline Projections for Entitlementsand Other Mandatory Spending, ExcludingDeposit Insurance 91
IV-3. Offsetting Receipts in the Baseline 95
IV-4. CBO Projections of Interest Costs andFederal Debt 98
IV-5. Outlays for Deposit Insurance inthe Baseline 101
IV-6. 1992 Baseline Subsidies and Loan Volumesfor Selected Credit Programs 106
V-l. CBO Baseline Revenue Projectionsby Source 112
V-2. Revenue Losses from Extension of ExpiringTax Preferences: Full-Year Effects in 1993 119
V-3. Omnibus Budget Reconciliation Actof 1990, Revenue Effects by Tax Source 120
V-4. Effective Federal Tax Rates 124

CONTENTS
A-l. CBO Estimates of Discretionary SpendingLimits for Fiscal Years 1991,1992, and 1993 130
A-2. CBO Estimates of Discretionary SpendingLimits for Fiscal Years 1994 and 1995 131
C-l. Relationship of the Budget to the FederalSector of the National Income and ProductAccounts 138
C-2. Projections of Baseline Receipts andExpenditures Measured by the NationalIncome and Product Accounts 141
D-l. Standardized-Employment Deficit andRelated Series, Fiscal Years 1956-1990 145
D-2. Revenues, Outlays, Deficits, and DebtHeld by the Public, Fiscal Years 1962-1990(In billions of dollars) 146
D-3. Revenues, Outlays, Deficits, and DebtHeld by the Public, Fiscal Years 1962-1990(As a percentage of GNP) 147
D-4. Revenues, by Major Source, Fiscal Years1962-1990 (In billions of dollars) 148
D-5. Revenues, by Major Source, Fiscal Years1962-1990 (As a percentage of GNP) 149
D-6. Outlays for Major Spending Categories,Fiscal Years 1962-1990 (In billionsof dollars) 150
D-7. Outlays for Major Spending Categories,Fiscal Years 1962-1990 (As a percentageof GNP) 151
x THE ECONOMIC AND BUDGET OUTLOOK January 1991
D-8. Outlays for Entitlements and OtherMandatory Spending, Fiscal Years1962-1990 (In billions of dollars) 152
D-9. Outlays for Entitlements and OtherMandatory Spending, Fiscal Years1962-1990 (As a percentage of GNP) 154
FIGURES
S-l. Deficit Projections xvi
1-1. Inventory-Sales Ratio 5
1-2. Exports as a Share of GNP 6
1-3. Real Oil Prices 8
1-4. Federal Funds Rate 22
1-5. Recent Inflation 23
1-6. The Exchange Rate and theInterest-Rate Differential 24
1-7. Bank Loans and Investment inU.S. Government Securities 26
1-8. The Economic Forecast and Projection 29
IV-1. Outlays by Category as Shares of GNP 81
rV-2. Discretionary Outlays for 1990-1996,Assuming Compliance with Spending Caps 83
IV-3. Defense Budget Authority andOutlays, 1946-1993 86

CONTENTS
V-1. Revenue by Source as Shares of GNP 115
V-2. Composition of Revenues 117
C-l. Deficit as Measured by the National Incomeand Product Accounts and the Budget 139
BOXES
1-1. The Recession Provisions of the BalancedBudget Act 14
IV-1. Federal Pay Reform and the Baseline 89
Hi J i


SUMMARY
The downturn in the economy and record outlays required to resolvefailed banks and savings and loans will push the federal deficit near$300 billion in 1991. Not included in this estimate, but sure to add toit, are the costs of Operation Desert Storm. After 1991, as these factorsbegin to fade and as the savings from last year's budget agreementgrow, the budgetary picture should brighten. By 1995, assuming thatthe new legal limits on discretionary spending are maintained, theCongressional Budget Office (CBO) projects that the total federal defi-cit will fall below $100 billion for the first time in 15 years and below 1percent of gross national product (GNP) for the first time in 20 years.
CBO's budget projections assume that the U.S. economy is now ina brief recession, which will continue into the spring. After that, theprospects for a solid recovery with low inflation are good. Real GNP isprojected to be flat in 1991 (on a year-over-year basis) and to grow byabout 3 percent a year in 1992 through 1996.
THE BUDGET OUTLOOK
The Omnibus Budget Reconciliation Act of 1990, enacted late lastyear, included a record of nearly $500 billion in deficit reduction mea-sures over the 1991-1995 period. The Budget Enforcement Act (TitleXIII of the reconciliation act) established dollar limits on discretionaryspending, a pay-as-you-go provision for most mandatory spending andrevenues, and procedures to enforce these requirements. Although theBudget Enforcement Act does not contain fixed deficit targets, as werepreviously set in law, the spending cuts and tax increases contained inthe reconciliation act should set the deficit on a downward trend after1991.
Til F"
xiv THE ECONOMIC AND BUDGET OUTLOOK January 1991
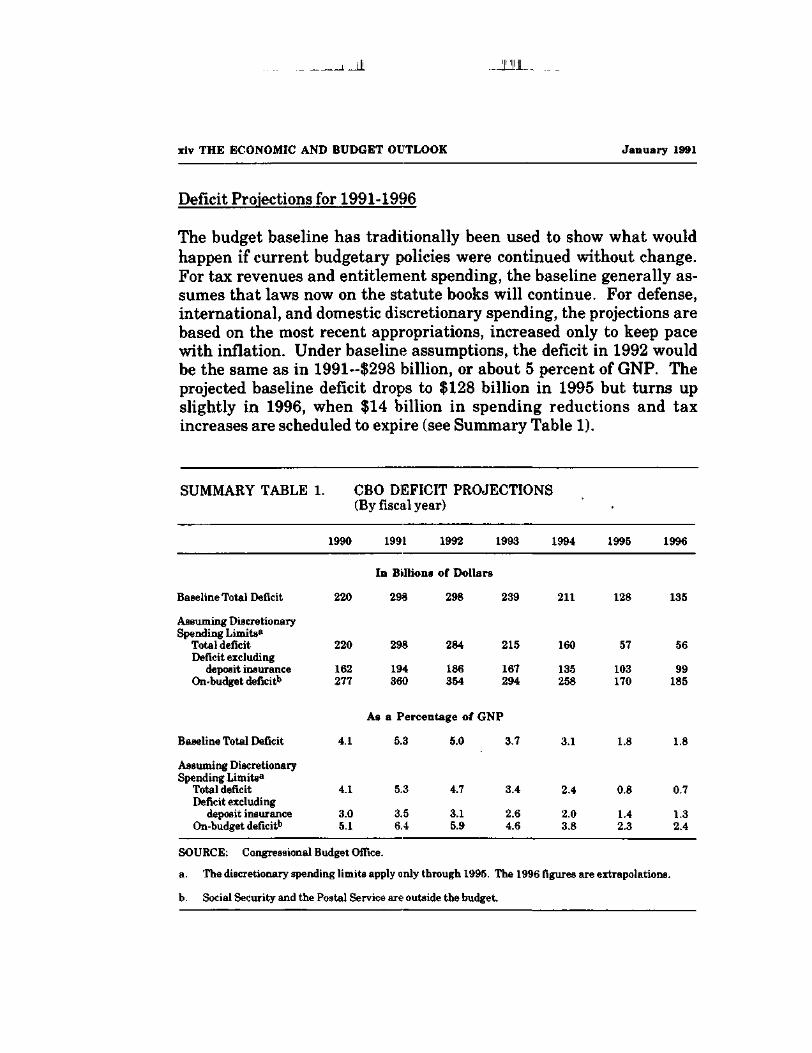
Deficit Projections for 1991-1996
The budget baseline has traditionally been used to show what wouldhappen if current budgetary policies were continued without change.For tax revenues and entitlement spending, the baseline generally as-sumes that laws now on the statute books will continue. For defense,international, and domestic discretionary spending, the projections arebased on the most recent appropriations, increased only to keep pacewith inflation. Under baseline assumptions, the deficit in 1992 wouldbe the same as in 1991--$298 billion, or about 5 percent of GNP. Theprojected baseline deficit drops to $128 billion in 1995 but turns upslightly in 1996, when $14 billion in spending reductions and taxincreases are scheduled to expire (see Summary Table 1).
SUMMARY TABLE 1. CBO DEFICIT PROJECTIONS(By fiscal year)
1990 1991 1992 1993 1994 1995 1996
Baseline Total Deficit
Assuming DiscretionarySpending Limits8
Total deficitDeficit excluding
deposit insuranceOn-budget deficitb
In Billions of Dollars
220 298 298 239
220
162277
298
194360
284
186354
215
167294
211
160
135258
128
57
103170
135
56
99185
Baseline Total Deficit
As a Percentage of GNP
4.1 5.3 5.0 3.7 3.1 1.8 1.8
Assuming DiscretionarySpending Limits8
Total deficitDeficit excluding
deposit insuranceOn-budget deficitb
4.1
3.05.1
5.3
3.56.4
4.7
3.15.9
3.4
2.64.6
2.4
2.03.8
0.8
1.42.3
0.7
1.32.4
SOURCE: Congressional Budget Office.
a. The discretionary spending limits apply only through 1995. The 1996 figures are extrapolations.
b. Social Security and the Postal Service are outside the budget.
SUMMARY
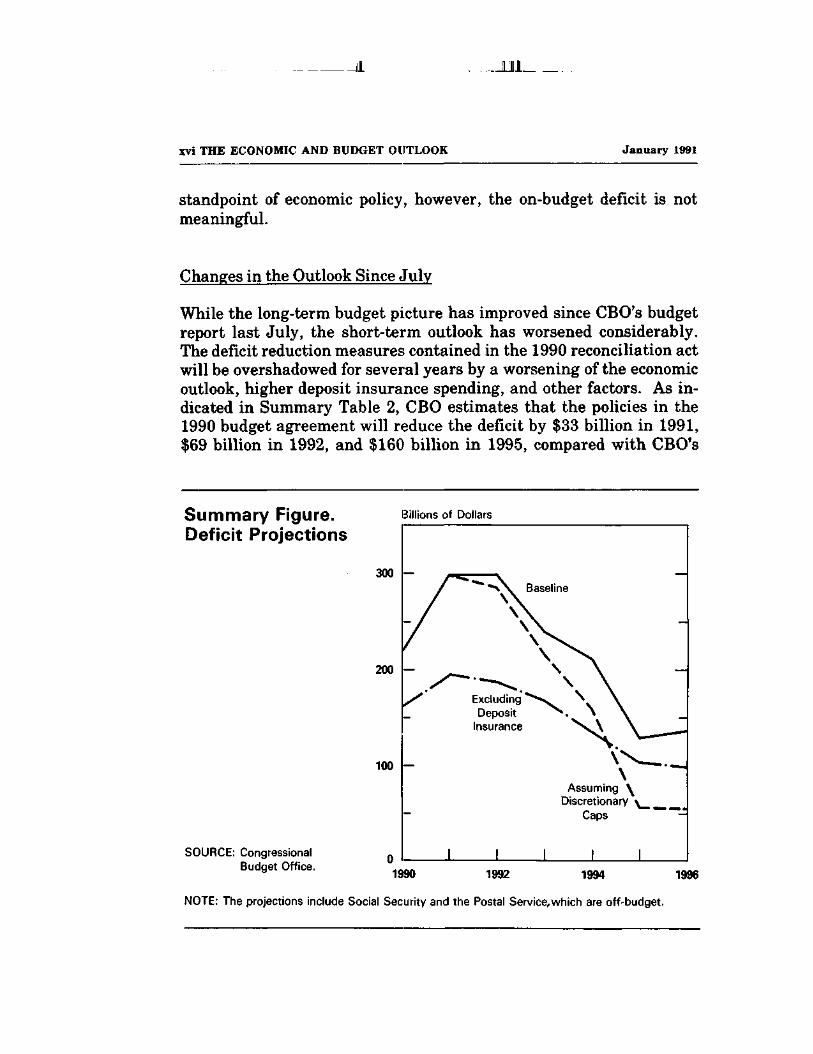
The baseline no longer represents current budgetary policy,however, because the dollar limits for discretionary appropriations arebelow the levels assumed in the baseline. Adhering to these limits willrequire holding discretionary outlays below baseline levels by anestimated $13 billion in 1992, $22 billion in 1993, $46 billion in 1994,and $62 billion in 1995. Although the statutory caps do not extend be-yond 1995, sticking to the caps through 1995 will also produce discre-tionary savings in 1996, as well as interest savings in all years. As-suming that discretionary spending is held to the caps, the deficitwould be $284 billion in 1992, $57 billion in 1995, and $56 billion in1996. By 1995, the deficit would fall to 1.8 percent of GNP in thebaseline and 0.8 percent of GNP if the discretionary spending caps areeffective.
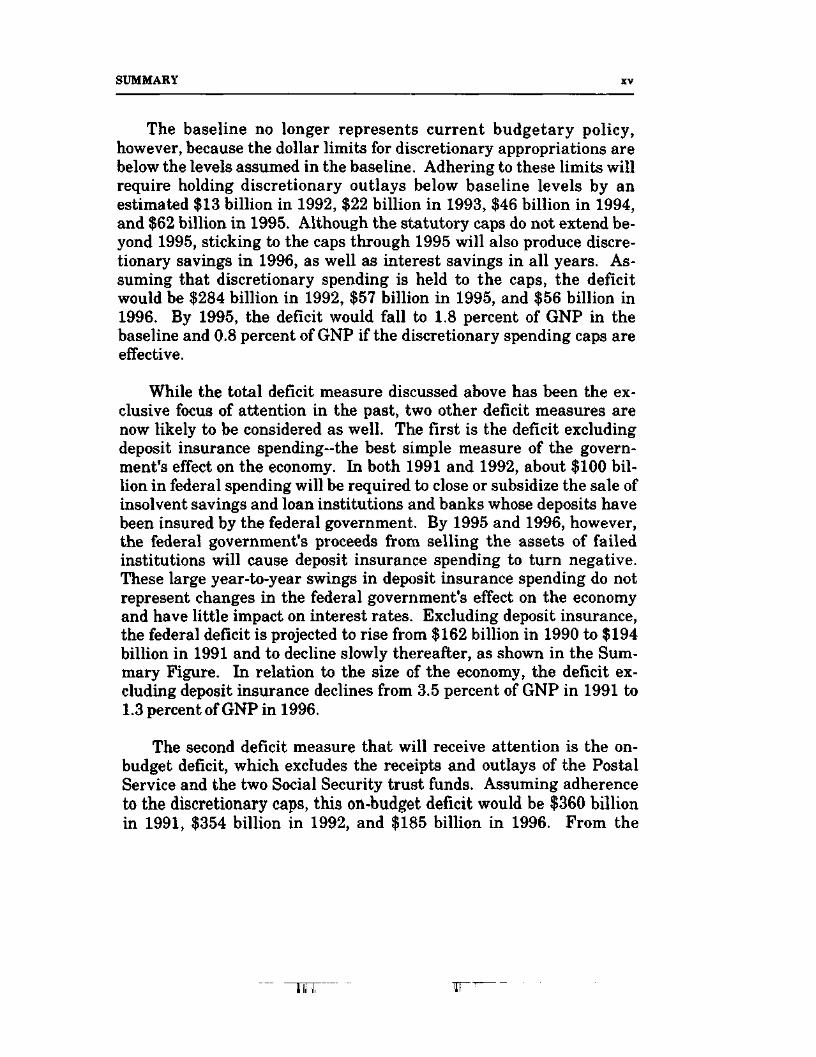
While the total deficit measure discussed above has been the ex-clusive focus of attention in the past, two other deficit measures arenow likely to be considered as well. The first is the deficit excludingdeposit insurance spending-the best simple measure of the govern-ment's effect on the economy. In both 1991 and 1992, about $100 bil-lion in federal spending will be required to close or subsidize the sale ofinsolvent savings and loan institutions and banks whose deposits havebeen insured by the federal government, By 1995 and 1996, however,the federal government's proceeds from selling the assets of failedinstitutions will cause deposit insurance spending to turn negative.These large year-to-year swings in deposit insurance spending do notrepresent changes in the federal government's effect on the economyand have little impact on interest rates. Excluding deposit insurance,the federal deficit is projected to rise from $162 billion in 1990 to $194billion in 1991 and to decline slowly thereafter, as shown in the Sum-mary Figure. In relation to the size of the economy, the deficit ex-cluding deposit insurance declines from 3.5 percent of GNP in 1991 to1.3 percent of GNP in 1996.
The second deficit measure that will receive attention is the on-budget deficit, which excludes the receipts and outlays of the PostalService and the two Social Security trust funds. Assuming adherenceto the discretionary caps, this on-budget deficit would be $360 billionin 1991, $354 billion in 1992, and $185 billion in 1996. From the
IT"-
_JJJ_
xvi THE ECONOMIC AND BUDGET OUTLOOK January 1991
standpoint of economic policy, however, the on-budget deficit is notmeaningful.
Changes in the Outlook Since July
While the long-term budget picture has improved since CBO's budgetreport last July, the short-term outlook has worsened considerably.The deficit reduction measures contained in the 1990 reconciliation actwill be overshadowed for several years by a worsening of the economicoutlook, higher deposit insurance spending, and other factors. As in-dicated in Summary Table 2, CBO estimates that the policies in the1990 budget agreement will reduce the deficit by $33 billion in 1991,$69 billion in 1992, and $160 billion in 1995, compared with CBO's
Summary Figure.Deficit Projections
Billions of Dollars
300
200
100
SOURCE: CongressionalBudget Office.
I
Baseline
ExcludingDeposit
Insurance
Assuming \Discretionary
Caps
I \
1990 1992 1994 19%
NOTE: The projections include Social Security and the Postal Service,which are off-budget.

SUMMARY
July baseline. Over the 1991-1995 period, the package saves an esti-mated $482 billion~$264 billion from spending cuts, $158 billion fromtax increases, and $59 billion in resulting savings on debt service.
For the next several years, however., changes in economic assump-tions and other factors overwhelm the policy changes. CBO's new eco-nomic assumptions have increased the projected deficit by $50 billionin 1991, $63 billion in 1992, and $79.billion in 1995. These figures re-flect both the current recession, which is temporary, and what appearsto be a reduction in the economy's potential rate of growth.
SUMMARY TABLE 2. CHANGES IN CBO DEFICIT PROJECTIONSSINCE JULY (By fiscal year, in billions of dollars)
July Baseline
1991
232
1992
238
1993
196
1994
145
1995
138
CumulativeFive- YearChanges
n.a.
ChangesPolicy changes
Revenues -18 -33 -32 -37 -39 -158Entitlements and other
mandatory spending -9 -12 -16 -19 -19 -75Enacted appropriations -6 -6 -9 -12 -13 -46Required reductions in
discretionary spending n.a. -13 -22 -46 -62 -144Debt service savings -1 -4 -10 -17 -27 -59
Subtotal -33 -69 -89 -131 -160 -482
Economic assumptions 50 63 63 70 79 n.a.
Technical reestimatesDeposit insurance 23 20 7 32 -44 n.a.Other 26 30 36 42 43 n.a.
Subtotal 49 50 43 74 -1 n.a.
Credit reform 0 2 3 2 a n.a.
Total Changes 66 46 19 15 -81 n.a.
Current Estimate AssumingDiscretionary Spending Limits 298 284 215 160 57 n.a.
SOURCE: Congressional Budget Office.
NOTES: The projections include Social Security and the Postal Service, which are off-budget.
n.a. = not applicable,
a. Less than $500 million.
F

xviii THE ECONOMIC AND BUDGET OUTLOOK January 1991
Changes in CBO's technical estimating assumptions have in-creased the projected deficits by an average of more than $50 billionper year in 1991 through 1994, but have reduced the deficit slightly in1995. This pattern mirrors the changes in deposit insurance estimates,which average $20 billion higher in 1991 through 1994, but are $44billion lower in 1995. In addition to upping the estimated short-runcosts of the thrift bailout, CBO has substantially increased estimatedspending in 1991 to deal with insolvent banks. CBO also projectsfaster growth in spending for Medicare and Medicaid. Other technicalreestimates affect a wide variety of revenue sources and spending pro-grams and add significantly to the costs of debt service.
THE ECONOMIC OUTLOOK
CBO believes that the U.S. economy has slipped into its ninth reces-sion of the postwar period. Although the economic outlook is extra-ordinarily uncertain, this recession will probably be milder than theaverage downturn and will end by midyear. Several factors contributeto the likelihood of a relatively short recession:
o Inventories are relatively low compared with sales, and re-ductions in orders are therefore less likely than in previousrecessions.
o Real exports are expected to remain strong as a result of thedollar's decline and a healthy growth in foreign demand.
o The war in the Persian Gulf is not likely to generate largedisruptions in oil supplies.
o Inflation is lower than at the onset of earlier recessions,thereby permitting a further easing of monetary policy.
Forecast for 1991 and 1992
CBO's economic forecast incorporates a decline in economic activity inthe fourth quarter of 1990 and the first quarter of 1991. Between the

SUMMARY xix
fourth quarters of 1990 and 1991, real GNP is projected to grow byabout H percent (see Summary Table 3). Because the recession willexpand the gap between actual production and the economy's capacity,
SUMMARY TABLE 3. COMPARISON OF CBO AND BLUE CHIPSHORT-RUN ECONOMIC FORECASTS
Estimated Forecast1990 1991 1992
Fourth Quarter to Fourth Quarter(Percentage change)
Real GNPCBO 0.2 1.3 3.4Blue Chip 0.2 0.9 2.8
Implicit GNP DeflatorCBO 4.4 4.1 3.6Blue Chip 4.5 4.0 3.6
Consumer Price Index (CPI-U)aCBO 6.1 4.0 3.5Blue Chip 6.2 4.1 4.0
Calendar-Year Averages(Percent)
Civilian Unemployment RateCBO 5.5 6.8 6.4Blue Chip 5.5 6.5 6.3
Three-Month Treasury Bill RateCBO 7.5 6.6 7.0Blue Chip 7.5 6.3 6.5
Ten- Year Treasury Note RateCBOBlue Chip
8.68.6
7.97.8
7.78.0
SOURCES: Congressional Budget Office; Eggert Economic Enterprises, Inc., Blue Chip EconomicIndicators (January 10, 1991); Department of Commerce, Bureau of Economic Analysis;Department of Labor, Bureau of Labor Statistics.
a. CPI-U is the consumer price index for all urban consumers.
b. Blue Chip does not project a 10-year note rate. The values shown here are based on the Blue Chipprojection of the Aaa bond rate, adjusted by CBO to reflect the estimated spread between Aaa bondsand 10-year Treasury notes.
"TTT

xx THE ECONOMIC AND BUDGET OUTLOOK January 1990
higher growth will mark the recovery, as the economy catches up to itspotential. For 1992, the growth rate is expected to rise to about 3£percent.
The pain of a recession, however, will produce the traditional bene-fits of reduced inflation and lower long-term interest rates. The in-flation rate is likely to remain between 3 percent and 4 percent on asustained basis—significantly lower than it was during most of the1980s. The interest rate on 10-year Treasury notes, which averaged8.6 percent in 1990, is expected to fall to 7.9 percent in 1991 and re-main low. Short-term interest rates should remain relatively low inthe near term as the Federal Reserve continues to relax monetary poli-cy, but will rebound as the economy recovers.
Projections for 1993-1996
CBO does not try to forecast short-term fluctuations in the economymore than two years into the future. Instead, for the 1993-1996 period,CBO makes projections based on trends in variables such as laborsupply, productivity, and saving rates. CBO projects that potentialGNP will grow on average by about 2-^ percent a year. This projection,which is slightly lower than CBO's estimates of last summer, reflectsthe July revisions to the national income accounts, which suggest thatproductivity has been growing more slowly in recent years than earlierreports had indicated. The projection of potential output also takesaccount of the expected slowing in the growth of the labor force, as wellas the increase in the capital stock that will stem from reductions inthe federal deficit. Real GNP is projected to grow at an average rate of2.8 percent over the 1993-1996 period to close the gap between actualand potential GNP opened up by the recession (see Summary Table 4).
CBO's long-run projections of interest rates are set by reference tothe historical pattern of interest rates and increases in nationalwealth. The reduction in the federal deficit will increase saving andcapital formation, but increased European capital demands will offsetthe resulting downward pressure on interest rates. As a result, CBOprojects real short-term interest rates in the mid-1990s of about 2percent, and real long-term rates about 1-̂ percentage points higher.

SUMMARY
SUMMARY TABLE 4. MEDIUM-TERM ECONOMIC PROJECTIONS FORCALENDAR YEARS 1993 THROUGH 1996
Estimated Forecast Projected1990 1991 1992 1993 1994 1995 1996
Nominal GNP(Billions of dollars) 5,467 5,700 6,107 6,505 6,919 7,358 7,824
Nominal GNP(Percentage change) 5.1 4.3 7.1 6.5 6.4 6.3 6.3
Real GNP(Percentage change) 0.9 0.0 3.3 2.9 2.8 2.7 2.7
Implicit GNP Deflator(Percentage change) 4.2 4.3 3.7 3.5 3.5 3.5 3.5
Fixed-Weighted GNP PriceIndex (Percentage change) 4.6 4.6 3.8 3.8 3.8 3.8 3.8
CPI-U (Percentage change) 5.4 4.9 3.5 3.6 3.6 3.6 3.6
Unemployment Rate(Percent) 5.5 6.8 6.4 6.2 6.0 5.8 5.6
Three-Month TreasuryBill Rate (Percent) 7.5 6.6 7.0 6.7 6.3 5.9 5.7
Ten-Year Treasury NoteRate (Percent) 8.6 7.9 7.7 7.6 7.4 7.3 7.2
SOURCE: Congressional Budget Office.
NOTE: CPI-U is the consumer price index for all urban consumers.
CONCLUSION
CBO's economic forecast is slightly more optimistic than the currentBlue Chip average, as Summary Table 3 shows. The 50 or so indi-vidual forecasts that make up the average, however, are more widelydispersed than normal, reflecting the unusual uncertainty prevailingtoday. Military and political analysts cannot foretell the course of thewar or the shape of the postwar Middle East. Similarly, economists arenotoriously poor at predicting the path of the economy near turning
"in TT-

xxii THE ECONOMIC AND BUDGET OUTLOOK January 1991
points in the business cycle. In addition, there is a good deal of un-certainty about whether banks and other financial institutions are in aposition to extend sufficient credit to the rest of the U.S. economy.
Fortunately, the Budget Enforcement Act has partly insulated thebudget process from these unpredictable factors. It adjusts the deficittargets for economic and technical changes and no longer promises tobalance the budget by a certain date. It exempts deposit insurancespending from the requirement that increases in mandatory spendingbe offset by other spending cuts or tax increases. And it exempts emer-gency spending~such as the cost of operations in the Persian Gulf—from the discretionary spending limits and pay-as-you-go require-ments. If fiscal policy is kept on its current course, the deficit shouldshrink significantly in a few years, even if it suffers further reverses inthe meantime.

CHAPTER I
THE ECONOMIC OUTLOOK
The U.S. economy has apparently fallen into its ninth recession of thepostwar era. Although the outlook is highly uncertain, the Congres-sional Budget Office (CBO) expects this recession to be one of the short-est in the postwar period, and anticipates a period of moderate expan-sion with significantly reduced inflation to begin before midyear.
Several factors are responsible for the slowdown of the U.S. econ-omy. Faced with the necessity of pursuing several critical goals at oncewhile beset with shifting statistics, oil shocks, and political develop-ments, the Federal Reserve held interest rates at relatively high levelsin 1989 and early 1990. Unavoidably, such high interest rates slowedeconomic growth and increased the risks that other developmentscould push the economy into recession. The crisis in the Persian Gulfwas a critical blow in knocking the economy over the edge, since it re-duced real incomes, raised interest rates, and weakened consumer con-fidence. Finally, the spreading problems in the financial sector mayhave helped cause the recession, since they have somewhat reduced theavailability of credit.
With the data regarding the onset of the recession still in prelimi-nary form, the current economic outlook is highly uncertain A moresevere recession could still occur, particularly if there is another ad-verse shock. As of mid-January, the Gulf crisis remains unresolved,and how pervasively credit is being tightened is not yet clear. Giventhis uncertainty, CBO has developed two alternative scenarios in addi-tion to its forecast. These alternatives, which embody different sets ofassumptions giving rise to higher and lower near-term growth, are in-tended to be illustrative, not exhaustive; they do not purport to en-compass the whole range of possible near-term conditions.
Til
1 j1... 11 -IL.
2 THE ECONOMIC AND BUDGET OUTLOOK January 1991
RECENT ECONOMIC DEVELOPMENTS
After nearly eight years of growth, the U.S. economy appears to haveslipped into recession in the second half of 1990. Some slowing wasforeseen at the start of 1990 as the Federal Reserve pressed on with itstight monetary policy into a fourth year. By midyear, however, theslowdown had clearly spread even beyond the sectors most sensitive tointerest rates. As concern about the economy grew, Iraq invadedKuwait and oil prices doubled. Now, in mid-January, uncertaintyabounds: the Gulf crisis remains unresolved, weaknesses are stillemerging in the banking sector, and the changes in Europe's economicstructure continue to unfold. Still, in the absence of another largeshock, the recession will probably not be severe.
Fiscal policy, including the recently enacted Omnibus BudgetReconciliation Act (also referred to here as the reconciliation act) andthe spending for military operations in the Gulf, will not be signifi-cantly stimulative over the near term. As a result, any efforts to mod-erate the severity of the recession will depend on monetary policy. TheFederal Reserve has so far responded to the slowdown in a controlledand gradual way. Financial markets clearly expect further easing inthe coming months, and the Federal Reserve, because of its conservative stance since 1987, is well-positioned to ease rates further. How-ever, if the incipient credit crunch becomes more widespread or ifevents in the Persian Gulf lead to highly adverse consequences, theFederal Reserve's strategy of measured response may prove to be insuf-ficient.
The Slowdown So Far
The U.S. economy slowed markedly in the second half of 1990. Eco-nomic performance in the first half of 1990 was much the same as ithad been in the latter half of 1989: very slow real growth coupled witha relatively stable underlying rate of inflation. Already evident bymidyear were signs that the slowing in economic activity would spreadbeyond the sectors that tight money most directly affected-housing,consumer durable goods, and construction of office buildings. But asthe Gulf crisis unfolded, the deterioration snowballed as consumer and

CHAPTER I THE ECONOMIC OUTLOOK 3
business confidence plunged in the wake of the Iraqi invasion. Never-theless, the current slowdown differs from previous postwar down-turns in several significant respects that, on balance, suggest that theslowdown is likely to be only a mild recession.
The Slow Second Half of 1990. The first unmistakable signs of theeconomic decline appeared in the employment data: total nonfarmpayroll employment declined in each of the last six months of 1990. ByDecember, the civilian unemployment rate had risen to 6.1 percent,well above the 5.3 percent level that, for the most part, had prevailedfrom mid-1989 through mid-1990.
What distinguished the decline in employment in the latter half of1990 was the weakness in service-sector employment. Employment inmanufacturing had already been declining for more than a year bymid-1990; by the year's end, these declines had quickened and spreadto most manufacturing industries. By late 1990, however, the weakdemand for labor in service-producing industries was also pervasive,though not as deep as in manufacturing. Employment in wholesaleand retail trade, as well as in finance and real estate services, waseither stagnant or declining over the second half of 1990.
Weakness in personal income and consumption reflected the de-clines in employment. Even though consumer confidence plummetedin August as a result of the Iraqi invasion, expenditures for real per-sonal consumption only began declining in October, when real dis-posable personal income fell sharply.
As for the near-term investment data, they are bleak. Housing andprivate nonresidential construction have been depressed for more thana year, and current low sales rates, high vacancy rates, and falling realestate prices imply that they will remain so for some time to come.Also weak in the last quarter of 1990 was growth in investment inproducers' durable equipment. Furthermore, the outlook for the nearterm remains dim. This weakness is reflected in a falling off in neworders for nondefense capital goods and the Commerce Department'sOctober-November survey of capital expenditure plans, which indi-cates that businesses are planning to expand real plant and equipmentinvestment by a meager 0.4 percent in 1991. However, even this esti-

4 THE ECONOMIC AND BUDGET OUTLOOK January 1991
mate may be optimistic because declines in planned capital expendi-tures reported to the survey tend to lag behind declines in overallactivity.
With government purchases of goods and services in the near termalready trimmed by budget cuts of previous years, the only major en-couraging sign in current demand appears in exports. Largely becauseof the weakness of the dollar since mid-1989, growth in real exports hasrecently accelerated. The recent high rate of growth in exports shouldcontinue well into 1991, as the effects of the dollar's recent declines arefelt more fully.
Perspectives on the Slowdown. Several characteristics of the currentstate of the U.S. economy augur that the current recession will be mildRelative to some previous cyclical downturns, the economy currentlyhas:
o Lower inventory stocks relative to sales;
o Higher growth in demand for exports;
o A larger service-producing sector relative to total demand;and
o Lower inflation rates than prevailed during the previousthree recessions.
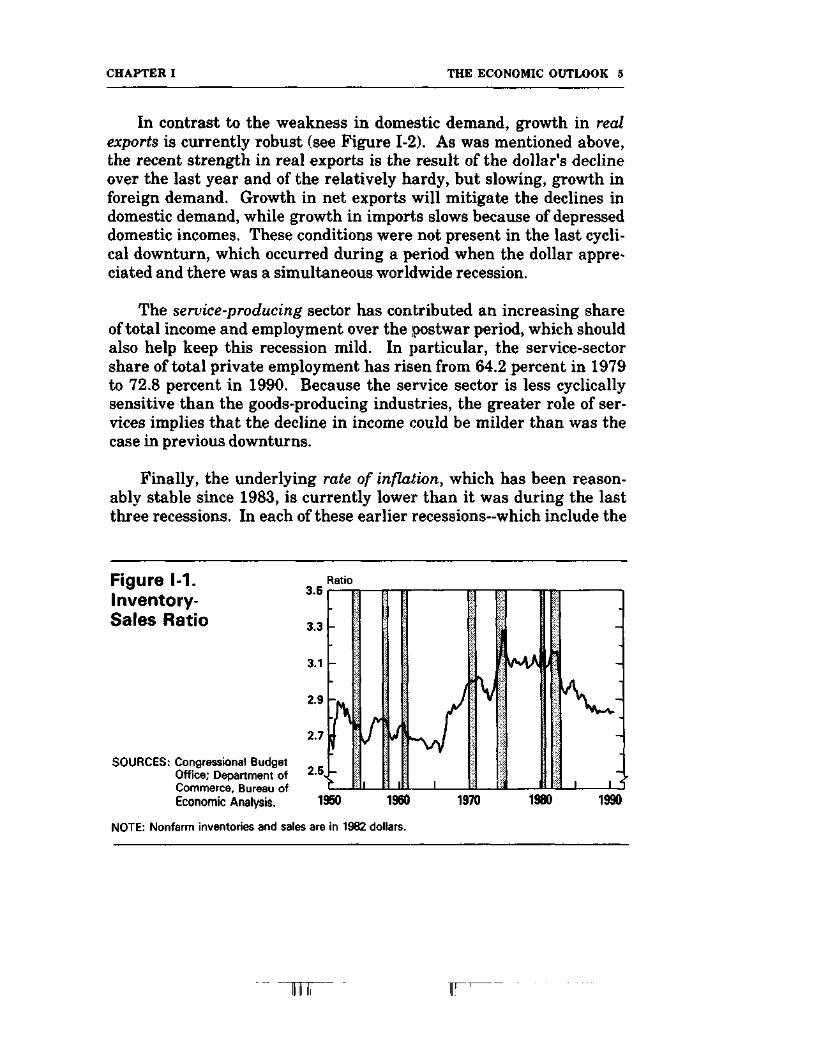
Inventory stocks did not rise at the beginning of the recession~agood sign of resilience (see Figure 1-1). In previous recessions, an earlyslowing of sales was matched by a sharp increase in inventories; theseinventories had to be worked off through lower production later. De-clines in inventory investment typically account for a substantial por-tion of the decline in gross national product (GNP) during recessions.The recent stability of the inventory-sales ratio, however, suggeststhat inventories are under control and that a large downward adjust-ment in inventories may not occur this time. Analysts attribute thelow current level of inventories to the Federal Reserve's long-standingpolicy of slowing economic growth, which put businesses on alert tokeep their inventories under control.
CHAPTER I THE ECONOMIC OUTLOOK 5
In contrast to the weakness in domestic demand, growth in realexports is currently robust (see Figure 1-2). As was mentioned above,the recent strength in real exports is the result of the dollar's declineover the last year and of the relatively hardy, but slowing, growth inforeign demand. Growth in net exports will mitigate the declines indomestic demand, while growth in imports slows because of depresseddomestic incomes. These conditions were not present in the last cycli-cal downturn, which occurred during a period when the dollar appre-ciated and there was a simultaneous worldwide recession.
The service-producing sector has contributed an increasing shareof total income and employment over the postwar period, which shouldalso help keep this recession mild. In particular, the service-sectorshare of total private employment has risen from 64.2 percent in 1979to 72.8 percent in 1990. Because the service sector is less cyclicallysensitive than the goods-producing industries, the greater role of ser-vices implies that the decline in income could be milder than was thecase in previous downturns.
Finally, the underlying rate of inflation, which has been reason-ably stable since 1983, is currently lower than it was during the lastthree recessions. In each of these earlier recessions—which include the
Figure 1-1.Inventory-Sales Ratio
SOURCES: Congressional BudgetOffice; Department ofCommerce, Bureau ofEconomic Analysis.
3.5Ratio
3.3 -
3.1
2.9
2.7
2.5
1950 1960
NOTE: Nonfarm inventories and sales are in 1982 dollars.
1970 1980 1990

II
6 THE ECONOMIC AND BUDGET OUTLOOK January 1991
two deepest downturns of the postwar period—the downturn was large-ly brought on by a rapid switch from an expansionary to a restrictivemonetary policy, a switch that was intended to reduce double-digitinflation rates. This degree of inflationary pressure is not present inthe current slowdown. Moreover, the stance of monetary policy is dif-ferent, having been restrictive from early 1987 to mid-1990. The Fed-eral Reserve has not been in the position of having to slow monetarygrowth rapidly—and exacerbate the economic slowdown~as it did inearlier downturns.
The Effects of the Gulf Crisis on the U.S. Economy
Iraq's invasion of Kuwait and the subsequent worldwide trade em-bargo with these two countries have markedly contributed to the eco-nomic slowdown. By raising oil prices sharply, the crisis has reduceddisposable incomes, increased inflation and interest rates, and de-pressed consumer confidence. Occurring at a time when concerns overan economic slowdown were already growing, soaring oil prices evokedunpleasant memories of the protracted economic stagnation thatfollowed the oil crises of 1973-1974 and 1979-1980. Although oil pricesdropped some of the way back to their pre-invasion levels in recent
Figure 1-2.Exports as a Shareof GNP
SOURCES: Congressional BudgetOffice; Department ofCommerce, Bureau ofEconomic Analysis.
18
14
10
Percent
1950 1960 1970 1980 1990
NOTE: Exports and GNP data are in 19S2 dollars.

CHAPTER I THE ECONOMIC OUTLOOK 7
months, and then to below these levels in. the first days of the conflict,anxiety still lingered. CBO's estimates suggest that the onset of theGulf crisis reduced real GNP, and increased inflation and interestrates significantly, helping to precipitate the current recession.
At the time of this writing, the Gulf crisis is not yet resolved andconsiderable uncertainty prevails. Still, the macroeconomic reper-cussions of the current crisis are not likely to be as severe as those ofthe earlier supply disruptions for two reasons: the price increase fromthe Iraq-Kuwait crisis is much smaller than the earlier oil priceshocks, and the United States and other oil-importing countries arebetter prepared today for disruptions in oil supplies than was trueearlier. Nonetheless, developments in the Gulf could affect the depthand duration of the U.S. economic slowdown for better or worse: aquick resolution of the Gulf crisis would allow oil prices to fall, but aprotracted war could cause prices to rise.
The Price Shock Is Relatively Small. For two reasons, the current Gulfcrisis has altered available world oil supplies to a far smaller extentthan did the two earlier crises: the primary loss in supply was smaller,and the price shock was quickly mitigated by expanded production anda drop in demand as a result of mild weather and the slowing economy.The worldwide boycott of Iraq-Kuwait oil reduced available worldcrude supplies by about 4.3 million barrels per day (mmbd), which isonly a small part of the world production of more than 60 mmbd. More-over, this shortfall hit at a time when producers with the Organizationof Petroleum Exporting Countries (OPEC) carried considerable excessproduction capacity and domestic crude stocks were relatively high.Soon after the crisis began, Saudi Arabia, Venezuela, and other oil-exporting nations stepped up petroleum production and more thanmade up for the original supply shortfall. Also, there was no specula-tive buildup in world stocks of crude petroleum, which were alreadyample in late July. This contrasts sharply with the behavior of inven-

8 THE ECONOMIC AND BUDGET OUTLOOK January 1991
Figure 1-3.Real Oil Prices
1990 Dollars per Barrel
SOURCES: Congressional BudgetOffice; Department ofCommerce, Bureau ofEconomic Analysis;Department of Ener-gy, Energy Informa-tion Administration.
. . 111. I.
1970 1975 1980 1985 1990
NOTE: Refiners' acquisition cost of crude oil deflated by fixed-weighted GNP price index reindexed to1990 = 1.0. Fourth-quarter 1990 value estimated by CBO.
tories during the earlier oil disruptions when, driven by speculativemotives, inventories increased sharply and helped keep prices uplonger. 1
As a result of the combination of all of these factors, oil pricesspiked, but the spike was small when compared with the two earliermajor oil crises, particularly for countries whose currencies have ap-preciated against the dollar (see Figure 1-3). Oil prices were $16 to $20per barrel before the invasion and rose as high as $38 per barrel twomonths into the crisis, declining to about $25 per barrel at the begin-ning of 1991. In real terms, the spike was much smaller than wasexperienced during either the 1973-1974 or the 1979-1980 crisis. Thecurrent increase in oil prices is only about half the size of the 1979-1980 increase, and less than two-thirds the size of the 1973-1974 in-crease. Moreover, each of the earlier price increases persisted for morethan a year.
See Richard Farmer, "Understanding the Volatility of Oil Prices During the Iraq-Kuwait Crisis,"CBO Staff Memorandum (January 1991).

CHAPTER I THE ECONOMIC OUTLOOK 9
The effects of the August price shock on overall inflation appear tobe over. The spike in oil prices produced a corresponding spike inconsumer prices: the consumer price index (CPI) rose sharply throughthe August-October period but was followed by smaller advances inNovember and December as the energy component of the price indexdeclined. Prices for alternative energy sources did not rise commen-surately with crude oil prices, and this has helped to temper the impacton consumer prices to date.
World Economies Are Generally Better Prepared. The current crisis isnot likely to cause long-term stagnation for another reason: the U.S.economy and the economies of other industrialized oil-importing coun-tries are more energy efficient and less dependent on oil today thanthey were earlier. The structural changes in the United States andother oil-importing countries that were inspired by the 1973-1974OPEC crisis and were reinforced by the 1979-1980 supply disruptionmake these nations less vulnerable to the longer-term consequences offurther shocks in oil prices.
Since the earlier crises, oil conservation has improved; industrieshave increased their ability to substitute other fuels for oil when neces-sary; strategic oil reserves exist; and oil price controls, which often dis-couraged production, have eroded. Since 1973, overall energy effi-ciency increased substantially worldwide: by about a third in theUnited States and Europe and by more than 40 percent in Japan.Moreover, the efficiency with which oil is used increased even more.These diminished vulnerabilities to oil price shocks largely result fromtechnological substitutions of less energy-intensive and oil-intensivemethods of production.2
In the United States, another structural factor has played a role inmitigating the impact of rising oil prices: the current reliance on mar-kets to allocate petroleum and petroleum products rather than thecomplex and distorting rationing and allocation rules that were used inthe past. Whereas the oil shocks of the 1970s produced long lines at
2. These technological changes also lowered potential output in the earlier crises. The macroeconomicimpacts of changes in oil prices are discussed in greater detail in Robert Dennis and MatthewSalomon, "Effects of the Recent Oil Price Rise on the Economy," CBO Staff Memorandum(September 1990).

10 THE ECONOMIC AND BUDGET OUTLOOK January 1991
gasoline stations and panic hoarding by consumers and producers ableto do so, the current oil shock has not led to any such behavior.
Near-Term Risks Remain. Although the economy is better prepared toabsorb oil price swings without the severe long-term consequences thatstemmed from the earlier crises, the economy is not immune to thenear-term costs of a further disruption of supplies in the Gulf.
As of this writing, oil prices are about $20 per barrel, considerablylower than the post-invasion peaks and roughly similar to what priceswere before Iraq invaded Kuwait. While oil prices have fluctuated inresponse to alternating waves of optimism and pessimism about devel-opments in the Gulf crisis, prices for future petroleum deliveries haveremained consistently below those for immediate delivery. For themost part, these lower future prices reflect expectations of favorable oilmarket fundamentals in the longer run. But because oil-exportingnations used their excess capacity, less oil is available to buffer furtherdisruptions over the very near term.
OPEC is currently working to rebuild surplus capacity, and fallingdemand has helped the inventory situation. But a large supply dis-ruption in the near future would have to be made up by further low-ering demand, reducing inventories (possibly including releases ofstrategic reserves), and increasing the output of higher-cost producers.
Foreign Economic Developments
The expansion of world trade and the integration of world capital mar-kets have made the U.S. economy increasingly sensitive to economicand policy developments in foreign countries. In 1990, the economiceffects of developments abroad were mixed: some factors helped slowthe U.S. economy, such as the rises in interest rates caused by the uni-fication of Germany and developments in Japan, and the torpid growthin Canada and the United Kingdom. These slowing effects were par-tially offset, however, by strong economic growth in western Germanyand the appreciation of the Deutsche Mark, both of which have helpedstrengthen U.S. exports.

CHAPTER I THE ECONOMIC OUTLOOK 11
Some weakening in world economies is expected for 1991. TheUnited Kingdom, Canada, and Australia now appear to be in recession,and the economies of several other European countries have sloweddown. But the strong demands generated by German unification and aresilient Japanese economy should produce a respectable world growthrate in 1991. Other major U.S. trading partners that should growrapidly in 1991 include Mexico, where real growth is speeding up inresponse to economic reforms, and the newly industrializing countriesof Asia, where, on average, real growth should be even stronger than itis in Japan. These sources of foreign economic growth, combined withthe exchange rate effects of tight monetary policies in both Germanyand Japan, bode well for U.S. exports.
Developments in Europe. Europe's economic structure is undergoing arevolution, provoked by the changing economic system in EasternEurope, the unification of Germany, and by the move toward a singlemarket in Western Europe. All of these developments have increasedgrowth and capital demands in Europe, arid help to increase the levelof world interest rates.
While the economic collapse of most of the Eastern European coun-tries limits their potential impact on world markets, German unifi-cation has been and promises to be a major factor. Unification hasproven immediately beneficial to the western part of Germany: west-ern Germany posted a striking 6.8 percent annual rate of real growthin the third quarter of 1990, as a result of sharply increased sales ofconsumer and investment goods to the eastern part of the country.(German statistics do not yet include eastern Germany, but productionthere has certainly fallen sharply.) At the same time, the estimatedbudgetary costs of unification have grown as the extent of economicdeterioration in eastern Germany has turned out to be much greaterthan anticipated. Together with the demands for funds to modernizeindustry in eastern Germany, these developments add up to anexpectation of enormous capital demands that should increase worldinterest rates and further strengthen the Deutsche Mark.
CBO has estimated that the capital demands of German unifi-cation could push up world interest rates by between 0.2 and 1.0percentage points, with the larger impact occurring if the German gov-
38-033 0 - 91 — 2 : QL 3
' ~ W" " F"
12 THE ECONOMIC AND BUDGET OUTLOOK January 1991
ernment does not find a politically acceptable way to increase taxesand therefore has to continue to rely on issuing debt to finance capitaldemands.3 Most likely, a significant part of this upward pressure oninterest rates has already been felt.
The move toward a common market in Europe also makes Europemore attractive for investment, and thus could put additional pressureon world capital markets and long-term interest rates. If the increasedtax revenues from higher European growth (the fiscal dividend) fi-nance either tax cuts or higher spending, CBO estimates that worldlong-term rates could rise by more than 0.5 percentage points.4 Butanother outcome is possible: if European governments instead use thefiscal dividend to reduce their borrowing, world interest rates mightnot rise and could even fall.
Led by the Bundesbank of Germany, European central banks haveresponded to these developments by maintaining their fight againstinflationary pressures, rather than accommodating the increased capi-tal demands. As a result, Europe now finds itself in a position similarto that of the United States in the early 1980s, with strong credit de-mands confronting a relatively tight monetary policy. Just as thissituation in the United States drove up the dollar in the early 1980s,this same combination of strong credit demands and tight money inEurope has led to strong European currencies. As a result, the dollarhas dropped 9.2 percent against the Deutsche Mark since mid-1990.
Developments in Japan. Japanese interest rates climbed and the yenappreciated sharply against the dollar in 1990, a chaotic year forJapan's financial markets. Ely year's end, the Bank of Japan had com-pleted its second year of fighting wage and price inflation and pre-cariously high land values with a policy of monetary restraint. Equityprices had plunged more than 40 percent from their levels of December1989. Japanese banks, which hold a substantial portion of assets inlarge, land-backed loans, cut lending sharply and sold dollar-denomi-nated securities. In spite of these convulsions in Japan's financial mar-
3. Congressional Budget Office, How the Economic Transformations in Europe Will Affect the UnitedStates (December 1990), Chapter IV.
4. Ibid., Chapter H.

CHAPTER I THE ECONOMIC OUTLOOK 13
kets, the Japanese economy is estimated to have grown more than 5-̂percent in 1990—the largest advance among the industrialized nations.
Most analysts expect that tight money and credit conditions willpersist and that Japanese economic growth will slow. Nevertheless,Japanese growth should remain higher than most other nationalgrowth rates.
Developments in Canada and the United Kingdom. Unlike conti-nental Europe and Japan, the major English-speaking economies arealready in or are entering recession. Canada's downturn began in thesecond quarter of 1990, while that in the United Kingdom apparentlystarted in the third quarter. According to many analysts, neither econ-omy is likely to begin a sustained recovery before mid-1991.
In both Canada and the United Kingdom, monetary policies aretight in order to maintain currency values and limit inflation. More-over, in both economies this monetary tightness played a major role inbringing on recession, though other factors also played a role. TheUnited Kingdom is anxious to maintain currency values so as to sup-port sterling's position in the European Monetary System, a policy thatis regarded as the keystone of the government's anti-inflation policy.Despite this policy, inflation remains high, even after allowing for thetemporary effects of the spike in oil prices.
In Canada, monetary authorities have kept interest rates high soas to support the value of the Canadian dollar against the U.S. dollar.Canada's large budget deficit and political uncertainty surroundingthe future of the confederation have also helped to raise interest rates.Although both the United Kingdom and Canada are oil exporters andthus were less severely affected by the Gulf crisis than oil-consumingcountries, the spike in oil prices may have further weakened theireconomies by reducing disposable consumer incomes.
Economic Effects of the Omnibus Budget Reconciliation Act of 1990
With the passage of the Omnibus Budget Reconciliation Act of 1990,the federal government has embarked on a new course of long-term

._! UL
14 THE ECONOMIC AND BUDGET OUTLOOK January 1991
BOX 1-1The Recession Provisions of the Balanced Budget Act
The Balanced Budget and Emergency Deficit Control Act of1985, as amended by last fall's Omnibus Budget Reconciliation Act,contains special provisions that allow important parts of the act'sdeficit reduction requirements to be suspended in the event of arecession or extraordinarity slow economic growth. However, theseprovisions are not automatic. They require explicit action by theCongress and approval by the President.
The slow-growth provisions are triggered when either the Con-gressional Budget Office (CBO) or the Office of Management andBudget (OMB) projects real economic growth to be less than zero, orwhen the Commerce Department reports an actual growth rate of lessthan 1 percent, for two consecutive quarters. If any of these trigger-ing events occurs, CBO must notify the Congress. Both CBO andOMB now project at least two quarters of negative growth, and CBOsent the obligatory letter to the Congress on January 23. As a resultof this notification, the Senate was required to consider promptly aresolution suspending certain requirements of the Balanced BudgetAct and other laws. In the House, however, the Majority Leader wasfree to choose whether or not to introduce a similar resolution. In anycase, the Congress and the Administration will almost certainly haveto revisit this issue in April, when, for the first time, the CommerceDepartment will report on actual economic growth for both the fourthquarter of 1990 and the first quarter of 1991.
The main effect of the passage of such a resolution and its ap-proval by the President would be to rule out any automatic cuts inspending as a means of enforcing the reconciliation act's current ceil-ings on different categories of appropriated spending, on mandatoryspending, and on overall deficits (see Chapter II for a detailed descrip-tion of these ceilings). A resolution would also end the right to blockconsideration of any bill that would violate the ceilings in an adoptedbudget resolution or the committee allocations flowing from that reso-lution. The suspension period would last until the first fiscal yearbeginning at least 12 months after the resolution is enacted. Thus, a

CHAPTER I THE ECONOMIC OUTLOOK 15
suspension resolution adopted this winter or spring would stay ineffect until October 1992 (the start of fiscal year 1993). Practicallyspeaking, this would obviate the ceilings on spending and deficitsthat the reconciliation act imposes for fiscal years 1991 and 1992,unless subsequent legislation were to supersede the resolution.
The slow-growth provisions are intended to keep budgetary poli-cy from accentuating an economic downturn. Reducing the under-lying or "structural" budget deficit, as the Balanced Budget Act isintended to do, risks making economic activity weaker than it wouldhave been in the short term by raising taxes and reducing federaldemands for goods and services. Having some provision for avoidingthis effect can be particularly important if the recession seems likelyto be severe. Since the depth of a recession is extremely hard to fore-cast, some analysts would argue that an early cancellation of ill-timed contractionary fiscal policies is appropriate.
Not all analysts, however, believe that suspending the reconcili-ation act's targets is advisable. They argue that the expenses of mili-tary operations in the Gulf, which are already outside the discipline ofthe act, may mean that the federal budget will exert little if any con-tractionary impact on the economy this year, notwithstanding theact's targets. Moreover, these analysts argue that suspending thetargets for two full fiscal years would leave little of the longer-termdeficit-reducing effect of recent legislation intact. The nation wouldprobably have to begin again the painful process of negotiation andconsensus-building that preceded passage of the recent amendmentsto the act in order to accomplish the long-term reductions in the defi-cit that most policymakers consider to be necessary.
In the meantime, interest rates could rise if financial markets de-veloped renewed doubts about the likelihood that deficits will ulti-mately be reduced. Moreover, some analysts argue that budgetarypolicy measures to bring about a recovery from the recession wouldprobably come too late and do little good. The economic effects of anysuch measures might be felt during a period when the recovery is al-ready well under way.

16 THE ECONOMIC AND BUDGET OUTLOOK January 1991
fiscal restraint. If the act's targets are met, it will reduce the deficit bynearly $500 billion over the 1991-1995 period and (excluding spendingfor deposit insurance) to 1.3 percent of GNP by 1996, the smallest per-centage in 20 years. Over the next several years and beyond, thisreduction in the federal government's use of scarce national saving willtend to improve GNP's potential rate of growth, the trade deficit, andreal long-term interest rates. Smaller federal deficits should ulti-mately help improve living standards, the nation's competitiveness,and its ability to withstand the problems that could be brought aboutby the retirement of the baby-boom generation. The remaining chap-ters of this report discuss the reconciliation act in more detail.
Short-Term Impacts of the Budget on Aggregate Demand. What willbe the effect of the reconciliation act on the economy? Although ad-herence to the terms of the act will help the economy in the mediumterm, the cuts in spending and the increases in taxes that it involvescould temporarily weaken the economy in 1991. (For this reason, theBalanced Budget Act gives the Congress and the Administration thepower to suspend the act's deficit reduction targets in the event of a re-cession—see Box 1-1 on page 1.4.) But other budget developments, dis-cussed below, imply that, overall, little significant restrictive effectfrom the budget is likely.
In order to judge the contribution of the federal budget to short-term changes in GNP, economists conventionally look to specializedanalytic measures of the stance of fiscal policy such as those shown inTable 1-1. (Note that these measures exclude the effects of deposit in-surance.) One such measure is the change in the standardized-employment deficit, a measure that strips the deficit of changes result-ing from economic fluctuations in order to isolate the effects of discre-tionary policy actions.
As Table 1-1 shows, the standardized-employment deficit falls by$22 billion between fiscal years 1990 and 1991. This fall largely re-flects the $33 billion by which the reconciliation act is estimated toreduce the budget deficit in 1991 from the level it would otherwisehave reached. Another measure of discretionary fiscal policy, thestandardized-employment deficit excluding interest payments, falls by$37 billion, also reflecting the fiscal restraint of the reconciliation act.

CHAPTER I THE ECONOMIC OUTLOOK 17
TABLE 1-1. THE FISCAL POLICY OUTLOOK (By fiscal year,on a budget basis, excluding deposit insurance)
1989 1990 1991 1992 1993 1994 1995 1996
Measures of Discretionary Fiscal Policy and MeasuresRelevant to Short-Run Effects on Aggregate Demand
(Billions of dollars)
Total Budget Deficit 131 162 194 186 167 135 103 99Standardized-employment
deficit 140 149 127 122 116 94 73 81Cyclical deficit -8 13 67 64 51 41 30 18
Total Inflation-AdjustedBudget Deficit** 51 69 98 94 74 33 0 -10
Budgetary Impact ofOmnibus Reconciliation Act n.a. n.a. -33 -69 -89 -131 -160 n.a.
Standardized-Employment DeficitExcluding Interest Payments -29 -34 -71 -85 -103 -133 -157 -152
Measures Relevant to Effects on Long-Run Economic Growth(Percentage of GNP)
Total Budget Deficit 2.6 3.0 3.5 3.1 2.6 2.0 1.4 1.3
Publicly Held Federal Debtb 42.2 43.1 44.6 44.6 44.5 43.9 42.8 41.5
Memoranda:(Billions of dollars)Deposit Insurance 22 58 103 98 48 25 -47 -42
Potential Nominal GNP 5,108 5,457 5,826 6,178 6,544 6,926 7,329 7,755
SOURCE: Congressional Budget Office.
NOTES: All measures of fiscal policy reflect the spending caps in the Omnibus Budget Reconciliation Actof 1990, but exclude outlays for deposit insurance. The 1991 deficit numbers include $7.5 billionin outlays for the Persian Gulf deployment, which is exactly offset by $7.5 billion incontributions from U.S. allies.
n.a. = not applicable.
a. Total budget deficit excluding effect of inflation in reducing real value of publicly held federal debt.
b. Excludes federal debt incurred for payments of deposit insurance.
TT-
18 THE ECONOMIC AND BUDGET OUTLOOK January 1991
Several factors, however, at least partially offset the fiscal re-straint shown in the table. The first factor is the extra spending formilitary operations in the Gulf, which is not fully reflected in Table 1-1.As Chapter IV points out, considerable uncertainty surrounds theseincremental costs. Still, these expenditures seem likely to exceed the$7.5 billion that are included in CBO's baseline budget estimates.Recent estimates suggest that the incremental costs in fiscal year 1991of the deployment offerees to the Gulf region and their engagement inhostilities could exceed, possibly by a good deal, $17 billion.5 Involve-ment after the hostilities have ceased could push up the costs.
Not all of the costs will result in spending in 1991. But a substan-tial share of the spending that does occur could stimulate the U.S.economy, since it is likely to be spent on goods and services produced inthe United States. Moreover, to the extent that payments from foreigngovernments match these expenditures, the fiscal stimulus would belarger, even though such payments would reduce the budget deficit.This increased fiscal stimulus takes place because government spend-ing that is not matched by increased taxes or borrowing stimulates theprivate economy more than spending that is so matched.6
A second factor—the effect of the reconciliation act on expecta-tions-somewhat offsets the economic effects of the fiscal restraint inthe act. The act is a landmark, multiyear measure that should work toreduce interest and exchange rates by holding out the realistic pros-pect of significantly lower federal credit demands over at least the nextseveral years. To the extent that the act succeeds in convincing partic-ipants in financial markets that federal credit demands will fall, itshould lead to declines in interest and exchange rates. These declinesin turn can stimulate investment, exports, and other types of spendingthat are sensitive to these rates. Resulting increases in private-sectorspending will help offset the fiscal restraint that might otherwiseemanate from the act. Participants in financial markets will no doubtrequire more time to judge the full effectiveness of the act in reducing
5. Congressional Budget Office, "Costs of Operation Desert Shield," CBO Staff Memorandum (Janu-ary 1991).
6. At present, expenditures for military Derations in the Gulf do not affect CBO's baseline estimatesof the deficit or the measures shown in Table 1-1 because assumed payments from foreigngovernments exactly match the assumed $7.5 billion in incremental outlays.

CHAPTER I THE ECONOMIC OUTLOOK 19
federal borrowing. (Chapter II summarizes the act's provisions toenforce its limits on spending and deficits.)
A final factor that helps cushion the contractionary effects of thereconciliation act is the action of the "cyclical" deficit--the amount bywhich the deficit is increased because GNP falls below its potential.Cyclical increases in the deficit, such as those shown in Table 1-1, comeabout as a result of economic weakening because taxable incomes falland transfer payments such as unemployment insurance increase.These cyclical responses, which are often called automatic stabilizers,ensure that disposable consumer income falls less than it would haveotherwise. Consequently, these automatic stabilizers cushion the eco-nomic decline.
Cyclical increases account for the rise in the overall budget deficit(excluding payments for deposit insurance), from $162 billion in 1990to $194 billion in 1991. These cyclical increases also explain theslightly smaller rise from $69 billion to $98 billion in another analyticmeasure shown in Table 1-1: the total deficit adjusted for inflation.This measure excludes from the deficit the amount by which inflationhas reduced the real value of the outstanding federal debt in a givenyear. Some economists favor this measure of the overall short-termeconomic impact of the deficit, since the impact of inflation in reducingthe real value of the debt detracts from the wealth of holders of federalbonds and offsets some of the stimulative impact that an increase inthe federal deficit might otherwise exert.
Outlays for deposit insurance are excluded from the fiscal mea-sures in Table 1-1 because they do not have significant direct economiceffects. These outlays do not increase the wealth or incomes of thosewho receive them, as do most other federal outlays. Instead, theyliquidate a federal obligation that already existed—the federal liabilityto guarantee the deposits of insolvent institutions. Most analystsagree that the economic effects of federal obligations for deposit insur-ance occur primarily at earlier stages, such as when the financial insti-tution's losses first occur, creating the insurance losses now beingrecognized.
T

J UL
20 THE ECONOMIC AND BUDGET OUTLOOK January 1991
Moreover, federal borrowing to finance outlays for deposit insur-ance does not have significant direct effects on credit markets. Theseoutlays are quite likely to give rise to new lending that offsets theabsorption of credit that initially comes about because of the added fed-eral borrowing. Outlays for deposit insurance are paid to individualsand institutions that are apt to reinvest them in financial markets,returning these funds to the pool available to private-sector borrowers.
Medium-Term Economic Implications of the Reconciliation Act. Be-yond the next couple of years, the reconciliation act brightens pros-pects for economic growth. As Table 1-1 shows, CBO projects that thefederal deficit (excluding deposit insurance) will fall sharply in rela-tion to GNP, assuming that the provisions of the reconciliation act aremet. This reduction in the federal government's use of the saving con-tributed by other parts of the economy helps account for a significantincrease in CBO's projection of the rate of net national saving, as thediscussion later in this chapter shows. Other indicators of longer-termeffects of the federal budget also show improvement. The ratio of thepublicly held federal debt to GNP (excluding the debt incurred for de-posit insurance payments) falls from 44.6 percent in 1991 to 41.5 per-cent in 1996. This fall suggests that there will be more room in non-federal holdings of wealth for more productive assets, such as invest-ments in business capital.
Monetary Policy, Inflation, the Dollar, and Financial Market Risks
Monetary policy slowed economic growth in 1990, but the policy cannotbe judged from a short-term perspective alone. The primary goal of themonetary policy of 1990 was to promote noninflationary growth in thelong run. The Federal Reserve, especially through the first half of theyear, continued to stress the goal of lowering inflation, and therefore itcontinued the relatively tight monetary actions that have prevailedsince 1987. But the Federal Reserve faced an extraordinary number ofcomplications in managing monetary policy in 1990.
Several complications were the result of developments outside theUnited States. The sharp increase in oil prices that stemmed fromIraq's invasion of Kuwait set off an increase in inflation, complicating

CHAPTER I THE ECONOMIC OUTLOOK 21
the central bank's job in controlling inflation. In addition, rising inter-est rates abroad pressured the Federal Reserve to keep U.S. rates highor risk seeing inflows of funds from abroad contract sharply. Such acontraction could have severely disrupted the domestic economy, andcould have caused the dollar to fall more sharply than it did.
Still another complication that beset the Federal Reserve duringthe summer and fall was the need to coordinate its policy with progressin the protracted negotiations between the Administration and theCongress over measures to reduce the budget deficit. One of the chiefobjectives of the negotiations was to facilitate lower interest rates, inpart by satisfying the Federal Reserve that the federal deficit wouldfinally decline after staying at high levels for years. The negotiationstook longer than expected, and at times their ultimate success was indoubt. In this climate of uncertainty, the Federal Reserve's reluctanceto reduce interest rates significantly was understandable.
Policies that promote the goal of noninflationary growth in thelong run increase the risk of recession in the short run. In the first halfof 1990, the perceived recessionary risk of these policies seemed rela-tively low—the underlying economic growth rate for recent quartershad been reported to be a relatively healthy 2.5 percent. Betweenearly July and the end of the year, however, a number of events raisedthe risk of recession sharply. In late July, the Commerce Departmentreleased revised estimates of real growth for 1989 and early 1990 thatwere much lower; these lower growth rates implied that the economywould be less resilient to any negative short-run shocks than was pre-viously thought.
The Federal Reserve responded to the initial signs of economicslowing by easing its tight monetary policy in mid-1990. Five easingactions by the central bank in the second half of the year-includingchanges in reserve requirements and the discount rate—brought thefederal funds rate more than a full percentage point below its late-Junelevel by mid-January (see Figure 1-4). Financial markets apparentlyexpect more easing in coming months, and, as the economy weakens,the Federal Reserve is likely to ease further.

: _A I1L
22 THE ECONOMIC AND BUDGET OUTLOOK January 1991
Because it has maintained a tight monetary policy over a longperiod, the Federal Reserve is not under pressure to rapidly restrictmoney growth at the first sign of stronger growth. Instead, the FederalReserve is in a favorable position to offset the severity of the currentrecession with gradual and controlled easing without abandoning itsanti-inflationary stance. Inflationary pressures should diminish asoverall growth declines and as the dollar remains low.
However, the weak banking sector presents a major risk for mone-tary policy in the current recession. A further deterioration in creditconditions is possible if real estate prices continue to fall: banks whoseloan portfolios are sensitive to weakness in real estate markets woulddeteriorate further, restrict credit, and, ultimately, may even fail.Such developments would undermine the Federal Reserve's strategy ofmaintaining its anti-inflationary stance by only gradual easing inter-est rates through the recession.
Recent Inflation. Most of the recent volatility in consumer prices wasrelated to energy and has already started to dissipate (see Figure 1-5).There is little evidence that the underlying rate of inflation willremain above the 4 percent to 5 percent range that has persisted since
Figure 1-4.Federal Funds Rate
SOURCES: Congressional BudgetOffice; Federal ReserveBoard.
Percent
8 -
4.I I I I
1980 1982 1984 1986 1988 1990
NOTE: CBO estimates the January 1991 value of the federal funds rate to be 6.75 percent.

CHAPTER I THE ECONOMIC OUTLOOK 23
1983. The rapid increase in the underlying rate of consumer priceinflation in early 1990 stemmed largely from an inexplicable advancein the homeowners' cost component of the consumer price index, but ithas since receded. Unless new inflationary shocks hit, the rising un-employment rate and declining factory operating rates should keepprices soft.
While recent increases in federal excise taxes should raise pricesin the first months of 1991, the increase in the rate of inflation willprobably be small and temporary. In addition, prices are expected torise temporarily in early 1991 as a result of the adverse effects of therecent freeze on California's citrus crop.
The Dollar. The exchange value of the dollar dropped sharply in 1990because world interest rates rose as U.S. interest rates fell (see Figure1-6). Apart from the fluctuations resulting from fears of war, the dollarhas stabilized recently. Tight monetary policies in Japan and Ger-many, as well as the capital demands generated by European devel-opments, should hold foreign interest rates sufficiently above those inthe United States to keep the dollar from strengthening over the fore-cast horizon.
Figure 1-5.Recent Inflation
Percentage Change from Year Ago
6 -
SOURCES: Congressional BudgetOffice; Department ofLabor, Bureau of LaborStatistics.
"*•*• ,' Overall Rate
1983 1985 1987 1989 1991
a. Consumer price index for all urban consumers (CPI-U) less food, energy, and used cars.
b. CPI-U.
F

i J
24 THE ECONOMIC AND BUDGET OUTLOOK January 1991
Financial Market Risks. A number of financial factors have causedeconomists concern that the current moderate decline could evolve intoa severe recession. The factors at issue are the high levels of indebted-ness of both corporations and households, and the fragile state of de-pository institutions.
High corporate debt levels should probably not be a major source ofconcern, though the debt ratios of nonfinancial corporations have in-creased sharply in recent years. Three measures of the debt position ofbusiness-the ratios of debt to GNP, debt to assets, and interest pay-ments to cash flow-were all high in the 1980s relative to the average ofthe postwar years. Whether the levels of these ratios indicate that theeconomy is in a more fragile state is uncertain, however. The ratioshave generally trended upward over the years, and a clear relationshipdoes not appear to exist between these ratios and the rate of businessfailures or the severity of downturns. Some firms are certainly in aweakened state because of the accumulation of debt in the 1980s—the
Figure 1-6.The Exchange Rateand the Interest-RateDifferential
10Percentage Points Index 1973 = 100
SOURCES: Congressional BudgetOffice; Federal ReserveBoard; InternationalMonetary Fund.
-5
Real Exchange Rate(Right Scale)
Real Interest-Rate Differential(Left Scale)
i i i I i i i i I i t i
150
100
50
1975 1980 1985 1990
NOTES: The real exchange rate is the level of U.S. consumer prices relative to consumer prices in 10industrialized countries, weighted by trade shares and adjusted by dollar exchange ratesagainst the currencies of those countries. Its movements are dominated by movements inexchange rates. An increase in the real exchange rate corresponds to dollar appreciation.
The real interest-rate differential is the difference between U.S. real long-term interest ratesand an average of foreign real long-term rates weighted by gross domestic product. Realinterest rates are nominal long-term rates less expected inflation, estimated by a centeredtwo-year moving average of actual and forecast inflation rates.

CHAPTER I THE ECONOMIC OUTLOOK 25
retailing industry has been particularly hard hit-but the debt status ofnonfinancial businesses in general does not appear likely to turn amild recession into a severe downturn.
High household debt levels, on the other hand, may pose a largerrisk. Household debt has been rising relative to income for manyyears. Until recently, the growth of household debt was more thanmatched by the growth of household assets, largely in real estate: thisleft aggregate household wealth strong despite high debt levels. Al-though some households were restraining their consumption becauseof high debt loads, others felt wealthy because of the increase in theirassets and they maintained or increased their consumption. More re-cently, however, the weakness of real estate prices in many parts of thecountry has undermined household wealth. Because this real estateweakness is an unusual development, it may lead to a more rapid de-cline in consumption in this recession than has happened in the past.
The troubled state of depository institutions could worsen the cur-rent recession. The capital position of both banks and thrift institu-tions has deteriorated in recent years, as loans soured and the value ofcollateral fell. Hence, these institutions entered the recession in aweakened state. As they seek to build their capital bases, in part be-cause of increased capitalization requirements and regulatory pres-sure, these institutions may be particularly careful in extending loans,and therefore could cause credit to be strained more severely than CBOcurrently envisions. An institutional shift in willingness to expandloan portfolios may blunt the Federal Reserve's efforts to temper thiscredit restraint by encouraging lower interest rates.
The data available to date do not clearly settle the question ofwhether current credit market restraint is unusually severe for aneconomy in recession, but anecdotal evidence of tightened credit iswidespread. Many sectors of the economy that are usually affected bya tightening of credit-housing and consumer durable goods, for exam-ple-slumped during 1990, and the problems of financial institutionspossibly aggravated these declines.
One could, however, also attribute the weakness in these sectors toother factors that are not directly related to financial considerations.

26 THE ECONOMIC AND BUDGET OUTLOOK January 1991
Examples are overbuilding and high vacancy rates in office buildings;slow growth in household real incomes in 1989; and the perception,beginning in 1989, that housing prices were too high, making housinga less attractive investment.
Growth in bank loans slowed markedly last year, but it is im-possible to tell how much of this decline was the result of diminishedsupplies of loanable bank funds and how much stemmed from theslowing of loan demands as the economy weakened (see Figure 1-7).One indication that some slowing in credit came from the supply side isthat banks increasingly shifted available funds away from loans andinto safe government securities. The Federal Reserve Board's monthlySenior Loan Officer Opinion Surveys have suggested that tighter bankcredit was more the result of a weaker economic outlook than of regula-tory pressure to rebuild capitalization. Nonetheless, the surveys havealso indicated that banks were increasingly wary of making even rela-tively safe loans.
Figure 1-7.Bank Loans and Investment in U.S. GovernmentSecurities
Percentage Change from Year Ago40
30
20
10
0
-10
U.S. Government SecuritiesHeld for Investment Account
1973 1975 1977 1979 1981 1983 1985 1987 1989 1991
SOURCES: Congressional Budget Office; Federal Reserve Board.

CHAPTER I THE ECONOMIC OUTLOOK 27
Even if the condition of financial institutions has not aggravatedthe downturn to date, it may worsen the decline this year. Through the1980s, real estate lending by banks rose to about 23 percent of totalbank assets. Hence, any further erosion of property values will alsoundermine banks. Although many analysts expect the real estate sec-tor to stage a moderate recovery this year, both in prices and in generaleconomic activity, the uncertainty in the near-term outlook for realestate and its importance for banks is an additional risk for the eco-nomic forecast.
CBO'S ECONOMIC FORECAST
The recession that apparently started last summer or early in the fallseems likely to continue into the spring, but then the prospects for amoderate recovery appear good. As a result, the recession is expectedto last less than the average 12 to 13 months and to be less deep thanthe average recession, which has involved a 2£ percent drop in realGNP. After the recession, the inflation rate is likely to be significantlylower than it has been during most of the 1980s—down from between 4percent and 5 percent to between 3 percent and 4 percent on a sustained basis. In other words, the pain of the recession will bring aboutits traditional benefit of lower inflation. Because the recession willbring production down well below potential output-about 4 percentbelow at the recession trough-there will be room for higher growth onaverage in the first part of the 1990s as the economy catches up to itspotential.
The Forecast for 1991 and 1992
CBO expects real GNP to grow about 1-J- percent between the fourthquarters of 1990 and 1991, with a fall in the first half of the year that ismore than offset by recovery in the second half (see Table 1-2 andFigure 1-8). For 1992, the growth rate is expected to rise to about 3£percent. The CPI rises a little less than 4 percent in 1991, and about 3-jpercent in 1992. The recession sharply increases unemployment,

28 THE ECONOMIC AND BUDGET OUTLOOK January 1991
TABLE 1-2. CBO FORECAST AND ALTERNATIVES
Estimated1990
Forecast1991 1992
Fourth Quarter to Fourth Quarter(Percentage change)
Nominal GNPCBO forecast
High-growth alternativeLow-growth alternative
Real GNPCBO forecast
High-growth alternativeLow-growth alternative
Fixed- Weighted GNP Price IndexCBO forecast
High-growth alternativeLow-growth alternative
Consumer Price IndexCBO forecast
High-growth alternativeLow-growth alternative
4.74.74.7
0.20.20.2
4.94.94.9
6.16.16.1
5.55.22.7
1.32.2
-0.9
4.33.13.8
4.03.24.2
7.17.06.9
3.44.14.6
3.83.02.4
3.53.32.0
Calendar-Year Averages(Percent)
Civilian Unemployment RateCBO forecast
High-growth alternativeLow-growth alternative
Three-Month Treasury Bill RateCBO forecast
High-growth alternativeLow-growth alternative
Ten-Year Treasury Note RateCBO forecast
High-growth alternativeLow-growth alternative
5.55.55.5
7.57.57.5
8.68.68.6
6.86.57.3
6.66.05.9
7.97.47.9
6.45.97.0
7.06.26.0
7.77.47.6
SOURCE: Congressional Budget Office.

CHAPTER I THE ECONOMIC OUTLOOK 29
Figure 1-8.The Economic Forecast and Projection
Percent
1980
Real GNP Growth8
1985 1990 1995
Percent12
Inflation13
1980
Actual Projected
0 I i i i i I i i i i I1985 1990 1995
Civilian Unemployment RatePercent
Interest Rates
10Actual Projected
i i i i I I
1980 1985 1990 1995
Percent15
10
Actual ' Projected
Ii
Ten-YearTreasury Notes
Three-MonthTreasury Bills
0 1 I i I i I I I I I I I I i i I I1980 1985 1990 1995
SOURCES: Congressional Budget Office; Department of Commerce, Bureau of Economic Analysis;Federal Reserve Board.
a. The annual value for real GNP growth for 1990 is estimated by CBO.b. Consumer price index for all urban consumers (CPI-U) from January 1983 to present; before that
time, the series incorporates a measure of homeownership conceptually similar to that of the cur-rent CPI-U.

30 THE ECONOMIC AND BUDGET OUTLOOK January 1991
which averages 6.8 percent in 1991 before dropping to around 6.4 per-cent in 1992. Interest rates are likely to be below current levels, asinflationary expectations are dampened and the Federal Reserve shiftsits priorities to moderating the recession.
This forecast is made in a climate of extraordinary uncertaintyabout the economy and about military and diplomatic developments inthe Gulf, which also impinge on the economic outlook. Recessions arealways difficult times for forecasters, and economists simply do nothave a good record of predicting the course of recessions. In the cur-rent case, the major domestic uncertainty is whether the financialproblems of banks will weaken the economy beyond where it stood atthe turn of the year. Compounding the difficulty this time is the situ-ation in the Middle East.
Despite these major uncertainties, CBO had to make assumptionsabout these matters in order to prepare the forecast. With respect tothe domestic economy, it assumed that the banks' credit crunch willnot intensify further. With respect to the Middle East, the forecastassumes that the unpredictable situation in this region keeps oil pricesat about $25 a barrel and that U.S. military spending is relativelymodest. Alternative forecasts that make different assumptions inthese respects are discussed later in this chapter.
The Recession and Recovery. The forecast includes only a brief reces-sion, lasting two quarters (the last quarter of 1990 and the first of1991). The recession is forecast to be relatively mild by historical stan-dards, and to be followed by a moderate recovery beginning in thespring of 1991. Lower interest rates are expected to play a major rolein the recovery as they have in previous recoveries. Two other factorsare important to this outlook: the likely strength of net exports, andthe possibility that the gradual slowing of economic activity that pre-ceded this recession, together with improved inventory control in the1980s, may mitigate the inventory cycle that plays a large role in in-tensifying the downturn in most recessions.
The forecast strength of net exports is largely the result of the de-preciation of the dollar in the second half of 1990, which has made U.S.

CHAPTER I THE ECONOMIC OUTLOOK 31
goods more competitive in world markets. In addition, though much ofthe English-speaking world appears to be in recession, other parts ofthe world—such as continental Europe and particularly Germany-areexperiencing an investment boom that should help to support demandfor U.S. exports of capital goods. The recession in the United States, to-gether with the budget agreement, will also reduce domestic demandand thus contribute to the forecast's improvement in net exports.
So far, manufacturers and distributors have avoided a sharp in-ventory accumulation, and CBO's forecast of a modest inventory cyclereflects this development. The early stages of most recessions bringundesired increases in inventories, because orders and production donot immediately respond to flagging sales. This means, of course, thatproduction has to be reduced at a later point in the recession to workdown the bulging stocks. The current recession, however, has notshown any sign of a sharp buildup of inventories: orders and produc-tion have been kept in close step with sales. The increased prevalenceof computer-controlled inventories may have played a role, as mayhave the Federal Reserve's policy of slowing the economy graduallyover the past several years, which gave plenty of warning of slowersales.
The Outlook for Inflation. Inflation is likely to fall significantly overthe next two years, largely as a result of the recession. Economistsoften relate the effect of economic weakness on inflation to the cumu-lative amount by which unemployment exceeds a certain critical rate,known as the NAIRU (for the nonaccelerating inflation rate of unem-ployment). If unemployment is at the NAIRU, inflation has no strongtendency to either increase or decrease, though it can vary because ofsuch factors as sharp changes in food or fuel prices. If unemployment isbelow the NAIRU, inflation can be expected to rise. Alternatively, ifunemployment is above the critical rate, inflation is likely to fall.While there is some disagreement over where this critical rate is, CBOcurrently puts it at a little below 5% percent, falling slightly in the nextfew years as a result of changes in the demographic composition of thelabor force.
Since the level of unemployment is expected to be significantlyabove the NAIRU for the next two years, the inflation rate is likely to

32 THE ECONOMIC AND BUDGET OUTLOOK January 1991
fall. A commonly used rule of thumb says that for every two to threepoint-years of unemployment above the NAIRU, the inflation rate isreduced by one percentage point. Following this rule, CBO forecasts adecline of one percentage point in the rate of inflation by the end of1992.
Measures of inflation are also affected by changes in the prices ofparticular products and services, and by changes in taxation. Oilprices are clearly critical to the forecast. CBO has assumed that theywill remain stable in 1991, reducing inflation slightly in contrast tothe large boost to inflation experienced in 1990. In the very short term,inflation may also be increased by the freeze in California at the turnof the year and consequent increases in fruit prices. Consumer priceshave also been pushed up by two rounds of increases in federal excisetaxes-first gasoline taxes in December and then taxes on alcohol,tobacco, luxury items, and other goods in January. These develop-ments will generate a temporary increase in prices but will have nolasting effect on the rate of inflation.
The Outlook for Interest Rates. The recession will cause a furtherreduction in interest rates in the forecast, as long-term rates fall inresponse to expectations of lower inflation, and short-term rates easefurther as the Federal Reserve continues to relax its monetary policy.The rate on 10-year Treasury notes, which was over 9.0 percent in lateApril and fell to 8.1 percent in December, is expected to fall aboutanother 0.4 percentage points by midyear. Short-term interest rateshave already fallen sharply. The three-month Treasury bill rate fellfrom 7.8 percent in the first quarter of 1990 to 6.5 percent in December,and is expected to decline further in coming months.
Short-term rates are expected to rebound slightly in the secondhalf of this year and early 1992 as the economy recovers, whereaslong-term rates, responding to expectations of lower inflation, willremain low.
Alternative Forecasts. Because of the extraordinary uncertainty of thepresent economic outlook, the result of the Gulf crisis, the creditcrunch, and the inevitable difficulty of forecasting during a recession,it is useful to consider other possible economic scenarios for the next

CHAPTER I THE ECONOMIC OUTLOOK 33
two years. CBO has developed high-growth and low-growth alterna-tive scenarios for 1991 and 1992. These alternatives, which are shownin Table 1-2, clearly do not encompass the full range of possible eco-nomic outcomes; for example, things could turn out worse than inCBO's low-growth alternative. These scenarios do, however, show therange of possibilities that seem likely.
The low-growth alternative forecast entails a more serious reces-sion than does CBO's forecast, leading to a drop of 2.2 percent in realGNP from its peak to its trough levels over about a year. As a result,real GNP falls for four quarters in this alternative, and the unemploy-ment rate rises to 7.3 percent on average for the year. Because a rela-tively strong recovery is possible after a deeper recession, growth inreal GNP is a relatively high 4.6 percent in 1992. Nevertheless, unem-ployment remains around 7 percent on average during 1992.
A deeper recession like that in the low-growth alternative couldcome about for a variety of reasons. The credit crunch could turn out tobe more serious than it now seems, a development that would weakenprivate domestic spending on housing, nonresidential construction, in-vestment in equipment, and consumer purchases of durable goods. Inaddition, continued instability in the Middle East and in the SovietUnion could lead to unsettled markets for oil, weakness in financialmarkets, and reduced business and consumer confidence.
The high-growth alternative is a shorter and less severe period ofeconomic weakness, with a stronger recovery, than in CBO's forecast.From peak to trough, the downturn in real GNP totals less than 1 per-cent in this alternative. Growth in real GNP is a significant 2.2 per-cent over the four quarters of 1991 and irises above 4 percent in 1992.At 6.5 percent on average during 1991, unemployment is slightly lowerthan in the forecast, while inflation falls; more quickly. Because of thepossibility of lower inflation, interest rates are lower in this scenariothan in the CBO forecast.
What could bring about such a relatively optimistic outcome? Onelikely source is low oil prices, stemming from a quick resolution of theGulf crisis. In generating this scenario, CBO assumed that the Gulfconflict is resolved quickly, and that oil prices fall at least temporarily
34 THE ECONOMIC AND BUDGET OUTLOOK January 1991
below $20 per barrel. Another source of such an optimistic outcome isthe possibility that the credit crunch turns out to be less of a factorlimiting spending in the economy than forecasters now believe. Thesharper decline in inflation in this alternative represents the pos-sibility that the effect of recession in slowing the growth of prices couldbe quite strong, even in a mild downturn.
Comparison with Other Forecasts. The CBO forecast for real GNP isconsiderably lower than what CBO predicted last July (see Table 1-3).That forecast was prepared before Iraq invaded Kuwait, before theJuly revisions to the national income and product accounts, and beforeevidence had emerged of the seriousness of the credit crunch. The newforecast differs from the old primarily because of these changes.
The revision in historical estimates of real GNP growth that theCommerce Department published last July cut recent reported growthrates and made it clear that the trend of growth was lower than hadpreviously been thought. Growth in real GNP for 1989 was revisedfrom 3.0 percent to 2.5 percent, growth in real disposable income from4.0 percent to 2.4 percent, and growth in real consumption from 2.7percent to 1.9 percent. Growth in nonfarm business productivity wasalso revised down sharply, from a positive 0.9 percent to a negative 0.7percent.
Other forecasters have also revised their views since last summer.The Blue Chip Economic Indicators, an average of forecasts by 50economists, has lowered its prediction of growth for 1991 since lastsummer. The January 1991 Blue Chip average forecast for real GNPgrowth in calendar year 1991 is only slightly lower than CBO's.
The Projections for 1993 Through 1996
CBO does not try to forecast fluctuations in the economy for more thantwo years. Instead, for 1993 through 1996, it extrapolates recenttrends in fundamental economic conditions, such as labor supply, pro-
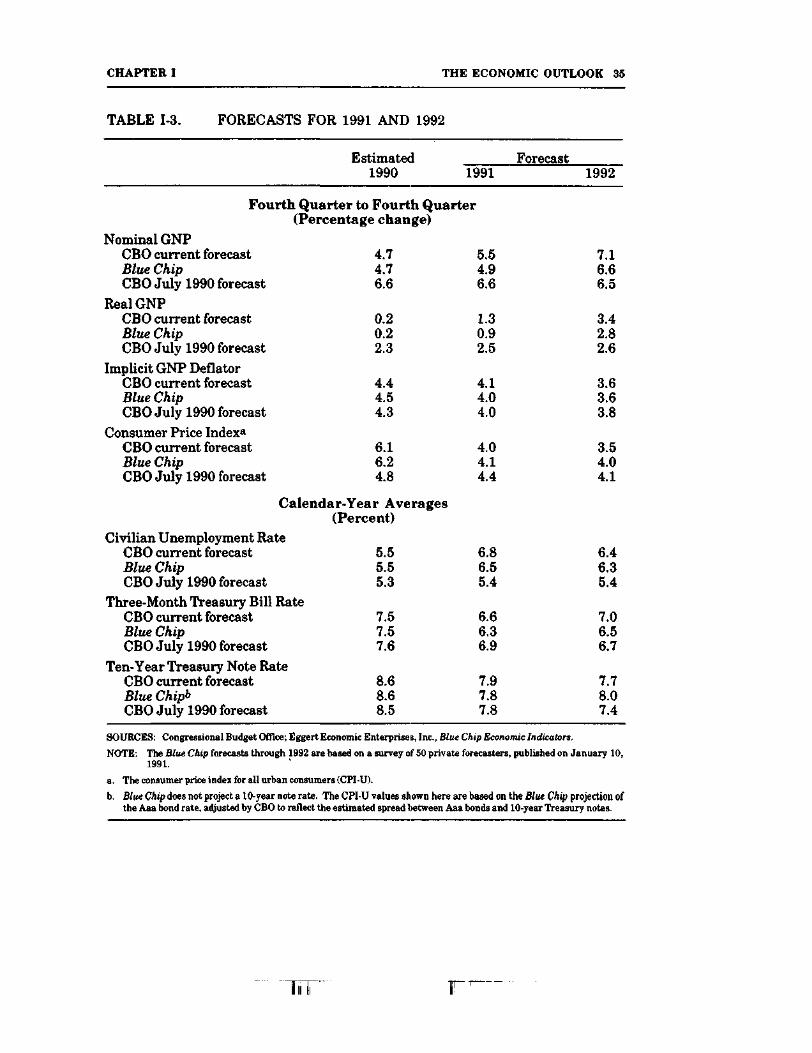
CHAPTER I THE ECONOMIC OUTLOOK 35
TABLE 1-3. FORECASTS FOR 1991 AND 1992
Estimated Forecast1990 1991 1992
Fourth Quarter to Fourth Quarter(Percentage change)
Nominal GNPCBO current forecast 4.7 5.5 7.1Blue Chip 4.7 4.9 6.6CBO July 1990 forecast 6.6 6.6 6.5
Real GNPCBO current forecast 0.2 1.3 3.4Blue Chip 0.2 0.9 2.8CBO July 1990 forecast 2.3 2.5 2.6
Implicit GNP DeflatorCBO current forecast 4.4 4.1 3.6Blue Chip 4.5 4.0 3.6CBO July 1990 forecast 4.3 4.0 3.8
Consumer Price Index8
CBO current forecast 6.1 4.0 3.5Blue Chip 6.2 4.1 4.0CBO July 1990 forecast 4.8 4.4 4.1
Calendar-Year Averages(Percent)
Civilian Unemployment RateCBO current forecastBlue ChipCBO July 1990 forecast
Three-Month Treasury Bill RateCBO current forecastBlue ChipCBO July 1990 forecast
Ten- Year Treasury Note RateCBO current forecastBlue ChipbCBO July 1990 forecast
5.55.55.3
7.57.57.6
8.68.68.5
6.86.55.4
6.66.36.9
7.97.87.8
6.46.35.4
7.06.56.7
7.78.07.4
SOURCES: Congressional Budget Office; Eggert Economic Enterprises, Inc., Blue Chip Economic Indicators.
NOTE: The Blue Chip forecasts through 1992 are based on a survey of 50 private forecasters, published on January 10,1991.
a. The consumer price index for all urban consumers (CPI-U).
b. Blue Chip does not project a 10-year note rate. The CPI-U values shown here are based on the Blue Chip projection ofthe Aaa bond rate, adjusted by CBO to reflect the estimated spread between Aaa bonds and 10-year Treasury notes.
IT'

36 THE ECONOMIC AND BUDGET OUTLOOK January 1991
ductivity, and saving rates. The paths of such variables as GNP, in-flation, and interest rates are then projected on the basis of the dif-ferences between the levels CBO has forecast for the end of 1992 andthe long-run or potential levels that are implied by the projected be-havior of fundamental economic conditions.
Growth in Real GNP. CBO projects relatively robust growth in realGNP after 1992 because the recession will leave real GNP well belowits potential level at the end of 1992, thereby making a healthy growthrate possible as the economy recovers and resources are more fullyused (see Tables 1-4 and 1-5). This strong growth should occur eventhough the average rate of growth of potential GNP is now thought tobe slightly lower than CBO projected last summer.
CBO has derived its medium-term projection of potential GNPusing the framework of a growth model.8 This model projects the rateof growth of potential output largely through projections of the growthrates of the labor force, the capital stock (which depends on assumedrates of national saving), and productivity. Once potential GNP hasbeen projected using this method, values for real GNP during the1993-1996 period are developed by assuming that the gap betweenactual and potential GNP will fall gradually from the relatively largevalue forecast at the end of 1992 to a historically average level by theend of 1996.
CBO follows the midrange assumptions of the Bureau of LaborStatistics in projecting that growth in the labor force will average 1.3percent over the 1993-1996 period, slower than its average rate of 1.6percent in the 1980s. The slowdown reflects slower growth in the adultpopulation and in the rate of participation by women in the labor force.
The projection for the capital stock depends primarily on nationalsaving (private saving less government borrowing as a share of GNP),which, together with overseas borrowing, determines the rate at
8. This model is based on one originally developed by researchers at the Brookings Institution. For asummary description of the CBO growth model, see Congressional Budget Office, The Economicand Budget Outlook: Fiscal Years 1990-1994 (January 1989), pp. 125-127.

CHAPTER I THE ECONOMIC OUTLOOK 37
TABLE 1-4. MEDIUM-TERM ECONOMIC PROJECTIONS FORCALENDAR YEARS 1993 THROUGH 1996
Estimated Forecast Projected1990 1991 1992 1993 1994 1995 1996
Nominal GNP(Billions of dollars) 5,467 5,700 6,107 6,505 6,919 7,358 7,824
Nominal GNP(Percentage change) 5.1 4.3 7.1 6.5 6.4 6.3 6.3
Real GNP(Percentage change) 0.9 0.0 3.3 2.9 2.8 2.7 2.7
Implicit GNP Deflator(Percentage change) 4.2 4.3 3.7 3.5 3.5 3.5 3.5
Fixed-Weighted GNP PriceIndex (Percentage change) 4.6 4.6 3.8 3.8 3.8 3.8 3.8
CPI-U (Percentage change) 5.4 4.9 3.5 3.6 3.6 3.6 3.6
Unemployment Rate(Percent) 5.5 6.8 6.4 6.2 6.0 5.8 5.6
Three-Month TreasuryBill Rate (Percent) 7.5 6.6 7.0 6.7 6.3 5.9 5.7
Ten-Year Treasury NoteRate (Percent) 8.6 7.9 7.7 7.6 7.4 7.3 7.2
Tax Bases (Percentage of GNP)Corporate profits 5.5 5.2 5.7 5.5 5.2 5.0 4.9Other taxable income 22.2 22.3 22.1 22.1 22.0 21.8 21.7Wage and salary
disbursements 49.4 49.4 49.4 49.5 49.6 49.8 49.8
Total 77.2 76.8 77.1 77.1 76.8 76.6 76.4
SOURCE: Congressional Budget Office.
NOTE: CPI-U is the consumer price index for all urban consumers.

38 THE ECONOMIC AND BUDGET OUTLOOK January 1991
TABLE 1-5. MEDIUM-TERM ECONOMIC PROJECTIONS FORFISCAL YEARS 1993 THROUGH 1996
Actual Forecast Projected1990 1991 1992 1993 1994 1995 1996
Nominal GNP(Billions of dollars) 5,406 5,624 6,003 6,405 6,813 7,246 7,705
Nominal GNP(Percentage change) 5.4 4.0 6.7 6.7 6.4 6.4 6.3
Real GNP(Percentage change) 1.3 -0.3 2.8 3.0 2.8 2.8 2.7
Implicit GNP Deflator(Percentage change) 4.0 4.4 3.8 3.6 3.5 3.5 3.5
Fixed-Weighted GNP PriceIndex (Percentage change) 4.4 4.7 4.0 3.8 3.8 3.8 3.8
CPI-U (Percentage change) 5.0 5.4 3.6 3.6 3.6 3.6 3.6
Unemployment Rate(Percent) 5.4 6.6 6.6 6.3 6.0 5.8 5.6
Three-Month TreasuryBill Rate (Percent) 7.7 6.7 6.9 6.8 6.4 6.0 5.7
Ten-Year TreasuryNote Rate (Percent) 8.4 8.0 7.7 7.6 7.5 7.3 7.2
Tax Base (Percentage of GNP)Corporate profits 5.5 5.2 5.6 5.6 5.3 5.0 4.9Other taxable income 22.2 22.3 22.1 22.1 22.0 21.9 21.7Wage and salary
disbursements 49.5 49.4 49.4 49.4 49.6 49.7 49.8
Total 77.2 76.9 77.0 77.1 76.9 76.7 76.4
SOURCE: Congressional Budget Office.
NOTE: CPI-U is the consumer price index for all urban consumers.
CHAPTER I THE ECONOMIC OUTLOOK 39
which firms invest in plant and equipment. CBO assumes that afterthe recovery from the recession, net national saving will be largerrelative to GNP than it has been during the 1980s, both because of thereduction in federal borrowing relative to GNP and because demo-graphic factors will tend to increase private saving. In the short run,however, saving and investment will be held down by the recession,and this weakness in saving is likely to last long enough so that netsaving on average in the first half of the 1990s could be a slightly lowershare of GNP than it was during the 1980s. Thus, capital formation islikely to slow somewhat. Nevertheless, because growth in the laborforce is expected to decline, capital per worker-a major contributor tolabor productivity-is likely to rise slightly.
Last summer's revisions to the data on historical GNP signifi-cantly reduced the reported recent growth of productivity, leading someprivate forecasters to be quite pessimistic about prospects for growth inproductivity through the mid-1990s.9 But it would be premature todeduce a lower long-run trend in productivity from only a few years'data, since many factors affect productivity, making it notoriouslyhard to predict.
Some factors would increase growth in productivity while otherswould reduce it. One major factor pointing to a higher trend in pro-ductivity growth in the next few years is the gradual shift that willtake place in the composition of the labor force: there will be feweryoung workers and more with greater maturity and experience onaverage. Alternatively, if the shift from high-productivity manu-facturing jobs to lower-productivity service jobs continues, growth inproductivity could fall. In light of these and other factors, CBO sees nooverwhelming reason why growth in productivity should differ in the1990s from what it was in the 1980s. CBO therefore assumes thatproductivity will proceed at the average rate of the 1980s, which hap-pens also to be close to the average rate for the 1960s, 1970s, and 1980staken together.
9. Productivity in this section refers to total factor productivity--a measure of the productivity of bothcapital and labor. A more comprehensive measure: than labor productivity, it is defined as thegrowth in output above the growth in the capital and labor inputs.
IT'"

40 THE ECONOMIC AND BUDGET OUTLOOK January 1991
TABLE 1-6. GROWTH IN LABOR PRODUCTIVITYIN THE NONFARM BUSINESS SECTOR
Average AnnualGrowth Rate
Period (Percent)
1950:4 -1960:2 2.0
1960:2-1973:2 2.5
1973:2-1981:3 0.6
1981:3-1990:3 1.0
SOURCES: Congressional Budget Office; Department of Labor, Bureau of Labor Statistics.
This assumption for growth in total factor productivity impliesthat labor productivity will grow about 1.4 percent a year during theprojection period, which is a more rapid pace than in recent years (seeTable 1-6). Because growth in the amount of capital per worker accel-erates, growth in labor productivity is assumed to pick up even thoughgrowth in total factor productivity remains steady. The growth incapital per worker should spur growth in labor productivity.
Interest Rates. CBO has based its projection of interest rates for the1993-1996 period on the projected strengths of both the supply of newsaving and the demand for saving during that period. CBO projectsthat the supply of new saving; will rise because of the increase in theU.S. national saving rate that it projects for the next several years. Ifthere were no significant expected changes in the demand for funds,CBO would project on the basis of historical patterns that this rise innational saving would reduce real (inflation-adjusted) long-term inter-est rates to roughly 3 percent in 1996. Real short-term interest rateswould be about 1̂ percent, reflecting historical norms in the spreadbetween long-term and short-term rates. 10 Both long- and short-term
10. CBO has used a proxy measure for national saving: the rate of creation of new wealth as measuredby the sum of real net investment and real net exports as a share of real net national product. For adetailed discussion of historical patterns of national saving rates and real interest rates, and ofCBO's use of these patterns in projecting real interest rates, see Congressional Budget Office, TheEconomic and Budget Outlook: An Update (July 1990), pp. 27-28.
CHAPTER I THE ECONOMIC OUTLOOK 41
real interest rates would be projected to decline gradually to these 1996levels over CBO's projection period.
CBO's current projection of real interest rates in the 1990s is high-er than this level, however, because it also takes into account the in-creased demands for funds that are expected to emanate from Europe.As the discussion earlier in this chapter pointed out, investment needsin that continent, primarily in unified Germany, are likely to drawheavily on the world's supply of funds and help keep interest rateshigher than they would otherwise be.
As a result, CBO has projected that interest rates will be higherthan the level mentioned above, which is based strictly on the projec-tion of increased national saving in the United States. In particular,CBO has assumed that capital demands in Europe will add about one-half percentage point to real long-term interest rates, leaving them ata level of approximately 3.5 percent in 1996.H Reflecting the samehistorical patterns in the spread between long- and short-term ratesthat CBO has used before, real short-term interest rates in 1996 areprojected at 2.2 percent. Real interest rates in the years before 1996are projected to decline steadily toward these levels.
11. CBO's estimates of how capital needs in Europe will affect world interest rates are described inCongressional Budget Office, How the Economic Transformations in Europe Will Affect the UnitedStates (December 1990).
"TTT ' IT"

_JJ1.

CHAPTER II
THE NEW BUDGET PROCESS
On September 30, after almost five months of talks, Congressional andAdministration budget negotiators announced an agreement. Thesummit agreement, as it was called, contained changes in substantivelaw and budgetary procedures designed to reduce the deficit by a totalof $500 billion over five years. When first presented to the House ofRepresentatives in the form of a concurrent resolution on the budget,the summit agreement was voted down. After some modifications,however, a budget resolution was ratified by the House on October 8and by the Senate the next day.
The budget resolution contained reconciliation instructions di-recting House and Senate authorizing committees to reduce mandatory spending or increase revenues by a total of $246 billion over the1991-1995 period. It also provided discretionary spending allocationsto the Appropriations Committees in the amounts agreed upon by thesummit participants. The Congress moved quickly to implement thebudget resolution. In the following three weeks, it completed action onthe 13 appropriation bills for fiscal year 1991. And on the weekend ofOctober 27-28, it approved the Omnibus Budget Reconciliation Act of1990, which contained tax increases, entitlement cuts, and changes inbudget enforcement procedures.
The Budget Enforcement Act of 1990 (Title XIII of the reconcilia-tion act) closely follows the procedures outlined in the budget summitagreement. It includes amendments to both the Balanced Budget andEmergency Deficit Control Act of 1985 (commonly known as Gramm-Rudman-Hollings) and the Congressional Budget Act of 1974. Themost striking change in the budget process is the elimination of fixeddeficit targets. While the deficit is likely to fall significantly betweennow and 1995 as a result of the spending cuts and tax increases in thereconciliation act, the new version of Gramm-Rudman-Hollings doesnot guarantee this result, as prior versions purported to do. Instead, it
38-033 O - 91 — 3 : QL 3

Jll
44 THE ECONOMIC AND BUDGET OUTLOOK January 1991
attempts to ensure that the hard-won savings enacted in 1990 are noteroded by future changes in law.
This chapter summarizes the new budget process. First, it outlinesthe rules that will govern the path of spending and revenues. Second,it describes the Congressional procedures that are intended to enforcethese rules and the automatic provisions that will be called into play ifthe Congressional procedures fail. Third, it gives the timetable for thebudget process this year. Finally, it considers some of the possible ef-fects of the new budget process on budget outcomes.
This chapter reflects the best current interpretation of the BudgetEnforcement Act, but few statements about the new law can be madewith complete assurance. The act is long and complicated and waswritten hurriedly, and most of its provisions have not yet been tested.Practical experience is therefore likely to modify some of the conclu-sions stated here.
BUDGETARY RULES
The Budget Enforcement Act establishes three major budgetaryrules—dollar limits on discretionary spending, a pay-as-you-go require-ment for most mandatory spending and revenues, and flexible deficittargets.
Discretionary Spending Limits
Ultimately, almost all federal spending is discretionary. Except for thecommitment to pay the interest on the public debt, laws that promiseto make specific benefit, grant, subsidy, or other payments can alwaysbe changed. Yet, some kinds of spending are more discretionary thanothers. The spending that is usually termed discretionary is thatwhich is controlled by annual appropriations.
Each year the Appropriations Committees consider and the Con-gress approves 13 separate appropriation bills. The largest (almost$300 billion) is for defense. The smallest (about $0.5 billion) provides

CHAPTER II THE NEW BUDGET PROCESS 45
the federal payment to the District of Columbia. The remaining appro-priation bills cover foreign operations; the Departments of Labor,Health and Human Services, and Education, and related agencies; thelegislative branch; rural development arid agriculture; transportation;and the other ongoing operations of the federal government. Each ap-propriation bill provides specific amounts of budget authority (theauthority to make financial obligations) for the agencies and programswithin its scope, and that budget authority sooner or later results inoutlays (generally, cash disbursements). If the appropriation bills arenot enacted by the start of each fiscal year, most government agencieswould have to shut down.
The Budget Enforcement Act divides discretionary appropriationsinto three parts-defense, international, and domestic. For 1991,1992,and 1993, there are separate budget authority and outlay limits foreach of the these three components. For 1994 and 1995, budget au-thority and outlay caps are set for discretionary spending as a whole.Like most of the other numbers in the Budget Enforcement Act, thediscretionary spending limits will be adjusted periodically according torules specified in law.
The defense discretionary category comprises not only the militaryactivities of the Department of Defense, but also the defense-relatedfunctions of other agencies, such as the Department of Energy's nucle-ar weapons programs. International discretionary spending includesforeign economic and military aid, the activities of the Department ofState and the U.S. Information Agency, and international financialprograms, such as the Export-Import Bank. Domestic discretionaryspending includes science and space, transportation, the environment,social services and education, subsidized housing, veterans' medicalcare, and the basic executive, legislative, and judicial functions of gov-ernment.
Adjustments to the discretionary spending limits will be madetwice each year~at the beginning and at the end of a session of Con-gress. This year, the initial adjustments are of two sorts: (1) adjust-ments for changes in budgetary concepts or definitions made by theBudget Enforcement Act and (2) adjustments for differences betweenactual and estimated inflation for fiscal year 1990.
IT"

46 THE ECONOMIC AND BUDGET OUTLOOK January 1991
After the Congress adjourns, the caps will be adjusted again to re-flect any additional amounts appropriated for enforcement activities ofthe Internal Revenue Service (up to a specified limit), InternationalMonetary Fund quota increases, certain debt forgiveness, or desig-nated emergencies. The law provides that the costs of Operation De-sert Shield (now Operation Desert Storm) are to be treated as an emer-gency need. Other emergencies-for example, a natural disaster-mustbe designated as such by both the President and the Congress. Sincethese adjustments are made only after legislation is enacted, they mustbe made at the end rather than the beginning of a budget cycle.
In addition, at the end of a Congressional session, the inter-national discretionary cap will be increased by about $1.2 billion inbudget authority, and the domestic cap will be increased by about $1.5billion. Because they are calculated as percentages after all the otheradjustments have been made, the amounts of these special budget au-thority allowances cannot be known with certainty until the end of theyear, although they can be estimated with reasonable precision.
Outlays are also permitted to exceed the caps by small amounts, aslong as the budget authority caps are not breached. Unlike the specialbudget authority allowances, however, this special outlay allowance isnot intended to be spent. It is designed to insulate the legislativeprocess from differences in estimates between CBO (whose estimatesare used for Congressional scorekeeping) and the Office of Manage-ment and Budget (whose estimates are controlling for the automaticenforcement of the discretionary spending limits).
Mandatory Spending and Revenues
Unlike discretionary appropriations, spending for entitlements andother mandatory programs (also called direct spending) does not re-quire annual decisions on funding levels. Instead, these programs (ofwhich the largest are Social Security, Medicare and Medicaid, and fed-eral civilian and military retirement) continue making payments toeligible recipients unless the Congress changes the underlying laws.Under the new procedures, changes in revenues and most mandatory

CHAPTER II THE NEW BUDGET PROCESS 47
spending are now required to be deficit-neutral in each year. Specialrules apply to Social Security and deposit insurance.
Pay-as-You-Go. The Budget Enforcement Act provides that changes inmandatory spending programs and in governmental receipts combinedmust not increase the deficit in any year. An entitlement program canbe increased only if another entitlement is cut or if taxes or fees areraised. Similarly, a tax can be cut only if another is increased or if en-titlement spending is reduced. This requirement, which is termedpay-as-you-go, applies not to each new law individually, but to thetotal of all laws affecting a fiscal year.
As with discretionary spending, spending for designated emer-gency needs is exempt from the pay-as-you-go requirement. But that isthe only exception. There is no allowance for estimating differences.
Unlike the appropriation caps, however, the pay-as-you-go systemdoes not control federal spending. Rejecting a decade of complaintsfrom some quarters about the growth of entitlement spending, the newlaw allows entitlements to be increased without limit, as long as theincreases are paid for by new taxes or fees.
Social Security. Social Security, the biggest entitlement program, isnot subject to the general pay-as-you-go requirement but has its ownpay-as-you-go rule.
The Budget Enforcement Act excludes the receipts and spending ofthe Social Security retirement and disability trust funds from allcalculations under the Balanced Budget Act, including the deficit andpay-as-you-go. The intent is to insulate Social Security from whateveradjustments are needed to meet the general budgetary limits. Thisexclusion, however, removes an impediment to cutting payroll taxes,increasing retirement benefits, or using the Social Security trust fundsto finance other programs. Accordingly, the Budget Enforcement Acterects new procedural hurdles to protect the balances in the SocialSecurity trust funds. New House and Senate rules thwart considera-tion of legislation that would reduce projected Social Security sur-pluses. In the Senate, waiving this rule requires 60 votes (instead ofthe 51 votes usually required when all Senators vote).

L
48 THE ECONOMIC AND BUDGET OUTLOOK January 1991
Deposit Insurance. Spending necessary to meet the government'sexisting deposit insurance commitments is not limited in any wayunder the new budget process.
Early in 1991, the Congress will have to provide more money tothe Resolution Trust Corporation to allow it to continue its job of re-solving hundreds of insolvent savings and loan institutions. The BankInsurance Fund will also need new resources soon. While legislationwill be required in both cases, the changes in law will not representnew spending but merely the recognition of a prior government com-mitment; therefore, it will be excluded from pay-as-you-go. Additionaldeposit insurance spending will not need to be offset by tax increases orspending cuts. By the same token, increases in deposit insurance pre-miums or other resources will not permit non-deposit-insurance spend-ing to be increased.
Deficit Targets
The Budget Enforcement Act revises the previous deficit targets, ex-tends the targets through 1995, and excludes the income and outgo ofthe Social Security trust funds from the targets. Through at least1993, however, the deficit targets are irrelevant.
There are two reasons for this. First, the President must adjustthe deficit targets for revised economic and technical assumptions, thecosts of Operation Desert Storm and other emergency legislation, andother adjustments to the discretionary caps when submitting the bud-get for fiscal years 1992 and 1993. Whenever these adjustments aremade, they will be made for all years through 1995. Second, the eco-nomic and technical estimating assumptions used by the Office of Man-agement and Budget in the President's budget must also be used byOMB for all subsequent calculations that year. Therefore, even if theoutlook deteriorates after the President's budget is submitted, the defi-cit targets will be said to have been reached as long as the discre-tionary spending limits and the pay-as-you-go requirement are met.
The President is also allowed to adjust the deficit targets in thebudgets for 1994 and 1995 to reflect up-to-date economic and technical

CHAPTER II THE NEW BUDGET PROCESS 49
assumptions. Even if he chooses not to exercise this option, he muststill revise the deficit targets for adjustments in the discretionaryspending limits. If the President opts to adjust the deficit targets fullyin 1994 and 1995, the targets will continue to be nonbinding, as in1992 and 1993. If the targets are not adjusted, and if the discretionaryspending limits and pay-as-you-go requirements are met, the deficittargets will be binding only if the economic and technical assumptionsused in the 1993 budget (other than for deposit insurance) understatedthe deficits for 1994 and 1995.
Credit Reform
The Budget Enforcement Act brings federal direct loan and loan guar-antee programs within the scope of the discretionary spending limits,pay-as-you-go requirements, and other budget enforcement provisionsstarting in fiscal year 1992.
Previously, federal credit programs were included in the budget ona cash-flow basis. The disbursement of a direct loan was recorded as abudget outlay, even if future repayments implied that the governmentincurred little or no long-run cost. Conversely, the receipt of a loanguarantee fee reduced outlays, and spending was not recorded unlessand until the loan defaulted. Because of these accounting perversities,a separate credit budget was created to control direct loans and loanguarantees through volume limits. Even so, the volume limits andcash-flow accounting rules distoieral credit programs.
Henceforth, the government'sloan guarantee program will bethe loan is disbursed. This chanplaces direct loans, loan guarai tegrams on the same footing. Crecosts will be shown as having ec ualcredit programs (those controll(will be included in the discretiadjustments will be made to themittees are not disadvantaged
ted budgetary decisions involving fed-
long-run cost for a direct loan or•ecorded as a budget outlay at the timeje in accounting, termed credit reform,
es, and other federal spending pro-lit and noncredit programs with equal
outlays. As a result, discretionaryd by the Appropriations Committees)jnary spending caps, and appropriatecaps so that the Appropriations Com->y the accounting change. Similarly,

50 THE ECONOMIC AND BUDGET OUTLOOK January 1991
mandatory credit programs will be subject to the pay-as-you-go disci-pline. A separate credit budget will no longer be necessary.
ENFORCEMENT OF THE RULES
Strengthened Congressional procedures are designed to assure thatany new legislation conforms to the discretionary spending limits,pay-as-you-go requirement, and deficit targets, if applicable. If theseprocedures fail, automatic across-the-board cutbacks (termed seques-tration) will do the job.
Congressional Procedures
Each year the Congress adopts a budget resolution, which is a plan toguide its spending and taxing decisions for that Congressional session.The spending total in the budget resolution is divided among com-mittees with jurisdiction over various spending programs, and specialprocedural rules make it difficult for a committee to exceed its spend-ing allocation. Similarly, the House Ways and Means Committee andthe Senate Finance Committee, which have jurisdiction over taxes, arenot allowed to propose tax cuts that, if enacted, would cause revenuesto fall short of their target.
Before the Budget Enforcement Act, the spending and revenuetotals in the Congressional budget resolution were binding only for oneyear, and committees were not precluded from taking actions in thebudget year that increased the deficit in later years. Now, budgetresolutions for fiscal years 1992 through 1995 must set forth appro-priate spending and revenue levels for both the budget year and thefollowing four years. These five-year budget resolutions will have tocomply with the discretionary spending limits, the pay-as-you-go re-quirement, the deficit targets, and all other requirements of the Bal-anced Budget Act.
Committees will not be permitted to exceed their spending allo-cations for both the first year and the total of the five years covered bythe budget resolution. In the Senate, waiving this or most other

CHAPTER II THE NEW BUDGET PROCESS 51
requirements of the Budget Enforcement Act will require a 60-votemajority.
Sequestration
If these Congressional procedures fail, any spending overage will beeliminated through automatic across-the-board cuts, or sequestration.In fact, there are now three potential sequestrations to achieve thethree budgetary requirements-discretionary spending limits, pay-as-you-go, and deficit targets. There is no sequestration, however, to en-force the special pay-as-you-go requirement for Social Security.
If defense, international, or domestic discretionary spending ex-ceeds its budget authority or outlay limit, the excess will be eliminatedthrough a cutback in the offending category. A few discretionary pro-grams are exempt, and some health programs are subject to a maxi-mum cut of 2 percent, but most discretionary spending is subject tosequestration. One discretionary spending sequestration has alreadytaken place. Because of a drafting error in the foreign operationsappropriation bill, international discretionary spending for 1991breached the limits by $395 million in budget authority. On November9,1990, after the required sequestration reports were released by CBOand OMB, the President issued a sequestration order cutting inter-national discretionary spending by 1.9 percent.
If changes in mandatory spending or receipts increase the deficitin any year, a pay-as-you-go sequestration will be triggered, and man-datory programs would be cut to the extent necessary to eliminate theoverage. Unlike discretionary spending, most mandatory spending isnot subject to sequestration, and Medicare is subject to a pay-as-you-goreduction of no more than 4 percent. Mandatory spending in 1992 isprojected to total $403 billion, excluding Social Security and depositinsurance. The maximum possible sequestration of mandatory pro-gams amounts to only about $26 billion, however, including $11 billion
52 THE ECONOMIC AND BUDGET OUTLOOK January 1991
for Commodity Credit Corporation (CCC) farm price supports and $4billion for Medicare benefits. For a pay-as-you-go sequestration of lessthan $5 billion, Medicare would bear 80 percent and CCC almost 10percent of the reductions.
Sequestration to enforce the discretionary spending limits and thepay-as-you-go requirements will assure that there will be no separatesequestration to achieve the deficit targets in 1992 and 1993. Thesame will be true in 1994 and 1995 if the President opts to adjust thetargets for those years for economic and technical changes. Otherwise,a separate deficit sequestration will enforce the 1994 and 1995 deficittargets. If the deficit is projected to exceed the target by more than $15billion (excluding changes in deposit insurance estimates), spendingwill be cut by the amount necessary to bring the deficit down to thetarget. Half of the reductions will be taken from defense and half fromnondefense programs.
BUDGET TIMETABLE
The Budget Enforcement Act modifies the budget timetable and addsan additional set of sequestration reports. Much of the old budget pro-cess, however, still remains. Key events will occur this year as follows.
January 30—CBO Preview Report
Five days before the President submits his budget message to the Con-gress, the Congressional Budget Office is required to issue a seques-tration preview report. (This year's report is found in Appendix A ofthis volume.) The preview report contains updated estimates of themaximum deficit amount and of the discretionary spending limits foreach category, based on the adjustments specified in law. It also pro-vides an estimate of any net deficit increase or decrease caused by en-titlement or revenue legislation enacted since the Budget EnforcementAct. (There is no such legislation so far this year.)

CHAPTER II THE NEW BUDGET PROCESS 53
February 4--President's Budget and OMB Preview Report
The President must submit his budget to the Congress between thefirst Monday in January and the first Monday in February. This year,OMB has announced that the fiscal year 1992 budget will be submittedon February 4, 1991. On that day, OMB must also issue its own se-questration preview report. The OMB report will contain the same in-formation as the CBO report, and OMB is required to explain differ-ences between its estimates and those of CBO. Whatever the differ-ences may be, CBO's estimates will be merely advisory, and OMB's es-timates of the discretionary spending limits and deficit targets will becontrolling.
The economic and technical estimating assumptions that OMBuses in the President's budget and in its sequestration preview reportmust also be used by OMB for all subsequent sequestration calcula-tions that year. Under prior law, OMB did not reveal its final esti-mating assumptions until August 15. This change is intended to makethe budget process operate more quickly and smoothly by setting therules of the game at the start of a Congressional session.
April 15—Congressional Budget Resolution
By mid-April the Congress is supposed to adopt the budget resolutionfor the coming fiscal year. Although in recent years the Congress hasnever met and has rarely come close to this deadline, the new budgetprocedures make it a more realistic goal. For 1992 and 1993, the splitamong defense, international, and domestic appropriations is largelydetermined by the discretionary spending caps. The deficit targets, asadjusted, will automatically be achieved if taxes and mandatoryspending are left unchanged and the appropriation caps are met. Theonly major decisions left for the budget resolution are the shape of anypay-as-you-go revenue or entitlement, initiative and whether discre-tionary spending should be held below the legal caps. If the Congressfails to adopt a budget resolution by April 15, the House Committee onAppropriations is given a spending allocation based on the adjusteddiscretionary spending limits for the upcoming fiscal year.

JJLL
54 THE ECONOMIC AND BUDGET OUTLOOK January 1991
August 15 and 20--CBO and OMB Sequestration Update Reports
CBO and OMB will issue sequestration update reports in August.These reports will revise the information provided in the preview re-ports to reflect subsequent legislation. As with the preview reports,OMB issues its report five days after CBO and is required to explainany differences in estimates.
Ten and Fifteen Days After the Congressional Session Ends-CBO and OMB Final Reports and Possible Sequestration
Previously, sequestration took place on October 15, even if the Con-gress was still in session, and any increase in the deficit resulting fromlegislation passed after October 15 was ignored. The new law closesthis loophole.
Now, CBO and OMB will issue their final sequestration reports 10and 15 days, respectively, after the session of Congress ends. If seques-tration is required to comply with the discretionary spending limits,the pay-as-you-go requirement, or the deficit target, the Presidentialorder will be issued 15 days after the end of the session.
During the next session of Congress, enactment of legislation thatcauses a breach in the discretionary spending limits for fiscal year1992 will trigger sequestration 15 days later if it occurs before July 1,1992. If the legislation is enacted after July 1, the applicable spendinglimits for fiscal year 1993 will be reduced by the amount of the breachin 1992. If tax or entitlement legislation enacted at any time duringthe next session of Congress increases the 1992 deficit, the amount ofthe 1992 net increase in the deficit will be added to the deficit increasein 1993. The same provisions will apply to fiscal years 1993 through1995, as well as to any legislation affecting the 1991 deficit during theremainder of the current fiscal year.

CHAPTER II THE NEW BUDGET PROCESS 55
IMPLICATIONS OF THE NEW PROCESS
While the new budget process is undeniably complex, it is more flexiblethan the old one in some respects, arid is likely to be seen as moreequitable and more effective. Even though policymakers and the pub-lic will chafe at some of its restrictions, the Budget Enforcement Actsets fiscal policy on a favorable course for the next five years.
Flexibility has been added to the process in three ways. First, theBudget Enforcement Act allows for adjustments in the discretionaryspending limits and the deficit targets. No longer is there a promisethat the budget will be balanced by a certain date, even though thatpromise is inevitably broken because of unforeseen circumstances.Second, exempting deposit insurance from the pay-as-you-go require-ment should remove the incentive to delay the resolution of the savingsand loan crisis, which would only increase its long-run cost. A thirdelement of flexibility is the provision that exempts emergency spend-ing from the discretionary spending limits and the pay-as-you-gorequirement.
The new discipline will probably be viewed as more equitable for acouple of reasons. For the next five years, sequestration will fall pri-marily on categories of spending that exceed their limits. Appropria-tions will not be cut as long as the appropriators stay within the caps.Moreover, at least through 1993, spending programs will not be heldhostage to developments that policymakers do not directly control,such as the state of the economy.
The new process is also likely to be more effective than the old,both because of its greater equity and for other reasons. Because thebudget horizon will stretch for five years, shifting spending or reve-nues from one year to another will no longer be readily available as ameans of avoiding real deficit reduction. Lease-purchase arrange-ments and other accounting devices have been limited by the score-keeping rules appended to the reconciliation act. And credit reformwill curb other budgetary gimmicks that have existed since before theGramm-Rudman-Hollings era.
56 THE ECONOMIC AND BUDGET OUTLOOK January 1991
As outlined above, the Budget Enforcement Act adds many newrules to the budget process while removing some of the old ones. Someof these new constraints will tend to make the budget debate less con-tentious. But they will also engender new controversies, frustration,and attempts at evasion.
One major issue, the pace at which defense spending should be re-duced and how the freed-up funds should be used, will be less im-portant for the next two years. In 1992 and 1993, reductions in defensespending cannot be used to increase the amount available for domesticor international discretionary spending in those years. Holding de-fense spending below the caps in 1992 and 1993, however, will make iteasier to devote a larger portion of discretionary spending to nonde-fense purposes in 1994 and 1995.
Although mandatory spending cannot be reduced nor taxes in-creased to fund discretionary programs, this barrier may not be in-surmountable. For example, in the area of higher education, some ex-perts have advocated reducing reliance on guaranteed student loansand expanding Pell grants. As long as guaranteed student loans aremandatory and Pell grants are discretionary, such a trade-off is pre-cluded. If Pell grants were made mandatory, however, both programswould fall in the pay-as-you-go category, and the impediment would beremoved.
Credit reform will also offer new opportunities for rearrangingspending priorities. Under the old cash-based accounting, to continuethe previous example, cutbacks in guaranteed student loans generatedlittle immediate budgetary savings. But with credit reform and pay-as-you-go, these savings will be recognized immediately and willbecome available to spend on another entitlement, such as a restruc-tured Pell grant program.
Other roundabout attempts to increase discretionary spendingmay also be expected. Some reports have suggested that there will bean incentive to increase fees because they will be treated as an offset todiscretionary outlays. But such a frontal assault on the caps may beprecluded, because the Budget Enforcement Act specifies that legis-lation affecting receipts is included in the pay-as-you-go scorecard. It

CHAPTER II THE NEW BUDGET PROCESS 57
would be possible, however, to enact or increase a fee and simultane-ously provide a mandatory appropriation of similar purpose to an exist-ing discretionary appropriation.
Some little-understood aspects of the new process may proveharder to evade. Spending from the highway and airport trust funds,for example, is classified as discretionary, even though the programshave dedicated revenue sources. Highway and airport spending musttherefore compete against education, health research, and other pro-grams for scarce room under the domestic discretionary cap, eventhough the trust funds have large and growing balances. Similarly,further increases in gasoline or airplane ticket taxes will not permitmore highway or airport spending.
Unless the 1990 reconciliation act itself is amended, the course offiscal policy appears to be set for the next five years. Not only did thereconciliation act achieve nearly $500 billion in deficit reduction, but itlocks those savings firmly in place. The Budget Enforcement Actprecludes changes in law, other than emergency spending, that wouldadd to the projected deficits. As a result, by 1995, the total federaldeficit is likely to fall below $100 billion for the first time in 15 yearsand below 1 percent of gross national product for the first time in 20years. The next chapter explores the budget outlook through 1996 andshows how it has been affected by the reconciliation act and otherrecent developments.


CHAPTER III
THE BUDGET OUTLOOK
During its final days, the 101st Congress enacted laws that sig-nificantly improved the budget outlook and strengthened the budgetprocess. This legislation reduced the deficit by nearly $500 billion overthe 1991-1995 period and established procedures to ensure that thesesavings are not eroded in the future. Two-thirds of the savings have al-ready been put in place, and one-third remains to be achieved by hold-ing discretionary spending within specified limits. Assuming that thelimits on discretionary spending are maintained, the recent budgetagreement will reduce the total federal government deficit (includingSocial Security and the Postal Service) to less than 1 percent of grossnational product by 1995 and 1996.
Although the long-term budget outlook is favorable, the federalgovernment faces massive borrowing requirements in the next fewyears. The Gulf crisis and other developments, as Chapter I has indi-cated, have halted the eight-year-long economic expansion. The weakeconomy, problems in the thrift and banking industries, and otherfactors are likely to raise the total federal deficit from $220 billion in1990 to nearly $300 billion in 1991 and 1992. The costs of OperationDesert Storm, which cannot be predicted at this time, are not includedin these figures and will push the 1991 deficit even higher.
These record deficits, however, are not as onerous as they appearAbout $100 billion of the 1991 and 1992 deficits will stem from spend-ing needed to resolve insolvent thrift institutions and banks. Whilethe federal government will need to raise these funds through borrow-ing in the market, the money that the government borrows will bepromptly returned to financial markets and will not add much furtherpressure on interest rates. Excluding deposit insurance, the federaldeficit is projected to rise less sharply--from $162 billion in 1990 to$194 billion in 1991 and $186 billion in 1.992.

60 THE ECONOMIC AND BUDGET OUTLOOK January 1991
This chapter summarizes the outlook for the federal budget underthe policies of the budget agreement and the CBO economic forecastand assumptions described in Chapter I. First, it projects the deficitthrough 1996, distinguishing between baseline projections and thosethat assume the new limits on. discretionary spending, and analyzingchanges since last summer. The following section attempts to sort outcompeting, and often confusing, measures of the federal deficit.Finally, the effect of the economy on the budget is illustrated usingrules of thumb that summarize the budget's sensitivity to key eco-nomic variables. Chapters IV and V, respectively, contain more de-tailed descriptions of the spending and revenue projections.
THE BUDGET OUTLOOK THROUGH 1996
Projecting the course of the federal budget requires making assump-tions about future spending and taxing policies. Table III-l presentsbudget projections under two different assumptions about discre-tionary spending. The first alternative—the baseline-assumes thatdiscretionary spending authority is held constant at 1991 inflation-adjusted levels. The second, lower path assumes that discretionaryappropriations are limited to the levels specified in the Budget En-forcement Act.
The Budget Baseline
Before the 1990 budget agreement, the budget baseline was the mostcommonly used benchmark for assessing the future course of the bud-get. For revenues and entitlement spending, the baseline generallyassumes that laws now on the statute books will continue. For defense,international, and domestic discretionary spending, the baseline pro-jections are based on the most recently enacted appropriations (in thiscase, for 1991), increased only to keep pace with inflation.

CHAPTER III THE BUDGET OUTLOOK 61
Because the discretionary spending limits in the Budget Enforce-ment Act do not grow as fast as inflation, the baseline no longer repre-sents current budgetary policy for discretionary programs. Nonethe-less, the baseline still serves several important purposes. First, thebaseline is the reference point for estimating changes in revenues orentitlement spending for pay-as-you-go. Second, the difference be-tween the baseline and the caps for discretionary programs shows theamount of real spending reductions still to be made. Third, many ofthe adjustments to the discretionary caps are computed using the base-line.
The Budget Enforcement Act made no changes in the rules for esti-mating the revenue baseline. The revenue projections reflect currenttax laws, including any scheduled increases or phase-outs. In addition,as specified in the act, excise taxes dedicated to trust funds, if expiring,are assumed to be continued at current rates. CBO therefore assumesthat highway taxes are extended beyond September 30, 1995, and thataviation taxes are extended beyond December 31, 1995. Three other,smaller extensions are also assumed.
Entitlement and other mandatory spending programs do not re-quire annual decisions on funding levels; instead, they continue mak-ing payments to eligible recipients until the Congress changes the un-derlying laws. Like the revenue baseline, the baseline for mandatoryprograms represents CBO's estimate of future spending under thebaseline economic assumptions, assuming continuation of current law.Under the Budget Enforcement Act, however, no program with esti-mated outlays greater than $50 million is assumed to expire in thebaseline. In particular, the baseline assumes that the Congress willprovide all funding necessary to meet existing commitments for de-posit insurance.
Unlike entitlements, discretionary programs rely for their fundingon annual Congressional action through the appropriation process.The baseline assumes no real growth in these discretionary appropria-tions, adjusting them only for inflation. The Budget Enforcement Actchanged the measure of inflation used in computing the baseline fordiscretionary programs. Henceforth, nonpersonnel costs will be ad-

L_iL
62 THE ECONOMIC AND BUDGET OUTLOOK January 1991
justed using the projected growth in the GNP fixed-weighted priceindex; personnel costs are adjusted using the employment cost index.Previously, the implicit GNP deflator was used for both personnel andnonpersonnel spending. As under prior law, personnel spending is alsoadjusted to make up for pay absorption (initially funding some portionof an increase in pay rates by reducing nonpersonnel spending) and forchanges in agencies' payments to the retirement and health benefitstrust funds.
The Budget Enforcement Act eliminates an anomaly in the discre-tionary baseline by adjusting it to reflect year-to-year changes in thenumber of expiring subsidized housing contracts up for renewal. It al-so provides that budgetary resources for the administrative expenses ofMedicare, Unemployment Insurance, and Railroad Retirement shallbe adjusted by the projected increase or decrease in the beneficiary pop-ulation.
Under baseline assumptions, the total deficit would grow from$220 billion in 1990 to $298 billion in 1991 and 1992, before droppingto $239 billion in 1993, $211 billion in 1994, and $128 billion in 1995(see Table III-l). In relation to the size of the economy, the total base-line deficit represents 4.1 percent of GNP in 1990, 5.3 percent of GNPin 1991, and 5.0 percent of GNP in 1992. In 1995 and 1996, the base-line deficit would be less than 2 percent of gross national product.
Discretionary Spending Limits
Adhering to the discretionary spending limits in the Budget Enforce-ment Act, as indicated in Table III-l, will require holding discretionaryoutlays below the baseline by an estimated $13 billion in 1992, $22billion in 1993, $46 billion in 1994, and $62 billion in 1995. The re-quired outlay savings grow sharply in 1994, because baseline outlaysfor discretionary programs increase by $24 billion in line with infla-tion, while the outlay cap hardly rises at all. Although the statutorycaps do not extend beyond 1995, sticking to the caps through 1995 andallowing appropriations to grow at the rate of inflation thereafter will
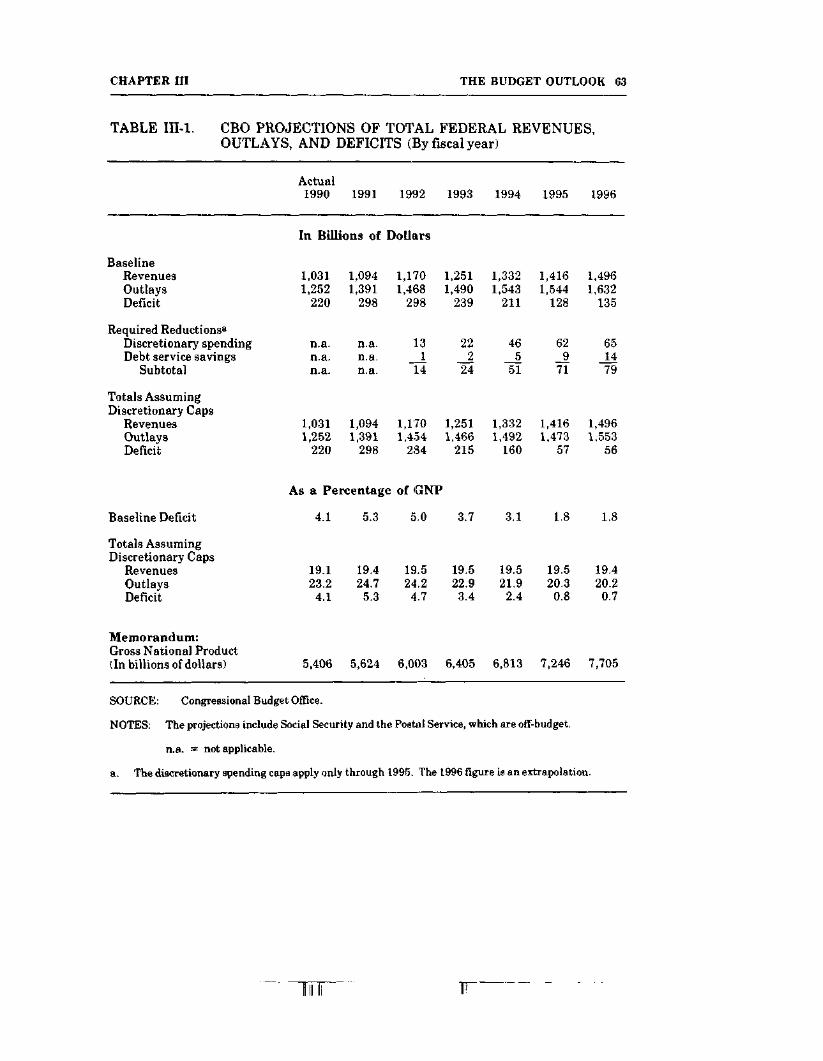
CHAPTER III THE BUDGET OUTLOOK 63
TABLE III-l. CBO PROJECTIONS OF TOTAL FEDERAL REVENUES,OUTLAYS, AND DEFICITS (By fiscal year)
Actual1990 1991 1992 1993 1994 1995 1996
BaselineRevenuesOutlaysDeficit
Required Reductions8
Discretionary spendingDebt service savings
Subtotal
Totals AssumingDiscretionary Caps
RevenuesOutlaysDeficit
In Billions of Dollars
1,0311,252220
n.a.n.a.n.a.
1,0941,391298
n.a.n.a.n.a.
1,1701,468298
13114
1,2511,490239
22224
1,3321,543211
46551
1,4161,544128
62971
1,4961,632135
651479
1,031 1,0941,252 1,391
220 298
1,1701,454
234
1,2511,466
215
1,3321,492
160
1,416 1,4961,473 1,553
57 56
Baseline Deficit
Totals AssumingDiscretionary Caps
RevenuesOutlaysDeficit
As a Percentage of GNP
4.1 5.3 5.0 3.7
19.1 19.4 19.5 19.523.2 24.7 24.2 22.9
4.1 5.3 4.7 3.4
3.1
19.521.9
2.4
1.8
19.520.3
0.8
19.420.2
0.7
Memorandum:Gross National Product(In billions of dollars) 5,406 5,624 6,003 6,405 6,813 7,246 7,705
SOURCE: Congressional Budget Office.
NOTES: The projections include Social Security and the Postal Service, which are off-budget.
n.a. = not applicable,
a. The discretionary spending caps apply only through 1995. The 1996 figure is an extrapolation.
nrr

Jill
64 THE ECONOMIC AND BUDGET OUTLOOK January 1991
TABLE III-2. CBO ESTIMATES OF DISCRETIONARY SPENDING CAPS(By fiscal year, in billions of dollars)
1991 1992 1993Budget
Authority OutlaysBudget
Authority OutlaysBudget
Authority Outlays
Defense
Cap as of January 30
CBO Baseline
Required Reductions
289.9289.2
n.a.
298.8
300.3
n.a.
291.3302.4
11.1
295.9304.5
8.6
291.5
315.1
23.6
292.5310.7
18.2
International
C ap as of January 30 20.1
Adjustment for SpecialBA Allowance n.a.
End-of-Session Cap 20.1CBO Baseline 20.1Required Reductions n.a.
18.7
n.a.18.7
18.7
n.a.
Domestic
20.0
1.221.2
20.80
18.9
0.6
19.4
19.50.1
20.9
1.2
22.1
21.30
19.7
0.8
20.520.4
0
Cap as of January 30
AdjustmentsSpecial BA allowanceIRS adjustment
End-of-Session Cap
CBO Baseline
Required Reductions
Cap as of January 30
End-of-Session Cap
CBO BaselineRequired Reductions
182.9
n.a.n.a.
182.9
188.9*
n.a.
492.9
492.9
498.2*
n.a.
198.3
n.a.n.a.
198.3197.1
n.a.
Total
515.8
515.8
516.1n.a.
197.2
1.50.2
198.9199.2
0.2
508.6
511.5522.4
11.3
207.5
0.80.2
208.5213.1
4.6
522.3
523.8537.1
13.3
204.7
1.50.2
206.4
205.7
0
517.1
520.0542.1
23.6
219.2
1.30.2
220.6
224.5
3.9
531.4
533.6555.622.1
SOURCE: Congressional Budget Office.
NOTES: BA = budget authority; IRS = Internal Revenue Service; n.a. = not applicable.
a. Baseline budget authority exceeds the cap in 1991 because of a redefinition of budget authority forcertain federal trust funds.

CHAPTER III THE BUDGET OUTLOOK 65
produce discretionary savings of about $65 billion in 1996 relative tothe baseline projections. In 1992 and 1993, three-quarters of the cumu-lative required outlay reductions are in the defense category, and asubstantial portion of the reductions in 1994 and 1995 are likely to bein defense as well. These spending reductions will also produce debtservice savings, which will reach $9 billion in 1995 and $14 billion in1996. Table III-2 shows CBO's current estimates of the discretionarycaps and the required reductions for 1992 and 1993, as described inChapter II and in CBO's sequestration preview report (Appendix A).
Assuming that discretionary spending is held to the caps, the 1992total deficit would be $284 billion, or 4.7 percent of GNP (see TableIII-l). The total deficit would fall to $215 billion (3.4 percent of GNP)in 1993 and $57 billion (0.8 percent of GNP) in 1995. The projecteddeficit drops only slightly in 1996, when $14 billion in spending reduc-tions and tax increases are scheduled to expire. Expiring revenue pro-visions of the Omnibus Budget Reconciliation Act of 1990 total $7 bil-lion, half of which stems from expiration of 2.5 cents per gallon of themotor fuels tax. Expiring spending provisions are worth another $7billion, including $3 billion in the Medicare program and $2 billionfrom lump-sum payments to federal retirees.
CHANGES IN THE OUTLOOK SINCE JULY
While the short-term budget outlook is considerably worse than whenCBO reported last July, the longer-run picture has improved. Thesechanges reflect the reconciliation and appropriation bills, which havereduced the deficit, and recent developments in the economy, depositinsurance, and elsewhere, which have increased it.
Policy Changes
CBO estimates that the policies in the budget agreement have reducedthe deficit by $33 billion in 1991, $69 billion in 1992, and $160 billionin 1995, compared with CBO's July baseline (see Table III-3). Over theentire 1991-1995 period, the package saves an estimated $482 billion-close to the target in the summit agreement. Excluding $59 billion in

66 THE ECONOMIC AND BUDGET OUTLOOK January 1991
debt service savings, 63 percent of the deficit reduction ($264 billion)derives from cutting outlays below baseline levels, and 37 percent($158 billion) stems from raising taxes.
Two-thirds of the five-year savings-$322 billion-has already beenput in place. This amount comprises $158 billion in tax revenue in-creases, $75 billion in reductions in entitlements and other mandatoryspending (including additional user fees), $46 billion in lower dis-cretionary spending, and $43 billion in reduced debt service costs. Theremaining $160 billion in deficit reduction is to be achieved by holdingdiscretionary appropriations to the specified limits ($144 billion inlower discretionary spending and $16 billion in resulting debt servicesavings).
TABLE III-3. EFFECTS OF RECENT POLICY CHANGES ON CBODEFICIT PROJECTIONS (By fiscal year, in billions of dollars)
1991 1992 1993
CumulativeFive-Year
1994 1995 Changes
Revenue Increases
Entitlements and OtherMandatory Spending
Enacted AppropriationsDefenseNondefense
Subtotal
Required Reductions in
-13
-9
-5
-33
-12
-14_8
-6
-32
-16
-2011-9
-37
-19
-2412
-12
-39
-19
-2613
-13
SOURCE: Congressional Budget Office.
NOTE: n.a. = not applicable.
-158
-75
-9145
-46
Discretionary Spending
Debt Service Savings
Total
n.a..
-1
-33
-13
-4
-69
-22
-10
-89
-46
-17
-131
-62
-27
-160
-144
-59
-482

CHAPTER III THE BUDGET OUTLOOK 67
The $158 billion in additional revenues includes the following big-ticket items:
o $41 billion from extending, raising, or imposing excise taxeson telephone service, tobacco, alcohol, certain luxury goods,and airline travel;
o $40 billion from income tax changes affecting high-incometaxpayers, including a 31 percent top tax bracket, a phase-out of personal exemptions, and a reduction in allowableitemized deductions;
o $27 billion from raising the cap on wages subject to the Medi-care payroll tax to $125,000;
o $25 billion from an additional 5-cents-per-gallon tax on gaso-line and other motor fuels;
o $9 billion from extending Social Security coverage to all stateand local government employees not covered by a public pen-sion plan; and
o $9 billion from a new requirement that income tax deduc-tions for certain acquisition expenses of insurance companiesbe spread over time and not completely taken in the firstyear.
Many other, smaller tax increases and decreases were also enacted.Increased appropriations for Internal Revenue Service enforcementactivities are estimated by CBO to produce an additional $4 billion inrevenues over the next five years. The revenue-losing provisions in-clude extension of the credits for research and experimentation and forinvestment in low-income housing, and new incentives for energy pro-duction.
TT"

68 THE ECONOMIC AND BUDGET OUTLOOK January 1991
The major cuts in entitlements and other mandatory spending are:
o $43 billion from Medicare, including $33 billion in lower re-imbursement payments to doctors and hospitals and $10 bil-lion in higher premiums and deductibles for program bene-ficiaries;
o $14 billion from eliminating the lump-sum payment optionfor most federal retirees and from other changes in federalemployee retirement and health benefits;
o $9 billion from administrative actions to increase deposit in-surance premiums for banks; and
o $4 billion from lower farm price support payments.
Other, smaller savings were achieved by reforming Stafford studentloans, Federal Housing Administration mortgage insurance programs,and veterans' benefits, and by imposing various user fees. The entitle-ment savings were partly offset by a $17 billion increase in spendingfor the earned income tax credit, a change designed to help lower-income workers pay for child care and health insurance.
The $46 billion in enacted savings from discretionary programscomprises a reduction of $91 billion in defense outlays and a $45 billionincrease in nondefense discretionary spending. An additional $144 bil-lion in discretionary spending reductions, mostly in national defense,remains to be made over the 1992-1995 period.
Economic Changes
CBO's short-run economic forecast and longer-term assumptionsincrease the projected deficit by $50 billion in 1991, $63 billion in 1992,and $79 billion in 1995 (see Table HI-4). As detailed in Chapter I,CBO's new forecast reflects significant signs of weakness that ap-peared in the economy after CBO completed its summer forecast inJune. The Iraqi invasion of Kuwait in early August has caused an in-
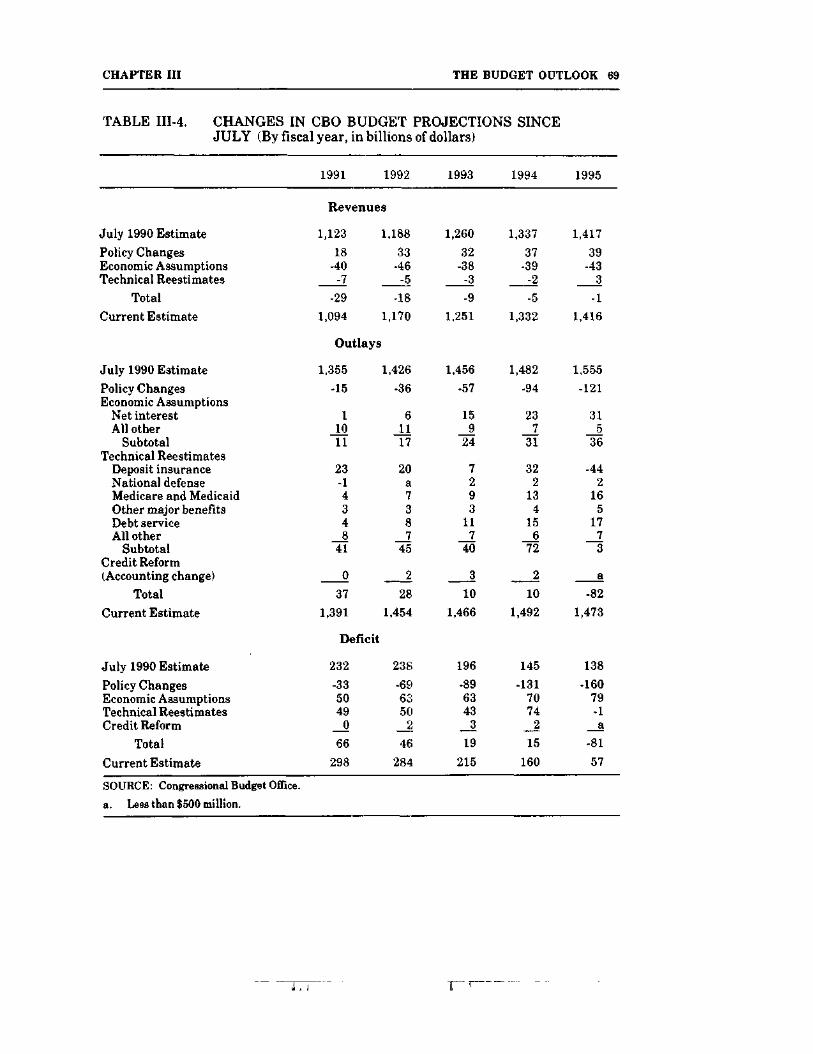
CHAPTER III THE BUDGET OUTLOOK 69
TABLE III-4. CHANGES IN CBO BUDGET PROJECTIONS SINCEJULY (By fiscal year, in billions of dollars)
1991 1992 1993 1994 1995
Revenues
July 1990 Estimate
Policy ChangesEconomic AssumptionsTechnical Reestimates
Total
Current Estimate
July 1990 Estimate
Policy ChangesEconomic Assumptions
Net interestAll other
SubtotalTechnical Reestimates
Deposit insuranceNational defenseMedicare and MedicaidOther major benefitsDebt serviceAll other
SubtotalCredit Reform(Accounting change)
Total
Current Estimate
July 1990 Estimate
Policy ChangesEconomic AssumptionsTechnical ReestimatesCredit Reform
Total
Current Estimate
SOURCE: Congressional Budget Office.
a. Less than $500 million.
1,123
18-40
-7-29
1,094
Outlays
1,355
-15
11011
23-14348
41
037
1,391
Deficit
232
-335049_066
298
1,18833
-46-5
-181,170
1,426
-36
61117
20a7387
45
2
281,454
238-696350_246
284
1,26032
-38-3-9
1,251
1,456-57
159
24
7293
117
40
310
1,466
196
-896343_319
215
1,337
37-39
-2-5
1,332
1,482-94
237
31
322
134
156
72
2
101,492
145
-1317074
_215
160
1,417
39-43
3-1
1,416
1,555-121
315
36
-442
165
1773
a-82
1,473
138-160
79-1a
-8157

L
70 THE ECONOMIC AND BUDGET OUTLOOK January 1991
crease in oil prices, which has boosted inflation in the short run. Inaddition, the revision of the national income and product accounts forthe past three years suggests that the economy's potential rate ofgrowth is lower than previously thought.
Taken together, these economic developments reduce projectedrevenues by about $40 billion per year. On the outlay side of theledger, spending is higher in the first few years of the projections forunemployment-sensitive programs, such as Unemployment Insurance,Food Stamps, and Medicaid. Higher inflation increases the 1991 and1992 cost-of-living adjustments for Social Security and other benefitprograms. Finally, increased federal borrowing requirements and, inthe longer run, higher interest rates boost debt service costs, byamounts growing from $1 billion in 1991 to $6 billion in 1992 and $31billion in 1995.
Technical Estimating Changes
Changes in technical estimating assumptions have increased the pro-jected deficits by an average of more than $50 billion per year in 1991through 1994, but have reduced the deficit slightly in 1995. This pat-tern mirrors the changes in deposit insurance estimates, which aver-age $20 billion higher in 1991 through 1994 but are $44 billion lowerin 1995. Significant changes have been made in the estimates for theFederal Savings and Loan Insurance Corporation (FSLIC) ResolutionFund (which is responsible for resolving thrift institutions sold orliquidated before March 1989), the Resolution Trust Corporation(RTC) and the Savings Association Insurance Fund (SAIF) (which areresponsible for other insolvent thrifts), and for the Bank InsuranceFund (BIF) (which insures commercial and savings banks).
The FSLIC Resolution Fund is projected to spend $7 billion morein 1991, compared with CBO's July baseline. CBO also assumes thatthe fund will repay $9 billion of interest-bearing notes in 1991 and $1billion in 1992, which will increase Treasury borrowing requirementsbut not outlays. These changes reflect the expected renegotiation ofcontracts with acquirers of failed thrifts. The new contracts will cut

CHAPTER III THE BUDGET OUTLOOK 71
the government's yield-maintenance and interest costs by $2 billionper year after 1991.
The Resolution Trust Corporation spent $10 billion more duringthe final months of fiscal year 1990 than CBO projected in July. Thissurge in spending suggests that ETC is resolving cases more quicklyand needs more working capital than previously thought. CBO is alsonow assuming that RTC will continue in business through 1995 andresolve cases that would otherwise have been left to SAIF. As a result,CBO has upped its estimates of RTC spending in 1991 through 1994,assuming that the Congress provides the necessary wherewithal, butreduced its estimate for 1995. CBO has not significantly changed itsestimates of total thrift losses or of the expected return on the assets offailed thrifts.
In contrast, the condition of the banking industry has clearly de-teriorated since last summer. Additional case resolution costs, onlypartly offset by assumed increases in bank insurance premiums, add$10 billion to the projected 1991 deficit and $4 billion in 1992. Outlaysof this size will render the Bank Insurance Fund insolvent by 1992,and the baseline assumes that BIF will borrow from the Federal Fi-nancing Bank to obtain working capital.
Faster growth in Medicare and Medicaid is projected to increasespending by $4 billion in 1991, $7 billion in 1992, and $16 billion in1995 over the July baseline. Debt service estimates have been raisedby $4 billion in 1991, $8 billion in 1992, and $17 billion in 1995 as aresult of the increases in spending for deposit insurance, Medicare andMedicaid, and other programs. The remaining technical reestimatesare spread over a wide variety of revenue sources and spending pro-grams.
MEASURING THE DEFICIT
As noted in Chapter II, the Budget Enforcement Act removed theincome and outgo of the two Social Security trust funds from thecalculation of the deficit targets. Excluding Social Security and thePostal Service (which was removed from the budget by the Omnibus
"T

L ILL
72 THE ECONOMIC AND BUDGET OUTLOOK January 1991
Budget Reconciliation Act of 1989), the on-budget deficit is projected torise from $277 billion in 1990 to $360 billion in 1991. Assuming ad-herence to the discretionary caps, the on-budget deficit would then fallto $354 billion in 1992, $294 billion in 1993, $258 billion in 1994, and$170 billion in 1995 (see Table III-5).
From the standpoint of economic policy, the on-budget deficit is notmeaningful. The annual flows in Social Security and the Postal Ser-vice affect economic activity and the allocation of resources in exactlythe same way as the flows in other government accounts. The totalgovernment deficit, including the Social Security and other trustfunds, determines the government's fiscal stance, its drain on creditmarkets, and the amount of saving it diverts from uses that promote
TABLE III-5. ALTERNATIVE MEASURES OF THE DEFICIT(By fiscal year, in billions of dollars)
Actual1990 1991 1992 1993 1994 1995 1996
Total Deficit AssumingDiscretionary Caps 220 298 284 215 160 57 56
Deficit ExcludingDeposit Insurance 162 194 186 167 135 103 99
On-Budget Deficit(Excluding Social Securityand Postal Service) 277 360 354 294 258 170 185
Memoranda:Deposit Insurance 58 103 98 48 25 -47 -42Off-Budget Surplus
Social Security 58 63 70 82 96 112 129Postal Service _^2 a a -2 1 1 a
Total 57 62 70 79 97 113 129
SOURCE: Congressional Budget Office,
a. Less than $500 million.

CHAPTER III THE BUDGET OUTLOOK 73
growth in living standards. For this reason, most tables in this volumedisplay figures for total revenues, outlays, and the deficit.
As was discussed in Chapter I, year-to-year swings in federal de-posit insurance spending, unlike Social Security, do not representchanges in the federal government's effect on the economy. Federalspending to insure deposits at banks, thrift institutions, and creditunions is projected to rise from $58 billion in 1990 to $103 billion in1991, drop sharply in 1993, and turn negative in 1995 (see Table III-5).Most of this spending is required to close or subsidize the sale ofhundreds of insolvent thrift institutions. Although financing the thriftbailout will add substantially to federal borrowing requirements in thenext few years, this borrowing does not put much additional pressureon interest rates. The money that the government borrows to resolveinsolvent thrifts and banks (less the administrative and interest costs)is returned to financial markets. The money is redeposited in new ac-counts or invested directly in income-earning assets. Excluding de-posit insurance, the federal deficit is projected to rise from $162 billionin 1990 to $194 billion in 1991 and to decline slowly thereafter. In re-lation to the size of the economy, the deficit excluding deposit insur-ance declines from 3.5 percent of GNP in 1991 to 1.3 percent of GNP in1996.
In addition to the two Social Security trust funds, the federal bud-get contains more than 150 other trust funds. These include trustfunds for Medicare, federal civilian and military retirement, unem-ployment insurance, highways, and airports. Federal trust funds serveprimarily as a bookkeeping tool for recording earmarked income andspending. In the aggregate, income credited to trust funds is projectedto exceed trust fund outlays by $120 billion in 1991. The projectedtrust fund surplus, as conventionally measured, swells to $201 billionby 1996, with Social Security accounting for almost two-thirds of thetotal (see Table III-6).
The conventional measure of the trust fund surplus, however, ig-nores the fact that there are large transfers of money from the budget'sgeneral fund to the trust funds. Such transfers boost the trust fundsurplus and the deficit in the remainder of the budget (known as thefederal funds deficit) by equal amounts; they do not affect the total
T7

74 THE ECONOMIC AND BUDGET OUTLOOK January 1991
federal deficit or federal borrowing requirements by one penny. Thelargest of these intrabudgetary transfers are interest paid to trustfunds, the government's contributions as employer to the retirementtrust funds, and the general-fund subsidy for Supplementary MedicalInsurance (Part B of Medicare). Transfers from the general fund to
TABLE III-6. CBO PROJECTIONS OF TRUST FUND SURPLUSES(By fiscal year, in billions of dollars)
Trust Fund 1991 1992 1993 1994 1995 1996
Social SecurityMedicareMilitary Retirement3
Civilian Retirement11
UnemploymentHighway and AirportOther
63161423-243
70161225
341
82181327
641
96171329
742
112151431842
129111430
952
Total Trust Fund Surplusc 120 131 151 169 186 201
Federal Funds Deficit* -418 -415 -365 -329 -243 -257
Total Deficit -298 -284 -215 -160 -57 -56
Memoranda:Trust Fund Deficit ExcludingTransfers from General Fund -59 -59 -58 -60 -65 -75
Federal Funds Deficit ExcludingTransfers to Trust Funds -239 -225 -157 -100 8 19
SOURCE: Congressional Budget Office.
a. Civil Service Retirement, Foreign Service Retirement, and several smaller funds.
b. Primarily Railroad Retirement, employees' health insurance and life insurance, HazardousSubstance Superfund, and various veterans' insurance trust funds.
c. Assumes that discretionary spending red actions are made in non-trust-fund programs.
CHAPTER III THE BUDGET OUTLOOK 75
trust funds are projected to grow from $179 billion in 1991 to $276billion in 1996. Without them, trust funds in the aggregate wouldexhibit deficits, not surpluses, as Table III-6 shows.
THE ECONOMY AND THE BUDGET
The federal budget is highly sensitive to the economy. Revenues de-pend largely on wages and salaries, corporate profits, and other tax-able incomes. Many benefits are pegged directly or indirectly to in-flation, while others respond to the unemployment rate. And the costsof servicing the government's large and growing debt depends on in-terest rates.
One popular way to highlight the effects of economic performanceon the budget focuses on four key variables: real economic growth,unemployment, inflation, and interest rates. Table III-7 shows theestimated changes in budget totals if any of these variables were todiffer from CBO's baseline assumptions by one percentage point be-ginning in January 1991. Such simplified illustrations are commonlycalled rules of thumb.
Real Growth
Real growth has powerful effects on the federal budget, chiefly on fed-eral government revenues and on interest costs. The baseline assumesthat, after 1991's recession, real growth returns to a rate averagingnearly 3 percent in 1992 through 1996. The first rule of thumb knocksa percentage point from these assumed growth rates, postulating adeeper recession in 1991 and pallid growth of about 2 percent a yearthereafter. After five years, real and nominal GNP are more than 5percent below baseline levels.
Revenue losses, reflecting lower nominal income, climb from $7billion in 1991 to $103 billion in 1996. As sluggish growth persists, theunemployment rate rises, and spending for unemployment compensa-tion and a few other benefit programs mounts. But more striking is theeffect on net interest, as higher borrowing drives up debt service costs.
38-033 0 - 91 — 4 : QL 3

76 THE ECONOMIC AND BUDGET OUTLOOK January 1991
By 1996, the deficit would be higher by $134 billion. Because rules ofthumb show the effect of economic variables in isolation, this exampleassumes that inflation and interest rates do not deviate from theirbaseline paths even as real growth falters.
TABLE III-7. EFFECTS ON CBO BUDGET PROJECTIONSOF SELECTED CHANGES IN ECONOMIC ASSUMPTIONS(By fiscal year, in billions of dollars)
1991 1992 1993 1994 1995 1996
Real Growth: Effect of One-Percentage-PointLower Annual Rate Beginning January 1991
Change in Revenues -7 -23 -40 -60 -80 -103Change in Outlays 1 4 8 14 21 31Change in Deficit 8 26 48 74 102 134
Unemployment: Effect of One-Percentage-PointHigher Annual Rate Beginning January 1991
Change in Revenues -28 -42 -43 -44 -46 -47Change in Outlays 5 8 12 16 21 25Change in Deficit 33 49 55 61 66 73
Inflation: Effect of One-Percentage-PointHigher Annual Rate Beginning January 1991
Change in Revenues 6 17 30 45 61 78Change in Outlays 5 18 30 43 57 71Change in Deficit -1 a -1 -2 -4 -7
Interest Rates: Effect of One-Percentage-PointHigher Annual Rates Beginning January 1991
Change in RevenuesChange in OutlaysChange in Deficit
055
01515
02222
02828
03333
03737
SOURCE: Congressional Budget Office,
a. Less than $500 million.

CHAPTER III THE BUDGET OUTLOOK 77
Unemployment
As the first example makes clear, real growth and unemployment areintertwined. The second rule of thumb depicts the budgetary effects ofa one-percentage-point increase in the unemployment rate. In theCBO baseline forecast, the unemployment rate averages 6.8 percent in1991, falling gradually to 5.6 percent by 1996. By contrast, theunemployment rate in this second rule of thumb averages 7.8 percentin 1991 and 6.6 percent in 1996.
A sharp rise in the unemployment rate would be accompanied by adrop in economic output. Okun's law, a generalization well known toeconomists, links a percentage-point rise in the unemployment rate toa reduction of about 2-j percentage points in GNP. The budgetary ef-fects mirror those of the first example: revenues are lower, benefit out-lays and debt service costs higher. In the short run, the economic slow-down is more drastic and the budget effects more severe. But the gapin economic output remains stuck at 2 j percent, instead of growingworse and worse as in the first rule of thumb. The longer-term bud-getary effects are therefore not as enormous as in the first example,boosting the deficit by $73 billion in 1996.
Inflation
The third rule of thumb shows the estimated budgetary impacts of aninflation rate that is one percentage point higher than the baseline in1991 through 1996. Thus, the growth in the overall GNP deflator isabout 5 percent in 1991 (instead of 4.3 percent), tapering off to 4.5 per-cent (instead of 3.5 percent) by 1996. Other measures of inflation, suchas consumer prices, behave similarly. Real growth is held to its base-line path. And finally, nominal interest rates are assumed to rise byone percentage point as well, leaving real interest rates unchanged.
Given these assumptions, higher inflation would have only a neg-ligible effect on the government's total deficit. Revenues climb with in-flation, despite indexation of the income tax, as taxpayers receivehigher wages and salaries, profits, and other incomes. But as revenuesgrow with inflation, so do federal government outlays, though with
;j
78 THE ECONOMIC AND BUDGET OUTLOOK January 1991
varying lags. Almost all benefit programs (which make up about 40percent of federal spending) pay explicit cost-of-living adjustments orotherwise respond automatically to inflation. In the next few years,discretionary programs are governed by dollar caps, which are ad-justed for inflation with a two-year lag. Finally, net interest spendingwould rise in response to higher interest rates.
Interest Rates
The Treasury must finance and refinance the growing federal debt atprevailing market rates. The fourth rule of thumb depicts the budget'ssensitivity to an increase of one percentage point in interest rates. Asshown in Table III-7, such an increase in the interest rate for allTreasury maturities would raise estimated outlays by $5 billion in1991 and by $37 billion in 1996. By the final year, nearly the entiredebt bears the higher interest rates: of the marketable debt projected tobe outstanding at the end of 1996, only one-sixth is neither originallyfinanced nor refinanced during the 1991-1996 period. In addition tonet interest, these estimates incorporate small changes in severalother interest-sensitive programs (chiefly Stafford student loans). Be-cause the effects are unclear, this rule of thumb includes no estimatesof whether and how much tax revenues or deposit insurance spendingmight respond to a sharp up tick in interest rates.
While rules of thumb clearly show the link between economic per-formance and budget outcomes, they have their limitations. Errors ofone percentage point are used for simplicity; they do not representtypical forecasting errors. Some economic variables (for example, in-terest rates) are notoriously harder to predict than others. Most im-portant, economic variables are related to one another, and sustainedchanges in one rarely occur in isolation. The war in the Persian Gulfand the reaction to it, for example, will doubtless affect oil prices, in-terest rates, stock prices, consumer sentiment, and a host of other fac-tors, but in complex and unforeseeable ways.
CHAPTER IV
THE OUTLOOK FOR FEDERAL SPENDING
In fiscal year 1991, federal spending is expected to approach $1.4 tril-lion, about 24.7 percent of gross national product (GNP)--a post-WorldWar II record. But 1991 spending will be ballooned by several tempo-rary factors: by the recession, which will drive up spending on benefitprograms; and by the continuing hemorrhage of spending for depositinsurance, projected to top $100 billion this year. Not reflected in theseestimates, but sure to add even more spending in 1991, are the extracosts associated with U.S. operations in the Persian Gulf region (whichremain highly uncertain). More normal patterns should reassertthemselves in the next five years. By 1993, if the spending caps in theBudget Enforcement Act are complied with, federal spending shouldslip back to 23.3 percent of GNP; and by 1996, it should be just above21 percent of GNP—the lowest percentage in nearly two decades.
This chapter summarizes the outlook for federal governmentspending. It surveys the outlook for three broad clusters of spendingthat, under the Budget Enforcement Act, will be addressed in sharplydifferent ways in the next five years: discretionary spending, manda-tory spending, and net interest. The first cluster encompasses CBO'straditional categories of defense and nondefense discretionary pro-grams--that is, activities that are controlled through the annual appro-priation process. In the next five years, dollar caps will set a lid onspending for these programs. The second cluster includes entitlementprograms such as Social Security and Medicare, along with offsettingreceipts such as fees. Dollar caps do not hold sway within this cluster;but these programs are linked with federal government revenues in apay-as-you-go regime, requiring that actions affecting them be, atworst, deficit neutral. Implicitly, the act forbids the Congress fromcrossing these boundaries-from cutting entitlement programs, forexample, in order to fund increases in discretionary spending.
80 THE ECONOMIC AND BUDGET OUTLOOK January 1991
Deposit insurance represents a huge and volatile category of man-datory spending, and gets separate treatment under the Budget En-forcement Act; the chapter pays special attention to this timely topic.Finally, the chapter briefly summarizes the effect of one of the bud-getary innovations mandated in the Budget Enforcement Act, creditreform.
Throughout this chapter, projected trends in federal spending arecompared and contrasted with patterns over the last few decades. Fig-ure IV-1 shows how the major clusters of federal spending have swollenor shrunk, relative to GNP, since the early 1960s. And Appendix Dlists the detailed data that underlie this historical perspective.
DISCRETIONARY PROGRAMS AND THE CAPS
Together, defense and nondefense discretionary programs make uproughly 40 percent of federal outlays—a much smaller share than theleading category, entitlements and mandatory spending. Each year,the Congress must decide how much budget authority (that is, author-ity to commit money) to parcel out among these programs. This budgetauthority ultimately translates into outlays, often with a lag in pro-grams that involve long planning horizons.
Because these programs require annual appropriations, budgetestimators must assume something about their course after the cur-rent year. Traditionally, attention has focused on baseline projections.Under baseline assumptions, budget authority (the engine that drivesthese programs) is adjusted annually for inflation. But the BudgetEnforcement Act set multiyear caps for these programs that will con-strain them, in the aggregate, from growing as rapidly as projected in-flation. Through 1993, separate caps apply to defense, internationaldiscretionary, and domestic discretionary spending. In 1994 and 1995,a single cap constrains all three categories combined (see Figure IV-2).
If the caps are complied w ith, defense and nondefense discretion-ary programs combined would equal $521 billion in 1991 and $526 bil-lion in 1992, growing slowly to $560 billion in 1996 (see Table IV-1).

CHAPTER IV THE OUTLOOK FOR FEDERAL SPENDING 81
Figure IV-1.Outlays by Category as Shares of GNP
National Defense9
Percentage of GNP14
'12
'10
8
6
4
2
Nondefense DiscretionarySpending3
Percentage of GNP
Actual
J I
Proj.
1970 1980 1990 1960 1970 1980 1990
Entitlements and OtherMandatory Spending
14
12
10
8
6
4
2
Percentage of GNP
Total
rExcludingDepositInsurance
Actual
I I I
Proj.
14
Net Interest
Percentage of GNP
12 -
10
8
6
4
2
J I
Actual
J I
Proj.
1960 1970 1980 1990 1960 1970 1980 1990
SOURCE: Congressional Budget Office.
a. Assumes compliance with discretionary spending caps in the Budget Enforcement Act. Caps arenot specified in detail after 1993.

JJ
82 THE ECONOMIC AND BUDGET OUTLOOK January 1991
TABLE IV-1. OUTLAYS BY CATEGORY, ASSUMING COMPLIANCEWITH DISCRETIONARY SPENDING CAPS (By fiscal year)
Spending CategoryActual1990 1991 1992 1993 1994 1995 1996
National Defense8
International DiscretionaryDomestic Discretionary0
Subtotal
Entitlements and Other MandatorySpending, Excluding DepositInsurance
Deposit InsuranceOffsetting Receipts
Net Interest
TotalOn-budgetOff-budget*
In Billions of Dollars
29919
186505
562
58
-57
184
29919
203521
632
103
-63
198
1,252 1,3911,027 1,154
225 237
29519
211526
29220
223536
bb
_b536
bb
_b541
bb
_b560
687
98
-63
207
1,4541,205249
731
48
-67
219
1,4661,204262
776
25
-71
227
1,4921,224268
824
-47
-76
230
1,4731,196277
881
-42
-79
233
1,5531,266287
As a Percentage of GNP
National Defense8
International DiscretionaryDomestic Discretionary0
Subtotal
Entitlements and Other MandatorySpending, Excluding DepositInsurance
Deposit InsuranceOffsetting Receipts
Net Interest
TotalOn-budgetOff-budget*
5.50.43.49.3
10.4
1.1
-1.1
3.4
23.219.04.2
5.30.33.69.3
11.2
1.8
-1.1
3.5
24.720.5
4.2
4.90.33.58.8
11.4
1.6
-1.1
3.4
24.220.14.1
4.60.33.58.4
11.4
0.7
-1.0
3.4
22.918.84.1
bbb
7.9
11.4
0.4
-1.0
3.3
21.918.03.9
bbb
7.5
11.4
-0.6
-1.0
3.2
20.316.53.8
bbb
7.3
11.4
-0.6
-1.0
3.0
20.216.43.7
SOURCE: Congressional Budget Office.
a. Almost all national defense outlays are discretionary. For simplicity these figures include small amounts ofdefense offsetting receipts and mandatory spending (totaling about -$500 million to -$700 million annually) that lieoutaide the jurisdiction of the Appropriations Committees and are not subject to the cap.
b. Discretionary spending caps are specified by category through 1993 and in the aggregate for later years. Projectionsfor 1996 represent a CBO extrapolation.
c. Includes $2 billion to $3 billion in administrative costs of Social Security, which (in CBO's view) are not subject tothe discretionary spending cap. The Office of Management and Budget disputes this view
d Social Security and Postal Service.

CHAPTER IV THE OUTLOOK FOR FEDERAL SPENDING 83
These totals slightly exceed the dollar caps cited in Chapter III, pri-marily because a small amount of discretionary spending—the ad-ministrative expenses of Social Security-is, in CBO's view, exemptfrom the caps because of the program's off-budget status. Within thesetotals, defense is held to a virtual dollar freeze in 1991 through 1993(excluding any extra costs associated with Operations Desert Shieldand Desert Storm), while domestic programs are allowed modestgrowth. The composition of the totals after 1993 is unspecified. Be-cause the nation's economic growth is expected to outpace the caps, dis-cretionary programs should shrink as a share of GNP-from about 9.3percent at present to 7.3 percent of GNP by 1996.
Figure IV-2.Discretionary Outlays for 1990-1996, AssumingCompliance with Spending Caps
600
500 -
Billions of Dollars
Defense
InternationalDiscretionary
DomesticDiscretionary
Total(Effectiveafter 1993)
1990 1991 1992 1993 1994 1995 1996
SOURCE: Congressional Budget Office.
~rrr

84 THE ECONOMIC AND BUDGET OUTLOOK January 1991
National Defense
The defense budget has been on a downward path since 1986, after thebuildup of the early 1980s. The 1991 defense budget is no exception:total defense budget authority enacted by the Congress for 1991 wasdown about 4 percent from 1990, and about eight percentage points shyof what would be required merely to compensate for inflation. Thisdefense budget authority reflected a scant $1 billion in funding forOperation Desert Shield, in anticipation that supplemental legislationwould be passed later under the emergency procedures of the BudgetEnforcement Act.
As Table IV-1 shows, defense outlays should shrink slightly inboth 1992 and 1993, assuming compliance with the spending caps.After 1993, defense vies with nondefense programs for a share of thetotal discretionary pie. Because the total cap grows only modestlyafter 1993, the defense budget is likely to face continued cost-cuttingpressures.
The defense budget is overwhelmingly discretionary in nature,that is, dependent on funding decisions by the Appropriations Com-mittees. The defense totals, though, also reflect a few offsetting re-ceipts and one small mandatory item, which lie outside the appro-priators' control. For simplicity, these items (which sum to about -$500million, a tiny fraction of the defense budget) are combined with thedefense totals in Table IV-1. A brand-new classification dilemmaarrived in 1991 with the receipt of billions of dollars in allied contribu-tions to help support U.S. operations in the Persian Gulf (as discussedbelow). CBO has included these receipts in the defense function, off-setting the spending that they help to finance.
Defense represents about 5.3 percent of GNP today, a relativelylow ratio by the standards of the last three decades except during theimmediate post-Vietnam era (see Figure IV-1). With the caps, thedefense share of GNP drifts down further, sinking to about 4.6 percentin 1993 (a level not witnessed since 1948). The downward trend willalmost certainly continue after 1993. But statistics on defense as ashare of GNP must be interpreted carefully. At best, they are a clue tothe relative burden of defense spending in different periods or in dif-

CHAPTER IV THE OUTLOOK FOR FEDERAL SPENDING 85
ferent countries. They do not measure the adequacy of the nation's de-fense, an intangible concept that embraces the size and quality offorces and the nature of potential threats. Furthermore, expressingdefense as a share of GNP may inadvertently imply that the real re-sources devoted to defense should inexorably keep growing as thecountry grows richer. Some observers prefer an alternative focus,simply analyzing the dollars provided to defense. Figure IV-3 depictsdefense budget authority and outlays in dollar terms, before and afteradjustment for inflation, since the end of World War II. It shows thatcurrent levels of real defense spending are roughly comparable withthose of the 1960s before the Vietnam buildup, and above the levels ofthe peacetime 1970s (a period that many analysts felt shortchangedthe defense budget). But like comparisons with GNP, such analysesreveal little about the adequacy or inadequacy of the nation's defenses.
The deployment and involvement of United States troops andequipment in the Persian Gulf region is deemed an emergency underthe budget summit agreement, and thus is expected to be funded by asupplemental appropriation. Such a supplemental would neither vio-late the spending caps nor require offsetting reductions elsewhere inthe budget, though of course it would boost the budget deficit.
At this time, no supplemental appropriation is in place for 1991.The 1991 baseline estimates, then, contain only limited and carefullycircumscribed funding for Operations Desert Shield and Desert Storm.The projections reflect only about $7.5 billion in costs—exactly theamount shown as allied contributions, and therefore having no net ef-fect on defense outlays or the deficit. (The extra spending is includedin the 1991 figures solely to make the budget estimates more realistic.Because the spending has not actually been appropriated, it does notenter into the baseline for 1992-1996 projections.) The Defense De-partment figured the cost of the initial 200,000-troop deployment at$15 billion and estimated that allied contributions would cover rough-ly half, providing the basis for CBO's $7.5 billion estimate. But espe-cially with the advent of combat, costs and contributions are likely tobe quite different from this estimate.
TT

86 THE ECONOMIC AND BUDGET OUTLOOK January 1991
Figure IV-3.Defense Budget Authority and Outlays, 1946-1993
400
300
200
100
In Billions of Current Dollars
Actual I Proj.
I
1945 1955 1965 1975 1985 1995
In Billions of Constant (1991) Dollars
1945 1955 1965 1975 1985 1995
SOURCE: Congressional Budget Office.
NOTE: Projections assume compliance with discretionary spending caps.

CHAPTER IV THE OUTLOOK FOR FEDERAL SPENDING 87
U.S. troops deployed in the Persian Gulf region currently totalabout 450,000, and their activities pose substantial—but uncertain--costs. Of course, many of the costs of maintaining the troops and equip-ment would be incurred no matter where they were stationed. Thus, acritical question is the incremental budgetary costs associated with thebuildup and conflict-costs that are easier to define than to measure.The range of possible costs is extremely wide, reflecting uncertaintyabout many factors: intensity and duration of the conflict; rotationpolicies for troops and equipment; the need to construct facilities; theneed to delay planned reductions in personnel; possible replacement ofweapons and supplies consumed in the conflict; the continuing role ofthe United States in the region after the conflict; and so forth. C A moredetailed discussion of these issues can be found in a CBO staff mem-orandum, "Costs of Operation Desert Shield," January 15, 1991 ) Theresource costs of the conflict can be far higher than the budgetary costs,if stockpiles are drawn down and not replaced, and if substantial por-tions of the costs are defrayed by in-kind assistance from U.S. allies,such as the fuel that is supplied directly by Saudi Arabia,
Nondefense Discretionary Spending
Nondefense discretionary spending covers a vast array of federal gov-ernment activities: foreign aid, space and science, transportation, theenvironment, social services and education, subsidized housing, veterans' medical care, and general government and judicial functionsAbout a fifth of the total represents pay and benefits for federal em-ployees, and a third goes to state and local governments in the form ofgrants-in-aid.
In the aggregate, nondefense discretionary spending has shrunk inimportance; today, it is about 4 percent of GNP, roughly two-thirds thesize of peaks attained in the period of the mid-1970s through 1981 (seeFigure IV-1). Particular clusters have exhibited distinct peaks andvalleys in the past. Funding for international discretionary programs(essentially, foreign military and humanitarian aid) has shrunk fairlysteadily as a share of GNP in the last three decades, amounting toabout 0.3 percent of GNP today as against more than 1 percent in the

LLL_
88 THE ECONOMIC AND BUDGET OUTLOOK January 1991
early 1960s. The space program was in vogue in the 1960s, as thenation sought to land astronauts on the moon, while the 1970s wit-nessed sharply higher spending on education and social programs, andto a smaller extent, on energy and the environment. Nearly all non-defense discretionary programs shared in the post-1981 decline. Theseprograms' share of GNP bottomed out at 3.7 percent in 1987 through1989. Recent years' appropriations have tended to boost the budgetauthority for nondefense discretionary programs.
Over the next few years, nondefense discretionary spending will begoverned by the caps spelled out in the Budget Enforcement Act.Through 1993, the caps split nondefense discretionary spending intotwo clusters: domestic appropriations, and the (far smaller) inter-national discretionary category. In the aggregate, budget authority forboth categories can keep pace with inflation through 1993, althoughthe Congress will likely have to move small amounts of money fromfast- to slow-spending programs in order to satisfy the outlay caps. Theseparate caps end after 1993, when these programs will be subject to asingle cap together with the defense budget (see Figure IV-2).
Future pay raises for federal civilian employees must be accom-modated within the spending caps. Last fall's pay reform legislationcalls for annual, across-the-board pay raises roughly matching pri-vate-sector wage growth, as well as special raises for civil servants ingeographic areas where federal pay has fallen farthest behind privatesalaries. Box IV-1 discusses this legislation in greater detail.
Nondefense discretionary spending also encompasses many fed-eral credit programs, in which the government lends money directly toborrowers or guarantees loans made by private lenders. The BudgetEnforcement Act requires a change in the accounting of credit pro-grams so as to express costs in terms of the long-run subsidies grantedrather than in terms of cash flows. Credit reform is further discussedat the end of this chapter. The reform is purely an accounting change;the loan programs themselves remain unchanged, and borrowers willbe unaware of the shift. However, the transition to a new accountingsystem will create an unavoidable discontinuity in budget data forthese programs. Because credit reform (as explained below) removes

CHAPTER IV THE OUTLOOK FOR FEDERAL SPENDING 89
BOX IV-1Federal Pay Reform and the Baseline
Currently, about one-fifth of nondefense discretionary spending goes toward pay andbenefits for employees of civilian government agencies. And about one out of everyeight defense dollars finances the analogous costs for civilian employees of theDefense Department. The Federal Employees Pay Comparability Act of 1990addressed a number of long-standing issues in the policies governing federal civilianpay. Many studies have shown that federal jobs, on average, carry lower salariesthan private-sector jobs involving similar qualifications and responsibilities.Estimates of the gap vary. The Bureau of Labor Statistics has estimated the gap at30 percent; the Congressional Budget Office, relying on data commissioned by theOffice of Personnel Management, has used a figure of 20 percent. Another issue hasconcerned the use of a single nationwide pay scale. Critics argued that a single scalefor civil servants made little sense, causing major recruitment and retentionproblems in high-wage areas (and overpayment in low-wage areas).
Despite these concerns, pay raises in the past few years have been modest, paidacross the board to all workers, and have been intimately bound up in the annualbudget and appropriation process. Since fiscal year 1982, annual civilian pay raiseshave ranged from zero to 4.8 percent, and averaged 3.3 percent.
The new law provides for two main types of pay adjustment for federal white-collar workers. Starting in January 1992, annual across-the-board adjustments forall workers will be pegged to growth in the employment cost index (ECI). The fullamount will be paid in 1992 and 1993; thereafter, the annual adjustment will equalthe growth in the ECI less one-half of one percentage point. And starting in January1994, locality-based adjustments in selected areas are intended to gradually close thegap between federal and nonfederal salaries. Ultimately, the law calls for the gap toshrink to 5 percent or less. In 1994, raises will equal 20 percent of the requiredamount; and a further raise equal to 10 percent of the required amount is due in eachsubsequent year. Where, and how large, these local adjustments will be will hinge ona survey that the Bureau of Labor Statistics (BLS) is ordered to conduct. The Presi-dent has authority to reduce both the across-the-board and locality adjustments inthe event of war, recession, or adverse economic conditions.
The locality-based adjustments may involve fairly large costs when they beginto take effect. Using the minimum phase-in rates specified in the law, CBO esti-mates that the raises will add about $1| billion in fiscal year 1994 and $2$ billion in1995. In fiscal year 2002, when they are fully phased in, the cost will be slightly over$10 billion a year. And if the BLS estimate of the gap exceeds CBO's assumption,costs would be higher.
Both the across-the-board and the locality-based pay increases must be accom-modated within the discretionary spending caps. The Budget Enforcement Act listsseveral allowable adjustments in the discretionary spending caps, but pay reform isnot among them.

UJ
90 THE ECONOMIC AND BUDGET OUTLOOK January 1991
some spending from the discretionary category starting in 1992, itslightly distorts the apparent growth rate between 1991 and 1992.
MANDATORY SPENDING AND THEPAY-AS-YOU-GO RULES
Entitlement and other mandatory spending and offsetting receiptshave always been controlled in a different manner from discretionaryspending. The Budget Enforcement Act collectively terms these man-datory programs and subjects them to an entirely new set of trade-offs.Unlike discretionary spending, mandatory programs will not facedollar caps. But the new rules effectively bar actions affecting theseprograms from adding to the deficit. In gauging deficit neutrality,mandatory programs are paired with federal government revenues.The act thus states that expansions in mandatory spending may be fi-nanced by tax increases, or tax cuts may be financed by savings inmandatory programs-a rule that was quickly dubbed the pay-as-you-go constraint. As Chapter II explains, the rule is enforced by tallyingup the aggregate effects of new legislation at the end of a Congres-sional session.
Entitlements and Other Mandatory Programs
Roughly half of all federal spending is devoted to entitlements andother mandatory programs. Led by retirement and health care pro-grams, they have also been a fast-growing category, doubling in sizerelative to GNP since the early 1960s (see Figure IV-1). Most of thisjump had occurred by 1975. Alone among major categories of spend-ing, they tend to keep pace with GNP in the budget projections, oncehighly volatile outlays for deposit insurance are excluded from theanalysis. Table IV-2 depicts this huge category in greater detail.
The common thread shared by all entitlement and mandatory pro-grams is their method of control. The Congress controls spending forthese programs indirectly, by setting terms and conditions (eligibility
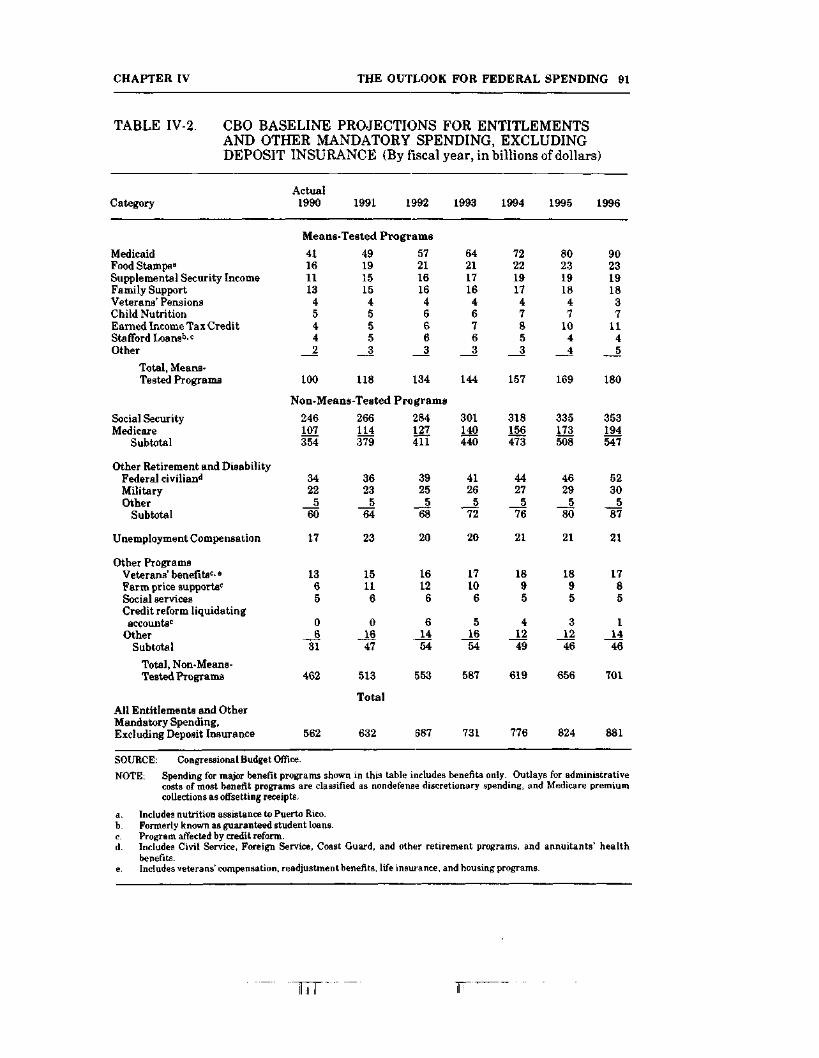
CHAPTER IV THE OUTLOOK FOR FEDERAL SPENDING 91
TABLE IV-2. CBO BASELINE PROJECTIONS FOR ENTITLEMENTSAND OTHER MANDATORY SPENDING, EXCLUDINGDEPOSIT INSURANCE (By fiscal year, in billions of dollars)
CategoryActual1990 1991 1992 1993 1994 1995 1996
Means-Tested Programs
MedicaidFood Stamps*Supplemental Security IncomeFamily SupportVeterans' PenaionaChild NutritionEarned Income Tax CreditStafford Loanab.c
Other
Total, Means-Tested Programs
4116111345442
100
4919151545553
118
5721161646663
134
6421171646763
144
7222191747853
157
8023191847
1044
169
9023191837
1145
180
Non-Means-Tested Programs
Social SecurityMedicare
Subtotal
246107354
266114379
284127411
301140440
318156473
335173508
353194547
Other Retirement and DisabilityFederal civilian-1 34 36 39 41 44 46 52Military 22 23 25 26 27 29 30Other 5 5 5 5 5 5 5
Subtotal 60 64 68 72 76 80 87
Unemployment Compensation 17 23 20 20 21 21 21
Other ProgramsVeterans' benefits'." 13 15 16 17 18 18 17Farm price supports0 6 11 12 10 9 9 8Social services 5 6 6 6 5 5 5Credit reform liquidatingaccounts': 0 0 6 5 4 3 1
Other 6 16 14 16 12 12 14Subtotal 31 47 54 54 49 46 46
Total, Non-Means-Tested Programs 462 513 553 587 619 656 701
TotalAll Entitlements and OtherMandatory Spending,Excluding Deposit Insurance 562 632 687 731 776 824 881
SOURCE: Congressional Budget Office.
NOTE: Spending for major benefit programs shown in this table includes benefits only. Outlays for administrativecosts of most benefit programs are classified as nondefense discretionary spending, and Medicare premiumcollections as offsetting receipts.
a. Includes nutrition assistance to Puerto Rico.b. Formerly known as guaranteed student loans.c. Program affected by credit reform.d. Includes Civil Service, Foreign Service, Coast Guard, and other retirement programs, and annuitants' health
benefits.e. Includes veterans' compensation, readjustment benefits, life insurance, and housing programs.

IL
92 THE ECONOMIC AND BUDGET OUTLOOK January 1991
requirements, benefit formulas, and so forth), rather than directlythrough the appropriation process. Payments are then available toanyone who meets the eligibility rules and seeks funds.
Means-Tested Programs. Means-tested programs-roughly, what mostpeople mean by "welfare programs"—are only about a fifth of entitle-ment and mandatory spending. To qualify, recipients must fall belowincome cutoffs and often must satisfy other criteria such as age orfamily status. Means-tested entitlements are dominated by the bur-geoning Medicaid program, a joint federal/state program. Medicaidoutlays in the baseline soar from $49 billion in 1991 to $90 billion in1996. (At the same time, state and local outlays for Medicaid are pro-jected to climb from $39 billion to $71 billion, evidence of the strainthat the program places on these governments.) Last fall, the Congresschanged Medicaid in several ways, principally by requiring states toextend coverage to all children under the poverty level by 2002, andfound roughly offsetting savings (in the early years) by requiringpharmaceutical discounts.
The reconciliation act also contained a major increase in theearned income tax credit (EITC). The EITC, part of the personalincome tax system, provides refundable credits to low-income workerswith children. EITC payments to families who owe no taxes, or whosecredit exceeds their tax liability, are treated as a budget outlay be-cause they are tantamount to direct benefit payments. Last fall'slegislation also achieved savings in the Stafford loan program (form-erly known as guaranteed student loans) by tightening standards forstudents and institutions with particularly high default rates.
Non-Means-Tested Programs. Unlike the programs just cited, thelion's share of entitlement and mandatory spending is not means-tested. Social Security and Medicare lead this category; Social Se-curity is the bigger program, but Medicare is projected to grow morethan twice as fast over the 1992-1996 period. Fundamentally, bothprograms might be expected to grow about as fast as the growth in theelderly population plus inflation. Medicare, however, faces added pres-sures as medical care costs continue to outstrip other prices and asbeneficiaries use more and increasingly complex covered services.Medicare spending would be even higher than shown in Table IV-2 if it

CHAPTER IV THE OUTLOOK FOR FEDERAL SPENDING 93
were not for last fall's reconciliation act,providers and imposed greater cost sharingsavings of $35 billion resulted. Several coiin 1996, explaining a slight jump in the prt gramthat year.
fhich curbed payments toon beneficiaries; five-year;-saving provisions expire
's expected growth in
Medicare is funded by a combinationworkers, premiums from beneficiaries, andfrom the general fund. Both payroll taxeswere increased by last fall's legislation, tbjTable IV-2. (Payroll taxes are discussed innues; premiums are part of the offsetting rediscussed below.)
of payroll taxes on activestraightforward subsidies
and beneficiary premiumsugh neither is depicted inChapter V, on federal reve-eipts cluster of the budget,
Other retirement and disability programschiefly include federal civilian and militarRetirement. Last fall's legislation suspefederal employees' right to take part of thebenefits in a lump sum upon retirement, saa year. (Because these beneficiaries, by leawith the government, will receive greaterings are nil; however, this pattern does notturn of the century.) The surge in unemplwhich jump by more than one-third betweeresult of recent legislation but of the recess:sides somewhat after 1991 as the economy i
run by the governmentf retirement and Railroadnded through 1995 mostr Civil Service Retirementing $1 billion to $2 billioning their money on depositenefits, the long-run sav-
assert itself until after theyment insurance benefits,11990 and 1991, is not then, and such spending sub-assumed to recover.
Among other programs depicted in Tabwere reauthorized in 1990. The legislatiosumption of export subsidies and marketRound of the General Agreement on Tariffsend with an agricultural trade agreement.
IV-2, farm price supportsi, though, calls for the re-ng loans if the Uruguaynd Trade (GATT) does not
newAs mentioned above, the switch to acredit programs beginning in 1992 leadsspending data. Credit reform temporarily cprograms shown in Table IV-2: Stafford student 1fits (including mortgage programs), and finvolve a relatively small export guarante
method of accounting foro some discontinuities instorts spending for several
cans, veterans' bene-rm price supports (whichprogram). And credit re-

94 THE ECONOMIC AND BUDGET OUTLOOK January 1991
form leads to the creation of an entirely new category of mandatoryspending: so-called liquidating accounts, which reflect future cashflows associated with the government's past credit commitments(shown in Table IV-2 and further explained at the end of this chapter).These future cash flows will be treated as mandatory outlays becausethey are no longer controllable in any meaningful sense. In relation tothe enormous category of entitlement and mandatory spending, thetemporary distortion caused by credit reform is tiny.
Federal government deposit insurance is another member of themandatory spending category. Because of its unique characteristicsand its special treatment under the Budget Enforcement Act, it is notdepicted in Table IV-2. Current spending for deposit insurance is hugeand volatile. But massive as these outlays are, they are temporary, in-volve little net drain on credit markets, and pose far smaller economicimpacts than other federal spending. These programs earned specialtreatment under the Budget Enforcement Act; any newly enacted re-ceipts (such as premiums) or spending are exempt from the pay-as-you-go rule if they merely represent the government's attempts to honor itscurrent commitments. Because of these outlays' volatility and theirspecial treatment in the budget rules, they are discussed separatelylater.
Offsetting Receipts
Offsetting receipts appear as negative outlays in the budget. They aredistinct from revenues because they do not result from the federal gov-ernment's taxing powers. Slightly more than half of offsetting receiptsare intragovernmental, reflecting the government's own contributionsto retirement plans on behalf of its employees. (Since such paymentsare part of agency budgets, but are clearly intragovernmental, a nega-tive outlay must be recorded to avoid exaggerating the total deficit.)As shown in Table IV-3, these retirement-related receipts mount from$36 billion in 1991 to $44 billion in 1996.

CHAPTER IV THE OUTLOOK FOR FEDERAL SPENDING 95
The remaining offsetting receipts come from the public, whichpays them voluntarily in exchange for a service or a privilege. Medi-care premiums dominate this category, climbing from $12 billion in1991 to $20 billion in 1996. These premiums are funneled mainly tothe Supplementary Medical Insurance program (SMI, also known asMedicare Part B), which covers physician and certain other profes-sional services. (Hospital bills, in contrast, are covered by MedicarePart A and financed by payroll taxes on workers.) While voluntary,SMI enjoys nearly universal enrollment among the eligible population.Premiums cover about one-fourth of Medicare Part B outlays, with therest subsidized by general taxpayers. Last fall's legislation preserved
TABLE IV-3. OFFSETTING RECEIPTS IN THE BASELINE(By fiscal year, in billions of dollars)
Category
Employer Share ofEmployee Retirement
Social SecurityMilitary RetirementOther*
Subtotal
Medicare Premiums
Energy-Related Receipts*1
Natural Resource-RelatedReceipts0
Other
Total
Actual1990
-6-16-12-34
-12
-5
-3
-4
-57
1991
-6-17-13-36
-12
-5
-3
-7
-63
1992
-6-16-13-36
-13
-5
-3
_i6
-63
1993
-7-17-14-38
-14
-5
-4
_i6
-67
1994
-8-17-15-40
-16
-6
-4
-6
-71
1995
-8-18-1642
-19
-6
-4
_i6
-76
1996
-9-18-17-44
-20
-6
-4
*Q
-79
SOURCE: Congressional Budget Office.
a. Primarily to Civil Service Retirement.
b. Includes proceeds from aales of power, various feea, and receipts from the Naval Petroleum Reservesand Outer Continental Shelf.
c. Includes timber receipts and various user feea.

11L.
96 THE ECONOMIC AND BUDGET OUTLOOK January 1991
this ratio, removing a linkage to Social Security cost-of-living adjust-ments that would have led premiums to finance a dwindling share ofthe program; over the 1991-1995 period, these changes were estimatedto bring in an extra $8 billion. Other large offsetting receipts, asshown in Table IV-3 on the preceding page, involve charges for theright to exploit government-owned timber or minerals, charges forelectric power generated by the federally owned power marketingadministrations, user fees for recreational facilities or Customs Serviceprocessing, and so forth.
Under the Budget Enforcement Act, offsetting receipts are linkedwith entitlements and mandatory spending and government revenuesunder the pay-as-you-go rules. Thus, raising fees offers one way tofinance increases in entitlement spending; alternatively, entitlementcuts could cover reductions in federal taxes or fees.
NET INTEREST
Net interest is not governed by any provision of the Budget Enforce-ment Act, simply because it is not susceptible to direct control. Rather,net interest depends on the government's debt and on interest rates.The Congress and the President exercise some control over the former,by making decisions that affect the government's total deficit andhence borrowing; they exert no direct control over the latter, whichdepend instead on market forces and on Federal Reserve policy.
Net interest is expected to total $198 billion in 1991, but its paththereafter hinges on compliance with the budget summit's require-ments, among many other factors. If policymakers comply with thediscretionary spending caps, net interest spending should total an esti-mated $233 billion in 1996 (see Table IV-1). Current projectionsvividly illustrate net interest's sensitivity to the government's deficit.Ignoring the caps, and instead permitting both defense and nondefensediscretionary spending to rise in step with inflation, would boost debtservice costs by an estimated $500 million in 1992 and $14 billion in1996.

CHAPTER IV THE OUTLOOK FOR FEDERAL SPENDING 97
Net interest outlays are highly sensitive to market interest rates.Unprecedentedly high interest rates caused the first quantum leap ininterest outlays, in the late 1970s and early 1980s, before rates sub-sided somewhat (leaving large deficits as the engine driving net inter-est spending). As Chapter I notes, both short- and long-term Treasuryinterest rates are assumed to fall gradually over the 1991-1996 period,ending at about one percentage point below today's levels and miti-gating the rise in net interest costs.
Net or Gross?
Economists and financial market participants rightly worry abouttotal federal borrowing and the resulting growth in interest costs.These observers focus on the total debt owed to the public-a figure thatsummarizes how much the government has had to raise in credit mar-kets~and on its close cousin, net interest paid. But among other bud-get watchers, much confusion surrounds the measurement of interestand debt. This confusion is fueled by the complex budgetary treatmentof federal government trust funds and the ensuing proliferation of netand gross measures of interest and debt.
As explained in Chapter III, federal government trust funds—chiefly Social Security, Medicare, and the federal civilian and militaryretirement systems-run large surpluses as conventionally measured,even though much of the surplus simply stems from reshuffling moneywithin the budget. By law, funds invest their surpluses in specialTreasury securities. Interest on these securities is clearly intragovern-mental: since it is both paid and collected by the government, it cannotpossibly affect total outlays or the deficit. But within the net interesttotals, both sides of this transaction are clearly visible. Some observerspoint to gross interest payments (that is, they lump together interestpaid to outside creditors and to federal government trust funds) whencalling attention to debt service burdens; but in doing so, they ignorethe fact that some of these outlays do not leave the government. Theyalso ignore the fact that the federal government collects some interestincome-primarily interest on its cash balances and interest on loans.Net interest, a more useful measure, instead pinpoints how much thefederal government must actually pay to outsiders.

J JJL
98 THE ECONOMIC AND BUDGET OUTLOOK January 1991
TABLE IV-4. CBO PROJECTIONS OF INTEREST COSTS ANDFEDERAL DEBT (By fiscal year)
1990 1991 1992 1993 1994 1995 1996
Interest on Public Debt(Gross interest)*
Interest Received byTrust Funds
Social SecurityOther trust fundsb
Subtotal
Other Interest0
Total
Gross Federal Debt
Debt Held byGovernment Accounts
Social SecurityOther government
accounts'1
Subtotal
Debt Held by the Public
Debt Subject to Limitd
Debt Held by the Public
Net Interest Outlays(In billions of dollars)
265 292 312 337 355 367
215
581
278
635
348
697
430
769
526
844
377
-16-46-62
-19
184
-21-52-73
-21
198
-26-54-79
-26
207
-31-57-88
-30
219
-37-61-98
-30
227
-45-65-109
-28
230
-53-68
-121
-23
233
Federal Debt, End of Year(In billions of dollars)
3,206 3,606 4,018 4,383 4,716 4,964 5,227
767
995796 913 1,045 1,198 1,370
2,410 2,693 2,973 3,185 3,346
3,161 3,565 3,980 4,348 4,682
Federal Debt as a Percentage of GNP
44.6 47.9 49.5 49.7 49.1
638
9211,558 1,762
3,405 3,465
4,931 5,195
47.0 45.0
SOURCE: Congressional Budget Office.NOTE: Projections of interest and debt assume compliance with the discretionary spending caps in the
Budget Enforcement Act.a. Excludes interest costs of debt issued by agencies other than the Treasury (primarily deposit
insurance agencies).b. Principally Civil Service Retirement, Military Retirement, Medicare, Unemployment Insurance, and
the Highway and the Airport and Airway trust funds.c. Primarily interest on loans to the publi c and to the Resolution Trust Corporation.d. Differs from the gross federal debt primarily because most debt issued by agencies other than the
Treasury (currently about $33 billion) is excluded from the debt limit.

CHAPTER IV THE OUTLOOK FOR FEDERAL SPENDING 99
An undue emphasis on gross interest exaggerates the burdenposed by federal government debt and interest. The growth in federaldebt, and the resulting debt service load, can be adequately docu-mented by using the more accurate and appropriate measures. TableIV-4 depicts the components of net interest and the corresponding com-ponents of the federal debt.
Debt held by the public grows from $2.4 trillion at the start of 1991to $3.5 trillion by 1996, assuming compliance with the budget sum-mit's spending caps (see Table IV-4). As a percentage of GNP, debtheld by the public will peak at almost 50 percent (the highest levelsince the 1950s, when an overhang of World War II-related debt stilldominated the totals) before subsiding to 45 percent in 1996.
The Debt Limit
Some of the confusion and mismeasurement of federal debt stems fromthe statutory debt limit. The Congress enacts ceilings on Treasurydebt issuance, including the securities issued to trust funds; and under-standably, this is the debt figure most familiar to many policymakers.In the late summer and early fall of 1990, the Congress passed a totalof six short-term increases in the debt ceiling before enacting a new,multiyear ceiling of $4,145 billion. As Table IV-4 suggests, this ceilingwill probably be reached sometime during fiscal year 1993.
THE OUTLOOK FOR DEPOSIT INSURANCE SPENDING
Much of the volatility and sheer uncertainty in outlay projections stemfrom deposit insurance spending. In the budget, these outlays are rec-ognized when the government resolves failed or failing institu-tions-even though the losses necessitating these actions may havebuilt up for years. Compounding this mismatch between budget ac-counting and economic reality, some of the money expended now willbe recouped later as the government sells assets that it has acquired.
Total outlays for deposit insurance in the baseline plunge from$103 billion in 1991 to a net inflow of $42 billion in 1996 (see Table
nnn—

_._L!LL_ _...
100 THE ECONOMIC AND BUDGET OUTLOOK January 1991
FV-5). The swings in spending can be traced largely to the ResolutionTrust Corporation (RTC), created in 1989 to resolve hundreds ofinsolvent savings and loan institutions. The Financial InstitutionsReform, Recovery, and Enforcement Act of 1989 (FIRREA), whichcreated the RTC, capped its insurance losses—that is, money expectednever to be recovered—at $50 billion, a figure now universally viewedas inadequate. The Congress last fall failed to allocate more resourcesto the RTC. As a stopgap, the RTC is taking advantage (with theCongress's full knowledge) of a drafting error in the 1989 legislation tocontinue operations for several months more, even though it has al-ready bumped up against the intended limits on its borrowing of work-ing capital.
Deposit insurance is a mandatory obligation of the government;having promised to protect depositors, the government must honor itspast pledges. Providing inadequate funds undeniably limits short-term outlays but hardly controls the ultimate cost to the government.Since last spring, both CBO and the Administration have presentedRTC projections on an unconstrained basis—that is, with additional re-sources beyond current law. (The Budget Enforcement Act implicitlysanctioned this approach.) Thus, the insurance losses depicted inTable IV-5 sum to $155 billion over the 1989-1996 period, more thanthree times the amount anticipated in the 1989 legislation. The RTC'sworking capital needs (that is, its temporary financing requirements)are also massive, as the agency acquires assets that it will hold formonths or years before selling. As the working capital flows in TableIV-5 suggest, sales of assets are already picking up steam; but muchwill remain to be collected after 1996, the final year reflected in thetable.
Last fall's Budget Enforcement Act drew a line between govern-ment-sponsored enterprises that may and may not be legitimatelyexcluded from budget totals. CBO has long argued that the ResolutionFunding Corporation (REFCORP)--conceived as a government-sponsored enterprise whose sole task was to borrow funds in creditmarkets to finance savings and loan resolutions-should not have beenexcluded from the budget; and CBO believes that last fall's legislationbuttresses this view. The Office of Management and Budget, however,

CHAPTER IV THE OUTLOOK FOR FEDERAL SPENDING 101
TABLE IV-5. OUTLAYSBASELINE
FOR DEPOSIT(By fiscal year,
Actual Estimate1989 1990
INSURANCE IN THEin billions of dollars)
1991 1992 1993 1994 1995 1996
Resolution Trust Corporation
Insurance LossesWorking Capital
DisbursementsReceipts
Payments from FederalHome Loan BanksReceipts from Resolution FundingCorporation (REFCORP)Interest and Adminis-trative Expenses
Total Budget OutlaysTotal Including REFCORP
Other
Federal Savings and LoanInsurance Corporation (FSLIC)FSLIC Resolution FundSavings Association InsuranceFund(SAIF)Bank Insurance FundOther":
Total Budget Outlays forDeposit InsuranceTotal Including REFCORPandFICO
1
90
-1
34
33-3
0
0 -18
a
99
Deposit
10a
a3a
22
26
1
4765
47
67-26
0
-12
5
8092
32
102-53
0
0
9
9090
21
87-75
0
0
14
4747
17
76-82
0
0
15
2626
4
9-74
0
0
14
-48-48
0
0-52
0
0
9
-43-43
Insurance Agencies
b5
a6a
Total
58
76
b
11
0-
13
e.
103
115
b
4
-1
4
a
98
98
b
3
a
-2
a
48
48
b
3
a
-3
a
25
25
b
2
3
-4
a
-47
-47
b
2
4
-6
a
-42
-42
SOURCE: Congressional Budget Office.NOTE: Budget outlays reflect the treatment of the Resolution Funding Corporation (REFCORP) and Financing
Corporation (FICO), shell corporations created solely to boirrow funds for savings and loan resolutions, asgovernment-sponsored enterprises. This treatment permits their borrowing to reduce the deficit. CBO haslong viewed this treatment as inappropriate. The estimates assume the provision of additional resources tothe RTC beyond those available under current law.
a. Less than $500 million.
b. Defunct.c. Primarily National Credit Union Share Administration.

J
102 THE ECONOMIC AND BUDGET OUTLOOK January 1991
has apparently concluded otherwise, and CBO has followed OMB'streatment in order to avoid confusion. Thus, $30 billion in spending bythe RTC ($18 billion in 1990 and $12 billion in 1991) is effectivelyexcluded from the budget totals. When REFCORP borrows funds, itpasses them on to the Resolution Trust Corporation (an on-budgetagency) where they are recorded as a collection, automatically off-setting the spending that they make possible. (A much smallerancestor, the Financing Corporation or FICO, operated in much thesame manner in the 1988-1989 period.) These off-budget arrange-ments have proved costly to the government, as REFCORP and FICObonds have carried interest rates approximately one-third of a per-centage point higher than comparable Treasury securities. CBO hasconsistently argued for an alternative approach to entities likeREFCORP and FICO, maintaining that (for the sake of accuracy andcomprehensiveness) they ought to be included in the budget but thatdeposit insurance spending merits special treatment in the selection ofbudgetary targets. Table FV-5 shows RTC's projected outlays as theywill actually be measured, and how they would appear if this bud-getary treatment were not permitted.
Several other agencies, depicted in the lower panel of Table IV-5,are also engaged in the savings and loan cleanup, succeeding the de-funct Federal Savings and Loan Insurance Corporation (FSLIC). Thedivision of responsibility revolves around whether and when savingsand loan institutions come into government hands. The FSLICResolution Fund inherited the FSLIC's books, assuming responsibilityfor institutions that the government had already taken over by early1989. The aforementioned RTC handles failed or failing institutionsthat the government could not afford to address before the 1989 legisla-tion. (Because its projections are unconstrained, CBO assumes thatthe RTC remains active through late 1995, three years beyond theperiod contemplated in FIRREA.) And the Savings Association Insur-ance Fund (SAIF) assumes responsibility for those institutions that re-main in the industry, some of which will inevitably fail.
CBO has not significantly revised its estimates of the costs of sav-ings and loan resolutions since last summer. New information sincethat time generally confirms CBO's earlier estimates, although eventhe newest available data precede the recent economic slowdown. For
CHAPTER IV THE OUTLOOK FOR FEDERAL SPENDING 103
purposes of summarizing the costs of the savings and loan debacle, thesingle most useful figure is the present value of future costs. Presentvalue, widely used by economists and financial analysts, reflects thefact that payments and receipts will take place over many years oreven decades, and expresses those future flows in today's dollars. Acritical complication, though, is the fact that the pace of governmentactions affects the ultimate costs. Because of human and adminis-trative constraints, the responsible agencies could not resolve the situ-ation overnight even if they had unlimited funds; and in the meantime,marginal institutions remain in business, accumulating losses thatwill eventually be borne by the government. CBO thus estimates thepresent value of the RTC's cleanup efforts at $155 billion, for an esti-mated caseload of about 1,600 institutions. The FSLIC ResolutionFund, which is not as susceptible to funding delays, faces estimatedcosts of $60 billion.
Commercial banks (and the lesser-known savings banks), whosedeposits are insured by the Bank Insurance Fund (BIF), have drawnmounting concern in the past year. CBO projects relatively highoutlays for BIF in 1991 and 1992. Like the RTC itself, BIF will needlegislation providing extra resources. The fund will likely becomeinsolvent in 1992, though it will continue to receive s6me income (frompremiums and liquidations) and enjoy access to short-term borrowing.Last fall, the Congress granted BIF's parent, the Federal Deposit In-surance Corporation, flexibility to raise premiums~a power that thesummit negotiators estimated would bring in an extra $9 billion overfive years. The new law also assured access to short-term workingcapital through the Treasury's Federal Financing Bank (in addition toBIF's existing small line of credit with the Treasury). In enactingthese changes, policymakers sought to avoid at least one stumblingblock of the savings and loan debacle, which was that the simple lack offinancing caused delays in closing institutions and drove up costs.
For the overall 1991-1996 period, CBO expects that total BIF out-lays will equal only $2 billion. But enormous flows of money underliethis projected total. Assistance to institutions totals $65 billion; mis-cellaneous costs (including interest) $12 billion; and income fromliquidations and assessments $75 billion. BIF is assumed to take fulladvantage of the freedom granted last fall to raise premiums, and
_ JLLL-
104 THE ECONOMIC AND BUDGET OUTLOOK January 1991
hence assessment income is projected to bring in $7 billion or moreannually in 1992 and beyond, compared with just $3 billion in 1990.
CREDIT REFORM AND THE SPENDING PROJECTIONS
The Budget Enforcement Act reformed the budgetary treatment offederal credit programs, addressing concerns that were raised as longago as the President's Commission on Budget Concepts in 1967. Thebudget, which fundamentally depicts the cash flows of the government,is ill suited to portray transactions that involve streams of loans, in-terest and principal repayments, and defaults over time. Before creditreform, the budget tended to exaggerate the costs of direct loan pro-grams and to understate the costs of guarantee programs in their earlyyears-the years that attract the keenest attention. And this distortionskewed the incentives facing policymakers. Credit reform deals withthis defect by expressing the entire expected lifetime cost of a loan orguarantee-that is, its subsidy-right at the outset, while there is stillopportunity to control these costs.
Subsidies in Credit Programs
At the heart of the credit reform concept is the notion of subsidy. TheFederal Credit Reform Act of 1990, part of the Budget EnforcementAct, defines subsidy as "the estimated long-term cost to the govern-ment of a direct loan or loan guarantee calculated on a net presentvalue basis, excluding administrative costs." Simply stated, the sub-sidy is the amount that the government expects to lose on a credittransaction.
The government engages in two broad types of credit programs: di-rect lending and loan guarantees. In a direct loan program, the gov-ernment disburses funds to a borrower and awaits principal and inter-est repayments over time. In a guarantee program, the governmentagrees to protect another lender (such as a bank) from default; if theloan goes sour, the government honors its guarantee.

CHAPTER IV THE OUTLOOK FOR FEDERAL SPENDING 105
If the government made (or guaranteed) loans only to creditworthyborrowers, at interest rates high enough to cover its own cost of funds,no subsidy would exist. Clearly, subsidies generally exist because thebeneficiaries of these programs are prone to default, or get a favorablerate of interest.
Before Credit Reform: The Distortions of Cash-Flow Accounting. Thebudget has traditionally treated disbursements and repayments fordirect loan programs on a cash basis. When initially disbursed, a directloan looked just as costly as a straightforward grant. This was mis-leading, since some or all of the loan would be repaid later.
Cash-basis accounting, in contrast, made guarantee programs ap-pear inexpensive. A guarantee typically involved no budget outlays atthe outset even if there was every reason to expect a future default.Perversely, if the government collected guarantee fees, these were re-corded as collections; thus, even high-risk guaranteed loans could re-duce the deficit at the outset.
After Credit Reform: The Subsidy Concept. Credit reform discardscash-flow accounting in favor of measuring subsidies. Starting withcommitments made in fiscal year 1992, budget outlays for credit pro-grams will reflect the expected lifetime cost of direct loans or guar-antees. This new approach permits much more meaningful compari-sons of credit programs with each other and with alternative means ofaiding recipients-such as outright grants.
Some of the biggest subsidies, as estimated by CBO, are shown inTable IV-6. The amounts shown are consistent with CBO's baseline(that is, the projections assume full adjustment for inflation in discre-tionary programs between 1991 and 1992). While many of these pro-grams are subject to the discretionary spending caps, there is no way toproject how they will fare in the competition with other programs forthe dollars available.
A few examples from Table IV-6 show how subsidy calculationssummarize the costs inherent in federal credit programs. Leading thelist of direct loan programs is the Rural Housing Insurance Fund,

106 THE ECONOMIC AND BUDGET OUTLOOK January 1991
TABLE IV-6. 1992 BASELINE SUBSIDIES AND LOAN VOLUMESFOR SELECTED CREDIT PROGRAMS
1992 1992Loans8 Subsidies'1 Subsidy
(Billions (Billions Ratec
Program Type < of dollars) of dollars) (Percent)
Direct Loan Programs
Rural Housing Insurance FundPublic Law 480 (Food for Peace)Rural Electrification Adminis-
tration Direct Loansd
Export-Import BankSmall Business Administration
(Disaster loans)Rural Development Insurance
FundAgricultural Credit Insurance
FundOther
DiscretionaryDiscretionary
MandatoryDiscretionary
Discretionary
Discretionary
MandatoryMixed
2.20.6
0.70.8
0.4
0.7
0.43.4
0.80.4
0.20.2
0.1
0.1
0.10.3
3868
2721
31
16
228
Total 9.1 2.2 24
Guaranteed Loan Programs
Stafford Student Loans Mandatory 12.2 3.0 25Federal Housing Administra-
tion (General and specialrisk insurance) Discretionary 6.3 0.3 5
Small Business Administration(Business loans) Discretionary 4.2 0.2 6
Veterans Administration LoanGuaranty and Indemnity Fund Mandatory 15.3 0.1 1
Other Subsidized Programs Mixed 13.6 0.2 2Federal Housing Administra-
tion (Mutual mortgageinsurance) Discretionary 44.1 -0.9 -2
Government NationalMortgage Association(Sale of mortgage-backedsecurities) Discretionary 83.2 -0.4 _e
Total 178.9 2.7 1
SOURCE: Congressional Budget Office.
a. Commitments made in fiscal year 1992;. Disbursement (by the government or by a private lender)may occur later.
b. Subsidy budget authority associated with 1992 commitments.c. Subsidy portion as a percentage of disbursements.d. Loans made directly by the RE A at interest rates of 5 percent (2 percent for financially needy
borrowers).e. Less than 0.5 percent.

CHAPTER IV THE OUTLOOK FOR FEDERAL SPENDING 107
expected to commit loans with a face amount of $2.2 billion in 1992.Because interest rates on these loans are scaled to income, the subsidyrate for this program is 38 percent-that is, the government is expectedto lose more than $800 million of the $2.2 billion it lends. Amongguarantee programs, Stafford student loans pose the greatest costs tothe government. The program is expected to guarantee approximately$12 billion worth of loans from private lenders in 1992, at a subsidyrate of almost 25 percent. This program's costly subsidies stem fromtwo major sources: from the availability of subsidized interest rates,and (less important) from defaults. Students in regular four-yearacademic institutions-especially those who have advanced to junior orsenior status-are generally good credit risks; but the government paystheir entire interest costs while they are in school, and subsidizes theirinterest rate afterward. Students in many proprietary schools andcommunity colleges are entitled to the same terms, but are more likelyto leave school early and default on their payments. Recent legislationhas curtailed this so-called high-risk sector of the program.
A few programs in Table IV-6 show negative subsidies. In thesecases the government, by collecting guarantee fees and by other means(such as selling repossessed property), more than covers its costs. (Akey reason that CBO estimates negative subsidies for these programsis that the law explicitly bars the inclusion of administrative costs inthe subsidy estimates.) Leading this list are the mutual mortgageinsurance program of the Federal Housing Administration (FHA) andguarantees of mortgage-backed securities by the Government NationalMortgage Association (GNMA, or Ginnie Mae).
Congressional Control Over Credit Programs. Until now, discre-tionary credit programs have typically been controlled simply bysetting caps on gross activity—that is, the total volume of direct loan orguarantee commitments—in appropriation acts. Often, these capshardly mattered because they far exceeded loan demand. Moreover,the limits bore no direct relationship to the government's losses.
Under credit reform, the Congress must explicitly appropriate thesubsidies for discretionary programs. A subsidy dollar will be no dif-ferent from a dollar for an ordinary, noncredit appropriation (such as a
38-033 0 - 91 — 5 : QL 3

Ji
108 THE ECONOMIC AND BUDGET OUTLOOK January 1991
grant), a change that is meant to ensure a level playing field for manydifferent types of spending.
Some credit programs, notably Stafford student loans, are part ofthe entitlement and mandatory spending cluster, and are outside thereach of appropriation action. As before, the Congress will controlspending by setting the terms and conditions of such programs. Butsubsidy estimates will now form the basis of future projections forthese programs, and will be used to estimate the costs of competingproposals.
Past and Future Cash Flows: Where Do They Fit?
Credit reform is prospective only, applying to new commitments start-ing in fiscal year 1992. Of course, it requires distinguishing betweenso-called old activity (loans and guarantees that stem from pre-1992commitments) and new activity (post-1991 commitments). For a fairlylong transition period, the two will be treated in dissimilar fashions.
Old Activity. Cash flows from old (pre-1992) commitments will bequite large for several years to come; CBO estimates that they willamount to about $12 billion in 1992, though they quickly shrink to $3billion in 1996. Congressional ability to exert meaningful control overthese cash flows has long since passed. Unlike subsidies, they requirelittle or nothing in the way of decisionmaking. They will remain on acash basis in future budgets. Because they are essentially uncontrol-lable, they have been moved wholesale into the mandatory spendingcluster-even if they occur in otherwise discretionary programs.
New Activity. As noted earlier, credit reform focuses on the subsidiesrather than the cash flows associated with future commitments. In-cluding the cash flows in budget totals would thwart credit reform'sgoal of focusing attention on these subsidy costs. But the cash flowsclearly are part of the government's overall financial picture and willcontribute to its borrowing needs. They will be reflected in so-calledfinancing accounts, outside the official budget totals.

CHAPTER IV THE OUTLOOK FOR FEDERAL SPENDING 109
The Impact of Credit Reform on Budget Totals
The impact of credit reform on budget totals is not obvious at the out-set. As a rule, the initial costs of direct loan programs will be smallerunder credit reform, while initial costs of guarantee programs will begreater. Clearly, the impact on budget totals from adopting a newaccounting system will depend on the mix of direct and guaranteedactivity and on the terms and conditions of these loans.
In fact, credit reform boosts total outlays in the current CBO base-line by $2 billion to $3 billion in 1992 and 1993, but by smaller (ornegative) amounts in later years, compared with the old cash-basedaccounting. This pattern emerges because credit reform increases theoutlays ascribed to guarantee programs in the initial years, and guar-antees are by far the dominant form of federal credit assistance. Thesemagnitudes, however, are markedly smaller than some estimates thatwere circulated when credit reform first gained momentum. One rea-son is that federal government credit activity, and especially the vol-ume of deeply subsidized activity, is down from its peak of the late1970s and early 1980s.
Credit reform undeniably leads to a discontinuity in the budgetdata beginning in 1992. This discontinuity is small in the aggregate,though it is more pronounced for individual programs or spending cate-gories. (For example, the decision to treat future cash flows from oldcommitments as essentially uncontrollable causes a temporary boostin mandatory spending, while depressing the discretionary category.)Special adjustments to the discretionary appropriations cap, outlinedin Appendix A, protect the Appropriations Committees against inad-vertent changes in their allowable spending as a result of credit re-form.
Last year's reconciliation act directed the Office of Managementand Budget to review historical budget data and, to the extent possible,develop adjustments to these data. But the task is a formidable one,and it is not yet clear what will come of the effort.


CHAPTER V
THE REVENUE OUTLOOK
Much of the discussion on the budget during 1990 centered on issues oftax policy. First, there was the issue of whether tax increases shouldbe a part of the deficit reduction plan at all. Once this was resolved,attention focused on the issues of the share of deficit reduction con-tributed by increased taxes and the distributional consequences ofthese taxes. In the end, close to one-third of the deficit reduction en-acted in the Omnibus Budget Reconciliation Act of 1990 (also referredto as the reconciliation act) was contributed by tax increases throughhigher excise taxes and increases in income and payroll taxes paid byupper-income taxpayers. Expanded income tax credits were providedfor lower-income families with children.
On balance, the tax system was made more progressive, since ef-fective tax rates for the lowest fifth of taxpayers were reduced, whilethose for the highest fifth were increased. Although the tax increasesin the reconciliation act are the largest since 1982, the act's effects onthe composition and distribution of taxes are modest, and growth inrevenues is projected to do no more than keep pace with growth in thegross national product (GNP) over the next six years.
Both the reconciliation act and the rapid weakening of the econ-omy in late 1990 have altered revenue prospects since the Congres-sional Budget Office's projections in July 1990. Despite the substantialtax increases in the reconciliation act, projected revenues are below thelevels in the July baseline in every year through 1995. Not until theend of the period do the tax increases of the act almost cancel out thereduction in revenues brought about by the slowdown in the economyand other factors.
TIT"

JJL
112 THE ECONOMIC AND BUDGET OUTLOOK January 1991
BASELINE PROJECTIONS AND REVENUE TRENDS
Baseline revenues are projected to increase 6 percent this year, to$1,094 billion, and 7 percent in 1992, to $1,170 billion (see Table V-l).Over the medium term, revenue growth just keeps pace with growth inGNP. Despite the recession, revenues will increase from 19.1 percentof GNP in 1990 to 19.4 percent in 1991 as a result of the tax in-
TABLE V-l. CBO BASELINE REVENUE PROJECTIONS BY SOURCE(By fiscal year)
Major SourceActual Base
1990 1991Projected
1992 1993 1994 1995 1996
In Billions of Dollars
Individual IncomeCorporate IncomeSocial InsuranceExciseEstate and GiftCustoms DutiesMiscellaneous Receipts
TotalOn-budgetOff-budget
4679438035121727
1,031750282
4899940446121726
52910343349131825
56910746453132026
61210949654142126
66010952856142227
70511156054152427
1,094 1,170 1,251 1,332 1,416 1,496794 851 910 967 1,026 1,081300 319 341 365 390 416
As a Percentage of GNP
Individual IncomeCorporate IncomeSocial InsuranceExciseEstate and GiftCustoms DutiesMiscellaneous Receipts
TotalOn-budgetOff-budget
8.61.77.00.70.20.30.5
19.113.95.2
8.71.87.20.80.20.30.5
19.414.15.3
8.81.77.20.80.20.30.4
19.514.25.3
8.91.77.20.80.20.30.4
19.514.25.3
9.01.67.30.80.20.30.4
19.514.25.4
9.11.57.30.80.20.30.4
19.514.2
5.4
9.11.47.30.70.20.30.4
19.414.05.4
SOURCE: Congressional Budget Office.

CHAPTER V THE REVENUE OUTLOOK 113
creases in the reconciliation act, and remain close to 19.5 percentthrough 1996.
Changes from the July 1990 Baseline
Overall, baseline revenues have been reduced relative to CBO's Julyprojections by $29 billion in 1991, $18 billion in 1992, and decreasingamounts thereafter. In 1995, baseline revenues are only $1 billion be-low the July level. Tax increases in the reconciliation act will add $18billion to revenues in 1991, $33 billion in 1992, and more than $30 bil-lion per year through 1996. However, the short recession weakenspersonal income and corporate profits, reducing revenues relative tothe July baseline by about $40 billion per year. Overall, the reductionsin revenues caused by the weak economy outweigh the increases gen-erated by the reconciliation act.
Other legislation enacted at the end of the 101st Congress in-creased revenues by about $1 billion per year. Among other changes,this legislation increased visa fees, provided preferential tariff treat-ment to additional products and to Caribbean Basin countries andCzechoslovakia, and gave the Internal Revenue Service more money toenforce the tax laws.
Technical revisions since July are small. Revisions in personal in-come taxes are positive in each year after 1991. Newly available datafor 1988, the first year reflecting the full effects of the Tax Reform Actof 1986, indicate that taxable incomes were higher than estimated.This increase more than offsets a reduction in projected capital gains,resulting from new data confirming unexpectedly low realizations ofgains in 1989.
For several years, corporate income taxes have been lower thanCBO's projections. As a result, technical revisions in corporate incometaxes are negative in each year of the current baseline. Other tech-nical revisions are minor.
r

ILL
114 THE ECONOMIC AND BUDGET OUTLOOK January 1991
Trends in Federal Government Tax Sources
The share of GNP claimed by taxes over the longer term indicates thetrend in the overall burden of providing government services, and pro-vides a context for the baseline projections. By this measure, the fed-eral tax burden will be high over the 1991-1996 period. The 19.5 per-cent average share will be a historically high six-year revenue claimon GNP. The next highest six-year average claim was 19.2 percentover the 1977-1982 period. The individual income tax share of GNPreached its highest postwar levels in 1981 and 1982 because rapidinflation in the 1979-1981 period boosted nominal incomes and pushedtaxpayers' incomes into higher tax brackets ("bracket creep"). Incometax bracket amounts and the standard deduction and personal exemp-tion are now indexed for inflation, removing inflationary bracket creepfrom the system.
Tax increases enacted in the reconciliation act raise the revenueshare of GNP by 0.5 percent a year from 1992 to 1995, and by 0.4 per-cent in 1996 after important revenue-raising provisions expire. Thisboost in revenues, however, does not greatly alter the GNP shares ofthe major tax sources that were projected for this period before the act.Personal taxes-income plus payroll taxes—provide most of the taxdollars, and their revenues continue to grow faster than GNP from1991 to 1996 (see Figure V-l). The reconciliation act increases reve-nues from these taxes by relatively small amounts: the individual in-come tax share rises to the third highest peak since World War II, andthe payroll tax share rises slightly, but more slowly than in the past.
Increases in corporate income taxes resulting from the reconcilia-tion act, about $1 billion per year overall, are not large enough to affectthe tax's declining share of GNP. Corporate revenues have been grow-ing more slowly than GNP since the early 1950s because of both a de-cline in the corporate tax base as a share of GNP and legislated reduc-tions in tax liability. The corporate tax share dropped from 1989 to1990, reflecting weakening profit growth. (Following the Tax ReformAct of 1986, corporate taxes had claimed a temporarily higher sharefrom 1987 to 1989.) Aside from a one-time increase in 1991, the corpo-

CHAPTER V THE REVENUE OUTLOOK 115
Figure V-l.Revenue by Source as Shares of GNP
10
Individual Income Taxes
Percentage of GNP
1960
Actual Proj.
1970 1980 1990
Social Insurance Taxes
Percentage of GNP
1970 1980 1990
10
Corporate Income Taxes
Percentage of GNP
Actual Proj.
1960 1970 1980 1990
SOURCE: Congressional Budget Office.
10
Excise Taxes
Percentage of GNP
1960
Actual Proj
I I1970 1980 1990
~irn—

I __UL
116 THE ECONOMIC AND BUDGET OUTLOOK January 1991
rate share will decline through 1996 as profits continue to grow moreslowly than GNP. By 1996, the share is projected to reach its lowestlevel since 1983, the year after the last recession.
The reconciliation act increases excise taxes: by 1995, excise taxreceipts are projected to be 60 percent above the level estimated underprior law. Nonetheless, the share of GNP claimed by excise taxes willbe only temporarily restored to the somewhat higher share of the late1970s. Revenues from excise taxes have declined steadily as a share ofGNP for many years, and the reconciliation act slows but does notreverse the trend. The enactment in 1980 of the windfall profit tax onoil produced the only recent break in the trend. The share falls mostlybecause many excise taxes are levied on a per-unit basis and, therefore,collections increase with the volume of taxed goods, not with total saleswhich rise more quickly. As a result, excise revenues fail to keep pacewith GNP. Furthermore, legislation has seldom changed major excisetaxes in recent years. The reconciliation act, with its significant de-pendence on excise taxes for increased revenues, represents a depar-ture from recent tax legislation.
These long-term differences in the growth rates of the various taxsources have dramatically changed the composition of the federal taxdollar. Over the past 30 years, the importance of social insurance taxeshas increased substantially, in concert with the growth in benefitsprovided to current retirees and scheduled for future retirees (see Fig-ure V-2). The importance of individual income taxes, by far the largesttax source since World War II, has also increased over the period, butby much less. The excise tax share of the tax dollar has been small for along time and continues to decrease. The corporate income tax sharewas significant in 1960, at 23 percent of total revenues, but it hasdropped the most, to 9 percent of revenues in 1990.
The reconciliation act shifts the composition of revenues slightlybut has little noticeable effect on the established trends. In 1995, be-fore important revenue-raising provisions expire, 4 cents of the taxdollar will come from excise taxes, up very slightly from more than 3cents in 1990. Without the reconciliation act, the excise share wouldfall to 2.5 cents in 1995. The share of the federal tax dollar provided by

CHAPTER V THE REVENUE OUTLOOK 117
Figure V-2.Composition of Revenues
1960
159%
12.6%
4.2%
1980
30.5%
23.2%
47.2%
12.5%
1990
36.8%
3.4%
5.4% 9.1%
45.3%
Individual Income Taxes
Corporate Income Taxes
37.2%
4.0%
1995
46.6%
4.5%7.7%
Social Insurance Taxes
Excise Taxes

118 THE ECONOMIC AND BUDGET OUTLOOK January 1991
personal taxes will rise from 82 cents in 1990 to 84 cents in 1995.Without the changes made by the reconciliation act, personal taxeswould account for 85 cents of the tax dollar in 1995. The modest corpo-rate tax share, which drops from 9 cents of the tax dollar in 1990 to 8cents in 1995, is relatively unaffected by the new legislation.
Assumptions in the Revenue Baseline
Baseline projections for revenues assume that current tax law remainsunchanged. Under current law, some provisions are scheduled tochange or expire during the 1991-1996 period, either on a specifieddate or when a statutorily defined condition is met. The baseline as-sumes that these changes and expirations occur on schedule.
One category of taxes-excise taxes dedicated to trust funds-is anexception to this rule. These excise taxes, even if scheduled to expire,are extended through 1996 in the baseline. Five types of excise taxesare extended under the exception: highway taxes, aviation taxes, Su-perfund taxes, and taxes to clean up oil spills and leaking undergroundstorage tanks.
Expiring Tax Preferences and the Pay-As-You-Go Requirement
During the 1991-1996 period, 13 tax preferences will expire. Althoughthe baseline assumes that these preferences will expire on schedule,recent history suggests otherwise. All of the provisions that will expireduring 1991 and 1992 have been extended at least twice, most recentlyin the reconciliation act, and four preferences have been extended fivetimes or more. Thus, the Congress is likely to consider extending ex-piring tax preferences again. If any of these preferences is extended,the new pay-as-you-go rules in the reconciliation act will require, forthe first time, that the resulting revenue loss be offset by an increase inanother revenue source or an entitlement reduction. The 102d Con-gress is likely to debate this trade-off, because 11 of the 13 provisionswill expire by the end of this year and the offsetting revenue amountsrequired will be substantial. For example, extending all the tax pref-

CHAPTER V THE REVENUE OUTLOOK 119
TABLE V-2. REVENUE LOSSES FROM EXTENSION OF EXPIRINGTAX PREFERENCES: FULL-YEAR EFFECTSIN 1993 (In billions of dollars)
Fiscal Year 1993Tax Preference Revenue Loss
Exclusion for Employer-Provided Educational Assistance -0.4
Exclusion for Employer-Provided Legal Assistance -0.1
Deduction for Health Insurance Premiums Paid by the Sielf-Employed -0.3
Credit for Investments in Low-Income Rental Housing -0.4
Exemption for Earnings on Mortgage Revenue Bonds -0.1
Exemption for Earnings on Small-Issue Manufacturing Bonds -0.1
Credit for Research and Experimentation Expenses -1.1
Rules for Allocation of Expenses for Research and Experimentation -0.9
Targeted Jobs Credit -0.2
Business Energy Credits -0.1
Nonconventional Fuels Credit -0.1
Orphan Drug Credit a
Total -3.8
SOURCE: Congressional Budget Office, based on estimates by the Joint Committee on Taxation.
NOTES: All of these tax preferences are scheduled to expire on or before December 31, 1991, with oneexception: the nonconventional fuels credit, which expires on December 31,1992. Extensionof the preferences that expire in 1991 would result in revenue losses in 1992 as well. The onlyexpiring provision not shown in the table is a deduction for contributions of stock to foun-dations, which expires on December 31,1994.
a. Less than $50 million.
erences scheduled to expire at or before the end of 1992 would requireoffsetting revenue increases or entitlement cuts totaling almost $4 bil-lion at 1993 income levels (see Table V-2).
THE OMNIBUS BUDGET RECONCILIATION ACT OF 1990
Roughly one-third of the deficit reduction enacted in the reconciliationact, or $156 billion over the 1991-1995 period, will take the form of in-creased taxes (see Table V-3). The act increases income, payroll, and
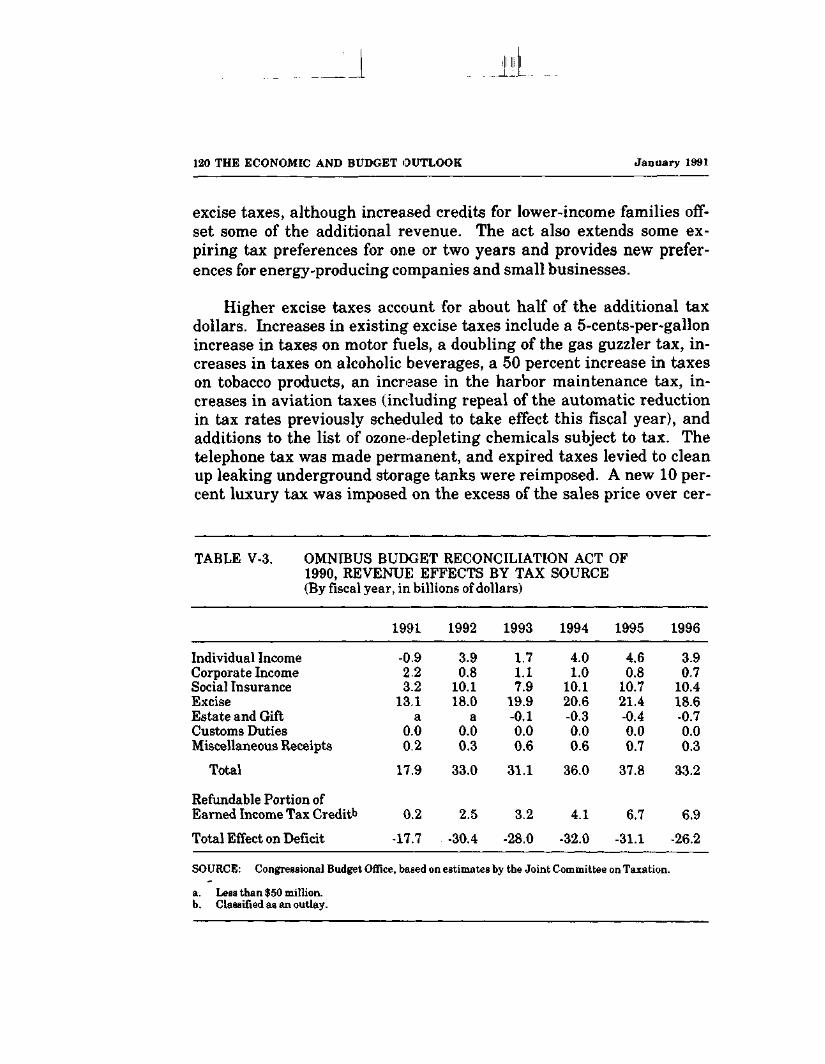
120 THE ECONOMIC AND BUDGET OUTLOOK January 1991
excise taxes, although increased credits for lower-income families off-set some of the additional revenue. The act also extends some ex-piring tax preferences for one or two years and provides new prefer-ences for energy-producing companies and small businesses.
Higher excise taxes account for about half of the additional taxdollars. Increases in existing excise taxes include a 5-cents-per-gallonincrease in taxes on motor fuels, a doubling of the gas guzzler tax, in-creases in taxes on alcoholic beverages, a 50 percent increase in taxeson tobacco products, an increase in the harbor maintenance tax, in-creases in aviation taxes (including repeal of the automatic reductionin tax rates previously scheduled to take effect this fiscal year), andadditions to the list of ozone-depleting chemicals subject to tax. Thetelephone tax was made permanent, and expired taxes levied to cleanup leaking underground storage tanks were reimposed. A new 10 per-cent luxury tax was imposed on the excess of the sales price over cer-
TABLE V-3. OMNIBUS BUDGET RECONCILIATION ACT OF1990, REVENUE EFFECTS BY TAX SOURCE(By fiscal year, in billions of dollars)
1991 1992 1993 1994 1995 1996
Individual IncomeCorporate IncomeSocial InsuranceExciseEstate and GiftCustoms DutiesMiscellaneous Receipts
-0.92.23.2
131a
0,00.2
3.90.8
10.118.0
a0.00.3
1.71.17.9
19.9-0.10.00.6
4.01.0
10.120.6-0.30.00.6
4.60.8
10.721.4-0.40.00.7
3.90.7
10.418.6-0.70.00.3
Total 17.9 33.0 31.1 36.0 37.8 33.2
Refundable Portion ofEarned Income Tax Creditb 0.2 2.5 3.2 4.1 6.7 6.9
Total Effect on Deficit -17.7 -30.4 -28.0 -32.0 -31.1 -26.2
SOURCE: Congressional Budget Office, baaed on estimates by the Joint Committee on Taxation.
a. Lees than $50 million.b. Classified as an outlay.

CHAPTER V THE REVENUE OUTLOOK 121
tain limits of automobiles, boats, aircraft, jewelry, and furs. In all,these measures increase excise receipts by about $20 billion per year.
For the first time since the Highway Trust Fund was establishedin 1956, not all highway tax receipts will be deposited in the trust fund.Revenue from 2.5 cents of the 5-cents-per-gallon increase in the motorfuel taxes will remain in the general fund. The baseline assumes thatthis portion of the tax expires on schedule at the end of fiscal year 1995.
The maximum taxable wage subject to the 1.45 percent tax forHospital Insurance (Part A of Medicare) was increased from $53,400 to$125,000 for 1991. The maximum continues to be indexed for wageincreases. Ninety-five percent of all wages earned by workers payingHospital Insurance taxes will now be subject to the tax, up from 89 per-cent in 1990. This change will raise about $6 billion per year in addi-tional revenue.
Social Security coverage is now mandatory for all employees ofstate and local governments unless they are members of their employ-ers' retirement plan, raising $2 billion per year in additional revenue.By the time they retire, most of these employees will qualify for SocialSecurity benefits through other jobs or through their spouses' jobs.Future increases in benefit payments stemming from the expandedcoverage will, therefore, be small.
The reconciliation act extended the 0.2 percent surtax paid by em-ployers to help fund Unemployment Insurance under the Federal Un-employment Tax Act. This surtax will raise about $1 billion each yearthrough 1995, after which it expires.
Income taxes have been increased for upper-income taxpayersthrough three provisions: a higher top tax rate, a revised phaseout ofpersonal exemptions, and a limit on itemized deductions. Before thereconciliation act, the benefit of the 15 percent tax bracket and per-sonal exemptions was phased out by means of a surtax on taxableincome above a floor. This created an implicit higher marginal rate of33 percent on income in the phaseout range. For income above thephaseout range, the marginal tax rate was 28 percent. The reconcili-ation act repealed the surtax and imposed a statutory rate of 31 per-

122 THE ECONOMIC AND BUDGET OUTLOOK January 1991
cent on all income (except capital gains) above limits virtually identi-cal to the beginning of the old phaseout range. In addition, the alterna-tive minimum tax rate was raised from 21 percent to 24 percent.
The reconciliation act also phases out the benefit of personalexemptions above an adjusted gross income (AGI) floor. The phaseoutbegins at $150,000 of AGI for joint filers ($100,000 for single filers),and proceeds at a rate of 2 percent per $2,500 of additional AGI. Inaddition, itemized deductions are now reduced by 3 percent of theamount by which a taxpayer's AGI exceeds $100,000, up to a maximumreduction of 80 percent of the originally allowable amount. Deductionsfor medical expenses, casualty and theft losses, and investment inter-est are exempt from the reduction.
In total, these three provisions will raise the taxes of about 2 per-cent of taxpayers while lowering the taxes of another 2 percent. To-gether they will bring in about $10 billion per year. The phaseout ofpersonal exemptions and the limitation on itemized deductions expirefor tax years beginning after 1995.
The reconciliation act significantly expanded the earned incometax credit (EITC) for lower-income families with children. In additionto increasing the amount of the existing EITC, the act further in-creased the credit for families with children under the age of one, andprovided a new credit for expenditures on health insurance premiumsfor children. These credits are refundable. (The refundable portion ofthe credit is recorded as an outlay in the budget.) The EITC expansionprovides $18 billion to lower-income families over the 1991-1995period.
Changes in corporate income taxes will raise about $1 billion inrevenue per year. The largest source of additional receipts is a new re-quirement that deductions for certain acquisition expenses of insur-ance companies be spread over time instead of completely taken in thefirst year. An increase in the rate of interest owed on tax underpay-ments will raise receipts in 1991. Other increases in corporate taxesresult from allowing the use of excess pension assets to fund retirees'health benefits, tightening the rules for deductions by insurance com-

CHAPTER V THE REVENUE OUTLOOK 123
panies of losses with salvage value, and refining a number of other taxrules.
Expiring Provisions of the Reconciliation Act
Four revenue-raising provisions of the reconciliation act will expire in1995, holding down the growth in baseline revenues in 1996: thephaseout of personal exemptions and the limit on itemized deductionsin the individual income tax, 2.5 cents of the 5-cents-per-gallon in-crease in taxes on motor fuels, and the 0.2 percent Federal Unemploy-ment Tax Act surcharge. In total, the loss of these revenue sourcesputs 1996 baseline revenues $7 billion below what they would be if theprovisions were permanent. A full year's effect of their expiration,measured at 1996 income levels, would be a $14 billion reduction inrevenues.
THE CHANGING DISTRIBUTION OF TAXES
The reconciliation act will have a modest effect on the distribution offederal taxes. Many provisions in the act were designed to increase theprogressivity of federal taxes (including; much higher refundable cred-its for lower-income families with earnings, if they have children, andhigher income and payroll taxes for upper-income families); however,other revenue provisions (particularly increases in federal excise tax-es) will tend to increase taxes relatively more for middle- and lower-income families.
The distribution of taxes is said to be progressive if the ratio oftaxes to income rises as incomes rise; to be regressive if the ratio fallsas incomes rise; and to be proportional if the ratio is the same at all in-come levels. Changes in progressivity depend on changes in the dis-tribution of income before tax as well as changes in the distribution oftaxes.
The reconciliation act increases the progressivity of the federal taxsystem-continuing in the direction begun under the Tax Reform Act of1986. Between 1980 and 1985, federal taxes became less progressive.
TTl

J J1L
124 THE ECONOMIC AND BUDGET OUTLOOK January 1991
The effective tax rate (the percentage of family income paid in taxes)for the one-fifth (quintile) of people in the highest-income families fellfrom 27.3 percent to 24.0 percent, while the effective tax rate for peoplein the lowest income quintile rose from 8.4 percent to 10.6 percent (seeTable V-4).
These changes were the result of different movements in the dis-tribution of effective tax rates for each federal tax source. Between1980 and 1985, effective social insurance and excise tax rates rose forall families. The rise in the social insurance tax rate reflected in-creases in the Social Security payroll tax rate and in the maximumamount of earnings subject to the tax, enacted in the Social SecurityAmendments of 1977 and 1983; the rise in effective excise tax rates re-sulted from increases in the federal tax on cigarettes, gasoline, andtelephone service. While these tax rates were rising, effective in-dividual and corporate income tax rates were falling for most families.However, effective individual income tax rates did not fall for familiesin the bottom third of the income distribution. The changes in effectiveindividual income tax rates resulted largely from the Economic Recov-ery Tax Act of 1981, which substantially reduced statutory tax ratesand increased allowable deductions, but failed to offset the effect on
TABLE V-4. EFFECTIVE FEDERAL TAX RATES
Income QuintileYear
1977
1980
1985
Lowest
9.5
8.4
10.6
Second
15.6
15.7
16.1
Middle
19.6
20.0
19.3
Fourth
21.9
23.0
21.7
Highest
27.1
27.3
24.0
Projected Rates for 1991Before OBRA 9.5 16.6 20.2 22.5 26.0After OBRA 8.8 16.8 20.7 23.0 26.8
SOURCE: Congressional Budget Office simulation models.
NOTE: OBRA = Omnibus Budget Reconciliation Act of 1990.

CHAPTER V THE REVENUE OUTLOOK 125
lower-income families of an inflation-induced decline in the real valueof personal exemptions, zero bracket amounts (standard deductions),andtheEITC.
Most of the reduction in progressivity resulted from the increase inpayroll taxes and the decrease in individual income taxes. The indi-vidual income tax is a highly progressive tax, while social insurancepayroll taxes are much less progressive over much of the income dis-tribution and even regressive in the highest-income range. A shiftfrom income to payroll taxes, therefore, reduces the progressivity oftotal federal taxes.
The Tax Reform Act of 1986 made changes that will render theindividual income tax system more progressive in 1991 than it was in1985. Measured before the effects of the reconciliation act, the effec-tive tax rate for people with the highest incomes was projected to risefrom 24.0 percent in 1985 to 26.0 percent in 1991, while the effectivetax rate for people in the lowest incomes quintile was projected to fallfrom 10.6 percent to 9.5 percent. The reduced effective tax rate forlower-income families stems from the increases in the standard deduc-tion, personal exemptions, and the EITC enacted in the Tax ReformAct.
The reconciliation act is projected to further lower effective taxrates for families with the lowest incomes and to raise slightly the ef-fective tax rates for upper-income families. Families with the veryhighest incomes-the top 1 percent-will have the greatest increase ineffective tax rates. The reductions for lower-income families areachieved through the expansion in the EITC, while the increases forfamilies with the highest incomes reflect the higher top income taxrate, the phaseout of personal exemptions and itemized deductions,and the higher taxable wage base for the Hospital Insurance payrolltax. Although the 1990 tax changes are modest compared with theeffects of the Tax Reform Act, the net result of all of these changes willbe to restore the progressivity of the federal tax system to about whereit was at the beginning of the last decade.
Til

Jil.

APPENDIXES
T~


APPENDIX A
SEQUESTRATION PREVIEW REPORT
The Budget Enforcement Act of 1990 amended the Balanced Budgetand Emergency Deficit Control Act of 1985 to add new enforcementmechanisms for entitlement spending, receipts, and discretionaryspending for fiscal years 1991 through 1995. The law requires theCongressional Budget Office to issue a sequestration preview reportfive days before the President's budget submission. This year's pre-view report must contain estimates of the following items:
o The discretionary spending limits and any adjustments tothose limits,
o The amount by which direct spending or receipt legislationenacted after the Budget Enforcement Act has increased ordecreased the deficit, and
o The maximum deficit amount.
This appendix provides the required information. Chapter II of thisvolume summarizes the provisions of the Budget Enforcement Act.
DISCRETIONARY SEQUESTRATION REPORT
CBO's estimates of the limits on discretionary spending in the threecategories-defense, international, and domestic—for fiscal years 1991,1992, and 1993 are shown in Table A-l. Table A-2 provides CBO's esti-mates of the limits on total discretionary spending for fiscal years 1994and 1995.
In its November 6, 1990, sequestration report, CBO adjusted thelimits for fiscal year 1991 for Internal Revenue Service funding, debt

130 THE ECONOMIC AND BUDGET OUTLOOK January 1991
TABLE A-l. CBO ESTIMATES OF DISCRETIONARY SPENDINGLIMITS FOR FISCAL YEARS 1991,1992, AND 1993(In millions of dollars)
1991Budget
Authority Outlays
1992Budget
Authority Outlays
1993Budget
Authority Outlays
Defense Discretionary
Enacted LimitsAdjustments
Emergency 1990 appropriationsChange in 1990 inflation
Total
Limits as of January 30, 1991
288,918
1,000n.a.
1,000
289,918
297,660
1,164n.a.
1,164
298,824
291,643
0-302
-302
291,341
295,744
328-192
136
295,880
291,785
0-314
-314
291,471
292,686
77-256
-179
292,507
International Discretionary
Enacted Limits
AdjustmentsDebt forgivenessCredit reformChange in 1990 inflation
Total
Limits as of January 30, 1991
Enacted Limits
AdjustmentsIKS 1991 fundingCredit reformCategory changes
Nuclear RegulatoryCommission fees
Tongass timber supplyForest Service permanent
appropriationsTemporary emergency food
assistance programCommodities for soup kitchensInterim assistance to states
Other changes in conceptsTrust fund budget authorityLease-purchase arrangementsSocial Security off-budget
Change in 1990 inflation
Total
Limits as of January 30, 1991
20,100
0n.a.n.a.
0
20,100
Domestic
18:2,700
191n.a.
n.a.n.a.
n.a.
n.a.n.a.n.a.
n.a.n.a.n.a.n.a.
191
182,891
18,600
100n.a.n.a.
100
18,700
20,500
0-452-21
-473
20,027
19,100
129-340-10
-221
18,879
21,400
0-469-21
-490
20,910
19,600
167-35-14
118
19,718
Discretionary
198,100
183n.a.
n.a.n.a.
n.a.
n.a.n.a.n.a.
n.a.n.a.n.a.n.a.
183
198,283
191,300
01,045
-30746
0
12033
-584
5,78800
-199
5,942
197,242
210,100
8-282
-30730
-28
120330
0436
-2,462-109
-2,561
207,539
198,300
0687
-32148
0
125340
6,07200
-206
6,439
204,739
221,700
0-161
-32147
0
125340
0495
-2,589-173
-2,543
219,157
SOURCE: Congressional Budget Office.
NOTE: n.a. = not applicable.

APPENDIX A SEQUESTRATION PREVIEW REPORT 131
forgiveness, and emergency appropriations for Operation DesertShield, as provided in section 251(b)(2) of the amended Balanced Bud-get Act. Tables A-l and A-2 show the corresponding adjustments forlater years. CBO has now made further adjustments to the limits forchanges in budgetary concepts and definitions and changes in infla-tion, as provided in section 251(b)(l).
TABLE A-2. CBO ESTIMATES OF DISCRETIONARY SPENDINGLIMITS FOR FISCAL YEARS! 1994 AND 1995(In millions of dollars)
1994Budget
Authority Outlays
1995Budget
Authority Outlays
Enacted Limits 510,800 534,800 517,700 540,800
AdjustmentsEmergency 1990
appropriations 0 21 0 0Debt forgiveness 0 210 0 231Credit reform 257 90 323 80Category changes
Nuclear RegulatoryCommission fees -337 -337 -353 -353
Tongass timber supply 51 50 53 52Temporary emergency
food assistance program 129 129 135 135Commodities for soup kitchens 36 36 37 37
Other changes in conceptsTrust fund budget
authorityLease-purchase
arrangementsSocial Security off-
budgetChange in 1990 inflation
Total
6,352
0
0-564
5,924
Limits as of January 30, 1991 516,724
0
641
-2,719-516
-2,395
532,405
6,752
0
0-590
6,357
524,057
0
174
-2,856-562
-3,062
537,738
SOURCE: Congressional Budget Office.
r~

132 THE ECONOMIC AND BUDGET OUTLOOK January 1991
Changes in Concepts and Definitions
The Budget Enforcement Act made various changes in budgetary con-cepts and definitions. The act provides that the discretionary limitsshall be adjusted for these and other conceptual changes.
Credit Reform. The Federal Credit Reform Act of 1990 ends cash-flowaccounting and institutes subsidy-cost accounting for federal creditprograms. Starting in fiscal year 1992, subsidy costs for discretionarycredit programs will be subject to annual appropriation and will be in-cluded in the discretionary spending limits. The act also providespermanent, indefinite spending authority to liquidate credit obliga-tions incurred before 1992. These changes will sometimes increase andsometimes decrease discretionary budget authority and outlays.Tables A-l and A-2 show the adjustments that CBO estimates shouldbe made to the discretionar}^ spending limits so that the Appropria-tions Committees are not advantaged or disadvangtaged by creditreform.
Category Changes. Recent legislation has reclassified three manda-tory programs as discretionary-the Tongass timber supply fund, thetemporary emergency food assistance program, and commodities forsoup kitchens. The discretionary spending limits must be correspond-ingly increased.
In two cases—Forest Service permanent appropriations, and inter-im assistance to states for legalization of aliens--1991 appropriationacts increased 1992 spending for mandatory programs. Also, thereconciliation act increased Nuclear Regulatory Commission cost-recovery fees, which will be treated as percentage offsets to discre-tionary appropriations. The discretionary spending limits must bereduced so that the Appropriations Committees are held responsiblefor their actions and do not benefit from actions of other Congressionalcommittees.
Other Changes. Three other conceptual changes also require ad-justments to the discretionary spending limits. First, the Budget En-forcement Act provides that authority to pay administrative expensesfrom the Hospital Insurance, Supplementary Medical Insurance, Un-

APPENDIX A SEQUESTRATION PREVIEW REPORT 133
employment Insurance, and Railroad Retirement trust funds shall nowbe counted as budget authority, thus requiring an increase in thebudget authority limits.
Second, Congressional scoring of the 1991 appropriation bills as-sumed that 10 federal office buildings would be acquired under lease-purchase arrangements, which would have had little immediate effecton outlays under the 1991 scorekeeping rules. Under the newscorekeeping procedures, however, outlays for a lease-purchase will berecorded when the building is built. Although the Administration hasnow decided to build the 10 buildings using funds borrowed from theTreasury's Federal Financing Bank, the budgetary effect will be thesame as a lease-purchase, and the discretionary outlay limits musttherefore be increased.
Third, section 13301 of the Budget Enforcement Act provides thatthe receipts and disbursements of the Social Security retirement anddisability trust funds shall not be counted as new budget authority oroutlays for purposes of the President's budget, the Congressional bud-get, or the Balanced Budget Act. Excluding Social Security adminis-trative expenses from the budget requires a reduction in the discre-tionary spending limits.
Change in 1990 Inflation
The discretionary spending limits are also adjusted for differences be-tween actual and expected inflation for the most recently completedfiscal year. The Budget Enforcement Act assumed that the grossnational product implicit price deflator would increase by 4.1 percentin fiscal year 1990. The actual increase was only 4.0 percent. Thisdifference requires a small reduction in the spending caps for all years.
PAY-AS-YOU-GO SEQUESTRATION REPORT
Since the enactment of the Budget Enforcement Act, no direct spend-ing or receipt legislation has been enacted that would increase or de-crease the deficit in fiscal year 1991 or 1992. Therefore, no net deficit
~T?T T~
134 THE ECONOMIC AND BUDGET OUTLOOK January 1991
increase or decrease exists for those years, and no sequestration isneeded to comply with the pay-as-you-go requirement.
DEFICIT SEQUESTRATION REPORT
The estimated maximum deficit amounts equal the projected on-budget baseline deficits, assuming that discretionary spending is heldto the adjusted limits (less any net deficit increases or decreases re-sulting from direct spending or receipt legislation). Using the eco-nomic forecast described in Chapter I of this volume and CBO's currenttechnical estimating assumptions, the maximum deficit amounts are:
Fiscal Year Maximum Deficit Amount
1992 $353 billion1993 $292 billion1994 $256 billion1995 $169 billion
These figures exclude the special budget authority allowances, whichwill not be made until the end of the Congressional session, and there-fore differ slightly from the on-budget deficits shown in the Summaryand Chapter III.

APPENDIX B
REPORT ON BALANCES PAID
FROM EXPIRED ACCOUNTS
Most appropriated funds are available for only a limited period of time,usually one to three years. Once federal agencies commit funds, theymust record and pay for their obligations*. In the past, agencies wouldkeep track of their obligations for two years after the expiration date--after which no new contracts could be signed. Then, any remainingfunds were combined with similar balances from previous years andwere available indefinitely to pay for unliquidated obligations made inprevious years.
The Defense Authorization Act of 1991 amends this procedure forall federal agencies making these payments. The act also requires theCongressional Budget Office to estimate the effect on the deficit of pay-ments made under the new procedure. Under the changes mandatedby the act, the system of merged accounts for paying obligations iseliminated. Instead, appropriation balances remain assigned to aspecific year for five years after their availability expires. After thisfive-year period, the balances will no longer be available; agencies willhave to use their currently appropriated funds or request additionalappropriations from the Congress to pay any outstanding obligations.
CBO does not project any change in its deficit calculations arisingfrom these new procedures. When discussing outlays of the Depart-ment of Defense, Administration officials have expressed a similarbelief that these procedural changes would not change their deficitcalculations. The deficit calculations would not change because thenew law would change only the procedure for paying certain obliga-tions, not to what extent they are paid. Administration officialsstressed that the agencies will continue to focus on obligations, leavingoutlay patterns the same as in the past. In any case, data do not existto estimate a new flow of funds, including to what extent agencies willhave to use funds from their current appropriations or request addi-tional funds from the Congress to pay off old obligations.

_l

APPENDIX C
THE FEDERAL SECTOR OF THE
NATIONAL INCOME AND
PRODUCT ACCOUNTS
In analyzing the government's role in the economy, many macro-economists prefer using the measures of the national income and prod-uct accounts (NIPA) rather than the usual budget totals. These ac-counts, maintained by the Commerce Department, provide the basicinformation about activity in all sectors of the economy. While similarto those of the budget, the NIP A measures are generally superior whenexamining the economic impact of federal government activity. Dif-ferences between the budget and NIPA totals fall into four categories:the netting and grossing of receipts, the exclusion of lending andfinancial activities, timing adjustments, and geographic coverage (seeTable C-l).
Although netting and grossing adjustments do not affect the totalNIPA deficit, they do boost totals of both NIPA receipts and expendi-tures compared with their budget counterparts. Differences in nettingand grossing arise because two types of collections are treated as nega-tive outlays in the budget but are transferred to the receipts side in theNIPA. The first type of collection represents contributions by federalagencies to the Civil Service Retirement Trust Fund, Social Security,and other benefit plans. As an intrabudgetary transaction, thesetransfers represent both a cost to the employing agencies and a receiptto the retirement fund. The second type of collection consists of volun-tary payments by the public (such as Medicare premiums and mineralleases), which are also recorded as negative outlays. Clearly, shiftingthese collections between expenditures and receipts does not affect themeasured deficit, but it more accurately depicts the government's totalcollections from all sources and its spending for all purposes.
By far, the most important factor causing the budget and NIPAmeasures of the deficit to diverge is the category of lending and finan-cial exclusions. Exchanges of existing assets and liabilities are gen-
TTT"
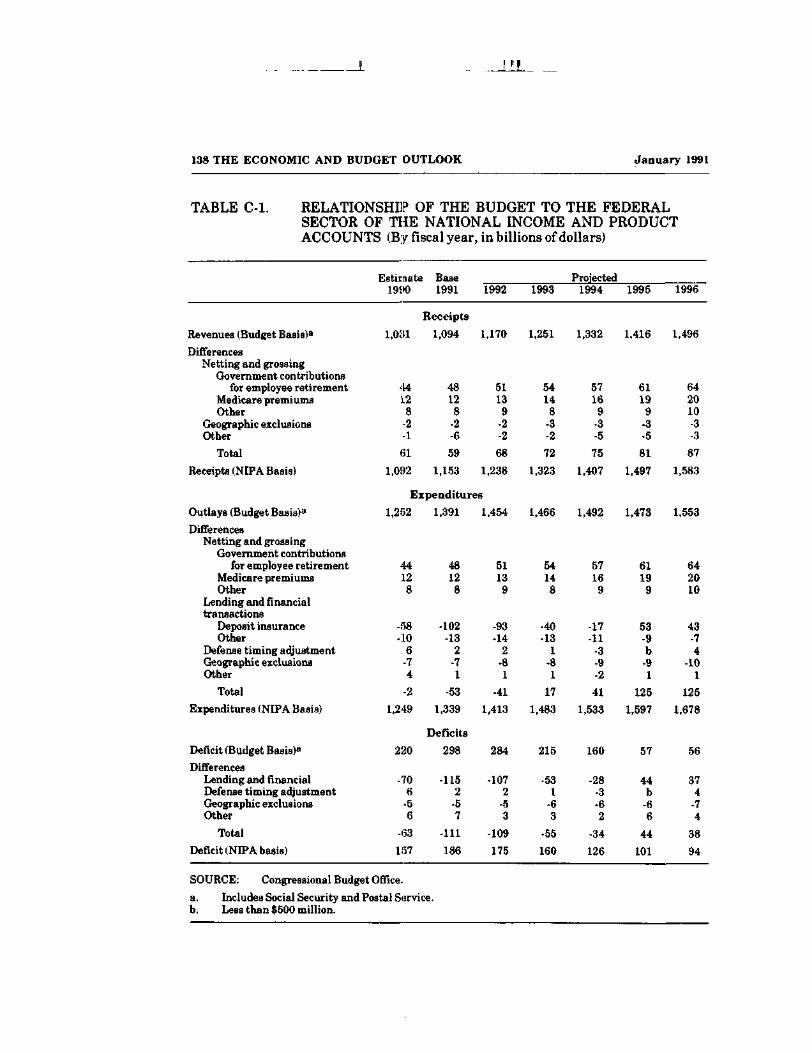
LLJ_ _
138 THE ECONOMIC AND BUDGET OUTLOOK January 1991
TABLE C-l. RELATIONSHIP OF THE BUDGET TO THE FEDERALSECTOR OF THE NATIONAL INCOME AND PRODUCTACCOUNTS (By fiscal year, in billions of dollars)
Estimate Base
Revenues (Budget Basis)3
DifferencesNetting and grossing
Government contributionsfor employee retirement
Medicare premiumsOther
Geographic exclusionsOther
Total
Receipts (NIPA Basis)
1990
1,031
<WL28
-2-1
61
1,092
1991
Receipts
1,094
48128
-2-6
59
1,153
1992
1,170
51139
-2-2
68
1,238
1993
1,251
54148
-3-2
72
1,323
Proiected1994
1,332
57169
-3-5
75
1,407
1995
1,416
61199
-3-5
81
1,497
1996
1,496
642010-3-3
87
1,583
Expenditures
Outlays (Budget Basis)3
DifferencesNetting and grossing
Government contributionsfor employee retirement
Medicare premiumsOther
Lending and financialtransactions
Deposit insuranceOther
Defense timing adjustmentGeographic exclusionsOther
Total
Expenditures (NIPA Basis)
Deficit (Budget Basis)8
DifferencesLending and financialDefense timing adjustmentGeographic exclusionsOther
Total
Deficit (NIPA basis)
1,252
'14128
-58-10
6-74
-2
1,249
220
-706
-56
-153
1157
1,391
48128
-102-13
2-71
-53
1,339
Deficits
298
-1152
-57
-111
186
1,454
51139
-93-14
2-81
-41
1,413
284
-1072
-53
-109
175
1,466
54148
-40-13
1-81
17
1,483
215
-531
-63
-55
160
1,492
57169
-17-11
-3-9-2
41
1,533
160
-28-3-62
-34
126
1,473
61199
53-9b
-91
125
1,597
57
44b
-66
44
101
1,553
642010
43-74
-101
125
1,678
56
374
-74
38
94
SOURCE: Congressional Budget Office.
a. Includes Social Security and Postal Service.b. Less than $500 million.

APPENDIX C THE FEDERAL SECTOR OF THE NIPA 139
erally excluded from the NIPA because they do not generate currentincome or production. Thus, the NIPA spending totals do not includeloans extended by the government, loan repayments, and the sale ofassets. In the 1991-1996 period, spending by the deposit insuranceagencies dominates this category of exclusions. NIPA expenditures es-sentially exclude all but the premium income, interest, and adminis-trative costs of the deposit insurance agencies.
Remaining differences between the budget and NIPA concepts aremuch smaller but can take on great importance at particular times.Timing differences occur because the budget records most transactionson a cash basis, while the NIPA often uses an accrual basis. (This ap-proach has generally left NIPA expenditures impervious to shifts of afew days in benefit payments or federal employees' pay.) In the NIPA
Figure C-1.Deficit as Measured by the National Income andProduct Accounts and the Budget:
300Billions of Dollars
200
100
Actual , Projected
Budget Deficit
I I1980 1985 1990 1995
SOURCES: Congressional Budget Office; Department of Commerce, Bureau of Economic Analysis.
38-033 0 - 91 — 6 : QL 3

LL.
140 THE ECONOMIC AND BUDGET OUTLOOK January 1991
projections, timing differences are most important in corporate profitstax accruals and, on the spending side, in defense purchases. Geo-graphic differences in computing gross national product and othernational economic data stem from the NIPA's exclusion of Puerto Rico,the Virgin Islands, and other areas.
During the 1980-1986 period, the NIPA and budget deficits gen-erally paralleled each other, with the NIPA deficit remaining about$20 billion below the budget deficit (see Figure C-l on the precedingpage). Variations in the relationship between the two deficit measuresare dominated by the large swings in lending and financial exclusions.In 1987, when lending and financial exclusions were at their 10-yearlow, the NIPA deficit actually exceeded the budget deficit by $13 bil-lion. In 1990, increased spending on deposit insurance resulted in larg-er lending and financial exclusions, further broadening the gap be-tween the NIPA and budget deficits. CBO projects that this trend willcontinue in 1991. Between 1992 and 1994, CBO projects a decline inspending on deposit insurance, which draws the NIPA and budget defi-cits closer together. After 1994, CBO projects large net inflows fromsales of assets held by the Resolution Trust Corporation (RTC). Thisswing in lending and financial exclusions will cause the NIPA deficitto exceed the budget deficit in 1995 and 1996.
The federal sector of the NIPA generally divides receipts accordingto their source and expenditures according to their purpose and desti-nation. Table C-2 divides receipts and expenditures into their NIPAcategories. Defense and nondefense purchases of goods and servicesenter directly into GNP. The other categories of expenditures—trans-fer payments, net interest, subsidies less current surpluses of govern-ment enterprises, and grants to state and local governments—do not in-volve the delivery of goods or services to the government; their effecton GNP depends on the recipients' use of the funds and is thus lessdirect.
During the 1991-1996 period, both the RTC and the Bank Insur-ance Fund (BIF) will borrow funds from the Federal Financing Bank(FFB). This borrowing will increase NIPA net interest but will leavenet interest in the unified budget virtually unchanged. The new bor-

APPENDIX C THE FEDERAL SECTOR OF THE NIPA 141
TABLE C-2. PROJECTIONS OF BASELINE RECEIPTS ANDEXPENDITURES MEASURED BY THE NATIONALINCOME AND PRODUCT ACCOUNTS(By fiscal year, in billions of dollars)
Estimate Base Projected
Personal Tax andNontax Receipts
Corporate ProfitsTax Accruals
Indirect Business Taxand Nontax Accruals
Contributions forSocial Insurance
Total
Purchases of Goodsand Services
DefenseNondefense
Subtotal
Transfer Payments
Grants- in- Aid to Stateand Local Governments
Net Interest
Subsidies Less CurrentSurplus of GovernmentEnterprises
Required Reductions inDiscretionary Spending
Total
Deficit
1990
484
108
60
440
1,092
307107415
504
128
182
22
n.a.
1,249
157
1991 1992 1993 1994 1995
Receipts
504 543 585 627 675
114 121 126 128 129
71 77 80 84 87
465 497 532 569 606
1,153 1,238 1,323 1,407 1,497
Expenditures
313 313 319 330 344121 132 139 145 151434 445 458 475 494
535 581 617 656 702
146 161 172 183 196
202 219 235 245 246
22 21 23 20 21
n.a. -13 -22 -46 -62
1,339 1,413 1,483 1,533 1,597
Deficit
186 175 160 126 101
1996
721
131
87
644
1,583
358158516
749
209
245
24
-65
1,678
94
SOURCE: Congressional Budget Office.
NOTE: n.a. = not applicable.

142 THE ECONOMIC AND BUDGET OUTLOOK January 1991
rowing necessitates higher interest payments on public debt, whichincreases both NIPA and unified net interest. Net interest in the uni-fied budget also includes interest received by the FFB (though not in-terest paid by the RTC and BIF), which offsets the increase in intereston the public debt. In the NIPA, however, both interest paid by thedeposit insurance fund and interest received by the FFB are excludedas intrabudgetary transactions. Therefore, the new borrowing boostsNIPA net interest, as it should, by roughly the interest generated bythe additional public borrowing.

APPENDIX D
HISTORICAL BUDGET DATA
Historical data for revenues, outlays, and the deficit are shown in thisappendix. Estimates of the standardized-employment deficit and itsrevenue and outlay components for fiscal years 1956 through 1990 arereported in Table D-l, along with estimates of nominal potential grossnational product and the corresponding nonaccelerating inflation rateof unemployment (NAIRU).
The change in the standardized-employment deficit is a commonlyused measure of the short-run impact of discretionary fiscal policy onaggregate demand. The standardized-employment deficit excludes therevenue and outlay effects of cyclical fluctuations in output and unem-ployment. More specifically, standardized-employment revenues arethe federal revenues that would be collected if the economy wereoperating at its potential level of GNP, These revenues are greaterthan actual revenues when actual GNP is below its potential levelbecause the actual tax bases are then cyclically depressed. Stan-dardized-employment outlays are the federal outlays that would be re-corded if the economy were at an unemployment rate consistent withstable inflation—the NAIRU, which is also the benchmark used tocompute potential GNP. These outlays are less than actual outlayswhen the actual rate of unemployment is higher than the NAIRU be-cause actual transfer payments for Unemployment Insurance andother programs are then cyclically inflated.
Budget data consistent with the budget projections in this reportare available for fiscal years 1962 through 1990 and reported in TablesD-2 through D-9. The data are shown both in nominal dollars and as apercentage of gross national product. Federal revenues, outlays, defi-cit or surplus, and debt held by the publiic are shown in Tables D-2 andD-3. Revenues, outlays, and the deficit have both on-budget and off-budget components. Social Security receipts and outlays were placedoff-budget by the Balanced Budget and Emergency Deficit Control Act
-7-7-

144 THE ECONOMIC AND BUDGET OUTLOOK January 1991
of 1985; the Postal Service was moved off-budget beginning in 1989 bythe Omnibus Budget Reconciliation Act of 1989. Both Social Securityand the Postal Service are excluded from the calculation of the maxi-mum deficit amount under the Budget Enforcement Act of 1990.
The major sources of federal revenues (including off-budget reve-nues) are presented in Tables D-4 and D-5. Social insurance taxes andcontributions include employer and employee payments for Social Se-curity, Medicare, Railroad Retirement, Unemployment Insurance, andpension contributions by federal workers. Excise taxes are levied oncertain products and services, such as gasoline, alcoholic beverages,and air travel. The windfall profit tax on domestic oil producers, en-acted in 1980 and classified as an excise tax, was repealed in 1988.Miscellaneous receipts consist of deposits of earnings by the FederalReserve System and numerous fees and charges.
Total on- and off-budget outlays for major spending categories areshown in Tables D-6 and D-7. National defense and net interest areidentical to the budget functions with the same titles (functions 050and 900, respectively). Entitlements and other mandatory spendinginclude programs for which spending is governed by laws making thosewho meet certain requirements eligible to receive payments. Addi-tional detail on entitlement programs is shown in Tables D-8 and D-9.Nondefense discretionary spending consists of all programs other thandefense that are controlled through the appropriation process. Off-setting receipts include the federal government's contribution towardemployee retirement, fees and charges such as Medicare premiums,and receipts from the use of federally controlled land and offshoreterritory.

APPENDIX D HISTORICAL BUDGET DATA 145
TABLE D-l. STANDARDIZED-EMPLOYMENT DEFICIT ANDRELATED SERIES, FISCAL YEARS 1956-1990(In billions of dollars)
FiscalYear
19561957195819591960
19611962196319641965
19661967196819691970
19711972197319741975
19761977197819791980
19811982198319841985
1986198719881989b1990b
Standardized - EmploymentRevenues
73.779.983.881.995.0
100.3103.4110.3113.8116.3
124.8142.4145.8178.7191.5
190.6210.8225.2260.6295.6
316.7368.7403.3463.4535.5
624.1679.7678.3708.9764.2
793.8877.9906.7983.8
1,045.2
Outlays
71.277.382.091.292.0
96.8106.1111.1118.5118.9
136.2159.7180.6186.9198.5
210.5230.6247.0271.7328.2
363.2402.9456.7503.6586.3
669.0727.9781.5836.5935.0
979.6996.4
1,062.51,123.61,194.7
Deficit (-)
2.42.71.8-9.12.9
3.5-2.7-0.7-4.7-2.6
-11.4-17.3-34.8-8.1-7.0
-19.8-19.8-21.8-11.1-32.6
-46.5-34.3-53.3-40.2-i)0.8
-45.0-48.2-103.2-127.6-170.8
-135.8-118.5-155.8-139.8-149.4
PotentialGNP
408.3434.6459.4484.1510.7
534.9564.6596.6627.8664.9
709.1760.3816.2891.9976.4
1,060.51,155.41,253.11,398.81,585.0
1,761.01,975.62,178.12,446.92,736.3
3,067.43,376.13,604.83,838.74,054.4
4,268.74,507.74,771.65,107.65,456.8
NAIRUa
5.15.15.05.15.2
5.25.35.45.55.6
5.65.65.65.65.6
5.75.85.85.96.0
6.06.05.95.95.9
6.05.95.85.75.7
5.65.65.55.55.4
SOURCE: Congressional Budget Office.a. The NAIRU is the nonaccelerating inflation rate of unemployment. It is the benchmark for com-
b.puting potential GNP.
Excludes deposit insurance.
r~

1
146 THE ECONOMIC AND BUDGET OUTLOOK January 1991
TABLE D-2. REVENUES, OUTLAYS, DEFICITS, AND DEBTHELD BY THE PUBLIC, FISCAL YEARS 1962-1990(In billions of dollars)
Deficit (-) or Surplus
1962196319641965
19661967196819691970
19711972197319741975
19761977197819791980
19811982198319841985
19861987198819891990
SOURCE:
Revenues
99.7106.6112.6116.8
130.8148.8153.0186.9192.8
187.1207.3230.8263.2279.1
298.1355.6399.6463.3517.1
599.3617.8600.6666.5734.1
769.1854.1909.0990.7
1,031.5
Outlays
106.8111.3118.5118.2
134.5157.5178.1183.6195.6
210.2230.7245.7269.4332.3
371.8409.2458.7503.5590.9
678.2745.7808.3851.8946.3
990.31,003.81,064.11,144.11,251.9
On-Budget
-i>.9-4.0-6.5-1.6
-3.1-12.6-27.7-0.5-8.7
-26.1-26.4-15.4-8.0
-55.3
-70.5-49.7-54.9-38.2-72.7
-73.9-120.0-208.0-185.6-221.6
-237.9-169.3-193.9-206.1-277.0
SocialSecurity
-1.3-0.80.60.2
-0.64.02.63.75.9
3.03.10.51.82.0
-3.2-3.9-4.3-2.0-1.1
-5.0-7.90.20.39.4
16.719.638.852.458.2
PostalService
0.00.00.00.0
0.00.00.00.00.0
0.00.00.00.00.0
0.00.00.00.00.0
0.00.00.00.00.0
0.00.00.00.3-1.6
Total
-7.1-4.8-5.9-1.4
-3.7-8.6
-25.23.2
-2.8
-23.0-23.4-14.9-6.1
-53.2
-73.7-53.6-59.2-40.2-73.8
-78.9-127.9-207.8-185.3-212.3
-221.2-149.7-155.1-153.4-220.4
DebtHeld by
the Public
248.0254.0256.8260.8
263.7266.6289.5278.1283.2
303.0322.4340.9343.7394.7
477.4549.1607.1639.8709.3
784.8919.2
1,131.01,300.01,499.4
1,736.21,888.12,050.32,190.72,410.4
Congressional Budget Office.
APPENDIX D HISTORICAL BUDGET DATA 147
TABLE D-3. REVENUES, OUTLAYS, DEFICITS, AND DEBTHELD BY THE PUBLIC, FISCAL YEARS 1962-1990(As a percentage of GNP)
Deficit (-) or Surplus
1962196319641965
19661967196819691970
19711972197319741975
19761977197819791980
19811982198319841985
19861987198819891990
SOURCE:
Revenues
17.918.117.917.4
17.718.718.020.119.5
17.718.018.018.618.3
17.618.418.418.919.4
20.119.718.118.118.6
18.419.319.019.319.1
Outlays
19.218.918.817.6
18.219.821.019.819.8
19.920.019.219.021.8
21.921.221.120.622.1
22.723.824.323.123.9
23.722.722.322.323.2
On-Budget
-1.1-0.7-1.0-0.2
-0.4-1.6-3.3-0.1-0.9
-2.5-2.3-1.2-0.6-3.6
-4.2-2.6-2.5-1.6-2.7
-2.5-3.8-6.3-5.0-5.6
-5.7-3.8-4.1-4.0-5.1
SocialSecurity
-0.2-0.10.1
a
-0.10.50.30.40.6
0.30.3
a0.10.1
-0.2-0.2-0.2-0.1
a
-0.2-0.3
aa
0.2
0.40.40.81.01.1
PostalService
0.00.00.00.0
0.00.00.00.00.0
0.00.00.00.00.0
0.00.00.00.00.0
0.00.00.00.00.0
0.00.00.0
aa
Total
-1.3-0.8-0.9-0.2
-0.5-1.1-3.00.3
-0.3
-2.2-2.0-1.2-0.4-3.5
-4.3-2.8-2.7-1.6-2.8
-2.6-4.1-6.3-5.0-5.4
-5.3-3.4-3.2-3.0-4.1
DebtHeld by
the Public
44.543.240.838.8
35.733.634.129.928.6
28.728.026.624.325.9
28.128.428.026.126.6
26.329.334.035.337.9
41.542.742.942.744.6
Congressional Budget Office.
a. Less than 0.05 percent.
'7T
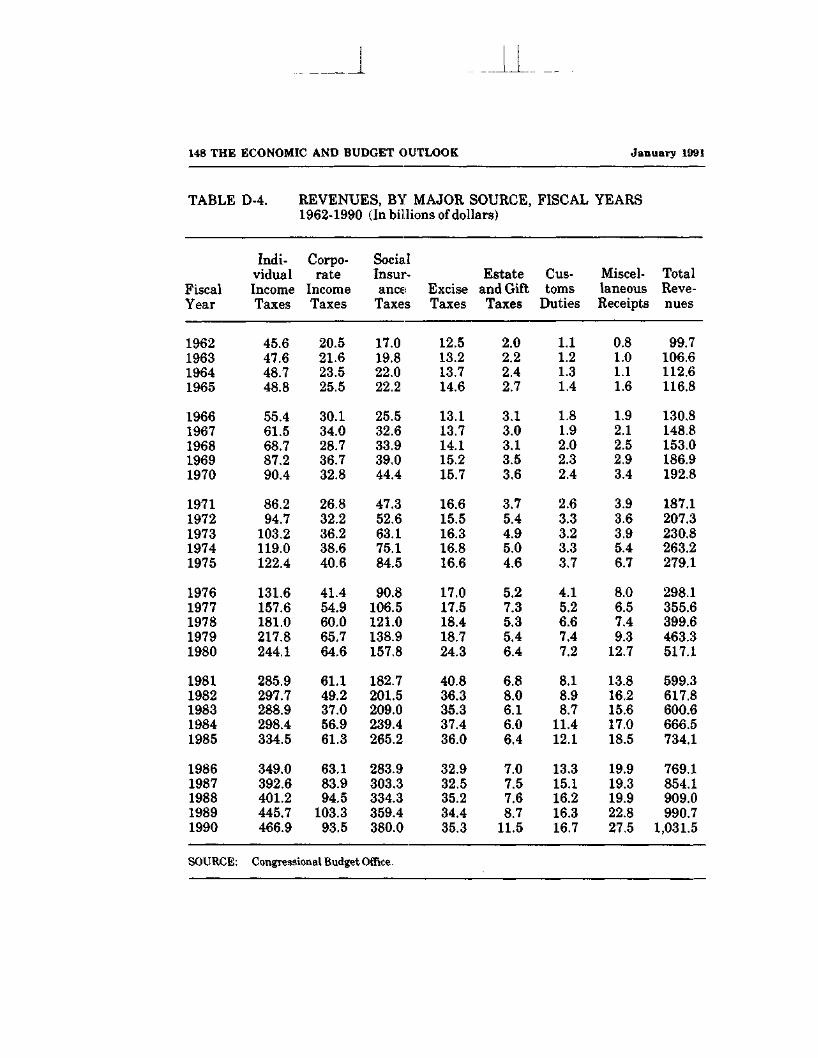
148 THE ECONOMIC AND BUDGET OUTLOOK January 1991
TABLE D-4. REVENUES, BY MAJOR SOURCE, FISCAL YEARS1962-1990 (In billions of dollars)
FiscalYear
1962196319641965
19661967196819691970
19711972197319741975
19761977197819791980
19811982198319841985
19861987198819891990
Indi-vidualIncomeTaxes
45.647.648.748.8
55.461.568.787.290.4
86.294.7
103.2119.0122.4
131.6157.6181.0217.8244.1
285.9297.7288.9298.4334.5
349.0392.6401.2445.7466.9
Corpo-rate
IncomeTaxes
20.521.623.525.5
30.134.028.736.732.8
26.832.236.238.640.6
41.454.960.065.764.6
61.149.237.056.961.3
63.183.994.5
103.393.5
SocialInsur-ance!
Taxes
17.019.822.022.2
25.532.633.939.044.4
47.352.663.175.184.5
90.8106.5121.0138.9157.8
182.7201.5209.0239.4265.2
283.9303.3334.3359.4380.0
EstateExcise and GiftTaxes Taxes
12.513.213.714.6
13.113.714.115.215.7
16.615.516.316.816.6
17.017.518.418.724.3
40.836.335.337.436.0
32.932.535.234.435.3
2.02.22.42.7
3.13.03.13.53.6
3.75.44.95.04.6
5.27.35.35.46.4
6.88.06.16.06.4
7.07.57.68.7
11.5
Cus-toms
Duties
1.11.21.31.4
1.81.92.02.32.4
2.63.33.23.33.7
4.15.26.67.47.2
8.18.98.7
11.412.1
13.315.116.216.316.7
Miscel- Totallaneous Reve-Receipts nues
0.81.01.11.6
1.92.12.52.93.4
3.93.63.95.46.7
8.06.57.49.3
12.7
13.816.215.617.018.5
19.919.319.922.827.5
99.7106.6112.6116.8
130.8148.8153.0186.9192.8
187.1207.3230.8263.2279.1
298.1355.6399.6463.3517.1
599.3617.8600.6666.5734.1
769.1854.1909.0990.7
1,031.5
SOURCE: Congressional Budget Office.

APPENDIX D HISTORICAL BUDGET DATA 149
TABLE D-5. REVENUES, BY MAJOR SOURCE, FISCAL YEARS1962-1990 (As a percentage of GNP)
FiscalYear
1962196319641965
19661967196819691970
19711972197319741975
19761977197819791980
19811982198319841985
19861987198819891990
Indi-vidualIncomeTaxes
8.28.17.77.3
7.57.78.19.49.1
8.28.28.18.48.0
7.78.28.38.99.1
9.69.58.78.18.5
8.38.98.48.78.6
Corpo-rate
IncomeTaxes
3.73.73.73.8
4.14.33.43.93.3
2.52.82.82.72.7
2.42.82.82.72.4
2.01.61.11.51.6
1.51.92.02.01.7
SocialInsur-ance
Taxes
3.13.43.53.3
3.54.14.04.24.5
4.54.64.95.35.6
5.35.55.65.75.9
6.16.46.36.56.7
6.86.97.07.07.0
ExciseTaxes
2.22.22.22.2
1.81.71.71.61.6
1.61.31.31.21.1
1.00.90.80.80.9
1.41.21.11.00.9
0.80.70.70.70.7
Estatearid GiftTaxes
0.40.40.40.4
0.40.40.40.40.4
0.40.50.40.40.3
0.30.40.20.20.2
0.20.30.20.20.2
0.20.20.20.20.2
Cus-toms
Duties
0.20.20.20.2
0.20.20.20.20.2
0.20.30.20.20.2
0.20.30.30.30.3
0.30.30.30.30.3
0.30.30.30.30.3
Miscel-laneousReceipts
0.20.20.20.2
0.30.30.30.30.3
0.40.30.30.40.4
0.50.30.30.40.5
0.50.50.50.50.5
0.50.40.40.40.5
TotalReve-nues
17.918.117.917.4
17.718.718.020.119.5
17.718.018.018.618.3
17.618.418.418.919.4
20.119.718.118.118.6
18.419.319.019.319.1
SOURCE: Congressional Budget Office.
~rr~

150 THE ECONOMIC AND BUDGET OUTLOOK January 1991
TABLE D-6. OUTLAYS FOR MAJOR SPENDING CATEGORIES,FISCAL YEARS 1962-1990 (In billions of dollars)
FiscalYear
1962196319641965
19661967196819691970
19711972197319741975
19761977197819791980
19811982198319841985
19861987198819891990
NationalDefense
52.353.454.850.6
58.171.481.982.581.7
78.979.276.779.386.5
89.697.2
104.5116.3134.0
157.5185.3209.9227.4252.7
273.4282.0290.4303.6299.3
Entitlementsiand OtherMandatorySpending
30.833.334.534.8
37.545.352.358.766.1
80.694.2
110.4125.0158.0
184.3198.5220.9240.8282.3
326.3358.8400.9397.2442.6
458.0474.1504.7546.6620.4
NondefenseDiscretionary
Spending
23.825.028.932.3
38.140.843.640.845.1
50.156.059.564.983.0
91.0105.2120.9129.8152.4
164.9153.8153.8161.5169.6
170.0163.4175.2189.4205.6
NetInterest
6.97.78.28.6
9.410.311.112.714.4
14.815.517.321.423.2
26.729.935.442.652.5
68.785.089.8
111.1129.4
136.0138.6151.7169.1183.8
OffsettingReceipts
-7.1-8.1-7.8-8.0
-8.5-10.3-10.8-11.1-11.6
-14.2-14.2-18.1-21.3-18.5
-19.8-21.6-23.0-26.1-30.4
-39.3-37.2-46.1-45.3-48.0
-47.0-54.2-58.0-64.6-57.2
TotalOutlays
106.8111.3118.5118.2
134.5157.5178.1183.6195.6
210.2230.7245.7269.4332.3
371.8409.2458.7503.5590.9
678.2745.7808.3851.8946.3
990.31,003.81,064.11,144.11,251.9
SOURCE: Congressional Budget Office.

APPENDIX D HISTORICAL BUDGET DATA 151
TABLE D-7. OUTLAYS FOR MAJOR SPENDING CATEGORIES,FISCAL YEARS 1962-1990 (As a percentage of GNP)
FiscalYear
1962196319641965
19661967196819691970
19711972197319741975
19761977197819791980
19811982198319841985
19861987198819891990
NationalDefense
9.49.18.77.5
7.99.09.68.98.2
7.56.96.05.65.7
5.35.04.84.85.0
5.35.96.36.26.4
6.56.46.15.95.5
Entitlementsand OtherMandatorySpending
5.55.75.55.2
5.15.76.26.36.7
7.68.28.68.8
10.4
10.810.310.29.8
10.6
10.911.412.110.811.2
11.010.710.610.711.5
NondefenseDiscretionary
Spending
4.34.34.64.8
5.15.15.14.44.6
4.74.94.64.65.5
5.45.45.65.35.7
5.54.94.64.44.3
4.13.73.73.73.8
NetInterest
1.21.31.31.3
1.31.31.31.41.5
1.41.31.41.51.5
1.61.51.61.72.0
2.32.72.73.03.3
3.33.13.23.33.4
OffsettingReceipts
-1.3-1.4-1.2-1.2
-1.2-1.3-1.3-1.2-1.2
-1.3-1.2-1.4-1.5-1.2
-1.2-1.1-1.1-1.1-1.1
-1.3-1.2-1.4-1.2-1.2
-1.1-1.2-1.2-1.3-1.1
TotalOutlays
19.218.918.817.6
18.219.821.019.819.8
19.920.019.219.021.8
21.921.221.120.622.1
22.723.824.323.123.9
23.722.722.322.323.2
SOURCE: Congressional Budget Office.
38-033 0 - 91 — 7 : QL 3
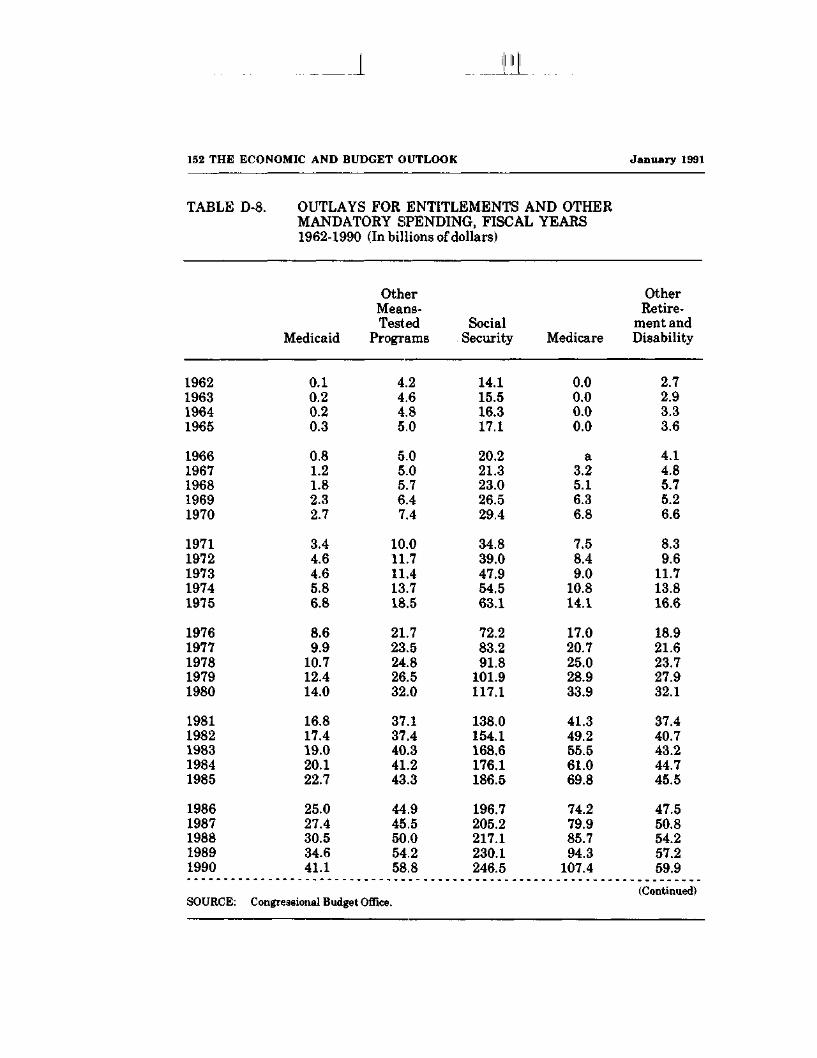
_l
152 THE ECONOMIC AND BUDGET OUTLOOK January 1991
TABLE D-8. OUTLAYS FOR ENTITLEMENTS AND OTHERMANDATORY SPENDING, FISCAL YEARS1962-1990 (In billions of dollars)
1962196319641965
19661967196819691970
19711972197319741975
19761977197819791980
19811982198319841985
19861987198819891990
SOURCE:
Medicaid
0.10.20.20.3
0.81.21.82.32.7
3.44.64.65.86.8
8.69.9
10.712.414.0
16.817.419.020.122.7
25.027.430.534.641.1
OtherMeans-Tested
Programs
4.24.64.85.0
5.05.05.76.47.4
10.011.711.413.718.5
21.723.524.826.532.0
37.137.440.341.243.3
44.945.550.054.258.8
SocialSecurity
14.115.516.317.1
20.221.323.026.529.4
34.839.047.954.563.1
72.283.291.8
101.9117.1
138.0154.1168.6176.1186.5
196.7205.2217.1230.1246.5
Medicare
0.00.00.00.0
a3.25.16.36.8
7.58.49.0
10.814.1
17.020.725.028.933.9
41.349.255.561.069.8
74.279.985.794.3
107.4
OtherRetire-
ment andDisability
2.72.93.33.6
4.14.85.75.26.6
8.39.6
11.713.816.6
18.921.623.727.932.1
37.440.743.244.745.5
47.550.854.257.259.9
(Continued)Congressional Budget Office.

APPENDIX D HISTORICAL BUDGET DATA 153
TABLE D-8. Continued
1962196319641965
19661967196819691970
19711972197319741975
19761977197819791980
19811982198319841985
19861987198819891990
UnemploymentCompensation
3.53.63.42.7
2.22.32.22.33.1
5.86.74.95.6
12.8
18.614.310.89.8
16.9
18.322.229.716.815.8
16.115.513.613.917.5
DepositInsurance
-0.4-0.4-0.4-0.4
-0.5-0.4-0.5-0.7-0.5
-0.4-0.6-0.8-0.60.5
-0.6-2.8-1.0-1.7-0.4
-1.4-2.2-1.2-0.9-2.2
1.53.1
10.022.058.1
Farm Other Non-Price Means-Tested
Supports Programs
2.43.43.42.8
1.42.03.34.23.8
2.94.13.61.00.6
1.13.85.73.62.8
4.011.718.97.3
17.7
25,822.412.210.66.5
4.13.63.63.8
4.35.86.16.36.9
8.310.718.120.524.9
26.824.329.531.634.0
34.928.327.030.843.5
26.224.231.529.624.6
TotalEntitlements
and OtherMandatorySpending
30.833.334.534.8
37.545.352.358.766.1
80.694.2
110.4125.0158.0
184.3198.5220.9240.8282.3
326.3358.8400.9397.2442.6
458.0474.1504.7546.6620.4
a. Less than $50 million.

I
154 THE ECONOMIC AND BUDGET OUTLOOK January 1991
TABLE D-9. OUTLAYS FOR ENTITLEMENTS AND OTHERMANDATORY SPENDING, FISCAL YEARS1962-1990 (As a percentage of GNP)
1962196319641965
19661967196819691970
19711972197319741975
19761977197819791980
19811982198319841985
19861987198819891990
SOURCE:
Medicaid
aaaa
0.10.10.20.20.3
0.30.40.40.40.4
0.50.50.50.50.5
0.60.60.60.50.6
0.60.60.60.70.8
OtherMeans-Tested
Programs
0.80.80.80.7
0.70.60.70.70.7
0.91.00.91.01.2
1.31.21.11.11.2
1.21.21.21.11.1
1.11.01.01.11.1
SocialSecurity
2.52.62.62.5
2.72.72.72.93.0
3.33.43.73.84.1
4.34.34.24.24.4
4.64.95.14.84.7
4.74.64.54.54.6
Medicare
0.00.00.00.0
a0.40.60.70.7
0.70.70.70.80.9
1.01.11.11.21.3
1.41.61.71.71.8
1.81.81.81.82.0
OtherRetire-
ment andDisability
0.50.50.50.5
0.60.60.70.60.7
0.80.80.91.01.1
1.11.11.11.11.2
1.31.31.31.21.2
1.11.11.11.11.1
(Continued)Congressional Budget Office.
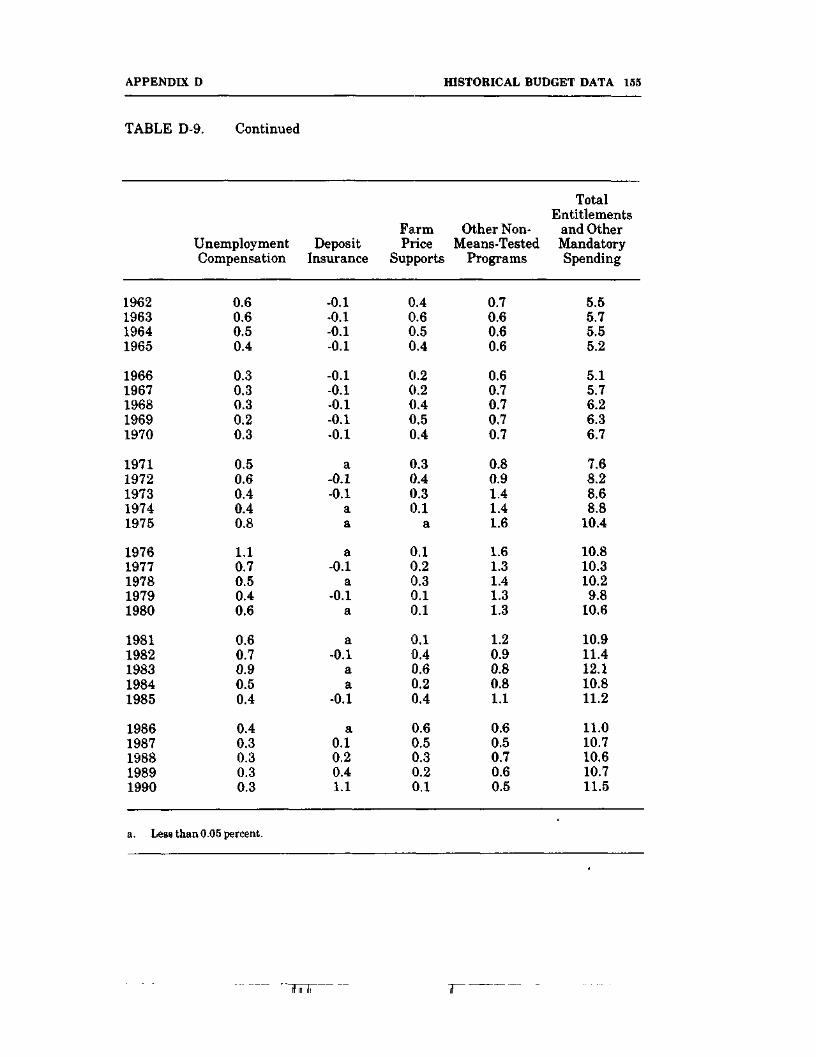
APPENDIX D HISTORICAL BUDGET DATA 155
TABLE D-9. Continued
UnemploymentCompensation
1962196319641965
19661967196819691970
19711972197319741975
19761977197819791980
19811982198319841985
19861987198819891990
0.60.60.50.4
0.30.30.30.20.3
0.50.60.40.40.8
1.10.70.50.40.6
0.60.70.90.50.4
0.40.30.30.30.3
DepositInsurance
-0.1-0.1-0.1-0.1
-0.1-0.1-0.1-0.1-0.1
a-0.1-0.1
aa
a-0.1
a-0.1
a
a-0.1
aa
-0.1
a0.10.20.41.1
Fa.rm Other Non-Price Means-Tested
Supports Programs
0.40.60.50.4
0.20.20.40.50.4
0.30.40.30.1
a
0.10.20.30.10.1
0.10.40.60.20.4
0.60.50.30.20.1
0.70.60.60.6
0.60.70.70.70.7
0.80.91.41.41.6
1.61.31.41.31.3
1.20.90.80.81.1
0.60.50.70.60.5
TotalEntitlements
and OtherMandatorySpending
5.55.75.55.2
5.15.76.26.36.7
7.68.28.68.8
10.4
10.810.310.29.8
10.6
10.911.412.110.811.2
11.010.710.610.711.5
a. Less than 0.05 percent.

JiL.

APPENDIX E
MAJOR CONTRIBUTORS TO THE
REVENUE AND SPENDING PROJECTIONS
The following analysts prepared the revenue and spending projectionsin this report:
Revenue Projections
Mark Booth Corporate income taxes,Federal Reserve System earnings
Maureen Griffin Social insurance contributions,excise taxes, estate and gift taxes
Katherine Johnson Excise taxes, NIPA receiptsRichard Kasten Individual income taxesLinda Radey Individual income taxes, excise taxesFrank Sammartino Individual income taxesJohn Stell Customs duties,
miscellaneous receipts
Spending Projections
Defense and International Affairs
Eugene Bryton DefenseKent Christensen International affairsRaymond Hall DefenseBarbara Hollinshead DefenseWilliam Myers DefenseAmy Plapp DefenseLisa Siegel DefenseJoseph Whitehill International affairs
r

.J
158 THE ECONOMIC AND BUDGET OUTLOOK January 1991
Spending Projections (continued)
Human Resources
Diane CeluchSandra Clark
Paul CullinanCathy Ellman
Alan FairbankKaren GrahamScott HarrisonHolly HarveyJean HearneLori HousmanJulia IsaacsDeborah KalcevicCory Oltman
Janice Peskin
Pat Purcell
Kathleen Shepherd
Social service programs, Head StartChild nutrition, veterans'
compensation and pensionsSocial SecurityCivil Service Retirement, Railroad
RetirementHospital InsurancePublic Health ServiceMedicareSupplementary Medical InsuranceMedicaidMedicareFood stamps, foster care, child careEducationUnemployment insurance, training
programs, veterans' educationAid to Families with Dependent
Children, child supportenforcement
Supplemental Security Income,Medicaid
Veterans' benefits
Natural and Physical Resources
Philip BartholomewLaura CarterKim Cawley
Peter FontaineTheresa Gullo
James Hearn
Deposit insuranceCommerce, deposit insuranceEnergy, pollution control and
abatementEnergyWater resources, conservation, and
land managementGeneral government, Agricultural
Credit Insurance Fund, OuterContinental Shelf receipts

APPENDIX E MAJOR CONTRIBUTORS 159
Spending Projections (continued)
Natural and Physical Resources
David HullThomas LuttonMary MaginnissEileen ManfrediMarjorie Miller
Marta Morgan
Andrew MortonDeborah ReisMitchell Rosenfeld
Brent ShippMichael Sieverts
AgricultureDeposit insuranceDeposit insuranceAgricultureTransportation, Federal Housing
AdministrationCommunity and regional
development, generalgovernment
AgricultureRecreation, water transportationAir transportation, justice,
Postal ServiceHousing and mortgage creditScience and space, justice,
natural resources
Other
Janet AirisEdward BlauDavid Elkes
Betty EmbreyKenneth FarrisDanila GirerdGlen GoodnowAlice GrantVernon HammettSandra HoffmanRichard KropFritz MaierRodney RasmussenKathy Ruffing
Appropriation billsAppropriation billsNational income and product
accounts, other interestAppropriation billsComputer supportCredit budgetAuthorization billsAppropriation billsComputer supportComputer supportCivilian agency pay, historical dataComputer supportNet interest on the public debtTreasury borrowing,
interest, and debt

L1L
160 THE ECONOMIC AND BUDGET OUTLOOK January 1991
Spending Projections (continued)
Other
Robert Sempsey Appropriation billsJeffSwersey Computer supportRick Williams Computer support

GLOSSARY
The Budget Enforcement Act of 1990 recently redefined a number ofbudget terms. The definitions of terms in this glossary conform to thechanges required by the act and reflect their usage in this report. Al-though such usage is standard, the definitions may not apply in othercontexts. Some entries sacrifice precision for brevity and clarity to thelay reader. Where appropriate, data sources for entries are indicatedas follows:
BEA denotes Bureau of Economic Analysis, Department of Com-merce;
BLS denotes Bureau of Labor Statistics, Department of Labor;
CBO denotes Congressional Budget Office;
FRB denotes Federal Reserve Board; and
NBER denotes National Bureau of Economic Research.
Aggregate demand: Total purchases of a country's output of goodsand services by consumers, businesses, government, and foreignersduring a given period. Because purchases equal sales, aggregate de-mand equals gross national product. (BEA)
Appreciation: Gain in the exchange value of a currency. See alsoExchange rate.
Appropriations: The legal authority for federal agencies to incur ob-ligations and make payments from the Treasury for specified purposes.
Discretionary appropriations are usually made on an annual basis butare sometimes made on a multiyear or open-ended basis. In acting
T

162 THE ECONOMIC AND BUDGET OUTLOOK January 1991
annually on these appropriations, the Congress exercises complete dis-cretion regarding the amounts appropriated.
Mandatory appropriations are also provided by the Congress on an an-nual basis. The amount of the appropriations, however, is determinedlargely by existing, substantive law. For the purposes of the BudgetEnforcement Act of 1990, any reference to entitlement authority in-cludes mandatory appropriations. See Entitlements.
Permanent appropriations are available as a result of previously en-acted legislation and do not require subsequent action by the Congressto authorize their use.
Authorization: A substantive law that sets up or continues a federalprogram or agency. Authorizing legislation is normally a prerequisitefor appropriations. For some programs, the authorizing legislation it-self provides the authority to incur obligations and make payments.
Balanced Budget Act: Common shorthand for the Balanced Budgetand Emergency Deficit Control Act of 1985, also known as Gramm-Rudman-Hollings. The act sets forth specific deficit targets and asequestration procedure to reduce spending if the targets are exceededby budget projections. The Budget Enforcement Act of 1990 estab-lished a revised set of targets through fiscal year 1995, which excludesthe Social Security trust funds. The President is required to adjust thedeficit targets for revised economic and technical assumptions whensubmitting the budgets for fiscal years 1992 and 1993 and has thatoption for the budgets of fiscal years 1994 and 1995.
Baseline: The benchmark for measuring the budgetary effects ofproposed changes in federal revenues or spending with the assumptionthat current budgetary policies are continued without change. TheBudget Enforcement Act of 1990 requires both CBO and the Office ofManagement and Budget to report on budget baseline levels for thenext five years. The methodology for CBO's baseline budget pro-jections follows the specifications required by the act. For revenuesand entitlement spending, the baseline generally assumes that lawsnow on the statute books will continue. For discretionary spending,

GLOSSARY 163
the projections for fiscal year 1992 are based on the appropriations forfiscal year 1991, adjusted for inflation.
Basis point: One-hundredth of 1 percent--for example, interest ratesof 6.4 percent and 6.2 percent differ by 20 basis points.
Budget: A detailed statement of actual or anticipated revenues andexpenditures during an accounting period.
Budget authority: Authority provided by law to incur financial obli-gations that will result in spending of federal government funds. Off-setting collections, including offsetting receipts, constitute negativebudget authority.
Budget deficit: Amount by which budget expenditures exceed budgetrevenues during a given period.
Budget Enforcement Act of 1990: Title XIII of the Omnibus BudgetReconciliation Act of 1990. This act amended both the CongressionalBudget Act of 1974 and the Balanced Budget and Emergency DeficitControl Act of 1985. The new law provides for new budget targets,sequestration procedures, pay-as-you-go procedures, credit reform, andvarious other changes.
Budget function: One of 19 areas into which federal spending andcredit activity are divided. National needs are grouped into 17 broadbudget functions, including national defense, international affairs,energy, agriculture, health, income security, and general government.Two functions-net interest and undistributed offsetting receipts-donot address national needs but are included to complete the budget.
Budget resolution: A resolution, passed by both Houses of the Con-gress but not requiring the President's signature, that sets forth a Con-gressional budget plan for the next five years. The plan must becarried out through subsequent legislation, including appropriationsand changes in tax and entitlement laws. The Congressional BudgetAct of 1974 established a number of mechanisms that are designed tohold spending and revenues to the targets established in the budgetresolution.
L
164 THE ECONOMIC AND BUDGET OUTLOOK January 1991
Budgetary resources: All sources of budget authority that are sub-ject to sequestration. For fiscal year 1991, budgetary resources includenew budget authority; unobligated balances; new loan guarantee com-mitments or limitations; new direct loan obligations, commitments, orlimitations; direct spending authority; and obligation limitations.From fiscal year 1992 through fiscal year 1995, budgetary resourcesare the same except that they exclude new loan guarantee commit-ments or limitations and new direct loan obligations, commitments, orlimitations as a result of credit reform.
Business cycle: Fluctuations in overall business activity accom-panied by swings in the unemployment rate, interest rates, and profits.Over a business cycle, real activity rises to a peak value (its highestlevel during the cycle), then falls until it reaches its trough value (itslowest level following the peak), whereupon it starts to rise again, de-fining a new cycle. Business cycles are irregular, varying in frequency,amplitude, and duration. (NBER)
Capital: Physical capital is the output that has been set aside to beused in production rather than consumed. According to the nationalincome and product accounts, private capital goods are composed ofresidential and nonresidential structures, producers' durable equip-ment, and business inventories. Financial capital is a claim on anindividual, business, or government represented by a security, such asa mortgage, stock certificate, or bond. Issuing such securities providesthe resources to buy physical capital.
Capitalization requirements: The amount of funds that the ownersof banks, savings and loan institutions, and mutual savings banks arerequired by law to maintain in their institutions as capital. Ownersrisk losing such funds if the institution's assets cannot cover its liabili-ties, but higher capitalization requirements reduce the risk of bank-ruptcy.
Cashflow: Profits plus depreciation of physical capital. (BEA)
Central bank: A government-established agency responsible for con-ducting monetary policy and overseeing credit conditions. The FederalReserve System fulfills these functions in the United States.

GLOSSARY 165
Civilian unemployment rate: Unemployment as a percentage of thecivilian labor force—that is, the labor force excluding armed forcespersonnel. (BLS)
Compensation: All income due to employees for their work during agiven period. Compensation includes wages and salaries as well asfringe benefits and employers' share of social insurance taxes. (BE A)
Constant dollars: Measured in terms of prices of a base period, cur-rently 1982 for most purposes, to remove the influence of inflation.Compare with Current dollar.
Consumer confidence: A measure of consumer attitudes and buyingplans indicated by an index of consumer sentiment. The index is con-structed by the University of Michigan Survey Research Center basedon surveys of consumers regarding their view of the states of the econ-omy and of their personal finances, both current and prospective.
Consumer durable goods: Goods bought by households for their per-sonal use that, on average, last more than three years~for example,automobiles, furniture, or appliances.
Consumer price index: See CPI-U.
Consumption: Total purchases of goods and services during a givenperiod by households for their own use. (BEA)
CPI-U: An index of consumer prices based on the typical market bas-ket of goods and services consumed by all urban consumers during abase period. (BLS)
Credit budget: A budget supplementary to the unified budget formeasuring gross federal and federally assisted credit activities and forcontrolling the gross volume of those activities. In large measure, pro-cedures established in the Federal Credit Reform Act of 1990 havesuperseded the credit budget.

:J
166 THE ECONOMIC AND BUDGET OUTLOOK January 1991
Credit crunch: A significant, temporary decline in the normal supplyof credit, usually caused by tight monetary policy or a regulatory re-striction facing lending institutions.
Credit reform: A revised system of budgeting for federal creditactivities that focuses on the cost of subsidies conveyed in federal creditassistance. This new process was authorized by the Federal CreditReform Act of 1990 and is to take effect in 1992.
Credit subsidies: The estimated long-term costs to the federal gov-ernment of direct loans or loan guarantees calculated on the basis ofnet present value, excluding administrative costs and any incidentaleffects on governmental receipts or outlays. For direct loans, the sub-sidy cost is the net present value of loan disbursements, less repay-ments, and adjusted for interest, estimated defaults, prepayments,fees, penalties, and other recoveries. For loan guarantees, the subsidycost is the net present value of the estimated payments by the govern-ment to cover defaults and delinquencies, interest subsidies, or otherpayments, offset by any payments to the government, including origi-nation and other fees, penalties, and recoveries.
Currency value: See Exchange rate.
Current dollar: Measured in the dollar value of the period; nominal.Compare with Constant dollar.
Cyclical deficit: The part of the budget deficit that results from cycli-cal factors rather than from underlying fiscal policy. The cyclical defi-cit reflects the fact that, when GNP falls, revenues automatically falland outlays automatically rise. The cyclical deficit is zero when theeconomy is operating at potential GNP. Compare with Stan-dardized-employment budget deficit. (CBO)
Defense spending: See Discretionary spending.
Deflator: See Implicit deflator.
Deposit insurance: The guarantee by a federal agency that an indi-vidual depositor at a participating depository institution will receive

GLOSSARY 167
the full amount of the deposit (up to $100,000) if the institution be-comes insolvent.
Depository institutions: Financial intermediaries that make loansto borrowers and obtain funds from savers by accepting deposits;banks, savings and loan institutions, mutual savings banks, and creditunions
Depreciation: Decline in the value of a currency or a capital good.When applied to a capital good, the term usually refers to loss of valuebecause of obsolescence or wear.
Direct spending: The Budget Enforcement Act of 1990 defines thisterm as (a) budget authority provided by law other than appropriationacts, (b) entitlement authority (including mandatory appropriations),and (c) the Food Stamp program. Compare with Discretionaryspending.
Discount rate: The interest rate charged by the Federal ReserveSystem on a loan that it makes to a bank. Such loans, when allowed,enable a bank to meet its reserve requirements without reducing itsloans.
Discretionary spending: Spending for programs provided by theCongress in the 13 annual appropriation bills. Discretionary spend-ing is divided among three categories: defense, international, anddomestic.
Defense discretionary spending consists primarily of the military activ-ities of the Department of Defense, which are funded in the defense andmilitary construction appropriation bills. It also includes the defense-related functions of other agencies, such as the Department of Energy'snuclear weapons programs.
International discretionary spending encompasses spending for foreigneconomic and military aid, the activities of the Department of Stateand the U.S. Information Agency, and international financial pro-grams, such as the Export-Import Bank of the United States.

JiL
168 THE ECONOMIC AND BUDGET OUTLOOK January 1991
Domestic discretionary spending includes most government activitiesin science and space, transportation, medical research, environmentalprotection, and law enforcement, among other spending programs.Funding for these programs is provided in 10 of the annual appropri-ation bills.
Discretionary spending caps: Ceilings on budget authority andoutlays for discretionary programs as defined by the Budget Enforce-ment Act of 1990. For fiscal years 1991 through 1993, the caps aredivided among the three categories of discretionary spending—defense,international, and domestic. For fiscal years 1994 and 1995, there isone cap for all discretionary spending. Discretionary spending caps areenforced through Congressional rules and sequestration procedures.
Disposable (personal) income: Income received by individuals, in-cluding transfer payments, less personal taxes and fees paid to gov-ernment. (BEA)
Dollar exchange rate: The number of units of a foreign currency thatcan be bought with one dollar. (FRB)
Domestic demand: Total purchases of goods and services, regardlessof origin, by U.S. consumers, businesses, and governments during agiven period. Domestic demand equals gross national product plusimports minus exports. (BEA)
Domestic discretionary spending: See Discretionary spending.
Entitlements: Programs that make payments to any person, business,or unit of government that seeks the payments and meets the criteriaset in law. The Congress controls these programs indirectly by de-fining eligibility and setting the benefit or payment rules, rather thandirectly through the annual appropriation process. The best-knownentitlements are the major benefit programs, such as Social Securityand Medicare; other entitlements include farm price supports and in-terest on the federal debt. Under the provisions of the Budget Enforce-ment Act of 1990, mandatory programs funded through the annualappropriation process are treated for budgetary purposes like entitle-ments.

GLOSSARY 169
Equity price: The market value of a stock certificate share.
Exchange rate: The number of units of a foreign currency that can bebought with one unit of the domestic currency. (FRB)
Excise tax: A tax levied on the purchase of a specific type of good orservice, such as tobacco products or telephone services.
Expansion: A phase of the business cycle that extends from thetrough to the next peak. (NBER)
Factory operating rate: The seasonally adjusted output of thenation's factories expressed as a percentage of their capacity to pro-duce. Capacity is defined as the greatest rate of output a plant canmaintain with a realistic work schedule. (FRB)
Federal funds rate: Overnight interest rate at which financial insti-tutions borrow and lend monetary reserves. A rise in the federal fundsrate (compared with other short-term rates) suggests a tightening ofmonetary policy, whereas a fall suggests an easing. (FRB)
Federal Reserve System: The agency responsible for conductingmonetary policy and overseeing credit conditions in the United States.
Financing account: Any account established under credit reform tofinance the portion of federal direct loans and loan guarantees not sub-sidized by federal funds. Since these accounts are used only to financethe nonsubsidized portion of federal credit activities, they are excludedfrom the federal budget and included as a means of financing the bud-get.
Fiscal policy: The government's choice of tax and spending programs,which influences the level, composition, and distribution of output andincome. An easy fiscal policy stimulates the growth of output andincome, while a tight fiscal policy restrains their growth. Movementsin the standardized-employment budget deficit constitute one overallindicator of the tightness or ease of federal fiscal policy-an increaserelative to potential GNP suggests fiscal ease, whereas a decrease sug-

170 THE ECONOMIC AND BUDGET OUTLOOK January 1991
gests fiscal restriction. The President and the Congress jointly carryout federal fiscal policy.
Fiscal year: A yearly accounting period. The federal government'sfiscal year begins October 1 and ends September 30. Fiscal years aredesignated by the calendar years in which they end--for example, fiscalyear 1990 began October 1,1989, and ended September 30,1990.
Fixed-weighted price index: An index that measures overall price(compared with a base period) without being influenced by changes inthe composition of output or purchases. Compare with Implicit defla-tor.
GDP: See Gross domestic product.
GNP: See Gross national product.
Government purchases of goods and services: Purchases from theprivate sector (including compensation of government employees)made by government during a given period. Unlike government ex-penditures, purchases exclude transfer payments (which includegrants and interest paid). (BEA)
Government-sponsored enterprises (GSEs): Enterprises estab-lished and chartered by the federal government to perform specific fi-nancial functions, usually under the supervision of a governmentagency. Major examples are the Federal National Mortgage Associa-tion, the Student Loan Marketing Association, and the Federal HomeLoan Banks.
Gross domestic product (GDP): The total current market value ofall goods and services produced domestically during a given period.GDP differs from GNP by excluding net income (primarily capital in-come) that residents earn abroad. (BEA)
Gross national product (GNP): The total current market value of allgoods and services produced in a given period by residents of a countryand the assets they own. See also Potential GNP. (BEA)

GLOSSARY 171
Implicit deflator: An overall measure of price (compared with a baseperiod) given by the ratio of current dollar purchases to constant dollarpurchases. Changes in an implicit deflator, unlike those in a fixed-weighted price index, reflect changes in the composition of purchasesas well as in the prices of goods and services purchased. (BE A)
Index: An indicator or summary measure that defines the overalllevel (compared with a base) of some aggregate, such as the generalprice level or total quantity, in terms of the levels of its components.
Inflation: Growth in a measure of the general price level, usually ex-pressed as an annual rate of change.
Inflation-adjusted budget deficit: A measure of the change in thereal value of the publicly held federal debt expressed in the dollarvalue of the period.
Inventories: Stocks of goods held by businesses either for furtherprocessing or for sale. (BEA)
Investment: Physical investment is the current product set asideduring a given period to be used for future production; in other words,an addition to the stock of capital goods. According to the national in-come and product accounts, private domestic investment consists of in-vestment in residential and nonresidential structures, producers' dur-able equipment, and the change in business inventories. Financial in-vestment is the purchase of a financial security.
Labor force: The number of people who have jobs or are available forwork and are actively seeking jobs. Labor force participation rate is thelabor force as a percentage of the noninstitutional population aged 16years or older. (BLS)
Labor productivity: Average real output per hour of labor. Thegrowth of labor productivity is defined as j^rowth of real output that isnot explained by growth of labor input alone. Labor productivity dif-fers from total factor productivity in that increases in capital per work-er raise labor productivity, but not total factor productivity. Comparewith Total factor productivity. (BLS)

J Jl
172 THE ECONOMIC AND BUDGET OUTLOOK January 1991
Liquidating account: Any budgetary account established undercredit reform to finance direct loan and loan guarantee activities thatwere obligated or committed before credit reform.
Long-term interest rate: Interest rate earned by a note or bond thatmatures in 10 or more years.
Ml: A relatively narrow measure of the U.S. money supply. It pri-marily consists of the public's (excluding banks') total holdings of cur-rency, traveler's checks, and checking accounts. (FRB)
M2: A broader measure of the U.S. money supply than Ml. It pri-marily consists of Ml, plus the public's holdings of savings and small(less than $100,000) time deposits and money-market deposit accountsheld at depository institutions, as well as accounts at money-marketmutual funds. (FRB)
Means of financing: Sources of financing federal deficits or uses offederal surpluses. The largest means of financing is normally federalborrowing from the public, but other means of financing include anytransaction that causes a difference between the federal (including off-budget) surplus or deficit arid changes in debt held by the public. Themeans of financing include changes in checks outstanding and Trea-sury cash balances, seigniorage, and the financing accounts enactedunder credit reform.
Means-tested programs: Programs that provide cash or services tolow-income people who meet a test of need. Most means-tested pro-grams are entitlements-for example, Medicaid, the Food Stamp pro-gram, Supplemental Security Income, family support, and veterans'pensions-hut a few, such as subsidized housing and various social ser-vices, are funded through discretionary appropriations.
Monetary policy: The strategy of influencing movements of themoney supply and interest rates to affect output and inflation. An easymonetary policy suggests faster money growth and initially lowershort-term interest rates in an attempt to increase aggregate demand,but it may lead to a higher rate of inflation. A tight monetary policy

GLOSSARY 173
suggests slower money growth and higher interest rates in the nearterm in an attempt to reduce inflationary pressure by reducing aggre-gate demand. The Federal Reserve System conducts monetary policyin the United States.
Monetary reserves: The amount of funds that banks and other de-pository institutions hold as cash or as deposits with the Federal Re-serve System. See also Reserve requirements.
Money supply: Private assets that can readily be used to make trans-actions or can easily be converted into those that can. See Ml and M2.
NAIRU (Nonaccelerating inflation rate of unemployment): Theunemployment rate consistent with a constant inflation rate. An un-employment rate greater than NAIRU indicates downward pressureon inflation, while a lower unemployment rate indicates upward pres-sure on inflation. Estimates of NAIRU are based on the historical rela-tionship between inflation and the aggregate unemployment rate.CBO's estimating procedures are described in Appendix B of The Eco-nomic and Budget Outlook: An Update (August 1987).
National income and product accounts (NIPA): Official U.S. ac-counts that detail the composition of GNP and how the costs of produc-tion are distributed as income. (BEA)
National saving: Total saving by all sectors of the economy: personalsaving, business saving (corporate after-tax profits not paid as divi-dends), and government saving (budget surplus or deficit-indicatingdissaving~of all government entities). National saving represents allincome not consumed, publicly or privately, during a given period.(BEA)
Net exports: A country's exports less its imports. (BEA)
Net interest: In the federal budget, net interest includes federal in-terest payments to the public as recorded in budget function 900. Netinterest also includes, as an offset, interest income received by the gov-ernment on loans and cash balances. In the national income and prod-uct accounts, net interest is the income component of GNP paid as

174 THE ECONOMIC AND BUDGET OUTLOOK January 1991
interest; primarily interest that domestic businesses pay, less interestthey receive. The NIPA treat government interest payments as trans-fers and net them from GNP.
Net national saving: National saving less depreciation of physicalcapital.
Net present value: The current value of future payments and collec-tions. The difference between cash at any point in time and future cashtransactions adjusted for the time value of money.
NIPA: See National income and product accounts.
Nominal: Measured in the dollar value (as in nominal output, income,or wage rate) or market terms (as in nominal exchange or interest rate)of a certain time period. Compare with Real.
Noncredit account: Any budgetary account except for credit activity,including the subsidy, program, and liquidating accounts establishedunder credit reform.
Nonfarm business productivity: Labor productivity in the nonfarmbusiness sector. (BLS)
Nonresidential structures: Primarily business buildings—such asindustrial, office, and other commercial buildings—and structures,such as mining shafts and well shafts. (BEA)
OBRA: The Omnibus Budget Reconciliation Act of 1990.
Off-budget: Spending or revenues excluded from the budget totals bylaw. The Budget Enforcement Act of 1990 requires that the revenuesand outlays of the two Social Security trust funds be shown as off-budget. The Omnibus Budget Reconciliation Act of 1989 took thePostal Service fund off-budget and also excluded it from the BalancedBudget Act and the Congressional budget resolution processes.
Offsetting receipts: Funds collected by the federal government thatare recorded as negative budget authority and outlays and credited to

GLOSSARY 175
separate receipt accounts. More than half of offsetting receipts areintragovernmental receipts that reflect agencies' payments to retire-ment and other funds on their employees' behalf; these receipts simplybalance payments elsewhere in the budget. The remaining offsettingreceipts (proprietary receipts) come from the public and generallyrepresent voluntary, business-type transactions. The largest items arethe flat premiums for Supplementary Medical Insurance (Part B ofMedicare), timber and oil lease receipts, and proceeds from the sale ofelectric power.
Operating deficit of state and local governments: Budget deficitexcluding revenues and expenditures of their social insurance funds(primarily retirement funds for employees). (BEA)
Organization of Petroleum Exporting Countries (OPEC): Thegroup of oil-rich countries that tries to determine the price of crude oil(given demand) by agreeing to production quotas among its members.
Outlays: The liquidation of a federal obligation, generally by issuinga check or disbursing cash. Sometimes obligations are liquidated (andoutlays occur) by issuing agency notes, such as those of the FederalDeposit Insurance Corporation. Unlike outlays for other categories ofspending, outlays for interest on the public debt are counted when theinterest is earned, not when it is paid. Outlays may be for payment ofobligations incurred in previous fiscal years or in the same year.Outlays, therefore, flow in part from unexpended balances of prior-year budget authority and, in part, from budget authority provided forthe current year.
Pay-as-you-go: A procedure required in the Budget Enforcement Actof 1990 to ensure that, for fiscal years 1991 through 1995, directspending and receipt legislation do not increase the deficit. Pay-as-you-go is enforced through Congressional rules and sequestration pro-cedures.
Payroll employment: An estimate of employment based on a month-ly survey of payroll records of nonfarm business and government estab-lishments. (BLS)

176 THE ECONOMIC AND BUDGET OUTLOOK January 1991
Peak: See Business cycle,
Personal saving: Disposable personal income that households do notuse for consumption or interest payments during a given period. Per-sonal saving rate is personal saving as a percentage of disposable per-sonal income. (BEA)
Point-year of unemployment: An unemployment rate that is onepercentage point above the NAIRU and lasts for one year. For exam-ple, if the unemployment rate averaged two percentage points aboveNAIRU for one year, that would be two point-years of unemployment.
Potential GNP: Level of GNP estimated to be consistent with a con-stant rate of inflation. (CBO)
Private saving: Saving by households and businesses; private savingis equal to personal saving plus after-tax corporate profits less divi-dends paid. (BEA)
Producers' durable equipment: Primarily nonresidential capitalequipment-such as computers, machines, and transportation equip-ment—owned by businesses. (BEA)
Program account: Any budgetary account that finances credit sub-sidies and the costs of administering credit programs.
Publicly held federal debt: Debt issued by the federal governmentand held by nonfederal investors (including the Federal Reserve Sys-tem).
Real: Adjusted to remove the effect of inflation. Real (constant dollar)output represents volume, rather than dollar value, of goods and ser-vices. Real income represents power to purchase real output. Realdata are constructed by dividing the corresponding nominal data by aprice index or deflator. Real interest rate is a nominal interest rate mi-nus the inflation rate of a given price index. Compare with Nominal.
Receipt account: Any budget or off-budget account that is estab-lished exclusively to record the collection of income, including negative

GLOSSARY 177
subsidies. In general, receipt accounts used to collect money arisingfrom the exercise of the government's sovereign powers are included asbudget or off-budget revenues, whereas the proceeds of intragovern-mental transactions or collections from the public arising from busi-ness-type transactions (such as interest income, proceeds from the saleof property or products, or profits from federal credit activities) are in-cluded as offsetting receipts-thai is, credited as offsets to outlays ratherthan included in receipts.
Recession: A phase of the business cycle that extends from a peak tothe next trough. Real GNP usually falls throughout the recession.(NBER)
Reconciliation: A process the Congress uses to make its tax andspending legislation conform with the targets established in the bud-get resolution. The budget resolution may contain reconciliation in-structions directing certain Congressional committees to achieve sav-ings in tax or spending programs under their jurisdiction. Legislationto implement the reconciliation instructions is usually combined in onecomprehensive bill. The reconciliation process primarily affects taxes,entitlement spending, and offsetting receipts. As a general rule, deci-sions on defense and nondefense discretionary programs are deter-mined separately through the appropriation process, which is also gov-erned by allocations in the budget resolution.
Reconciliation act: See OBRA.
Reserve requirements: The amount of funds that banks and otherdepository institutions must hold as cash or as deposits with the Fed-eral Reserve System. The Federal Reserve System specifies reserverequirements depending on the level of deposits. Such requirementsreduce the risk of bank failure and allow the Federal Reserve Systemto influence the money supply. (FRB)
Residential investment: Investment in housing, primarily for con-struction of new single-family and multifamily housing and altera-tions and additions to existing housing. (BEA)

178 THE ECONOMIC AND BUDGET OUTLOOK January 1991
Resolution Trust Corporation (RTC): An agency created by theFinancial Institutions Reform, Recovery, and Enforcement Act of 1989(FIRREA) to close, merge, or otherwise resolve insolvent savings andloan institutions whose deposits are insured by the federal govern-ment.
RTC: See Resolution Trust Corporation.
Sequestration: The cancellation of budgetary resources to enforce theBudget Enforcement Act of 1990. Sequestration is triggered if theOffice of Management and Budget determines that discretionary ap-propriations breach the discretionary spending caps, that direct spend-ing and receipt legislation increase the deficit, or that the deficit ex-ceeds, by more than a specified margin, the maximum deficit amountset by law. Failure to meet the maximum deficit amount would triggeracross-the-board spending reductions. Changes in direct spending andreceipt legislation that increase the deficit would result in reductionsin funding from entitlements not otherwise exempted by law. Dis-cretionary spending in excess of the caps would cause the cancellationof budgetary resources within the appropriate discretionary spendingcategory.
Short-term interest rate: Interest rate earned by a debt instrumentthat will mature within one year.
Standardized-employment budget deficit: The level of the federalgovernment budget deficit if the economy is operating at potentialGNP. It provides a measure of underlying fiscal policy by removingthe influence of cyclical factors from the budget deficit. Compare withCyclical deficit. (CBO)
Structural budget deficit: Same as Standardized-employmentbudget deficit.
Ten-year Treasury note: Interest-bearing note issued by the U.S.Treasury that is redeemed in 10 years.
Three-month Treasury bill: Security issued by the U.S. Treasurythat is redeemed in 91 days.

GLOSSARY 179
Thrift institutions: Savings and loan institutions and mutual savingsbanks.
Total factor productivity: Average real output per unit of combinedlabor and capital inputs. The growth of total factor productivity isdefined as growth in real output that is not explained by growth ofcombined labor and capital inputs. While technical advance and edu-cation are likely major contributors to total factor productivity, it hasexhibited many variations in the past that have not been fully ex-plained. CBO estimates the growth rate of total factor productivity asthe amount by which the growth rate of real output exceeds theweighted sum of the growth rates of worker hours and real capital.The respective weights are the 1989 shares of output paid as income tolabor and capital. Compare with Labor productivity.
Trade deficit: The excess of a country's imports over its exports.(BEA)
Transfer payments: Payments in return for which no good or serviceis received—for example, welfare or Social Security payments or moneysent to relatives abroad. (BEA)
Trough: See Business cycle.
Trust fund: A fund, designated as a trust fund by statute, that iscredited with income from earmarked collections and charged with cer-tain outlays. Collections may come from the public (for example, taxesor user charges) or from intrabudgetary transfers. More than 150 fed-eral government trust funds exist, of which the largest and best knownfinance several major benefit programs (including Social Security andMedicare) and certain infrastructure spending (the Highway and theAirport and Airway trust funds). The term "federal funds" refers to allprograms that are not trust funds.
Underlying rate of inflation: Rate of inflation of a modified CPI-Uthat excludes from the market basket the components most volatile inprice-food, energy, and used cars.

180 THE ECONOMIC AND BUDGET OUTLOOK January 1991
Unemployment: The number of jobless people who are available forwork and are actively seeking jobs. The unemployment rate is unem-ployment as a percentage of the labor force. (BLS)
Yield: The average annual rate of return on a security, including in-terest payments and repayment of principal, if held to maturity.