Embed Size (px)
Citation preview
The Ecological Impacts Of Nitrogen Deposition: Insights From The Carnivorous
Pitcher Plant Sarracenia purpurea
Nicholas J. GotelliDepartment of BiologyUniversity of VermontBurlington, VT 05405
U.S.A.

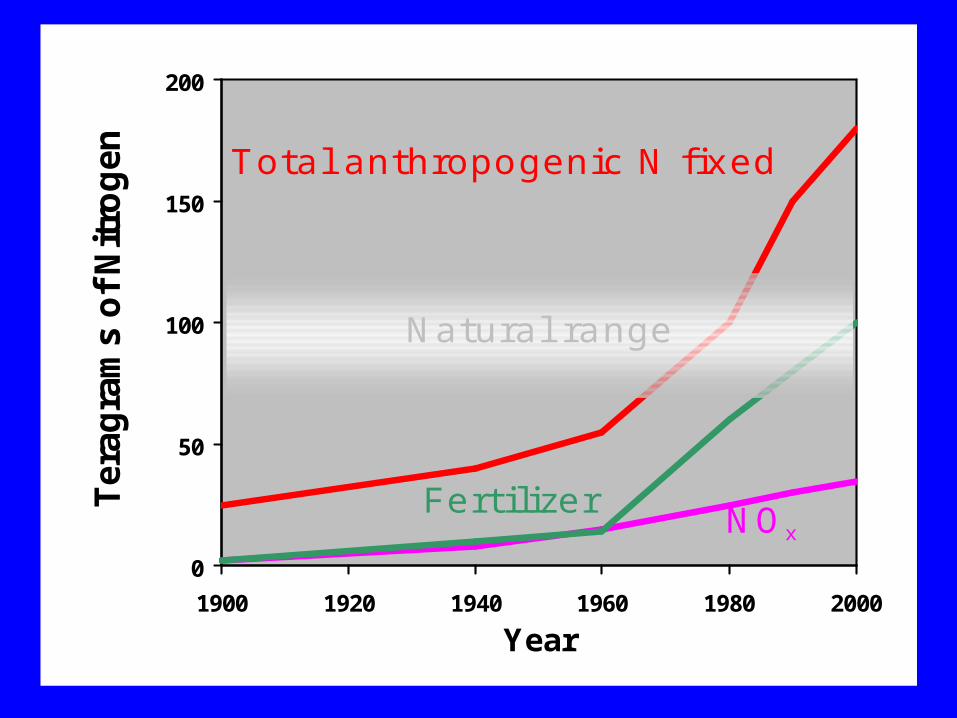
0
50
100
150
200
1900 1920 1940 1960 1980 2000
Year
Ter
agra
ms
of
Nit
rog
en
Fertilizer NOx
Total anthropogenic N fixed
Natural range
Effects of N Deposition
• IndividualAltered morphologyChanges in reproduction, survivorship
Effects of N Deposition
• IndividualAltered morphologyChanges in reproduction, survivorship
• PopulationIncreased long-term extinction riskChanges in short-term dynamics
Effects of N Deposition• Individual
Altered morphologyChanges in reproduction, survivorship
• Population Increased long-term extinction riskChanges in short-term dynamics
• CommunityChanges in abundance and compositionAltered nutrient transfer and storage
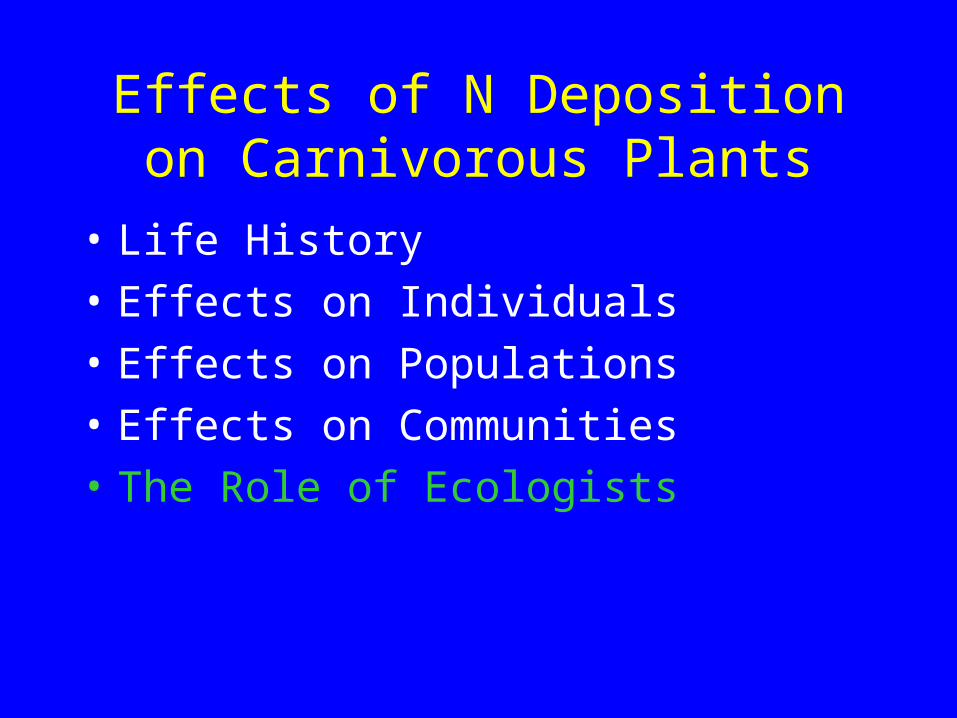
Effects of N Deposition on Carnivorous Plants
• Life History
• Effects on Individuals
• Effects on Populations
• Effects on Communities
• The Role of Ecologists
Effects of N Deposition on Carnivorous Plants
• Life History
• Effects on Individuals
• Effects on Populations
• Effects on Communities
• The Role of Ecologists
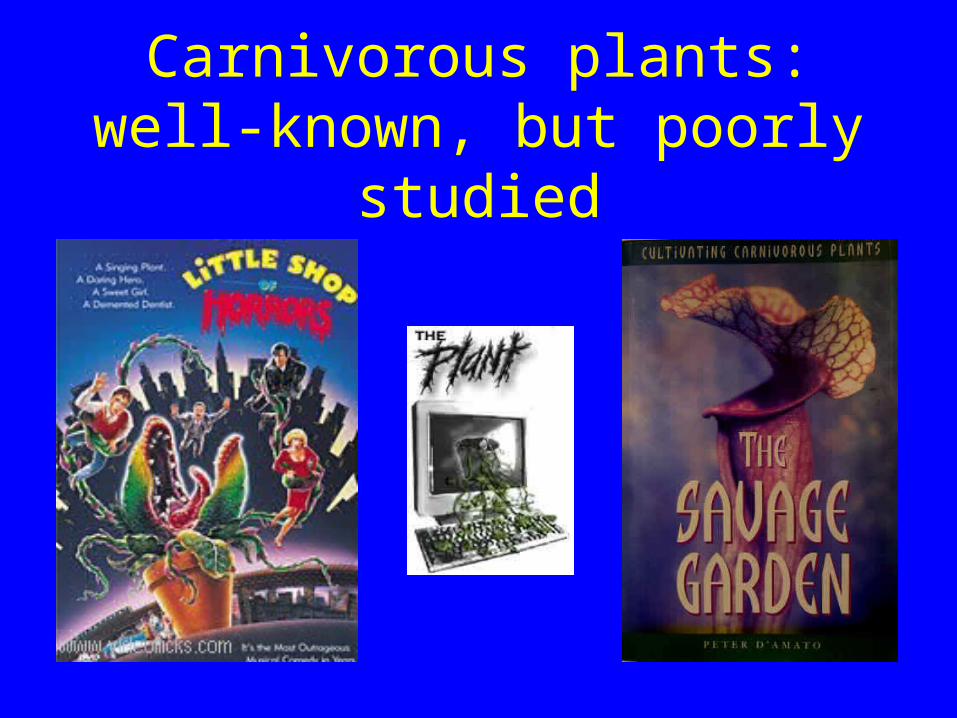
Carnivorous plants: well-known, but poorly studied
Carnivory in plants
• Phylogenetically diverse
• Morphological, chemical adaptations for attracting, capturing, digesting arthropods
• Common in low N habitats
• Poor competitors for light, nutrients
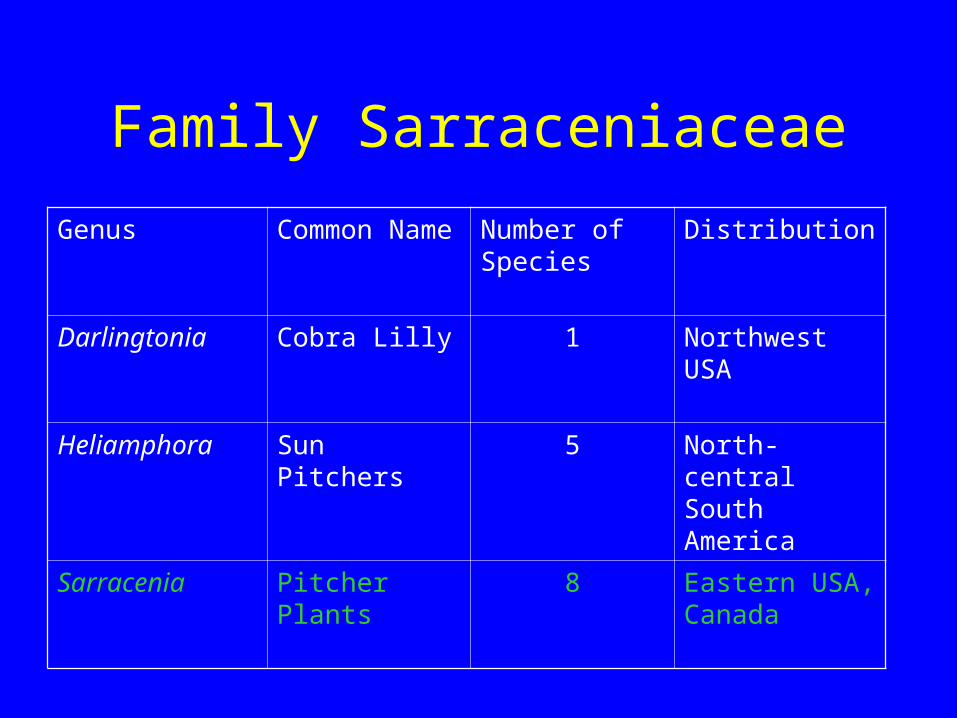
Family Sarraceniaceae
Genus Common Name
Number of Species
Distribution
Darlingtonia Cobra Lilly 1 Northwest USA
Heliamphora Sun Pitchers 5 North-central South America
Sarracenia Pitcher Plants 8 Eastern USA, Canada
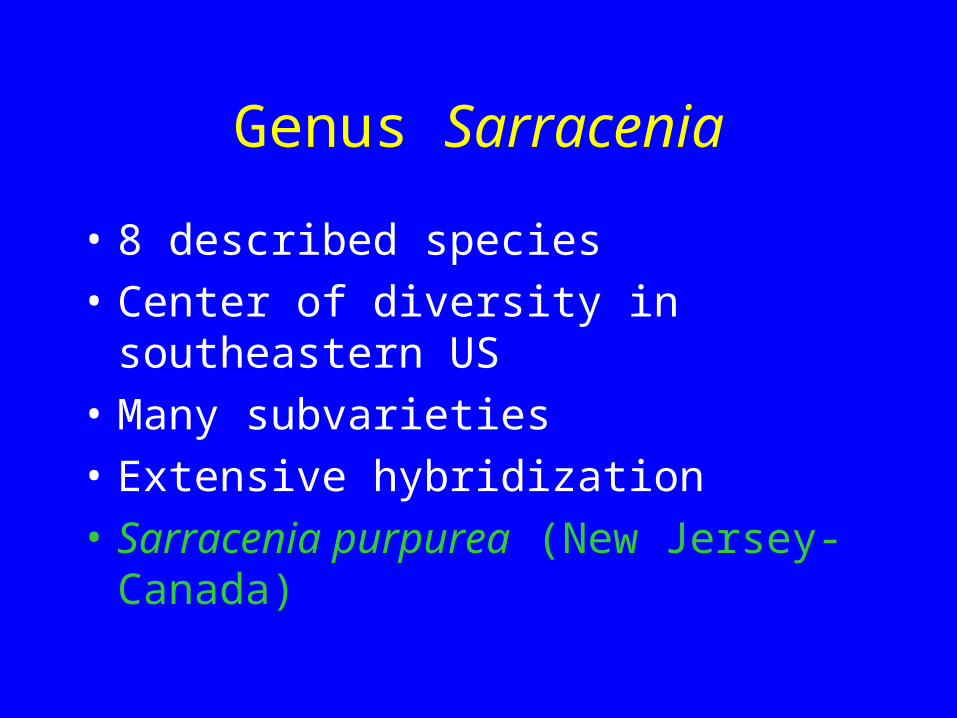
Genus Sarracenia
• 8 described species
• Center of diversity in southeastern US
• Many subvarieties
• Extensive hybridization
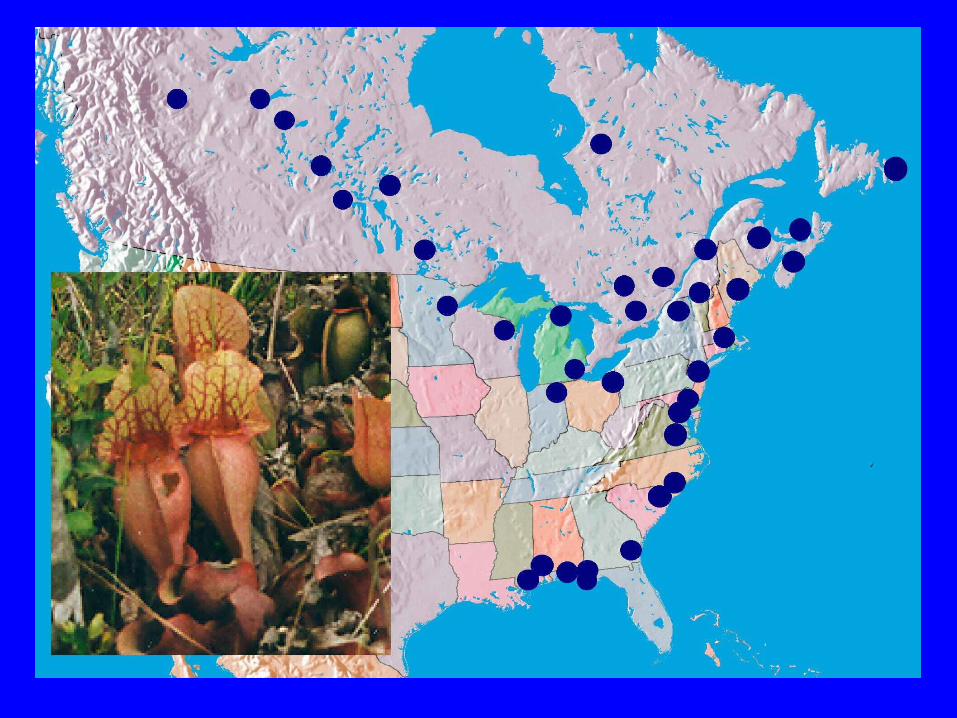
• Sarracenia purpurea (New Jersey- Canada)
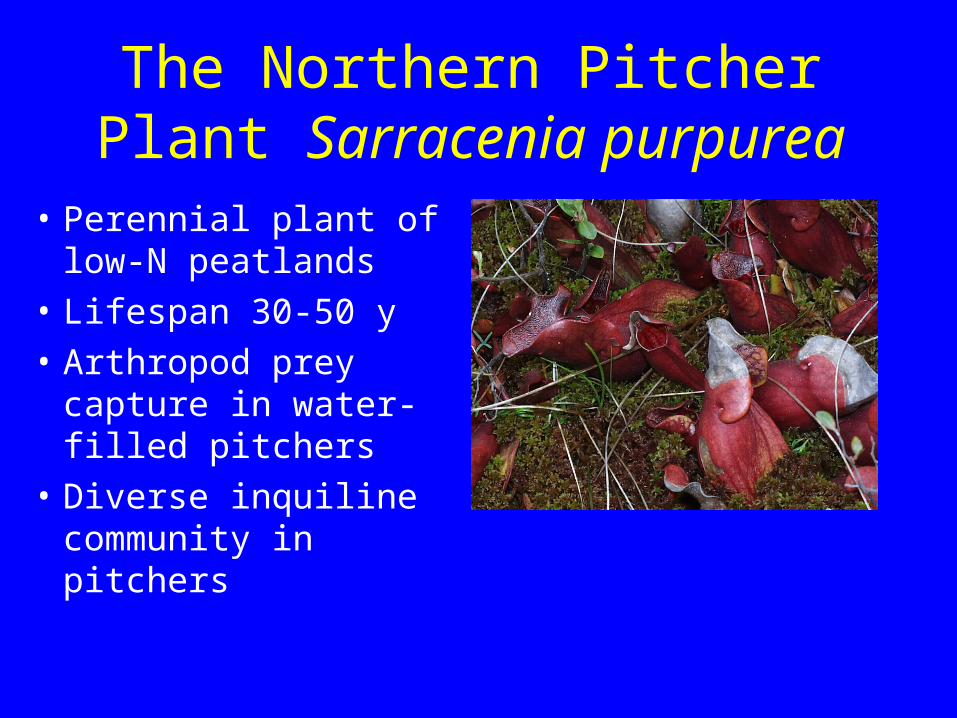
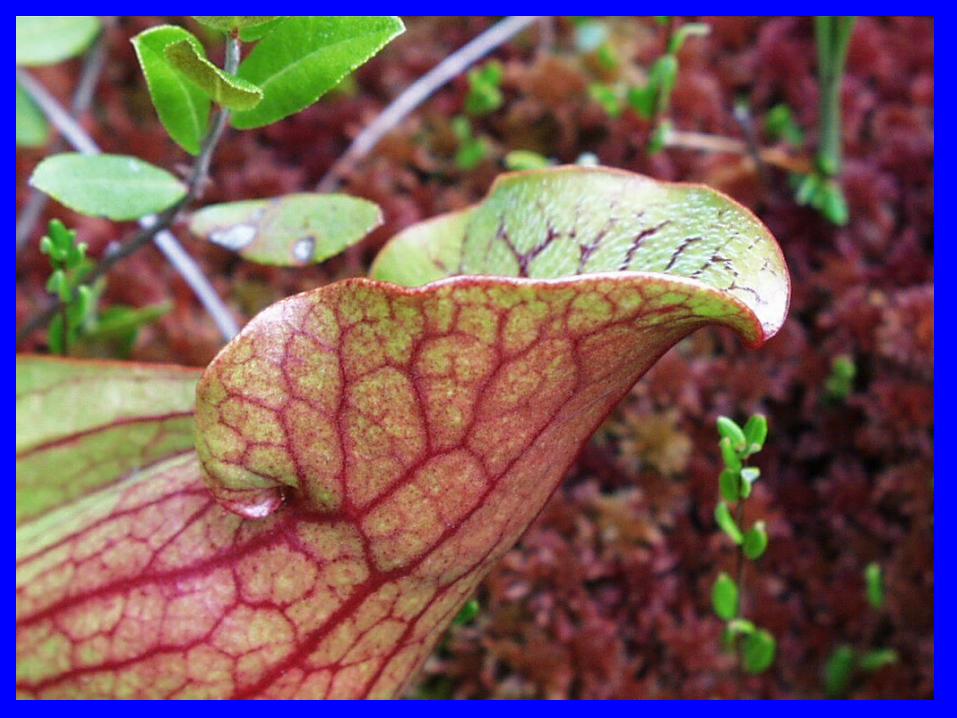
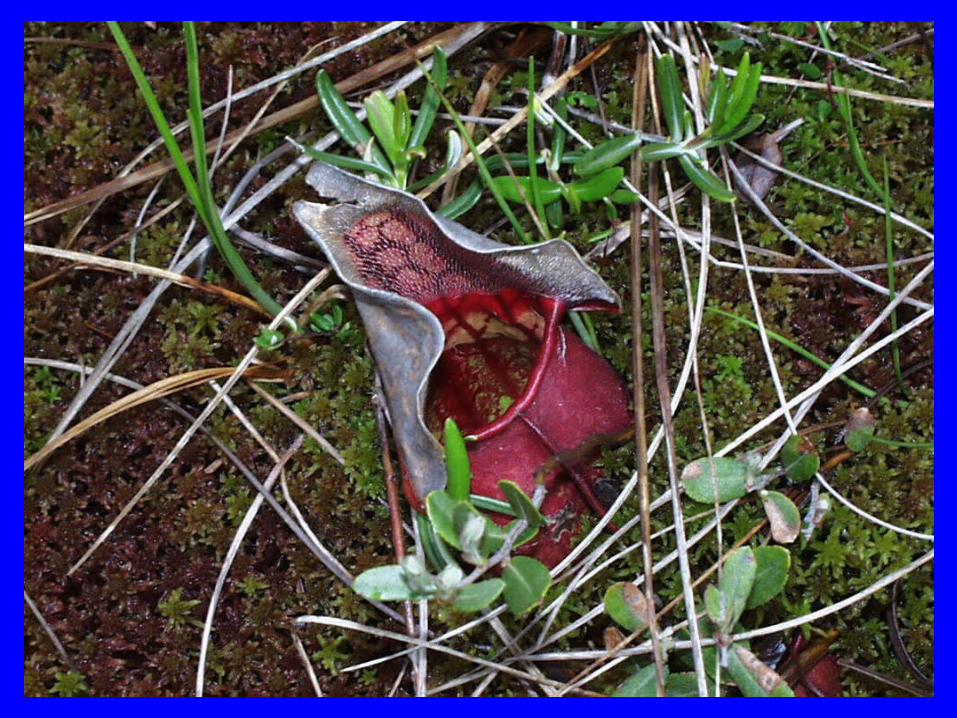
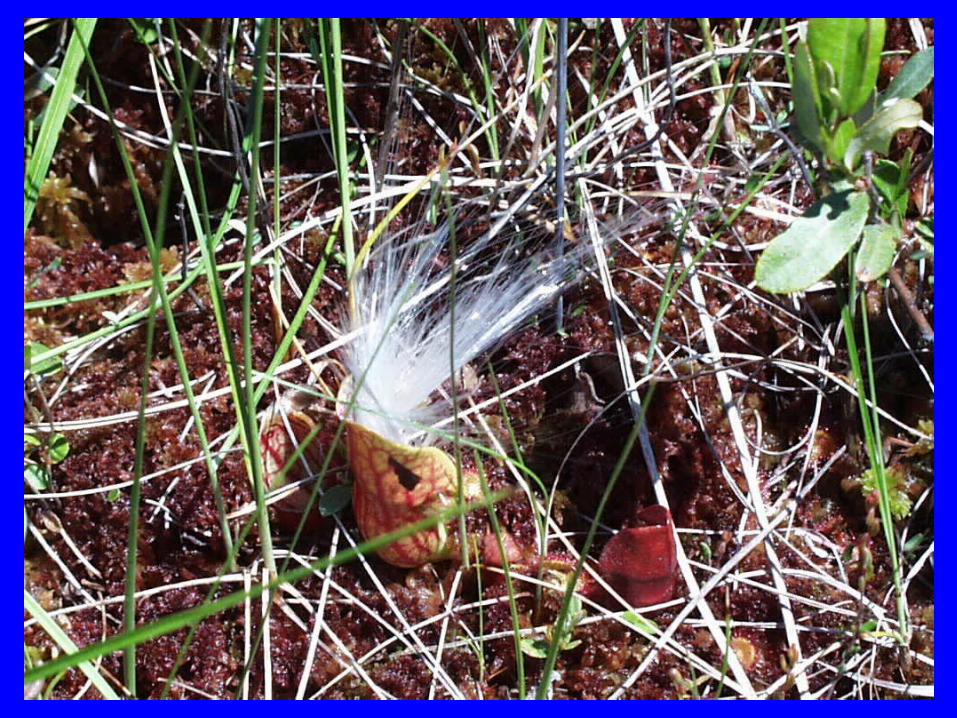
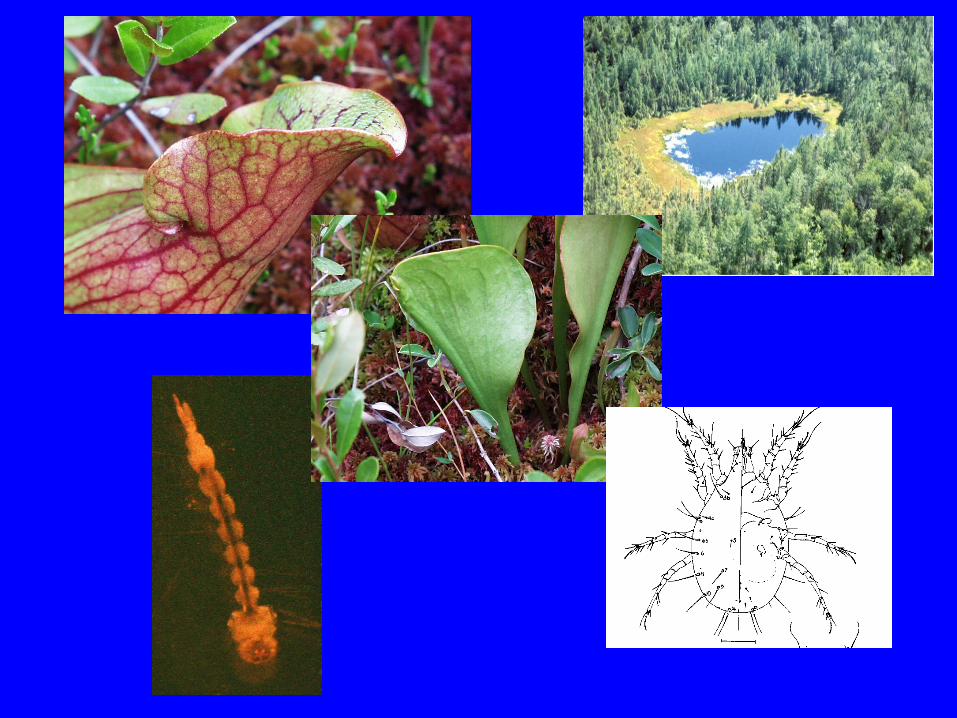
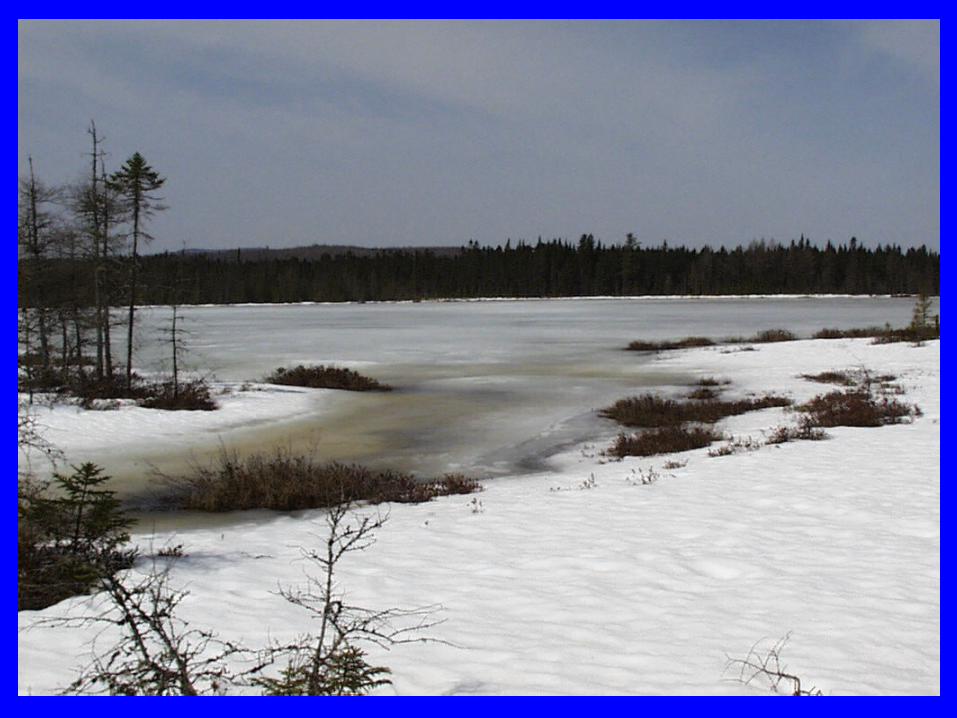
The Northern Pitcher Plant Sarracenia purpurea
• Perennial plant of low-N peatlands
• Lifespan 30-50 y
• Arthropod prey capture in water-filled pitchers
• Diverse inquiline community in pitchers
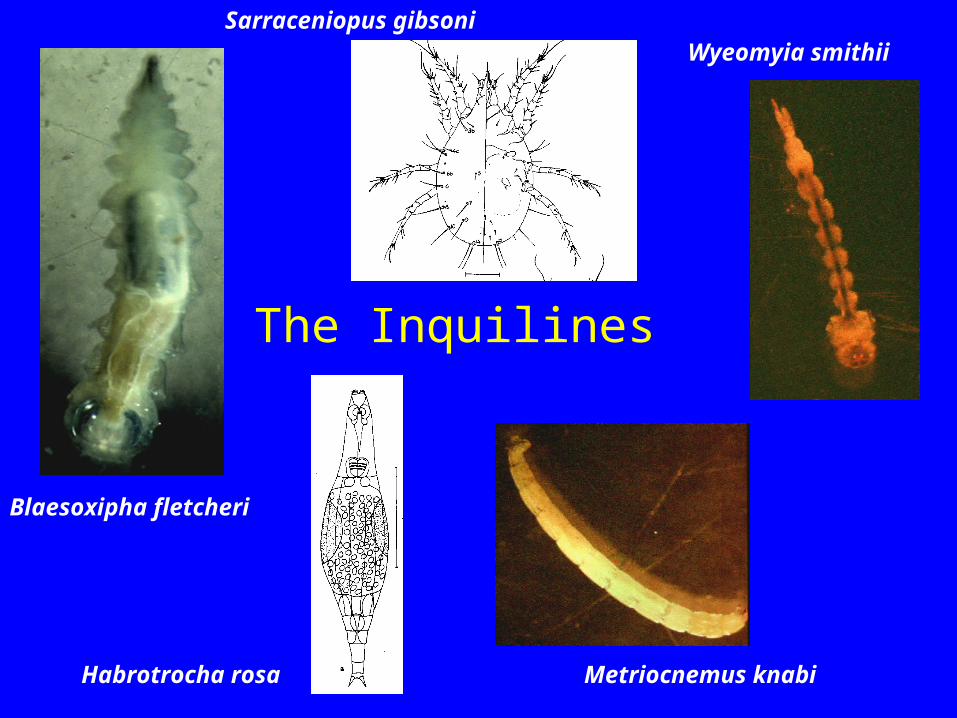
The Inquilines
Wyeomyia smithii
Metriocnemus knabiHabrotrocha rosa
Blaesoxipha fletcheri
Sarraceniopus gibsoni
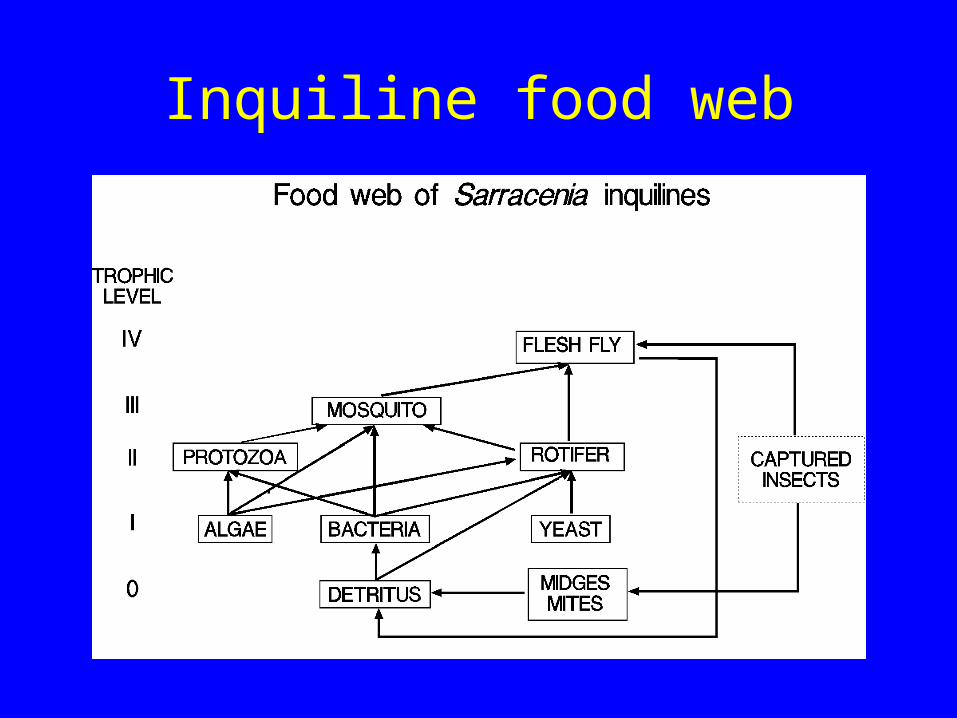
Inquiline food web
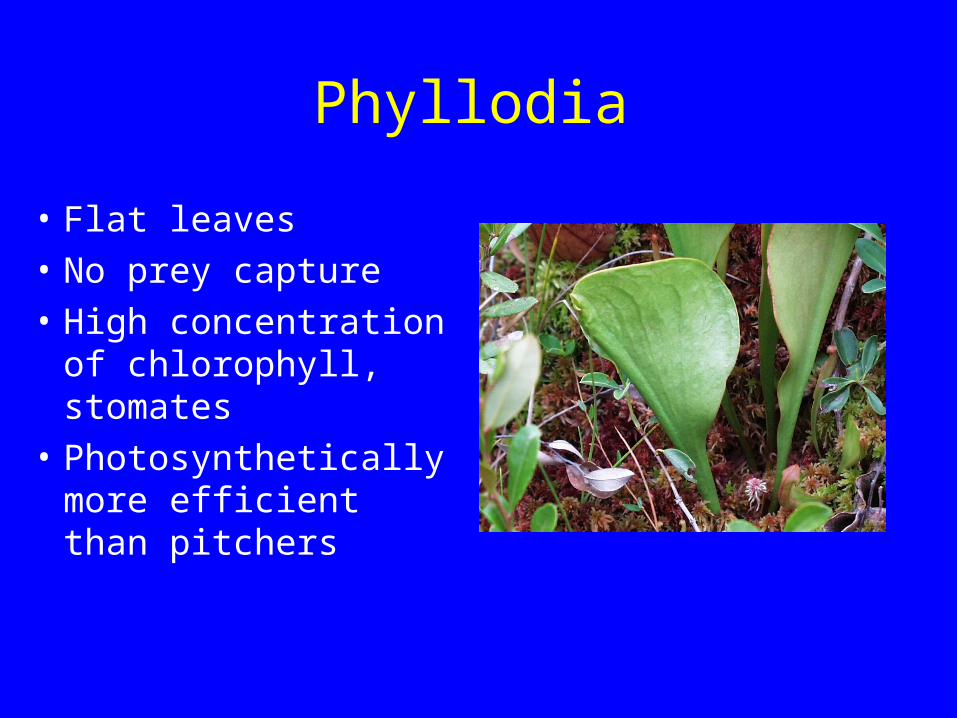
Phyllodia
• Flat leaves
• No prey capture
• High concentration of chlorophyll, stomates
• Photosynthetically more efficient than pitchers
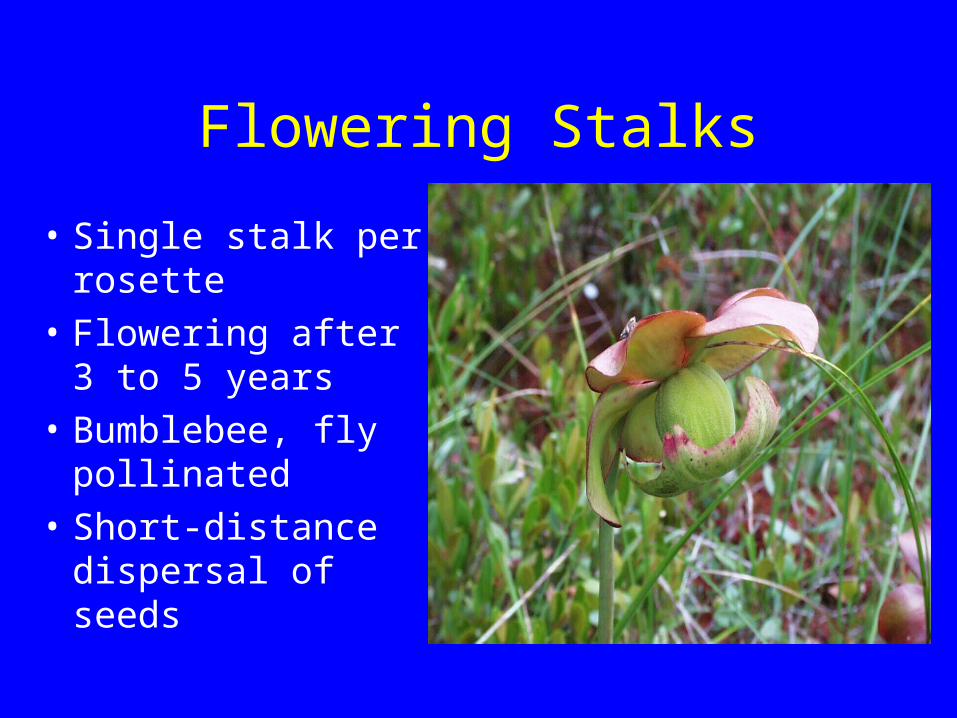
Flowering Stalks
• Single stalk per rosette
• Flowering after3 to 5 years
• Bumblebee, fly pollinated
• Short-distancedispersal of seeds
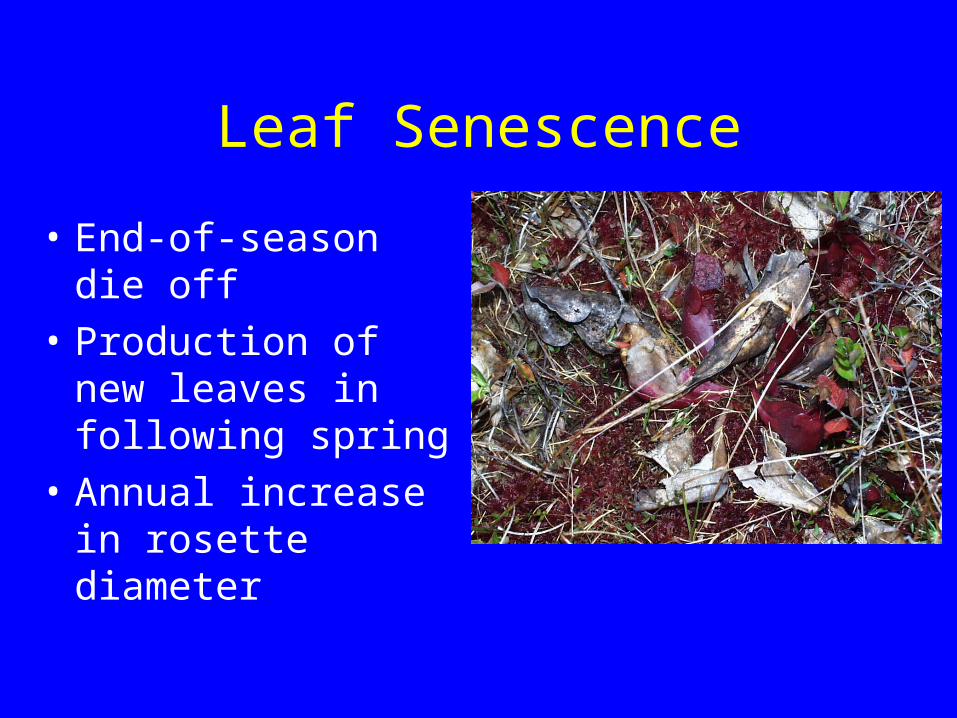
Leaf Senescence
• End-of-season die off
• Production of new leaves in following spring
• Annual increase in rosette diameter
Effects of N Deposition on Carnivorous Plants
• Life History
• Effects on Individuals
• Effects on Populations
• Effects on Communities
• The Role of Ecologists
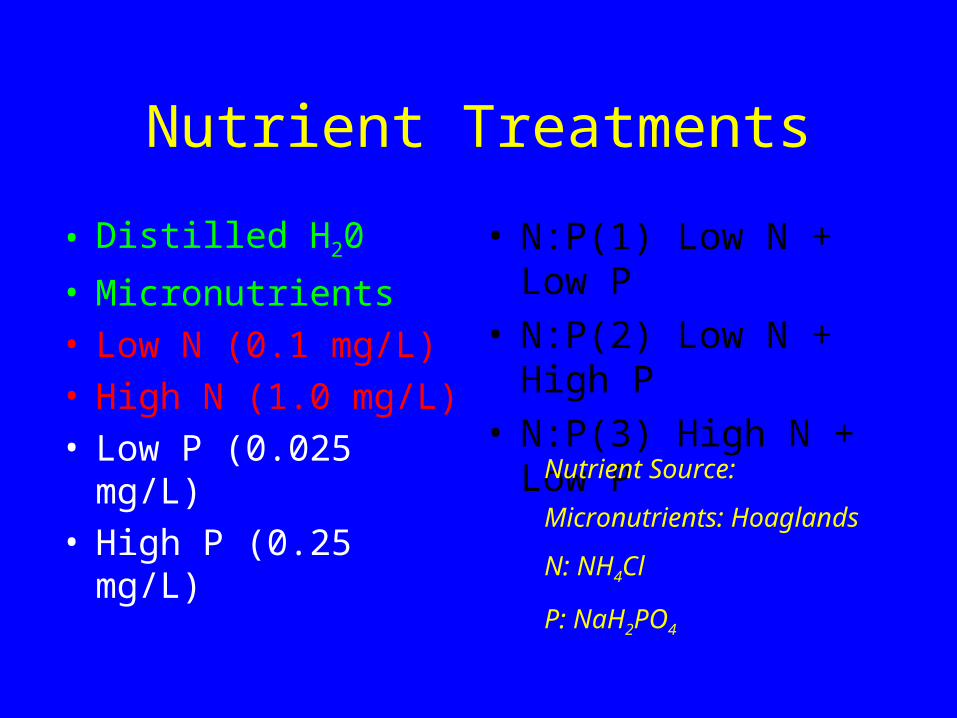
Nutrient Treatments
• Distilled H20
• Micronutrients• Low N (0.1 mg/L)• High N (1.0 mg/L)• Low P (0.025 mg/L)• High P (0.25 mg/L)
• N:P(1) Low N + Low P• N:P(2) Low N + High P• N:P(3) High N + Low P
Nutrient Source:
Micronutrients: Hoaglands
N: NH4Cl
P: NaH2PO4
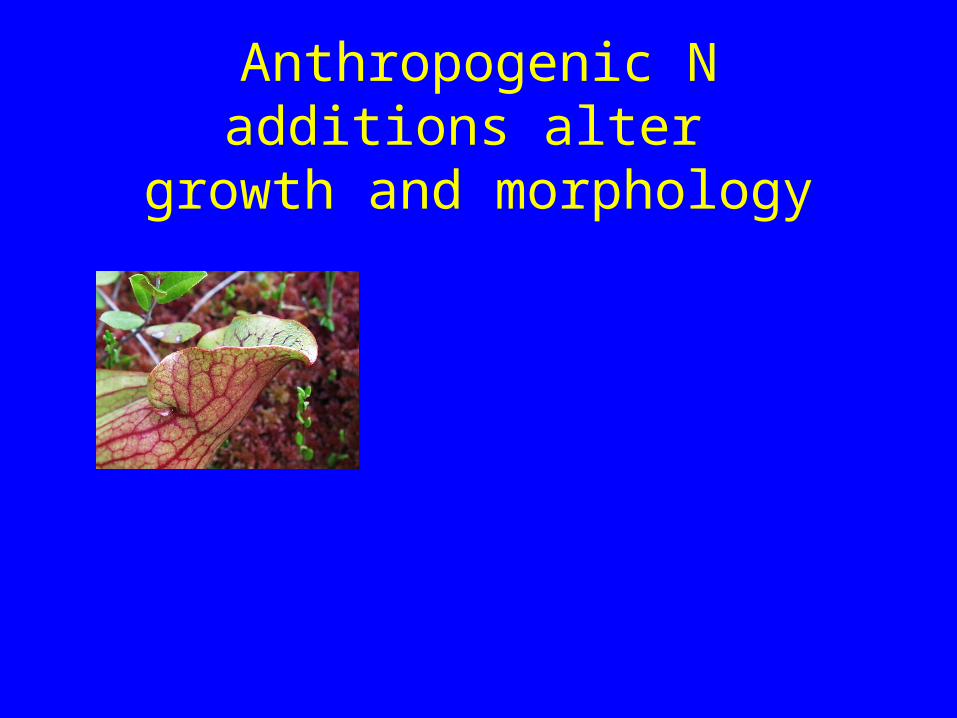
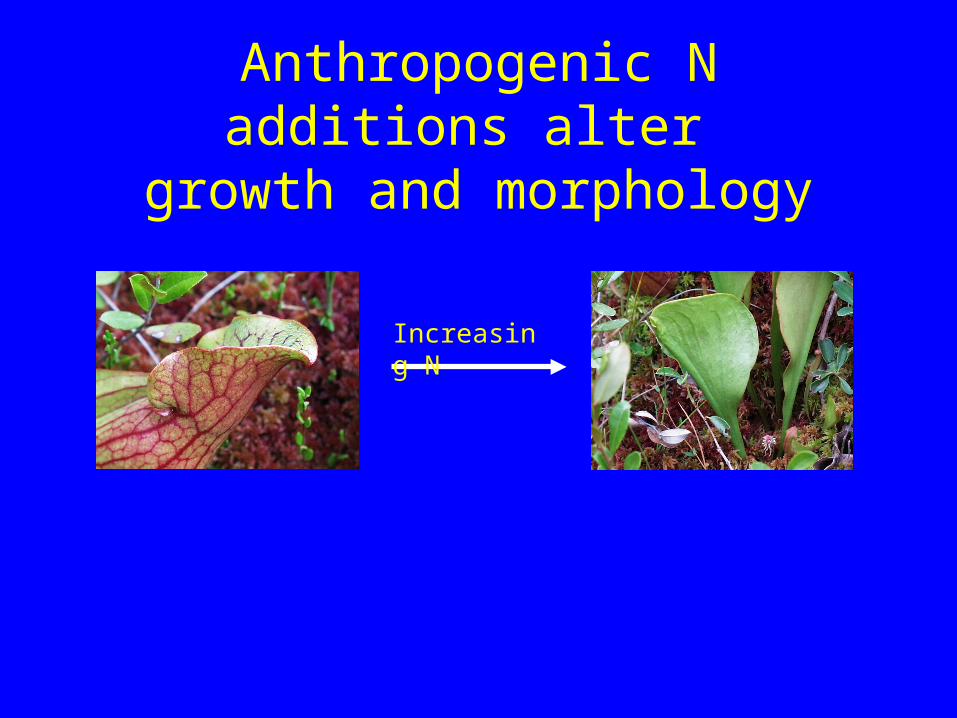
Anthropogenic N additions alter growth and morphology
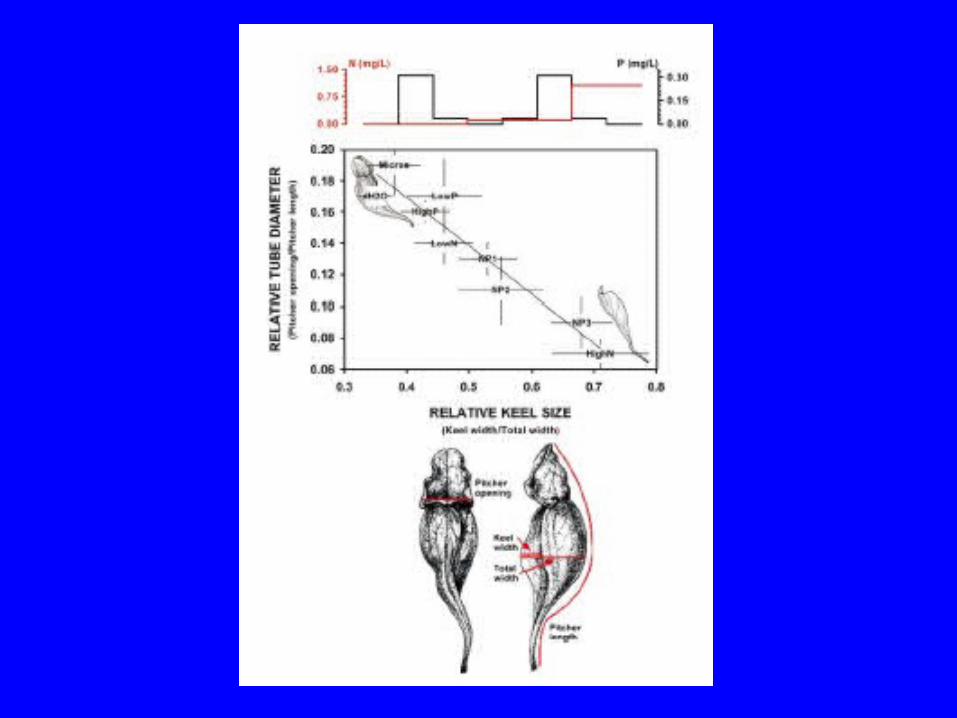

Anthropogenic N additions alter growth and morphology
Increasing N
Effects of Anthropogenic N additions
• Increased production of phyllodiaPhenotypic shift from carnivory to
photosynthesis
• Increased probability of flowering
Contrasting effects of anthropogenic N vs. N derived
from prey
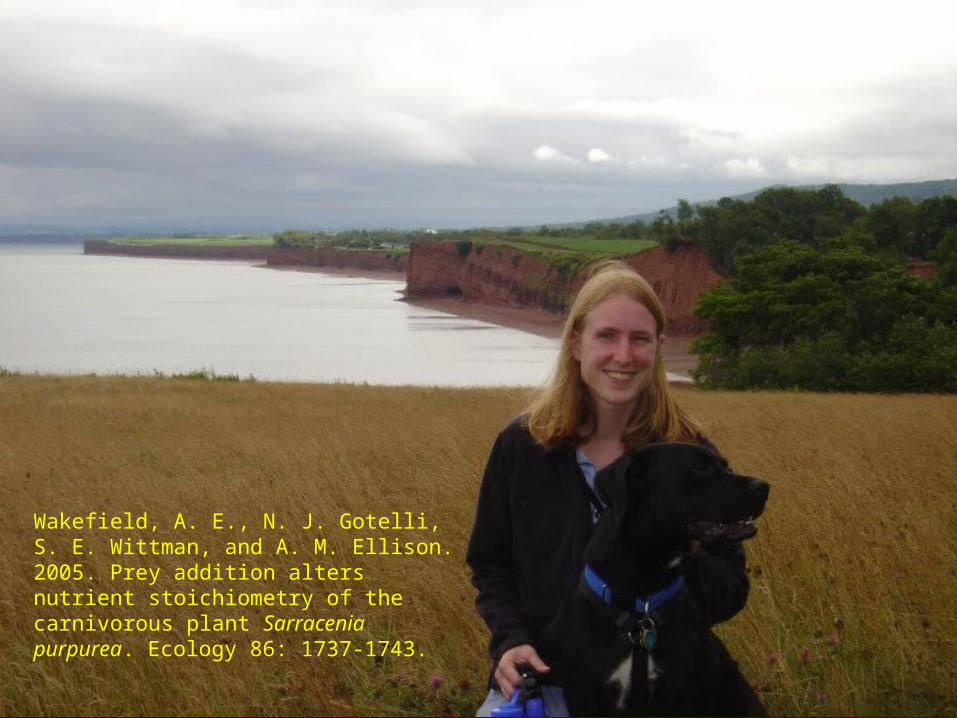
Wakefield, A. E., N. J. Gotelli, S. E. Wittman, and A. M. Ellison. 2005. Prey addition alters nutrient stoichiometry of the carnivorous plant Sarracenia purpurea. Ecology 86: 1737-1743.
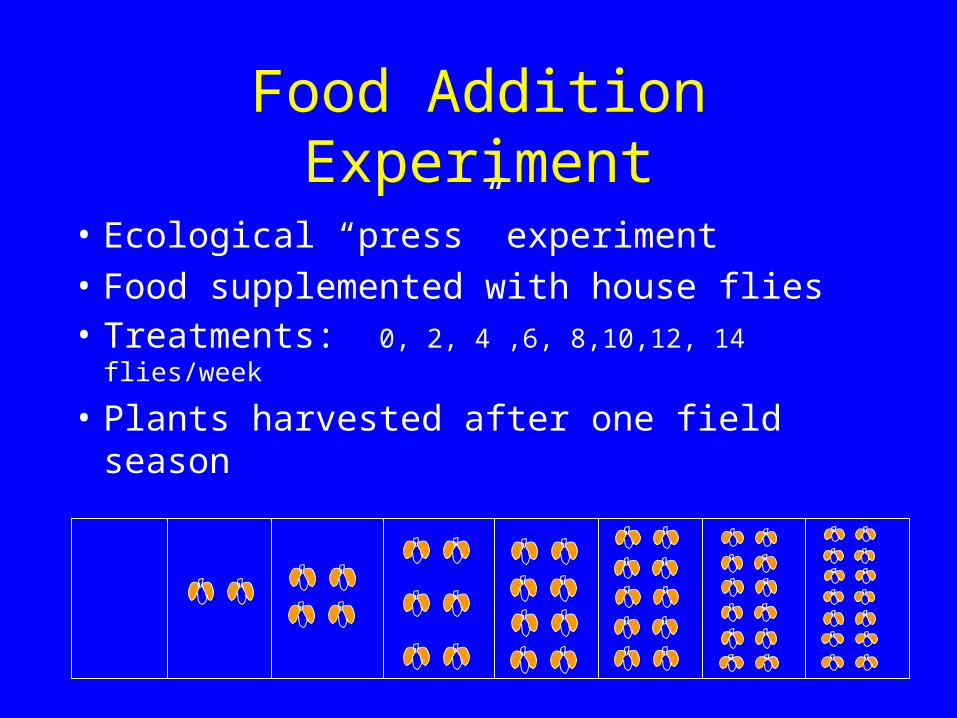
Food Addition Experiment
• Ecological “press” experiment
• Food supplemented with house flies• Treatments: 0, 2, 4 ,6, 8,10,12, 14 flies/week
• Plants harvested after one field season
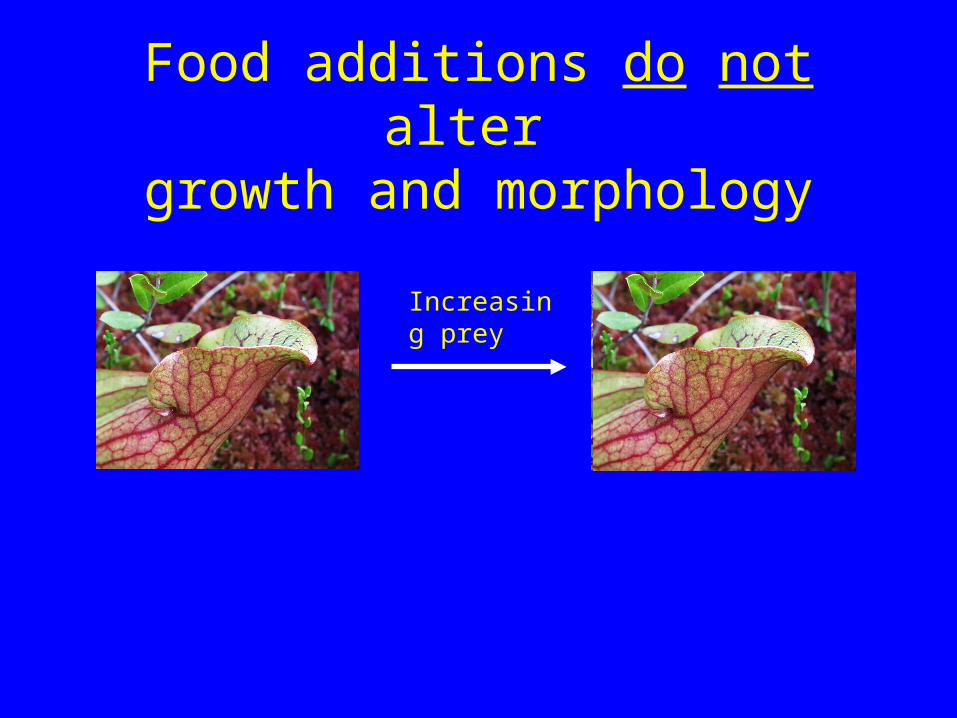
Food additions do not alter growth and morphology
Increasing prey
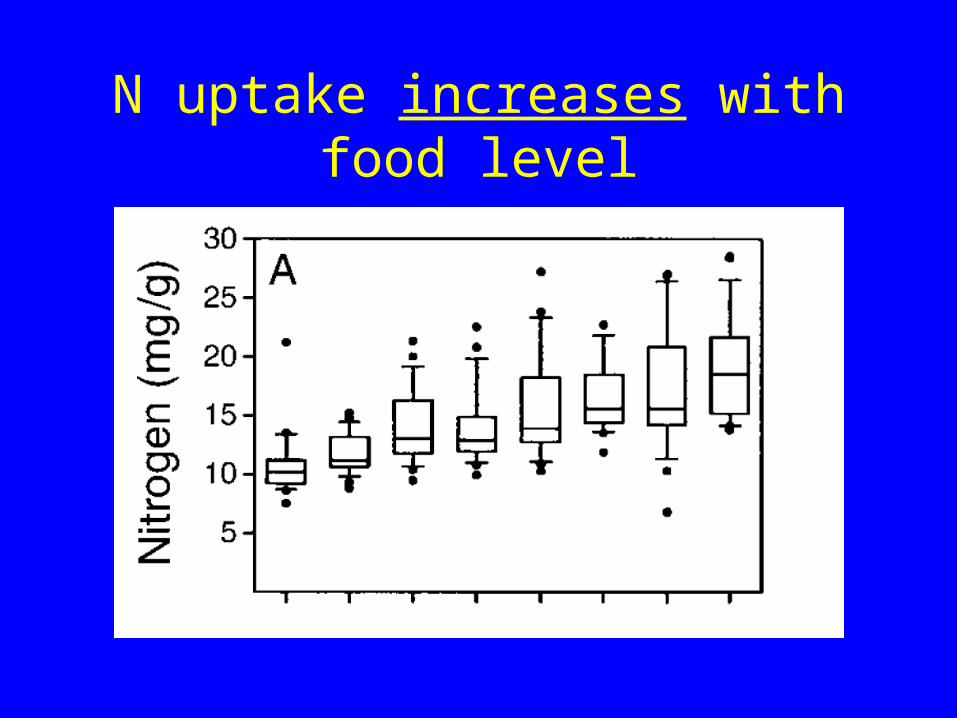
N uptake increases with food level
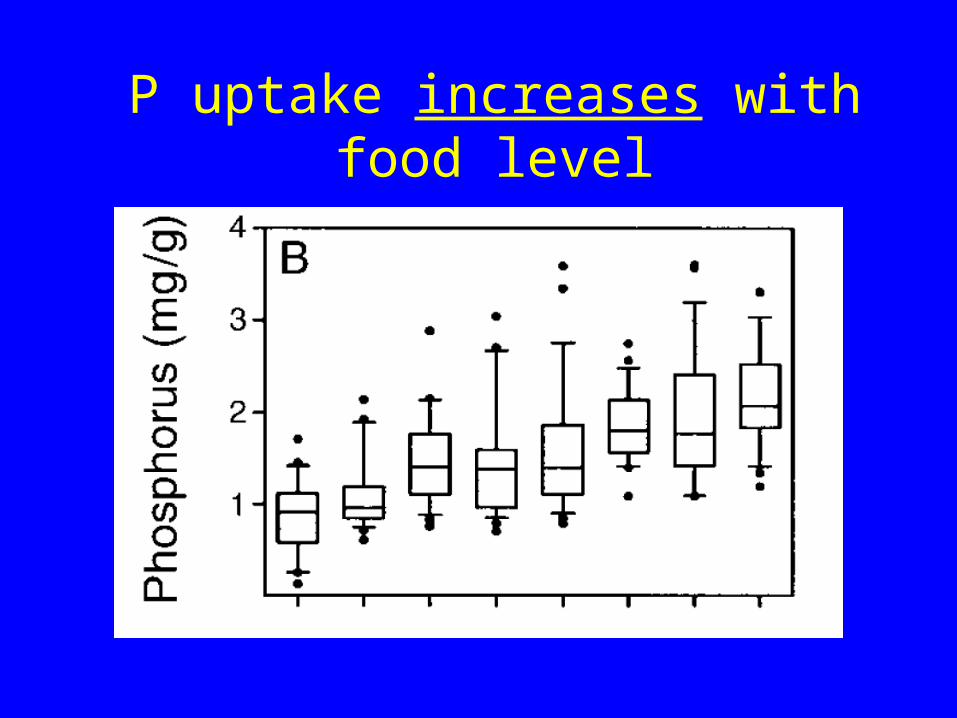
P uptake increases with food level
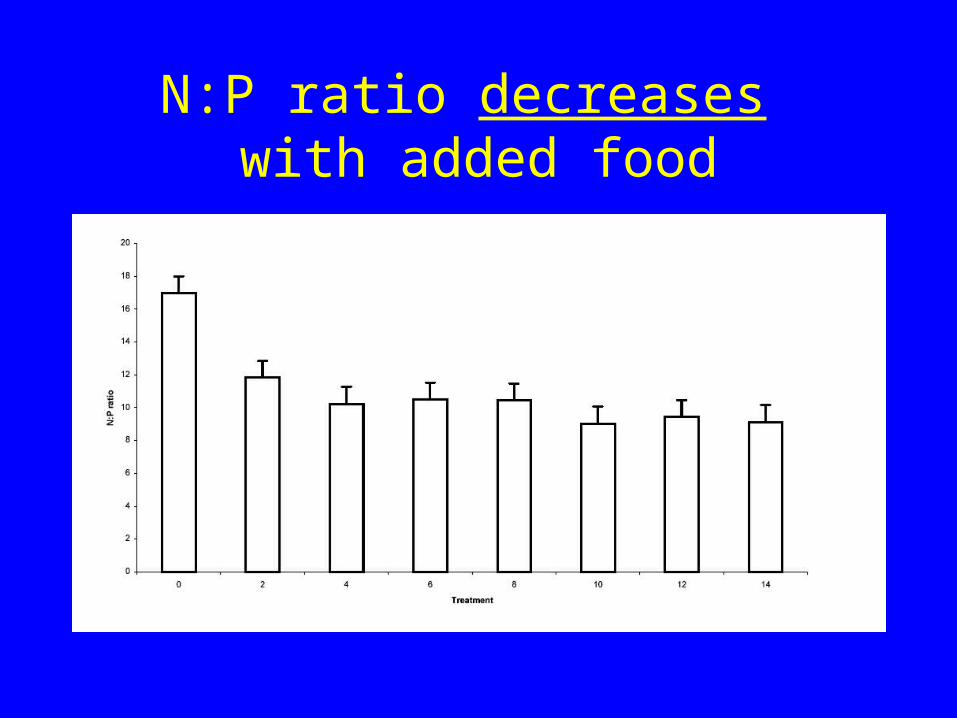
N:P ratio decreases with added food
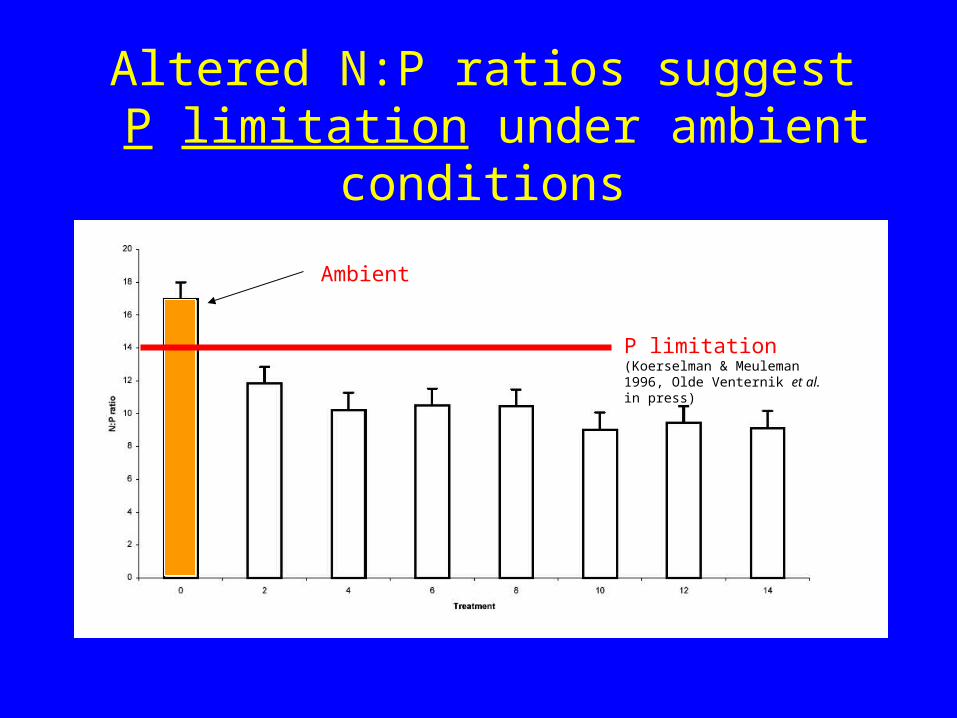
Altered N:P ratios suggest P limitation under ambient conditions
P limitation (Koerselman & Meuleman 1996, Olde Venternik et al. in press)
Ambient

Food additions do not alter growth and morphology
Increasing prey
Anthropogenic N additions alter growth and morphology
Increasing N
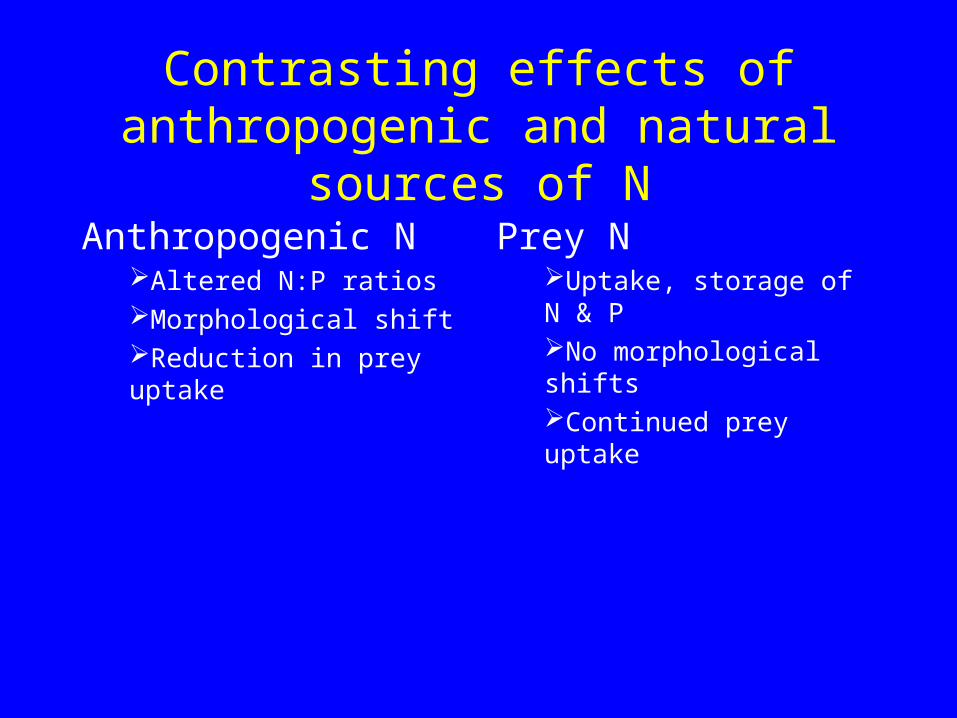
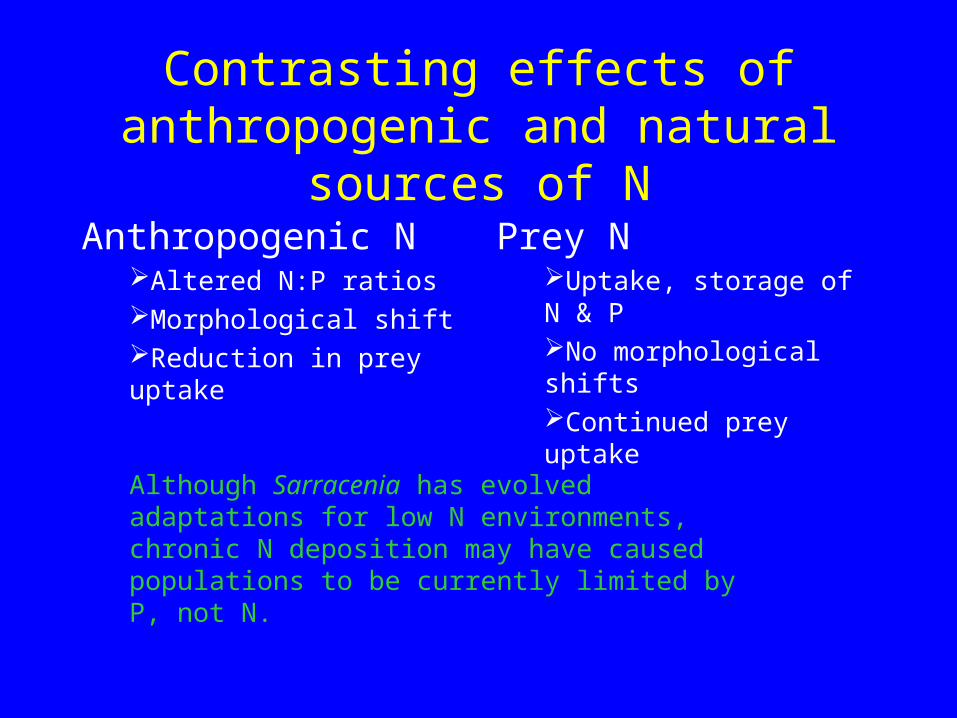
Contrasting effects of anthropogenic and natural sources of N
Anthropogenic NAltered N:P ratiosMorphological shiftReduction in prey uptake
Prey NUptake, storage of N & PNo morphological shiftsContinued prey uptake
Contrasting effects of anthropogenic and natural sources of N
Anthropogenic NAltered N:P ratiosMorphological shiftReduction in prey uptake
Prey NUptake, storage of N & PNo morphological shiftsContinued prey uptake
Although Sarracenia has evolved adaptations for low N environments, chronic N deposition may have caused populations to be currently limited by P, not N.
Effects of N Deposition on Carnivorous Plants
• Life History
• Effects on Individuals
• Effects on Populations
• Effects on Communities
• The Role of Ecologists
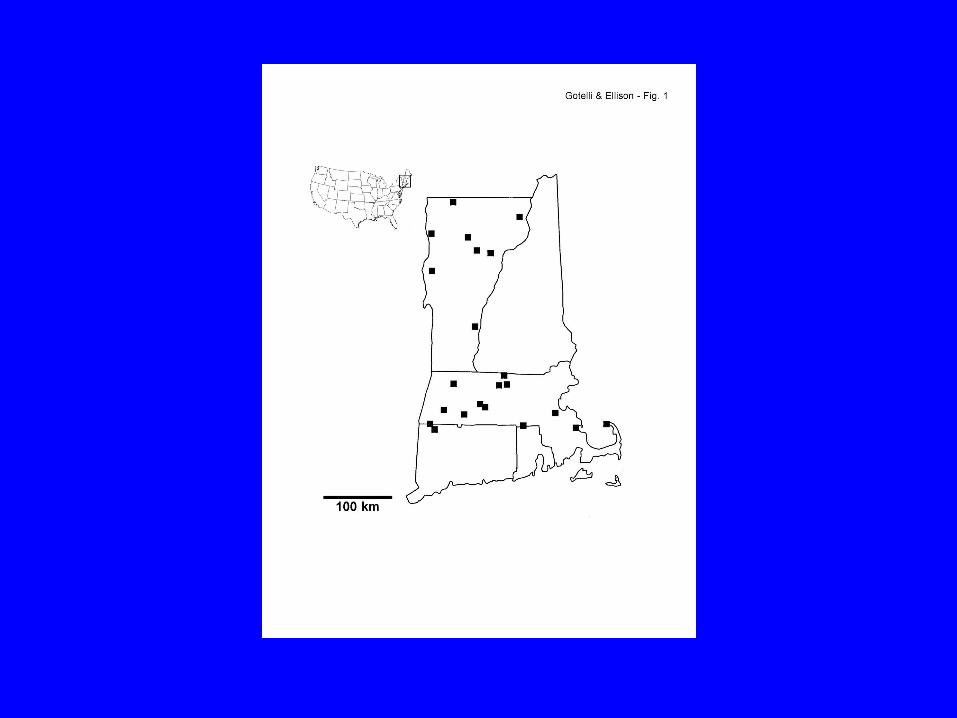
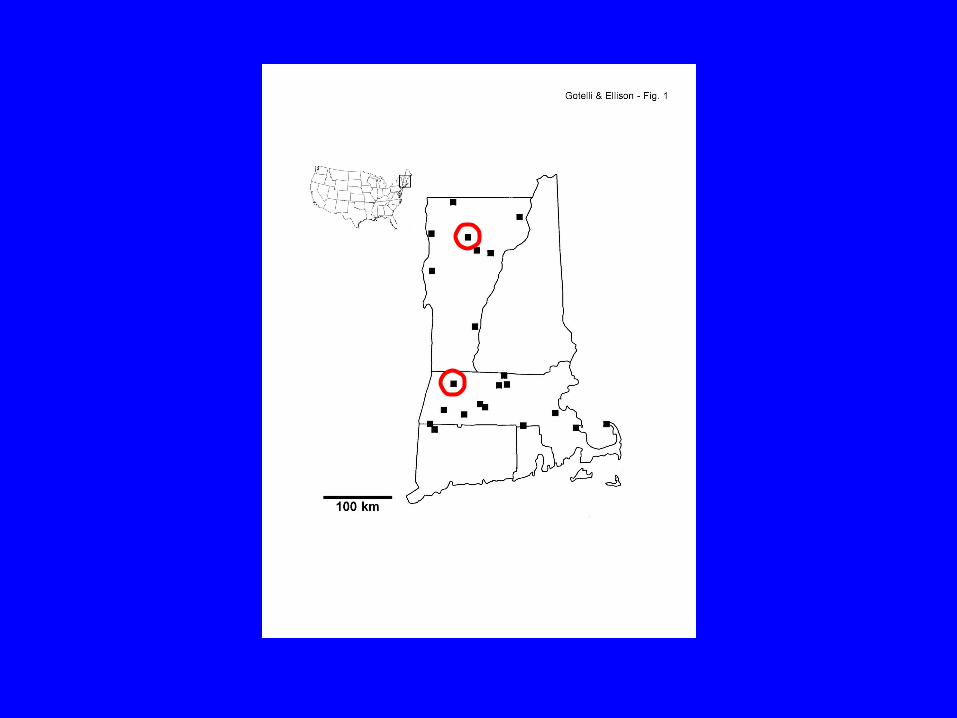
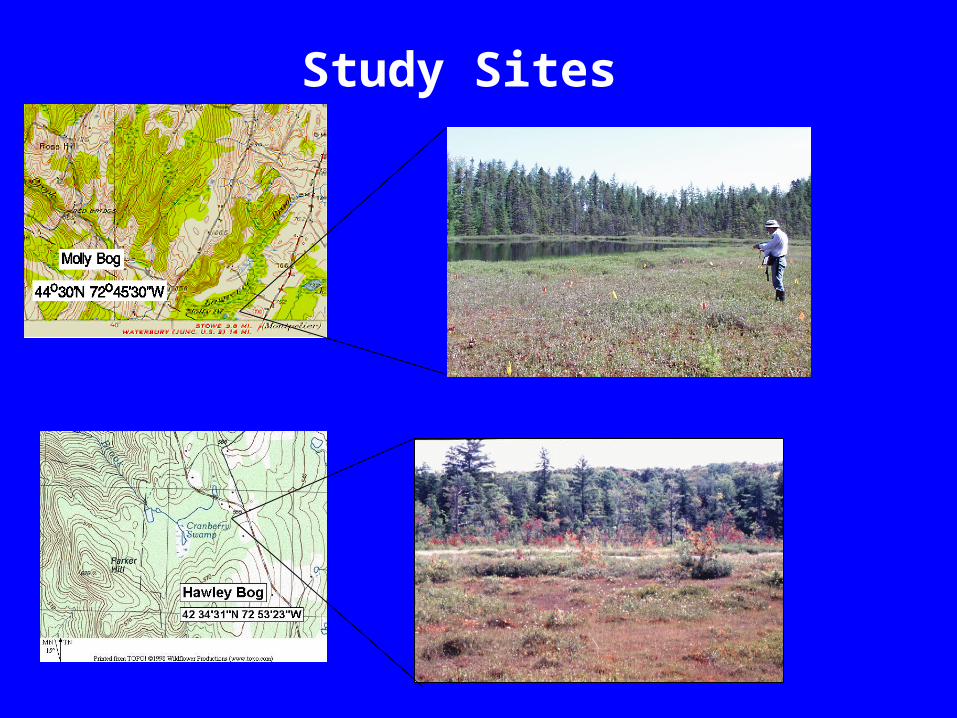
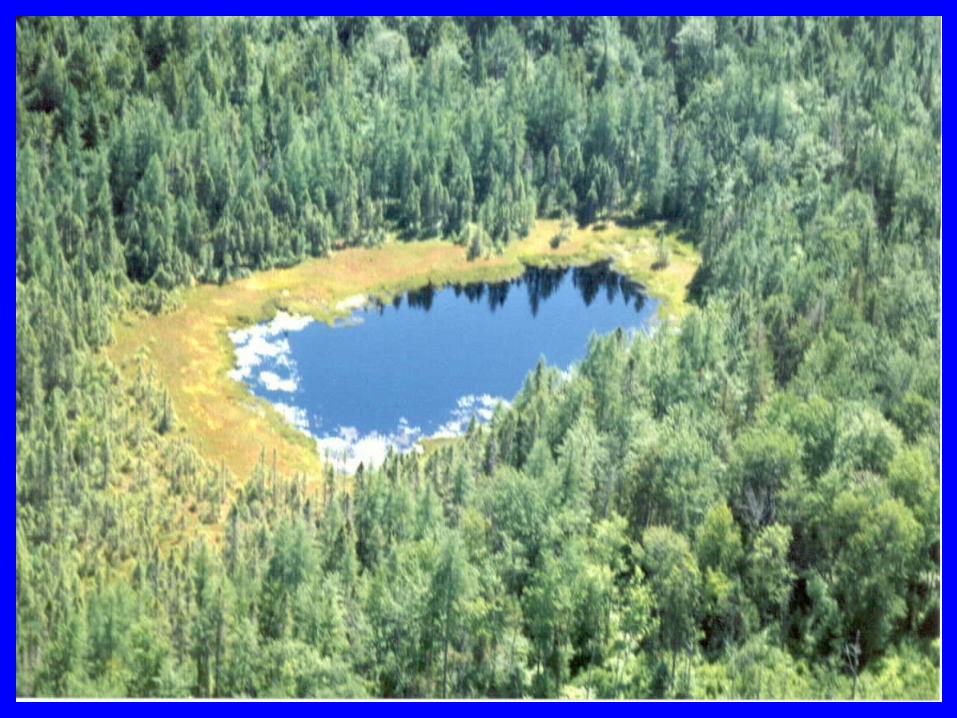
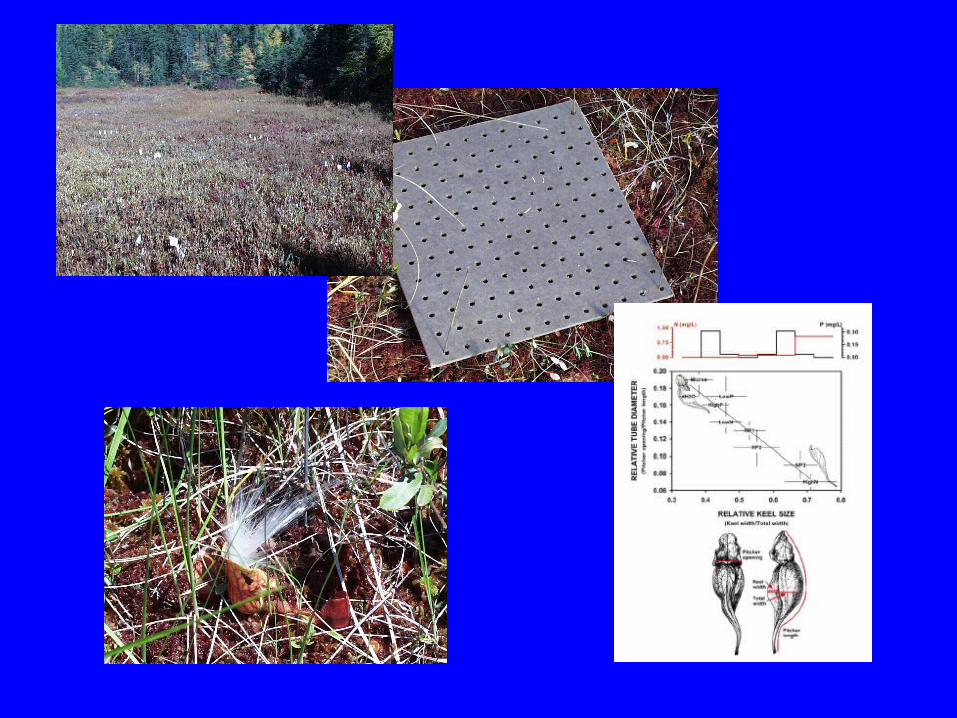
Study Sites
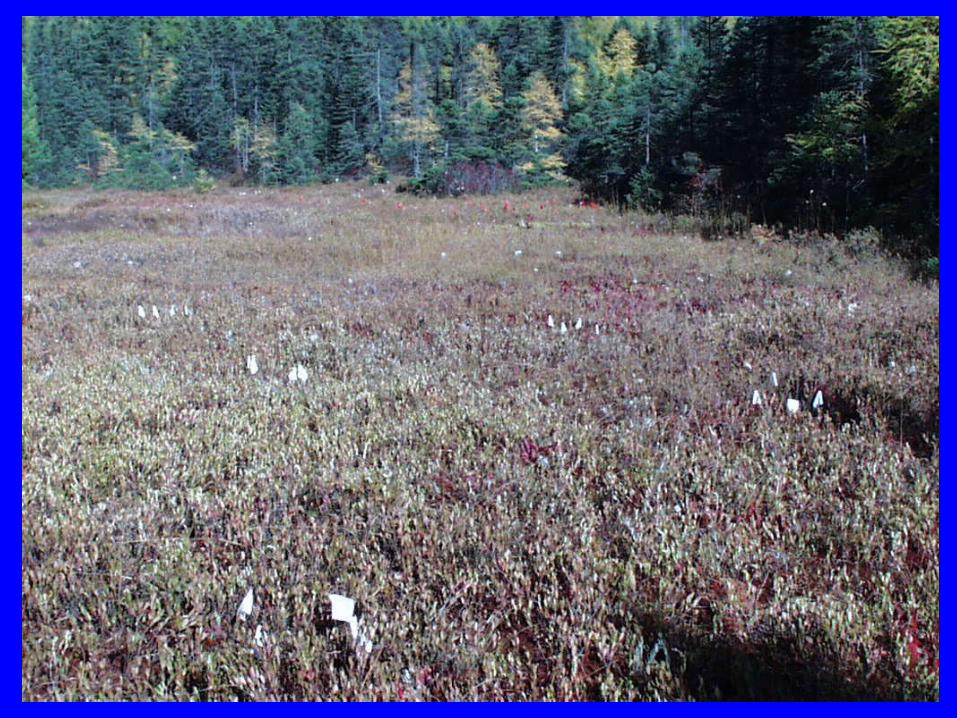
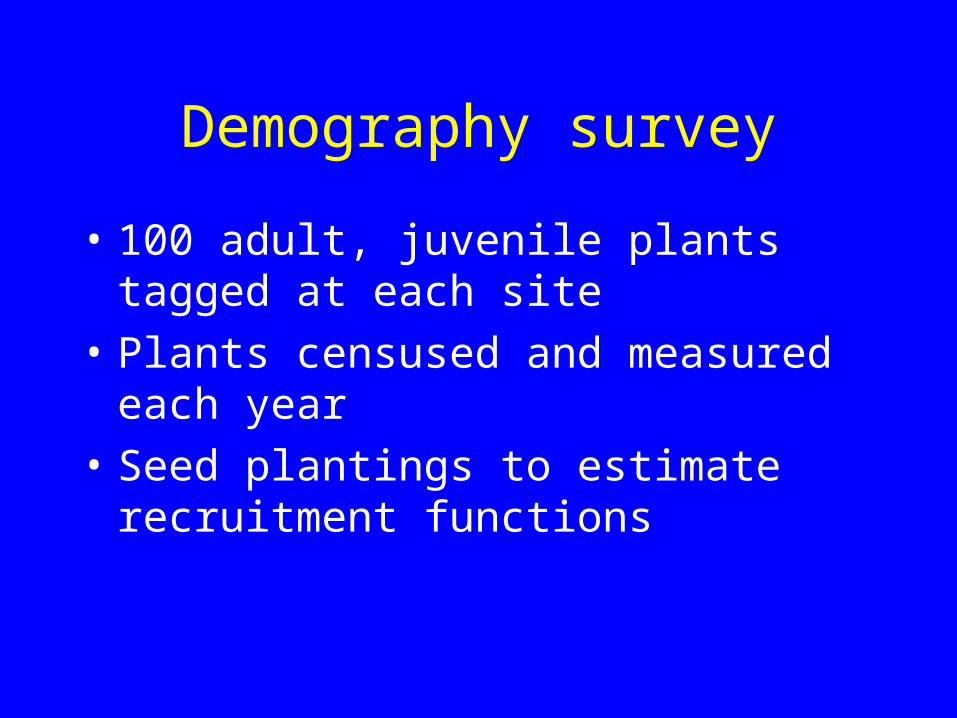
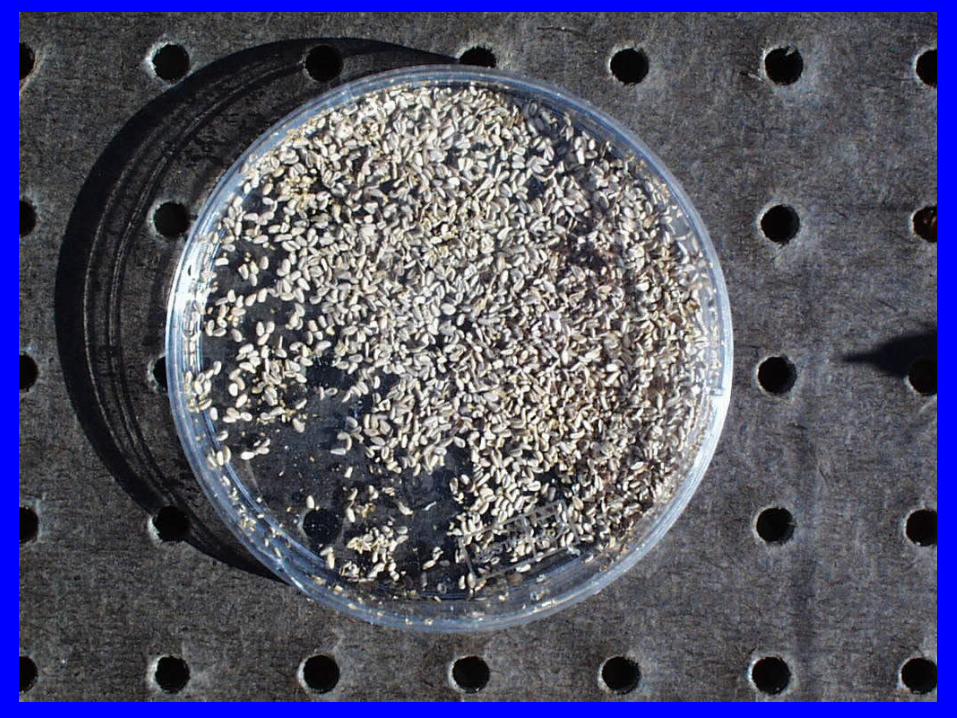
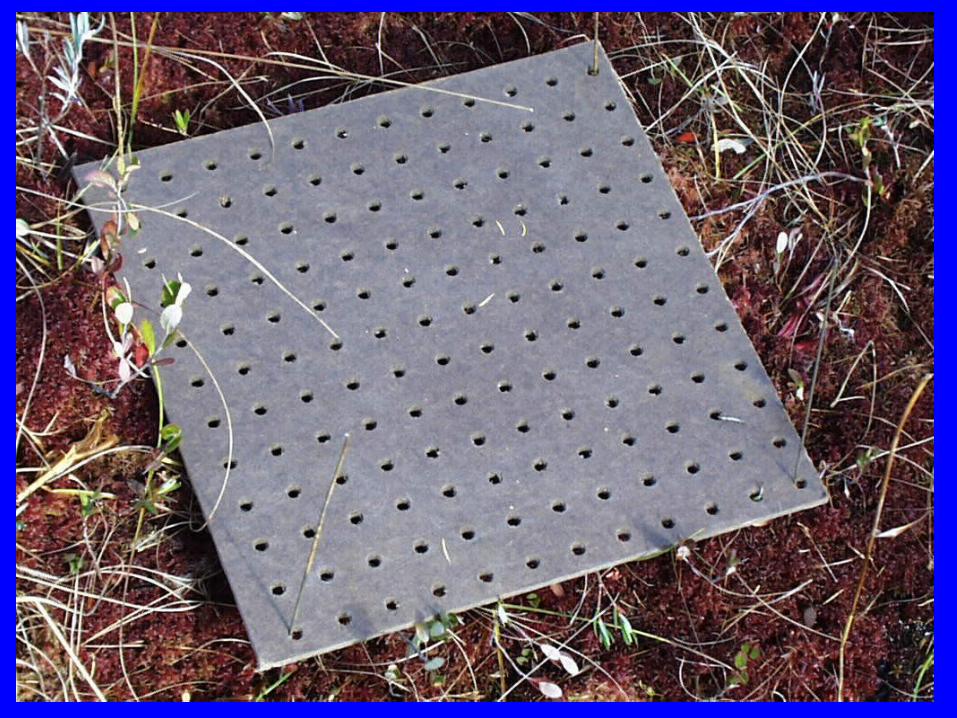
Demography survey
• 100 adult, juvenile plants tagged at each site
• Plants censused and measured each year
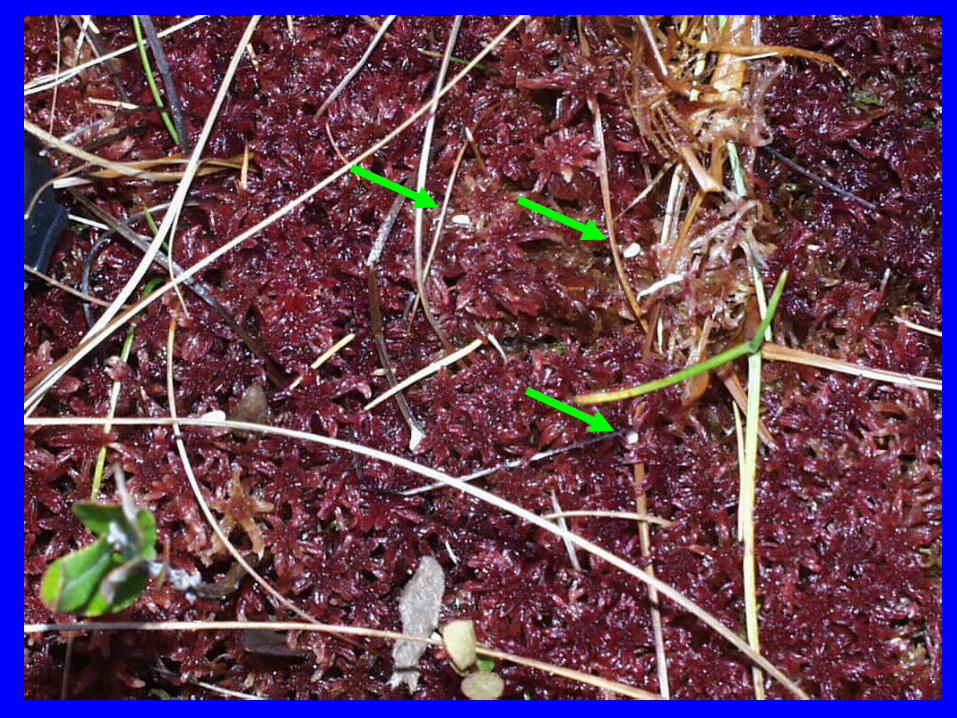
• Seed plantings to estimate recruitment functions
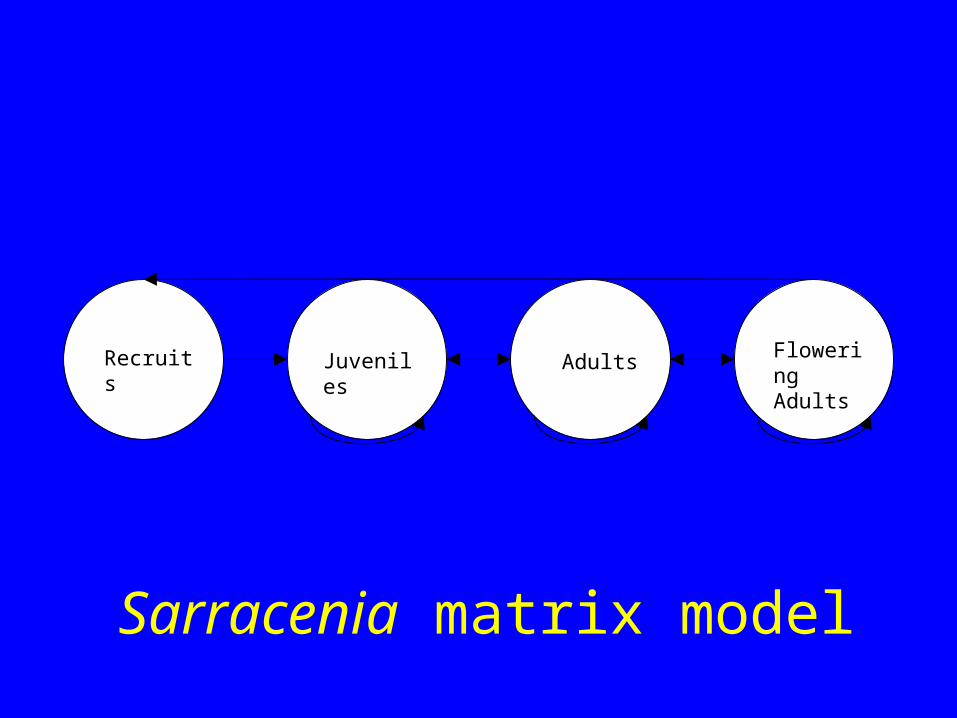
Recruits Juveniles Adults Flowering Adults
Sarracenia matrix model
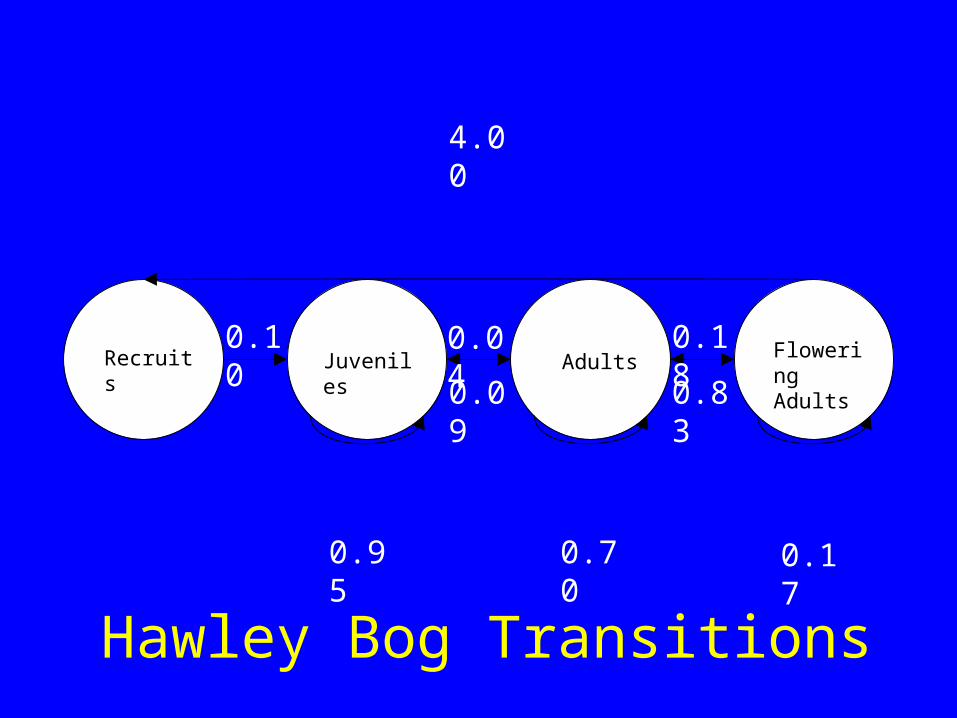
Recruits Juveniles Adults Flowering Adults
Hawley Bog Transitions
0.10
4.00
0.04
0.09
0.18
0.83
0.95 0.70 0.17
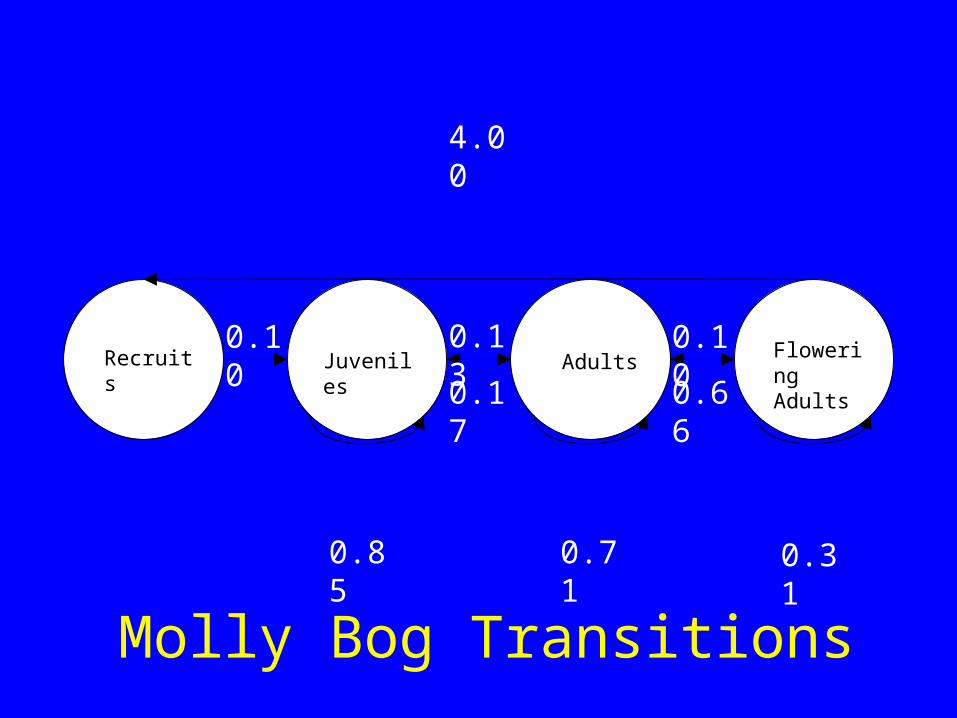
Recruits Juveniles Adults Flowering Adults
Molly Bog Transitions
0.10
4.00
0.13
0.17
0.10
0.66
0.85 0.71 0.31
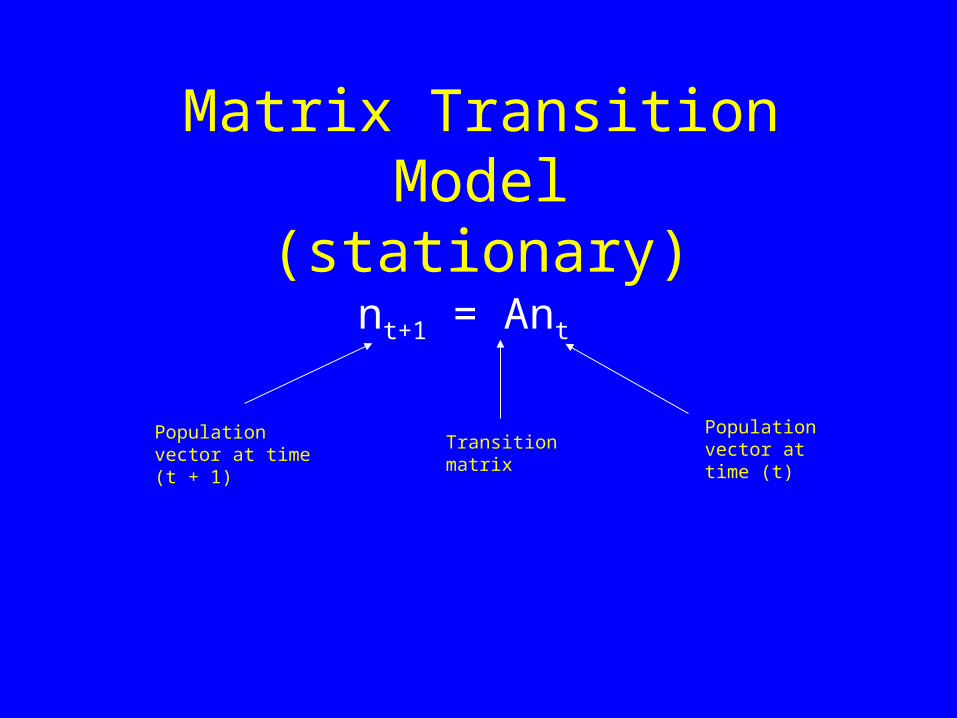
Matrix Transition Model(stationary)
nt+1 = Ant
Population vector at time (t + 1)
Transition matrixPopulation vector at time (t)
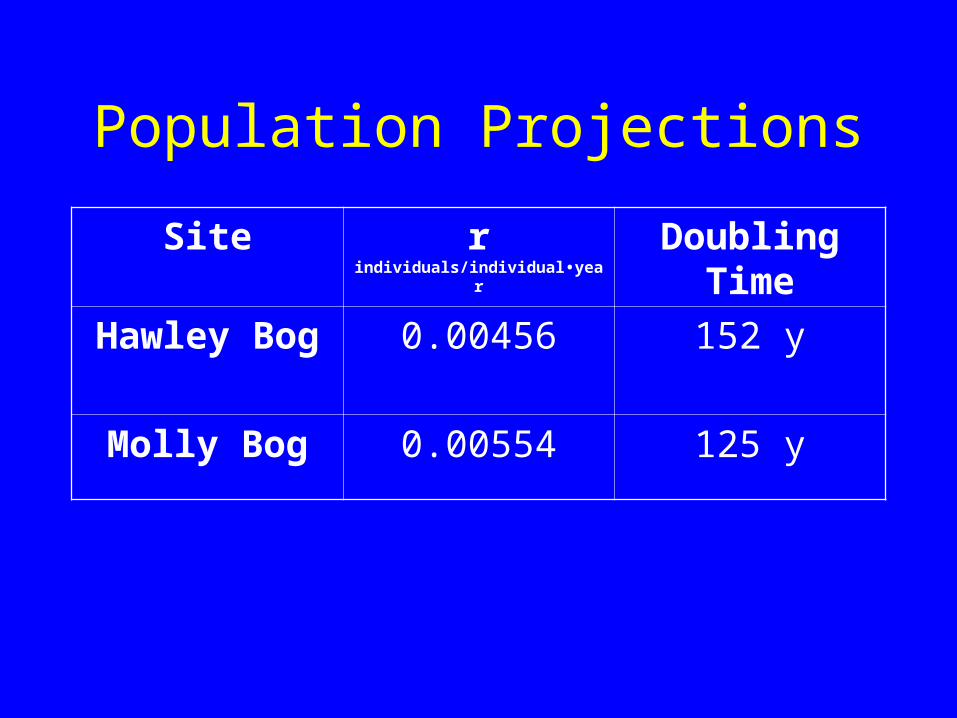
Population Projections
Site r individuals/individual•year Doubling Time
Hawley Bog 0.00456 152 y
Molly Bog 0.00554 125 y
Deterministic Model: Results
• Growth, survivorship, and reproduction are closely balanced in both sites
• Doubling times > 100 y
• Juvenile, adult persistence contribute most to population growth rate
• Sexual reproduction, recruitment relatively unimportant
How do N and P concentrations affect population growth of
Sarracenia?
Nutrient Addition Experiment
• 10 juveniles, 10 adults/treatment
• Nutrients added to leaves twice/month
• Nutrient concentrations bracket observed field values
• Nutrient treatments maintained 1998, 1999
• “Press” experiment

Nutrient Treatments
• Distilled H20
• Micronutrients• Low N (0.1 mg/L)• High N (1.0 mg/L)• Low P (0.025 mg/L)• High P (0.25 mg/L)
• N:P(1) Low N + Low P• N:P(2) Low N + High P• N:P(3) High N + Low P
Nutrient Source:
Micronutrients: Hoaglands
N: NH4Cl
P: NaH2PO4
Effects of N additions
• Increased production of phyllodia
• Increased probability of flowering
Effects of N additions
• Increased production of phyllodia
• Increased probability of flowering
• Decreased juvenile survivorship
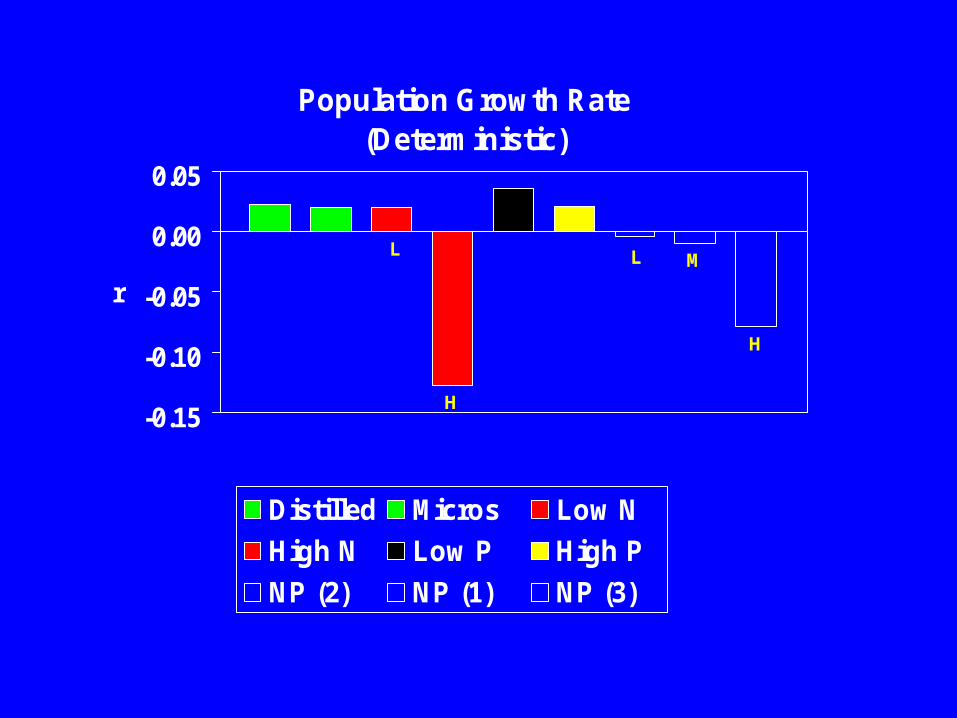
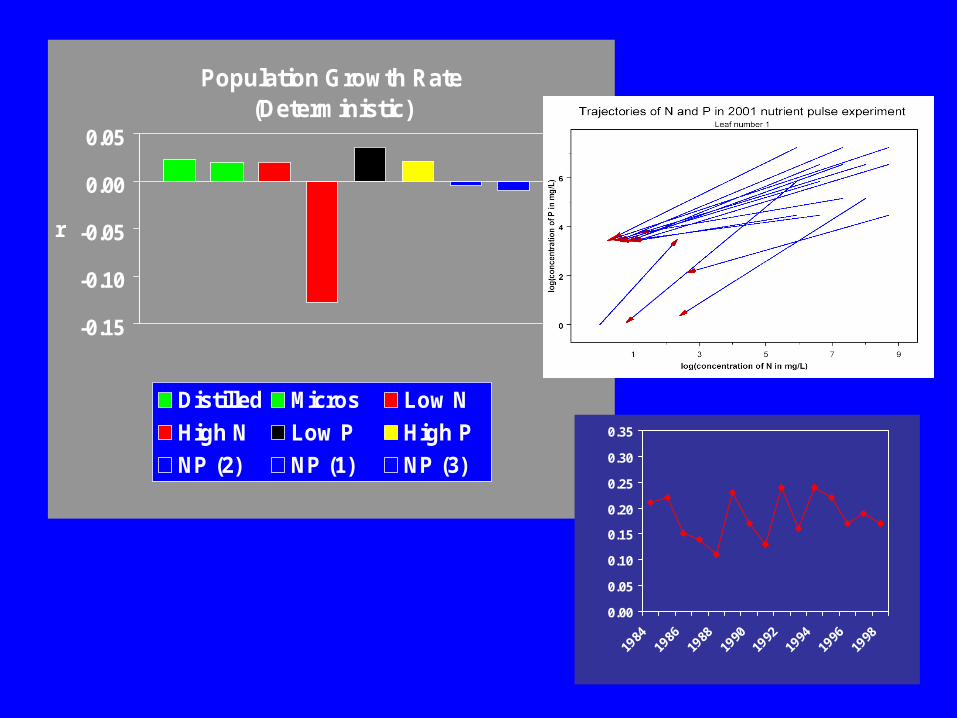
Population Growth Rate(Deterministic)
-0.15
-0.10
-0.05
0.00
0.05
r
Distilled Micros Low N
High N Low P High P
NP (2) NP (1) NP (3)
LLM
H
H
Effects of Nitrogen on Demography: Results
• Population growth rates respond to different N and P regimes
• Population growth rate decreases in response to increasing N
• Population growth rate decreases in responses to increasing N:P

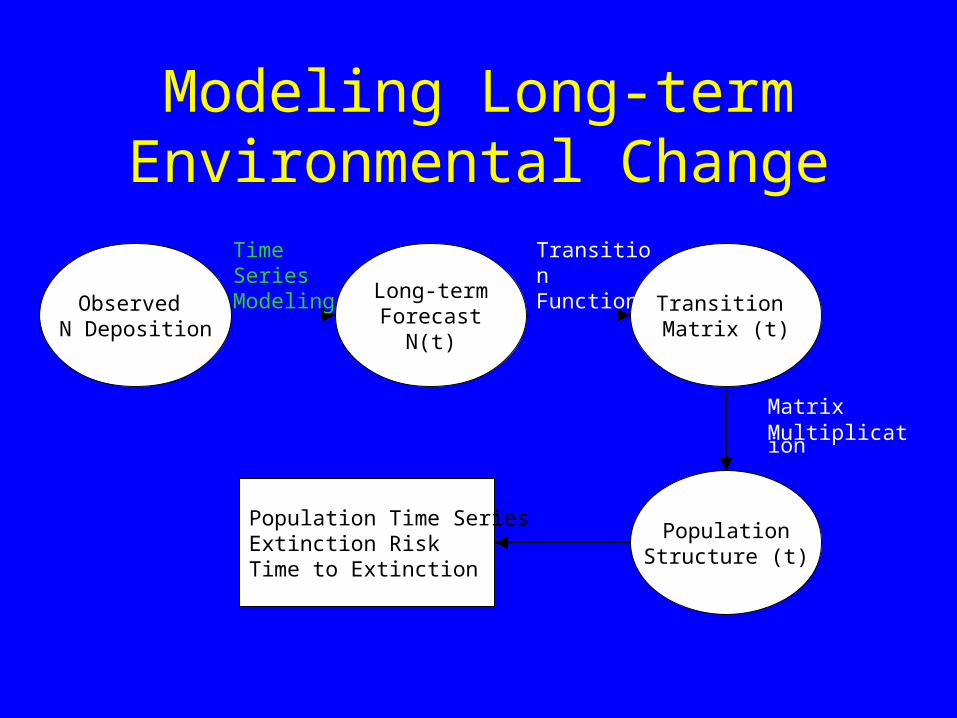
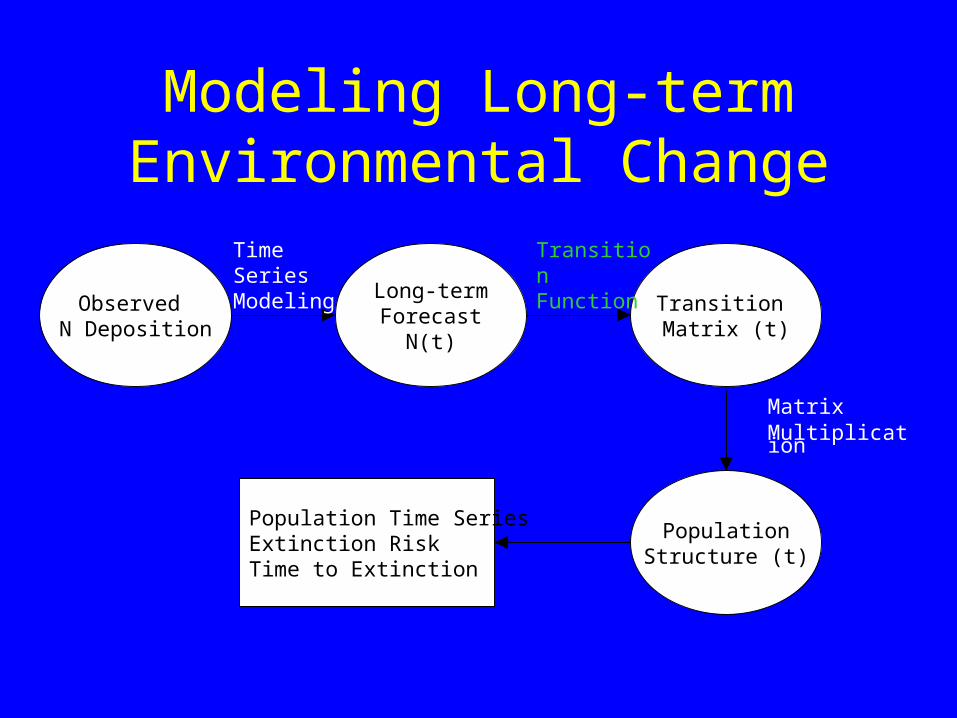
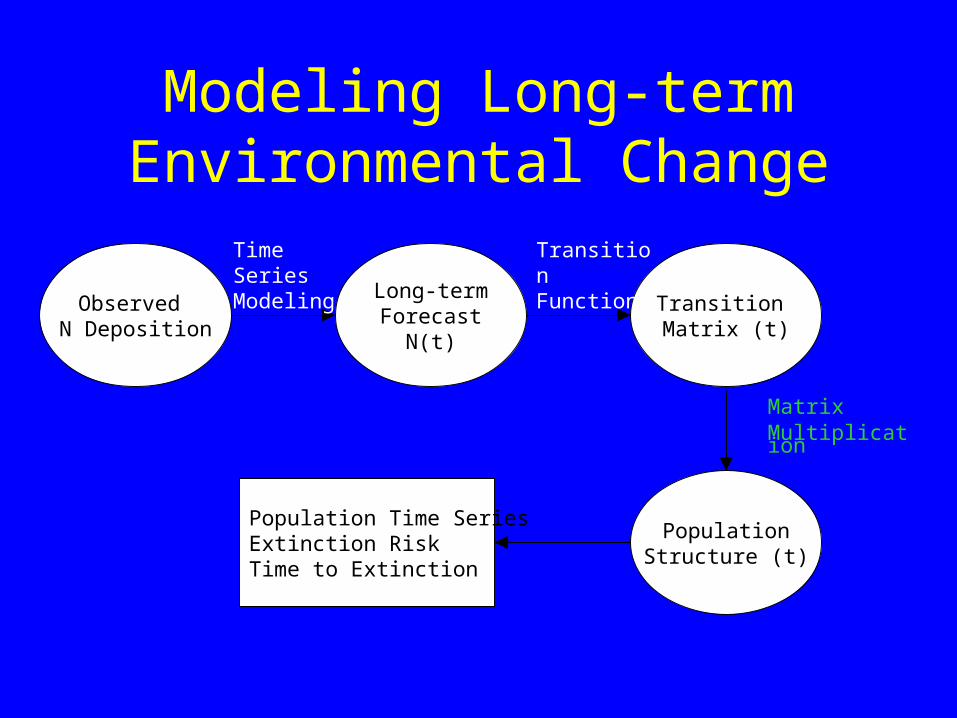
Modeling Long-term Environmental Change
Observed N Deposition
Long-termForecast
N(t)
Transition Matrix (t)
PopulationStructure (t)
Time Series Modeling
Transition Function
Population Time SeriesExtinction RiskTime to Extinction
MatrixMultiplication
Modeling Long-term Environmental Change
Observed N Deposition
Long-termForecast
N(t)
Transition Matrix (t)
PopulationStructure (t)
Time Series Modeling
Transition Function
Population Time SeriesExtinction RiskTime to Extinction
MatrixMultiplication
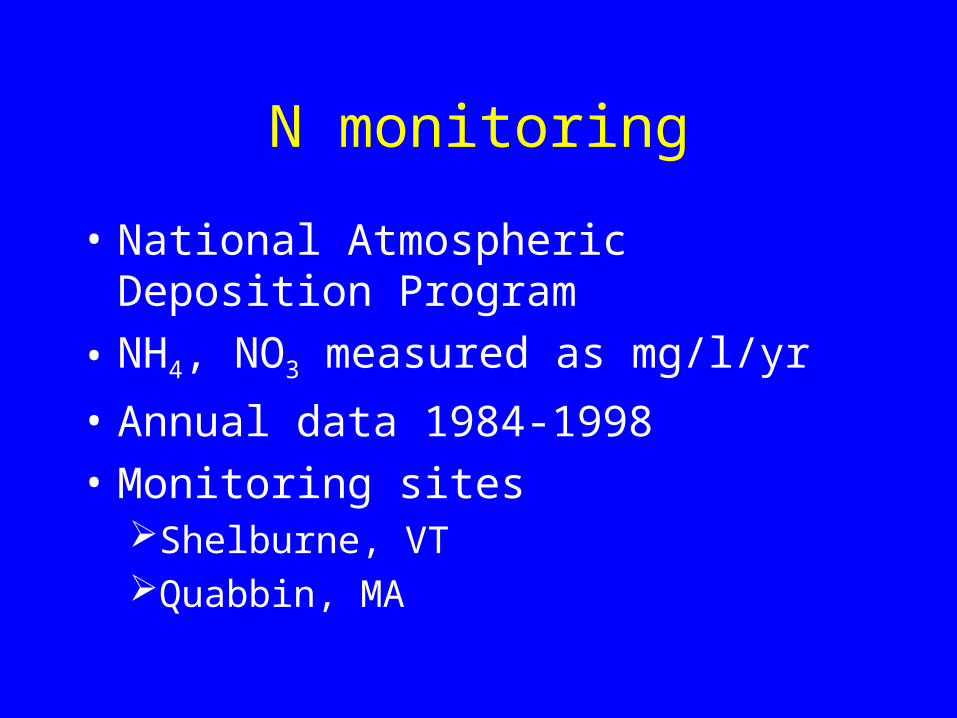
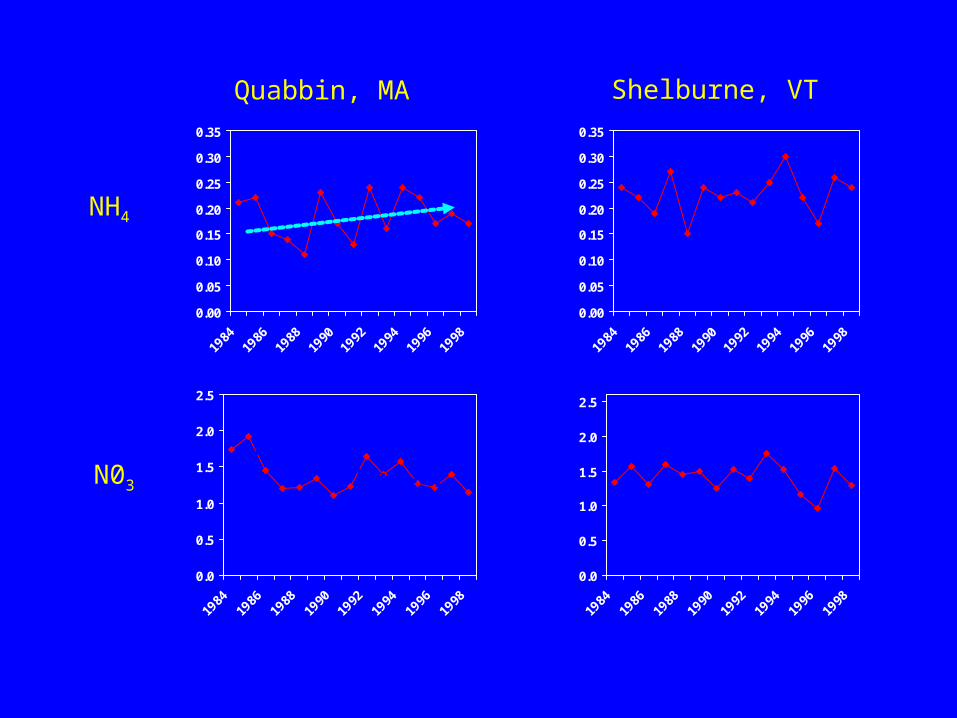
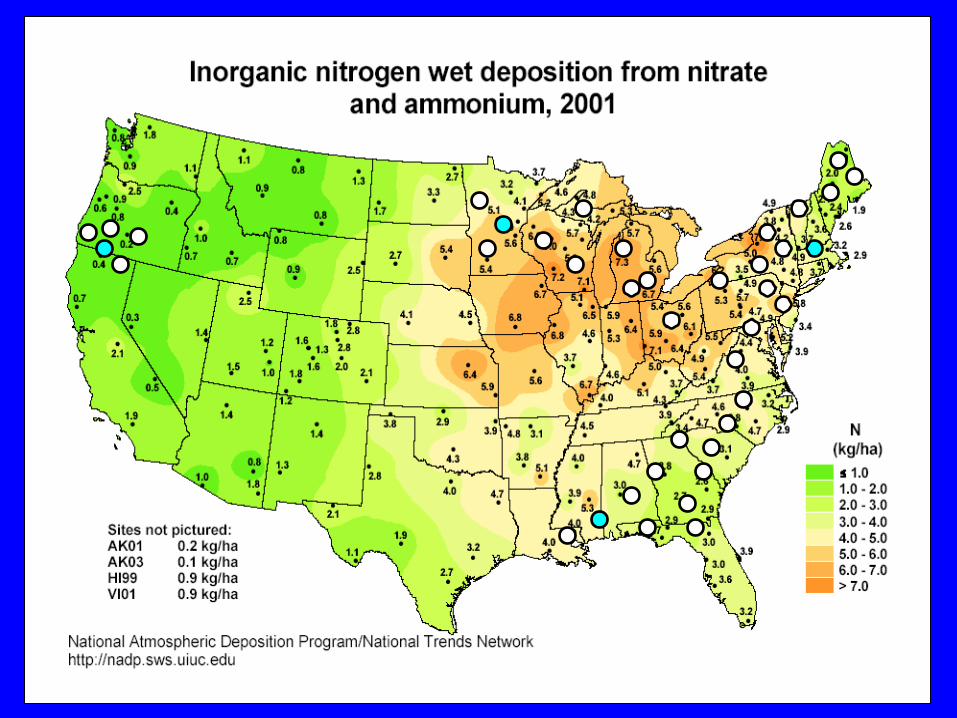
N monitoring
• National Atmospheric Deposition Program
• NH4, NO3 measured as mg/l/yr
• Annual data 1984-1998
• Monitoring sitesShelburne, VTQuabbin, MA
0.00
0.05
0.10
0.15
0.20
0.25
0.30
0.35
1984
1986
1988
1990
1992
1994
1996
1998
0.00
0.05
0.10
0.15
0.20
0.25
0.30
0.35
1984
1986
1988
1990
1992
1994
1996
1998
0.0
0.5
1.0
1.5
2.0
2.5
1984
1986
1988
1990
1992
1994
1996
1998
0.0
0.5
1.0
1.5
2.0
2.5
1984
1986
1988
1990
1992
1994
1996
1998
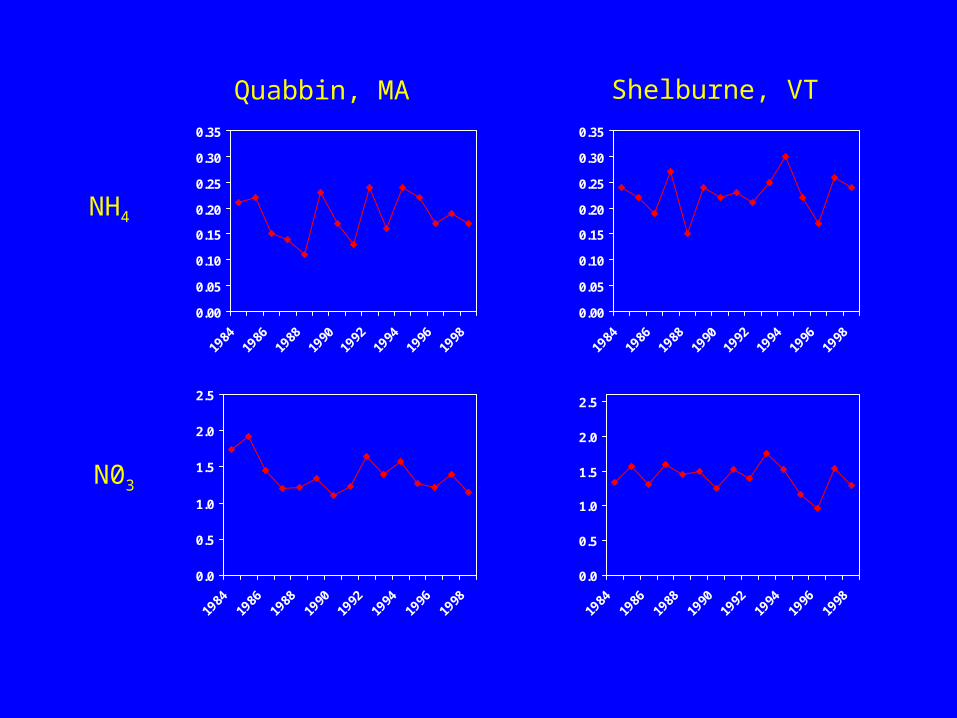
Quabbin, MA Shelburne, VT
NH4
N03
0.00
0.05
0.10
0.15
0.20
0.25
0.30
0.35
1984
1986
1988
1990
1992
1994
1996
1998
0.00
0.05
0.10
0.15
0.20
0.25
0.30
0.35
1984
1986
1988
1990
1992
1994
1996
1998
0.0
0.5
1.0
1.5
2.0
2.5
1984
1986
1988
1990
1992
1994
1996
1998
0.0
0.5
1.0
1.5
2.0
2.5
1984
1986
1988
1990
1992
1994
1996
1998
Quabbin, MA Shelburne, VT
NH4
N03
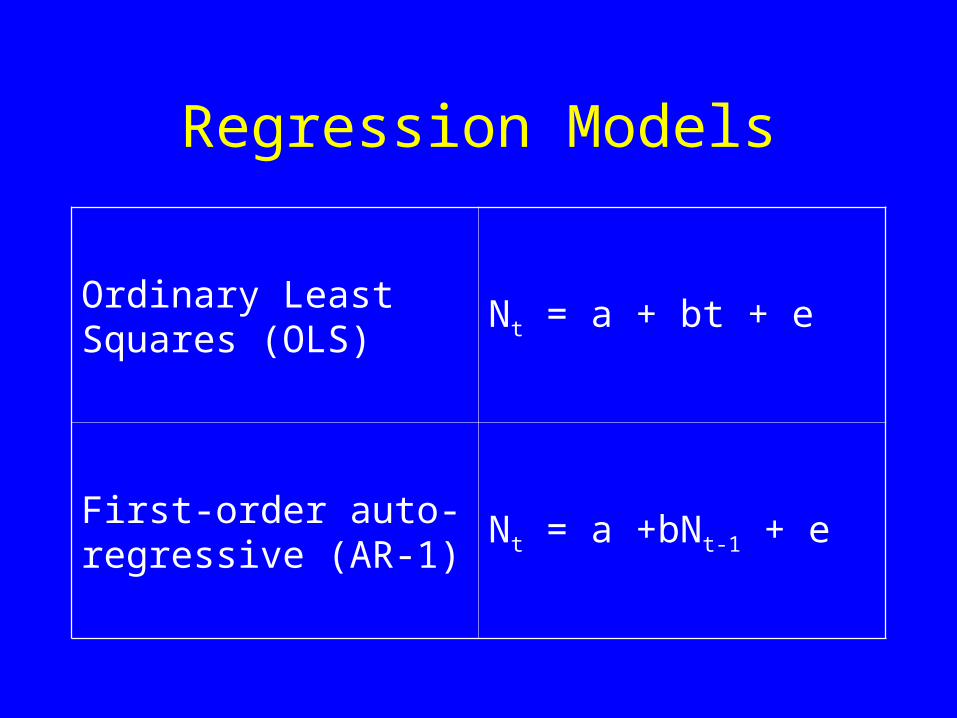
Regression Models
Ordinary Least Squares (OLS)
Nt = a + bt + e
First-order auto-regressive (AR-1)
Nt = a +bNt-1 + e
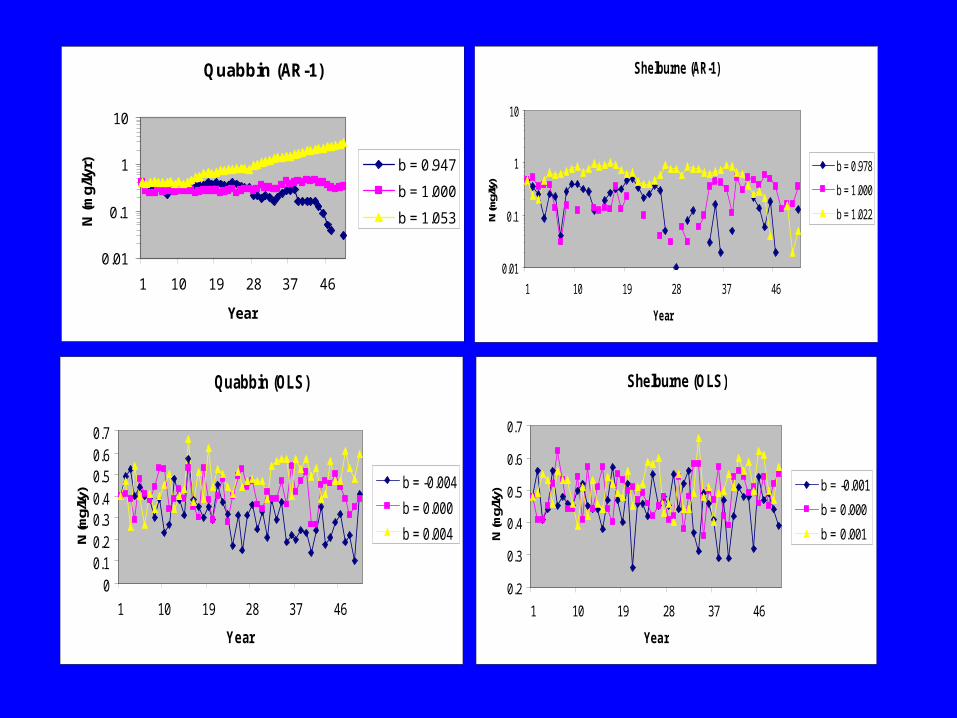
Quabbin (AR-1)
0.01
0.1
1
10
1 10 19 28 37 46
Year
N (m
g/l/y
r) b = 0.947
b = 1.000
b = 1.053
Quabbin (OLS)
00.10.20.30.40.50.60.7
1 10 19 28 37 46
Year
N (m
g/l/y
) b = -0.004
b = 0.000
b = 0.004
Shelburne (AR-1)
0.01
0.1
1
10
1 10 19 28 37 46
Year
N (m
g/l/y
)
b = 0.978
b = 1.000
b = 1.022
Shelburne (OLS)
0.2
0.3
0.4
0.5
0.6
0.7
1 10 19 28 37 46
Year
N (m
g/l/y
) b = -0.001
b = 0.000
b = 0.001
Modeling Long-term Environmental Change
Observed N Deposition
Long-termForecast
N(t)
Transition Matrix (t)
PopulationStructure (t)
Time Series Modeling
Transition Function
Population Time SeriesExtinction RiskTime to Extinction
MatrixMultiplication
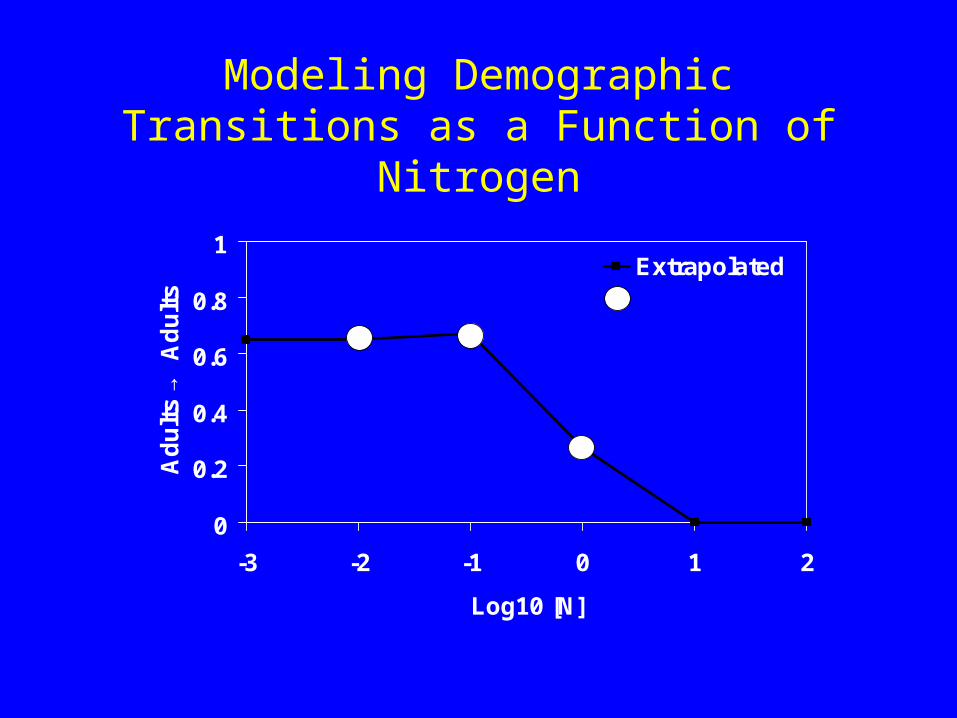
0
0.2
0.4
0.6
0.8
1
-3 -2 -1 0 1 2
Log10 [N]
Ad
ult
s →
Ad
ult
s
ExtrapolatedObserved
Modeling Demographic Transitions as a Function of Nitrogen
Modeling Long-term Environmental Change
Observed N Deposition
Long-termForecast
N(t)
Transition Matrix (t)
PopulationStructure (t)
Time Series Modeling
Transition Function
Population Time SeriesExtinction RiskTime to Extinction
MatrixMultiplication
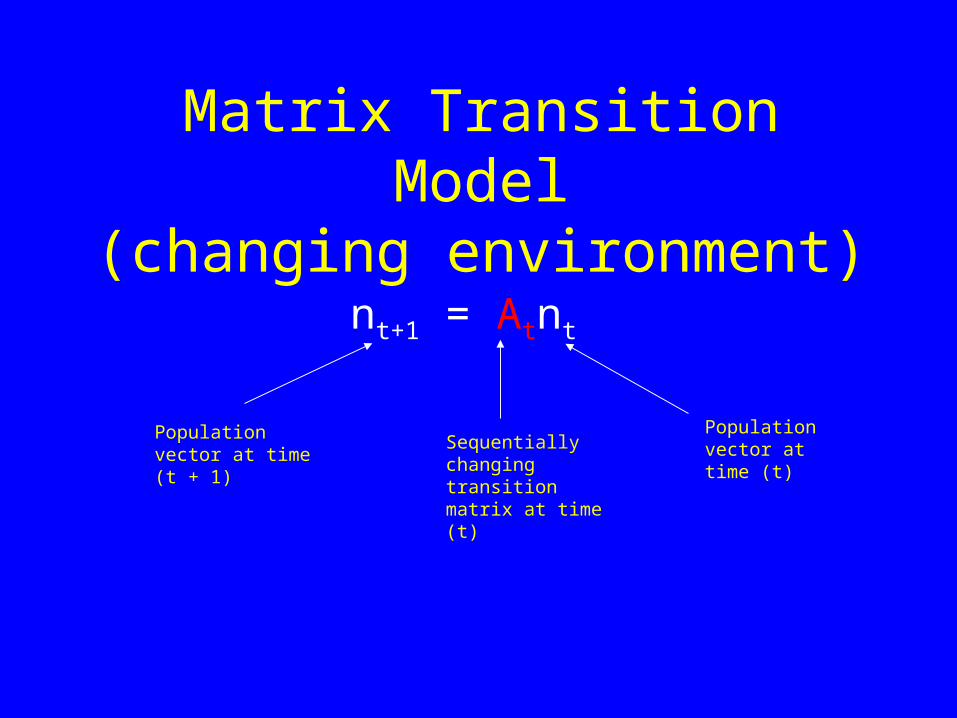
Matrix Transition Model(changing environment)
nt+1 = Atnt
Population vector at time (t + 1)
Sequentially changing transition matrix at time (t)
Population vector at time (t)
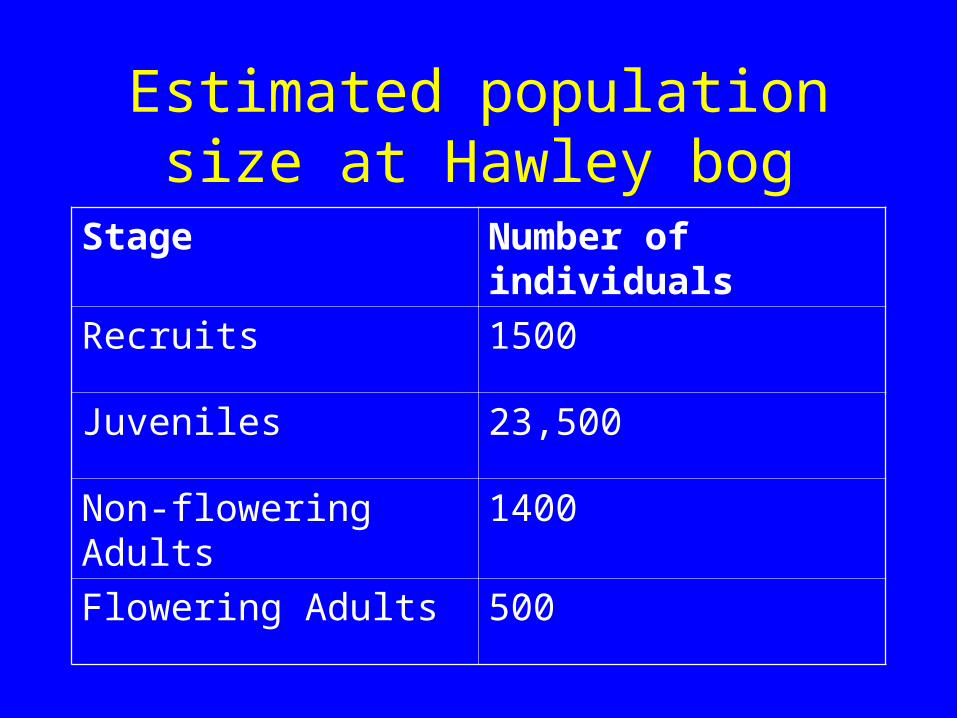
Estimated population size at Hawley bog
Stage Number of individuals
Recruits 1500
Juveniles 23,500
Non-flowering Adults 1400
Flowering Adults 500
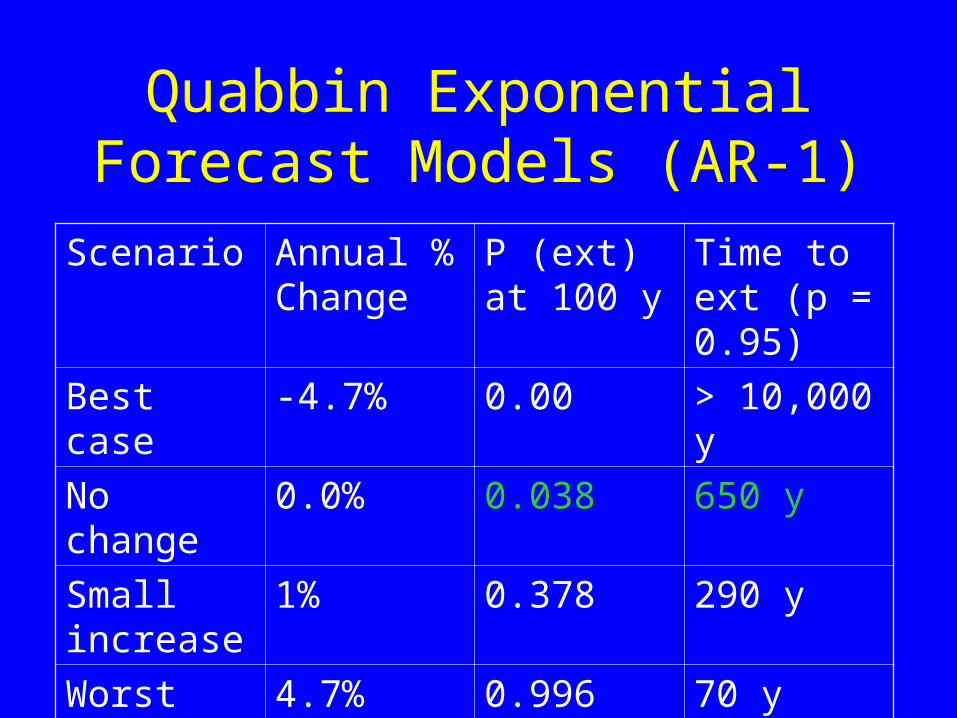
Quabbin Exponential Forecast Models (AR-1)
Scenario Annual % Change
P (ext) at 100 y
Time to ext (p = 0.95)
Best case -4.7% 0.00 > 10,000 y
No change 0.0% 0.038 650 y
Small increase
1% 0.378 290 y
Worst case 4.7% 0.996 70 y
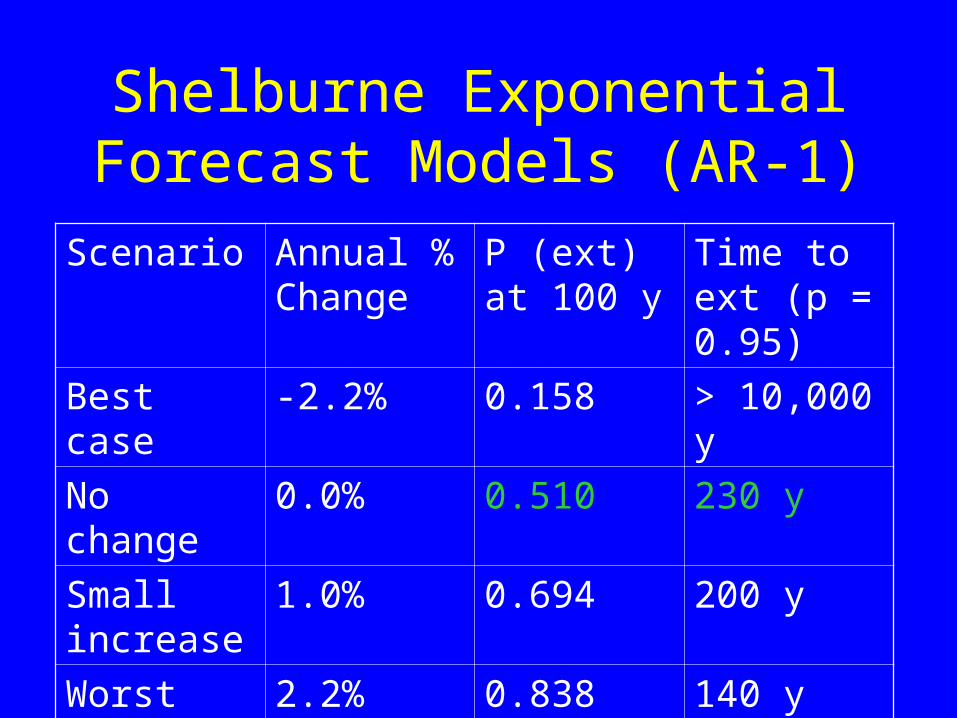
Shelburne Exponential Forecast Models (AR-1)
Scenario Annual % Change
P (ext) at 100 y
Time to ext (p = 0.95)
Best case -2.2% 0.158 > 10,000 y
No change 0.0% 0.510 230 y
Small increase
1.0% 0.694 200 y
Worst case 2.2% 0.838 140 y
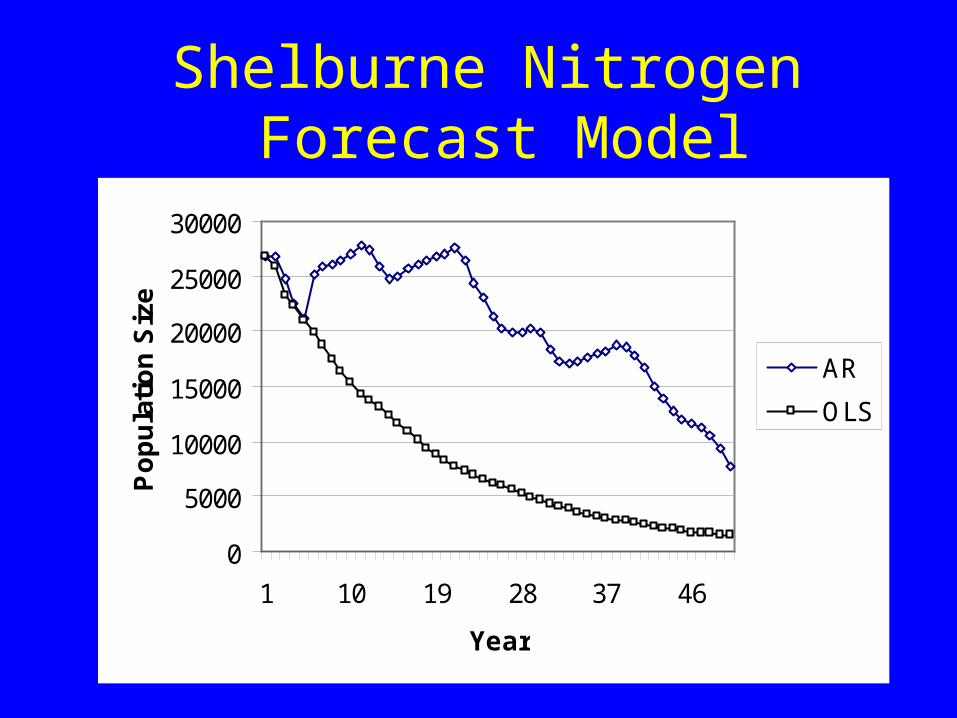
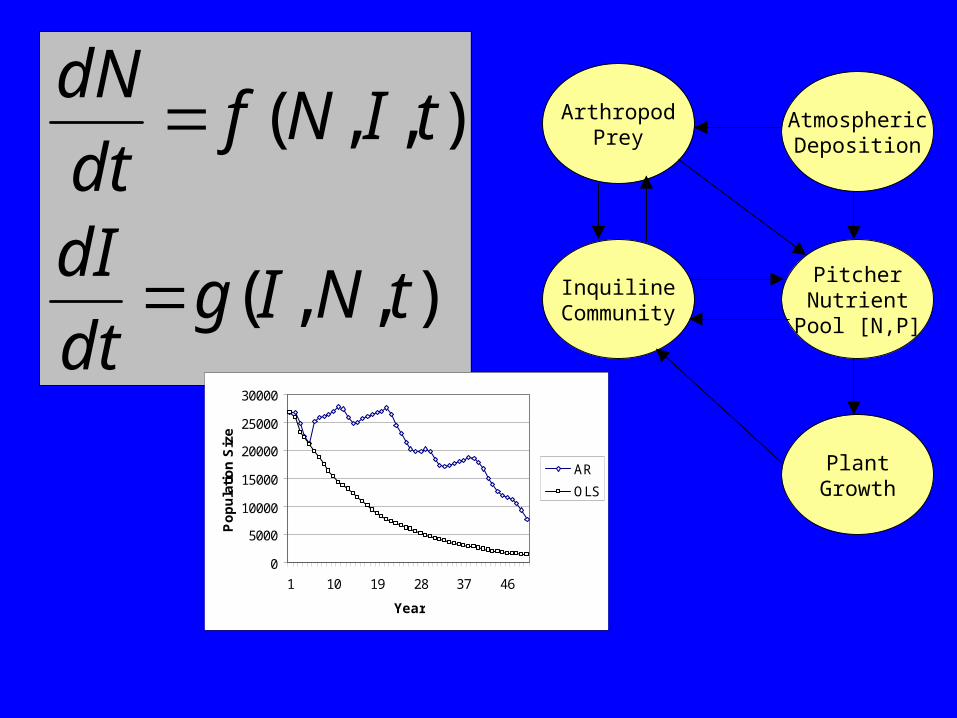
Shelburne Nitrogen Forecast Model
0
5000
10000
15000
20000
25000
30000
1 10 19 28 37 46
Year
Po
pu
lati
on
Siz
e
AR
OLS
Forecasting Models for Nitrogen Deposition: Results
• Increasing or stationary models of Nitrogen deposition drive Sarracenia populations to extinction
• Extinction risk declines with reduced nitrogen
• Correlated nitrogen series can induce cycles and complex population dynamics
Effects of N Deposition on Carnivorous Plants
• Life History
• Effects on Individuals
• Effects on Populations
• Effects on Communities
• The Role of Ecologists

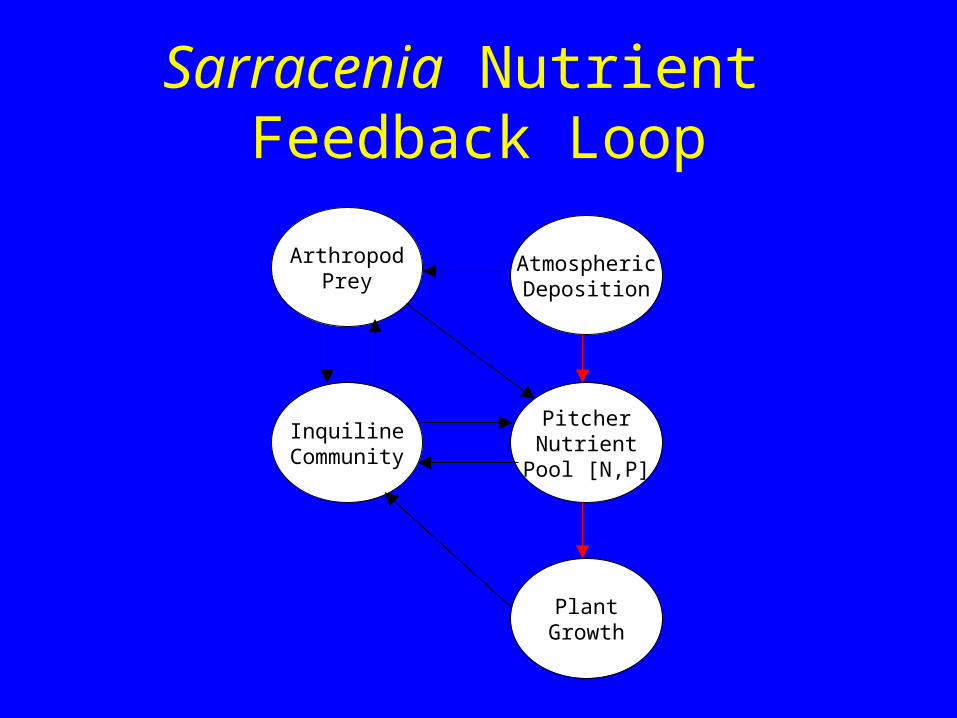
Sarracenia Nutrient Feedback Loop
PitcherNutrient
Pool [N,P]
InquilineCommunity
ArthropodPrey
PlantGrowth
AtmosphericDeposition
Sarracenia Nutrient Feedback Loop
PitcherNutrient
Pool [N,P]
InquilineCommunity
ArthropodPrey
PlantGrowth
AtmosphericDeposition

Sarracenia Nutrient Feedback Loop
PitcherNutrient
Pool [N,P]
InquilineCommunity
ArthropodPrey
PlantGrowth
AtmosphericDeposition

Sarracenia Nutrient Feedback Loop
PitcherNutrient
Pool [N,P]
InquilineCommunity
ArthropodPrey
PlantGrowth
AtmosphericDeposition
Four-level Multi-Factorial Experiment
• Atmospheric N (8 levels)
• Prey supplement (yes,no)
• Top predator removal (yes,no)
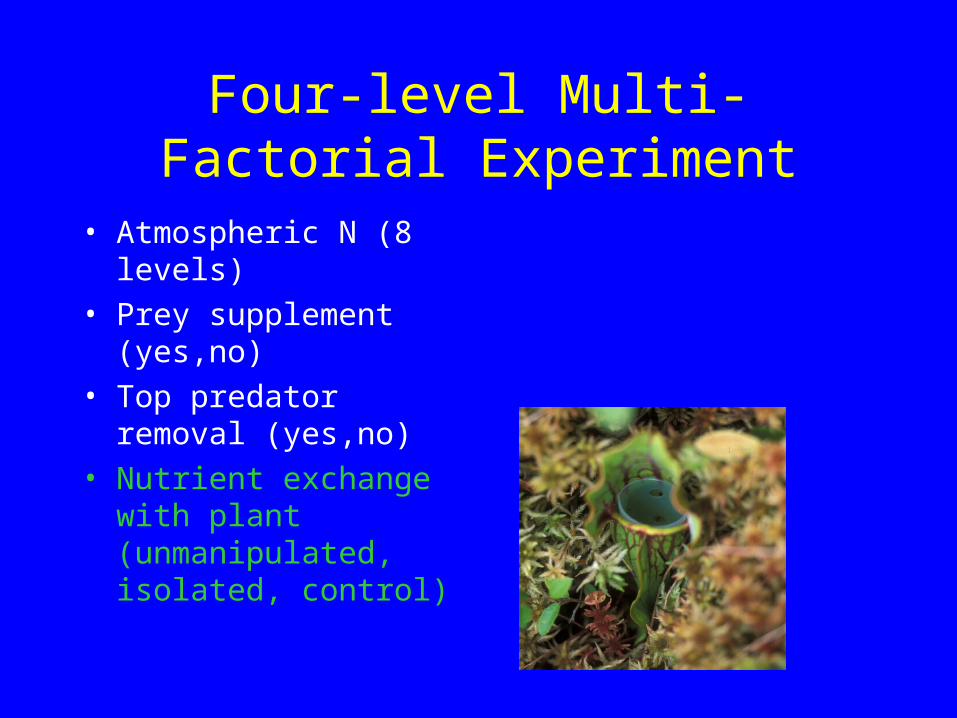
Four-level Multi-Factorial Experiment
• Atmospheric N (8 levels)
• Prey supplement (yes,no)
• Top predator removal (yes,no)
• Nutrient exchange with plant(unmanipulated, isolated, control)
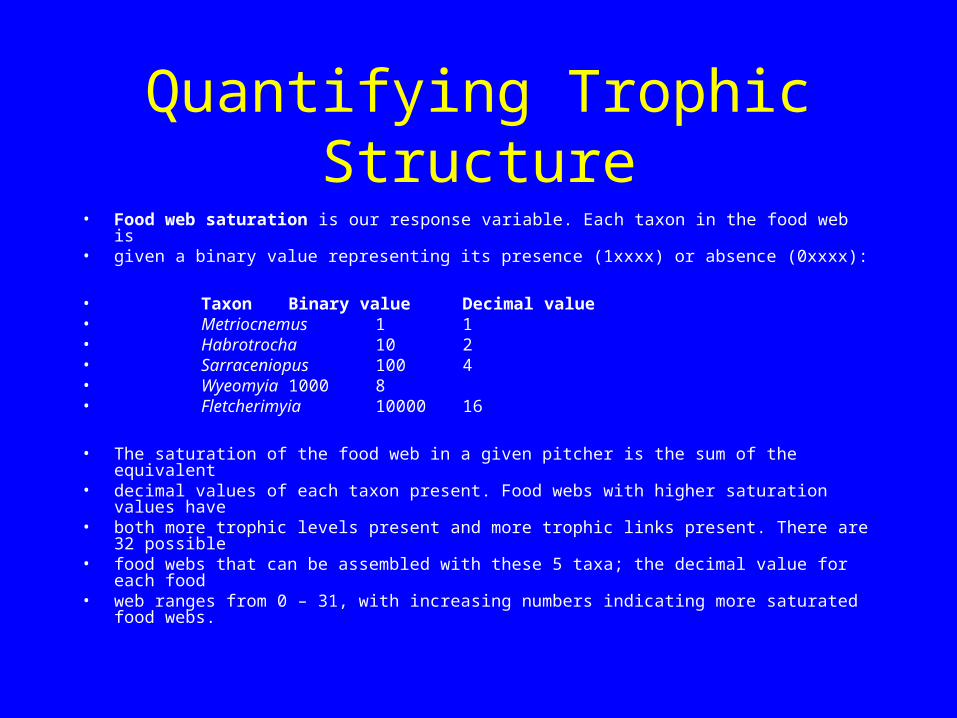
Quantifying Trophic Structure• Food web saturation is our response variable. Each taxon in the food web is • given a binary value representing its presence (1xxxx) or absence (0xxxx):
• Taxon Binary value Decimal value• Metriocnemus 1 1• Habrotrocha 10 2• Sarraceniopus 100 4• Wyeomyia 1000 8• Fletcherimyia 10000 16
• The saturation of the food web in a given pitcher is the sum of the equivalent• decimal values of each taxon present. Food webs with higher saturation values have • both more trophic levels present and more trophic links present. There are 32 possible • food webs that can be assembled with these 5 taxa; the decimal value for each food • web ranges from 0 – 31, with increasing numbers indicating more saturated food webs.
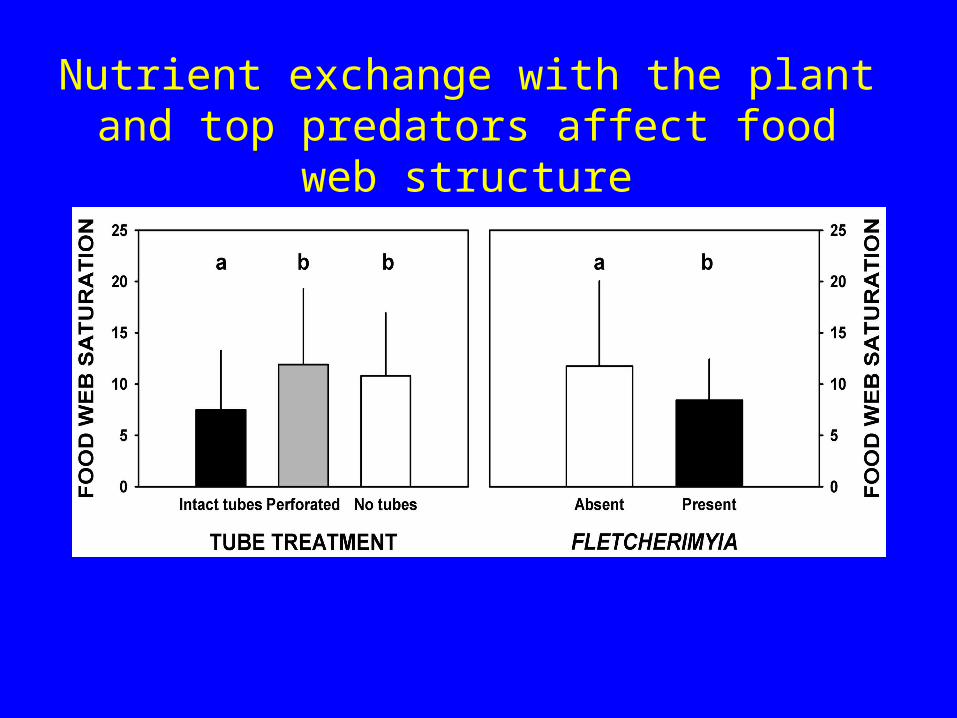
Nutrient exchange with the plant and top predators affect food web structure

Sarracenia Nutrient Feedback Loop
PitcherNutrient
Pool [N,P]
InquilineCommunity
ArthropodPrey
PlantGrowth
AtmosphericDeposition
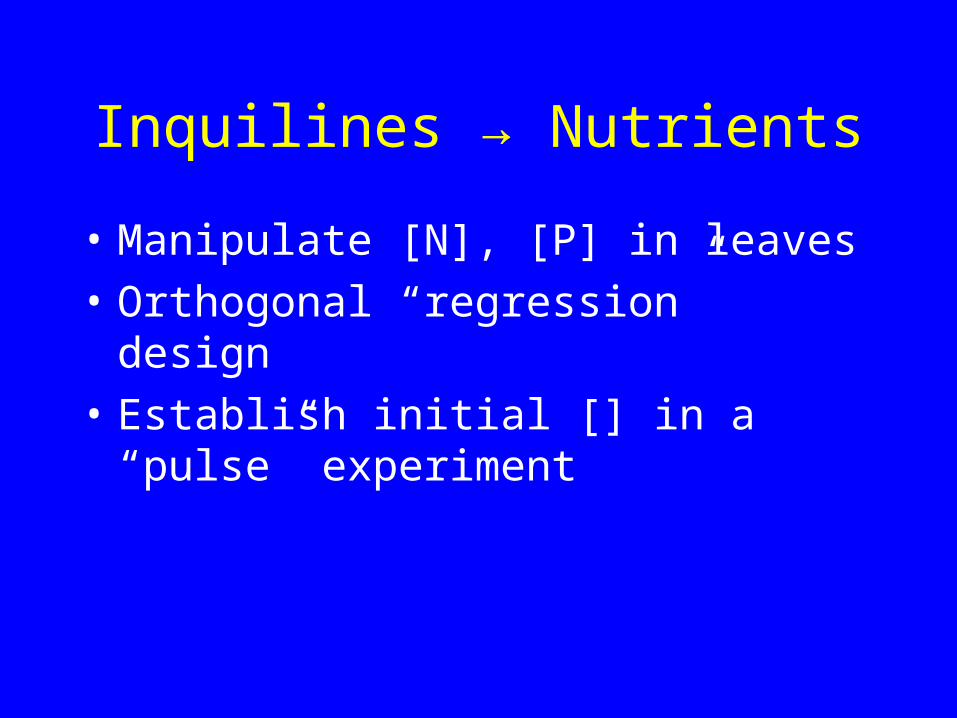
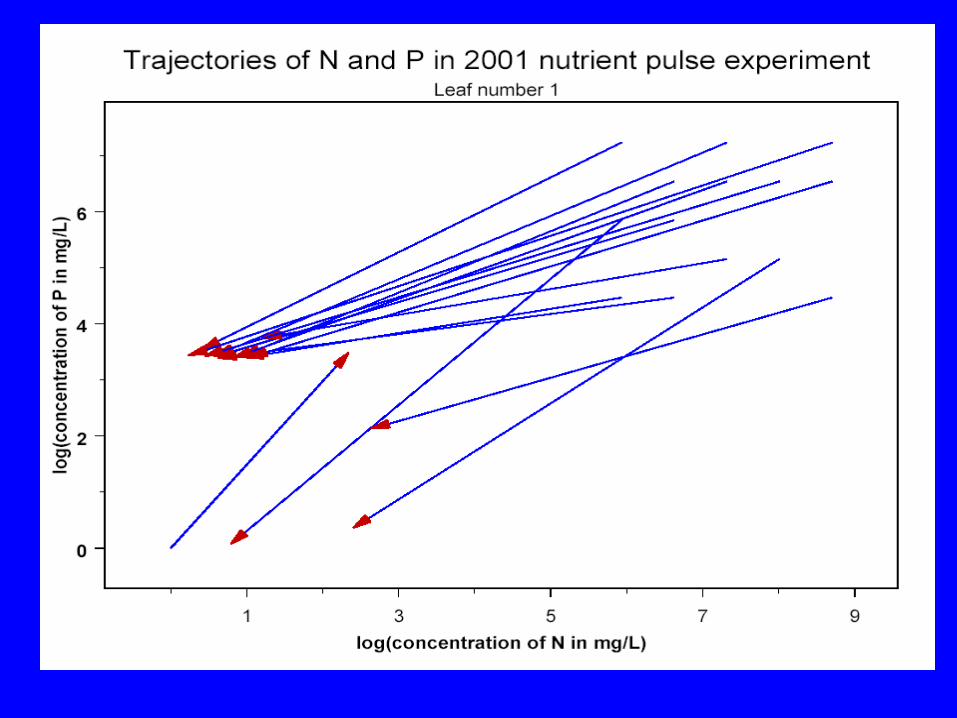
Inquilines → Nutrients
• Manipulate [N], [P] in leaves
• Orthogonal “regression” design
• Establish initial [] in a “pulse” experiment
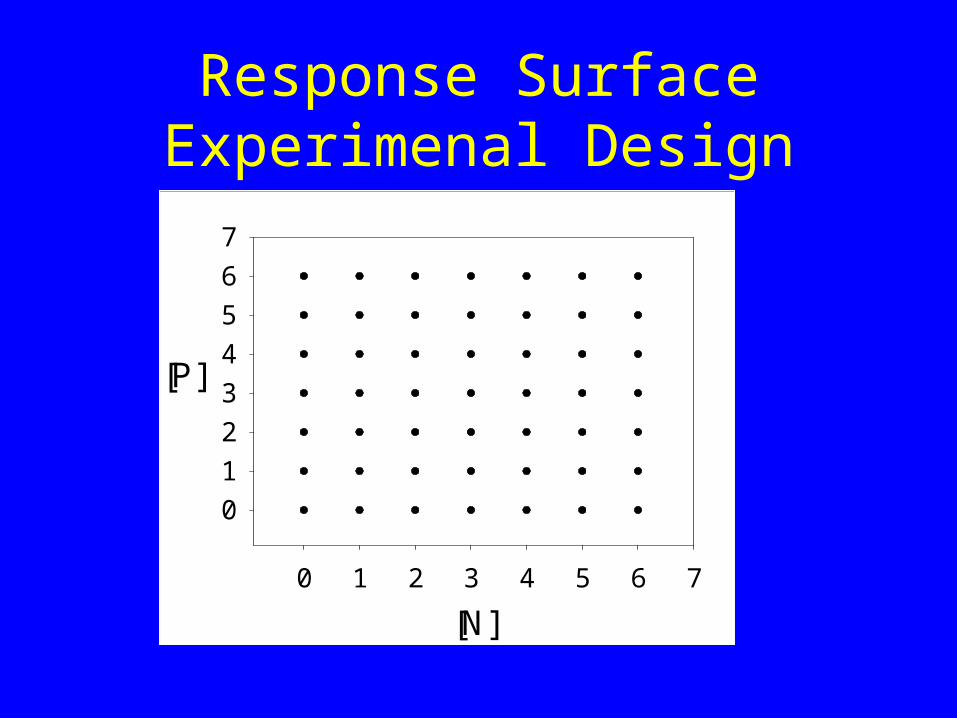
Response Surface Experimenal Design
[N]0 1 2 3 4 5 6 7
[P]
0
1
2
3
4
5
6
7
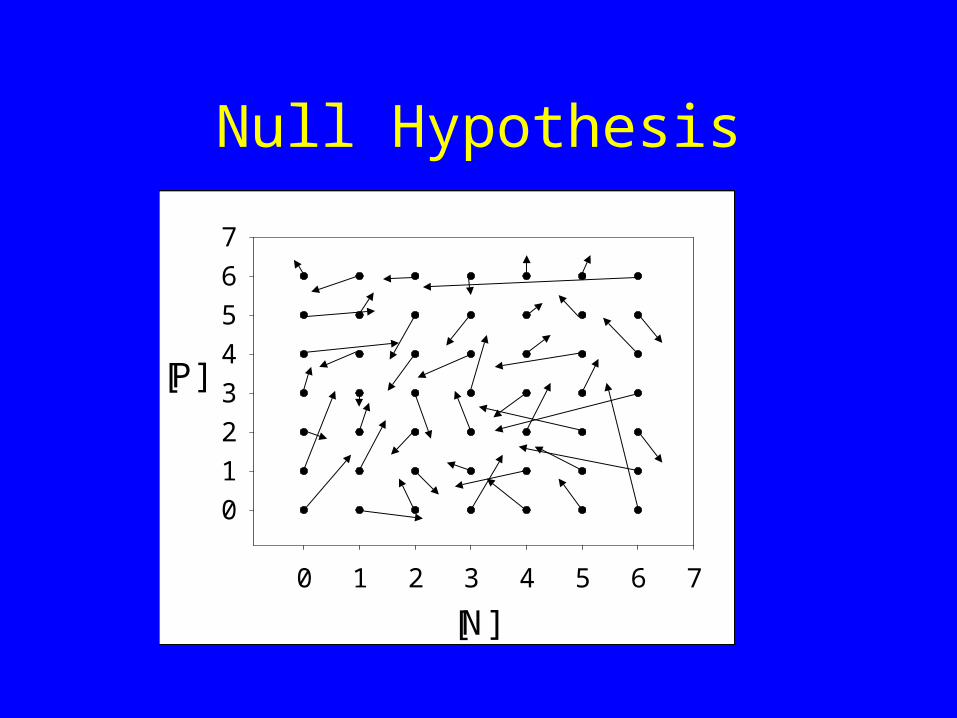
Null Hypothesis
[N]0 1 2 3 4 5 6 7
[P]
0
1
2
3
4
5
6
7
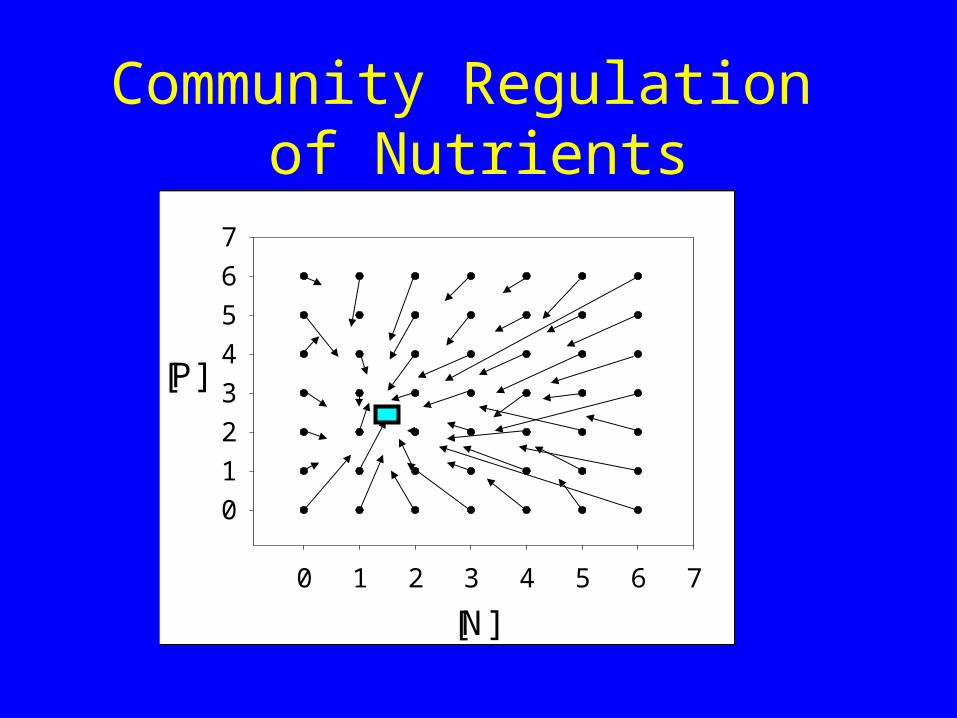
Community Regulation of Nutrients
[N]0 1 2 3 4 5 6 7
[P]
0
1
2
3
4
5
6
7

Sarracenia Nutrient Feedback Loop
PitcherNutrient
Pool [N,P]
InquilineCommunity
ArthropodPrey
PlantGrowth
AtmosphericDeposition
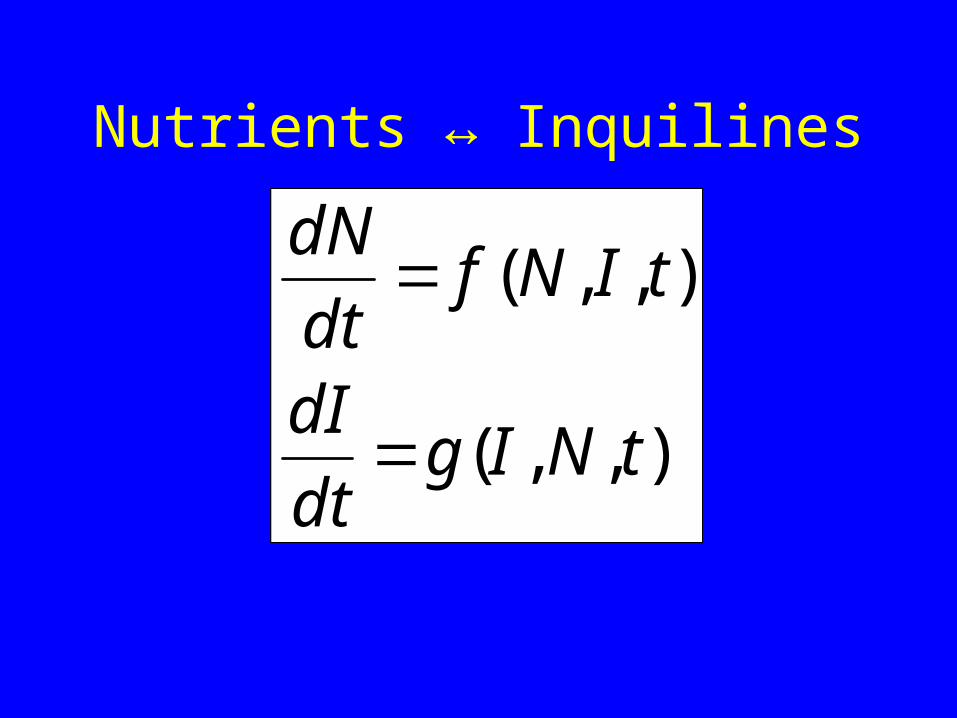
Nutrients ↔ Inquilines
),,(
),,(
tNIgdt
dI
tINfdt
dN
Effects of N Deposition on Carnivorous Plants
• Life History
• Effects on Individuals
• Effects on Populations
• Effects on Communities
• The Role of Ecologists
0
50
100
150
200
1900 1920 1940 1960 1980 2000
Year
Ter
agra
ms
of
Nit
rog
en
Fertilizer NOx
Total anthropogenic N fixed
Natural range

Ecology ≠
Environmental Science

Reasons for Studying Ecology

Reasons for Studying Ecology
• Natural History

Reasons for Studying Ecology
• Natural History
• Field Studies & Experiments

Reasons for Studying Ecology
• Natural History
• Field Studies & Experiments
• Statistics & Data Analysis
Population Growth Rate(Deterministic)
-0.15
-0.10
-0.05
0.00
0.05
r
Distilled Micros Low N
High N Low P High P
NP (2) NP (1) NP (3)
0.00
0.05
0.10
0.15
0.20
0.25
0.30
0.35
1984
1986
1988
1990
1992
1994
1996
1998

Reasons for Studying Ecology
• Natural History
• Field Studies & Experiments
• Statistics & Data Analysis
• Modeling
),,(
),,(
tNIgdt
dI
tINfdt
dN
PitcherNutrient
Pool [N,P]
InquilineCommunity
ArthropodPrey
PlantGrowth
AtmosphericDeposition
0
5000
10000
15000
20000
25000
30000
1 10 19 28 37 46
Year
Po
pu
lati
on
Siz
e
AR
OLS

Reasons for Studying Ecology
• Natural History
• Field Studies & Experiments
• Statistics & Data Analysis
• Modeling
• Collaboration
Aaron M. Ellison
Harvard Forest
Conclusions• Anthropogenic deposition of N is a major ecological
challenge
Conclusions• Anthropogenic deposition of N is a major ecological
challenge• Carnivorous plants in ombrotrophic bogs are a model
system
Conclusions• Anthropogenic deposition of N is a major ecological
challenge• Carnivorous plants in ombrotrophic bogs are a model
system• Individual response
plants alter morphology and growth in response to N:P ratios
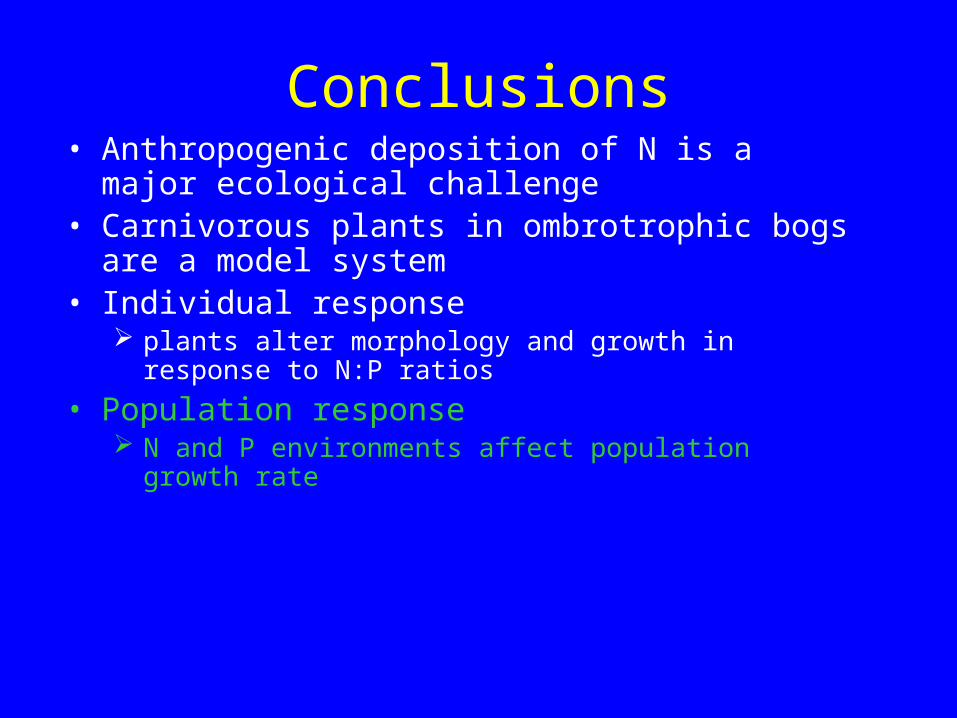
Conclusions• Anthropogenic deposition of N is a major ecological
challenge• Carnivorous plants in ombrotrophic bogs are a model
system• Individual response
plants alter morphology and growth in response to N:P ratios
• Population response N and P environments affect population growth rate
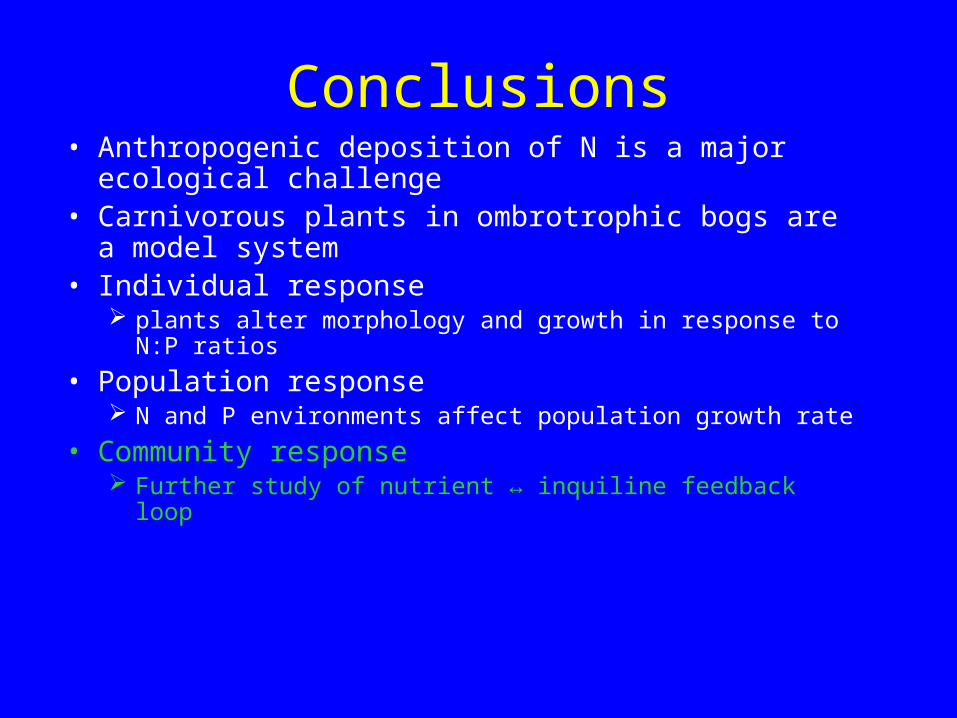
Conclusions• Anthropogenic deposition of N is a major ecological
challenge• Carnivorous plants in ombrotrophic bogs are a model
system• Individual response
plants alter morphology and growth in response to N:P ratios
• Population response N and P environments affect population growth rate
• Community response Further study of nutrient ↔ inquiline feedback loop


![Gotelli - A Primer of Ecology[1]](https://img.pdfslide.us/doc/110x75/55cf983c550346d033966ac5/gotelli-a-primer-of-ecology1.jpg)