Embed Size (px)
Citation preview

The ECMWFEnsemble Prediction System
Weather observations are neither perfect norcomplete. Also, because of limitations in computerpower, our models inevitably approxi mate theexact equations for weather. Hence every singleforecast is, to some extent, uncertain. But howuncertain?Uncertainty will vary from day to day, depend -
ing on the atmospheric conditions at the start ofthe forecast. When the state of the atmos phere issuch that forecasts are not very sensitive touncertainties in the starting conditions, theforecasts can be made with confidence many daysahead. However, when the forecasts areparticularly sensitive to the starting conditions,forecasts can be uncertain almost from thebeginning. Is there a way to know beforehandwhether a forecast is going to be accurate or not?The European Centre for Medium-Range
Weather Forecasts (ECMWF) has pioneered asystem to predict forecast confidence. Thissystem, operational at ECMWF since 1992, is theEnsemble Prediction System (EPS).
The rationale behind probabilistic weather forecasts
In 2008, the EPS was merged with themonthly prediction system and has beencoupled to a dynamical ocean model. Sincethen, the EPS has been producing 15-dayprobabilistic forecasts daily at 00 and 12UTC.On Thursdays, forecasts are extended to 32days, to provide users with monthly forecasts.Since 2010, the EPS probabilistic forecast has
been based on 51 integrations with approxi -mately 32-km resolution up to forecast day 10,and 65-km resolution thereafter, with 62vertical levels.
Tem
pera
ture
Forecast timeInitial condition Forecast
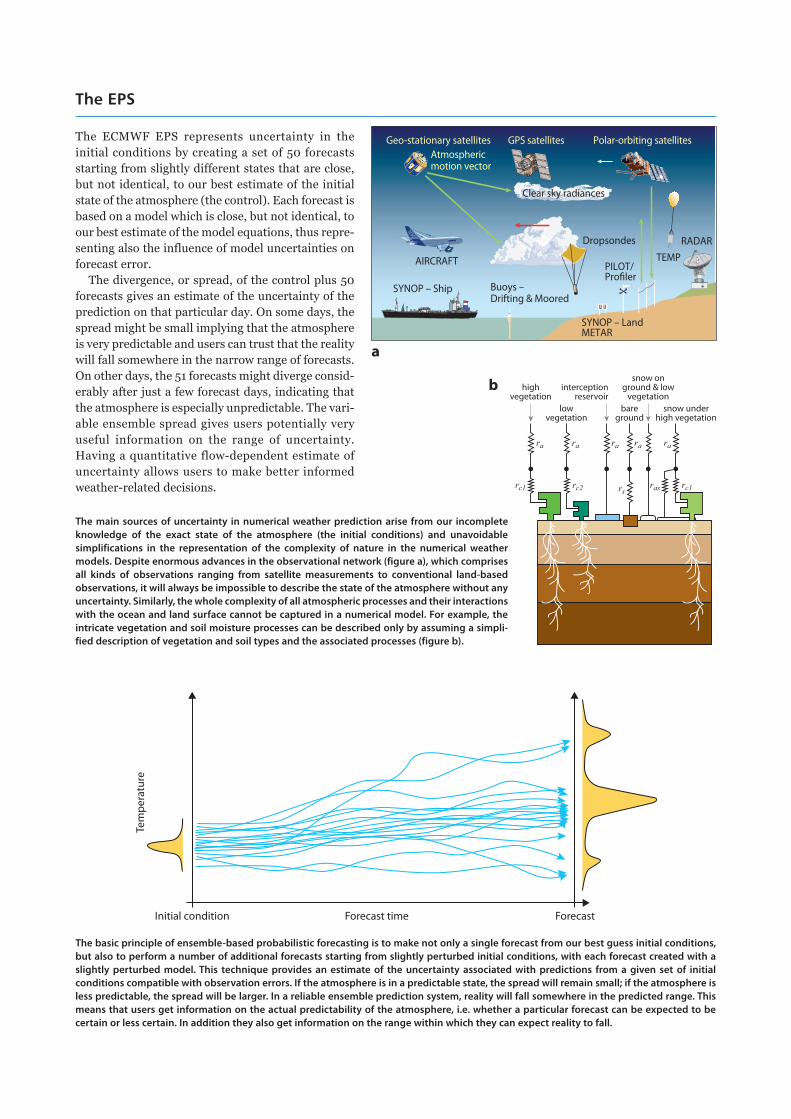
The basic principle of ensemble-based probabilistic forecasting is to make not only a single forecast from our best guess initial conditions,but also to perform a number of additional forecasts starting from slightly perturbed initial conditions, with each forecast created with aslightly perturbed model. This technique provides an estimate of the uncertainty associated with predictions from a given set of initialconditions compatible with observation errors. If the atmosphere is in a predictable state, the spread will remain small; if the atmosphere isless predictable, the spread will be larger. In a reliable ensemble prediction system, reality will fall somewhere in the predicted range. Thismeans that users get information on the actual predictability of the atmosphere, i.e. whether a particular forecast can be expected to becertain or less certain. In addition they also get information on the range within which they can expect reality to fall.
The ECMWF EPS represents uncertainty in the
initial conditions by creating a set of 50 forecasts
starting from slightly different states that are close,
but not identical, to our best estimate of the initial
state of the atmosphere (the control). Each forecast is
based on a model which is close, but not identical, to
our best estimate of the model equations, thus repre-
senting also the influence of model uncertainties on
forecast error.
The divergence, or spread, of the control plus 50
forecasts gives an estimate of the uncertainty of the
prediction on that particular day. On some days, the
spread might be small implying that the atmosphere
is very predictable and users can trust that the reality
will fall somewhere in the narrow range of forecasts.
On other days, the 51 forecasts might diverge consid-
erably after just a few forecast days, indicating that
the atmosphere is especially unpredictable. The vari-
able ensemble spread gives users potentially very
useful information on the range of uncertainty.
Having a quantitative flow-dependent estimate of
uncertainty allows users to make better informed
weather-related decisions.
The EPS
RADAR
PILOT/Pro ler
Buoys –Drifting & Moored
Dropsondes
TEMP
Polar-orbiting satellites GPS satellites Geo-stationary satellites Atmosphericmotion vector
Clear sky radiances
SYNOP – Ship
AIRCRAFT
SYNOP – LandMETAR
The main sources of uncertainty in numerical weather prediction arise from our incompleteknowledge of the exact state of the atmosphere (the initial conditions) and unavoidablesimplifications in the representation of the complexity of nature in the numerical weathermodels. Despite enormous advances in the observational network (figure a), which comprisesall kinds of observations ranging from satellite measurements to conventional land-basedobservations, it will always be impossible to describe the state of the atmosphere without anyuncertainty. Similarly, the whole complexity of all atmospheric processes and their interactionswith the ocean and land surface cannot be captured in a numerical model. For example, theintricate vegetation and soil moisture processes can be described only by assuming a simpli-fied description of vegetation and soil types and the associated processes (figure b).
interceptionreservoir
lowvegetation
bareground
snow onground & low
vegetationhigh
vegetationsnow under
high vegetation
ra
rc1 rc1rc2 rasrs
ra ra ra ra
b
a
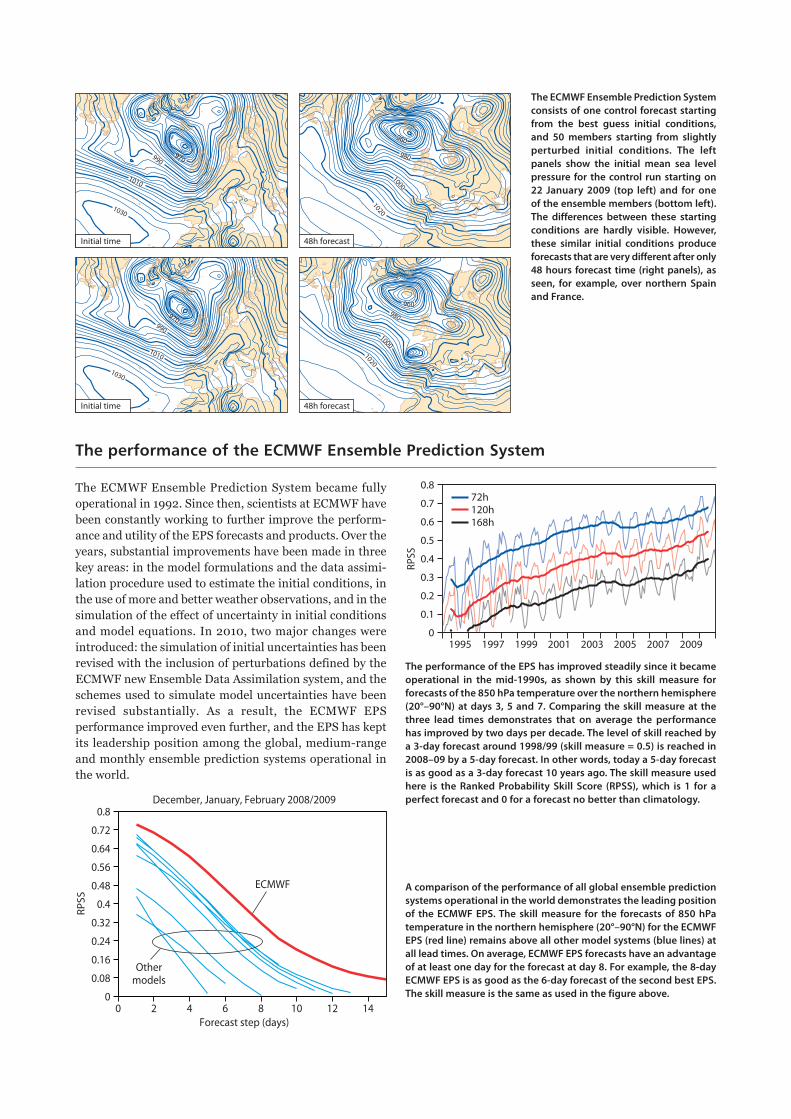
The ECMWF Ensemble Prediction Systemconsists of one control forecast startingfrom the best guess initial conditions,and 50 members starting from slightlyperturbed initial conditions. The leftpanels show the initial mean sea levelpressure for the control run starting on22 January 2009 (top left) and for oneof the ensemble members (bottom left).The differences between these startingconditions are hardly visible. However,these similar initial conditions produceforecasts that are very different after only48 hours forecast time (right panels), asseen, for example, over northern Spainand France.
1030
1030
1010
990970
1010
970990
10201020
1000
980
960
1000
980
960
Initial time
Initial time
48h forecast
48h forecast
Forecast step (days)
December, January, February 2008/2009
00 2 4 6 8 10 12 14
0.08
0.16
0.24
0.32
0.4
0.48
0.56
0.64
0.72
0.8
RPSS
ECMWF
Othermodels
The performance of the EPS has improved steadily since it becameoperational in the mid-1990s, as shown by this skill measure forforecasts of the 850 hPa temperature over the northern hemisphere(20°–90°N) at days 3, 5 and 7. Comparing the skill measure at thethree lead times demonstrates that on average the performancehas improved by two days per decade. The level of skill reached bya 3-day forecast around 1998/99 (skill measure = 0.5) is reached in2008–09 by a 5-day forecast. In other words, today a 5-day forecastis as good as a 3-day forecast 10 years ago. The skill measure usedhere is the Ranked Probability Skill Score (RPSS), which is 1 for aperfect forecast and 0 for a forecast no better than climatology.
A comparison of the performance of all global ensemble predictionsystems operational in the world demonstrates the leading positionof the ECMWF EPS. The skill measure for the forecasts of 850 hPatemperature in the northern hemisphere (20°–90°N) for the ECMWFEPS (red line) remains above all other model systems (blue lines) atall lead times. On average, ECMWF EPS forecasts have an advantageof at least one day for the forecast at day 8. For example, the 8-dayECMWF EPS is as good as the 6-day forecast of the second best EPS.The skill measure is the same as used in the figure above.
The performance of the ECMWF Ensemble Prediction System
The ECMWF Ensemble Prediction System became fully
operational in 1992. Since then, scientists at ECMWF have
been constantly working to further improve the perform-
ance and utility of the EPS forecasts and products. Over the
years, substantial improvements have been made in three
key areas: in the model formulations and the data assimi-
lation procedure used to estimate the initial conditions, in
the use of more and better weather observations, and in the
simulation of the effect of uncertainty in initial conditions
and model equations. In 2010, two major changes were
introduced: the simulation of initial uncertainties has been
revised with the inclusion of pertur bations defined by the
ECMWF new Ensemble Data Assimilation system, and the
schemes used to simulate model uncertainties have been
revised substantially. As a result, the ECMWF EPS
performance improved even further, and the EPS has kept
its leadership position among the global, medium-range
and monthly ensemble prediction systems operational in
the world.
RPSS
72h120h168h
1995 1997 1999 2001 2003 2005 2007 2009
0.8
0.7
0.6
0.5
0.4
0.3
0.2
0.1
0
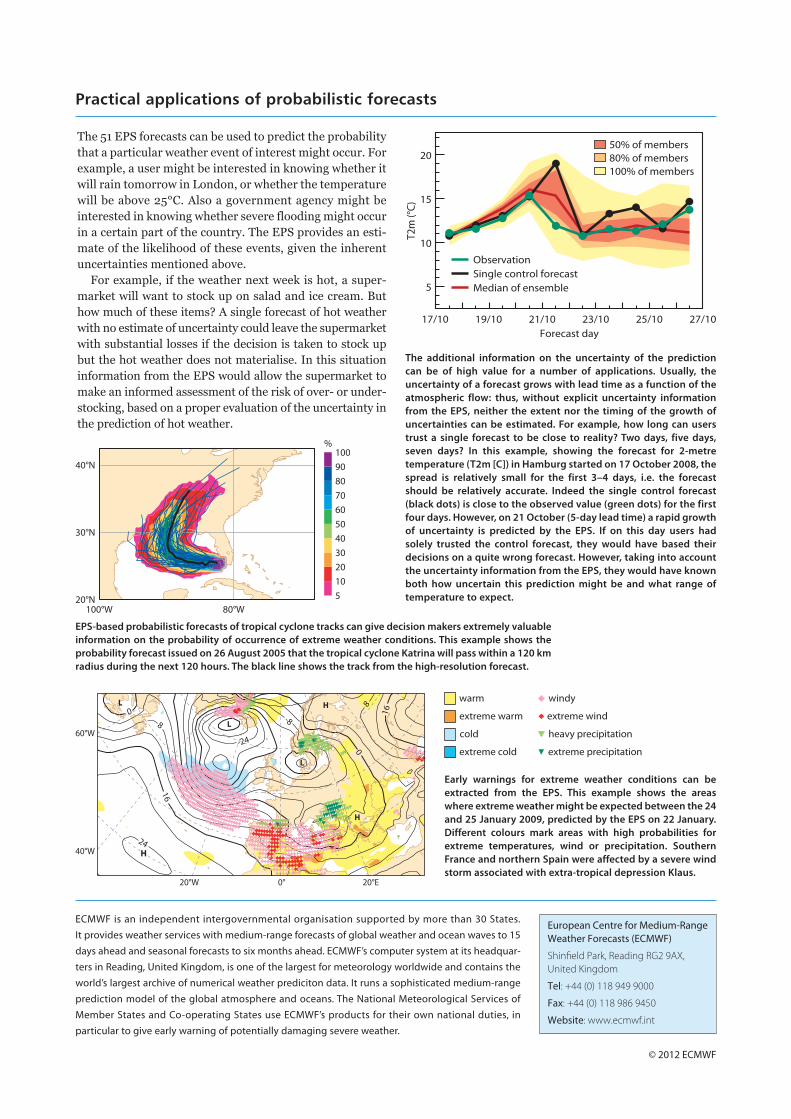
EPS-based probabilistic forecasts of tropical cyclone tracks can give decision makers extremely valuableinformation on the probability of occurrence of extreme weather conditions. This example shows theprobability forecast issued on 26 August 2005 that the tropical cyclone Katrina will pass within a 120 kmradius during the next 120 hours. The black line shows the track from the high-resolution forecast.
20°N
30°N
40°N
100°W 80°W5102030405060708090100
%
-24
-8
0
08
8
16
16
24
60°W
40°W
20°W 0° 20°E
H
H
H
L
L
L
17/10 19/10 21/10 23/10 25/10 27/10Forecast day
Observation
50% of members80% of members100% of members
5
10
15
20
T2m
(°C)
Single control forecastMedian of ensemble
The additional information on the uncertainty of the predictioncan be of high value for a number of applications. Usually, theuncertainty of a forecast grows with lead time as a function of theatmospheric flow: thus, without explicit uncertainty informationfrom the EPS, neither the extent nor the timing of the growth ofuncertainties can be estimated. For example, how long can userstrust a single forecast to be close to reality? Two days, five days,seven days? In this example, showing the forecast for 2-metretemperature (T2m [C]) in Hamburg started on 17 October 2008, thespread is relatively small for the first 3–4 days, i.e. the forecastshould be relatively accurate. Indeed the single control forecast(black dots) is close to the observed value (green dots) for the firstfour days. However, on 21 October (5-day lead time) a rapid growthof uncertainty is predicted by the EPS. If on this day users hadsolely trusted the control forecast, they would have based theirdecisions on a quite wrong forecast. However, taking into accountthe uncertainty information from the EPS, they would have knownboth how uncertain this prediction might be and what range oftemperature to expect.
Practical applications of probabilistic forecasts
The 51 EPS forecasts can be used to predict the probability
that a particular weather event of interest might occur. For
example, a user might be interested in knowing whether it
will rain tomorrow in London, or whether the temperature
will be above 25°C. Also a government agency might be
interested in knowing whether severe flooding might occur
in a certain part of the country. The EPS provides an esti-
mate of the likelihood of these events, given the inherent
uncertainties mentioned above.
For example, if the weather next week is hot, a super-
market will want to stock up on salad and ice cream. But
how much of these items? A single forecast of hot weather
with no estimate of uncertainty could leave the supermarket
with substantial losses if the decision is taken to stock up
but the hot weather does not materialise. In this situation
information from the EPS would allow the supermarket to
make an informed assessment of the risk of over- or under-
stocking, based on a proper evaluation of the uncertainty in
the prediction of hot weather.
warm
extreme warm
extreme cold
cold
extreme wind
windy
extreme precipitation
heavy precipitation
ECMWF is an independent intergovernmental organisation supported by more than 30 States.It provides weather services with medium-range forecasts of global weather and ocean waves to 15days ahead and seasonal forecasts to six months ahead. ECMWF’s computer system at its headquar-ters in Reading, United Kingdom, is one of the largest for meteorology worldwide and contains theworld’s largest archive of numerical weather prediciton data. It runs a sophisticated medium-rangeprediction model of the global atmosphere and oceans. The National Meteorological Services ofMember States and Co-operating States use ECMWF’s products for their own national duties, inparticular to give early warning of potentially damaging severe weather.
European Centre for Medium-RangeWeather Forecasts (ECMWF)
Shinfield Park, Reading RG2 9AX,United Kingdom
Tel: +44 (0) 118 949 9000
Fax: +44 (0) 118 986 9450
Website: www.ecmwf.int
© 2012 ECMWF
Early warnings for extreme weather conditions can beextracted from the EPS. This example shows the areaswhere extreme weather might be expected between the 24and 25 January 2009, predicted by the EPS on 22 January.Different colours mark areas with high probabilities forextreme temperatures, wind or precipitation. SouthernFrance and northern Spain were affected by a severe windstorm associated with extra-tropical depression Klaus.