Embed Size (px)
Citation preview
The East African Community:
Prospects for Sustained Growth
Catherine McAuliffe, Sweta C. Saxena, and Masafumi Yabara
WP/12/272
© 2012 International Monetary Fund WP/12/272
IMF Working Paper
African Department
The East African Community: Prospects for Sustained Growth1
Prepared by Catherine McAuliffe, Sweta C. Saxena, and Masafumi Yabara
Authorized for distribution by Peter Allum
November 2012
Abstract
The East African Community (EAC) has been among the fastest growing regions in sub-Saharan Africa in the past decade or so. Nonetheless, the recent growth path will not be enough to achieve middle-income status and substantial poverty reduction by the end of the decade—the ambition of most countries in the region. This paper builds on methodologies established in the growth literature to identify a group of countries that achieved growth accelerations and sustained growth to use as benchmarks to evaluate the prospects, and potential constraints, for EAC countries to translate their recent growth upturn into sustained high growth. We find that EAC countries compare favorably to the group of sustained growth countries—macroeconomic and government stability, favorable business climate, and strong institutions—but important differences remain. EAC countries have a smaller share of exports, lower degree of financial deepening, lower levels of domestic savings, higher reliance on donor aid, and limited physical infrastructure and human capital. Policy choices to address some of these shortcomings could make a difference in whether the EAC follows the path of sustained growth or follows other countries where growth upturns later fizzled out.
JEL Classification Numbers:O4, O400, O430, O470, O500
Keywords: Accelerated growth, sustained growth, benchmarking, East African Community, sub-Saharan Africa
Author’s E-Mail Address: [email protected], [email protected], [email protected]
1 An earlier version of the paper was presented at a Conference “The East African Community After 10 Years: Deepening EAC Integration” held in Arusha, Tanzania in early 2012. We would like to thank Peter Allum, Michael Atingi Ego, Hamid Davoodi, and Maxwell Opoku-Afari for helpful comments on earlier versions of the paper. We are also grateful for Dixit Shiv and Xingwei Hu for their assistance in compiling data. Usual disclaimers apply.
This Working Paper should not be reported as representing the views of the IMF. The views expressed in this Working Paper are those of the author(s) and do not necessarily represent those of the IMF or IMF policy. Working Papers describe research in progress by the author(s) and are published to elicit comments and to further debate.
2
Contents Page
I. Introduction and Summary .....................................................................................................3
II. Review of the Literature ........................................................................................................7
III. Explaining Growth: The Empirical Framework ..................................................................8 A. Identifying Growth Episodes ....................................................................................8 B. Predicting Growth Episodes—Regression Analysis ...............................................11 C. Differentiating Sustained—and non-sustained—Growth: A Complimentary
Analysis ...................................................................................................................16
IV. How Does Growth in the EAC Compare to Other High Growth Countries? A Benchmarking Exercise .................................................................................................23
A. Investment and Productivity ...................................................................................25 B. Improved Macroeconomic Stability ........................................................................26 C. Quality of Institutions and Infrastructure ................................................................28 D. Limited Financial Depth and Low Domestic Savings ............................................33 E. External Competitiveness ........................................................................................40
V. Conclusions and Policy Priorities for Sustained Growth ....................................................46 Tables 1. Growth Episodes of Commodity Exporters .........................................................................11 2: Predicting Growth Accelerations .........................................................................................14 3. Predicting Sustained Growth Episodes ................................................................................15 4. Explaining Growth ...............................................................................................................16 5. Possible Drivers and Risk Factors for Sustained High Growth ...........................................22 Boxes 1. East African Community: An Overview ................................................................................6 2. Definitions of Accelerated and Sustained Growth Episode .................................................10 3. Structural Reforms and Institution Building in the EAC .....................................................30 4. The EAC Common Market: Achievements and Remaining Challenge ..............................44 Appendix 1. Data Source ..........................................................................................................................54 References ................................................................................................................................50
3
I. INTRODUCTION AND SUMMARY
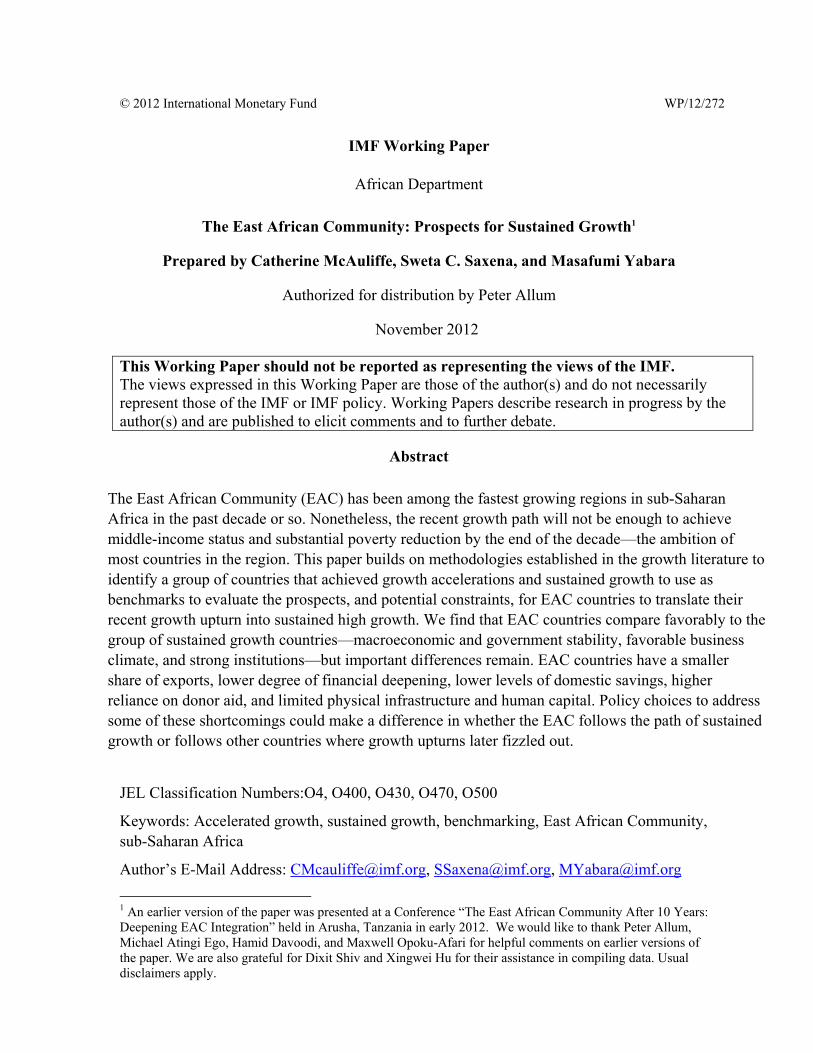
In the midst of sub-Saharan Africa’s (SSA’s) best decade of economic growth since at least the 1970s, the East African Community (EAC) is among the fastest growing regions.2 Growth rates have picked up strongly in EAC countries over the last two decades—outpacing the rest of SSA since 2000. During 2005–10, per capita income growth reached 3.7 percent a year in the EAC, compared to 3.2 percent for SSA as a whole, and almost quadruple the rate achieved in the previous 15-year period (Figure 1). Part of the recent high growth is “catching up” after years of very poor growth—in the last part of the 20th century the region suffered periods of severe civil strife and bouts of economic instability. Since then, the region has been committed to strong policies.
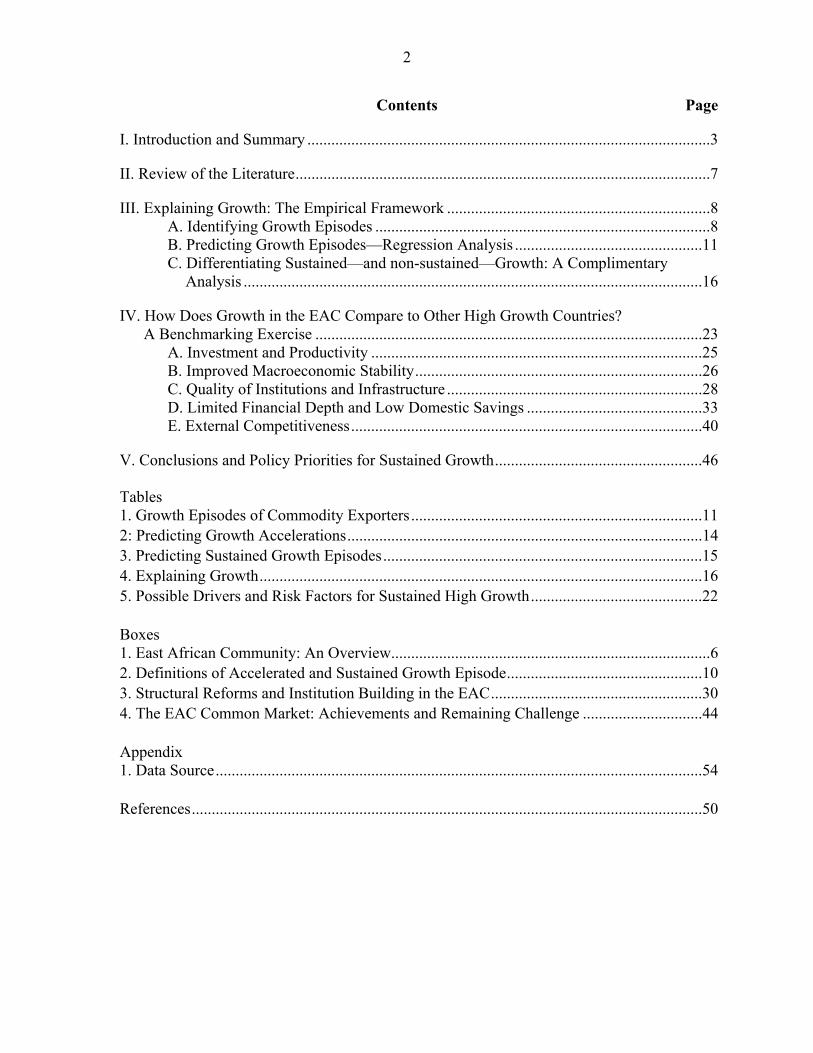
However, growth within the EAC has been uneven. Rwanda, Tanzania, and Uganda have had the longest periods of high growth. Uganda’s growth acceleration started earlier than in the other countries and has lasted more than 20 years, with per capita income growth averaging 3.4 percent a year during 1990–2010 (Figure 2). Growth in Rwanda and Tanzania has been strong since the early 2000s. After a period of stagnation, growth is picking up in Kenya—the largest of the five economies—averaging 1.9 percent a year since 2005 compared to minus 0.2 percent in 1990–2004, providing momentum for the region as a whole. Output declined in Burundi in most of the period since 1990—reflecting periods of political conflict—but has shown signs of recovery in recent years.
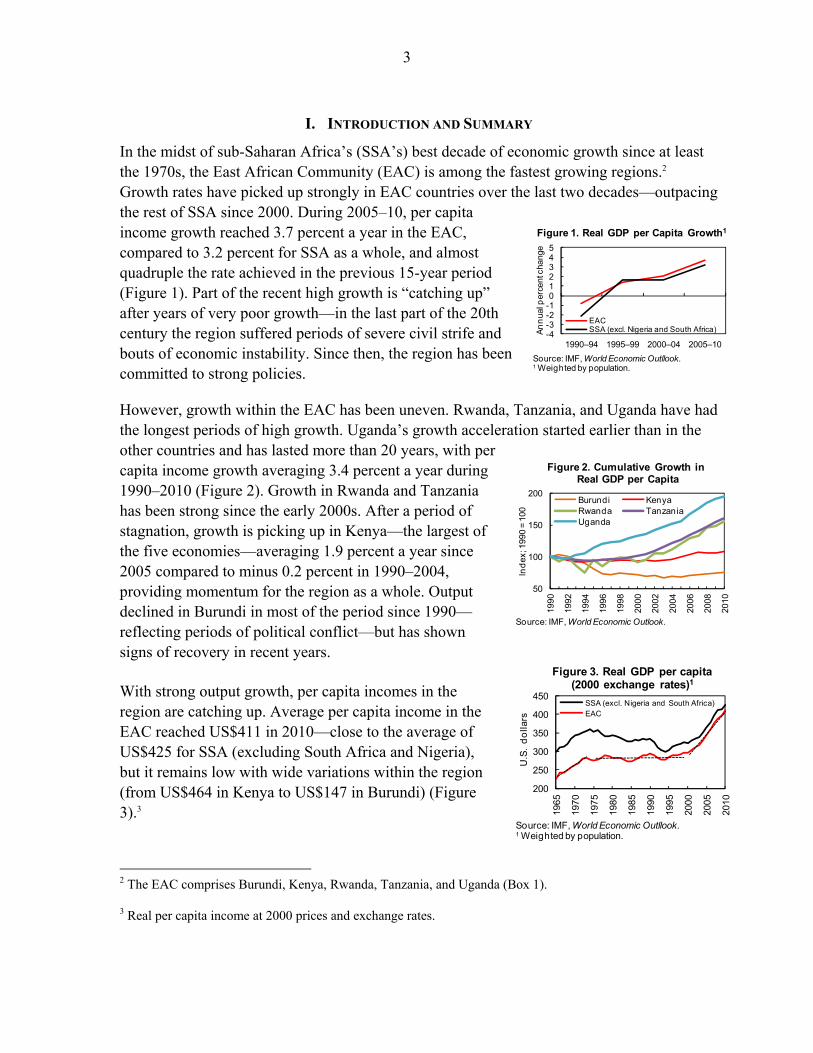
With strong output growth, per capita incomes in the region are catching up. Average per capita income in the EAC reached US$411 in 2010—close to the average of US$425 for SSA (excluding South Africa and Nigeria), but it remains low with wide variations within the region (from US$464 in Kenya to US$147 in Burundi) (Figure 3).3
2 The EAC comprises Burundi, Kenya, Rwanda, Tanzania, and Uganda (Box 1).
3 Real per capita income at 2000 prices and exchange rates.
-4-3-2-1012345
1990–94 1995–99 2000–04 2005–10
An
nua
l per
cent
cha
nge
EACSSA (excl. Nigeria and South Africa)
Figure 1. Real GDP per Capita Growth1
Source: IMF, World Economic Outllook.1 Weighted by population.
50
100
150
200
1990
1992
1994
1996
1998
2000
2002
2004
2006
2008
2010
Ind
ex; 1
990
= 10
0
Burundi KenyaRwanda TanzaniaUganda
Figure 2. Cumulative Growth in Real GDP per Capita
Source: IMF, World Economic Outlook.
200
250
300
350
400
450
1965
1970
1975
1980
1985
1990
1995
2000
2005
2010
U.S
. d
olla
rs
SSA (excl. Nigeria and South Africa)EAC
Figure 3. Real GDP per capita(2000 exchange rates)1
Source: IMF, World Economic Outllook.1 Weighted by population.
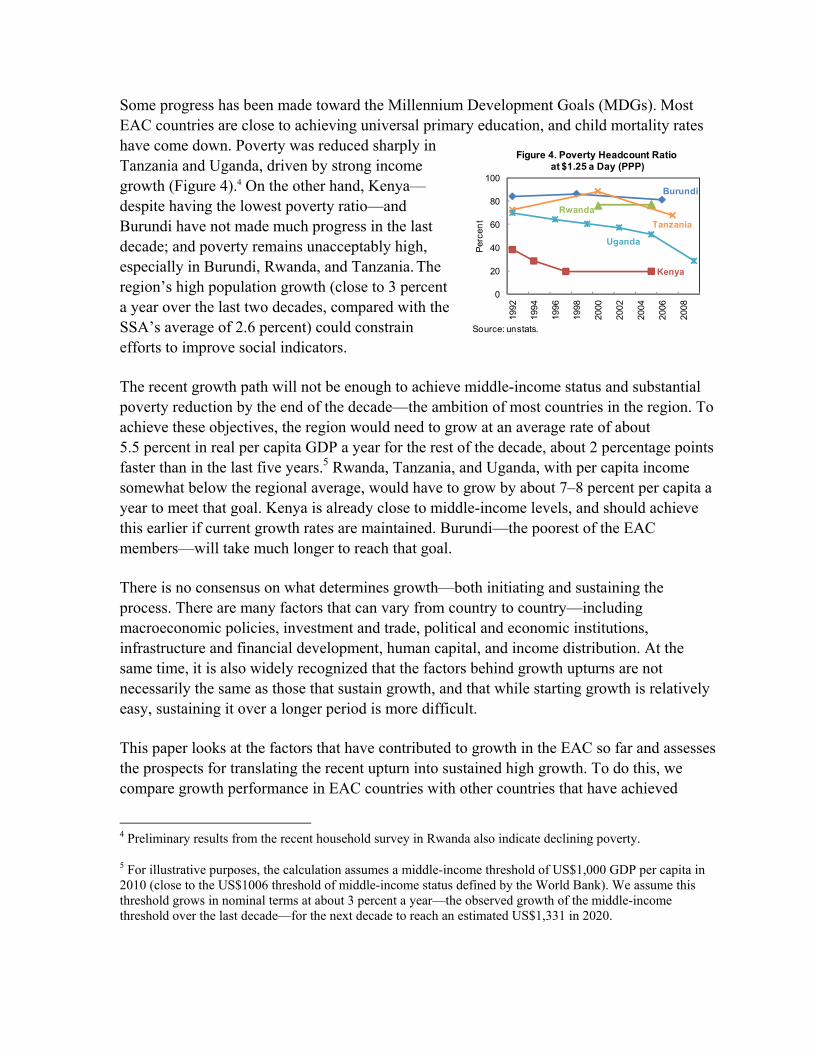
Some progress has been made toward the Millennium Development Goals (MDGs). Most EAC countries are close to achieving universal primary education, and child mortality rates have come down. Poverty was reduced sharply in Tanzania and Uganda, driven by strong income growth (Figure 4).4 On the other hand, Kenya—despite having the lowest poverty ratio—and Burundi have not made much progress in the last decade; and poverty remains unacceptably high, especially in Burundi, Rwanda, and Tanzania. The region’s high population growth (close to 3 percent a year over the last two decades, compared with the SSA’s average of 2.6 percent) could constrain efforts to improve social indicators.
The recent growth path will not be enough to achieve middle-income status and substantial poverty reduction by the end of the decade—the ambition of most countries in the region. To achieve these objectives, the region would need to grow at an average rate of about 5.5 percent in real per capita GDP a year for the rest of the decade, about 2 percentage points faster than in the last five years.5 Rwanda, Tanzania, and Uganda, with per capita income somewhat below the regional average, would have to grow by about 7–8 percent per capita a year to meet that goal. Kenya is already close to middle-income levels, and should achieve this earlier if current growth rates are maintained. Burundi—the poorest of the EAC members—will take much longer to reach that goal.
There is no consensus on what determines growth—both initiating and sustaining the process. There are many factors that can vary from country to country—including macroeconomic policies, investment and trade, political and economic institutions, infrastructure and financial development, human capital, and income distribution. At the same time, it is also widely recognized that the factors behind growth upturns are not necessarily the same as those that sustain growth, and that while starting growth is relatively easy, sustaining it over a longer period is more difficult.
This paper looks at the factors that have contributed to growth in the EAC so far and assesses the prospects for translating the recent upturn into sustained high growth. To do this, we compare growth performance in EAC countries with other countries that have achieved
4 Preliminary results from the recent household survey in Rwanda also indicate declining poverty.
5 For illustrative purposes, the calculation assumes a middle-income threshold of US$1,000 GDP per capita in 2010 (close to the US$1006 threshold of middle-income status defined by the World Bank). We assume this threshold grows in nominal terms at about 3 percent a year—the observed growth of the middle-income threshold over the last decade—for the next decade to reach an estimated US$1,331 in 2020.
Burundi
Kenya
Rwanda
Tanzania
Uganda
0
20
40
60
80
100
1992
1994
1996
1998
2000
2002
2004
2006
2008
Per
cen
t
Figure 4. Poverty Headcount Ratio at $1.25 a Day (PPP)
Source: unstats.
sustained growth (comparing levels and trends in certain indicators to those observed in the other countries).6 Are EAC countries undergoing important shifts in growth patterns—similar to other sustained growth countries (SGs)—that could underpin a longer period of high growth for the region? We also compare the track record of SGs with countries that started to grow but fizzled out. What are the key factors that distinguish sustained and non-sustained growth, and what lessons are there for the EAC? Although this type of benchmarking cannot be used to make unconditional policy advice, it has been used with greater frequency in the growth literature to help judge the growth potential of a country or region by identifying the types of strategies and policy interventions that have been successful, as well as identifying possible constraints to growth.
We find that countries that continued to follow prudent macroeconomic policies and further improve institutions were able to translate growth upturns into sustained growth. Specifically, countries that have sustained strong growth tend to maintain (i) low inflationary environments; (ii) high investment and savings rates; (iii) improved fiscal discipline through low fiscal deficits and low external debt; (iv) higher export-oriented growth with better current account balances, helped by depreciating real exchange rates; and (v) better governance, institutions, and conducive business climates that encourage foreign direct investment.
EAC countries compare favorably to the group of SGs in a number of these important areas—macroeconomic and government stability, favorable business climate, and strong institutions—but important differences remain. In comparison to SGs, EAC countries have a smaller share of exports, lower degree of financial deepening, lower levels of domestic savings, higher reliance on donor aid, and limited physical infrastructure and human capital. There are also different priorities within the EAC, because the countries are at different stages of growth acceleration. Policy choices could make a difference in whether the EAC follows the path of SGs or of other countries where growth upturns later fizzled out.
The rest of the paper is organized as follows: Section II provides a review of recent growth literature. Section III explains the methodology used in the paper to identify growth accelerations and sustained growth episodes, and highlights factors contributing to sustained growth. Section IV provides a comparison of EAC growth with other growth episodes. Section V concludes with some policy recommendations.
6 To support the benchmarking exercise, we also run regressions to understand what institutional measures explain growth and increase the likelihood of achieving accelerated and sustained growth. The latter part is motivated by Hausmann, Pritchett, and Rodrik (2005), with new variables to capture economic liberalization and peace dividends.
Box 1. East African Community: An Overview
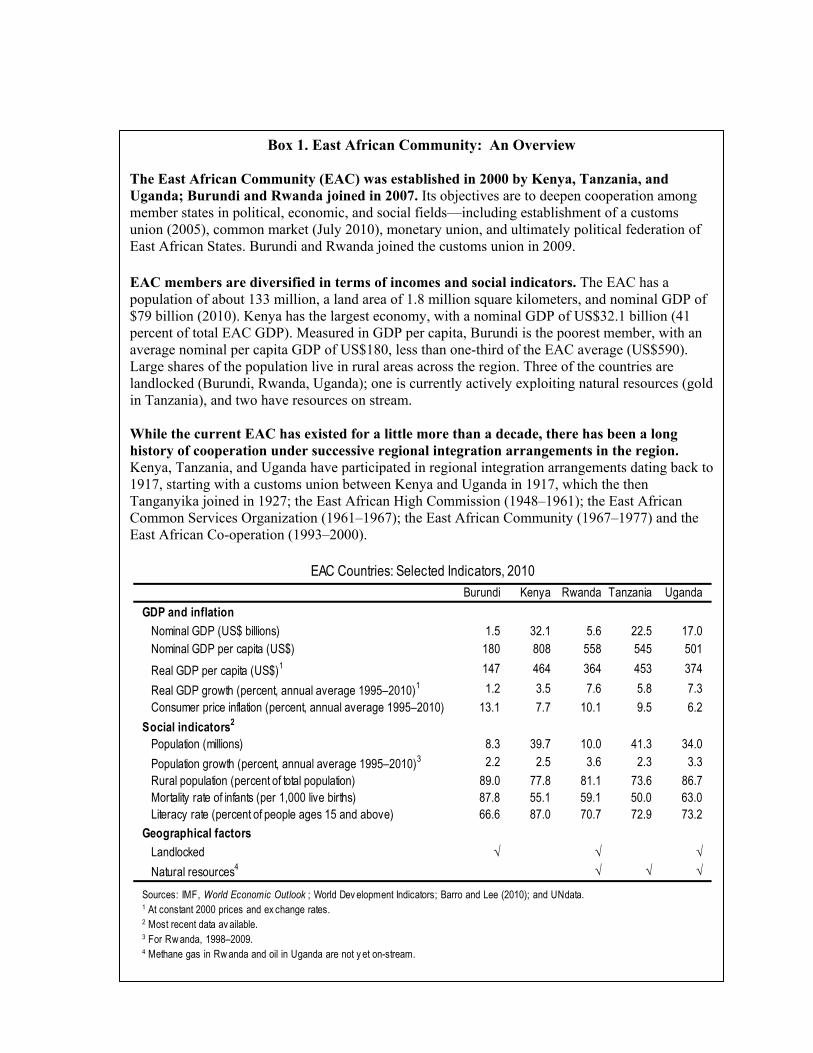
The East African Community (EAC) was established in 2000 by Kenya, Tanzania, and Uganda; Burundi and Rwanda joined in 2007. Its objectives are to deepen cooperation among member states in political, economic, and social fields—including establishment of a customs union (2005), common market (July 2010), monetary union, and ultimately political federation of East African States. Burundi and Rwanda joined the customs union in 2009. EAC members are diversified in terms of incomes and social indicators. The EAC has a population of about 133 million, a land area of 1.8 million square kilometers, and nominal GDP of $79 billion (2010). Kenya has the largest economy, with a nominal GDP of US$32.1 billion (41 percent of total EAC GDP). Measured in GDP per capita, Burundi is the poorest member, with an average nominal per capita GDP of US$180, less than one-third of the EAC average (US$590). Large shares of the population live in rural areas across the region. Three of the countries are landlocked (Burundi, Rwanda, Uganda); one is currently actively exploiting natural resources (gold in Tanzania), and two have resources on stream. While the current EAC has existed for a little more than a decade, there has been a long history of cooperation under successive regional integration arrangements in the region. Kenya, Tanzania, and Uganda have participated in regional integration arrangements dating back to 1917, starting with a customs union between Kenya and Uganda in 1917, which the then Tanganyika joined in 1927; the East African High Commission (1948–1961); the East African Common Services Organization (1961–1967); the East African Community (1967–1977) and the East African Co-operation (1993–2000).
Burundi Kenya Rwanda Tanzania Uganda
GDP and inflation
Nominal GDP (US$ billions) 1.5 32.1 5.6 22.5 17.0Nominal GDP per capita (US$) 180 808 558 545 501
Real GDP per capita (US$)1 147 464 364 453 374
Real GDP growth (percent, annual average 1995–2010)1 1.2 3.5 7.6 5.8 7.3
Consumer price inflation (percent, annual average 1995–2010) 13.1 7.7 10.1 9.5 6.2
Social indicators2
Population (millions) 8.3 39.7 10.0 41.3 34.0
Population growth (percent, annual average 1995–2010)3 2.2 2.5 3.6 2.3 3.3
Rural population (percent of total population) 89.0 77.8 81.1 73.6 86.7Mortality rate of infants (per 1,000 live births) 87.8 55.1 59.1 50.0 63.0Literacy rate (percent of people ages 15 and above) 66.6 87.0 70.7 72.9 73.2
Geographical factors
Landlocked √ √ √
Natural resources4 √ √ √
EAC Countries: Selected Indicators, 2010
Sources: IMF, World Economic Outlook ; World Dev elopment Indicators; Barro and Lee (2010); and UNdata.1 At constant 2000 prices and ex change rates.2 Most recent data av ailable.3 For Rw anda, 1998–2009.4 Methane gas in Rw anda and oil in Uganda are not y et on-stream.
7
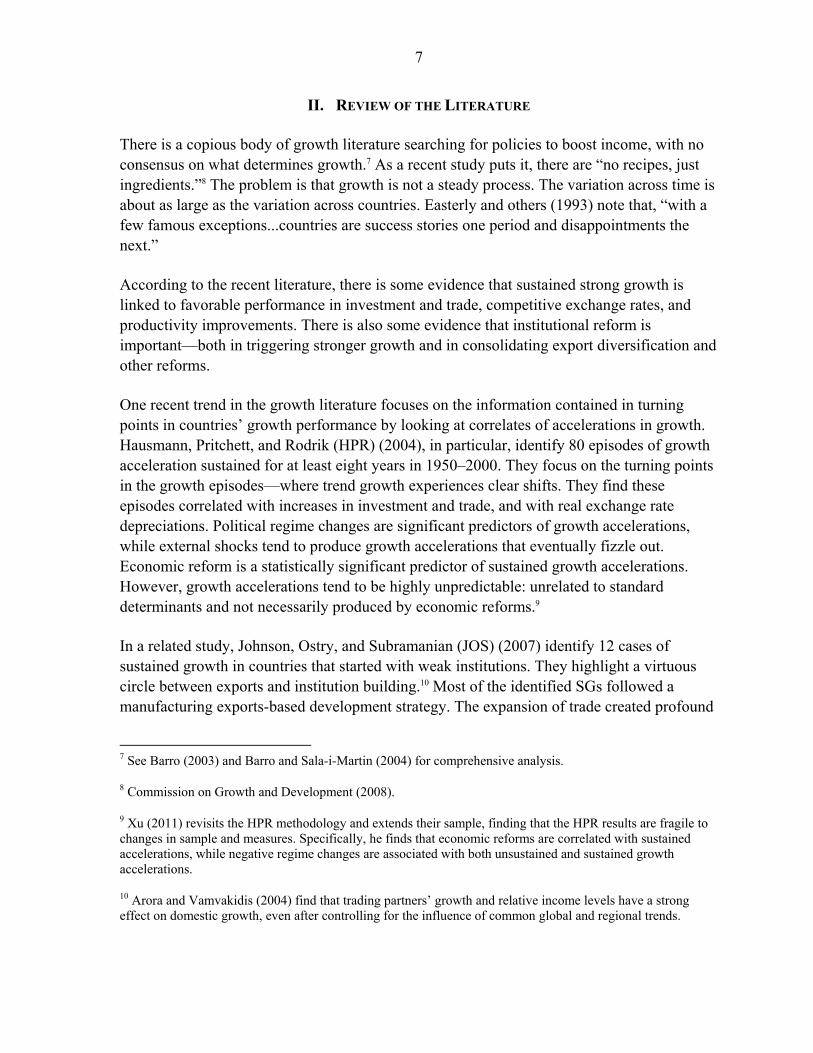
II. REVIEW OF THE LITERATURE
There is a copious body of growth literature searching for policies to boost income, with no consensus on what determines growth.7 As a recent study puts it, there are “no recipes, just ingredients.”8 The problem is that growth is not a steady process. The variation across time is about as large as the variation across countries. Easterly and others (1993) note that, “with a few famous exceptions...countries are success stories one period and disappointments the next.”
According to the recent literature, there is some evidence that sustained strong growth is linked to favorable performance in investment and trade, competitive exchange rates, and productivity improvements. There is also some evidence that institutional reform is important—both in triggering stronger growth and in consolidating export diversification and other reforms.
One recent trend in the growth literature focuses on the information contained in turning points in countries’ growth performance by looking at correlates of accelerations in growth. Hausmann, Pritchett, and Rodrik (HPR) (2004), in particular, identify 80 episodes of growth acceleration sustained for at least eight years in 1950–2000. They focus on the turning points in the growth episodes—where trend growth experiences clear shifts. They find these episodes correlated with increases in investment and trade, and with real exchange rate depreciations. Political regime changes are significant predictors of growth accelerations, while external shocks tend to produce growth accelerations that eventually fizzle out. Economic reform is a statistically significant predictor of sustained growth accelerations. However, growth accelerations tend to be highly unpredictable: unrelated to standard determinants and not necessarily produced by economic reforms.9
In a related study, Johnson, Ostry, and Subramanian (JOS) (2007) identify 12 cases of sustained growth in countries that started with weak institutions. They highlight a virtuous circle between exports and institution building.10 Most of the identified SGs followed a manufacturing exports-based development strategy. The expansion of trade created profound
7 See Barro (2003) and Barro and Sala-i-Martin (2004) for comprehensive analysis.
8 Commission on Growth and Development (2008).
9 Xu (2011) revisits the HPR methodology and extends their sample, finding that the HPR results are fragile to changes in sample and measures. Specifically, he finds that economic reforms are correlated with sustained accelerations, while negative regime changes are associated with both unsustained and sustained growth accelerations.
10 Arora and Vamvakidis (2004) find that trading partners’ growth and relative income levels have a strong effect on domestic growth, even after controlling for the influence of common global and regional trends.
8
changes in the distribution of economic power, with consequences for political power and, consequently, for institutions. While weak institutions may not be a binding constraint on growth for African countries, risks may be seen in developing institutions for commodity exporters and countries that receive sizeable aid inflows.
Selassie (2008) examines Uganda, a member of the EAC, to understand why its sustained growth for 20 years did not translate into structural transformation. He finds that strengthening the country’s infrastructure and enhancing export competitiveness is required to improve the quality of growth.
Other Africa-specific studies attribute growth to institution and human development. For example, Page (2009) and Arbache and Page (2009) find that growth in Africa since 1995 has been due to better macroeconomic policies, while changes in such “growth determinants” as investment, export diversification, and productivity have not accompanied the growth boom. Page (2009) suggests that for sustained growth Africa needs to manage natural resources better, push nontraditional exports, build the private sector, and create new skills. He also identifies the challenge for commodity exporters to develop institutions that promote and support growth. Radelet (2010) highlights a group of 17 emerging countries in SSA that since the mid-1990s have broken away from the rest of the region and achieved steady economic growth, deepening democracy, stronger leadership, and falling poverty.
III. EXPLAINING GROWTH: THE EMPIRICAL FRAMEWORK
A. Identifying Growth Episodes
We build on the methodology established in HPR and further developed in JOS (2007) and Xu (2011) to identify countries that achieved growth accelerations and sustained growth. Our methodology modifies these earlier studies in a number of important areas: First, we extend the time series to 2009 (or 2006 depending on the explanatory variables) whereas the HPR data goes through only 2000, effectively excluding the high growth period in SSA and particularly in the EAC.11 Second, our sample consists of commodity-exporting low-income countries (i.e., countries with similar economic characteristics to EAC countries); whereas the HPR sample includes all countries (including industrial), and JOS uses only countries that had weak initial institutions.
According to the methodology, countries with growth acceleration episodes must have experienced (i) a period of rapid growth of at least 3½ percent a year for seven years; (ii) an
11 We use Penn World Tables (PWT) 7.0 (May 2011), which covers 1950 to 2009 for 189 countries for identifying growth episodes. The World Economic Outlook (WEO) and the World Development Indicators (WDI) are used in benchmarking the EAC growth experience against identified growth episodes, and they cover data starting in 1960.
9
improvement in growth rates of at least 2 percentage points per capita (which captures the idea of acceleration); and (iii) a higher post-acceleration income level than the pre-acceleration peak (this is to rule out cases where accelerations are simply a rebound from a prior period of bad performance, owing to conflict or other shocks) (Box 2). On the basis of these criteria, and using the latest available data through 2009, we can identify growth acceleration episodes starting as late as 2002.12
Furthermore, to identify sustained high growth episodes, i.e., countries that not only accelerated growth, but also sustained high growth after the acceleration, we add criterion (iv) that growth rates must stay above 3 percent for at least five years after the first seven years, similar to methodologies used in HPR and subsequent studies.13 This criterion can identify sustained growth episodes that started in 1997 at the latest.14 To investigate factors distinguishing sustained and non-sustained growth, we further identified non-sustained growth episodes, which meet all three criteria for growth acceleration (i–iii), but not the criterion for sustained growth (iv).
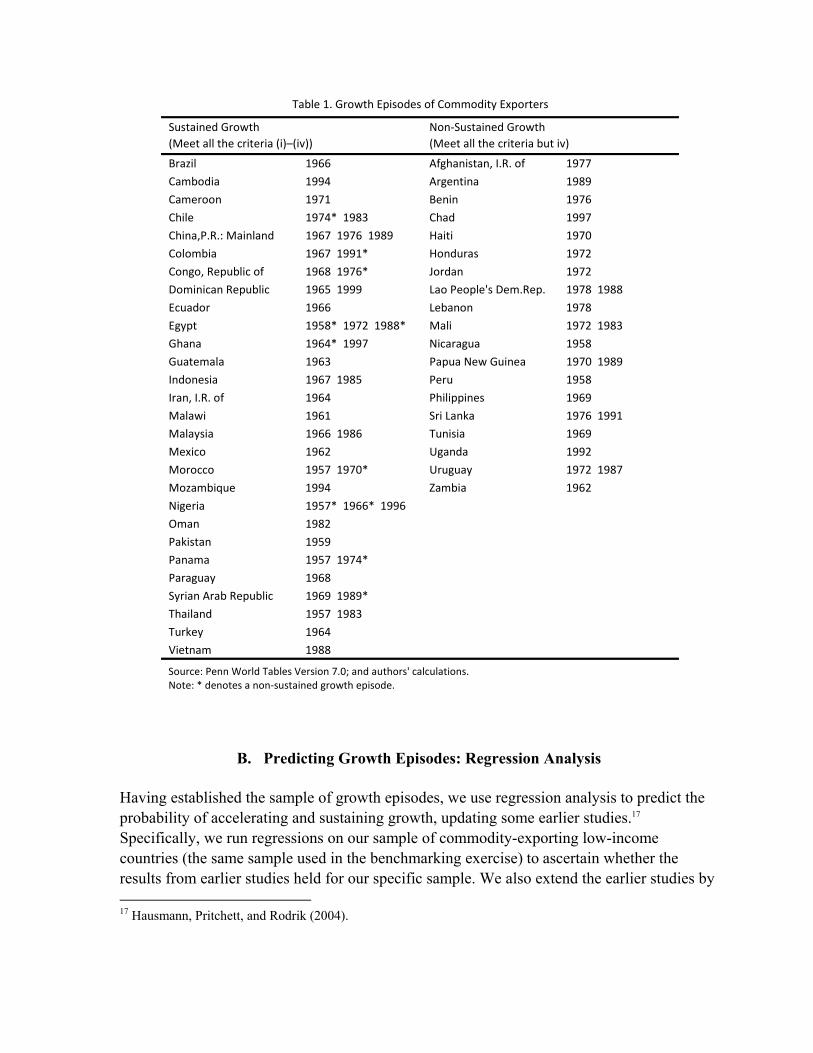
We identify 34 episodes of sustained growth in 28 countries (SGs), as well as 35 non-sustained growth episodes in 28 countries (non-SGs). Table 1 shows all of the growth episodes and the years of initiation (time t). The list of SGs includes most of the well-known growth episodes that followed significant policy changes or policy reforms. None of the EAC countries is included in the list. Three EAC countries (Uganda, Tanzania, Rwanda) have achieved growth accelerations (satisfying criteria i-iii)—with acceleration in 1992 for Uganda, 1999 for Tanzania, and 2002 for Rwanda. However, they are not SGs (none meet criteria iv—the growth episodes for Rwanda and Tanzania are too short, and Uganda fell just short of the threshold of sustaining growth for seven years beyond growth acceleration).15 In contrast, Burundi and Kenya, two countries with the lowest and highest per capita income in the EAC, respectively, have not yet registered a growth acceleration, failing to meet criteria (i)–(iii). For the rest of the paper, Rwanda, Tanzania, and Uganda (referred to as EAC-AGs) are treated as a group, given similarities in their growth performance; while Burundi and Kenya are assessed individually because they are subject to different constraints on achieving growth accelerations. 12 Since growth episodes must last for at least 7 years to qualify as a growth acceleration (criterion ii), the latest year for the start of an acceleration is 2002 using PWT 7.0, which includes data through 2009.
13 Although these studies commonly use the criterion of 10 years after growth acceleration to be considered sustained, HPR and Xu (2011) use the criterion that gt+7,t+17 ≥ 2 ppa, whereas JOS use the criterion that growth per capita must stay above 3 percent after 7 [Must be a number because of 10]years.
14 Countries that achieved growth acceleration in 1998 or after do not meet the criterion for sustained growth simply because their episodes are too short and data gt+7, t+12 are unavailable.
15 Rwanda and Tanzania are not included in the group of non-SGs because their years of growth acceleration are after 1997, while Uganda is included as a non-SG.
10
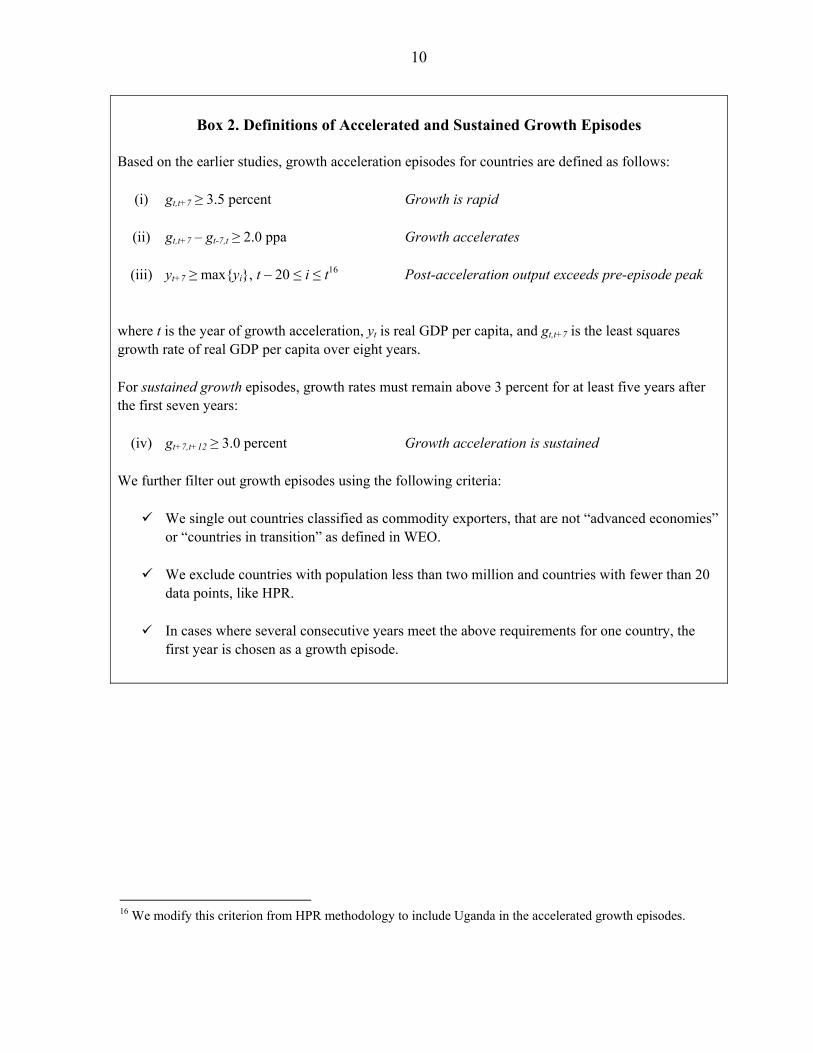
Box 2. Definitions of Accelerated and Sustained Growth Episodes
Based on the earlier studies, growth acceleration episodes for countries are defined as follows:
(i) gt,t+7 ≥ 3.5 percent Growth is rapid
(ii) gt,t+7 – gt-7,t ≥ 2.0 ppa Growth accelerates
(iii) yt+7 ≥ max{yi}, t – 20 ≤ i ≤ t16 Post-acceleration output exceeds pre-episode peak
where t is the year of growth acceleration, yt is real GDP per capita, and gt,t+7 is the least squares growth rate of real GDP per capita over eight years.
For sustained growth episodes, growth rates must remain above 3 percent for at least five years after the first seven years:
(iv) gt+7,t+12 ≥ 3.0 percent Growth acceleration is sustained
We further filter out growth episodes using the following criteria:
We single out countries classified as commodity exporters, that are not “advanced economies” or “countries in transition” as defined in WEO.
We exclude countries with population less than two million and countries with fewer than 20 data points, like HPR.
In cases where several consecutive years meet the above requirements for one country, the first year is chosen as a growth episode.
16 We modify this criterion from HPR methodology to include Uganda in the accelerated growth episodes.
B. Predicting Growth Episodes: Regression Analysis
Having established the sample of growth episodes, we use regression analysis to predict the probability of accelerating and sustaining growth, updating some earlier studies.17 Specifically, we run regressions on our sample of commodity-exporting low-income countries (the same sample used in the benchmarking exercise) to ascertain whether the results from earlier studies held for our specific sample. We also extend the earlier studies by 17 Hausmann, Pritchett, and Rodrik (2004).
Brazil 1966 Afghanistan, I.R. of 1977
Cambodia 1994 Argentina 1989
Cameroon 1971 Benin 1976
Chile 1974* 1983 Chad 1997
China,P.R.: Mainland 1967 1976 1989 Haiti 1970
Colombia 1967 1991* Honduras 1972
Congo, Republic of 1968 1976* Jordan 1972
Dominican Republic 1965 1999 Lao People's Dem.Rep. 1978 1988
Ecuador 1966 Lebanon 1978
Egypt 1958* 1972 1988* Mali 1972 1983
Ghana 1964* 1997 Nicaragua 1958
Guatemala 1963 Papua New Guinea 1970 1989
Indonesia 1967 1985 Peru 1958
Iran, I.R. of 1964 Philippines 1969
Malawi 1961 Sri Lanka 1976 1991
Malaysia 1966 1986 Tunisia 1969
Mexico 1962 Uganda 1992
Morocco 1957 1970* Uruguay 1972 1987
Mozambique 1994 Zambia 1962
Nigeria 1957* 1966* 1996
Oman 1982
Pakistan 1959
Panama 1957 1974*
Paraguay 1968
Syrian Arab Republic 1969 1989*
Thailand 1957 1983
Turkey 1964
Vietnam 1988
Table 1. Growth Episodes of Commodity Exporters
Sustained Growth
(Meet all the criteria (i)–(iv))
Non-Sustained Growth
(Meet all the criteria but iv)
Source: Penn World Tables Version 7.0; and authors' calculations.Note: * denotes a non-sustained growth episode.
12
incorporating a dummy variable for the end of the civil war to capture a “peace dividend” (earlier studies have only tested for the impact of civil war, not the end of civil war, on growth) and a new index to capture domestic financial sector liberalization, both of which are important for the EAC. Other variables (including terms of trade, world commodity prices, growth and interest rates, and real effective exchange rate) are similar to those in the earlier studies.
To foreshadow our results, we find that both external factors (improvements in terms of trade, world commodity prices, and world economic outlook) and domestic factors (financial liberalization) improve growth. The analysis further shows that maintaining peace and a move toward financial liberalization improve the chances of experiencing both growth accelerations and sustained growth after about five- to seven years, i.e., persistence pays off. For example, the end of a civil war increases the probability of experiencing growth acceleration by about 10 percent after six years. For the EAC, the probability of experiencing growth acceleration increases by 38 percent following the end of civil war and 8 percent after domestic financial sector liberalization, both after five years.18 While the same factors help explain both acceleration and sustained growth episodes, institutional and economic changes need to persist longer to translate into sustained growth. For example, financial sector liberalization increases the probability of experiencing sustained growth by 10 percent after seven years.19
Specifically, we use probit regressions to predict the probability of accelerated growth and sustained growth, following the methodology established in HPR (although modified to include lags and new explanatory variables). Specifically, we incorporate a new index to capture domestic financial sector liberalization and a lagged dummy variable for the end of the civil war to capture a “peace dividend,” unlike HPR, which uses contemporaneous variables.
1. Similar to HPR, our dependent variable is a dummy that takes the value of one in the period around the first year of a growth acceleration or sustained growth episode (time t) and zero otherwise (i.e., the dummy equals one for t-1, t, and t+1)). Specifically:
)()1( 1 itit XFDP , where Dit is the dummy variable; Xit-1 are the lags of the explanatory
18 Other studies have found that civil wars have long term negative impact on economic growth. However, none have tested for the impact of “end of civil war” on growth.
19 This is consistent with other studies that have found that liberalized banking systems have led to financial deepening, but only in countries with institutions that place checks and balances on political power (Abiad, Detragiache and Tressel, 2008). The lagged effect in our sample likely reflects the fact that financial liberalization takes time to translate into financial deepening because institutions are probably weak.
13
variables used to explain the probability of a growth takeoff.
We incorporate the following explanatory variables (see Appendix for data sources):
TT_Thresh90 is a dummy variable that captures exceptionally favorable external circumstances by assigning the value 1 whenever the change in the terms of trade from year t to t-4 is in the top 90th percentile of the entire sample (40.8 percent).
Civil War End captures “peace dividends,” which are important for a region that has suffered from civil wars. The dummy variable takes the value 1 in the year the civil war ends.
PosRegChg is used to gauge the impact of political stability on growth episodes. The dummy variables take the value of 1 if, over a 5-year period, there is at least a 3-unit change in the Polity score—a commonly used indicator for democratization. Specifically, PosRegChg is 1 if the regime change over a five-year period increased the Polity score by at least 3 points, denoting a movement toward greater democracy.20
ΔDFSlib captures domestic financial sector liberalization, using a new index adopted from Abiad, Detragiache and Tressel (2008).
Banking Crisis is a dummy that takes the value 1 in the year a banking crisis starts.
ΔREER is the change in real effective exchange rate and captures competitiveness of the economy.
ΔWorld Commodity Prices, World Growth (in percent change), and World Interest Rate (proxied by the U.S. federal funds rate) capture external economic conditions common to all sample countries.
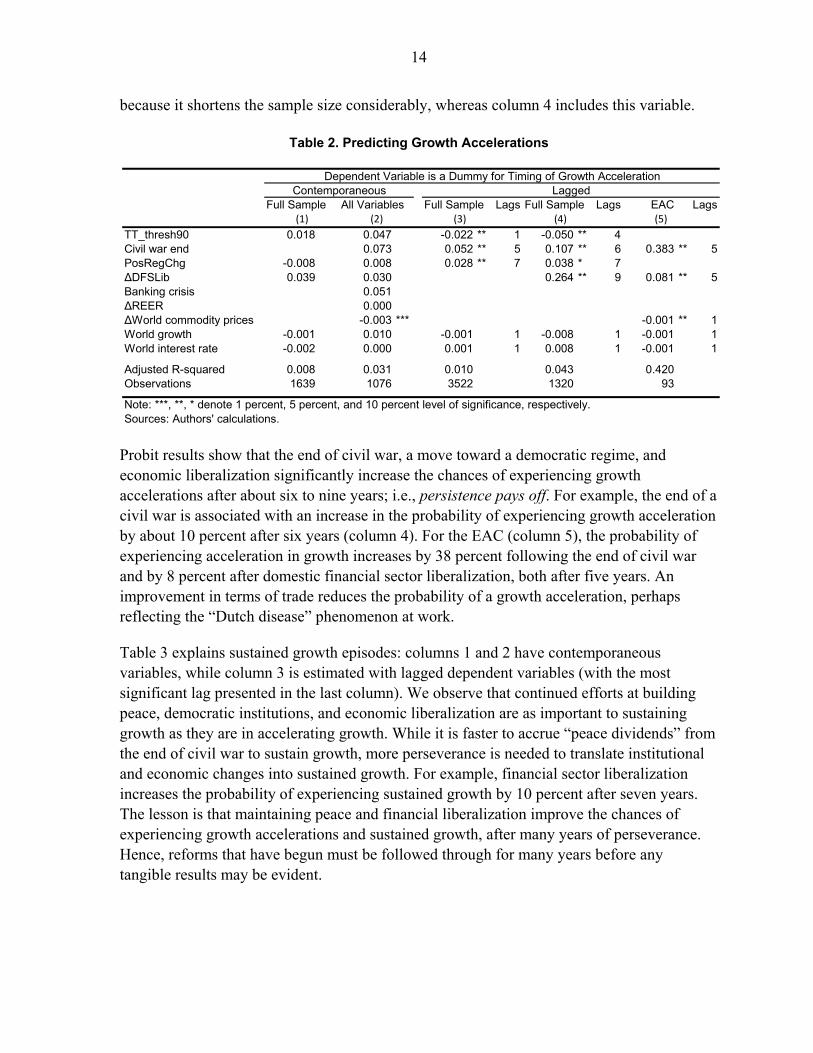
Table 2 presents the results from probit regressions to predict growth accelerations. Column1 estimates the model on contemporaneous independent variables as in HPR, while column 2 has the HPR variables as well as additional ones. Predicting growth acceleration with contemporaneous variables appears insignificant, with the exception of world commodity prices, which are negatively correlated to the probability of acceleration. This could be due to the relatively immediate impact of commodity prices on domestic inflation and output. Going beyond HPR, columns 3 and 4 estimate the probit model using lagged independent variables (the number next to the estimates reflects the lag at which that variable was significant). Column 3 shows the estimates for the HPR variables, ignoring financial liberalization
20 NegRegChg is defined analogously as a decrease in the Polity score, and denotes a move towards greater authoritarianism. However, we do not use this variable in the regressions because it was insignificant.
14
because it shortens the sample size considerably, whereas column 4 includes this variable.
Table 2. Predicting Growth Accelerations
Probit results show that the end of civil war, a move toward a democratic regime, and economic liberalization significantly increase the chances of experiencing growth accelerations after about six to nine years; i.e., persistence pays off. For example, the end of a civil war is associated with an increase in the probability of experiencing growth acceleration by about 10 percent after six years (column 4). For the EAC (column 5), the probability of experiencing acceleration in growth increases by 38 percent following the end of civil war and by 8 percent after domestic financial sector liberalization, both after five years. An improvement in terms of trade reduces the probability of a growth acceleration, perhaps reflecting the “Dutch disease” phenomenon at work.
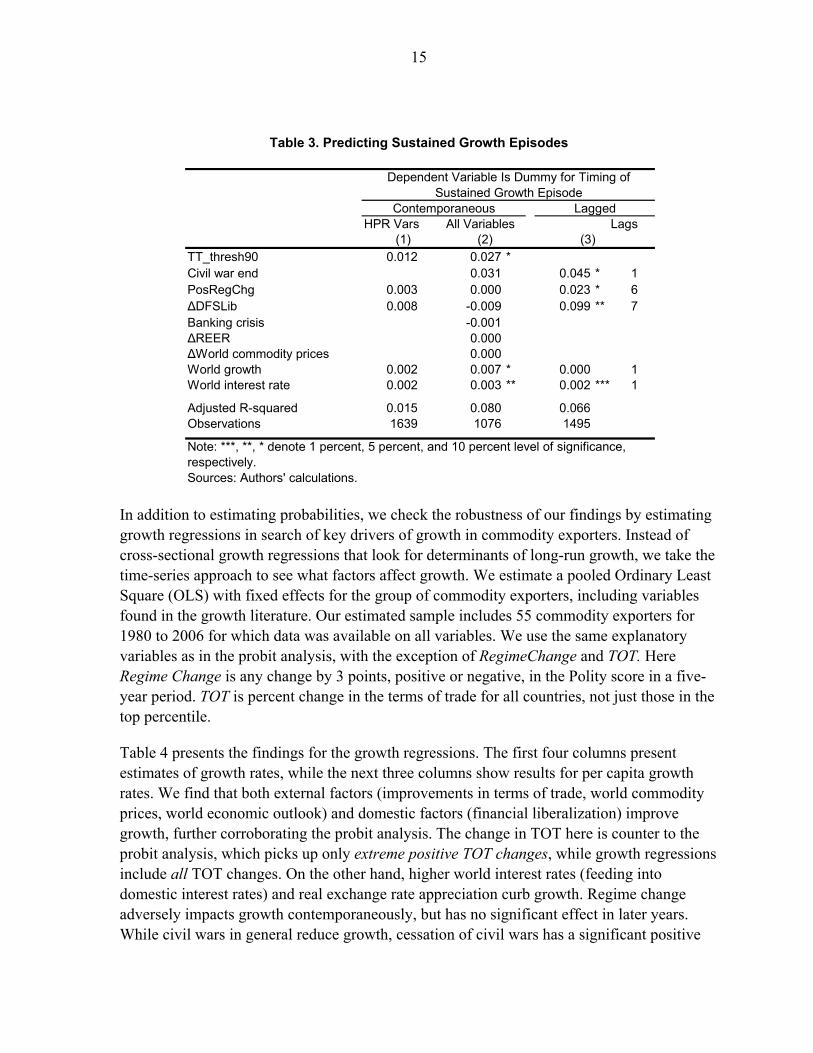
Table 3 explains sustained growth episodes: columns 1 and 2 have contemporaneous variables, while column 3 is estimated with lagged dependent variables (with the most significant lag presented in the last column). We observe that continued efforts at building peace, democratic institutions, and economic liberalization are as important to sustaining growth as they are in accelerating growth. While it is faster to accrue “peace dividends” from the end of civil war to sustain growth, more perseverance is needed to translate institutional and economic changes into sustained growth. For example, financial sector liberalization increases the probability of experiencing sustained growth by 10 percent after seven years. The lesson is that maintaining peace and financial liberalization improve the chances of experiencing growth accelerations and sustained growth, after many years of perseverance. Hence, reforms that have begun must be followed through for many years before any tangible results may be evident.
Dependent Variable is a Dummy for Timing of Growth AccelerationContemporaneous Lagged
Full Sample All Variables Full Sample Lags Full Sample Lags EAC Lags(1) (2) (3) (4) (5)
TT_thresh90 0.018 0.047 -0.022 ** 1 -0.050 ** 4Civil war end 0.073 0.052 ** 5 0.107 ** 6 0.383 ** 5PosRegChg -0.008 0.008 0.028 ** 7 0.038 * 7∆DFSLib 0.039 0.030 0.264 ** 9 0.081 ** 5Banking crisis 0.051∆REER 0.000∆World commodity prices -0.003 *** -0.001 ** 1World growth -0.001 0.010 -0.001 1 -0.008 1 -0.001 1World interest rate -0.002 0.000 0.001 1 0.008 1 -0.001 1
Adjusted R-squared 0.008 0.031 0.010 0.043 0.420Observations 1639 1076 3522 1320 93
Note: ***, **, * denote 1 percent, 5 percent, and 10 percent level of significance, respectively.Sources: Authors' calculations.
15
Table 3. Predicting Sustained Growth Episodes
In addition to estimating probabilities, we check the robustness of our findings by estimating growth regressions in search of key drivers of growth in commodity exporters. Instead of cross-sectional growth regressions that look for determinants of long-run growth, we take the time-series approach to see what factors affect growth. We estimate a pooled Ordinary Least Square (OLS) with fixed effects for the group of commodity exporters, including variables found in the growth literature. Our estimated sample includes 55 commodity exporters for 1980 to 2006 for which data was available on all variables. We use the same explanatory variables as in the probit analysis, with the exception of RegimeChange and TOT. Here Regime Change is any change by 3 points, positive or negative, in the Polity score in a five-year period. TOT is percent change in the terms of trade for all countries, not just those in the top percentile.
Table 4 presents the findings for the growth regressions. The first four columns present estimates of growth rates, while the next three columns show results for per capita growth rates. We find that both external factors (improvements in terms of trade, world commodity prices, world economic outlook) and domestic factors (financial liberalization) improve growth, further corroborating the probit analysis. The change in TOT here is counter to the probit analysis, which picks up only extreme positive TOT changes, while growth regressions include all TOT changes. On the other hand, higher world interest rates (feeding into domestic interest rates) and real exchange rate appreciation curb growth. Regime change adversely impacts growth contemporaneously, but has no significant effect in later years. While civil wars in general reduce growth, cessation of civil wars has a significant positive
Dependent Variable Is Dummy for Timing ofSustained Growth Episode
Contemporaneous LaggedHPR Vars All Variables Lags
(1) (2) (3)
TT_thresh90 0.012 0.027 *Civil war end 0.031 0.045 * 1PosRegChg 0.003 0.000 0.023 * 6∆DFSLib 0.008 -0.009 0.099 ** 7Banking crisis -0.001∆REER 0.000∆World commodity prices 0.000World growth 0.002 0.007 * 0.000 1World interest rate 0.002 0.003 ** 0.002 *** 1
Adjusted R-squared 0.015 0.080 0.066Observations 1639 1076 1495
Note: ***, **, * denote 1 percent, 5 percent, and 10 percent level of significance,respectively.Sources: Authors' calculations.
16
impact on growth for EAC countries, albeit after eight years.
Table 4. Explaining Growth
C. Differentiating Sustained and Non-Sustained Growth: A Complementary Analysis
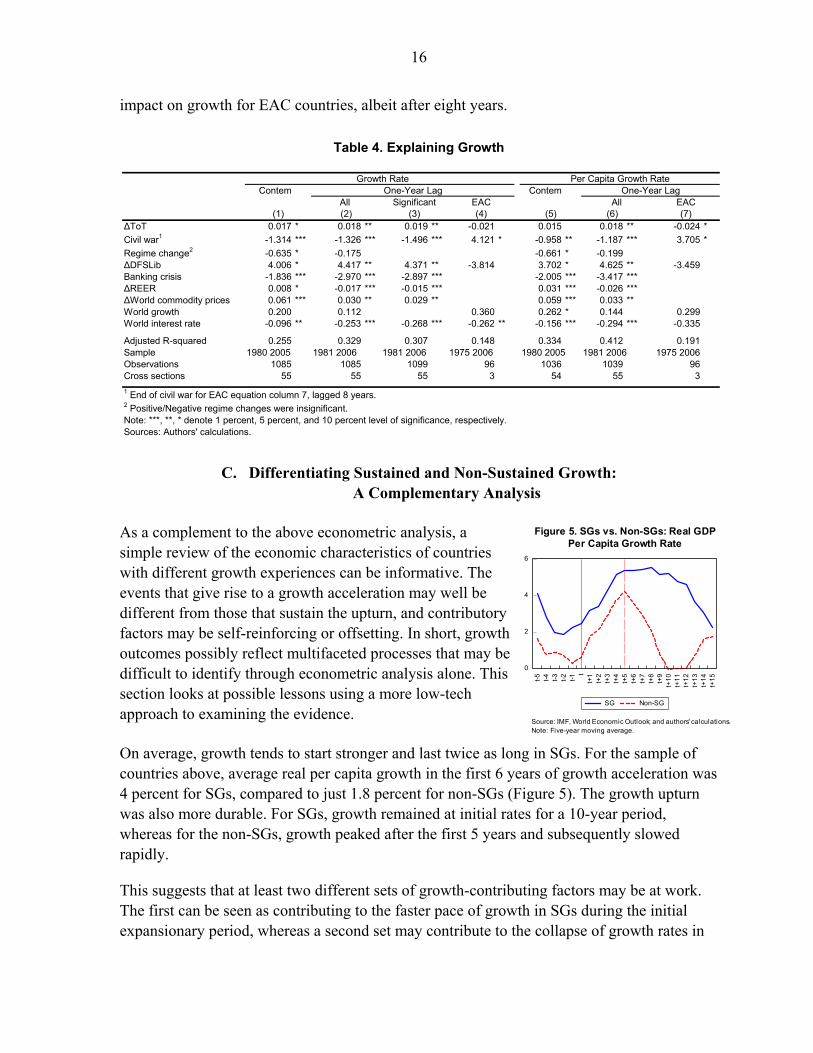
As a complement to the above econometric analysis, a simple review of the economic characteristics of countries with different growth experiences can be informative. The events that give rise to a growth acceleration may well be different from those that sustain the upturn, and contributory factors may be self-reinforcing or offsetting. In short, growth outcomes possibly reflect multifaceted processes that may be difficult to identify through econometric analysis alone. This section looks at possible lessons using a more low-tech approach to examining the evidence.
On average, growth tends to start stronger and last twice as long in SGs. For the sample of countries above, average real per capita growth in the first 6 years of growth acceleration was 4 percent for SGs, compared to just 1.8 percent for non-SGs (Figure 5). The growth upturn was also more durable. For SGs, growth remained at initial rates for a 10-year period, whereas for the non-SGs, growth peaked after the first 5 years and subsequently slowed rapidly.
This suggests that at least two different sets of growth-contributing factors may be at work. The first can be seen as contributing to the faster pace of growth in SGs during the initial expansionary period, whereas a second set may contribute to the collapse of growth rates in
Growth Rate Per Capita Growth RateContem One-Year Lag Contem One-Year Lag
All Significant EAC All EAC(1) (2) (3) (4) (5) (6) (7)
∆ToT 0.017 * 0.018 ** 0.019 ** -0.021 0.015 0.018 ** -0.024 *
Civil war1 -1.314 *** -1.326 *** -1.496 *** 4.121 * -0.958 ** -1.187 *** 3.705 *
Regime change2 -0.635 * -0.175 -0.661 * -0.199∆DFSLib 4.006 * 4.417 ** 4.371 ** -3.814 3.702 * 4.625 ** -3.459Banking crisis -1.836 *** -2.970 *** -2.897 *** -2.005 *** -3.417 ***∆REER 0.008 * -0.017 *** -0.015 *** 0.031 *** -0.026 ***∆World commodity prices 0.061 *** 0.030 ** 0.029 ** 0.059 *** 0.033 **World growth 0.200 0.112 0.360 0.262 * 0.144 0.299World interest rate -0.096 ** -0.253 *** -0.268 *** -0.262 ** -0.156 *** -0.294 *** -0.335
Adjusted R-squared 0.255 0.329 0.307 0.148 0.334 0.412 0.191Sample 1980 2005 1981 2006 1981 2006 1975 2006 1980 2005 1981 2006 1975 2006Observations 1085 1085 1099 96 1036 1039 96Cross sections 55 55 55 3 54 55 3
1 End of civil war for EAC equation column 7, lagged 8 years.2 Positive/Negative regime changes were insignificant.Note: ***, **, * denote 1 percent, 5 percent, and 10 percent level of significance, respectively.Sources: Authors' calculations.
0
2
4
6
t-5
t-4
t-3
t-2
t-1 t
t+1
t+2
t+3
t+4
t+5
t+6
t+7
t+8
t+9
t+1
0t+
11
t+1
2t+
13
t+1
4t+
15
SG Non-SG
Figure 5. SGs vs. Non-SGs: Real GDPPer Capita Growth Rate
Source: IMF, World Economic Outlook; and authors' calculations.Note: Five-year moving average.
17
non-SGs around the five-year mark. Possible candidates for these roles are considered below.
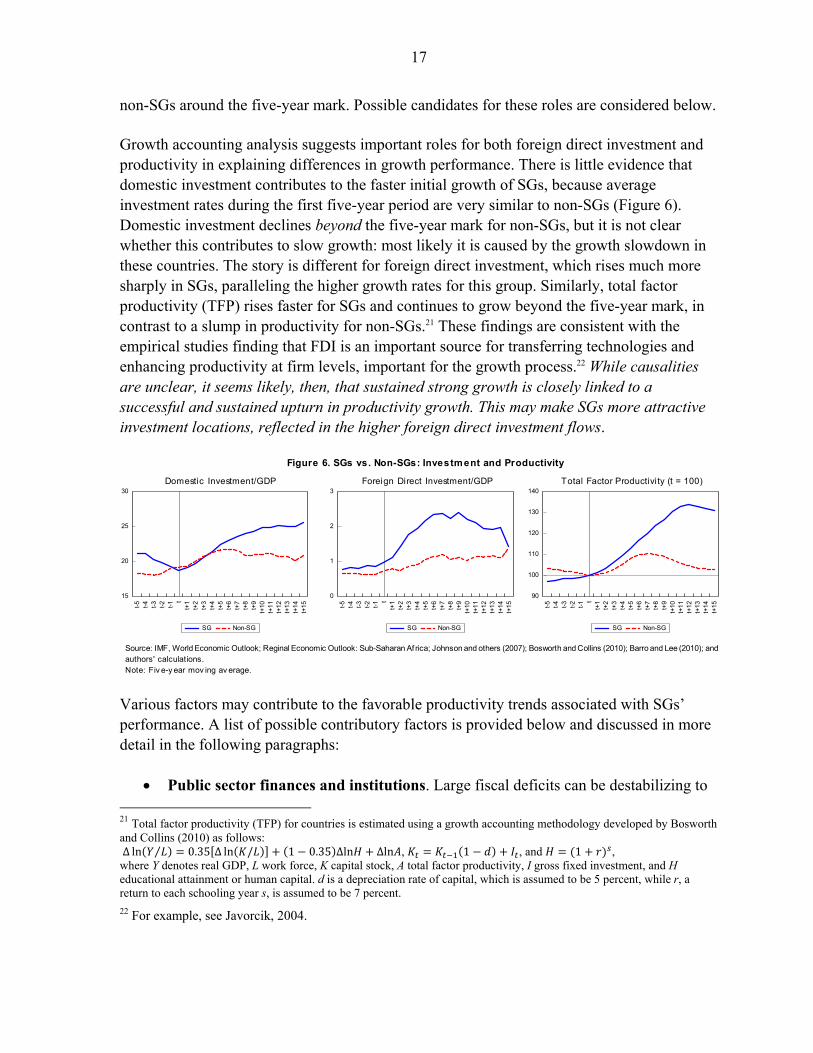
Growth accounting analysis suggests important roles for both foreign direct investment and productivity in explaining differences in growth performance. There is little evidence that domestic investment contributes to the faster initial growth of SGs, because average investment rates during the first five-year period are very similar to non-SGs (Figure 6). Domestic investment declines beyond the five-year mark for non-SGs, but it is not clear whether this contributes to slow growth: most likely it is caused by the growth slowdown in these countries. The story is different for foreign direct investment, which rises much more sharply in SGs, paralleling the higher growth rates for this group. Similarly, total factor productivity (TFP) rises faster for SGs and continues to grow beyond the five-year mark, in contrast to a slump in productivity for non-SGs.21 These findings are consistent with the empirical studies finding that FDI is an important source for transferring technologies and enhancing productivity at firm levels, important for the growth process.22 While causalities are unclear, it seems likely, then, that sustained strong growth is closely linked to a successful and sustained upturn in productivity growth. This may make SGs more attractive investment locations, reflected in the higher foreign direct investment flows.
Various factors may contribute to the favorable productivity trends associated with SGs’ performance. A list of possible contributory factors is provided below and discussed in more detail in the following paragraphs:
Public sector finances and institutions. Large fiscal deficits can be destabilizing to 21 Total factor productivity (TFP) for countries is estimated using a growth accounting methodology developed by Bosworth and Collins (2010) as follows: ∆ ln ⁄ 0.35 ∆ ln / 1 0.35 ∆ln ∆ln , 1 , and 1 , where Y denotes real GDP, L work force, K capital stock, A total factor productivity, I gross fixed investment, and H educational attainment or human capital. d is a depreciation rate of capital, which is assumed to be 5 percent, while r, a return to each schooling year s, is assumed to be 7 percent.
22 For example, see Javorcik, 2004.
15
20
25
30
t-5 t-4 t-3 t-2 t-1t
t+1
t+2
t+3
t+4
t+5
t+6
t+7
t+8
t+9
t+10
t+11
t+12
t+13
t+14
t+15
SG Non-SG
0
1
2
3
t-5 t-4 t-3 t-2 t-1t
t+1
t+2
t+3
t+4
t+5
t+6
t+7
t+8
t+9
t+10
t+11
t+12
t+13
t+14
t+15
SG Non-SG
90
100
110
120
130
140
t-5 t-4 t-3 t-2 t-1t
t+1
t+2
t+3
t+4
t+5
t+6
t+7
t+8
t+9
t+10
t+11
t+12
t+13
t+14
t+15
SG Non-SG
Figure 6. SGs vs. Non-SGs: Investment and Productivity
Domestic Investment/GDP Foreign Direct Investment/GDP Total Factor Productivity (t = 100)
Source: IMF, World Economic Outlook; Reginal Economic Outlook: Sub-Saharan Af rica; Johnson and others (2007); Bosworth and Collins (2010); Barro and Lee (2010); andauthors' calculations.Note: Fiv e-y ear mov ing av erage.
18
the macro economy, while high levels of foreign aid inflows may be able to finance growth-promoting investments. The quality of public sector institutions could also potentially influence national productivity performance.
Inflation discipline. There is evidence that high rates of inflation undermine growth performance.
Health and education. A healthy and well-educated population would be more productive.
Infrastructure. Strong public infrastructure would support overall productivity.
Financial sector depth. A well-developed financial sector can help mobilize domestic savings and allocate resources productively.
External competitiveness. Strong growth performance is frequently linked to favorable contributions from the export sector.
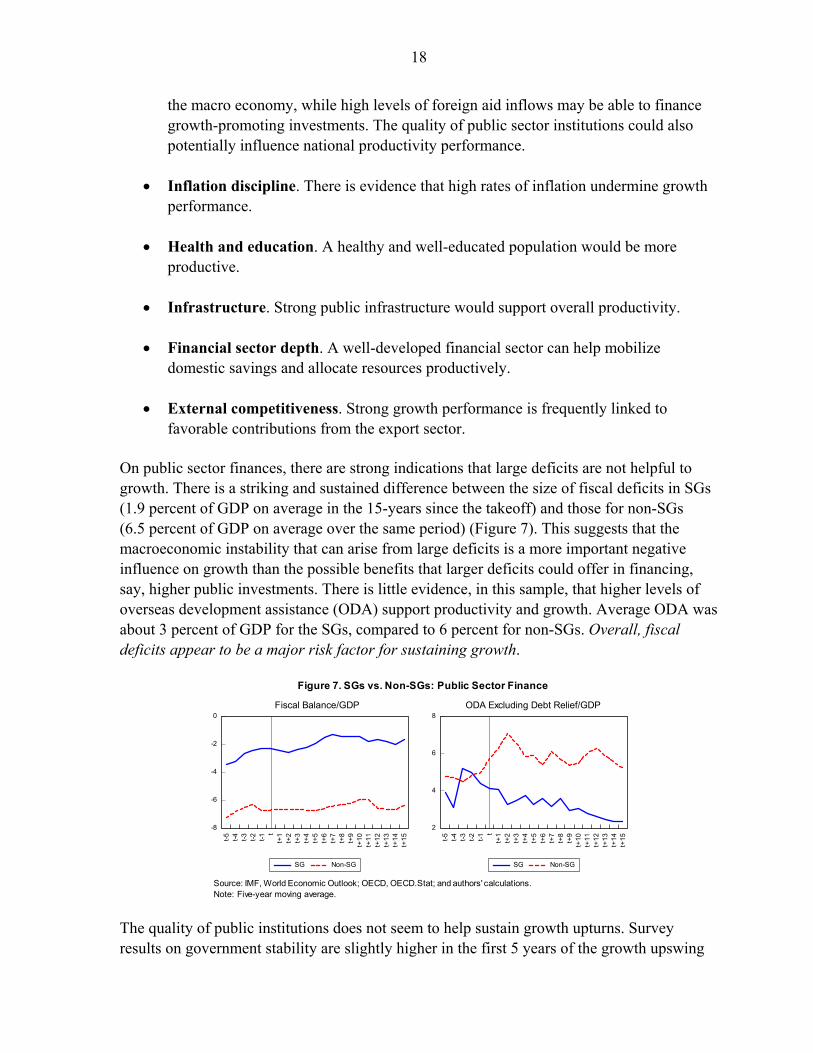
On public sector finances, there are strong indications that large deficits are not helpful to growth. There is a striking and sustained difference between the size of fiscal deficits in SGs (1.9 percent of GDP on average in the 15-years since the takeoff) and those for non-SGs (6.5 percent of GDP on average over the same period) (Figure 7). This suggests that the macroeconomic instability that can arise from large deficits is a more important negative influence on growth than the possible benefits that larger deficits could offer in financing, say, higher public investments. There is little evidence, in this sample, that higher levels of overseas development assistance (ODA) support productivity and growth. Average ODA was about 3 percent of GDP for the SGs, compared to 6 percent for non-SGs. Overall, fiscal deficits appear to be a major risk factor for sustaining growth.
The quality of public institutions does not seem to help sustain growth upturns. Survey results on government stability are slightly higher in the first 5 years of the growth upswing
-8
-6
-4
-2
0
t-5
t-4
t-3
t-2
t-1 t
t+1
t+2
t+3
t+4
t+5
t+6
t+7
t+8
t+9
t+1
0t+
11
t+1
2t+
13
t+1
4t+
15
SG Non-SG
2
4
6
8
t-5
t-4
t-3
t-2
t-1 t
t+1
t+2
t+3
t+4
t+5
t+6
t+7
t+8
t+9
t+1
0t+
11
t+1
2t+
13
t+1
4t+
15
SG Non-SG
Figure 7. SGs vs. Non-SGs: Public Sector Finance
Fiscal Balance/GDP ODA Excluding Debt Relief/GDP
Source: IMF, World Economic Outlook; OECD, OECD.Stat; and authors' calculations.Note: Five-year moving average.
19
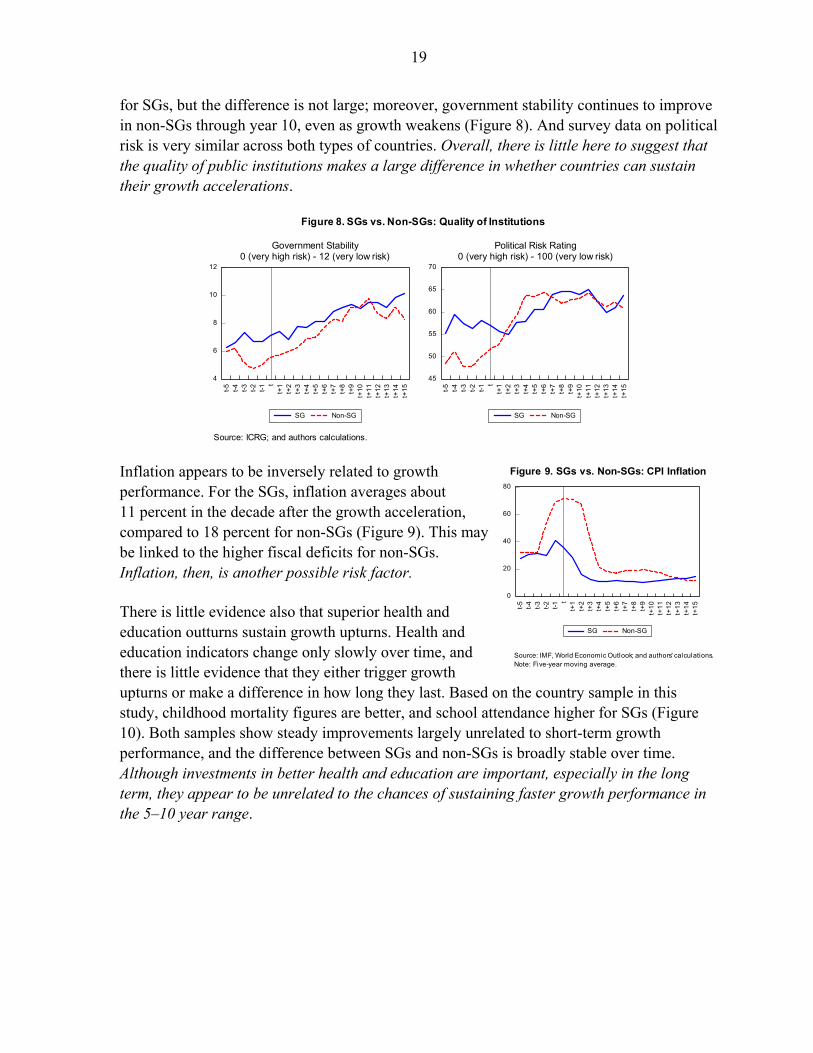
for SGs, but the difference is not large; moreover, government stability continues to improve in non-SGs through year 10, even as growth weakens (Figure 8). And survey data on political risk is very similar across both types of countries. Overall, there is little here to suggest that the quality of public institutions makes a large difference in whether countries can sustain their growth accelerations.
Inflation appears to be inversely related to growth performance. For the SGs, inflation averages about 11 percent in the decade after the growth acceleration, compared to 18 percent for non-SGs (Figure 9). This may be linked to the higher fiscal deficits for non-SGs. Inflation, then, is another possible risk factor.
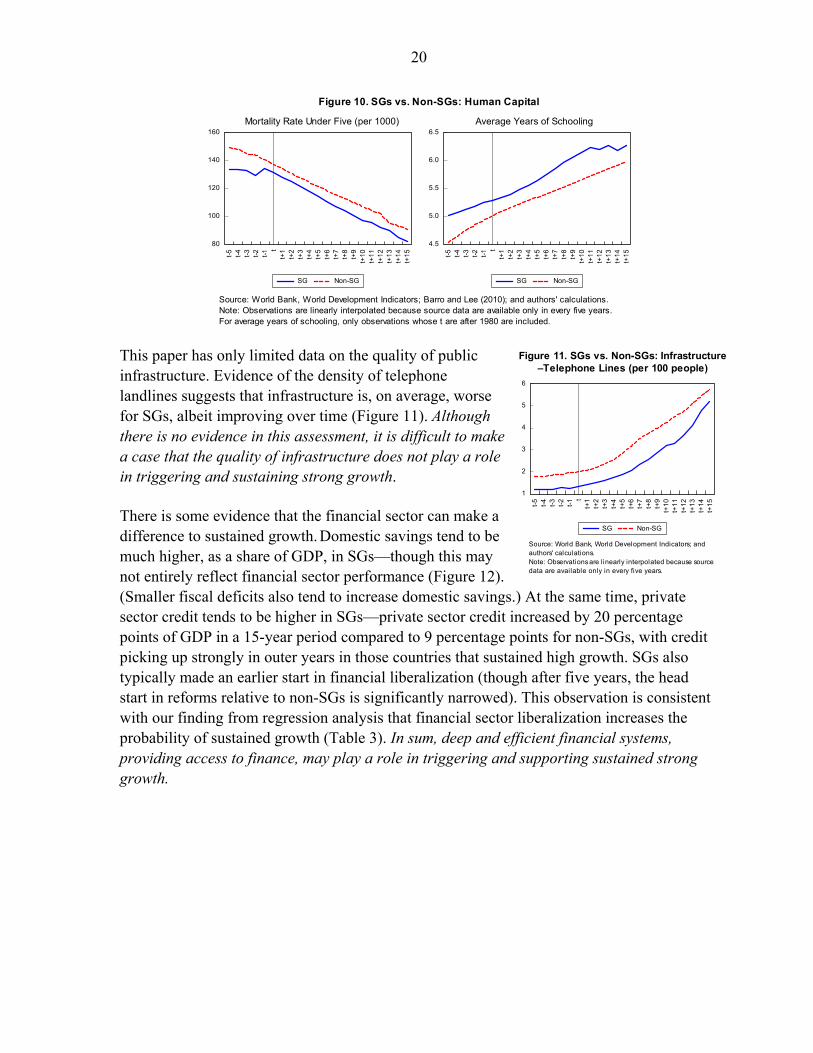
There is little evidence also that superior health and education outturns sustain growth upturns. Health and education indicators change only slowly over time, and there is little evidence that they either trigger growth upturns or make a difference in how long they last. Based on the country sample in this study, childhood mortality figures are better, and school attendance higher for SGs (Figure 10). Both samples show steady improvements largely unrelated to short-term growth performance, and the difference between SGs and non-SGs is broadly stable over time. Although investments in better health and education are important, especially in the long term, they appear to be unrelated to the chances of sustaining faster growth performance in the 5–10 year range.
4
6
8
10
12
t-5
t-4
t-3
t-2
t-1 t
t+1
t+2
t+3
t+4
t+5
t+6
t+7
t+8
t+9
t+1
0t+
11
t+1
2t+
13
t+1
4t+
15
SG Non-SG
45
50
55
60
65
70
t-5
t-4
t-3
t-2
t-1 t
t+1
t+2
t+3
t+4
t+5
t+6
t+7
t+8
t+9
t+1
0t+
11
t+1
2t+
13
t+1
4t+
15
SG Non-SG
Figure 8. SGs vs. Non-SGs: Quality of Institutions
Government Stability0 (very high risk) - 12 (very low risk)
Political Risk Rating0 (very high risk) - 100 (very low risk)
Source: ICRG; and authors calculations.
0
20
40
60
80
t-5
t-4
t-3
t-2
t-1 t
t+1
t+2
t+3
t+4
t+5
t+6
t+7
t+8
t+9
t+1
0t+
11
t+1
2t+
13
t+1
4t+
15
SG Non-SG
Figure 9. SGs vs. Non-SGs: CPI Inflation
Source: IMF, World Economic Outlook; and authors' calculations.Note: Five-year moving average.
20
This paper has only limited data on the quality of public infrastructure. Evidence of the density of telephone landlines suggests that infrastructure is, on average, worse for SGs, albeit improving over time (Figure 11). Although there is no evidence in this assessment, it is difficult to make a case that the quality of infrastructure does not play a role in triggering and sustaining strong growth.
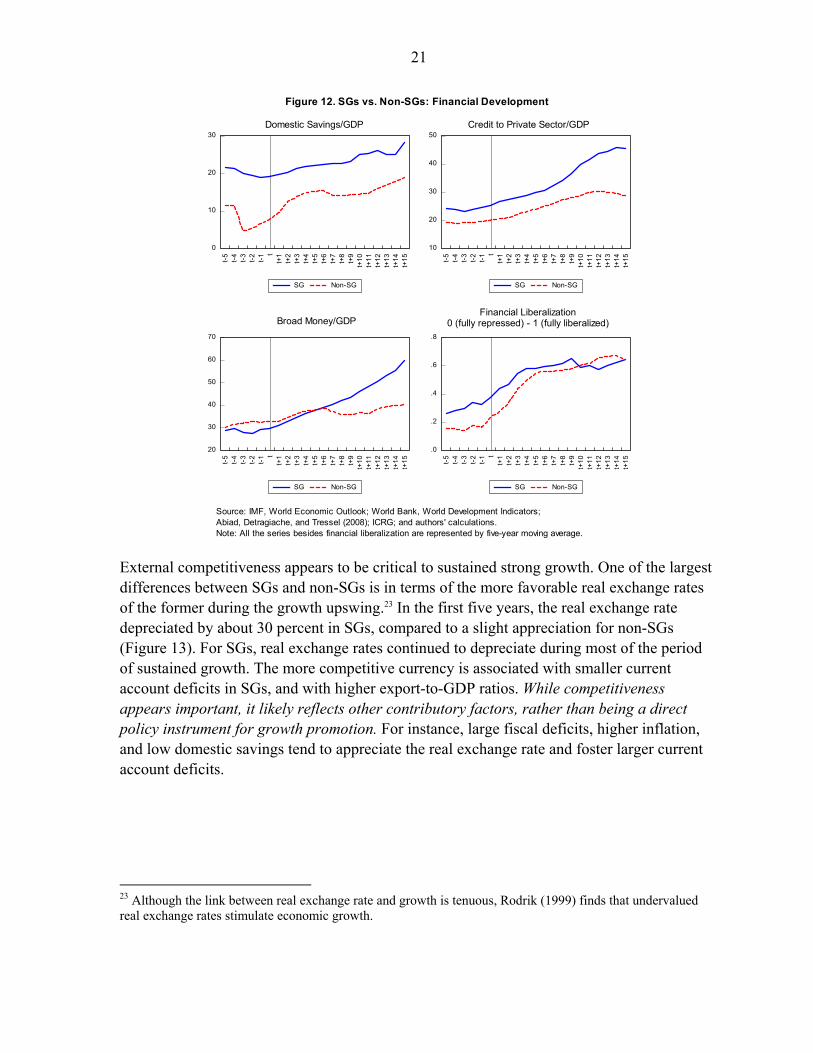
There is some evidence that the financial sector can make a difference to sustained growth. Domestic savings tend to be much higher, as a share of GDP, in SGs—though this may not entirely reflect financial sector performance (Figure 12). (Smaller fiscal deficits also tend to increase domestic savings.) At the same time, private sector credit tends to be higher in SGs—private sector credit increased by 20 percentage points of GDP in a 15-year period compared to 9 percentage points for non-SGs, with credit picking up strongly in outer years in those countries that sustained high growth. SGs also typically made an earlier start in financial liberalization (though after five years, the head start in reforms relative to non-SGs is significantly narrowed). This observation is consistent with our finding from regression analysis that financial sector liberalization increases the probability of sustained growth (Table 3). In sum, deep and efficient financial systems, providing access to finance, may play a role in triggering and supporting sustained strong growth.
80
100
120
140
160
t-5
t-4
t-3
t-2
t-1 t
t+1
t+2
t+3
t+4
t+5
t+6
t+7
t+8
t+9
t+1
0t+
11
t+1
2t+
13
t+1
4t+
15
SG Non-SG
4.5
5.0
5.5
6.0
6.5
t-5
t-4
t-3
t-2
t-1 t
t+1
t+2
t+3
t+4
t+5
t+6
t+7
t+8
t+9
t+1
0t+
11
t+1
2t+
13
t+1
4t+
15
SG Non-SG
Figure 10. SGs vs. Non-SGs: Human Capital
Mortality Rate Under Five (per 1000) Average Years of Schooling
Source: World Bank, World Development Indicators; Barro and Lee (2010); and authors' calculations.Note: Observations are linearly interpolated because source data are available only in every five years.For average years of schooling, only observations whose t are after 1980 are included.
1
2
3
4
5
6
t-5
t-4
t-3
t-2
t-1 t
t+1
t+2
t+3
t+4
t+5
t+6
t+7
t+8
t+9
t+1
0t+
11
t+1
2t+
13
t+1
4t+
15
SG Non-SG
Figure 11. SGs vs. Non-SGs: Infrastructure–Telephone Lines (per 100 people)
Source: World Bank, World Development Indicators; andauthors' calculations.Note: Observations are linearly interpolated because sourcedata are available only in every five years.
21
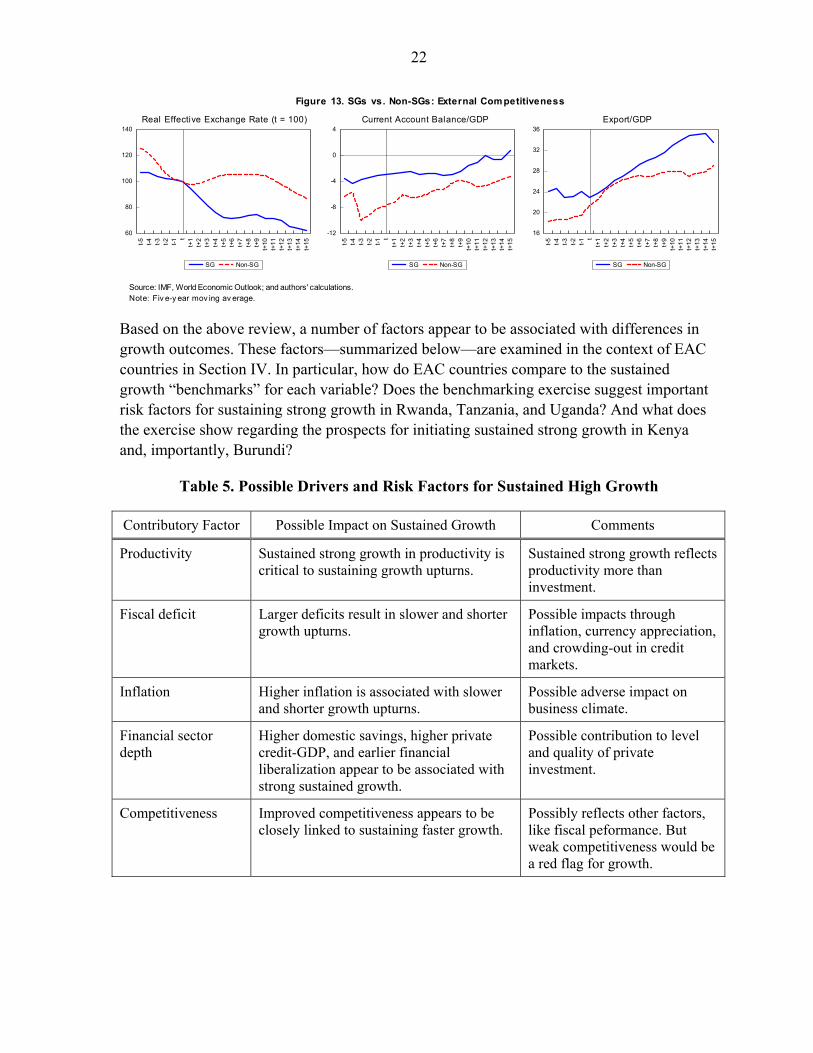
External competitiveness appears to be critical to sustained strong growth. One of the largest differences between SGs and non-SGs is in terms of the more favorable real exchange rates of the former during the growth upswing.23 In the first five years, the real exchange rate depreciated by about 30 percent in SGs, compared to a slight appreciation for non-SGs (Figure 13). For SGs, real exchange rates continued to depreciate during most of the period of sustained growth. The more competitive currency is associated with smaller current account deficits in SGs, and with higher export-to-GDP ratios. While competitiveness appears important, it likely reflects other contributory factors, rather than being a direct policy instrument for growth promotion. For instance, large fiscal deficits, higher inflation, and low domestic savings tend to appreciate the real exchange rate and foster larger current account deficits.
23 Although the link between real exchange rate and growth is tenuous, Rodrik (1999) finds that undervalued real exchange rates stimulate economic growth.
0
10
20
30
t-5
t-4
t-3
t-2
t-1 t
t+1
t+2
t+3
t+4
t+5
t+6
t+7
t+8
t+9
t+1
0t+
11
t+1
2t+
13
t+1
4t+
15
SG Non-SG
10
20
30
40
50
t-5
t-4
t-3
t-2
t-1 t
t+1
t+2
t+3
t+4
t+5
t+6
t+7
t+8
t+9
t+1
0t+
11
t+1
2t+
13
t+1
4t+
15
SG Non-SG
20
30
40
50
60
70
t-5
t-4
t-3
t-2
t-1 t
t+1
t+2
t+3
t+4
t+5
t+6
t+7
t+8
t+9
t+1
0t+
11
t+1
2t+
13
t+1
4t+
15
SG Non-SG
.0
.2
.4
.6
.8
t-5
t-4
t-3
t-2
t-1 t
t+1
t+2
t+3
t+4
t+5
t+6
t+7
t+8
t+9
t+1
0t+
11
t+1
2t+
13
t+1
4t+
15
SG Non-SG
Figure 12. SGs vs. Non-SGs: Financial Development
Domestic Savings/GDP Credit to Private Sector/GDP
Broad Money/GDPFinancial Liberalization
0 (fully repressed) - 1 (fully liberalized)
Source: IMF, World Economic Outlook; World Bank, World Development Indicators;Abiad, Detragiache, and Tressel (2008); ICRG; and authors' calculations.Note: All the series besides financial liberalization are represented by five-year moving average.
22
Based on the above review, a number of factors appear to be associated with differences in growth outcomes. These factors—summarized below—are examined in the context of EAC countries in Section IV. In particular, how do EAC countries compare to the sustained growth “benchmarks” for each variable? Does the benchmarking exercise suggest important risk factors for sustaining strong growth in Rwanda, Tanzania, and Uganda? And what does the exercise show regarding the prospects for initiating sustained strong growth in Kenya and, importantly, Burundi?
Table 5. Possible Drivers and Risk Factors for Sustained High Growth
Contributory Factor Possible Impact on Sustained Growth Comments
Productivity Sustained strong growth in productivity is critical to sustaining growth upturns.
Sustained strong growth reflects productivity more than investment.
Fiscal deficit Larger deficits result in slower and shorter growth upturns.
Possible impacts through inflation, currency appreciation, and crowding-out in credit markets.
Inflation Higher inflation is associated with slower and shorter growth upturns.
Possible adverse impact on business climate.
Financial sector depth
Higher domestic savings, higher private credit-GDP, and earlier financial liberalization appear to be associated with strong sustained growth.
Possible contribution to level and quality of private investment.
Competitiveness Improved competitiveness appears to be closely linked to sustaining faster growth.
Possibly reflects other factors, like fiscal peformance. But weak competitiveness would be a red flag for growth.
60
80
100
120
140
t-5 t-4 t-3 t-2 t-1t
t+1
t+2
t+3
t+4
t+5
t+6
t+7
t+8
t+9
t+10
t+11
t+12
t+13
t+14
t+15
SG Non-SG
-12
-8
-4
0
4
t-5 t-4 t-3 t-2 t-1t
t+1
t+2
t+3
t+4
t+5
t+6
t+7
t+8
t+9
t+10
t+11
t+12
t+13
t+14
t+15
SG Non-SG
16
20
24
28
32
36
t-5 t-4 t-3 t-2 t-1t
t+1
t+2
t+3
t+4
t+5
t+6
t+7
t+8
t+9
t+10
t+11
t+12
t+13
t+14
t+15
SG Non-SG
Figure 13. SGs vs. Non-SGs: External Competitiveness
Real Effective Exchange Rate (t = 100) Current Account Balance/GDP Export/GDP
Source: IMF, World Economic Outlook; and authors' calculations.Note: Fiv e-y ear mov ing av erage.
23
IV. HOW DOES GROWTH IN THE EAC COMPARE TO OTHER HIGH-GROWTH COUNTRIES? A BENCHMARKING EXERCISE
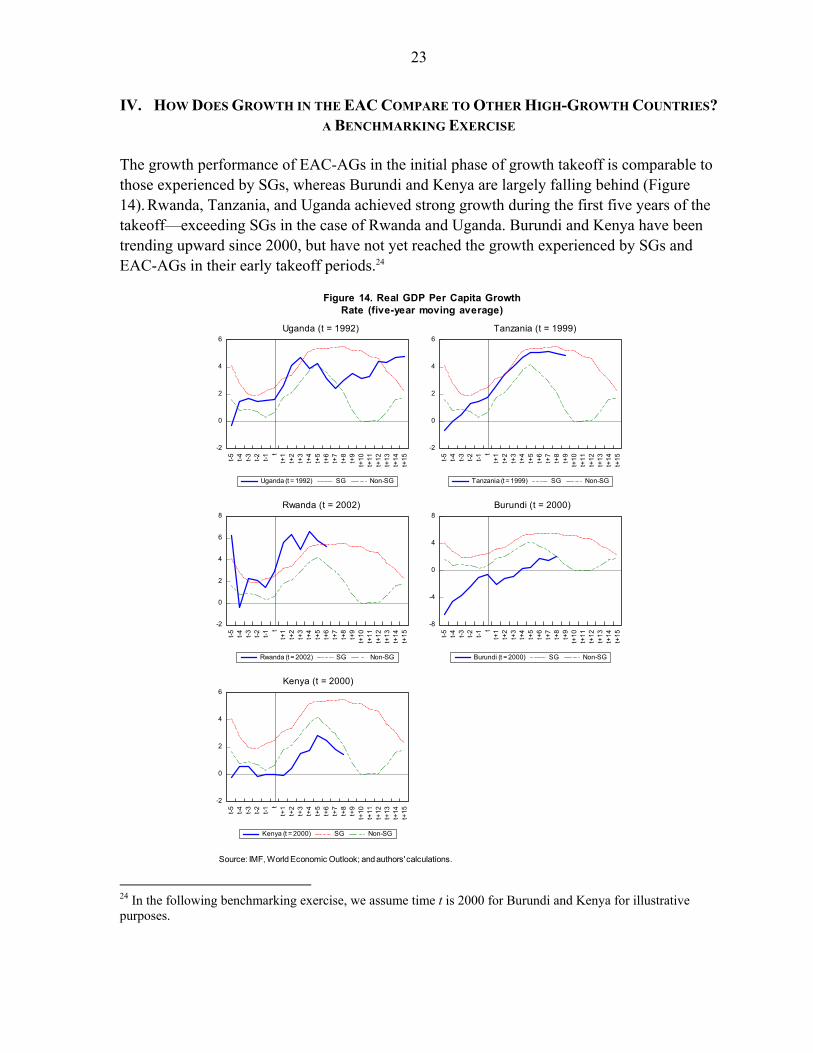
The growth performance of EAC-AGs in the initial phase of growth takeoff is comparable to those experienced by SGs, whereas Burundi and Kenya are largely falling behind (Figure 14). Rwanda, Tanzania, and Uganda achieved strong growth during the first five years of the takeoff—exceeding SGs in the case of Rwanda and Uganda. Burundi and Kenya have been trending upward since 2000, but have not yet reached the growth experienced by SGs and EAC-AGs in their early takeoff periods.24
24 In the following benchmarking exercise, we assume time t is 2000 for Burundi and Kenya for illustrative purposes.
-2
0
2
4
6
t-5
t-4
t-3
t-2
t-1 t
t+1
t+2
t+3
t+4
t+5
t+6
t+7
t+8
t+9
t+1
0t+
11
t+1
2t+
13
t+1
4t+
15
Uganda (t = 1992) SG Non-SG
-2
0
2
4
6
t-5
t-4
t-3
t-2
t-1 t
t+1
t+2
t+3
t+4
t+5
t+6
t+7
t+8
t+9
t+1
0t+
11
t+1
2t+
13
t+1
4t+
15
Tanzania (t = 1999) SG Non-SG
-2
0
2
4
6
8
t-5
t-4
t-3
t-2
t-1 t
t+1
t+2
t+3
t+4
t+5
t+6
t+7
t+8
t+9
t+1
0t+
11
t+1
2t+
13
t+1
4t+
15
Rwanda (t = 2002) SG Non-SG
-8
-4
0
4
8
t-5
t-4
t-3
t-2
t-1 t
t+1
t+2
t+3
t+4
t+5
t+6
t+7
t+8
t+9
t+1
0t+
11
t+1
2t+
13
t+1
4t+
15
Burundi (t = 2000) SG Non-SG
-2
0
2
4
6
t-5
t-4
t-3
t-2
t-1 t
t+1
t+2
t+3
t+4
t+5
t+6
t+7
t+8
t+9
t+1
0t+
11
t+1
2t+
13
t+1
4t+
15
Kenya (t = 2000) SG Non-SG
Uganda (t = 1992) Tanzania (t = 1999)
Rwanda (t = 2002) Burundi (t = 2000)
Kenya (t = 2000)
Source: IMF, World Economic Outlook; and authors' calculations.
Figure 14. Real GDP Per Capita GrowthRate (five-year moving average)
24
Sustaining growth for EAC-AGs, however, has been more difficult. Only Tanzania has sustained high growth beyond the critical five-year mark—when growth rates started to trend down in non-SGs. Growth rates in Uganda were sharply lower in the second five-year period, before rising in later years. In Rwanda, growth rates have been more erratic, but are recently trending downward.
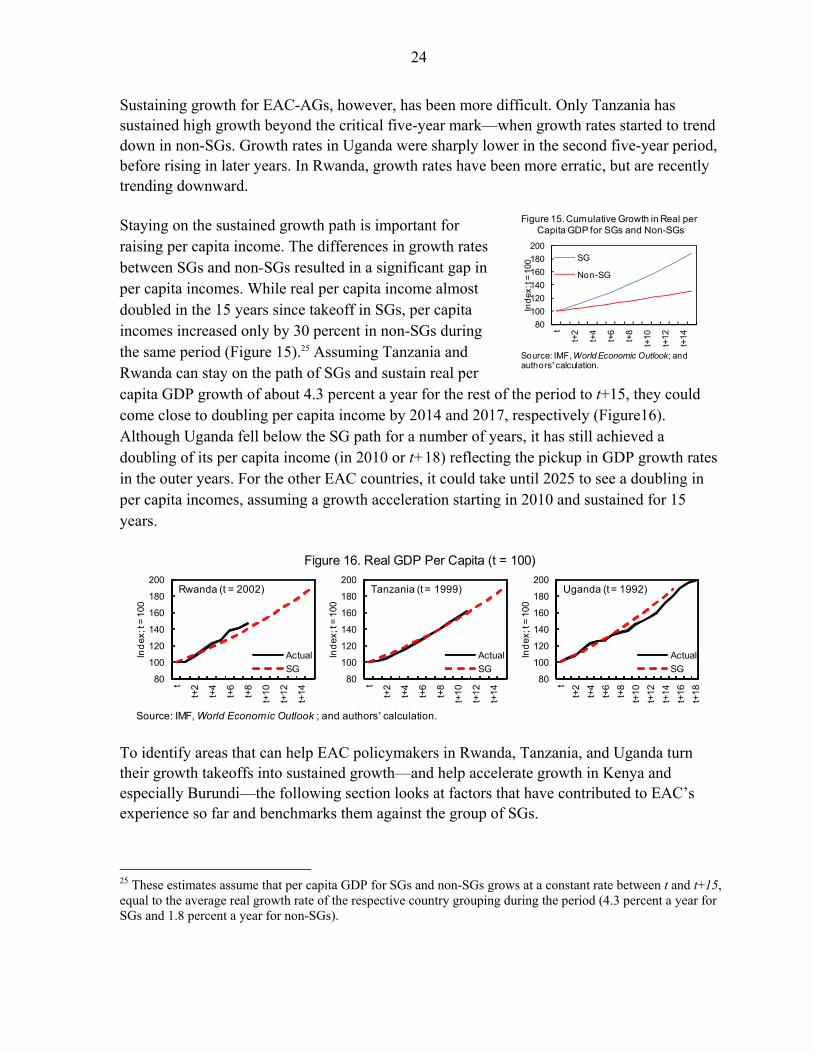
Staying on the sustained growth path is important for raising per capita income. The differences in growth rates between SGs and non-SGs resulted in a significant gap in per capita incomes. While real per capita income almost doubled in the 15 years since takeoff in SGs, per capita incomes increased only by 30 percent in non-SGs during the same period (Figure 15).25 Assuming Tanzania and Rwanda can stay on the path of SGs and sustain real per capita GDP growth of about 4.3 percent a year for the rest of the period to t+15, they could come close to doubling per capita income by 2014 and 2017, respectively (Figure16). Although Uganda fell below the SG path for a number of years, it has still achieved a doubling of its per capita income (in 2010 or t+18) reflecting the pickup in GDP growth rates in the outer years. For the other EAC countries, it could take until 2025 to see a doubling in per capita incomes, assuming a growth acceleration starting in 2010 and sustained for 15 years.
To identify areas that can help EAC policymakers in Rwanda, Tanzania, and Uganda turn their growth takeoffs into sustained growth—and help accelerate growth in Kenya and especially Burundi—the following section looks at factors that have contributed to EAC’s experience so far and benchmarks them against the group of SGs.
25 These estimates assume that per capita GDP for SGs and non-SGs grows at a constant rate between t and t+15, equal to the average real growth rate of the respective country grouping during the period (4.3 percent a year for SGs and 1.8 percent a year for non-SGs).
Source: IMF, World Economic Outlook ; and authors' calculation.
Figure 16. Real GDP Per Capita (t = 100)
80
100
120
140
160
180
200
t
t+2
t+4
t+6
t+8
t+10
t+12
t+14
Ind
ex; t
= 1
00
Actual
SG
Rwanda (t = 2002)
80
100
120
140
160
180
200
t
t+2
t+4
t+6
t+8
t+10
t+12
t+14
Ind
ex; t
= 1
00
Actual
SG
Tanzania (t = 1999)
80
100
120
140
160
180
200
t
t+2
t+4
t+6
t+8
t+10
t+12
t+14
t+16
t+18
Ind
ex; t
= 1
00
Actual
SG
Uganda (t = 1992)
80
100
120
140
160
180
200
t
t+2
t+4
t+6
t+8
t+10
t+12
t+14
Ind
ex; t
= 1
00
SG
Non-SG
Figure 15. Cumulative Growth in Real per Capita GDP for SGs and Non-SGs
Source: IMF, World Economic Outlook; andauthors' calculation.
25
A. Investment and Productivity
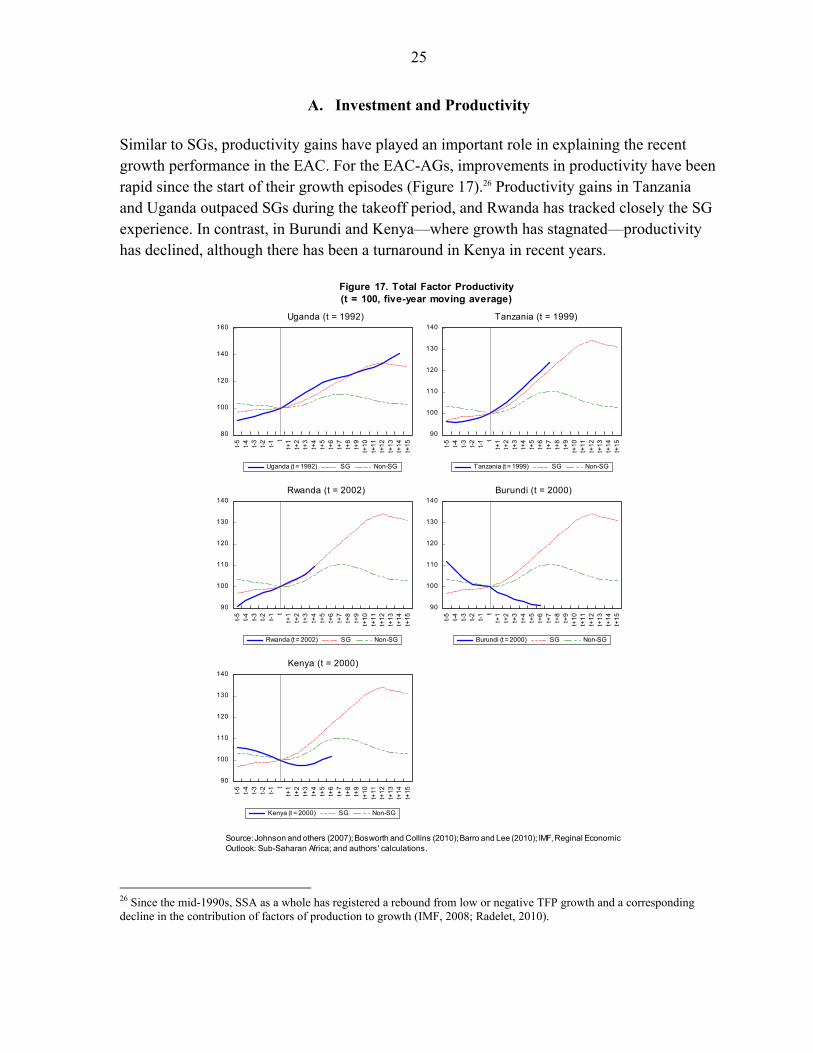
Similar to SGs, productivity gains have played an important role in explaining the recent growth performance in the EAC. For the EAC-AGs, improvements in productivity have been rapid since the start of their growth episodes (Figure 17).26 Productivity gains in Tanzania and Uganda outpaced SGs during the takeoff period, and Rwanda has tracked closely the SG experience. In contrast, in Burundi and Kenya—where growth has stagnated—productivity has declined, although there has been a turnaround in Kenya in recent years.
26 Since the mid-1990s, SSA as a whole has registered a rebound from low or negative TFP growth and a corresponding decline in the contribution of factors of production to growth (IMF, 2008; Radelet, 2010).
80
100
120
140
160
t-5
t-4
t-3
t-2
t-1 t
t+1
t+2
t+3
t+4
t+5
t+6
t+7
t+8
t+9
t+1
0t+
11
t+1
2t+
13
t+1
4t+
15
Uganda (t = 1992) SG Non-SG
90
100
110
120
130
140
t-5
t-4
t-3
t-2
t-1 t
t+1
t+2
t+3
t+4
t+5
t+6
t+7
t+8
t+9
t+1
0t+
11
t+1
2t+
13
t+1
4t+
15
Tanzania (t = 1999) SG Non-SG
90
100
110
120
130
140
t-5
t-4
t-3
t-2
t-1 t
t+1
t+2
t+3
t+4
t+5
t+6
t+7
t+8
t+9
t+1
0t+
11
t+1
2t+
13
t+1
4t+
15
Rwanda (t = 2002) SG Non-SG
90
100
110
120
130
140
t-5
t-4
t-3
t-2
t-1 t
t+1
t+2
t+3
t+4
t+5
t+6
t+7
t+8
t+9
t+1
0t+
11
t+1
2t+
13
t+1
4t+
15
Burundi (t = 2000) SG Non-SG
90
100
110
120
130
140
t-5
t-4
t-3
t-2
t-1 t
t+1
t+2
t+3
t+4
t+5
t+6
t+7
t+8
t+9
t+1
0t+
11
t+1
2t+
13
t+1
4t+
15
Kenya (t = 2000) SG Non-SG
Uganda (t = 1992) Tanzania (t = 1999)
Rwanda (t = 2002) Burundi (t = 2000)
Kenya (t = 2000)
Figure 17. Total Factor Productivity(t = 100, five-year moving average)
Source: Johnson and others (2007); Bosworth and Collins (2010); Barro and Lee (2010); IMF, Reginal EconomicOutlook: Sub-Saharan Africa; and authors' calculations.
26
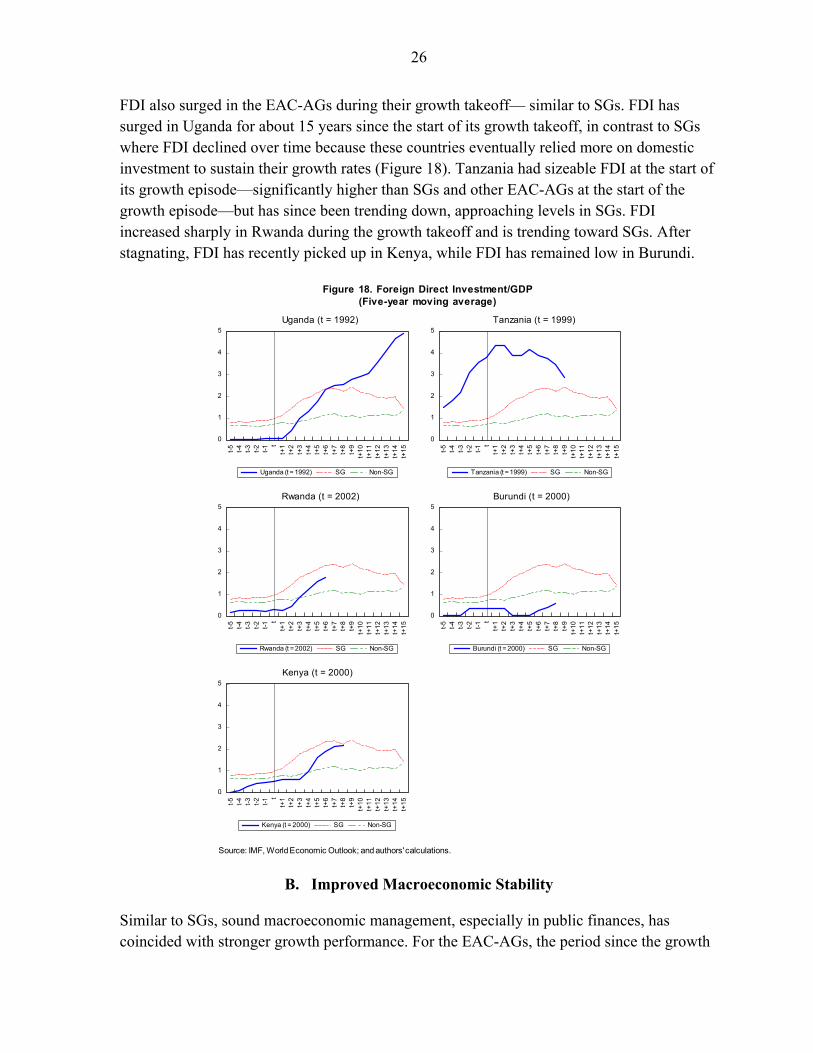
FDI also surged in the EAC-AGs during their growth takeoff— similar to SGs. FDI has surged in Uganda for about 15 years since the start of its growth takeoff, in contrast to SGs where FDI declined over time because these countries eventually relied more on domestic investment to sustain their growth rates (Figure 18). Tanzania had sizeable FDI at the start of its growth episode—significantly higher than SGs and other EAC-AGs at the start of the growth episode—but has since been trending down, approaching levels in SGs. FDI increased sharply in Rwanda during the growth takeoff and is trending toward SGs. After stagnating, FDI has recently picked up in Kenya, while FDI has remained low in Burundi.
B. Improved Macroeconomic Stability
Similar to SGs, sound macroeconomic management, especially in public finances, has coincided with stronger growth performance. For the EAC-AGs, the period since the growth
0
1
2
3
4
5
t-5
t-4
t-3
t-2
t-1 t
t+1
t+2
t+3
t+4
t+5
t+6
t+7
t+8
t+9
t+1
0t+
11
t+1
2t+
13
t+1
4t+
15
Uganda (t = 1992) SG Non-SG
0
1
2
3
4
5
t-5
t-4
t-3
t-2
t-1 t
t+1
t+2
t+3
t+4
t+5
t+6
t+7
t+8
t+9
t+1
0t+
11
t+1
2t+
13
t+1
4t+
15
Tanzania (t = 1999) SG Non-SG
0
1
2
3
4
5
t-5
t-4
t-3
t-2
t-1 t
t+1
t+2
t+3
t+4
t+5
t+6
t+7
t+8
t+9
t+1
0t+
11
t+1
2t+
13
t+1
4t+
15
Rwanda (t = 2002) SG Non-SG
0
1
2
3
4
5
t-5
t-4
t-3
t-2
t-1 t
t+1
t+2
t+3
t+4
t+5
t+6
t+7
t+8
t+9
t+1
0t+
11
t+1
2t+
13
t+1
4t+
15
Burundi (t = 2000) SG Non-SG
0
1
2
3
4
5
t-5
t-4
t-3
t-2
t-1 t
t+1
t+2
t+3
t+4
t+5
t+6
t+7
t+8
t+9
t+10
t+11
t+12
t+13
t+14
t+15
Kenya (t = 2000) SG Non-SG
Uganda (t = 1992) Tanzania (t = 1999)
Rwanda (t = 2002) Burundi (t = 2000)
Kenya (t = 2000)
Source: IMF, World Economic Outlook; and authors' calculations.
Figure 18. Foreign Direct Investment/GDP(Five-year moving average)
27
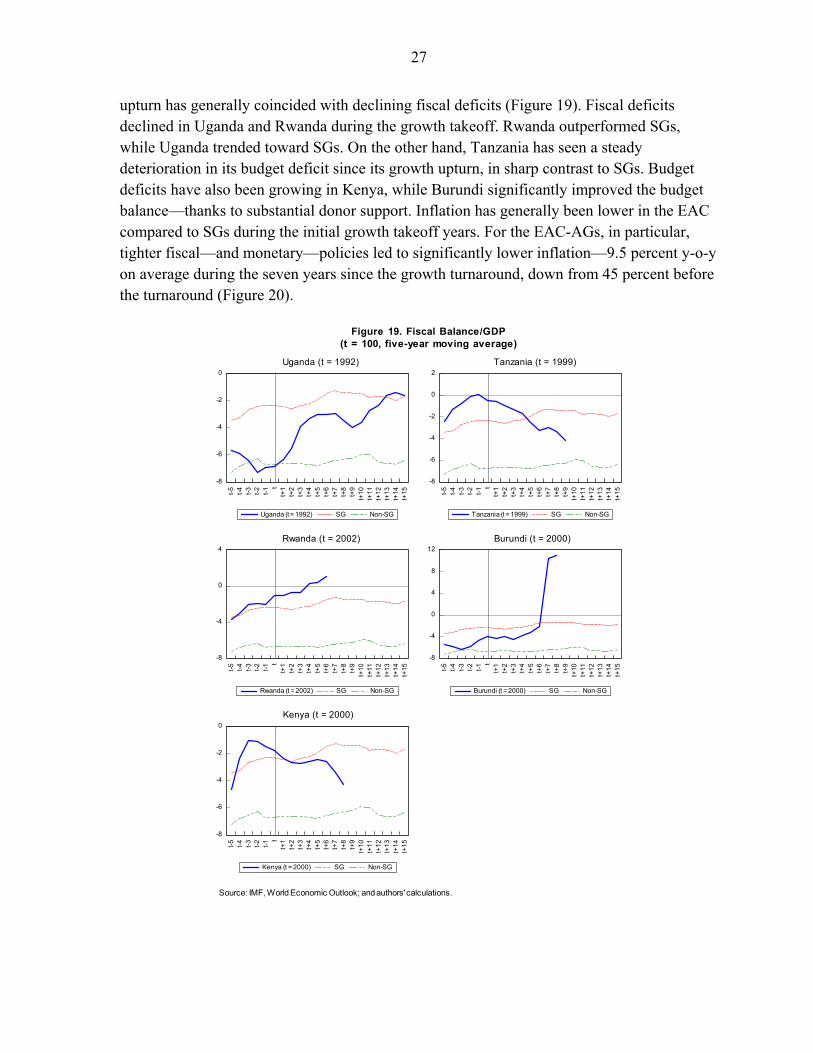
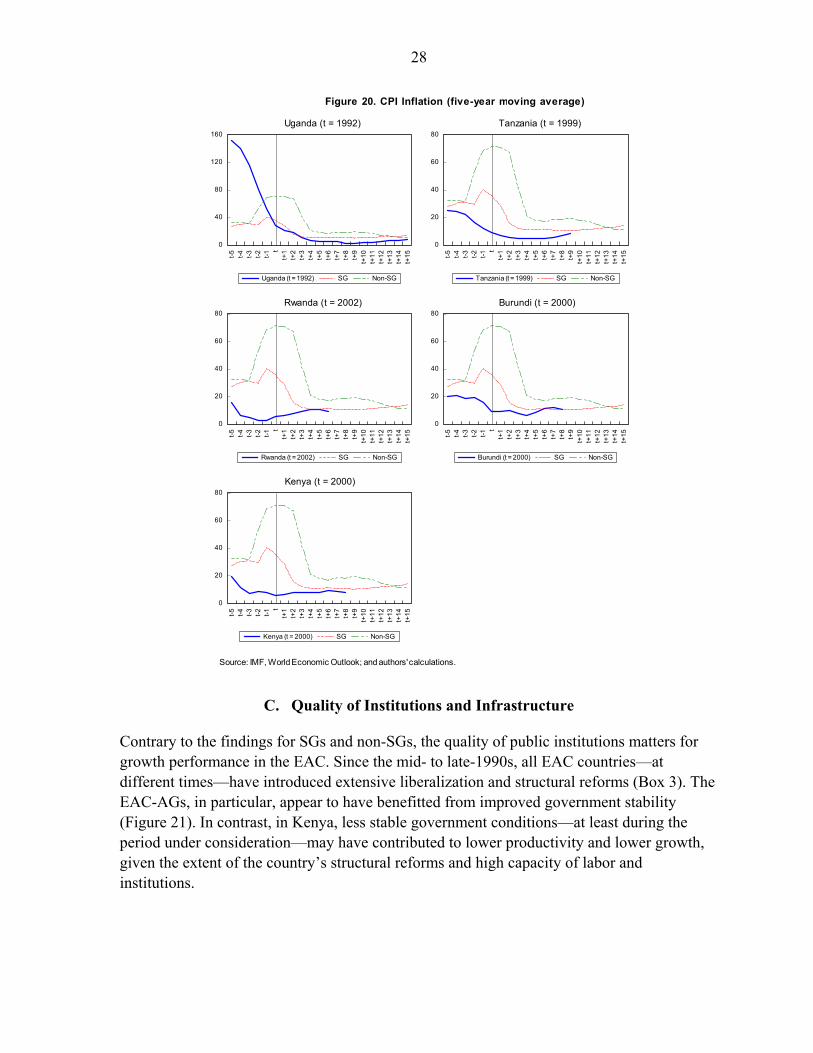
upturn has generally coincided with declining fiscal deficits (Figure 19). Fiscal deficits declined in Uganda and Rwanda during the growth takeoff. Rwanda outperformed SGs, while Uganda trended toward SGs. On the other hand, Tanzania has seen a steady deterioration in its budget deficit since its growth upturn, in sharp contrast to SGs. Budget deficits have also been growing in Kenya, while Burundi significantly improved the budget balance—thanks to substantial donor support. Inflation has generally been lower in the EAC compared to SGs during the initial growth takeoff years. For the EAC-AGs, in particular, tighter fiscal—and monetary—policies led to significantly lower inflation—9.5 percent y-o-y on average during the seven years since the growth turnaround, down from 45 percent before the turnaround (Figure 20).
-8
-6
-4
-2
0
t-5
t-4
t-3
t-2
t-1 t
t+1
t+2
t+3
t+4
t+5
t+6
t+7
t+8
t+9
t+1
0t+
11
t+1
2t+
13
t+1
4t+
15
Uganda (t = 1992) SG Non-SG
-8
-6
-4
-2
0
2
t-5
t-4
t-3
t-2
t-1 t
t+1
t+2
t+3
t+4
t+5
t+6
t+7
t+8
t+9
t+1
0t+
11
t+1
2t+
13
t+1
4t+
15
Tanzania (t = 1999) SG Non-SG
-8
-4
0
4
t-5
t-4
t-3
t-2
t-1 t
t+1
t+2
t+3
t+4
t+5
t+6
t+7
t+8
t+9
t+10
t+11
t+12
t+13
t+14
t+15
Rwanda (t = 2002) SG Non-SG
-8
-4
0
4
8
12
t-5
t-4
t-3
t-2
t-1 t
t+1
t+2
t+3
t+4
t+5
t+6
t+7
t+8
t+9
t+10
t+11
t+12
t+13
t+14
t+15
Burundi (t = 2000) SG Non-SG
-8
-6
-4
-2
0
t-5
t-4
t-3
t-2
t-1 t
t+1
t+2
t+3
t+4
t+5
t+6
t+7
t+8
t+9
t+1
0t+
11
t+1
2t+
13
t+1
4t+
15
Kenya (t = 2000) SG Non-SG
Uganda (t = 1992) Tanzania (t = 1999)
Rwanda (t = 2002) Burundi (t = 2000)
Kenya (t = 2000)
Source: IMF, World Economic Outlook; and authors' calculations.
Figure 19. Fiscal Balance/GDP(t = 100, five-year moving average)
28
C. Quality of Institutions and Infrastructure
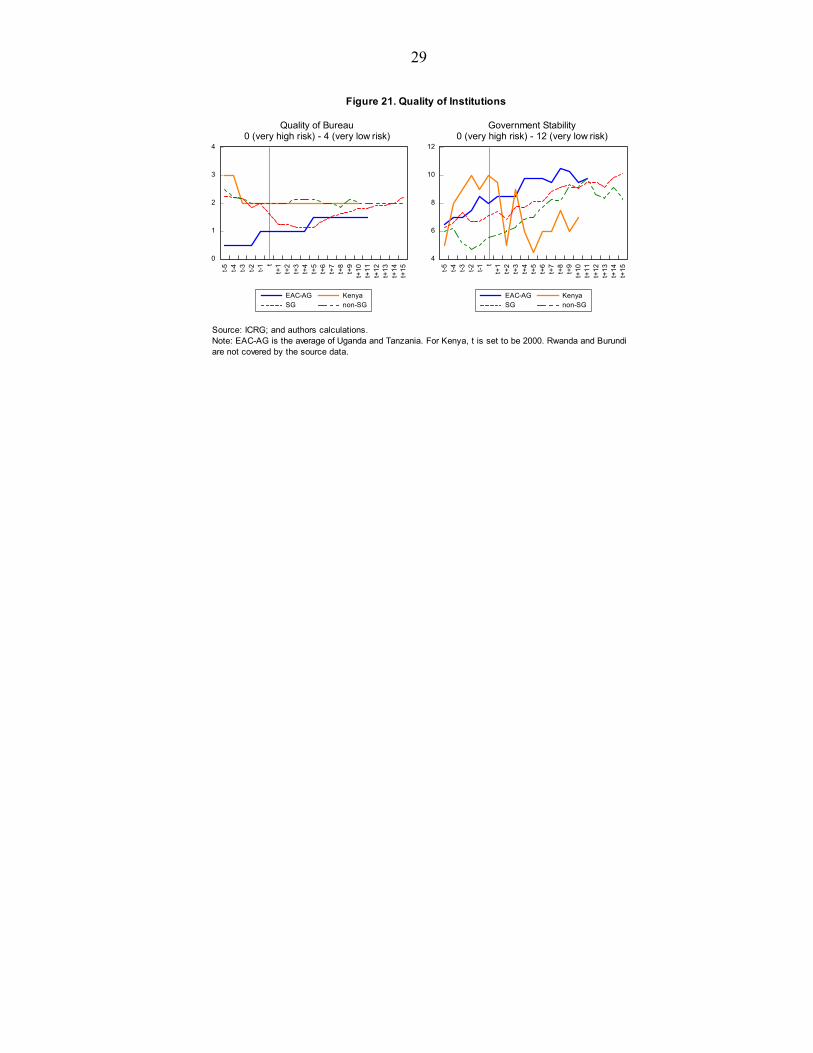
Contrary to the findings for SGs and non-SGs, the quality of public institutions matters for growth performance in the EAC. Since the mid- to late-1990s, all EAC countries—at different times—have introduced extensive liberalization and structural reforms (Box 3). The EAC-AGs, in particular, appear to have benefitted from improved government stability (Figure 21). In contrast, in Kenya, less stable government conditions—at least during the period under consideration—may have contributed to lower productivity and lower growth, given the extent of the country’s structural reforms and high capacity of labor and institutions.
0
40
80
120
160
t-5
t-4
t-3
t-2
t-1 t
t+1
t+2
t+3
t+4
t+5
t+6
t+7
t+8
t+9
t+1
0t+
11
t+1
2t+
13
t+1
4t+
15
Uganda (t = 1992) SG Non-SG
0
20
40
60
80
t-5
t-4
t-3
t-2
t-1 t
t+1
t+2
t+3
t+4
t+5
t+6
t+7
t+8
t+9
t+1
0t+
11
t+1
2t+
13
t+1
4t+
15
Tanzania (t = 1999) SG Non-SG
0
20
40
60
80
t-5
t-4
t-3
t-2
t-1 t
t+1
t+2
t+3
t+4
t+5
t+6
t+7
t+8
t+9
t+1
0t+
11
t+1
2t+
13
t+1
4t+
15
Rwanda (t = 2002) SG Non-SG
0
20
40
60
80
t-5
t-4
t-3
t-2
t-1 t
t+1
t+2
t+3
t+4
t+5
t+6
t+7
t+8
t+9
t+1
0t+
11
t+1
2t+
13
t+1
4t+
15
Burundi (t = 2000) SG Non-SG
0
20
40
60
80
t-5
t-4
t-3
t-2
t-1 t
t+1
t+2
t+3
t+4
t+5
t+6
t+7
t+8
t+9
t+1
0t+
11
t+1
2t+
13
t+1
4t+
15
Kenya (t = 2000) SG Non-SG
Uganda (t = 1992) Tanzania (t = 1999)
Rwanda (t = 2002) Burundi (t = 2000)
Kenya (t = 2000)
Source: IMF, World Economic Outlook; and authors' calculations.
Figure 20. CPI Inflation (five-year moving average)
29
0
1
2
3
4
t-5
t-4
t-3
t-2
t-1 t
t+1
t+2
t+3
t+4
t+5
t+6
t+7
t+8
t+9
t+1
0t+
11
t+1
2t+
13
t+1
4t+
15
EAC-AG KenyaSG non-SG
4
6
8
10
12
t-5
t-4
t-3
t-2
t-1 t
t+1
t+2
t+3
t+4
t+5
t+6
t+7
t+8
t+9
t+1
0t+
11
t+1
2t+
13
t+1
4t+
15
EAC-AG KenyaSG non-SG
Figure 21. Quality of Institutions
Quality of Bureau0 (very high risk) - 4 (very low risk)
Government Stability0 (very high risk) - 12 (very low risk)
Source: ICRG; and authors calculations.Note: EAC-AG is the average of Uganda and Tanzania. For Kenya, t is set to be 2000. Rwanda and Burundiare not covered by the source data.
30
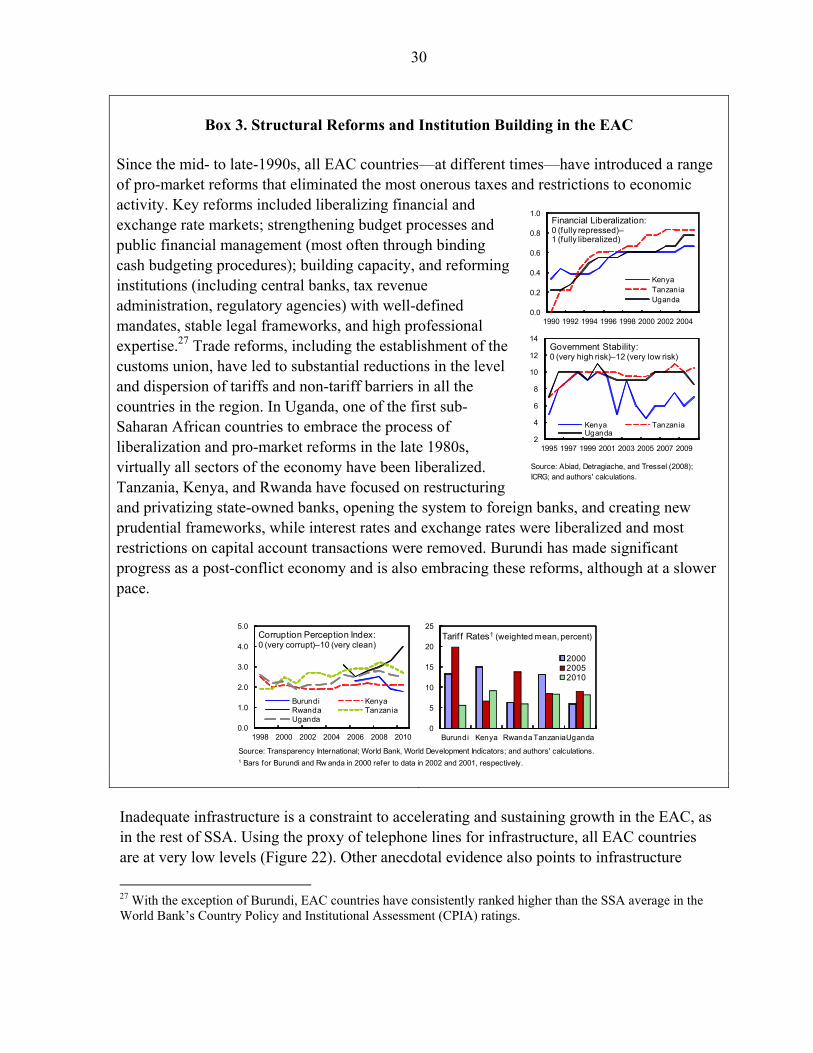
Box 3. Structural Reforms and Institution Building in the EAC
Since the mid- to late-1990s, all EAC countries—at different times—have introduced a range of pro-market reforms that eliminated the most onerous taxes and restrictions to economic activity. Key reforms included liberalizing financial and exchange rate markets; strengthening budget processes and public financial management (most often through binding cash budgeting procedures); building capacity, and reforming institutions (including central banks, tax revenue administration, regulatory agencies) with well-defined mandates, stable legal frameworks, and high professional expertise.27 Trade reforms, including the establishment of the customs union, have led to substantial reductions in the level and dispersion of tariffs and non-tariff barriers in all the countries in the region. In Uganda, one of the first sub-Saharan African countries to embrace the process of liberalization and pro-market reforms in the late 1980s, virtually all sectors of the economy have been liberalized. Tanzania, Kenya, and Rwanda have focused on restructuring and privatizing state-owned banks, opening the system to foreign banks, and creating new prudential frameworks, while interest rates and exchange rates were liberalized and most restrictions on capital account transactions were removed. Burundi has made significant progress as a post-conflict economy and is also embracing these reforms, although at a slower pace.
Inadequate infrastructure is a constraint to accelerating and sustaining growth in the EAC, as in the rest of SSA. Using the proxy of telephone lines for infrastructure, all EAC countries are at very low levels (Figure 22). Other anecdotal evidence also points to infrastructure
27 With the exception of Burundi, EAC countries have consistently ranked higher than the SSA average in the World Bank’s Country Policy and Institutional Assessment (CPIA) ratings.
Source: Transparency International; World Bank, World Development Indicators; and authors' calculations.1 Bars for Burundi and Rw anda in 2000 refer to data in 2002 and 2001, respectively.
0.0
1.0
2.0
3.0
4.0
5.0
1998 2000 2002 2004 2006 2008 2010
Burundi KenyaRwanda TanzaniaUganda
Corruption Perception Index:0 (very corrupt)–10 (very clean)
0
5
10
15
20
25
Burundi Kenya RwandaTanzaniaUganda
200020052010
Tarif f Rates1 (weighted mean, percent)
Source: Abiad, Detragiache, and Tressel (2008); ICRG; and authors' calculations.
0.0
0.2
0.4
0.6
0.8
1.0
1990 1992 1994 1996 1998 2000 2002 2004
KenyaTanzaniaUganda
Financial Liberalization:0 (fully repressed)–1 (fully liberalized)
2
4
6
8
10
12
14
1995 1997 1999 2001 2003 2005 2007 2009
Kenya TanzaniaUganda
Government Stability:0 (very high risk)–12 (very low risk)
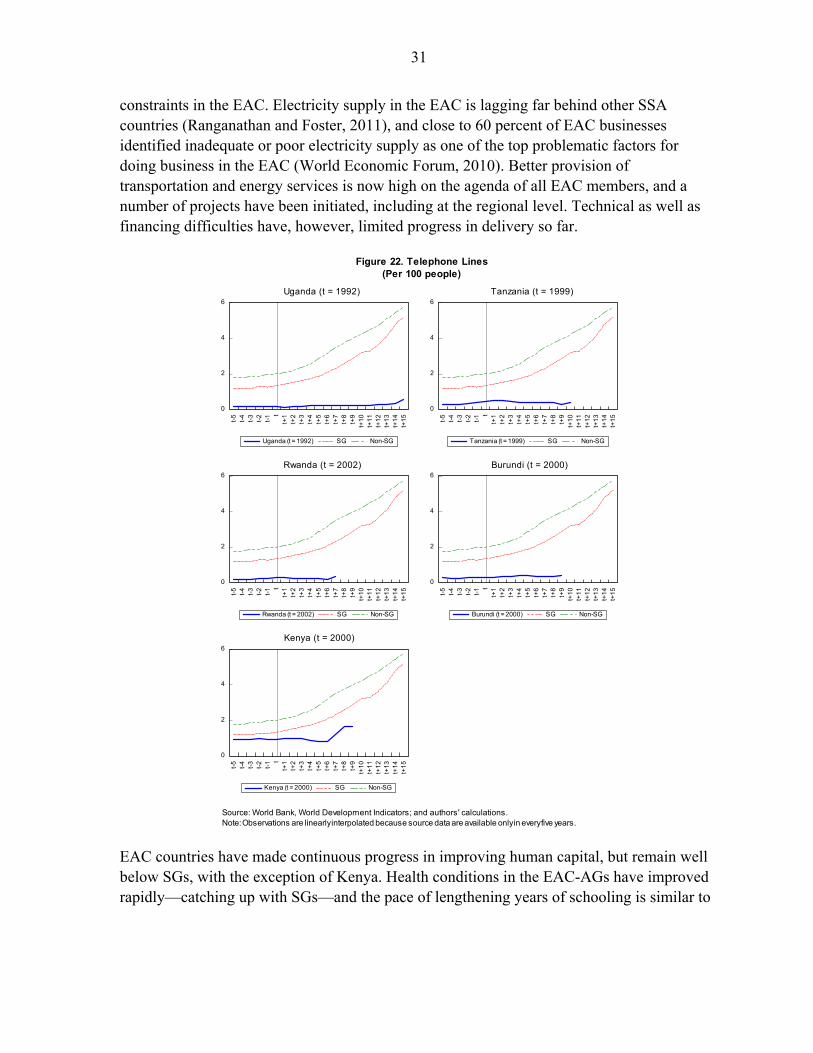
31
constraints in the EAC. Electricity supply in the EAC is lagging far behind other SSA countries (Ranganathan and Foster, 2011), and close to 60 percent of EAC businesses identified inadequate or poor electricity supply as one of the top problematic factors for doing business in the EAC (World Economic Forum, 2010). Better provision of transportation and energy services is now high on the agenda of all EAC members, and a number of projects have been initiated, including at the regional level. Technical as well as financing difficulties have, however, limited progress in delivery so far.
EAC countries have made continuous progress in improving human capital, but remain well below SGs, with the exception of Kenya. Health conditions in the EAC-AGs have improved rapidly—catching up with SGs—and the pace of lengthening years of schooling is similar to
0
2
4
6
t-5
t-4
t-3
t-2
t-1 t
t+1
t+2
t+3
t+4
t+5
t+6
t+7
t+8
t+9
t+1
0t+
11
t+1
2t+
13
t+1
4t+
15
Uganda (t = 1992) SG Non-SG
0
2
4
6
t-5
t-4
t-3
t-2
t-1 t
t+1
t+2
t+3
t+4
t+5
t+6
t+7
t+8
t+9
t+1
0t+
11
t+1
2t+
13
t+1
4t+
15
Tanzania (t = 1999) SG Non-SG
0
2
4
6
t-5
t-4
t-3
t-2
t-1 t
t+1
t+2
t+3
t+4
t+5
t+6
t+7
t+8
t+9
t+1
0t+
11
t+1
2t+
13
t+1
4t+
15
Rwanda (t = 2002) SG Non-SG
0
2
4
6
t-5
t-4
t-3
t-2
t-1 t
t+1
t+2
t+3
t+4
t+5
t+6
t+7
t+8
t+9
t+1
0t+
11
t+1
2t+
13
t+1
4t+
15
Burundi (t = 2000) SG Non-SG
0
2
4
6
t-5
t-4
t-3
t-2
t-1 t
t+1
t+2
t+3
t+4
t+5
t+6
t+7
t+8
t+9
t+1
0t+
11
t+1
2t+
13
t+1
4t+
15
Kenya (t = 2000) SG Non-SG
Uganda (t = 1992) Tanzania (t = 1999)
Rwanda (t = 2002) Burundi (t = 2000)
Kenya (t = 2000)
Figure 22. Telephone Lines(Per 100 people)
Source: World Bank, World Development Indicators; and authors' calculations.Note: Observations are linearly interpolated because source data are available only in every five years.
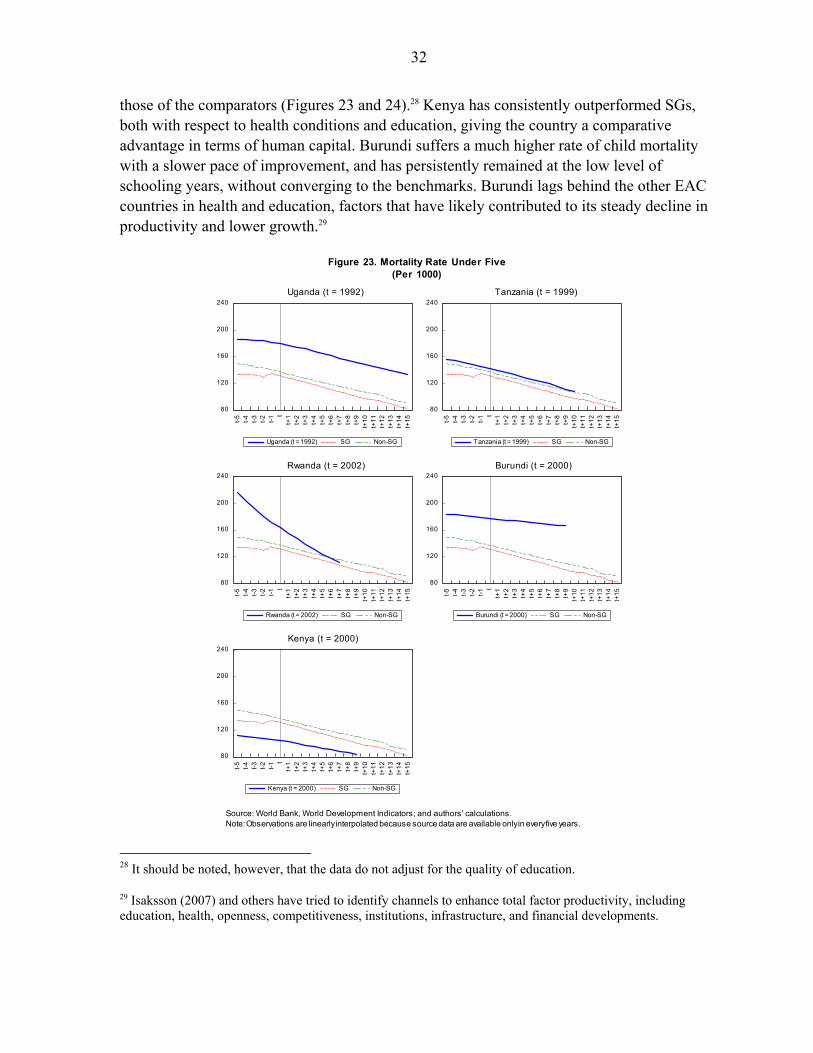
32
those of the comparators (Figures 23 and 24).28 Kenya has consistently outperformed SGs, both with respect to health conditions and education, giving the country a comparative advantage in terms of human capital. Burundi suffers a much higher rate of child mortality with a slower pace of improvement, and has persistently remained at the low level of schooling years, without converging to the benchmarks. Burundi lags behind the other EAC countries in health and education, factors that have likely contributed to its steady decline in productivity and lower growth.29
28 It should be noted, however, that the data do not adjust for the quality of education.
29 Isaksson (2007) and others have tried to identify channels to enhance total factor productivity, including education, health, openness, competitiveness, institutions, infrastructure, and financial developments.
80
120
160
200
240
t-5
t-4
t-3
t-2
t-1 t
t+1
t+2
t+3
t+4
t+5
t+6
t+7
t+8
t+9
t+1
0t+
11
t+1
2t+
13
t+1
4t+
15
Uganda (t = 1992) SG Non-SG
80
120
160
200
240
t-5
t-4
t-3
t-2
t-1 t
t+1
t+2
t+3
t+4
t+5
t+6
t+7
t+8
t+9
t+1
0t+
11
t+1
2t+
13
t+1
4t+
15
Tanzania (t = 1999) SG Non-SG
80
120
160
200
240
t-5
t-4
t-3
t-2
t-1 t
t+1
t+2
t+3
t+4
t+5
t+6
t+7
t+8
t+9
t+1
0t+
11
t+1
2t+
13
t+1
4t+
15
Rwanda (t = 2002) SG Non-SG
80
120
160
200
240
t-5
t-4
t-3
t-2
t-1 t
t+1
t+2
t+3
t+4
t+5
t+6
t+7
t+8
t+9
t+1
0t+
11
t+1
2t+
13
t+1
4t+
15
Burundi (t = 2000) SG Non-SG
80
120
160
200
240
t-5
t-4
t-3
t-2
t-1 t
t+1
t+2
t+3
t+4
t+5
t+6
t+7
t+8
t+9
t+1
0t+
11
t+1
2t+
13
t+1
4t+
15
Kenya (t = 2000) SG Non-SG
Uganda (t = 1992) Tanzania (t = 1999)
Rwanda (t = 2002) Burundi (t = 2000)
Kenya (t = 2000)
Figure 23. Mortality Rate Under Five(Per 1000)
Source: World Bank, World Development Indicators; and authors' calculations.Note: Observations are linearly interpolated because source data are available only in every five years.
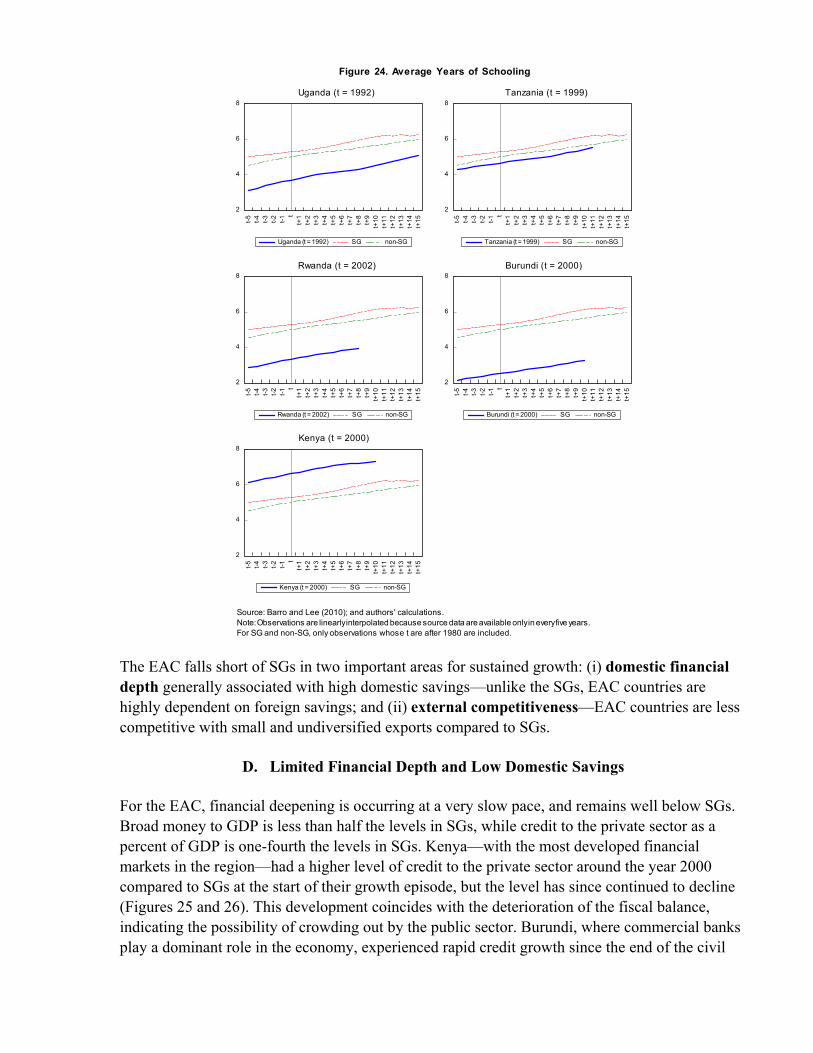
The EAC falls short of SGs in two important areas for sustained growth: (i) domestic financial depth generally associated with high domestic savings—unlike the SGs, EAC countries are highly dependent on foreign savings; and (ii) external competitiveness—EAC countries are less competitive with small and undiversified exports compared to SGs.
D. Limited Financial Depth and Low Domestic Savings
For the EAC, financial deepening is occurring at a very slow pace, and remains well below SGs. Broad money to GDP is less than half the levels in SGs, while credit to the private sector as a percent of GDP is one-fourth the levels in SGs. Kenya—with the most developed financial markets in the region—had a higher level of credit to the private sector around the year 2000 compared to SGs at the start of their growth episode, but the level has since continued to decline (Figures 25 and 26). This development coincides with the deterioration of the fiscal balance, indicating the possibility of crowding out by the public sector. Burundi, where commercial banks play a dominant role in the economy, experienced rapid credit growth since the end of the civil
2
4
6
8
t-5
t-4
t-3
t-2
t-1 t
t+1
t+2
t+3
t+4
t+5
t+6
t+7
t+8
t+9
t+1
0t+
11
t+1
2t+
13
t+1
4t+
15
Uganda (t = 1992) SG non-SG
2
4
6
8
t-5
t-4
t-3
t-2
t-1 t
t+1
t+2
t+3
t+4
t+5
t+6
t+7
t+8
t+9
t+1
0t+
11
t+1
2t+
13
t+1
4t+
15
Tanzania (t = 1999) SG non-SG
2
4
6
8
t-5
t-4
t-3
t-2
t-1 t
t+1
t+2
t+3
t+4
t+5
t+6
t+7
t+8
t+9
t+1
0t+
11
t+1
2t+
13
t+1
4t+
15
Rwanda (t = 2002) SG non-SG
2
4
6
8
t-5
t-4
t-3
t-2
t-1 t
t+1
t+2
t+3
t+4
t+5
t+6
t+7
t+8
t+9
t+1
0t+
11
t+1
2t+
13
t+1
4t+
15
Burundi (t = 2000) SG non-SG
2
4
6
8
t-5
t-4
t-3
t-2
t-1 t
t+1
t+2
t+3
t+4
t+5
t+6
t+7
t+8
t+9
t+1
0t+
11
t+1
2t+
13
t+1
4t+
15
Kenya (t = 2000) SG non-SG
Uganda (t = 1992) Tanzania (t = 1999)
Rwanda (t = 2002) Burundi (t = 2000)
Kenya (t = 2000)
Figure 24. Average Years of Schooling
Source: Barro and Lee (2010); and authors' calculations.Note: Observations are linearly interpolated because source data are available only in every five years.For SG and non-SG, only observations whose t are after 1980 are included.
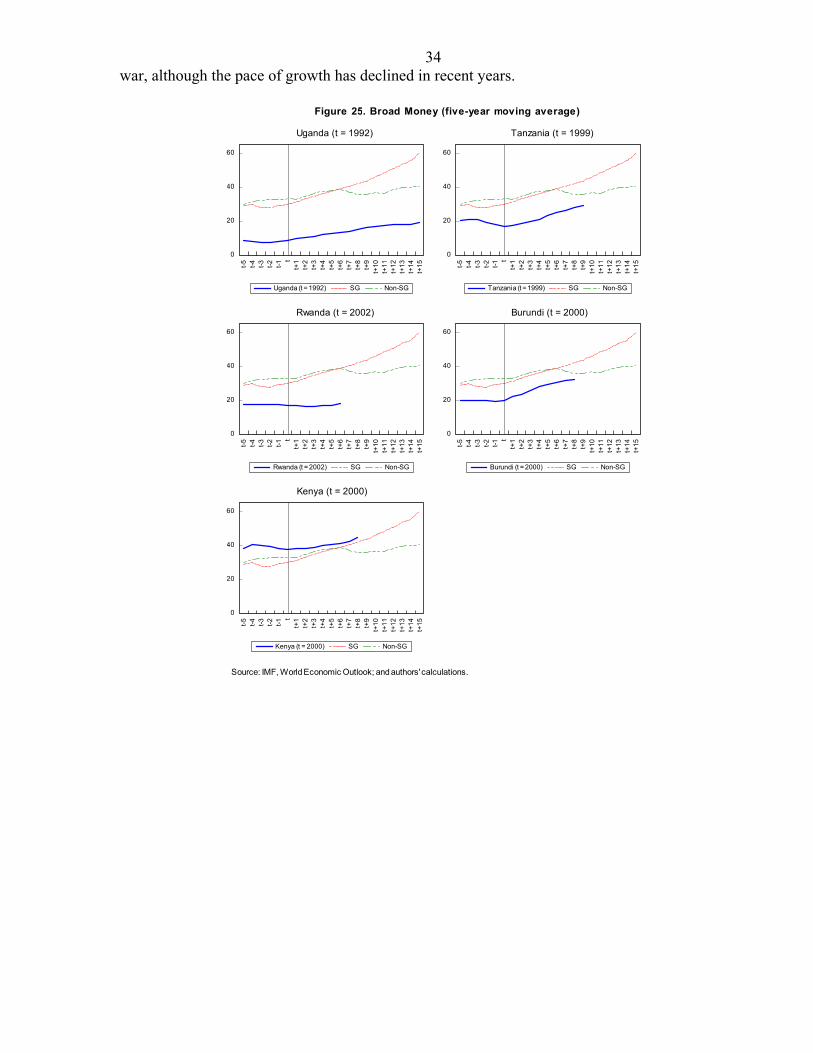
34
war, although the pace of growth has declined in recent years.
0
20
40
60
t-5
t-4
t-3
t-2
t-1 t
t+1
t+2
t+3
t+4
t+5
t+6
t+7
t+8
t+9
t+1
0t+
11
t+1
2t+
13
t+1
4t+
15
Uganda (t = 1992) SG Non-SG
0
20
40
60
t-5
t-4
t-3
t-2
t-1 t
t+1
t+2
t+3
t+4
t+5
t+6
t+7
t+8
t+9
t+1
0t+
11
t+1
2t+
13
t+1
4t+
15
Tanzania (t = 1999) SG Non-SG
0
20
40
60
t-5
t-4
t-3
t-2
t-1 t
t+1
t+2
t+3
t+4
t+5
t+6
t+7
t+8
t+9
t+1
0t+
11
t+1
2t+
13
t+1
4t+
15
Rwanda (t = 2002) SG Non-SG
0
20
40
60
t-5
t-4
t-3
t-2
t-1 t
t+1
t+2
t+3
t+4
t+5
t+6
t+7
t+8
t+9
t+1
0t+
11
t+1
2t+
13
t+1
4t+
15
Burundi (t = 2000) SG Non-SG
0
20
40
60
t-5
t-4
t-3
t-2
t-1 t
t+1
t+2
t+3
t+4
t+5
t+6
t+7
t+8
t+9
t+1
0t+
11
t+1
2t+
13
t+1
4t+
15
Kenya (t = 2000) SG Non-SG
Uganda (t = 1992) Tanzania (t = 1999)
Rwanda (t = 2002) Burundi (t = 2000)
Kenya (t = 2000)
Source: IMF, World Economic Outlook; and authors' calculations.
Figure 25. Broad Money (five-year moving average)
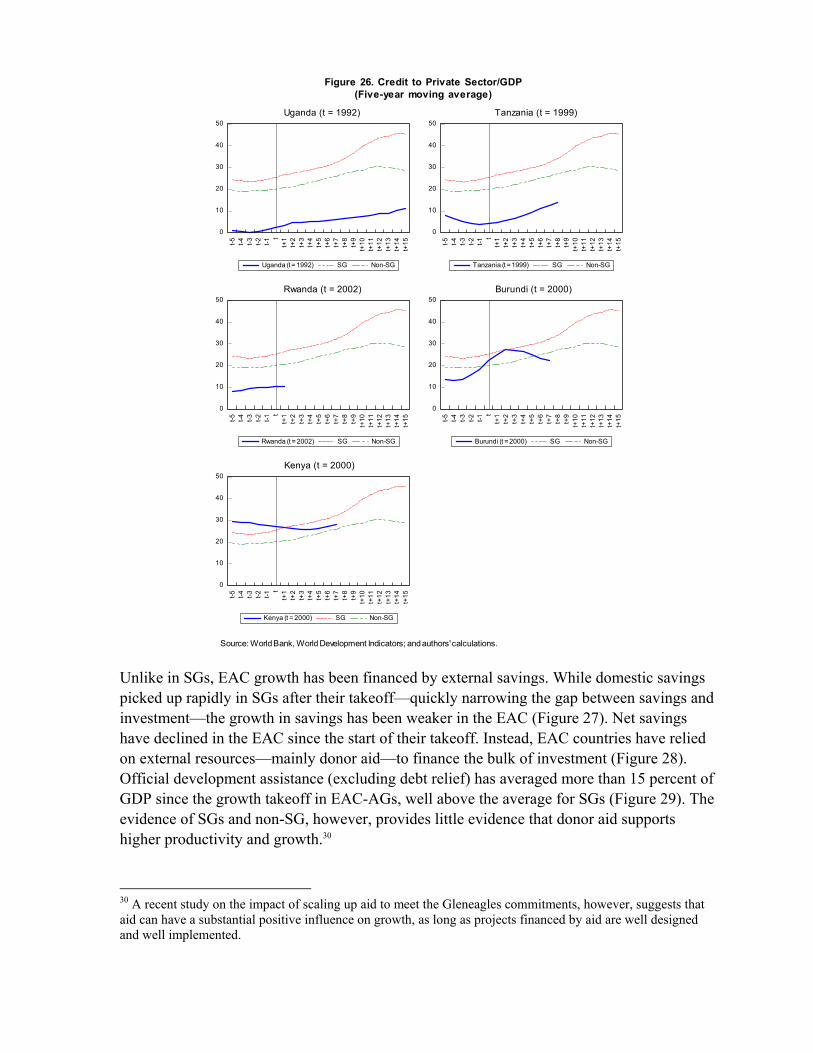
Unlike in SGs, EAC growth has been financed by external savings. While domestic savings picked up rapidly in SGs after their takeoff—quickly narrowing the gap between savings and investment—the growth in savings has been weaker in the EAC (Figure 27). Net savings have declined in the EAC since the start of their takeoff. Instead, EAC countries have relied on external resources—mainly donor aid—to finance the bulk of investment (Figure 28). Official development assistance (excluding debt relief) has averaged more than 15 percent of GDP since the growth takeoff in EAC-AGs, well above the average for SGs (Figure 29). The evidence of SGs and non-SG, however, provides little evidence that donor aid supports higher productivity and growth.30
30 A recent study on the impact of scaling up aid to meet the Gleneagles commitments, however, suggests that aid can have a substantial positive influence on growth, as long as projects financed by aid are well designed and well implemented.
0
10
20
30
40
50
t-5
t-4
t-3
t-2
t-1 t
t+1
t+2
t+3
t+4
t+5
t+6
t+7
t+8
t+9
t+1
0t+
11
t+1
2t+
13
t+1
4t+
15
Uganda (t = 1992) SG Non-SG
0
10
20
30
40
50
t-5
t-4
t-3
t-2
t-1 t
t+1
t+2
t+3
t+4
t+5
t+6
t+7
t+8
t+9
t+1
0t+
11
t+1
2t+
13
t+1
4t+
15
Tanzania (t = 1999) SG Non-SG
0
10
20
30
40
50
t-5
t-4
t-3
t-2
t-1 t
t+1
t+2
t+3
t+4
t+5
t+6
t+7
t+8
t+9
t+1
0t+
11
t+1
2t+
13
t+1
4t+
15
Rwanda (t = 2002) SG Non-SG
0
10
20
30
40
50
t-5
t-4
t-3
t-2
t-1 t
t+1
t+2
t+3
t+4
t+5
t+6
t+7
t+8
t+9
t+1
0t+
11
t+1
2t+
13
t+1
4t+
15
Burundi (t = 2000) SG Non-SG
0
10
20
30
40
50
t-5
t-4
t-3
t-2
t-1 t
t+1
t+2
t+3
t+4
t+5
t+6
t+7
t+8
t+9
t+1
0t+
11
t+1
2t+
13
t+1
4t+
15
Kenya (t = 2000) SG Non-SG
Uganda (t = 1992) Tanzania (t = 1999)
Rwanda (t = 2002) Burundi (t = 2000)
Kenya (t = 2000)
Figure 26. Credit to Private Sector/GDP(Five-year moving average)
Source: World Bank, World Development Indicators; and authors' calculations.
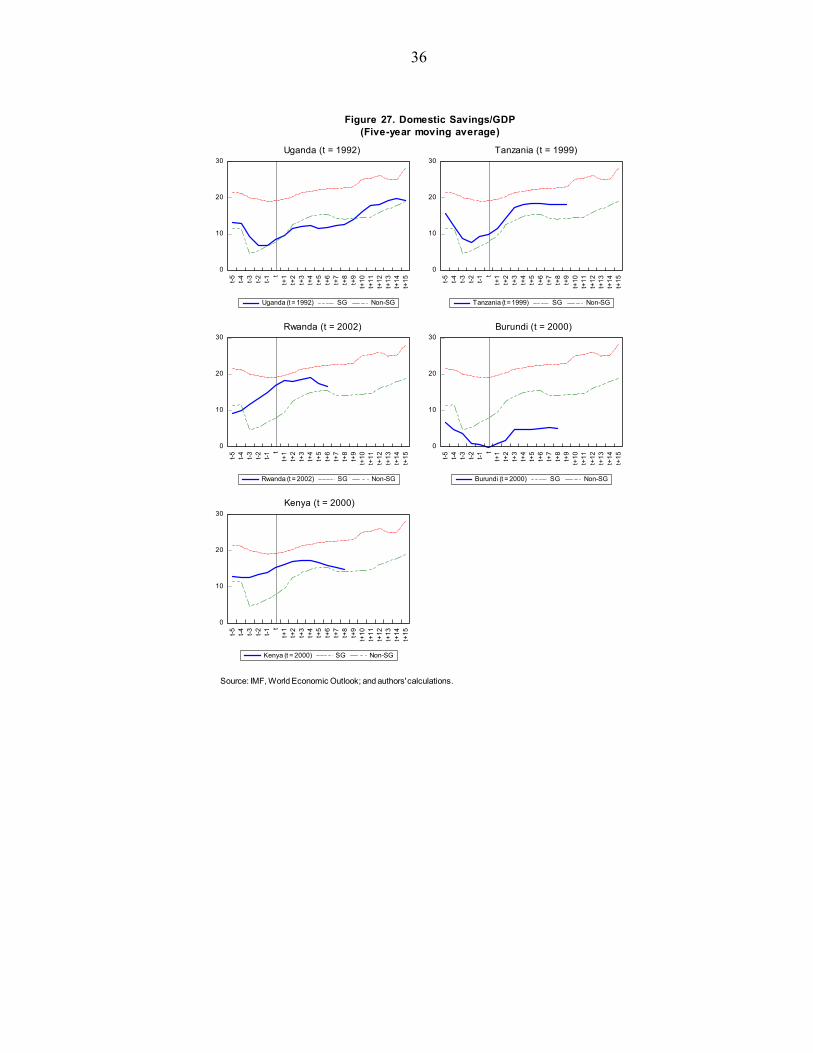
36
0
10
20
30
t-5
t-4
t-3
t-2
t-1 t
t+1
t+2
t+3
t+4
t+5
t+6
t+7
t+8
t+9
t+1
0t+
11
t+1
2t+
13
t+1
4t+
15
Uganda (t = 1992) SG Non-SG
0
10
20
30
t-5
t-4
t-3
t-2
t-1 t
t+1
t+2
t+3
t+4
t+5
t+6
t+7
t+8
t+9
t+1
0t+
11
t+1
2t+
13
t+1
4t+
15
Tanzania (t = 1999) SG Non-SG
0
10
20
30
t-5
t-4
t-3
t-2
t-1 t
t+1
t+2
t+3
t+4
t+5
t+6
t+7
t+8
t+9
t+1
0t+
11
t+1
2t+
13
t+1
4t+
15
Rwanda (t = 2002) SG Non-SG
0
10
20
30
t-5
t-4
t-3
t-2
t-1 t
t+1
t+2
t+3
t+4
t+5
t+6
t+7
t+8
t+9
t+1
0t+
11
t+1
2t+
13
t+1
4t+
15
Burundi (t = 2000) SG Non-SG
0
10
20
30
t-5
t-4
t-3
t-2
t-1 t
t+1
t+2
t+3
t+4
t+5
t+6
t+7
t+8
t+9
t+1
0t+
11
t+1
2t+
13
t+1
4t+
15
Kenya (t = 2000) SG Non-SG
Uganda (t = 1992) Tanzania (t = 1999)
Rwanda (t = 2002) Burundi (t = 2000)
Kenya (t = 2000)
Source: IMF, World Economic Outlook; and authors' calculations.
Figure 27. Domestic Savings/GDP(Five-year moving average)
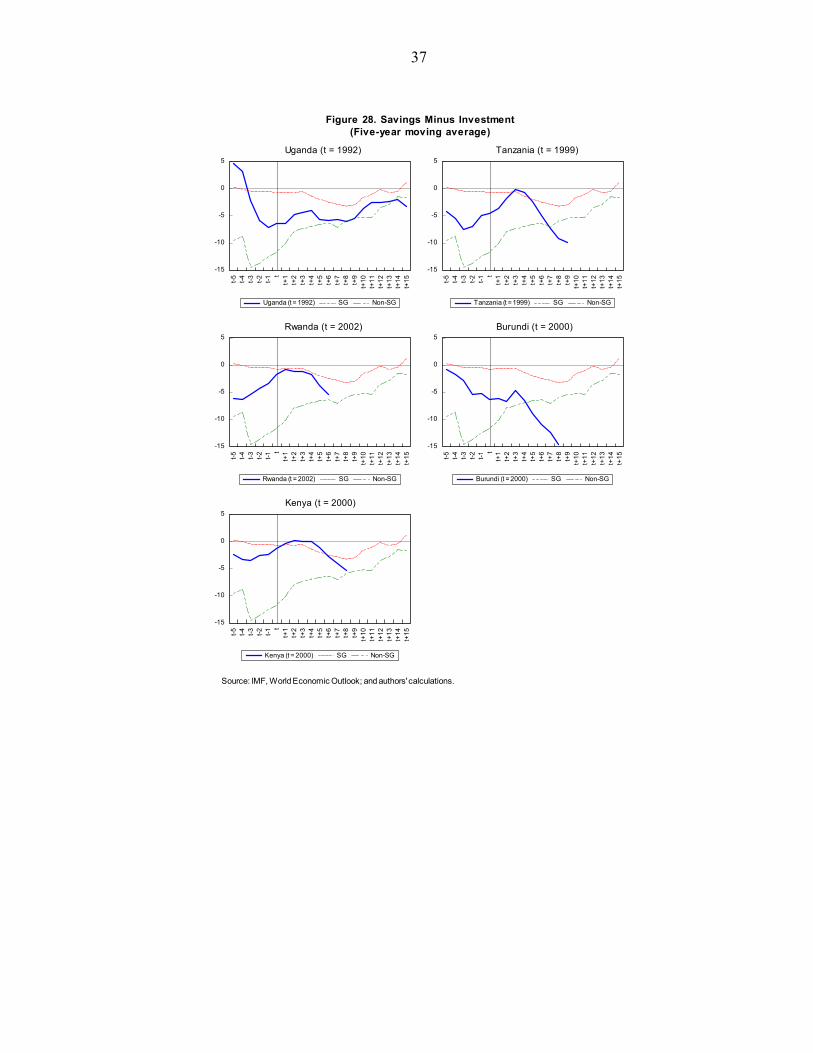
37
-15
-10
-5
0
5
t-5
t-4
t-3
t-2
t-1 t
t+1
t+2
t+3
t+4
t+5
t+6
t+7
t+8
t+9
t+1
0t+
11
t+1
2t+
13
t+1
4t+
15
Uganda (t = 1992) SG Non-SG
-15
-10
-5
0
5
t-5
t-4
t-3
t-2
t-1 t
t+1
t+2
t+3
t+4
t+5
t+6
t+7
t+8
t+9
t+1
0t+
11
t+1
2t+
13
t+1
4t+
15
Tanzania (t = 1999) SG Non-SG
-15
-10
-5
0
5
t-5
t-4
t-3
t-2
t-1 t
t+1
t+2
t+3
t+4
t+5
t+6
t+7
t+8
t+9
t+1
0t+
11
t+1
2t+
13
t+1
4t+
15
Rwanda (t = 2002) SG Non-SG
-15
-10
-5
0
5
t-5
t-4
t-3
t-2
t-1 t
t+1
t+2
t+3
t+4
t+5
t+6
t+7
t+8
t+9
t+1
0t+
11
t+1
2t+
13
t+1
4t+
15
Burundi (t = 2000) SG Non-SG
-15
-10
-5
0
5
t-5
t-4
t-3
t-2
t-1 t
t+1
t+2
t+3
t+4
t+5
t+6
t+7
t+8
t+9
t+1
0t+
11
t+1
2t+
13
t+1
4t+
15
Kenya (t = 2000) SG Non-SG
Uganda (t = 1992) Tanzania (t = 1999)
Rwanda (t = 2002) Burundi (t = 2000)
Kenya (t = 2000)
Source: IMF, World Economic Outlook; and authors' calculations.
Figure 28. Savings Minus Investment(Five-year moving average)
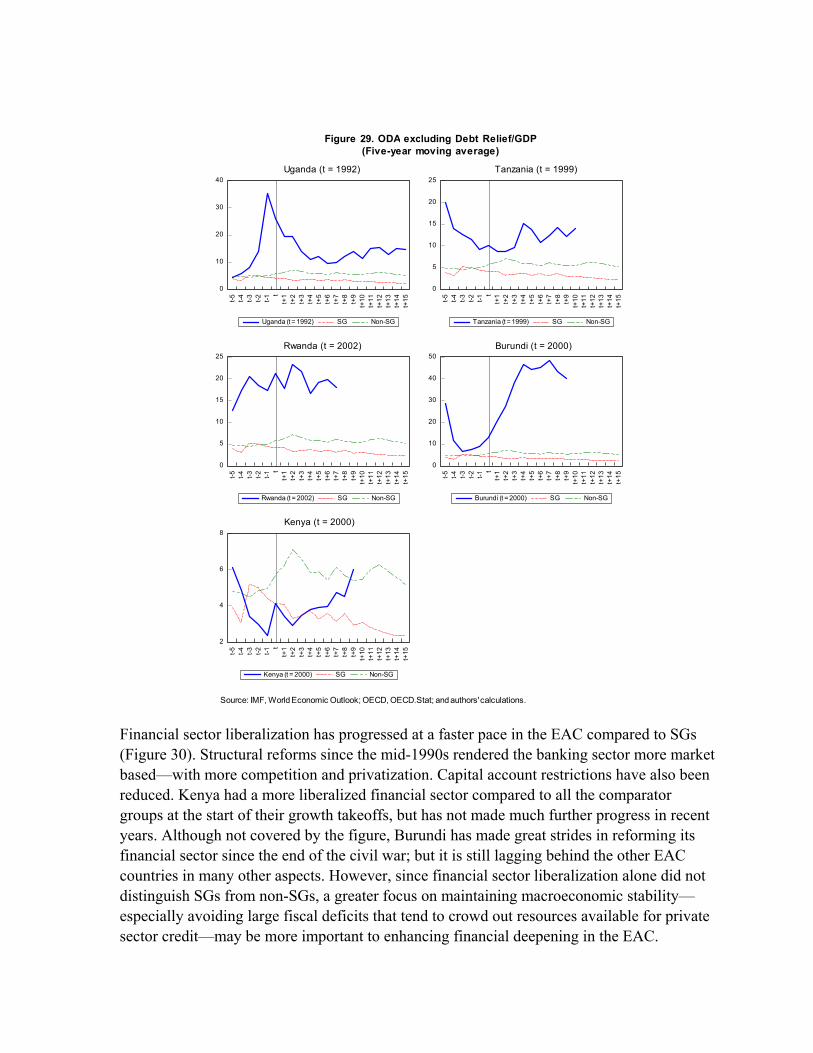
Financial sector liberalization has progressed at a faster pace in the EAC compared to SGs (Figure 30). Structural reforms since the mid-1990s rendered the banking sector more market based—with more competition and privatization. Capital account restrictions have also been reduced. Kenya had a more liberalized financial sector compared to all the comparator groups at the start of their growth takeoffs, but has not made much further progress in recent years. Although not covered by the figure, Burundi has made great strides in reforming its financial sector since the end of the civil war; but it is still lagging behind the other EAC countries in many other aspects. However, since financial sector liberalization alone did not distinguish SGs from non-SGs, a greater focus on maintaining macroeconomic stability—especially avoiding large fiscal deficits that tend to crowd out resources available for private sector credit—may be more important to enhancing financial deepening in the EAC.
0
10
20
30
40
t-5
t-4
t-3
t-2
t-1 t
t+1
t+2
t+3
t+4
t+5
t+6
t+7
t+8
t+9
t+1
0t+
11
t+1
2t+
13
t+1
4t+
15
Uganda (t = 1992) SG Non-SG
0
5
10
15
20
25
t-5
t-4
t-3
t-2
t-1 t
t+1
t+2
t+3
t+4
t+5
t+6
t+7
t+8
t+9
t+1
0t+
11
t+1
2t+
13
t+1
4t+
15
Tanzania (t = 1999) SG Non-SG
0
5
10
15
20
25
t-5
t-4
t-3
t-2
t-1 t
t+1
t+2
t+3
t+4
t+5
t+6
t+7
t+8
t+9
t+1
0t+
11
t+1
2t+
13
t+1
4t+
15
Rwanda (t = 2002) SG Non-SG
0
10
20
30
40
50
t-5
t-4
t-3
t-2
t-1 t
t+1
t+2
t+3
t+4
t+5
t+6
t+7
t+8
t+9
t+1
0t+
11
t+1
2t+
13
t+1
4t+
15
Burundi (t = 2000) SG Non-SG
2
4
6
8
t-5
t-4
t-3
t-2
t-1 t
t+1
t+2
t+3
t+4
t+5
t+6
t+7
t+8
t+9
t+1
0t+
11
t+1
2t+
13
t+1
4t+
15
Kenya (t = 2000) SG Non-SG
Uganda (t = 1992) Tanzania (t = 1999)
Rwanda (t = 2002) Burundi (t = 2000)
Kenya (t = 2000)
Figure 29. ODA excluding Debt Relief/GDP(Five-year moving average)
Source: IMF, World Economic Outlook; OECD, OECD.Stat; and authors' calculations.
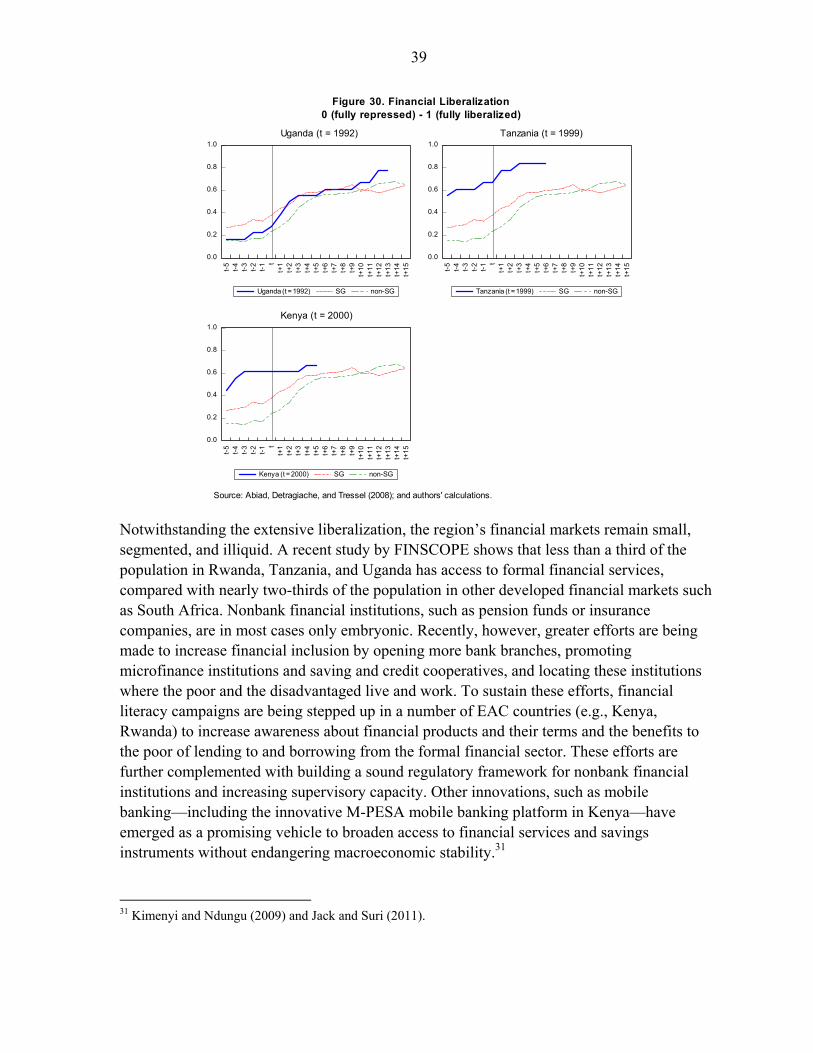
39
Notwithstanding the extensive liberalization, the region’s financial markets remain small, segmented, and illiquid. A recent study by FINSCOPE shows that less than a third of the population in Rwanda, Tanzania, and Uganda has access to formal financial services, compared with nearly two-thirds of the population in other developed financial markets such as South Africa. Nonbank financial institutions, such as pension funds or insurance companies, are in most cases only embryonic. Recently, however, greater efforts are being made to increase financial inclusion by opening more bank branches, promoting microfinance institutions and saving and credit cooperatives, and locating these institutions where the poor and the disadvantaged live and work. To sustain these efforts, financial literacy campaigns are being stepped up in a number of EAC countries (e.g., Kenya, Rwanda) to increase awareness about financial products and their terms and the benefits to the poor of lending to and borrowing from the formal financial sector. These efforts are further complemented with building a sound regulatory framework for nonbank financial institutions and increasing supervisory capacity. Other innovations, such as mobile banking—including the innovative M-PESA mobile banking platform in Kenya—have emerged as a promising vehicle to broaden access to financial services and savings instruments without endangering macroeconomic stability.31
31 Kimenyi and Ndungu (2009) and Jack and Suri (2011).
0.0
0.2
0.4
0.6
0.8
1.0
t-5
t-4
t-3
t-2
t-1 t
t+1
t+2
t+3
t+4
t+5
t+6
t+7
t+8
t+9
t+1
0t+
11
t+1
2t+
13
t+1
4t+
15
Uganda (t = 1992) SG non-SG
0.0
0.2
0.4
0.6
0.8
1.0
t-5
t-4
t-3
t-2
t-1 t
t+1
t+2
t+3
t+4
t+5
t+6
t+7
t+8
t+9
t+1
0t+
11
t+1
2t+
13
t+1
4t+
15
Tanzania (t = 1999) SG non-SG
0.0
0.2
0.4
0.6
0.8
1.0
t-5
t-4
t-3
t-2
t-1 t
t+1
t+2
t+3
t+4
t+5
t+6
t+7
t+8
t+9
t+1
0t+
11
t+1
2t+
13
t+1
4t+
15
Kenya (t = 2000) SG non-SG
Uganda (t = 1992) Tanzania (t = 1999)
Kenya (t = 2000)
Figure 30. Financial Liberalization0 (fully repressed) - 1 (fully liberalized)
Source: Abiad, Detragiache, and Tressel (2008); and authors' calculations.
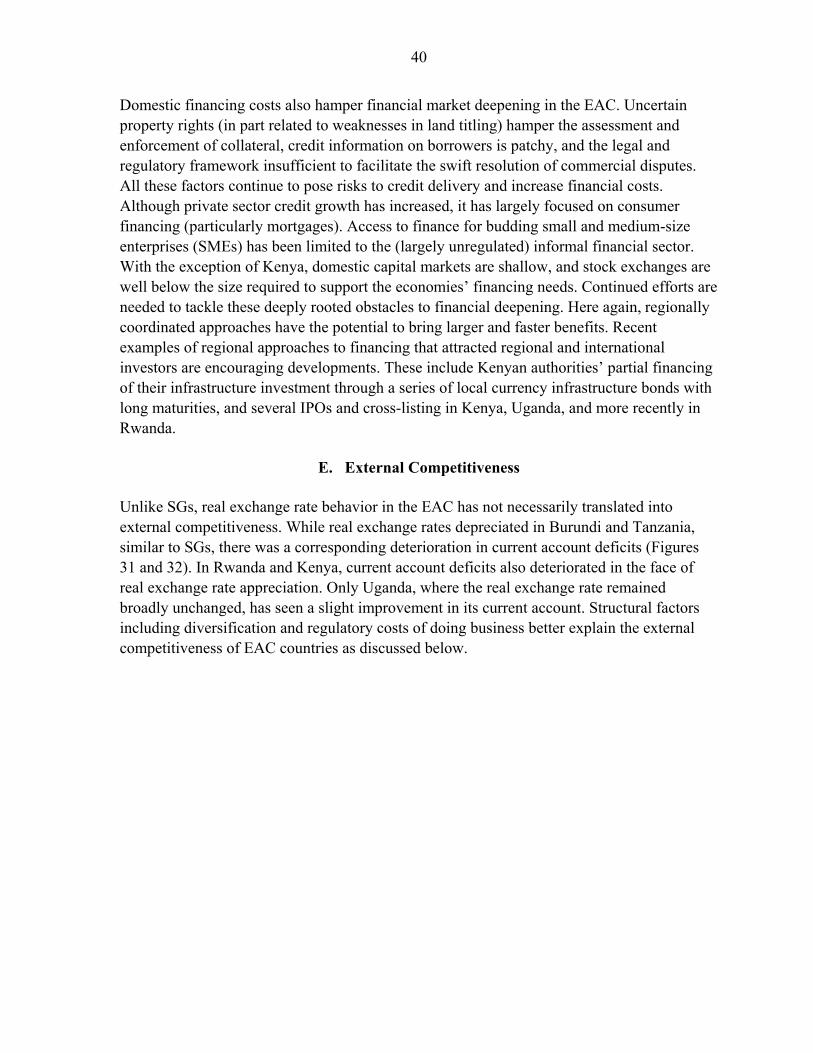
40
Domestic financing costs also hamper financial market deepening in the EAC. Uncertain property rights (in part related to weaknesses in land titling) hamper the assessment and enforcement of collateral, credit information on borrowers is patchy, and the legal and regulatory framework insufficient to facilitate the swift resolution of commercial disputes. All these factors continue to pose risks to credit delivery and increase financial costs. Although private sector credit growth has increased, it has largely focused on consumer financing (particularly mortgages). Access to finance for budding small and medium-size enterprises (SMEs) has been limited to the (largely unregulated) informal financial sector. With the exception of Kenya, domestic capital markets are shallow, and stock exchanges are well below the size required to support the economies’ financing needs. Continued efforts are needed to tackle these deeply rooted obstacles to financial deepening. Here again, regionally coordinated approaches have the potential to bring larger and faster benefits. Recent examples of regional approaches to financing that attracted regional and international investors are encouraging developments. These include Kenyan authorities’ partial financing of their infrastructure investment through a series of local currency infrastructure bonds with long maturities, and several IPOs and cross-listing in Kenya, Uganda, and more recently in Rwanda.
E. External Competitiveness
Unlike SGs, real exchange rate behavior in the EAC has not necessarily translated into external competitiveness. While real exchange rates depreciated in Burundi and Tanzania, similar to SGs, there was a corresponding deterioration in current account deficits (Figures 31 and 32). In Rwanda and Kenya, current account deficits also deteriorated in the face of real exchange rate appreciation. Only Uganda, where the real exchange rate remained broadly unchanged, has seen a slight improvement in its current account. Structural factors including diversification and regulatory costs of doing business better explain the external competitiveness of EAC countries as discussed below.
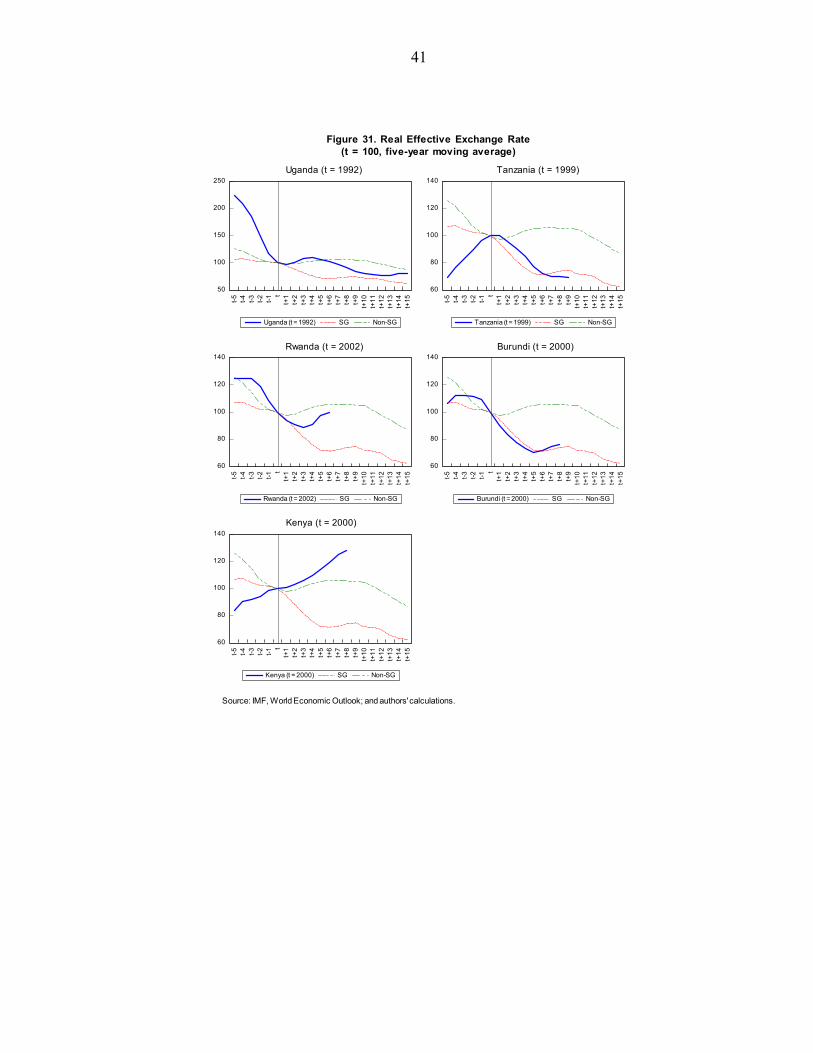
41
50
100
150
200
250
t-5
t-4
t-3
t-2
t-1 t
t+1
t+2
t+3
t+4
t+5
t+6
t+7
t+8
t+9
t+1
0t+
11
t+1
2t+
13
t+1
4t+
15
Uganda (t = 1992) SG Non-SG
60
80
100
120
140
t-5
t-4
t-3
t-2
t-1 t
t+1
t+2
t+3
t+4
t+5
t+6
t+7
t+8
t+9
t+1
0t+
11
t+1
2t+
13
t+1
4t+
15
Tanzania (t = 1999) SG Non-SG
60
80
100
120
140
t-5
t-4
t-3
t-2
t-1 t
t+1
t+2
t+3
t+4
t+5
t+6
t+7
t+8
t+9
t+1
0t+
11
t+1
2t+
13
t+1
4t+
15
Rwanda (t = 2002) SG Non-SG
60
80
100
120
140
t-5
t-4
t-3
t-2
t-1 t
t+1
t+2
t+3
t+4
t+5
t+6
t+7
t+8
t+9
t+1
0t+
11
t+1
2t+
13
t+1
4t+
15
Burundi (t = 2000) SG Non-SG
60
80
100
120
140
t-5
t-4
t-3
t-2
t-1 t
t+1
t+2
t+3
t+4
t+5
t+6
t+7
t+8
t+9
t+1
0t+
11
t+1
2t+
13
t+1
4t+
15
Kenya (t = 2000) SG Non-SG
Uganda (t = 1992) Tanzania (t = 1999)
Rwanda (t = 2002) Burundi (t = 2000)
Kenya (t = 2000)
Source: IMF, World Economic Outlook; and authors' calculations.
Figure 31. Real Effective Exchange Rate(t = 100, five-year moving average)
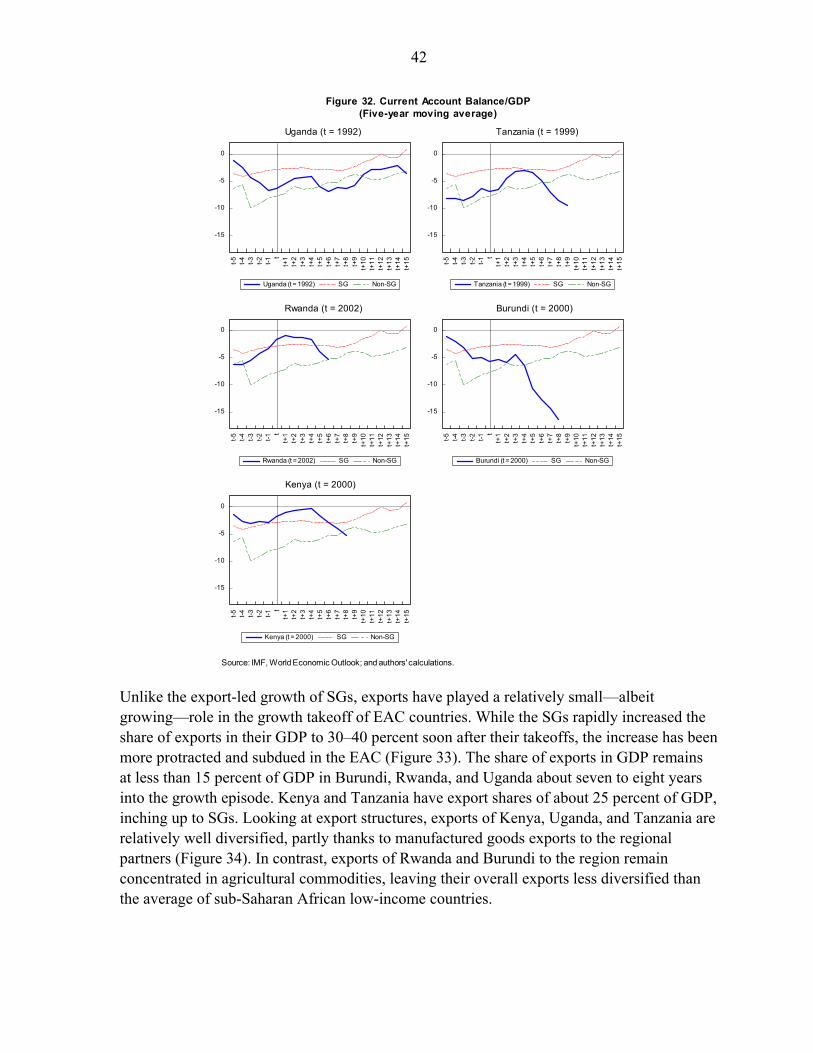
42
Unlike the export-led growth of SGs, exports have played a relatively small—albeit growing—role in the growth takeoff of EAC countries. While the SGs rapidly increased the share of exports in their GDP to 30–40 percent soon after their takeoffs, the increase has been more protracted and subdued in the EAC (Figure 33). The share of exports in GDP remains at less than 15 percent of GDP in Burundi, Rwanda, and Uganda about seven to eight years into the growth episode. Kenya and Tanzania have export shares of about 25 percent of GDP, inching up to SGs. Looking at export structures, exports of Kenya, Uganda, and Tanzania are relatively well diversified, partly thanks to manufactured goods exports to the regional partners (Figure 34). In contrast, exports of Rwanda and Burundi to the region remain concentrated in agricultural commodities, leaving their overall exports less diversified than the average of sub-Saharan African low-income countries.
-15
-10
-5
0
t-5
t-4
t-3
t-2
t-1 t
t+1
t+2
t+3
t+4
t+5
t+6
t+7
t+8
t+9
t+1
0t+
11
t+1
2t+
13
t+1
4t+
15
Uganda (t = 1992) SG Non-SG
-15
-10
-5
0
t-5
t-4
t-3
t-2
t-1 t
t+1
t+2
t+3
t+4
t+5
t+6
t+7
t+8
t+9
t+1
0t+
11
t+1
2t+
13
t+1
4t+
15
Tanzania (t = 1999) SG Non-SG
-15
-10
-5
0
t-5
t-4
t-3
t-2
t-1 t
t+1
t+2
t+3
t+4
t+5
t+6
t+7
t+8
t+9
t+1
0t+
11
t+1
2t+
13
t+1
4t+
15
Rwanda (t = 2002) SG Non-SG
-15
-10
-5
0
t-5
t-4
t-3
t-2
t-1 t
t+1
t+2
t+3
t+4
t+5
t+6
t+7
t+8
t+9
t+1
0t+
11
t+1
2t+
13
t+1
4t+
15
Burundi (t = 2000) SG Non-SG
-15
-10
-5
0
t-5
t-4
t-3
t-2
t-1 t
t+1
t+2
t+3
t+4
t+5
t+6
t+7
t+8
t+9
t+1
0t+
11
t+1
2t+
13
t+1
4t+
15
Kenya (t = 2000) SG Non-SG
Uganda (t = 1992) Tanzania (t = 1999)
Rwanda (t = 2002) Burundi (t = 2000)
Kenya (t = 2000)
Source: IMF, World Economic Outlook; and authors' calculations.
Figure 32. Current Account Balance/GDP(Five-year moving average)
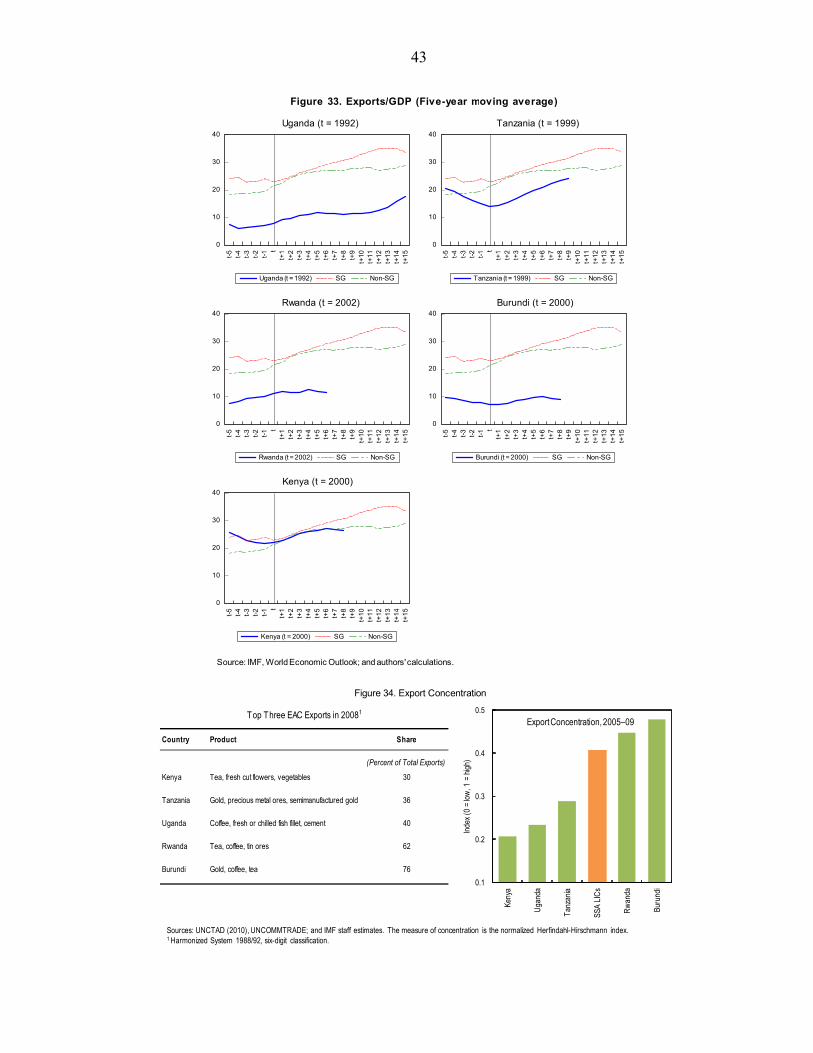
43
0
10
20
30
40
t-5
t-4
t-3
t-2
t-1 t
t+1
t+2
t+3
t+4
t+5
t+6
t+7
t+8
t+9
t+1
0t+
11
t+1
2t+
13
t+1
4t+
15
Uganda (t = 1992) SG Non-SG
0
10
20
30
40
t-5
t-4
t-3
t-2
t-1 t
t+1
t+2
t+3
t+4
t+5
t+6
t+7
t+8
t+9
t+1
0t+
11
t+1
2t+
13
t+1
4t+
15
Tanzania (t = 1999) SG Non-SG
0
10
20
30
40
t-5
t-4
t-3
t-2
t-1 t
t+1
t+2
t+3
t+4
t+5
t+6
t+7
t+8
t+9
t+1
0t+
11
t+1
2t+
13
t+1
4t+
15
Rwanda (t = 2002) SG Non-SG
0
10
20
30
40
t-5
t-4
t-3
t-2
t-1 t
t+1
t+2
t+3
t+4
t+5
t+6
t+7
t+8
t+9
t+1
0t+
11
t+1
2t+
13
t+1
4t+
15
Burundi (t = 2000) SG Non-SG
0
10
20
30
40
t-5
t-4
t-3
t-2
t-1 t
t+1
t+2
t+3
t+4
t+5
t+6
t+7
t+8
t+9
t+1
0t+
11
t+1
2t+
13
t+1
4t+
15
Kenya (t = 2000) SG Non-SG
Uganda (t = 1992) Tanzania (t = 1999)
Rwanda (t = 2002) Burundi (t = 2000)
Kenya (t = 2000)
Source: IMF, World Economic Outlook; and authors' calculations.
Figure 33. Exports/GDP (Five-year moving average)
Country Product Share
(Percent of Total Exports)
Kenya Tea, fresh cut flowers, vegetables 30
Tanzania Gold, precious metal ores, semimanufactured gold 36
Uganda Coffee, fresh or chilled fish fillet, cement 40
Rwanda Tea, coffee, tin ores 62
Burundi Gold, coffee, tea 76
Top Three EAC Exports in 20081
Figure 34. Export Concentration
0.1
0.2
0.3
0.4
0.5
Keny
a
Uga
nda
Tanz
ania
SSA
LIC
s
Rw
anda
Buru
ndi
Inde
x (0
= lo
w, 1
= h
igh)
Export Concentration, 2005–09
Sources: UNCTAD (2010), UNCOMMTRADE; and IMF staff estimates. The measure of concentration is the normalized Herfindahl-Hirschmann index.1 Harmonized System 1988/92, six-digit classification.
44
Underlying the more subdued export growth in the EAC, regulatory bottlenecks hamper the region’s competitiveness. Although a common market is in place, nontariff barriers are still high in the region; and common standards and harmonized regulations are yet to be agreed upon (Box 4).While EAC members have embraced market-supportive policies at the broader level and often put in place legal frameworks amicable to investors, business surveys show that enforcement is problematic (Figure 34). Investment incentives are uncoordinated and often enterprise specific. Such obstacles not only constrain investment and export levels, but also hamper private investment in infrastructure, further increasing costs; and they deter innovation, and thus output and export diversification. Although most EAC country authorities have plans to improve the investment climate, progress to date has been uneven across the region, with only Rwanda implementing ambitious and comprehensive reforms. In addition, reform efforts have not been closely coordinated at the regional level, reducing to some extent their impact. Removing these remaining obstacles could facilitate faster export growth for the region.
Box 4. The EAC Common Market: Achievements and Remaining Challenges
Trade integration has been a central objective of the EAC since its establishment. The customs union was established in 2005, followed by a common market in 2010. Internal tariffs on goods from other EAC countries have been eliminated over a five-year period. A common external tariff (CET) was established for imports from third countries: a zero rate for raw materials, a 10 percent rate for intermediate products, and a 25 percent rate for finished goods. The new tariff structure lowered the maximum tariff rate in each EAC country. EAC members also agreed to eliminate gradually restrictions on trade in services, the free movement of workers, and the right of establishment.
In practice, however, significant obstacles remain in the operation of the EAC common market. Although agreement was reached to remove gradually non-tariff barriers, and mechanisms are in place in each country to monitor implementation, actual progress has been limited. Customs procedures and harmonized regulations are yet to be agreed upon, while delays exist in issuance of certificates of origin, standards are not applied uniformly, and procurement procedures still need to be liberalized. Weak administrative capacity hinders the application of existing rules, while modalities for collecting and accounting for customs revenue at the regional level are not in place. Structural weaknesses, notably inadequate transport infrastructure, also hamper intraregional trade.
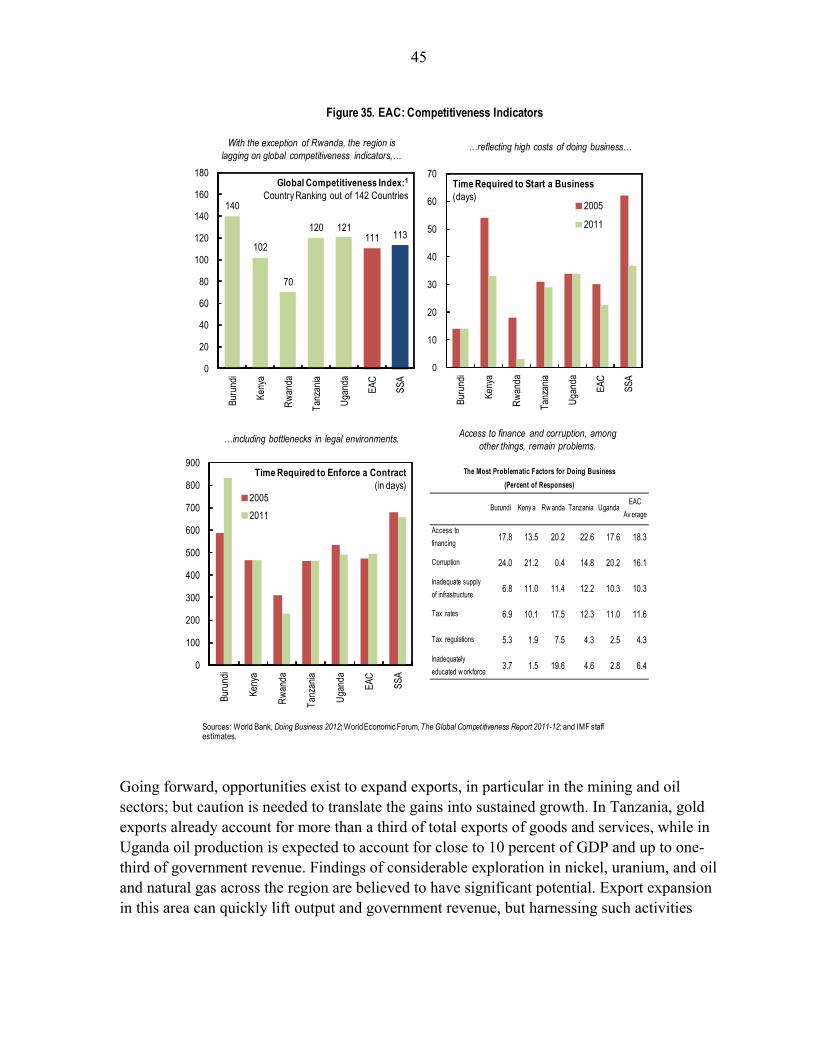
45
Going forward, opportunities exist to expand exports, in particular in the mining and oil sectors; but caution is needed to translate the gains into sustained growth. In Tanzania, gold exports already account for more than a third of total exports of goods and services, while in Uganda oil production is expected to account for close to 10 percent of GDP and up to one-third of government revenue. Findings of considerable exploration in nickel, uranium, and oil and natural gas across the region are believed to have significant potential. Export expansion in this area can quickly lift output and government revenue, but harnessing such activities
140
102
70
120 121111 113
0
20
40
60
80
100
120
140
160
180
Buru
ndi
Keny
a
Rw
anda
Tanz
ania
Uga
nda
EAC
SSA
Global Competitiveness Index:1
Country Ranking out of 142 Countries
0
10
20
30
40
50
60
70
Buru
ndi
Keny
a
Rw
anda
Tanz
ania
Uga
nda
EAC
SSA
2005
2011
Time Required to Start a Business(days)
0
100
200
300
400
500
600
700
800
900
Buru
ndi
Keny
a
Rw
anda
Tanz
ania
Uga
nda
EAC
SSA
2005
2011
Time Required to Enforce a Contract(in days)
Figure 35. EAC: Competitiveness Indicators
…reflecting high costs of doing business…With the exception of Rwanda, the region is lagging on global competitiveness indicators,…
…including bottlenecks in legal environments. Access to finance and corruption, among other things, remain problems.
Sources: World Bank, Doing Business 2012; World Economic Forum, The Global Competitiveness Report 2011-12; and IMF staff estimates.
Burundi Keny a Rw anda Tanzania UgandaEAC
Av erage
Access to
financing17.8 13.5 20.2 22.6 17.6 18.3
Corruption 24.0 21.2 0.4 14.8 20.2 16.1
Inadequate supply
of infrastructure6.8 11.0 11.4 12.2 10.3 10.3
Tax rates 6.9 10.1 17.5 12.3 11.0 11.6
Tax regulations 5.3 1.9 7.5 4.3 2.5 4.3
Inadequately
educated w orkforce3.7 1.5 19.6 4.6 2.8 6.4
The Most Problematic Factors for Doing Business
(Percent of Responses)
46
into longer-term growth raises considerable policy challenges—to avoid the “natural resource trap.”32 For East Africa, a region that has remained relatively less commodity dependent than its African neighbors, the impact of increasing commodity exports could be a double-edged sword: while they could increase output growth and income in the near term, they could also stunt the development of higher value-added exports needed to reach faster, sustained growth over the medium term. Early, determined policy action is needed to preserve competitiveness and ensure that the revenue from commodity exports is successfully intermediated into productive spending and investment in other sectors of the economy.
V. CONCLUSIONS AND POLICY PRIORITIES FOR SUSTAINED GROWTH
Prudent macroeconomic policies, productivity gains, financial sector depth, and a competitive external sector are important to sustaining growth. Comparing the growth performance of countries that have achieved sustained growth (SGs) against those that accelerated but failed to sustain growth (non-SGs), we find that SGs tend to maintain (i) low inflationary environments and low fiscal deficits; (ii) steady improvements in productivity, encouraging higher investment, especially FDI; (iii) high domestic savings and private sector credit underpinned by liberalized financial markets; and (iv) competitive external sectors fostering export growth with better current account balances. These findings concur with various growth determinants found in the recent growth literature. Our regression analysis also points to the importance of financial liberalization and sustaining peace for growth.
Within the EAC, Rwanda, Tanzania, and Uganda (EAC-AGs) have grown at rates comparable to SGs and share many of the key characteristics of sustaining growth. Similar to SGs, the growth upturn in the EAC-AGs has coincided with a period of low inflation and low budget deficits, while improved business environments and government stability have contributed to strong productivity gains and increasing FDI, in some cases exceeding SGs.
A number of challenges remain for the EAC-AGs to stay on the path of SGs. These include deepening financial markets and mobilizing domestic savings, improving external competitiveness—to increase exports—and further developing physical and human capital. Unlike SGs, growth in the EAC-AGs has been financed primarily by external savings, mainly donor grants. The levels of domestic savings and financial deepening in the EAC-AGs are much lower compared to SGs. Similarly, contribution of exports to growth has been fairly limited in EAC-AGs with widening current account deficits, compared to SGs. This is attributable to weaknesses in competiveness, including high costs of doing business in the region. Physical and human capital are also lagging in EAC countries, which could impede further productivity gains, especially over the longer term.
32 Collier (2007) and others. Commodity exporters have fallen into a detrimental to long-term growth because of the adverse impact of commodity exports on productivity, the real exchange rate, institutional development, and governance.
47
Elsewhere in the EAC, Burundi and Kenya have only recently started to grow after many years of stagnant or declining growth. Burundi has suffered from unstable macroeconomic performance and poor quality of institutions and physical and human capital. Although levels of investment, savings, and exports are all lower in Burundi compared to EAC-AGs, the benchmarking exercise suggests that the more fundamental constraint for Burundi is poor quality of institutions, infrastructure, and human capital: doing business is seen to be the most difficult in the region, the child mortality rate remains stubbornly high, and the level of education is by far the lowest in the region.
Macroeconomic and government instability may be dampening growth in Kenya. Real GDP growth rates have been trending upward since 2000, but not high enough to be considered accelerated. Kenya, unlike the other EAC countries, has a deep financial sector and a large export sector, even compared to SGs. Kenya performs better than SGs on social indicators for health and education. Nevertheless, productivity in Kenya has been declining until recently. This may reflect rising fiscal deficits and inflation since 2000 and a less stable government, at least in recent years.
The EAC is at a critical juncture, where policy decisions will determine whether they follow the path of SGs—accelerating the move to middle-income status—or non-SGs. With growth rates of EAC-AGs generally closely tracking those in SGs, now is a critical moment for them to ensure that accelerated growth is translated into sustained growth—and for Burundi and Kenya to boost the current growth momentum into a full-fledged growth acceleration. For this, the following policy recommendations will be important, albeit with different priorities for each EAC country:
(i) Maintain macroeconomic stability, namely low inflation and low budget deficits;
(ii) Deepen financial sectors to mobilize domestic savings;
(iii) Develop stable institutions and a conducive business climate;
(iv) Improve competiveness and diversify exports; and
(v) Overcome the bottlenecks of infrastructure and human capital.
Maintaining macroeconomic stability—low inflation and fiscal deficits—is important for all EAC countries. Fiscal deficits in the EAC have risen in recent years in line with planned fiscal stimulus policies in the face of the global recession. Fiscal deficits have increased from 1.8 percent of GDP on average in 2008—before the global financial crisis—to 3.9 percent in 2011. While the recent increases in fiscal deficits may have been important to sustain growth over the short term, they may be an impediment for sustaining growth over the longer term, if they are not appropriately unwound. Also recently, inflation has risen sharply, reflecting rising global food and fuel prices as well as drought-induced food shortages in the region.
48
This will have to be carefully managed to avoid second-round effects that could have more lasting effects on longer-term inflation. Maintaining macroeconomic stability also requires that natural resource export proceeds are managed carefully to avoid real exchange rate appreciation (by saving a large part of the foreign exchange earnings) or by investing in other sectors of the economy.
Deeper regional integration can help the EAC to cooperatively achieve its key policy priorities. The mechanism of regional surveillance backed up by appropriate convergence criteria could be used to mutually ensure prudent macroeconomic management by the members. Financial integration would allow the pooling and mobilization of scarce domestic savings and efficient allocation of such savings. Well-designed regional infrastructure projects could help overcome bottlenecks of physical infrastructure and encourage efficient use of invested resources. Free movement of goods, services, and capital would enhance competition across the region, thereby boosting productivity and output growth.
EAC integration is already advancing, but critical obstacles remain. Removing them should become a priority. A time-bound process to eliminate non-tariff barriers would let businesses reap the benefits of the regional common market and prepare them for competition in broader markets. The development of common standards and harmonized regulations would greatly enhance the business environment and facilitate legal enforcement. Regional coordination of investment promotion and tax reform would limit intraregional incentive competition and help attract financing for larger projects.
In the financial area, stepped-up regional approaches to financing―building, for example, on recent regional bond issuances―could facilitate pooling of savings across the region, expanding market size beyond each country, and reducing the fixed costs of developing market infrastructure. The harmonization of national regulatory frameworks, now under way, could be accelerated to facilitate the emergence of regional financial instruments. Deeper government debt markets could enhance the efficiency of monetary policy and serve as a benchmark yield curve for the private sector, facilitating the pricing of financial products.
In the external sector, raising the EAC’s export potential requires continued focus on improving productivity across the region. In particular, a better educated and skilled labor force as well as a better business environment and improved infrastructure—including regional transportation, energy, and information technologies—will reduce production costs and facilitate higher-value exports. Stepped-up efforts to increase agricultural productivity, for example, could both raise the EAC’s export potential and lift incomes in the area where the poorest segments of the population are concentrated. In the near term, the region could broaden its export markets to neighboring Democratic Republic of the Congo (DRC) and South Sudan, especially exports of food crops and light manufactured goods, while efforts are put in place to penetrate broader international markets over the longer term. This would require some investments in upgrading rural road networks and simplification of customs and
49
border post procedures.
Expanding exports may also demand, at least in the initial years, targeted “catalytic” interventions in natural niche sectors where EAC economies could build up or strengthen their comparative advantage, overcome late-comer handicaps, and establish a market presence. Coordinated interventions should cover complementary areas (skills, transportation, technology, market access). These interventions should be carefully targeted, both sectorally and geographically. Resources are insufficient to enhance skills, roads, and power in the entire region at the same time. An equal distribution of these limited resources will not give any area sufficient traction to become competitive. Regional coordination—with a common focus, for example, on a few “trade corridors”—could help mobilize financing and increase returns. To prevent “state capture,” implementation of the export push policy should be time bound with a clear exit strategy. More broadly, its fiscal cost should be strictly constrained, given the many other demands faced by the government, particularly on social issues.
The private sector should be closely involved in the design of such interventions, helping identify concrete needs and efficient delivery modes. Targeted areas should be selected transparently, with a focus on their impact on sustainability of both exports and productivity. Given its potential for expanding exports and reducing poverty, agriculture would likely offer the greatest payoff from targeted support.
References
Abiad, Abdul, Enrica Detragiache, and Thierry Tressel, 2008, “A New Database of Financial Reforms,” IMF Working Paper 08/266 (Washington: International Monetary Fund). Arbache, Jorge-Saba, and John Page, 2009, “How Fragile Is Africa’s Recent Growth?” Journal of African Economies, Vol. 19, number 1, pp 1–24. Arora, Vivek, and Athanasios Vamvakidis, 2004, “How Much Do Trading Partners Matter
for Economic Growth?” IMF Working Paper 04/26 (Washington: International Monetary Fund).
Barro, Robert J., 2003, “Determinants of Economic Growth in a Panel of Countries,” Annals of Economics and Finance, Vol. 4, No. 2, pp. 231–74. Barro, Robert, and Jong-Wha Lee, 2010, “A New Data Set of Educational Attainment in the World, 1950–2010,” NBER Working Paper No. 15902 (Cambridge, Mass.: National Bureau of Economic Research). Barro, Robert J., and Xavier Sala-i-Martin, 2004, Economic Growth, Second Edition (New York: McGraw Hill). Berg, Andrew, Jan Gottschalk, Rafael Portillo, and Luis-Felipe Zanna, 2010, “The
Macroeconomics of Medium-Term Aid Scaling-Up Scenarios,” IMF Working Paper 10/160 (Washington: International Monetary Fund).
Berg, Andrew, Jonathan D. Ostry, and Jeromin Zettelmeyer, 2008, “What Makes Growth Sustained,” IMF Working Paper 08/59 (Washington: International Monetary Fund). Bosworth, Barry P., and Susan M. Collins, 2010, “The Empirics of Growth: An Update,” Brookings Papers on Economic Activity (Washington: Brookings Institution). Cerra, Valerie, and Sweta C. Saxena, 2008, “Growth Dynamics: The Myth of Economic Recovery,” American Economic Review, Vol. 90, No. 1, pp. 439–57. Collier, Paul, 2007, “The Bottom Billion: Why the Poorest Countries Are Failing and What Can Be Done About It” (New York: Oxford University Press). Commission on Growth and Development, 2008, “The Growth Report: Strategies for Sustained Growth and Inclusive Development” (Washington: The World Bank). Correlates of War Project, 2008, “State System Membership List, v2008.1,” available via the
Internet: http://correlatesofwar.org.
51
East African Community, “Treaty for the Establishment of the East African Community,” available via the Internet: http://www.eac.int/html.
__________, “Protocol on the Establishment of the East African Customs Union,” Available
via the Internet: http://www.eac.int/customs/html. Easterly, William, Michael Kremer, Lant Pritchett, and Lawrence H. Summers, 1993, “Good Policy or Good Luck: Country Growth Performance and Temporary Shocks,” Journal of Monetary Economics, Vol. 32 (December), pp. 459–83. Hausmann, Ricardo, Lant Pritchett, and Dani Rodrik, 2004, “Growth Accelerations,” NBER Working Paper 10566 (Cambridge, Mass: National Bureau of Economic Research).
International Monetary Fund, 2008, Regional Economic Outlook: Sub-Saharan Africa (Washington, October).
International Monetary Fund, 2011, Enhancing Development Assistance to Africa: Lessons from Scaling-up Scenarios (Washington: International Monetary Fund).
Isaksson, Anders, 2007, “Determinants of Total Factor Productivity: A Literature Review,” Research and Statistics Staff Working Paper 2/2007 (Vienna: United National Industrial Development Organization). Jack, William, and Tavneet Suri, 2011, “Mobile Money: The Economics of MPESA,” NBER Working Paper No. 16721 (Cambridge, Mass.: National Bureau of Economic
Research).
Javorcik, Beata S., 2004, “Does Foreign Direct Investment Increase the Productivity of Domestic Firms? In Search of Spillovers through Backward Linkages,” American Economic Review, Vol. 94, No. 3, pp. 605–627. Johnson, Simon, Jonathan D. Ostry, and Arvind Subramanian, 2007, “The Prospects for Sustained Growth in Africa: Benchmarking the Constraints,” IMF Working Paper 07/52 (Washington: International Monetary Fund). Kaminsky, Graciela, and Carmen Reinhart, 1999, “The Twin Crises: The Causes of Banking and Balance-of-Payments Problems,” American Economic Review, 89(3): 473–500. Kimenyi, Mwangi S., and Njuguna S. Ndungu, 2009, M-PESA Mobile Banking Statistics, Central Bank of Kenya (Washington: Brookings Institute). Laeven, Luc, and Fabian Valencia, 2008, “Systemic Banking Crises: A New Database,” IMF
Working Paper 08/224 (Washington: International Monetary Fund). Ndulu, Benno J., Stephen A. O'Connell, Jean-Paul Azam, 2008, “The Political Economy of Economic Growth in Africa, 1960–2000,” (Cambridge: Cambridge University Press).
52
Ostry, Jonathan D., Jeromin Zettelmeyer, and Andrew Berg, 2007, “What Makes Growth Sustained?” IMF Working Paper 08/59 (Washington: International Monetary Fund). Page, John, 2009, “Africa’s Growth Turnaround: From Fewer Mistakes to Sustained Growth,” Commission on Growth and Development Working Paper 54 (Washington:
Commission on Growth and Development) Pritchett, Lant, 2002, “Understanding Patterns of Economic Growth: Searching for Hills among Plateaus, Mountains, and Plains,” World Bank Economic Review, Vol. 14, No. 2, pp. 221–50. Radelet, Steven, 2010, “Emerging Africa: How 17 Countries Are Leading the Way” (Washington: Centre for Global Development). Ranganathan, Rupa, and V. Foster, 2011, "East Africa’s Infrastructure: A Continental Perspective," Policy Research Working Paper 5844 (Washington: World Bank). Robinson, David, Matthew Gaertner, and Chris Papageorgiou, 2011, “Tanzania: Growth
Acceleration and Increased Public Spending with Macroeconomic Stability,” in Yes Africa Can: Success Stories from a Dynamic Continent (Washington: World Bank).
Rodrik, Dani, 1999, “Where Did All the Growth Go? External Shocks, Social Conflict, and Growth Collapses,” Journal of Economic Growth, Vol. 4, No. 4, pp. 385–412. Romer, Paul M., 1990, “Endogenous Technical Change,” Journal of Political Economy, 98 (5), pp. S71–S102. Selassie, Abebe A., 2008, “Beyond Macroeconomic Stability: The Quest for Industrialization in Uganda,” IMF Working Paper 08/231 (Washington: International Monetary Fund). Tressel, Thierry, and Enrica Detragiache, 2008. “Do Financial Sector Reforms Lead to
Financial Development? Evidence from a New Dataset,” IMF Working Paper 08/265 (Washington: International Monetary Fund).
World Bank, 2012, Doing Business 2012 (Washington: World Bank) World Economic Forum, 2010, The Global Competitiveness Report 2010–2011 (Geneva: World Economic Forum). Xu, Guo, 2011, “Growth Accelerations Revisited,” Econ Journal Watch, Vol. 8, No. 1, pp 39–56. Yabara, Masafumi, 2011, “Capital Market Integration: Progress Ahead of the East African
Community Monetary Union,” IMF Working Paper 12/18 (Washington: International Monetary Fund).

53
Young, Alwyn, 2009, “The African Growth Miracle,” mimeo, Department of Economics, London School of Economics.
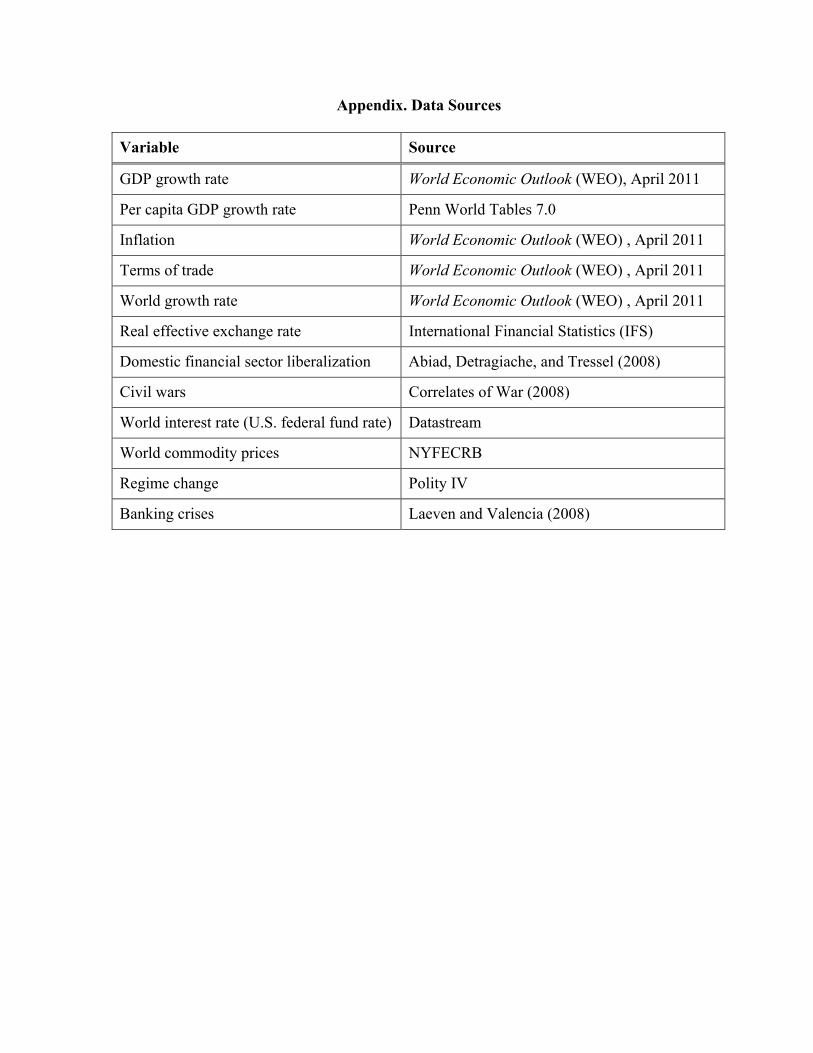
Appendix. Data Sources
Variable Source
GDP growth rate World Economic Outlook (WEO), April 2011
Per capita GDP growth rate Penn World Tables 7.0
Inflation World Economic Outlook (WEO) , April 2011
Terms of trade World Economic Outlook (WEO) , April 2011
World growth rate World Economic Outlook (WEO) , April 2011
Real effective exchange rate International Financial Statistics (IFS)
Domestic financial sector liberalization Abiad, Detragiache, and Tressel (2008)
Civil wars Correlates of War (2008)
World interest rate (U.S. federal fund rate) Datastream
World commodity prices NYFECRB
Regime change Polity IV
Banking crises Laeven and Valencia (2008)