Embed Size (px)
Citation preview

ervth
ob
ser
the
ear
www.nasa.gov
National Aeronautics and Space Administration
The Earth Observer. July - August 2011. Volume 23, Issue 4.
On June 10 the Argentinian Satélite de Aplicaciones Científicas (SAC)-D spacecraft launched into space from Vandenberg Air Force Base in California aboard a Delta II rocket—see photo below. SAC-D carries NASA’s Aquarius instrument, which was developed under the Earth System Science Pathfinder (ESSP) Program (similar to Cloudsat, CALIPSO and GRACE).
The launch was nominal and the SAC-D observatory is in the process of on-orbit checkout prior to turning on the instruments. The spacecraft is healthy and the telemetry looks good. Some delays have occurred with testing the attitude control system parameters. Turning on all of the Aquarius/SAC-D instruments is now likely to begin in mid-August and will take about one month.
continued on page 2
Editor’s CornerSteve PlatnickEOS Senior Project Scientist
Successful Liftoff for Delta II and Aquarius/SAC-D!
The United Launch Alliance Delta II rocket carrying the Aquarius/SAC-D spacecraft launched from NASA’s Space Launch Com-plex 2 at Vandenberg Air Force Base on June 10, 2011, beginning a three-year mission to study our planet’s salty seas. Liftoff was on-time at 7:20 a.m. PDT (10:20 a.m. EDT) capping a very smooth countdown with no technical or weather problems.
The Aquarius/SAC-D mission is a collabora-tion between NASA and Argentina’s space agency, with participation by Brazil, Canada, France, and Italy. NASA’s Launch Services Program at the Kennedy Space Center in Florida managed the launch. United Launch Alliance of Denver, CO, is NASA’s launch service provider.
Image credit: United Launch Alliance

The Earth Observer July - August 2011 Volume 23, Issue 4 02ed
itor's
cor
ner
Aquarius seeks to map Earth’s salty seas from space; the instrument will measure the concentration of Sea Sur-face Salinity (SST), i.e., dissolved salt at the ocean’s sur-face. The science community is eager to have this new measurement capability, which when combined with existing SST measurements will allow for determination
of the density driven circulation of the surface waters of the ocean.
Scientists will investigate how this circulation is tied to changes in rainfall and evaporation, the melting and freezing of ice, and examine its effect on climate variability.
Congratulations to Principal Investigator Gary Lager-loef and the entire Aquarius team.
Due to a bus undervoltage caused by the emergence of one or more weak battery cells, the CloudSat spacecraft entered emergency mode on April 18, 2011. Through fault protection, the radar was turned off, as were all non-essential spacecraft systems, and the spacecraft was commanded by fault protection into a spinning con-figuration with solar arrays canted +/-40°. With no ma-neuver capability, the spacecraft began to drift out of its A-Train control box and toward Aqua. The Aqua and Earth Science Mission Operations teams worked closely to develop a plan for Aqua to maneuver out of the way of CloudSat, if necessary. However, on June 18 Cloud-Sat was able to perform a maneuver to lower its orbit to avoid conjunction with the Aqua satellite, and on July 10 CloudSat passed under the Terra satellite. At this time, CloudSat is orbiting below the A-Train.
As of this writing, the spacecraft computer has been turned back on and the team has the ability to load commands to be executed from stored memory. The cloud radar is not powered on, but survival heaters keep all radar components safe. Steps toward recovery include: moving from the emergency mode to a sun-point-spin mode that will stabilize the battery charging profile; moving to an Earth-point mode; and then fi-nally turning on the cloud radar in late August or early September. Studies are underway to determine when, if, and in what location CloudSat will return to the A-Train once radar operations are restored.
On behalf of all users of A-Train data, we thank the en-tire CloudSat mission team for working tirelessly over the last few months to regain control of the spacecraft and wish them well in their continuing efforts.
A new Atmospheric Infrared Sounder AIRS team lead-ership is now in place. This follows the passing of long-time team leader Mous Chahine in March of this year. The new AIRS Science Team leader will be Joao Teix-eira. Tom Pagano will remain as AIRS Project Man-ager, George Aumann will become AIRS Instrument Scientist, and Eric Fetzer will become AIRS Project Scientist. On behalf of Aqua Project Scientist Claire Parkinson and me, I would like to extend our con-gratulations to Teixeira, Aumann, and Fetzer on their new positions. This impressive team is well positioned to follow through on Chahine’s vision and accomplish-ments for AIRS.
eos.nasa.gov
In This Issue
Editor’s Corner Front Cover
Feature Articles
The NASA CloudSat/GPM Light Precipita-tion Validation Experiment (LPVEx) 4
Paving the Way for Space-Based Air Pollution Sensors 9
NASA Comes Full Circle at the Odyssey of the Mind World Finals 13
DEVELOP Summer Students Learn First-hand the Practical Application of NASA Earth Science Research 16
Meeting/Workshop Summaries
CERES Science Team Meeting Summary 222011 HyspIRI Science Symposium 25Summary of International Glacier
Monitoring Summit 28MODIS Science Team Meeting 32NASA Land-Cover/Land-Use Change
Program 15th Anniversary Science Team Meeting 36
In The News
NASA Sets Sail on Second Leg of Arctic Ocean Research Voyage 40
For Aquarius, Sampling Seas No ‘Grain of Salt’ Task 42
Regular Features
NASA Earth Science in the News 44NASA Science Mission Directorate –
Science Education and Public Outreach Update 46
Science Calendars 47
Reminder: To view newsletter images in color, visit: eospso.gsfc.nasa.gov/eos_homepage/for_scientists/earth_observer.php
The Earth Observer July - August 2011 Volume 23, Issue 4 03
edito
r's c
orne
rMeanwhile, plans continue to develop future Earth ob-serving missions. On June 17, NASA’s Science Mission Directorate released an Announcement of Opportunity (AO) (NNH11ZDA012O), for Earth Venture-2 (EV-2). Earth Venture is another element within the ESSP Pro-gram that conducts principal investigator (PI)-led Earth science investigations relevant to the Science Mission Directorate’s Earth Science Division1. NASA expects to select one EV-2 mission to proceed into formulation and implementation. Launch Readiness Date (LRD) is to occur no later than April 30, 2017. The proposed missions must support the goals and objectives of the EV-2 element.
The solicitation closes on September 15, 2001. The full text of the AO and all appendices are available elec-tronically at: nspires.nasaprs.com/.
This announcement follows the EV-1 solicitation, which funded five sub-orbital projects2 in May 2010. The first of those experiments—Deriving Information on Surface conditions from Column and Vertically Resolved Observations Relevant to Air Quality (DIS-COVER-AQ)—is taking place during July in Mary-land; others are planned for later this year and beyond.
DISCOVER-AQ will collect measurements of pol-lution from aircraft and combine them with ground-based measurements taken at several locations around the state. Twelve to fourteen flights over major com-muter routes in Maryland (e.g., Interstate 95, Inter-state 695, and the Baltimore–Washington Parkway) are planned throughout July using two NASA planes. The P-3B, a four-engine turboprop that returned recently from a deployment to the Arctic, will carry a suite of nine instruments, while a smaller two-engine King Air UC-12 will carry two instruments. A third aircraft, a Cessna operated by the University of Maryland, will also participate in the campaign.
Scientists will use observations taken during DISCOVER-AQ to better understand and improve satellite retrieval algorithms of atmospheric constituents such as ozone, nitrogen dioxide, and particulate matter. In many cases, the current retrieval algorithms for these constituents do not do an adequate job distinguishing pollution located at low levels from pollution located at higher levels in the atmosphere. Improving this distinc-tion would make future satellites more useful tools to detect (and perhaps forecast) adverse health conditions. To learn more about DISCOVER-AQ read the article on page 9 of this issue.1 To learn more about the Earth Venture program see Steve Volz’s summary article in the September–October 2010 issue of The Earth Observer [Volume 22, Issue 5, pp. 13-18].2 To learn more about the projects funded under EV-1 please visit: science.nasa.gov/about-us/smd-programs/earth-system-sci-ence-pathfinder/. The table at the bottom of the page links to details on each project.
We also include an article on the Light Precipitation Validation Experiment (LPVEx) in this issue—see page 4—an experiment that took place September–Octo-ber 2010 in Finland. The data being collected during LPVEx are expected to help fill a knowledge gap in our current understanding of precipitation processes. A sig-nificant portion of the precipitation that falls poleward of 45° latitude has rainfall rates less than a few mm/hr. However, current retrieval algorithms used to measure precipitation from space do not do a good job detecting and/or quantifying this so-called light precipitation. This is especially true for multifrequency passive microwave radiometers—e.g., on the Tropical Rainfall Measuring Mission (TRMM) and the upcoming Global Precipita-tion Measurement (GPM) mission.
In an effort to improve the inventory of cool-season high-latitude light precipitation databases and to ad-vance our understanding of the physical process as-sumptions made in satellite-based precipitation retrieval algorithm development, NASA’s CloudSat and GPM validation teams joined with several other international partners to conduct LPVEx. Together, they made de-tailed measurements of light precipitation, leveraging the existing infrastructure at the Helsinki Precipitation Testbed. The experiment featured coordinated ground and airborne remote-sensing components designed to observe and quantify the precipitation physics associat-ed with light precipitation in low-altitude melting layer environments over the Gulf of Finland and neighboring land masses surrounding Helsinki, Finland. Please refer to the article for more details.
Finally, for the eleventh consecutive year, NASA spon-sored an Odyssey of the Mind (OM) long-term prob-lem and also was present at the OM World Finals, which took place May 27–30, 2011 at the University of Maryland, College Park, with over 15,000 student participants. Whether it was the NASA Science exhibit at the Creativity Festival, the Earth Science E-Theatre, or the Tour of the Electromagnetic Spectrum workshop in the Stamp Union, participants had opportunities for ex-posure to many facets of NASA. We invite you to read a summary of the activities on page 13 of this issue.

The Earth Observer July - August 2011 Volume 23, Issue 4 04tic
les
e ar
feat
urThe NASA CloudSat/GPM Light Precipitation Validation Experiment (LPVEx)Walter A. Petersen, NASA Marshall Space Flight Center, [email protected] L’Ecuyer, Colorado State University, [email protected] Moisseev, University of Helsinki, Finland, [email protected]
Introduction
Ground-based measurements of cool-season precipitation at mid- and high-latitudes (i.e., poleward of 45°N/S latitude) suggest that a significant fraction of the total pre-cipitation volume falls in the form of light precipitation—defined as having rainfall rates less than or equal to a few mm/hr. These cool-season—September 1–November 1—light rainfall events often originate in situations of a low-altitude (typically lower than 2 km) melting level and pose a significant challenge to the accuracy and reliabil-ity of all satellite-based precipitation measurements. This is especially problematic for measurements that rely on the use of multifrequency passive microwave (PMW) ra-diometers such as the one on CloudSat or the one planned for the upcoming Global Precipitation Measurement (GPM) mission.
As a result of the difficulties in accurately measuring light precipitation from satel-lites, significant disagreements exist between satellite estimates of rainfall accumula-tion poleward of 45°. Efforts to develop, improve, and ultimately evaluate physically based algorithms designed to detect and accurately quantify high-latitude rainfall are ongoing, but hindered by a general lack of detailed, observationally based ground-validation datasets. These kinds of datasets help to provide a physically consistent framework from which to test and refine assumptions used in satellite rain retrieval al-gorithms, and a means to build a library of algorithm retrieval databases in higher-lat-itude cold-season light-precipitation regimes. These databases are especially relevant to NASA’s CloudSat and GPM ground-validation programs that are collecting high-lat-itude precipitation measurements in meteorological systems associated with frequent cool-season light-precipitation events.
In an effort to improve the inventory of cool-season high-latitude light-precipitation databases and to advance the physical process assumptions made in satellite-based pre-cipitation retrieval algorithm development, the CloudSat and GPM mission ground-validation programs collaborated with the Finnish Meteorological Institute (FMI), the University of Helsinki (UH), and Environment Canada (EC) to conduct the Light Precipitation Validation Experiment (LPVEx). This field campaign was designed to make detailed measurements of cool-season light precipitation by leveraging existing infrastructure in the Helsinki Precipitation Testbed. LPVEx was conducted during September–October 2010 and featured coordinated ground and airborne remote sens-ing components designed to observe and quantify the precipitation physics associated with light precipitation in low-altitude melting-layer environments over the Gulf of Finland and neighboring land masses surrounding Helsinki, Finland.
Science Objectives
The LPVEx effort was designed around two overarching science objectives. These were to:
• Characterize the ability of CloudSat, GPM, and passive microwave radiometers in general, to detect and accurately estimate rainfall intensity at high-latitudes; and
• Provide a new database with requisite ice and liquid water content, size distribution, and precipitation information to test and verify critical assumptions being made in cur-rent and developing (e.g., GPM) space-based precipitation retrieval algorithms.
LPVEx was conducted during the months of September–October 2010 and featured co-ordinated ground and airborne remote-sensing components designed to observe and quantify the precipitation phys-ics associated with light precipitation in low-altitude melting layer environments over the Gulf of Finland and neighboring land masses surrounding Helsinki, Finland.

The Earth Observer July - August 2011 Volume 23, Issue 4 05
ticle
se
arfe
atur
In association with the aforementioned science objectives, a set of specific science questions to be addressed using the field campaign data include:
• What are the minimum rainfall rates that can be detected by current satellite pre-cipitation sensors in environments with freezing levels lower than 2 km?
• How will rainfall detection be improved by future platforms such as GPM?
• How well can existing new satellite sensors discriminate rainfall from snowfall?
• Are the microphysical assumptions, such as raindrop size distribution, cloud wa-ter contents, and properties of the melting layer and precipitating ice aloft, cur-rently employed in global satellite precipitation algorithms representative of high-latitude precipitation in a statistical sense?
• What is the impact of variability in these microphysical assumptions and those related to vertical structure and spatial heterogeneity on random errors in re-trieved rainfall rate?
• Collectively, are the above intersensor differences large enough to explain ob-served disagreements in current satellite estimates of high-latitude rainfall?
Methodology
Assessing the accuracy of rainfall products and quantifying uncertainties due to spe-cific algorithm components requires a combination of in situ measurements of cloud and precipitation profiles with collocated observations of surface rainfall. Therefore, the LPVEx observational and instrumentation strategy consisted of coordinated airborne microphysical sampling conducted within an extensive network of ground-based ob-servations focused on measurement of hydrometeor bulk water contents, precipitation rates, and drop size distributions (DSD). A complete list of the ground and aircraft sen-sors deployed during the experiment is presented in Tables 1 and 2, respectively. These instruments were deployed at three surface sites representative of island, coastal, and in-land regimes, while two disdrometer instruments (the optical disdrometer, ODM-470, and the laser-optical disdrometer, Parsivel) and a Micro Rain Radar (MRR) were de-ployed aboard the FMI Research Vessel Aranda during two weeks of cruises in the Gulf of Finland to provide an oceanic counterpart to the ground sites.
Table 1. LPVEx Ground Sensors
Disdrometers: 3 Two-dimensional (2D) video, 7 Parsivel, 1 Joss-Waldvogel
10+ rain gauges
ADvanced MIcrowave RAdiometer for Rain Identification (ADMIRARI) /Micro Rain Radar (MRR)
3 C-band dual-polarimetric radars (fully adaptable scanning geometry)
1 vertically-pointing C-band Doppler radar
2 Precipitation Occurrence Sensing Systems (POSS)
Ultra High Frequency (UHF) Wind Profiler
5 Micro Rain Radars (MRR)
Station for Measuring Ecosystem-Atmosphere Relation (SMEAR) aerosol/flux tower [University of Helsinki]
6 Ceilometers
The LPVEx observa-tional and instrumen-tation strategy consisted of coordinated airborne microphysical sampling conducted within an extensive network of ground-based observa-tions focused on mea-surement of hydrometeor bulk water contents, pre-cipitation rates, and drop size distributions (DSD).

The Earth Observer July - August 2011 Volume 23, Issue 4 06fe
atur
e ar
ticle
s Table 2. LPVEx Airborne Sensors [deployed on University of Wyoming King Air]
W-band cloud radar (multiple beams)Instruments to Measure Water Content: Droplet Measurement Technologies (DMT) probe; Gerber, Nevzorov probes Instruments to Observe Microphysics: two-dimensional Cloud Droplet Imaging Probe (2D-P CIP), Cloud Droplet Probe (CDP), Forward-Scattering Spectrometer Probe (FSSP) and 2D-C particle imaging probesPassive Cavity Aerosol Spectrometer Probe (PCASP-100X)Ancillary Relative Humidity (RH), Temperature (T), altitude, and wind speed sensors.
Figure 1. Observing strategy dur-ing LPVEx. Predetermined posi-tions of stacked flight track legs executed during the campaign are indicated by black vectors. Filled circles indicate position of spiral ascent and descent aircraft tracks over intensive instrumen-tation sites. C-band dual-po-larimetric radars were located at Kumpala and Kerava in Finland, with an additional operational radar located at Vantaa. To view newsletter images in color, visit: eospso.gsfc.nasa.gov/eos_homepage/for_scientists/earth_observer.php.
The LPVEx field campaign strategy centered around the collection of hydrometeor information describing phase and shape characteristics, DSD, and surface rainfall in-tensity using an array of ground and air-based measurements. Figure 1 summarizes the observing strategy used to collect both vertical and spatial distributions of hydro-meteor characteristics through well-calibrated, multifrequency, polarimetric radar ob-servations. These measurements are then translated into larger three-dimensional (3D) volume estimates similar to what a satellite “sees” at higher latitudes. When combined with temperature, humidity, wind, aerosol concentration, and cloud water profile in-formation from the W-band Wyoming Cloud Radar (WCR) aboard the aircraft, these observations will provide a full 3D volume depiction of rainfall scenes and their associ-ated meteorology. When combined with appropriate satellite simulators, these 3D vol-umes can be used to differentiate the detection characteristics and evaluate algorithm performance for all current rainfall platforms—including PMW imagers and sound-ers and the CloudSat Cloud Profiling Radar (CPR)—and assist in developing the next generation of satellite rainfall retrieval algorithms for the GPM Microwave Imager (GMI) and Dual-frequency Precipitation Radar (DPR). In other words, using pre-cipitation characteristics information obtained during LPVEx will help improve algorithms which translate satellite measurements into more-accurate estimates of surface rainfall.
A Day in the Life of LPVEx
Operations on any given day of LPVEx typically involved an early morning weather briefing given by FMI forecasters, followed by an aircraft briefing to make final go/
The Earth Observer July - August 2011 Volume 23, Issue 4 07
feat
ure
artic
lesno-go decisions and to determine track positions for the day’s sampling. The targets
for sampling were preferably widespread stratiform rain or snow systems, although data were also collected to study the backscatter cross-section of the ocean surface on clear days. For days having aircraft missions, Finnish air traffic control typically pro-vided a 4–5-hour operations window from approximately 0630–1130 UTC in which 3.5-hour missions were conducted using the University of Wyoming King Air that was based in Turku. During airborne sampling, the radars operated in a combination of narrow-sector volume scans and repeating Range-Height Indicator (RHI) scans to provide combined horizontal coverage over the sampling volume and high-resolution vertical sampling of the column. Surface instrumentation operated continuously dur-ing the campaign, while the aircraft conducted coincident stacked legs and spiral as-cents or descents over the ground sites (when possible) within the coverage of the po-larimetric radars.
Preliminary Results
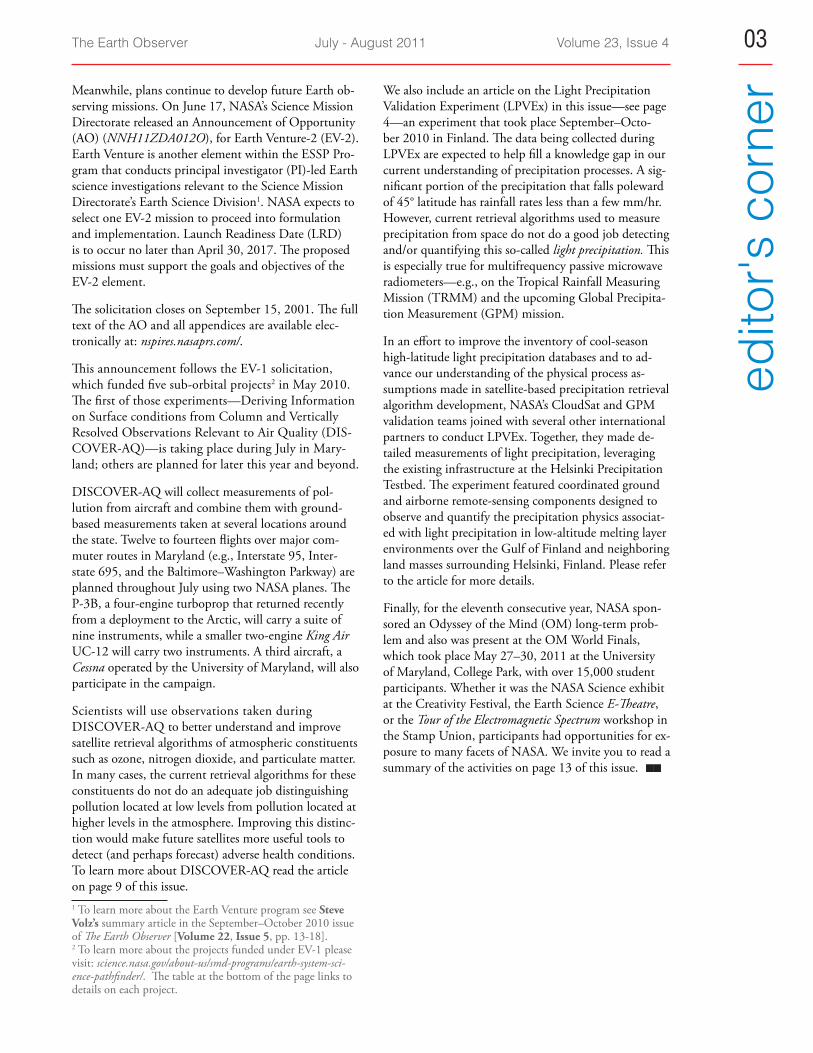
Observed DSDs and rainfall rates during the LPVEx intensive observations period (IOP) inferred from the Joss-Waldvogel disdrometer at the inland Järvenpää site (lo-cated ~20 km north of Helsinki) are shown in Figure 2. Also depicted are the dates of the 15 research flights that were conducted during the experiment. By design, the ob-servations straddled the transition from the deeper 3 km freezing levels characteristic of late summer precipitation to much shallower freezing levels (~1 km) and even light snowfall toward the end of the experiment. Both isolated convective and widespread stratiform rainfall were sampled during the experiment, and the observations spanned a wide spectrum of rainfall intensities from light drizzle to rain rates exceeding 10
mm/hr. Drier conditions during the middle of the experiment were used to conduct four additional research flights in non-precipitating clouds and cloud-free conditions to provide additional datasets for evaluating W-band cloud retrievals and to examine the relationship between ocean backscatter and wind speed at a range of view angles.
Examples from several of the datasets collected during LPVEx are presented in Fig-ure 3, illustrating the overall observing strategy that was adopted for the experiment as described above. In particular, the widespread light rainfall event from Octo-ber 20, 2010 is representative of the type of precipitation targeted by LPVEx. The freezing level was approximately 1 km; observed rainfall rates at the surface ranged from light drizzle to about 5 mm/hr during the 3.5-hour research flight (RF15). The lower left panel of Figure 3 shows Kumpula C-band radar reflectivity observa-tions, which illustrate the widespread nature of the precipitation around the Helsin-ki area at 0920 UTC. Near this time, the King Air conducted a spiral descent from 10,000–1,000 feet (3048–304 m) at a rate of 500 feet per minute (fpm; 152 mpm) within the coverage of repeated RHI and small-sector volume scans from the Kum-pula and Kerava radars, respectively. Cross-sections of the Kumpula radar reflectiv-ity, copolar correlation coefficient (rHV) and differential reflectivity (Zdr) are shown
Figure 2. Surface rainfall ob-servations at the Järvenpää site during LPVEx. Each numbered circle represent one of the 15 research flights conducted dur-ing the field campaign. Size dis-tribution parameters (D0 and N0) are presented in the middle and lower panels, respectively.

The Earth Observer July - August 2011 Volume 23, Issue 4 08fe
atur
e ar
ticle
s
Figure 3. October 20, 2010 was an “ideal day” for LPVEx observations. On that day, widespread light precipitation was falling over the study area in Finland. Shown here is a sampling of data collected on October 20 at the Emasalo coastal site. These are charac-teristic of the kinds of mea-surements taken throughout LPVEx. For more specific de-tails on what is shown above, please refer to the article text. To view newsletter images in color, visit: eospso.gsfc.nasa.gov/eos_homepage/for_scientists/earth_observer.php.
with a corresponding cross-section taken from the WCR in the upper left and center panels of Figure 3, respectively. Simultaneous reflectivity observations from the 24-GHz MRR and ADMIRARI based at Emasalo are also presented in the lower central portion of Figure 3, and provide constraints on cloud base and freezing level height as well as column-integrated liquid water amounts.
Collectively, this combination of bulk multi-frequency and dual-polarimetric radar remote sensing observations can be related to detailed ice, liquid, and melting-layer microphysics information provided by the imaging probes aboard the height-profiling aircraft, as well as to surface rainfall and DSD information from disdrometers located on the ground at Emasalo. When combined with ancillary observations of tempera-ture, humidity, and surface wind speed, these data collectively allow the observed multi-wavelength radar and radiometric signatures to be related to both the vertical structure of cloud and precipitation microphysics in the atmospheric column and the rainfall intensity at the surface, providing the essential building blocks for developing and testing both active and passive satellite rainfall retrieval algorithms.
Expected Outcomes
The LPVEx IOP has provided coordinated sampling of cloud and precipitation micro-physics profiles, a diverse set of multi-wavelength radar and ground-based radiometer measurements, and surface rainfall/DSD observations in this under sampled high-lati-tude, cool-season environment. Given the limited number of observations linking mi-crophysics, thermodynamics, and precipitation in shallow freezing-level environments, it is anticipated that LPVEx will fill a valuable data gap for rainfall algorithm evalua-tion and development outside of the tropics. In support of this expectation, LPVEx will provide:
• Quantitative assessment of the detection characteristics of a variety of satellite-based rainfall sensors, including current PMW imagers and sounders, the Cloud-Sat CPR, and GPM’s GMI and DPR in shallow freezing level environments.
continued on page 21

The Earth Observer July - August 2011 Volume 23, Issue 4 09
feat
ure
artic
lesPaving the Way for Space-Based Air
Pollution SensorsAdam Voiland, NASA’s Earth Science News Team, [email protected]
Although the nation’s air has grown significantly cleaner in recent decades, about 40% of Americans—124-million people—live in counties where pollution levels still regularly exceed national air quality standards established by the Environmental Pro-tection Agency (EPA).
Most of the areas with the heaviest pollution are in California, but other parts of the country are anything but immune. On the drive down Interstate 95 between Balti-more and Washington DC, for example, sweltering summer heat and relentless traffic often leave plumes of polluted air stewing over the highway, making the area one of the top 20 smoggiest metropolitan areas in the country.
Come July, all of that health-sapping pollution will have company: a 117-ft (35.7-m) P-3B NASA research aircraft, flying spirals over six ground stations in Maryland. The aircraft is part of a month-long field campaign designed to improve satellite measure-ments of air pollution.
The name of the experiment—Deriving Information on Surface conditions from Col-umn and Vertically Resolved Observations Relevant to Air Quality (DISCOVER-AQ)—is a mouthful, but its purpose is simple.
“We’re trying to fill the knowl-edge gap that severely limits our ability to monitor air pollution with satellites,” said James Craw-ford, the campaign’s principal in-vestigator and a scientist based at NASA’s Langley Research Center in Hampton, VA.
The fundamental challenge for satellites measuring air quality is to distinguish between pollution near the surface and pollution higher in the atmosphere. Mea-surements from aircraft, in combination with ground-based measurements, offer a key perspective that makes such distinctions easier to make.
Between 12 and 14 flights are planned throughout July, using two primary planes. The P-3B, a four-engine turboprop (shown in Figure 1) that returned recently from a deployment to the Arctic, will carry a suite of nine instruments, while a smaller, two-engine King Air UC-12 will carry two instruments.
Both aircraft will measure the colorless gas ozone and a mixture of soot and other substances known as particulate matter (PM). Other instruments on the P-3B will measure pollutants that lead to the formation of ozone, such as nitrogen dioxide and formaldehyde. A third aircraft, a Cessna operated by the University of Maryland, will also participate in the campaign.
While the King Air UC-12 will cruise at high altitudes—about 26,000 ft (8 km)—the P-3B will fly corkscrew patterns over six ground stations in Maryland that will bring the plane from its highest altitude of about 15,500 ft (4.7 km) to as low as 1,000 ft (305 m).
The fundamental chal-lenge for satellites mea-suring air quality is to distinguish between pollution near the sur-face and pollution higher in the atmo-sphere. Measurements from aircraft, in com-bination with ground-based measurements, offer a key perspective that makes such distinc-tions easier to make.
Figure 1. NASA’s P-3B is a four-engine turboprop, capable of long-duration flights of 8–12 hours. It is based at NASA’s Wallops Flight Facility. Image credit: NASA

The Earth Observer July - August 2011 Volume 23, Issue 4 10fe
atur
e ar
ticle
s
Sampling will focus on an area extending from Beltsville, MD, in the southwest to the northeastern corner of Maryland in a pattern that follows major traffic corridors, over-flies ground measurement sites operated by the Maryland Department of the Environ-ment, and observes conditions over the northern Chesapeake Bay—shown in Figure 2.
The two instruments aboard the King Air UC-12 will look down at the surface, much like a satellite-based instrument, to measure particles and trace gases. The P-3B, in contrast, will sample the air it flies through, allowing it to take air samples from a vari-ety of altitudes.
The July flights are the first leg of a broader five-year campaign that will bring the air-craft to Houston, TX and other polluted regions.
Measuring Health-sapping Particles From Above
Overall, the World Health Organization estimates that air pollution causes some two-million premature deaths globally per year. Pollutants can spark a whole range of dis-eases including asthma, cardiovascular disease, and bronchitis.
Since many countries, including the U.S., have large gaps in ground-based air-pollu-tion-monitoring networks, experts look to satellites to provide a global perspective. Satellites have been collecting information about the main air pollutants that affect human health for more than a decade, yet they have struggled to achieve accurate measurements of the pollutants in the air near the surface—i.e., the air people actu-ally breathe.
The problem is that most satellite instruments can’t distinguish pollution close to the ground from that high in the atmosphere. In addition, clouds can block the view, and
Figure 2. Map showing details on flights planned during DISCOVER-AQ.

The Earth Observer July - August 2011 Volume 23, Issue 4 11
feat
ure
artic
lesbright land surfaces, such as snow, desert sand, and those found in certain urban areas
can prevent accurate measurements.
“We’re better with some pollutants than others, but broadly speaking we have diffi-culty distinguishing between pollutants high in a given column of air, which we can see quite well with satellites, and pollutants at the surface,” said Kenneth Pickering [DISCOVER-AQ—Project Scientist].
As a result, questions remain about the vertical distribution of pollutants. How far up in the atmosphere are morning and evening spikes in pollution associated with rush hour noticeable? How does ozone, which peaks near the surface in the afternoon, be-have at other altitudes throughout the day? When is the best time of the day for satel-lites to measure various pollutants?
The problem is particularly pro-nounced for pollutants that are abundant at the surface and higher in the atmosphere. For ex-ample, a Code Red air quality day during the summer might pro-duce very high concentrations of ozone in the bottom few kilome-ters of the atmosphere, yet gener-ate a change of a mere 1–2% to a total column of ozone.
Studies suggest that discrepan-cies of as much as 30–50% exist between estimates of ground ni-trogen dioxide inferred from the Ozone Monitoring Instrument (OMI), an instrument on NASA’s Aura satellite, launched in 2004, and measurements from ground-based instruments.
A Three Dimensional Picture
DISCOVER-AQ will address such problems by helping researchers develop a three-dimensional view of how air pollutants are distributed and move between different levels of the atmosphere throughout the day.
An array of ground-based instruments will offer a critical view of the same regions of air the aircraft are monitoring from above. While NASA sponsors certain ground in-struments, other institutions—including the EPA, the Maryland Department of the Environment, Howard University, and Pennsylvania State University—manage the in-struments at the ground stations such as the one depicted in Figure 3.
One of the stations in Edgewood, MD is particularly well suited for monitoring how sea breezes that blow in from the Chesapeake Bay and trap pollutants over land con-tribute to some of the most severe ozone problems in Maryland, according to Anne Thompson [Pennsylvania State University—Professor of Meteorology].
It’s rare for researchers to have an opportunity to use such an array of instruments at once. “It’s not just one instrument that’s most important—it’s really the combination of all of them that makes this campaign valuable,” said Jennifer Hains [Maryland De-partment of the Environment—Research Statistician].
Figure 3. The DISCOVER-AQ aircraft will fly over this ground station in Beltsville and five other locations in Maryland. Image credit: Jennifer Hains [Maryland Department of the Environment]

The Earth Observer July - August 2011 Volume 23, Issue 4 12fe
atur
e ar
ticle
s
Figure 4. This image shows nitrogen dioxide (NO2) across the U.S. for2006. Nitrogen dioxide is a traffic-related pollutant that mainly occurs over large populated regions, heavily industrialized areas, and power plants. The darkest areas indicate the highest levels of NO2 Credit: NASA
Scientists will use information collected during the DISCOVER-AQ campaign to improve measurements from existing satellites and to help establish parameters for future NASA satellite missions that will monitor air quality. An example of relevant information for nitro-gen dioxide is found in Figure 4.
“Achieving better measurements of the column at a vari-ety of altitudes is critical to connecting what’s happening at the surface to what we’re seeing from above with satel-lites,” said Scott Janz [Goddard Space Flight Center].
Future satellites could play a key role in helping com-munities meet national air quality standards. Although
ozone and PM2.5 (particulate matter up to 2.5 µm in size) have declined in recent decades across the nation. Many areas, including the entire Baltimore–Washington region, still frequently experience days in which air pol-lution levels exceed standards established by the EPA.
Over the last five years, for example, Maryland has ex-ceeded ozone standards on average 36 days per year and exceeded PM2.5 standards on average 10 days per year, according to the Maryland Department of the Environ-ment. Last year, ozone proved particularly potent: Mary-land exceeded ozone standards on 43 days.
Track the Progress of This Summer’s DISCOVER-AQ Mission in Real-timeCommuters on busy roadways in Maryland this summer may witness some large low-flying aircraft circling overhead. They need not be alarmed. The aircraft are collecting data on air pollution over the Baltimore–Washington area as part of the DISCOVER-AQ field campaign. The information collected around several ground stations in Maryland (and eventually over other areas in the U.S.) is expected to help improve the ac-curacy of satellite retrievals of air pollution.
The mission—Deriving Information on Surface Conditions from Column and Vertical Resolved Observa-tions Relevant to Air Quality (DISCOVER-AQ)—is a campaign designed to increase our understanding of atmospheric composition and near-surface pollution. Scientists will use information collected during the DISCOVER-AQ campaign to improve measurements from existing satellites and to help establish param-eters for future NASA satellite missions that will monitor global air quality.
To learn more about DISCOVER-AQ or follow daily progress on the Science Team Webpage, visit: discov-er-aq.larc.nasa.gov/. For daily reports, flight reports, and quick look data reports, click on “Planning” from the menu bar.

The Earth Observer July - August 2011 Volume 23, Issue 4 13
feat
ure
artic
lesNASA Comes Full Circle at the Odyssey of the Mind
World FinalsHeather Hyre, NASA Goddard Space Flight Center, [email protected] Graham, NASA Goddard Space Flight Center, [email protected]
Many of the daunting global problems our society faces today are difficult—if not im-possible—to solve working by ourselves. However, when we pull together a talented team and unleash a little creativity, problems that may at first seem insurmountable become more manageable and even solvable. This is exactly the spirit behind the Od-yssey of the Mind (OM) World Finals competition. Every year, teams composed of the best and brightest students from around the world gather to compete for the title of OM World Champion.
For the eleventh consecutive year, NASA’s Earth Observing System Project Science Office (EOSPSO) sponsored an OM long-term problem (a problem to be solved during the school year). This year’s problem title was Full Circle. While change is ever-present, the Full Circle problem tasked students with presenting a “humorous performance where something changes form or appearance at least three times and eventually undergoes a final change where it returns to its original form and appearance.”
The 2011 OM World Finals took place May 27–30 at the University of Maryland, College Park. Students, coaches, parents, and community members alike gathered from around the world for this year’s competition. Over 15,000 OM participants came to Maryland that weekend, filling buildings, dormitories, and hallways, spilling onto sidewalks and crosswalks all over the campus.
Among the hustle and bustle of creative minds hard at work, costume changes, group anticipation, and readiness, there were a number of activities for all ages happening around the campus, including several NASA-sponsored activities. Whether it was the NASA Science exhibit at the Creativity Festival at the Reckord Armory, the Earth Sci-ence E-Theatre at the Hoff Theatre in the Stamp Student Union, or the Tour of the Electromagnetic Spectrum workshop in the Stamp Union, participants were exposed to NASA’s many facets.
The NASA Science exhibit featured a large 40’x40’ Earth Tent, Earth Observatory Image Pairs (depicting global change), the NASA @ Home and City interactive kiosk, and scale models of future space exploration vehicles. An assortment of outreach materials and ac-tivities, including a scavenger hunt, were offered throughout the duration of the event, addressing topics ranging from galaxy identification to calculating one’s very own carbon footprint. Students, teachers, coaches, and even parents were able to collect NASA Earth and Moon jigsaw puzzles, calendars, holographic bookmarks, What is a Planet DVDs, and
This year’s problem title was Full Circle. While change is ever present, the Full Circle prob-lem tasked students with presenting a “humor-ous performance where something changes form or appearance at least three times and eventu-ally undergoes a final change where it returns to its original form and appearance.”
Inside the Earth Tent, OM participants, coaches, and even parents learn about NASA science.

The Earth Observer July - August 2011 Volume 23, Issue 4 14fe
atur
e ar
ticle
s
more. Many participants from the U.S. and other countries—including China, Poland, Canada, Mexico, South Korea, and Germany—excitedly visited the NASA Science exhibit.
Twelve hands-on, hour-long, Tour of the Electromagnetic Spectrum workshops captured the attention of more than 200 students. The interactive classroom experience offered participants opportunities to understand how the electromagnetic spectrum works, through hands-on experience with activities such as:
• exploring color mixing with LED lights;
• having fun with an infrared camera;
• building their own spectroscope;
• using a spectrometer; and
• exploring multiple wavelengths using wireless speakers, lasers, fluorescent lights, remote controls, and more.
The Earth Science E-Theatre provided students with an hour-long immersion in NASA Earth Science data. The presentation included a series of dramatic high-definition vi-sualizations of our home planet’s atmosphere, oceans, and land surfaces. The imagery comes from NASA’s Earth-observing satellites and computer models.
The three-day event began with Paul Hertz, Chief Scientist of NASA’s Science Mission Directorate, giving a five-minute opening presentation during the Opening Ceremo-nies held at the Comcast Center. Hertz is a veteran of OM, having been a parent of a participant, coach, and judge, and his remarks captivated the over 8,000 in attendance. The event ended with a closing ceremony at Comcast where the winners of each divi-sion were announced. While the results highlight groups with exquisite talent, all of the participants are recognized for the dedication, creative thinking, perseverance, and team-work necessary for advancement to the World Finals competition. The winners are:
Division 1
1st Place: Beverly Woods Elementary School—Charlotte, NC2nd Place: River Oaks Elementary School Team A—Houston, TX3rd Place: Anglo Chinese School Junior 2—Singapore, Singapore4th Place (tied for 4th): Thornapple Kellogg Elementary School 2—Middleville, MI4th Place (tied for 4th): Szkola Podstawowa W Pogórzu—Pogórze, Poland5th Place: Lawton Chiles Elementary School—Tampa, FL6th Place: Saxe Middle School Team A—New Canaan, CT7th Place: St. Jude the Apostle Catholic School—Atlanta, GA
The event ended with a closing ceremony at Comcast where the winners of each divi-sion were announced. While the results reveal groups with exquisite talent, all of the par-ticipants are recognized for the dedication, cre-ative thinking, perse-verance, and teamwork necessary for advance-ment to the World Fi-nals competition.
Ginger Butcher [NASA HQ—Science Writer and Instructional Designer] led students on a Tour of the Electromagnetic Spectrum. Here, the students learn about the benefits of using an infrared (i.e., thermal) camera to “see” through the atmosphere and dust in space.

The Earth Observer July - August 2011 Volume 23, Issue 4 15
feat
ure
artic
lesDivision 2
1st Place: J.P. Case Middle School—Flemington, NJ2nd Place: Gimnazjum NR 4 W Gdynia—Gdynia, Poland3rd Place: Forest Hills Central Middle School—Grand Rapids, MI4th Place (tied for 4th): Charles Ellis Montessori School—Savannah, GA4th Place (tied for 4th): Raffles Girls’ Secondary School—Singapore, Singapore5th Place (tied for 5th): South Middle School—Eau Claire, WI5th Place (tied for 5th): James Madison Middle School—Roanoke, VA6th Place: Harper Park Middle School Team A—Leesburg, VA7th Place (tied for 7th): Panorama G/T Program—Panora, IA7th Place (tied for 7th): Enka Middle School—Candler, NC7th Place (tied for 7th): Bethlehem Central Middle School—Delmar, NY
Division 3
1st Place: Myers Park High School White—Charlotte, NC2nd Place: Stowe Playhouse—Stowe, VT3rd Place: Wake Forest-Rolesville High School—Wake Forest, NC4th Place: Stillwater Creativity Boostr A—Stillwater, OK5th Place: III Liceum Gdansk Topolówka—Gdańsk, Poland6th Place: West Potomac High School—Alexandria, VA7th Place (tied for 7th): Anglo Chinese School Independent—Singapore, Singapore7th Place (tied for 7th): Bear River High School—Grass Valley, CA7th Place (tied for 7th): Edmond North High School—Edmond, OK
Division 4
1st Place: III Liceum Ogólnoksztalcące—Gdynia, Poland2nd Place: North Dakota State University—Fargo, ND
NASA is able to reach the minds of over two million people around the world through its sponsorship of OM. Year-round support will continue being delivered via NASA’s Earth Observatory/OM website: earthobservatory.nasa.gov/odysseyofthemind/. The site has been designed specifically for OM students and coaches, providing help-ful resources for exploration and examination of Earth system science.
NASA looks forward to supporting next year’s World Final long-term problem: Weird Science. Teams will select a location, based on NASA Earth Observatory Images, to represent the area where their team will “uncover the cause of mysterious events”. The event will be held at Iowa State University May 23–27, 2012. To find out more about Odyssey of the Mind, visit the official website at: www.odysseyofthemind.com/.
Participants in the Tour of the Electromagnetic Spectrum work-shop work in pairs to calculate vegetation reflectance values using spectrometers.

The Earth Observer July - August 2011 Volume 23, Issue 4 16fe
atur
e ar
ticle
s DEVELOP Summer Students Learn Firsthand the Practical Application of NASA Earth Science ResearchAnup Myneni, DEVELOP National Program, Langley Research Center, [email protected] Phoebe Doty, DEVELOP National Program, [email protected] Nate Makar, DEVELOP National Program, [email protected]
Introduction
This summer 140 students and young professionals had the opportunity to conduct research on the application of NASA science technology to real-world environmental issues. The DEVELOP National Program, a NASA Applied Sciences training and development program, provides domestic and international students and young professionals with experience in examining satellite remote sensing data and integrating results of their analyses into decision-making support tools. The program hosts domestic and international students from high school through graduate school, at nine locations across the U.S. and one in Monterrey, Mexico. Students have the opportunity to apply NASA Earth observing satellite data to local environmental concerns, bridging the gap between NASA’s remote sensing capabilities and the public good for communities around the globe. In this way, the DEVELOP program demonstrates the practical benefits of NASA Earth Science research. DEVELOP teams collaborated with partner organizations at the local,
regional, and international levels, working on project teams with topics ranging from agricultural monitoring in the Midwest U.S. to water quality in Kenya.
Six of the nine U.S. locations are at NASA centers—Ames Research Center (ARC), Goddard Space Flight Center (GSFC), Jet Propulsion Laboratory (JPL), Langley Research Center (LaRC), Marshall Space Flight Center, (MSFC), and Stennis Space Center (SSC)—while three are located in regional offices—Mobile County Health Department (MCHD) in Alabama, the Great Lakes and St. Lawrence Cities Initiative in Illinois, and the Wise County
Clerk of Court’s Office in Virginia. During the Summer 2011 term 23 projects were conducted under the guidance of NASA science advisors and partner organizations, all looking to enhance NASA’s Earth Science investments by enabling and empowering the next generation of young professionals.
Langley Research Center
The Langley Research Center—headquarters of the DEVELOP program—hosted 62 students during the summer term. Several LaRC DEVELOP teams focused their research on natural disasters and related environmental phenomena. The Russia Disasters and Human Health Team used data from the Ozone Monitoring Instrument (OMI) on the Aura spacecraft and the Multi-angle Imaging SpectroRadiometer (MISR) and Advanced Spaceborne Thermal Emission and Reflection Radiometer (ASTER) on the Terra spacecraft to monitor the widespread impacts of the 2010 Russian wildfires. Another LaRC team studied pumice rafts caused by shallow marine
During the Summer 2011 term, 23 DEVELOP projects were conducted under the guidance of NASA science advisors and partner organizations, all looking to maximize NASA’s Earth Science investments by enabling and empowering the next generation of young professionals.
DEVELOP students at Lang-ley Research Center tour Lang-ley’s new Headquarters build-ing, “New Town”, a platinum LEED building.
The Earth Observer July - August 2011 Volume 23, Issue 4 17
feat
ure
artic
lesvolcanism in the Pacific Ocean. According to student researcher Lindsey Honaker,
the team worked to “identify and monitor hazards in the Pacific in ways that enable future groups to protect ships and coastal communities.” This student project used data from OMI and the Ocean Surface Topography Mission/Jason-2, and Cloud-Aerosol Lidar and Infrared Pathfinder Satellite Observations (CALIPSO) satellites in its work, which was completed in partnership with the Smithsonian Institute Global Volcanism Program. A third LaRC team investigated the capabilities of NASA Earth observations to detect, monitor, and mitigate the destruction caused by the March 2011 Japanese earthquake and tsunami. The Japan Disaster Team focused on the creation of unique visualizations to display the extent of damage and to demonstrate the feasibility of using NASA EOS data in similar disaster situations. DEVELOP projects at LaRC spanned a wide array of scientific research areas and concerns, including public health and water quality. For example, the Midwest Agriculture and Climate Team created a methodology for identifying tillage practices using data collected by the Hyperion imaging spectrometer on the Earth Observing (EO)-1 satellite, the ASTER instrument onboard Terra, and the Thematic Mapper and Enhanced Thematic Mapper on Landsat 5 and 7, respectively. This newly developed methodology improves decision-making processes for end users, such as analyses relating to carbon crediting in the U.S. Department of Agriculture. Another team of LaRC students monitored the impacts of forest fragmentation on bird populations in the greater Washington, DC area. The team partnered with the U.S. Fish and Wildlife Service to use Landsat satellite data along with data collected from ASTER and the two orbiting Moderate Resolution Imaging Spectroradiometer (MODIS) instruments to improve endangered species monitoring and land management. An additional LaRC team partnered with the National Ocean Service and the National Oceanic and Atmospheric Administration (NOAA) to investigate the impact of climate change on water quality and algal blooms in the Atlantic Ocean. This project made use of NASA remote sensing technology, including the Sea-viewing Wide Field-of-view Sensor (SeaWiFS), MODIS, and NOAA’s Advanced Very High Resolution Radiometer (AVHRR). LaRC’s Highly-portable Immersive Virtual Environment (HIVE) team developed a lightweight and portable immersive visualization system, which was used by student researchers to display Earth science data and engineering models to help convey other teams’ project methodologies and results. Stennis Space Center
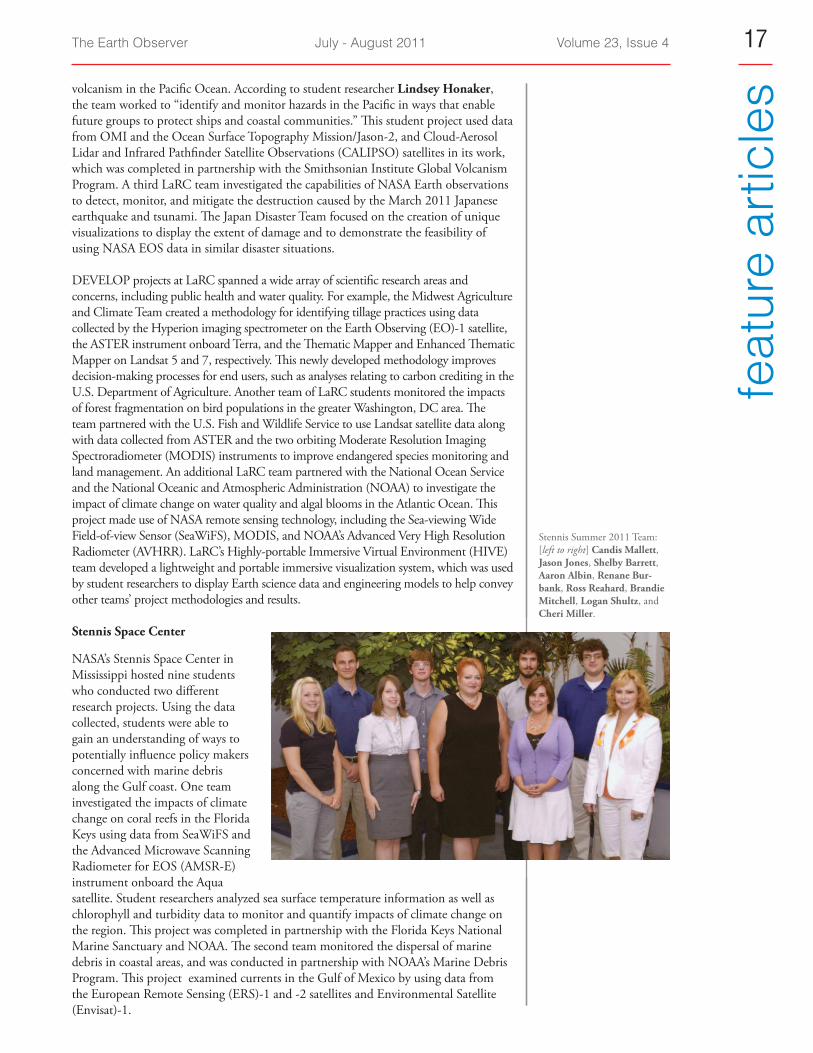
NASA’s Stennis Space Center in Mississippi hosted nine students who conducted two different research projects. Using the data collected, students were able to gain an understanding of ways to potentially influence policy makers concerned with marine debris along the Gulf coast. One team investigated the impacts of climate change on coral reefs in the Florida Keys using data from SeaWiFS and the Advanced Microwave Scanning Radiometer for EOS (AMSR-E) instrument onboard the Aqua satellite. Student researchers analyzed sea surface temperature information as well as chlorophyll and turbidity data to monitor and quantify impacts of climate change on the region. This project was completed in partnership with the Florida Keys National Marine Sanctuary and NOAA. The second team monitored the dispersal of marine debris in coastal areas, and was conducted in partnership with NOAA’s Marine Debris Program. This project examined currents in the Gulf of Mexico by using data from the European Remote Sensing (ERS)-1 and -2 satellites and Environmental Satellite (Envisat)-1.
Stennis Summer 2011 Team: [left to right] Candis Mallett, Jason Jones, Shelby Barrett, Aaron Albin, Renane Bur-bank, Ross Reahard, Brandie Mitchell, Logan Shultz, and Cheri Miller.
The Earth Observer July - August 2011 Volume 23, Issue 4 18fe
atur
e ar
ticle
s Marshall Space Flight Center
In collaboration with NASA’s Marshall Space Flight Center, the DEVELOP National Program at the University of Alabama at Birmingham (UAB) hosted 12 summer students who conducted two projects related to water quality and environmental change. One of the projects monitored fish habitat and correlated population change along the Cahaba River in Alabama using Landsat 5 and 7 satellite data as well as aerial photography from Digital Globe, a commercial vendor of space imagery. The project, which has the potential to strengthen local water and land management decision-making processes, allowed the student researchers to partner with the Cahaba River Society and the UAB. A second research team used NASA Earth observations, including measurements acquired by instruments on the Landsat 5 and 7 satellites as well as ASTER onboard Terra, to identify locations of endangered and/or threatened species in Georgia’s Providence Canyon. Working alongside officials from Georgia State parks and other historic sites, these students mapped the habitat of several rare species in Georgia, including the plumleaf azalea.
Ames Research Center
The DEVELOP team at Ames Research Center hosted 18 students who investigated diverse environmental issues using NASA remote sensing technology. Students at Ames were able to explore unique issues involving ecology, climate, and agriculture
through the use of data from NASA satellites and partnerships with influential organizations. The California Climate and Ecology Team researched regional meteorological patterns, such as the spatial distribution of fog along the California coast. Students partnered with the National Park Service and used the AVHRR to supplement images taken from MODIS to map meteorological patterns and to demonstrate patterns and change along the coast. Students in a second ARC project worked alongside the U.S. Geological Survey (USGS) and conservation groups to map the invasive pepperweed species. The
team used data collected by instruments on the Landsat satellites as well as MODIS and ASTER to record the distribution of pepperweed in the South San Francisco Bay Salt Ponds. The third ARC research team investigated water availability for California’s Central Valley by collecting data from Landsat instruments, as well as MODIS and ASTER instruments. This team partnered with the USGS Groundwater Resources Program and the California Department of Water Resources to create crop models that help evaluate crop distributions based on water supplies. Goddard Space Flight Center
The Goddard Space Flight Center provided 10 students the opportunity to research water management, public health, and ecological forecasting issues. The three groups of students at GSFC used NASA technology to collect data that could potentially influence public health and ecology, providing the students excellent learning opportunities while solving real-world environmental issues. One project partnered with Maryland Department of Natural Resources to focus on Maryland’s ecology to investigate the distribution of native as well as invasive Maryland species. This
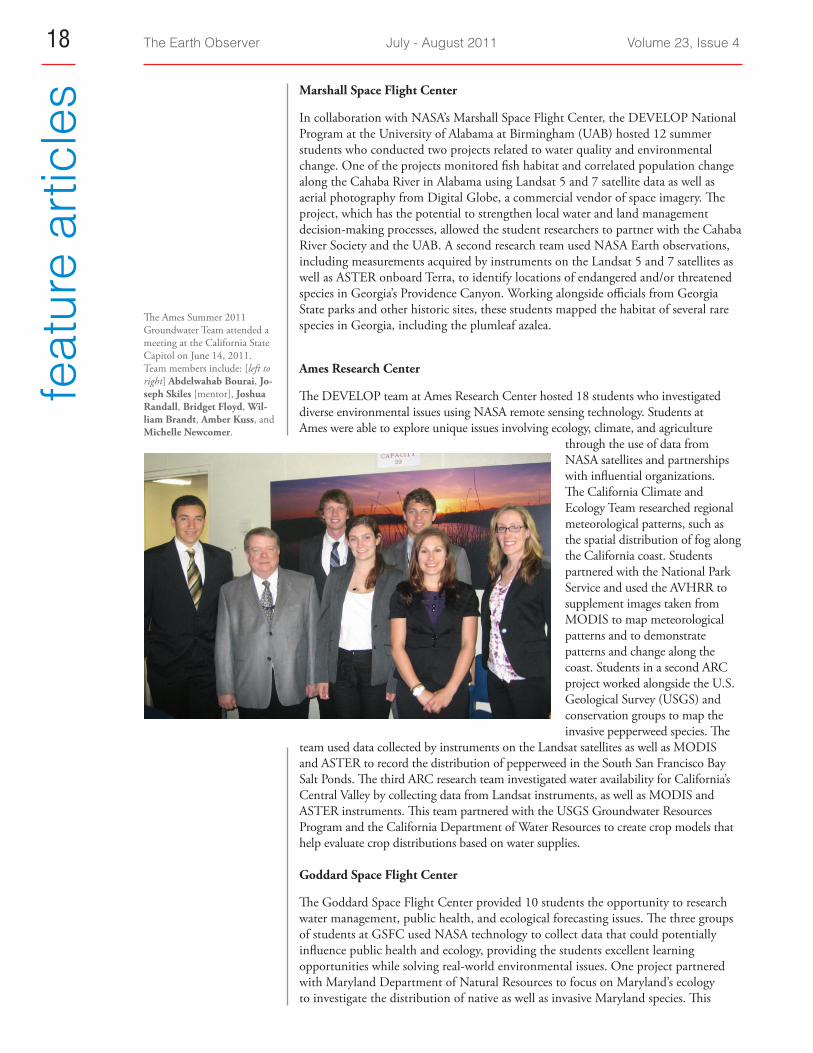
The Ames Summer 2011 Groundwater Team attended a meeting at the California State Capitol on June 14, 2011. Team members include: [left to right] Abdelwahab Bourai, Jo-seph Skiles [mentor], Joshua Randall, Bridget Floyd, Wil-liam Brandt, Amber Kuss, and Michelle Newcomer.

The Earth Observer July - August 2011 Volume 23, Issue 4 19
feat
ure
artic
lesteam used data from Shuttle Radar Topography Mission (SRTM), MODIS, and
Landsat instruments to model and detect habitat suitability for invasive species such as wavyleaf basketgrass. The second team of students sponsored by GSFC used data provided by MODIS and SRTM to research water surface inundation. Working with the U.S. Department of Agriculture’s Conservation Effects Assessment Project, this group used digital elevation models to map areas prone to flooding. The third GSFC team, working with the Bangladesh Human Health and Water Team, investigated NASA Earth observations in relation to public health. These students partnered with University of Maryland to use data collected by AVHRR, MODIS, and instruments on the Jason-2 satellite, to map cholera outbreaks and to improve understanding their correlation with salinity and chlorophyll estimates. Mobile County Health Department
Established in 2003, the DEVELOP office at the MCHD in Alabama has continued to host and support student research through the present Summer 2011 term. The team in Mobile this summer conducted two projects and hosted nine individuals. One project utilized SRTM, Tropical Rainfall Measuring Mission (TRMM), and AMSR-E data to analyze tropical cyclone-induced precipitation and flooding in the Gulf of Mexico, in partnership with the Center for Hurricane Intensification and Landfall Intensification. This project monitored and analyzed the impacts of weather patterns and precipitation rates to potentially improve flood mapping in the region. The second team of students at the MCHD investigated the water quality of Lake Victoria in Kenya through Earth observations, including data from the Advanced Land Imager (ALI), Hyperion, and AVHRR. Partnered with the Lake Victoria Basin Commission, the team’s work may provide tangible benefits for policymakers and communities with a strong interest in preserving Lake Victoria’s natural resources and its use as a source of drinking water. Jet Propulsion Laboratory
The Jet Propulsion Laboratory hosted a team of three students this summer. They investigated the effects that urban forest processes and urban heat islands have on human health. These students helped the Million Tree Initiative, a campaign initiated to plant one million trees in the city over the next few years, by raising awareness concerning urban forest processes and its effects on Los Angeles’s tree population. Using data from instruments on the Landsat 5 and 7 and CALIPSO satellites, this group of students collected data to reveal the significance of urban heat islands and further discussed their effects on public health. The team used NASA technology to explore links between these urban issues and health risks such as heat stroke and pre-respiratory illnesses. Given the opportunity to work alongside the Los Angeles Conservation Corps Education Program, this group of students provided data that could potentially impact the application of important decision support tools to help maintain vegetation around the city. Great Lakes and St. Lawrence Cities Initiative
One of DEVELOP’s newer locations, the Great Lakes and St. Lawrence Cities Initiative DEVELOP team, hosted two students during this summer term. The team
MCHD DEVELOP stu-dents participate in a tele-conference with science ad-visors from NASA’s SERVIR Program on June 21. [back row, left to right] Naresh Aligeti, Hunter Winstan-ley, Tharini Jeyaprakash. [front] Josh Stodghill [MCHD—Center Lead].

The Earth Observer July - August 2011 Volume 23, Issue 4 20fe
atur
e ar
ticle
s studied the habitats and spread of Asian carp, an invasive species, in the Great Lakes. These students used MODIS, Jason-1, and TOPEX/Poseidon data to construct a methodology for mapping potentially at-risk areas to assist fishery managers
and to enhance support for eradication efforts. The team’s research, completed in conjunction with the U.S. Fish and Wildlife Service, USGS, and NOAA, may help to assess the threat to the Great Lakes caused by Asian carp and aid in the control of this invasive species.
Wise County, VA, and Monterrey, Mexico
DEVELOP’s team in Wise County, VA, which is the second oldest DEVELOP node outside LaRC, has concluded its second semester of work on an international science venture that seeks to positively impact environmental and public health in Mexico. Wise DEVELOP students, working alongside a team of students in Mexico, conducted three separate projects designed to provide
data and unique insight into major issues of concern to Mexican citizens and their government’s agencies. One team studied the impact of industrial discharges on the health of the Lerma River, one of the largest rivers in Mexico. They monitored the spread of algal blooms in an effort to create a model that could predict future pollution. Another project recorded the effects of air pollution in and around Monterrey to study impacts on the ozone layer. In particular, the team studied the effects that wind patterns and the jet stream have on pollution in the area. The last of the three projects studied was dengue fever, a potentially deadly disease spread by mosquitoes, in six Mexican states. Working in collaboration with researchers from the University of Miami, the team created a mathematical model to predict future outbreaks using data that address the influences that humidity and seasonal change have on the disease’s spread. In each of these three projects, the international collaboration among DEVELOP students represents a tangible step towards improving environmental and human well-being.
JPL’s Summer 2011 DEVEL-OP team: [left to right] Caitlin Kontgis, Asya Hollins, and Katrina Laygo [JPL Center Lead].
DEVELOP student Char-ley Follett, Center Lead of the Great Lakes and St. Lawrence’s Cities Initiative (GLSLCI) DE-VELOP team attended the GLSLCI 2011 Annual Meeting presenting his team’s research results related to invasive spe-cies risk in the Great Lakes. Pictured here are [left to right] Dave Ullrich [GLSLCI—Exec-utive Director], Charley Follett, Kenton Ross [SSAI@NOAA NESDIS—DEVELOP Science Advisor], and Jonathan Gleason [NASA—DEVELOP alumnus].

The Earth Observer July - August 2011 Volume 23, Issue 4 21
feat
ure
artic
les
The Summer 2011 Wise DEVELOP team presented information on their work at the Southwestern Virginia Technology Council Gala during the first week of the Summer 2011 term.
Conclusion
DEVELOP continues to provide students a unique opportunity to conduct research in numerous fields, from disaster management to ecological forecasting to air quality, while maturing as young professionals. The students’ experiences are unique in that they are able to focus on real-world issues through the lens of NASA’s satellite and airborne Earth observation systems. The program cultivates well-rounded young professionals who learn the importance of teamwork, gain experience in presenting meaningful results to a variety of audiences, and who are fluent in the use of NASA Earth observations and remote sensing capabilities. Using NASA Earth observations in innovative and resourceful ways, students have conducted projects that have the potential to impact communities nationwide, while providing students the opportunity to learn firsthand the benefits and practical applications of NASA Earth Science activities.
For more information, please visit: develop.larc.nasa.gov/.
The NASA CloudSat/GPM Light Precipitation Validation Experiment (LPVEx)continued from page 8
• A robust assessment of the uncertainties in rain-fall intensity estimates from these sensors.
• An archive of high-quality microphysics and rainfall intensity measurements in high-latitude precipita-tion systems to improve the underlying assump-tions in satellite rainfall algorithms, and to facilitate the development of algorithms for future sensors.
• A better overall understanding of high-latitude precipitation processes and their implications for satellite remote sensing.These project objectives and light-rain-centric outcomes are necessary to
ultimately reconcile differences in current satellite rainfall products at high-latitudes, to meet the mu-tual goals of the CloudSat and GPM programs.
More information about the LPVEx campaign and as-sociated datasets can be obtained through the Cloud-Sat LPVEx website at: lpvex.atmos.colostate.edu. DSD and rain-rate observations and associated documenta-tion from the surface sites are also available through the GPM Ground Validation Data Portal at: gpm.nsstc.nasa.gov/lpvex/index.html. Information about the GPM mis-sion is available at: gpm.nasa.gov.

The Earth Observer July - August 2011 Volume 23, Issue 4 22m
eetin
g/w
orks
hop
sum
mar
ies CERES Science Team Meeting Summary
Jim Closs, Science Systems and Applications Inc. @ NASA Langley Research Center, Inc., [email protected]
The Spring 2011 meeting of the Clouds and the Earth’s Radiant Energy System (CERES) Science Team was held April 26-28, 2011, at the City Center at Oyster Point Marriott Hotel in Newport News, VA. Norman Loeb [NASA Langley Research Center (LaRC)— CERES Principal Investigator] hosted the meeting.
Major objectives of the meeting included review and sta-tus of CERES instruments and data products, including reports and/or updates on:
• the state of CERES, the 2011 Senior Reviews, and the NPOESS1 Preparatory Project (NPP);
• the status of the CERES instrument on Terra, Aqua, NPP, and beyond;
• CERES Edition 3 processing status;
• progress towards implementing Edition 4 algo-rithm improvements: Clouds, Angular Distribu-tion Models (ADMs), computed and parameter-ized surface fluxes, and time-space averaging;
• Data Management Team activities for Terra, Aqua, and NPP;
• Atmospheric Sciences Data Center (ASDC) activities; and
• CERES education and public outreach activities update.
In addition to CERES-specific science reports by Sci-ence Team members Amato Evan [University of Vir-ginia] and Daniel Murphy [National Oceanic and Atmospheric Administration (NOAA), Earth System Re-search Laboratory] gave invited presentations.
Norman Loeb presented an overview and status of CERES, NASA, EOS, Senior Reviews, NASA’s Pro-gram for Climate Model Diagnosis and Intercompari-son (PCMDI) effort, NPP, and the Joint Polar Satellite System (JPSS). Loeb gave an overview of the CERES project structure, data products, and discussed plans for CERES on NPP and JPSS. In addition, he revisited the CERES organization and Working Group leads, and gave an update on NASA’s Earth Science budget. He referenced a popular paper2 that highlights discrep-
1 NPOESS stands for National Polar-orbiting Operational Environmental Satellite System. See Note on Nomenclature in the MODIS Science Team Summary report on page 32 of this issue.2 Trenberth and Fasullo (2010) “Tracking Earth’s Energy”, Sci-ence. April 16, 2010, 328:5976, pp. 316-317.
ancies between observing systems measuring different parts of Earth’s energy budget. Loeb concluded with a touching tribute to Jim Coakley on his retirement, chronicling his exemplary career from his PhD physics studies at University of California at Berkeley, through his National Center for Atmospheric Research (NCAR) and Earth Radiation Budget Experiment (ERBE) years, to his tenure at Oregon State University.
Kory Priestley [LaRC] gave an overview and update of the CERES Instrument Working Group, EOS flight hardware performance and status, data product status, and climate data record continuity path forward with CERES Flight Model Five (FM5) on NPP, FM6 on JPSS-1, and Earth Radiation Budget Sensor (ERBS) on JPSS-2. Priestley emphasized the importance of calibra-tion and why it is so difficult for CERES, noting Edition 3 reprocessing of the first ten years of radiances allows a more rigorous identification and separation of instru-ment artifacts and climate signals. The integration and test program for CERES FM5 on NPP is complete, and all major subassemblies for FM6 have been delivered to Northrop Grumman for sensor integration and testing. Priestley concluded with an NPP and Earth System vid-eo narrated by NPP Project Scientist James Gleason.
The next series of presentations provided updates on various CERES subsystem activities.
• Patrick Minnis [LaRC] gave an update on CERES cloud algorithm and validation results.
• Wenying Su [Science Systems and Application In-corporated (SSAI)@LaRC] reported on improved CERES ADMs.
• Dave Kratz [LaRC] gave a status update on the Surface-Only Flux Algorithm (SOFA) for Edition 4.
• Thomas Charlock [LaRC] gave a status on surface and atmosphere radiation budget (SARB) calcula-tions for Cloud Radiative Swath Edition 4.
• David Doelling [LaRC] reported on Time Interpo-lation and Spatial Averaging (TISA), activities, and the FluxbyCloudType product for climate modeling.
• David Rutan [SSAI @ LaRC] reported on the broad-band data for top-of-atmosphere and surface fluxes.
• Jonathan Gleason [LaRC] reported on the activi-ties of the CERES Data Management Team.
• John Kusterer [LaRC] gave an update on the ASDC.

The Earth Observer July - August 2011 Volume 23, Issue 4 23
mee
ting/
wor
ksho
p su
mm
arie
s• Sarah Crecelius [SSAI@LaRC] presented on be-half of Lin Chambers [LaRC] with an update on CERES education and outreach activities.
Day two began with break-out Working Group ses-sions, including the Angular Modeling Working Group, led by Wenying Su; the SARB/SOFA Working Group, led by Thomas Charlock; and the Cloud Working Group, led by Patrick Minnis.
As noted earlier, a pair of invited presentations high-lighting exciting new science followed.
Amato Evan [University of Virginia] spoke first, on “South Atlantic Stratocumulus Clouds as a Feedback onto the Atlantic Meridional Mode (AMM)”, co-au-thored by Robert Allen, Joel R. Norris, and Stephen Klein. Evan explained the circulation patterns of the Atlantic meridional mode, and its coupling with low cumulus clouds. He concluded that observational evi-dence supported by theoretical arguments suggest that tropical Atlantic stratocumulus clouds are an integral part of the AMM, and that cloud cover variability
may be externally exciting the AMM via cloud radia-tive forcing.
Daniel Murphy [NOAA] then presented a paper pub-lished in Geophysical Research Letters titled “The Earth’s Energy Budget and Climate Sensitivity”. Murphy noted that energy conservation for Earth has no “natural cy-cles”, and that a warmer Earth loses more heat to space. He contends that using only outgoing shortwave radia-tion data relative to position in Earth’s orbit is insuffi-cient across the Earth’s annual energy cycle because of variations in its distance from the sun and in reflected sunlight. Murphy summarized by stating that the ener-gy budget and forcing is more about the indirect effect than about climate sensitivity, and that radiative forcing is not just radiative transfer.
Following the invited presentations, there was a series of investigator reports, with updates on new data products and science results. The topics discussed are summarized in the table below. Please refer to the URL listed in the text box at the end of this article for details on each presentation.
Topic Speaker Institution
Factors Contributing to Variability in Joel Norris Scripps Institute of OceanographyCERES Radiation Flux How the Shortwave Cloud Feedback Andrew Dessler Texas A&M University Makes Estimating Climate Sensitivity DifficultUpdate on the Coupled Model Inter- Jerry Potter Goddard Space Flight Centercomparison Project Phase 5 (CMIP5) Observation Data BaseThe Seasonality and Interannual Varia- Xianglei Huang University of Michigan tions of Band-by-Band Cloud Radiative Forcing in the Tropics: Observations ver-sus GCMs Radiative Effects of Arctic Sea Ice Re- Kristina Pistone Scripps Institute of Oceanographytreat as Seen by CERES The Effects of Aerosols on Deep Con- James Coakley Oregon State University vective CloudsThe Trend of Ozone Profile from 1978– Shi-Keng Yang NOAA Climate Prediction Center2009 from SBUV/(2)First Decade of CERES/Terra Radiation Takmeng Wong Langley Research Center Budget Data Using CERES Data to Improve Snow- Laura Hinkelman University Of Washingtonmelt Modeling Validation of CERES–MODIS Cloud Xao Dong University of North Dakota Properties Over Arctic Region using ARM and Cloudsat/CALIPSO Observations Using CERES Observations to Help Gouyong Wen University of MarylandCorrect Cloud 3D Radiative Effects on MODIS Aerosol Optical Thickness in the Vicinity of Clouds: A Case Study

The Earth Observer July - August 2011 Volume 23, Issue 4 24m
eetin
g/w
orks
hop
sum
mar
ies
Norman Loeb led a final wrap-up and discussion of ac-tion items from the meeting, including the following highlights:
• Continuing validation efforts with Cloudsat, Cloud–Aerosol Lidar and Infrared Pathfinder Sat-ellite Observations (CALIPSO), and Department of Energy Atmospheric Radiation Measurment (ARM) sites.
• Refining the strategy for the Visible Infrared Im-ager Radiometer Suite (VIIRS) on NPP.
• Implementing Edition 4 improvements for SOFA and SARB. (Changes will be made in keeping with the schedule for Clouds activities).
• Establishing a node with the Earth System Grid for CMIP5.
• Finalizing and delivering Energy Balanced and Filled-Top of Atmosphere (EBAF-TOA) Edition 2.5B.
• Submitting papers describing new CERES data products, the 10-year Terra data record, ocean heat storage research results, and the diurnal cycle.
Full presentations are available on the CERES website at: science.larc.nasa.gov/ceres. The next CERES Science Team meeting will be hosted by the Program for Climate Model Diagnosis and Intercomparison (PCMDI) at the Lawrence Livermore National Laboratory, October 4-6, 2011, in Livermore, CA.
Progress in CERES Clear-sky Aerosol Lusheng Liang Langley Research Center/SSAIOptical Thickness Dependent Angular Distribution Model over Ocean A “Direct” Estimation of Surface Solar Istvan Laszlo NOAA and University of MarylandFluxes from CERES Toward Producing a Level 4 Surface En- Seiji Kato Langley Research Centerergy Balance and Filled (EBAF) Gridded Monthly Irradiance Product Controls on the Spatial and Seasonal Patrick Taylor Langley Research CenterDistribution of the Tropical Diurnal CycleGERB Status and Related Activities, and Almudena Velaquez/ Royal Meteorological Institute of Effects of the Mirror in the Unfiltering Nicolas Clerbeaux BelgiumPresentation and Validation of the Spec- Ilse Decoster Royal Meteorological Institute of tral Aging Model for Meteosat First- BelgiumGeneration Visible Band Assessment of Regional Climate Vari- Bing Lin Langley Research Centerability Using Satellite Radiation Mea-surements

The Earth Observer July - August 2011 Volume 23, Issue 4 25
mee
ting/
wor
ksho
p su
mm
arie
s2011 HyspIRI Science SymposiumElizabeth M. Middleton, NASA Goddard Space Flight Center, [email protected]. Fred Huemmrich, University of Maryland Baltimore County, [email protected] Cheng, Earth Resources Technology, Inc., [email protected]
The Hyperspectral Infrared Imager (HyspIRI) mission is one of the missions recommended in the National Research Council (NRC) Earth Science Decadal Sur-vey. HyspIRI will fly an imaging spectrometer mea-suring the visible to shortwave infrared (VSWIR) spectrum and a multispectral thermal infrared (TIR) imager. HyspIRI data will be used to study terrestrial and coastal ecosys-tems and carbon cycle parameters, along with sup-porting geologi-cal studies, such as volcano observa-tions. The 2011 HyspIRI Science Symposium on Ecosystem and En-vironmental Data Products was held at the NASA God-dard Space Flight Center (GSFC) on May 17–18, 2011. Over 80 participants from academic institutions and government agencies participated in the two-day event. Following the successful symposium held in 2010, this year’s meeting focused on identifying potential higher-level products for ecosystems and the environment at regional and global scales, along with the requirements for a data management framework to process and de-liver HyspIRI data. A total of 40 talks and seven post-ers were presented. The presentations covered the back-ground and activities of the HyspIRI mission, product integrity and availability, and science and applications from the user community. Potential higher-level HyspIRI terrestrial ecology products were identified and proposed. Consensus discussions were also initiated.
Background and Framework—Building on Past Experience
Nick White [GSFC—Director of the Sciences and Ex-ploration Directorate] welcomed everyone to GSFC and commented on the Center’s activities supporting the HyspIRI mission.
Woody Turner [NASA Headquarters (HQ)—Co-Pro-gram Scientist for HyspIRI] provided an update on the status of the HyspIRI mission. He noted the HyspIRI Summative Briefing to NASA HQ in 2010, and out-
lined the need for future work to enhance the maturity of the mission concept and to advance the scientific case for the mission.
Betsy Middleton [GSFC] presented the overall objec-tives and logistics of the meeting by identifying science and application data products from HyspIRI, discuss-
ing issues underly-ing data product processing and integration, and prioritizing the development of products and al-gorithms. She also pointed out that a report summariz-ing the outcome of this symposium would be generated and distributed.
Jack Kaye [NASA HQ—Associate
Director for Research and Analysis, Earth Science Divi-sion] provided an update from the HQ perspective on the status of the Decadal Survey missions and how the HyspIRI mission fits into the overall program.
Rob Green [NASA Jet Propulsion Laboratory (JPL)] summarized the HyspIRI VSWIR imaging spec-trometer, which will provide observations over the 380–2500-nm spectral region with a 10-nm spectral resolution and a 19-day revisit time. With the global coverage and 60-m spatial resolution over the terres-trial surface, the HyspIRI VSWIR data will provide valuable observations for climate studies and ecosys-tem monitoring.
Simon Hook [JPL] summarized the HyspIRI TIR in-strument. The multispectral TIR imager on HyspIRI will acquire data in eight spectral bands from 4–12 µm with a nominal 5-day revisit time. A wide range of sci-ence and application examples were given to show how the TIR data would be used, including studies of volca-noes, wildfires, and water use/availability.
Betsy Middleton presented the opportunities and chal-lenges of the HyspIRI mission, pointing out how the HyspIRI mission could contribute to NASA’s strate-gic goal to advance Earth System Science and meet the
Artist’s concept of the NASA HyspIRI mission in orbit

The Earth Observer July - August 2011 Volume 23, Issue 4 26m
eetin
g/w
orks
hop
sum
mar
ies challenges of understanding climate and environmental
change. HyspIRI can provide key information for ob-jectives of the NRC Decadal Survey and Intergovern-mental Panel on Climate Change (IPCC), including ecosystem feedbacks for climate change, water resources management and sustainability, and critical volcanic eruption parameters. Nevertheless, issues—including data processing, calibration, and validation—need fur-ther discussion and action.
Robert Wolfe [GSFC] shared the successful experience and lessons learned from Moderate Resolution Imag-ing Spectroradiometer (MODIS) observations. Wolfe pointed out the importance of leadership and commu-nications within the community. He reviewed various issues including data systems, algorithm development, quality assurance, calibration, and applications. Wolfe examined issues that arose from each of the MODIS disciplines (oceans, atmosphere, and land) and how they were resolved.
Jeff Masek [GSFC] reviewed the 40 years of Landsat missions. Masek summarized the contributions that the continuous Landsat observations have made to im-portant science and application studies, including land surveys, forest dynamics, disturbance, and recovery. He emphasized the value of having frequent coverage and lessons from the development of Landsat global prod-ucts that the HyspIRI mission can apply.
New Possibilities for Science with HyspIRI— General Ideas
Rob Green [JPL] presented how the HyspIRI mission will provide unprecedented opportunities to monitor ecosystems and their responses and feedbacks to the changing climate, since HyspIRI can provide informa-tion about vegetation species, functional types, biodi-versity, and plant chemical and physiological conditions from its measurements. Hank Margolis [University of Laval] demonstrated the potential of using a machine-learning algorithm to scale carbon exchange between ecosystems and the atmosphere from the site level up to the global level using remote sensing and meteorologi-cal data, and the implications of this approach for po-tential HyspIRI global products. Charlie Walthall [U.S. Department of Agriculture (USDA)] discussed some challenges for agriculture, including food safety, adapta-tion for climate change, and sustainability. Various mea-surements from local-to-global scales are needed; the HyspIRI mission can provide an opportunity to improve our current agricultural management using such data. Miguel Roman [GSFC] presented on the Committee on Earth Observation Satellite (CEOS) Working Group on Calibration and Validation (WGCV) Land Product Validation (LPV) subgroup and their possible collabora-tion with the HyspIRI mission.
New Possibilities for Science with HyspIRI—Examples
Eric Hochberg [Nova Southeastern University] pre-sented a summary of current coral reef studies, the con-nections with climate change, and how remote sensing and HyspIRI observations can be used. Because of its global coverage, HyspIRI will provide a unique oppor-tunity to quantitatively assess the global status of coral reef ecosystems. Dale Quattrochi [NASA Marshall Space flight Center (MSFC)] discussed urbanization, its effects on human health, and responses to climate change. HyspIRI imagery, especially the TIR and day/night acquisitions, will provide measurements for prod-ucts describing air quality, urban heat islands, and land-cover/land-use change. Martha Anderson [USDA] and Rasmus Houborg [European Union Joint Research Centre, Italy] presented an algorithm that can use HyspIRI VSWIR and TIR data simultaneously to mod-el carbon assimilation and transpiration. Results of test studies over multiple sites were described. Jeffery Lu-vall [MSFC] described the potential for using HyspIRI TIR measurements to evaluate ecosystem health and integrity through the connection between thermody-namics and ecosystem structural development. Robert Wright [University of Hawaii] discussed global volcano monitoring and hazard assessment with future HyspIRI data. The fine spatial and temporal resolution of HyspI-RI data—coupled with improved accuracy of surface temperature retrievals—will significantly advance the ability to describe volcanic activity.
Data Volume Challenges and Solutions
Ed Masuoka [GSFC] shared his experiences in manag-ing the data from MODIS for the scientific community. The infrastructure of MODIS product development, processing, distribution, and response to the needs of the science community provide valuable lessons on how to handle the global coverage of HyspIRI data. Dan Mandl [GSFC] gave a status update on the intelligent payload module and low-latency products. Current efforts focus on taking advantage of parallel processing for efficient computation power and rapid production of low-latency data products. Bob Knox [GSFC] led a panel consist-ing of Rob Green [JPL], Ed Masuoka, Karen Moe [NASA HQ], and Dan Mandl, which focused on the preferred mission model for the data processing chain. Various framework and infrastructure approaches were introduced and discussed to achieve consistency, ensure availability, examine integrity, and maintain continuity of various HyspIRI data product types.
Context for Hyperspectral and TIR Data Products
Prasad Thenkabail [U.S. Geological Survey] reviewed past research on hyperspectral remote sensing for veg-etation, both natural and managed systems, and the

The Earth Observer July - August 2011 Volume 23, Issue 4 27
mee
ting/
wor
ksho
p su
mm
arie
sstatus of our current knowledge. Potential HyspIRI VSWIR products on leaf biochemical and canopy bio-physical properties were suggested.
Mike Ramsey [University of Pittsburgh] reviewed the past and current state-of-the-art remote sensing for vol-canic activity. Capabilities for volcanological remote sensing using TIR measurements have advanced rapidly over the last decade. Future observations from HyspIRI, could be routinely used in monitoring, modeling, and hazard appraisals.
Betsy Middleton reviewed the successful 2010 HyspIRI Science Symposium to identify and evaluate potential higher-level products for end users of climate studies.
Susan Ustin [University of California, Davis] gave a summary of two workshops on HyspIRI global science products and their relevance for climate change research and modeling. The key message from the workshops was that the spatial resolution, temporal revisit, and spectral characteristics of HyspIRI will significantly ad-vance ecosystem science and provide improved land surface parameterization for climate studies. Further, HyspIRI measurements can contribute critical informa-tion about ecosystem responses and feedbacks to cli-mate change.
Data Issues
Dave Landis [Sigma Space Corporation] introduced the current design for tagging and developing meta-data for the NASA Earth Observing-1 (EO-1) imagery and how this may lead to future approaches for search-ing HyspIRI data. Vuong Ly [GSFC] described the current development of several data processing tools for the EO-1 mission and their potential for HyspIRI. Steve Ungar [Universities Space Research Association (USRA)] summarized the various CEOS activities and calibration topics with implications for HyspIRI. Sasha Smirnov [Sigma Space Corporation] reviewed Aerosol Robotic Network (AERONET) activities. The HyspIRI mission can use AERONET measurements for calibra-tion as well as to learn from their successful internation-al network in the development of a calibration/valida-tion network. Stan Hooker [GSFC] reviewed various sensors for calibration and validation that were devel-oped to support ocean color satellite missions. Robert Sohlberg [University of Maryland] showed web-based data processing tools for environmental monitoring.
Prototyping with EO-1, AVIRIS, Spectrometer, and MASTER/ASTER Data
Steve Chien [JPL] showed a global volcano product based on the current EO-1 Hyperion Volcano Sensor Web. Brian Johnson [National Ecological Observatory
Network (NEON)] discussed data product prototyp-ing by NEON and their activities to integrate data ac-quired at various spatial scales. Andy French [USDA] discussed the potential of using HypsIRI TIR data for estimates of rangeland changes and modeling energy fluxes. Qingyuan Zhang [USRA] gave an update on a potential HyspIRI science product, the Fraction of Ab-sorbed Photosynthetic Active Radiation at Chlorophyll level (fAPARchl), a radiative transfer modeling-based parameter that can help to improve the estimation of carbon fluxes over multiple sites of natural and man-aged ecosystems. Yen-Ben Cheng [Earth Resources Technology, Inc. (ERT)] presented an algorithm that integrated two potential HyspIRI products—Photo-chemical Reflectance Index (PRI) and fAPARchl—to estimate carbon assimilation with a discussion of pos-sible effects due to spatial resolution. Petya Campbell [University of Maryland Baltimore County (UMBC)] used time series of EO-1 Hyperion imagery to demon-strate the use of multiple narrow spectral bands to mon-itor a range of ecosystems and their carbon exchange. Fred Huemmrich [UMBC] presented the concept of using PRI from MODIS narrow ocean bands for eco-system carbon monitoring at multiple sites and the im-plications for global sampling of HyspIRI. Bruce Cook [GSFC] introduced a newly developed integration of multiple instruments, including an imaging spectrom-eter, thermal imager, and lidar that can be flown on a light aircraft for carbon and ecosystem monitoring.
Break-out Session Discussions: Higher-Level Re-gional/Global Products
Prasad Thenkabail and Petya Campbell led two break-out discussion sessions. Various potential HyspI-RI higher-level products at regional and global scales were discussed. Other topics included enhancing com-munication about thermal sensing and imaging spec-troscopy, both within the scientific community and for the general public, along with ideas on data and algo-rithm sharing within the HyspIRI community.
Summary
In general, participants recognized that the planned HyspIRI mission will provide the science community with extremely valuable information on plant physiolog-ical conditions and energy exchange between the atmo-sphere and terrestrial ecosystems. Potential higher-level products at regional-to-global levels will address science questions from various disciplines, including ecosys-tem monitoring and modeling, biodiversity, and climate change. Successful use of HyspIRI data will require the development of an information system that builds upon the lessons learned from heritage instruments and mis-sions such as MODIS and Landsat, respectively.

The Earth Observer July - August 2011 Volume 23, Issue 4 28m
eetin
g/w
orks
hop
sum
mar
ies Summary of International Glacier Monitoring Summit
Zemp, M.1,4, Paul, F.1,3,9, Andreassen, L.M.4,9, Arino, O.6, Bippus, G.3,9, Bolch, T.4,9, Braithwaite, R. 4, Braun, L.2, Cáceres, B.E.2, Casassa, G.2, Casey, K.A.3, Ceballos, C.L.2, Citterio, M.2,4, Delgado, H.2,9, Demuth, M.2, Espizua, L.E.2, Farokhnia, A.2, Fischer, A.2, Foppa, N.5, Frey, H.3, Fujita, K.2, Gärtner-Roer, I.1, Glowacki, P.2, Haeberli, W.1, Hagen, J.O.2, Hoelzle, M.1,2, Holmlund, P.2, Giesen, R.H.4, Kääb, A.1,3,9, Khromova, T. 4,9, Kotlarski, S.4, Le Bris, R.3, Li, Z.2, Meier, M.5, Meneghel, M.2, Mool, P. 4, Nussbaumer, S.U.1, Peduzzi, P.7, Plummer, S.6, Pop-ovnin, V.V.2, Prinz, R.2, Rack, W.2,9, Rastner, P. 3, Raup, B.4,8,9, Rinne, E.3, Seifert, F.M.6, Seiz, G.5, Severskiy, I.2, Shepherd, A.3, Sigurðsson, O.2,9, Strozzi, T.3, Vincent, C.2, Wheate, R.4,9, Yakovlev, A.2
1 WGMS Coordinating Office, 2 WGMS National Correspondents and Deputies, 3 GlobGlacier Consortium, 4 GlobGlacier User Group, 5 Swiss GCOS Office, 6 European Space Agency, 7 United Nations Environment Pro-gramme, 8 U.S. National Snow and Ice Data Center, 9 Global Land Ice Measurements from Space
In the first week of September 2010, international experts on glacier monitoring convened in Zermatt, Switzerland, for two separate but related meetings. They discussed glacier data compiled over the past 150 years and how to improve this dataset to meet the challenges of the 21st century, pre-sented latest results from in situ and remotely sensed obser-vations, and came up with key tasks for the glacier moni-toring community for the coming decade.
About Worldwide Glacier Monitoring
Internationally coordinated observation of glaciers began in 1894 in Zurich, Switzerland, with regu-larly published standardized glacier data available from the very beginning. Today, the World Glacier Monitoring Service (WGMS), in close cooperation with the U.S. National Snow and Ice Data Center (NSIDC) and the Global Land Ice Measurements from Space (GLIMS) initiative, runs the Global Terrestrial Network for Glaciers (GTN-G) within the Global Climate Observing Systems (GCOS) as a contribution to the United Nations Framework Convention on Climate Change (UNFCCC). The international data compilation efforts over more than a century have resulted in unprecedented da-tasets that allow for a robust (but rough) estimate of the global distribution of glacier ice and its changes since the Little Ice Age, which lasted rough-ly from the 16th to the 19th centuries.
To answer questions about linkages between changes in glaciers and climate change—e.g., How much of the current global sea-level rise can be attributed to melting glaciers?—more precise and quantitative studies of gla-ciers are required. This includes systematically extending the available in situ and remote sensing data, putting to-gether a more-detailed world glacier inventory (WGI), continuing and strategically enlarging the global mass balance monitoring network, and conducting a rigorous uncertainty assessment of the available data series.
Towards a Complete Global Glacier Inventory
The science community first considered the need for a global overview of glacier distribution during the Inter-national Hydrological Decade (1965-74); this resulted in the development of the first world glacier inventory based mainly on aerial photographs and maps. The original inventory included preliminary estimates of the glacierized area of Earth and detailed information on 70,000 glaciers. This inventory task continues through the present day, and is now based mainly on satellite images within GLIMS. The satellite inventory began in 1999 with the launch of NASA’s Terra mission, and was originally under the auspices of the Advanced Space-borne Thermal Emission and Reflection Radiometer (ASTER) Science Team. It has since expanded into an international scientific initiative to map Earth’s glaciers using spaceborne sensors.
In 2006 the European Space Agency (ESA) initiated the GlobGlacier project, under the lead of the De-partment of Geography of the University of Zurich in Switzerland, with the intention of making a major contribution towards global documentation of glaciers and ice caps. The project’s goal is to provide detailed glacier inventories from well-established remote sens-ing methods in regions not yet covered in the GTN-G databases (i.e., WGI and GLIMS). A GlobGlacier user group, composed of institutions and individual sci-
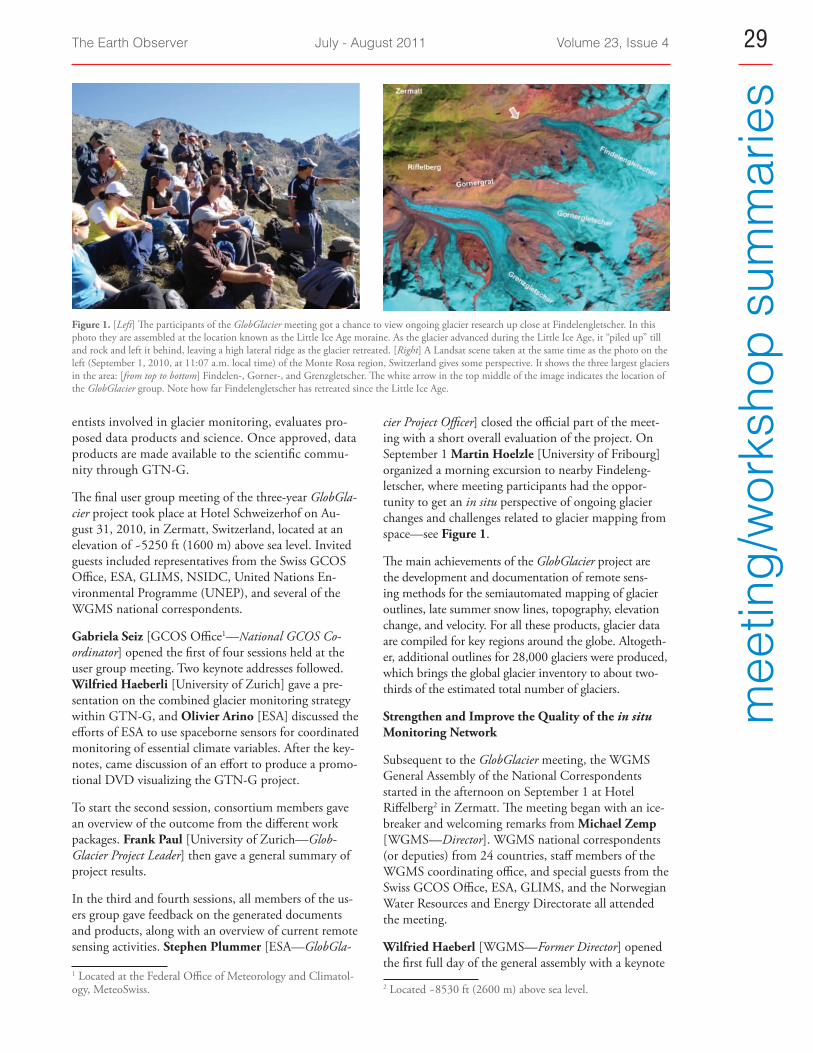
The Earth Observer July - August 2011 Volume 23, Issue 4 29
mee
ting/
wor
ksho
p su
mm
arie
s
entists involved in glacier monitoring, evaluates pro-posed data products and science. Once approved, data products are made available to the scientific commu-nity through GTN-G.
The final user group meeting of the three-year GlobGla-cier project took place at Hotel Schweizerhof on Au-gust 31, 2010, in Zermatt, Switzerland, located at an elevation of ~5250 ft (1600 m) above sea level. Invited guests included representatives from the Swiss GCOS Office, ESA, GLIMS, NSIDC, United Nations En-vironmental Programme (UNEP), and several of the WGMS national correspondents.
Gabriela Seiz [GCOS Office1—National GCOS Co-ordinator] opened the first of four sessions held at the user group meeting. Two keynote addresses followed. Wilfried Haeberli [University of Zurich] gave a pre-sentation on the combined glacier monitoring strategy within GTN-G, and Olivier Arino [ESA] discussed the efforts of ESA to use spaceborne sensors for coordinated monitoring of essential climate variables. After the key-notes, came discussion of an effort to produce a promo-tional DVD visualizing the GTN-G project.
To start the second session, consortium members gave an overview of the outcome from the different work packages. Frank Paul [University of Zurich—Glob-Glacier Project Leader] then gave a general summary of project results.
In the third and fourth sessions, all members of the us-ers group gave feedback on the generated documents and products, along with an overview of current remote sensing activities. Stephen Plummer [ESA—GlobGla-
1 Located at the Federal Office of Meteorology and Climatol-ogy, MeteoSwiss.
cier Project Officer] closed the official part of the meet-ing with a short overall evaluation of the project. On September 1 Martin Hoelzle [University of Fribourg] organized a morning excursion to nearby Findeleng-letscher, where meeting participants had the oppor-tunity to get an in situ perspective of ongoing glacier changes and challenges related to glacier mapping from space—see Figure 1.
The main achievements of the GlobGlacier project are the development and documentation of remote sens-ing methods for the semiautomated mapping of glacier outlines, late summer snow lines, topography, elevation change, and velocity. For all these products, glacier data are compiled for key regions around the globe. Altogeth-er, additional outlines for 28,000 glaciers were produced, which brings the global glacier inventory to about two-thirds of the estimated total number of glaciers.
Strengthen and Improve the Quality of the in situ Monitoring Network
Subsequent to the GlobGlacier meeting, the WGMS General Assembly of the National Correspondents started in the afternoon on September 1 at Hotel Riffelberg2 in Zermatt. The meeting began with an ice-breaker and welcoming remarks from Michael Zemp [WGMS—Director]. WGMS national correspondents (or deputies) from 24 countries, staff members of the WGMS coordinating office, and special guests from the Swiss GCOS Office, ESA, GLIMS, and the Norwegian Water Resources and Energy Directorate all attended the meeting.
Wilfried Haeberl [WGMS—Former Director] opened the first full day of the general assembly with a keynote
2 Located ~8530 ft (2600 m) above sea level.
Figure 1. [Left] The participants of the GlobGlacier meeting got a chance to view ongoing glacier research up close at Findelengletscher. In this photo they are assembled at the location known as the Little Ice Age moraine. As the glacier advanced during the Little Ice Age, it “piled up” till and rock and left it behind, leaving a high lateral ridge as the glacier retreated. [Right] A Landsat scene taken at the same time as the photo on the left (September 1, 2010, at 11:07 a.m. local time) of the Monte Rosa region, Switzerland gives some perspective. It shows the three largest glaciers in the area: [from top to bottom] Findelen-, Gorner-, and Grenzgletscher. The white arrow in the top middle of the image indicates the location of the GlobGlacier group. Note how far Findelengletscher has retreated since the Little Ice Age.

The Earth Observer July - August 2011 Volume 23, Issue 4 30m
eetin
g/w
orks
hop
sum
mar
ies
address on the historical background of international glacier monitoring and the integration of in situ mea-surements within the GTN-G strategy. Subsequent to the talk, national correspondents (or their deputies) gave overviews on the status and challenges of glacier monitoring in their respective countries.
The second day started with a general discussion of the national summaries of the first day, followed by four workshops on:
1. improvement of the quality and richness of avail-able glacier datasets;
2. homogenization, validation, and calibration of gla-cier mass balance series;
3. current status and challenges of remote sensing of glaciers; and
4. how to improve WGMS’s service to the scientific community.
In his concluding remarks, Michael Zemp emphasized the strength of the WGMS as a global scientific collabo-ration network that follows an integrative monitoring strategy in order to actively measure, compile, and dis-seminate standardized data and information of the high-est quality on global glacier distribution and changes to the scientific community, political authorities, and the wider public. Based on the global and national over-views presented and on the discussion during the differ-
ent workshops, the following key tasks for glacier moni-toring of the coming decade have been developed. They are to:
• Improve the organizational structure and fund-ing situation of the national monitoring programs through WGMS network collaborations and con-tacts to international organizations (e.g., GCOS);
• use the WGMS network for capacity building (e.g., summer schools, scholarships, and mass bal-ance measurement training);
• adjust monitoring strategies for disintegrating and vanishing glaciers;
• strongly facilitate homogenization, validation, and calibration of long-term mass balance series (e.g., scientific workshops);
• strengthen integration of and improve cooperation between in situ and remote sensing communities dealing with glaciers;
• initiate (small) scientific workshops focused on specific monitoring-related aspects (e.g., point mass balance analysis, automated weather station measurements, and energy balance modeling), and;
• improve the visibility of WGMS datasets (e.g., through joint review papers).
Figure 2. Participants of the WGMS General Assembly of the National Correspondents at Riffelberg in Zermatt, Switzerland, on September 3, 2010.

The Earth Observer July - August 2011 Volume 23, Issue 4 31
mee
ting/
wor
ksho
p su
mm
arie
sThe panoramic and culinary setting of the Swiss venue greatly supported the spirit of intensive and construc-tive discussions during the workshop, and provided a perfect stage for the evening talks by two guest speakers:
• Heinz J. Zumbühl [University of Bern] discussed the iconography of glaciers, ice, and climate during the Little Ice Age.
• Christoph Dehnert [University of Ulm] presented information on acute high-altitude associated ill-nesses, and discussed results from medical research he has conducted at Capanna Regina Margherita, located “next door” at an altitude of 14,957 ft (4559 m) above sea level.
On September 4 Martin Hoelzle organized a morn-ing excursion to Gornergrat, located ~10,170 ft (3100 m) above sea level. It was the perfect place to view (and receive explanations of ) ongoing research efforts at Gorner- and Findelengletscher, as well as on Stockhorn and Colle Gnifetti, Monte Rosa.
Laying the Foundation for Future IPCC Assessment Reports
The two meetings in Zermatt clearly demonstrated that GTN-G is not just another acronym in the sea of international organizations. It is, rather, a framework for global glacier monitoring, with operational bodies (i.e., the WGMS, NSIDC, and GLIMS) that actively compile and disseminate glacier data as a unique ser-vice to the scientific community. Thanks to the suc-cessful GlobGlacier project and the continued close co-operation with the leading space agencies around the world, it is on its way to completing the world glacier
inventory within the coming decade, and continues to provide repeat inventories of key regions. NASA is a key player in this effort, as its release in 2008 of the complete Landsat image archive at no cost to users makes large-scale mapping efforts much easier. ESA will continue its strong involvement in the operational glacier monitoring from space with its new Climate Change Initiative.
The WGMS will put all its efforts into continuing the long-term in situ observation series, reactivating inter-rupted data series of strategic importance, strengthening the monitoring network in underrepresented mountain ranges, and improving the richness and quality of avail-able data series. Furthermore, in Zermatt the WGMS decided to start compiling standardized measurements of glacier thickness to improve estimates of the global distribution of the remaining glacier volume. While sci-entists are about to draft their scientific papers for on-time submission to the Fifth Assessment Report of the Intergovernmental Panel on Climate Change (papers should be submitted to journals before July 31, 2012), international glacier monitoring is laying the (data) foundation for the assessment reports beyond the fifth.
For more information, visit:
www.wgms.ch www.nsidc.org www.glims.org www.gtn-g.org www.globglacier.ch www.esa-glaciers-cci.org landsat.usgs.gov/documents/USGS_Landsat_Imagery_Re-lease.pdf
Erratum
In our May–June 2011 issue we ran an article titled “NASA and the International Year of Chemistry 2011” [Volume 23, Issue 3, pp. 19-24, 31]. In the last paragraph on page 22 we mistakenly reported that carbon dioxide is the “most abundant of all the so-called greenhouse gases”. It should have said, “the second-most abun-dant of all the so-called greenhouse gases”—water vapor being most abundant. The Earth Observer regrets this error; the online pdf version of the newsletter has been corrected. er
ratu
m
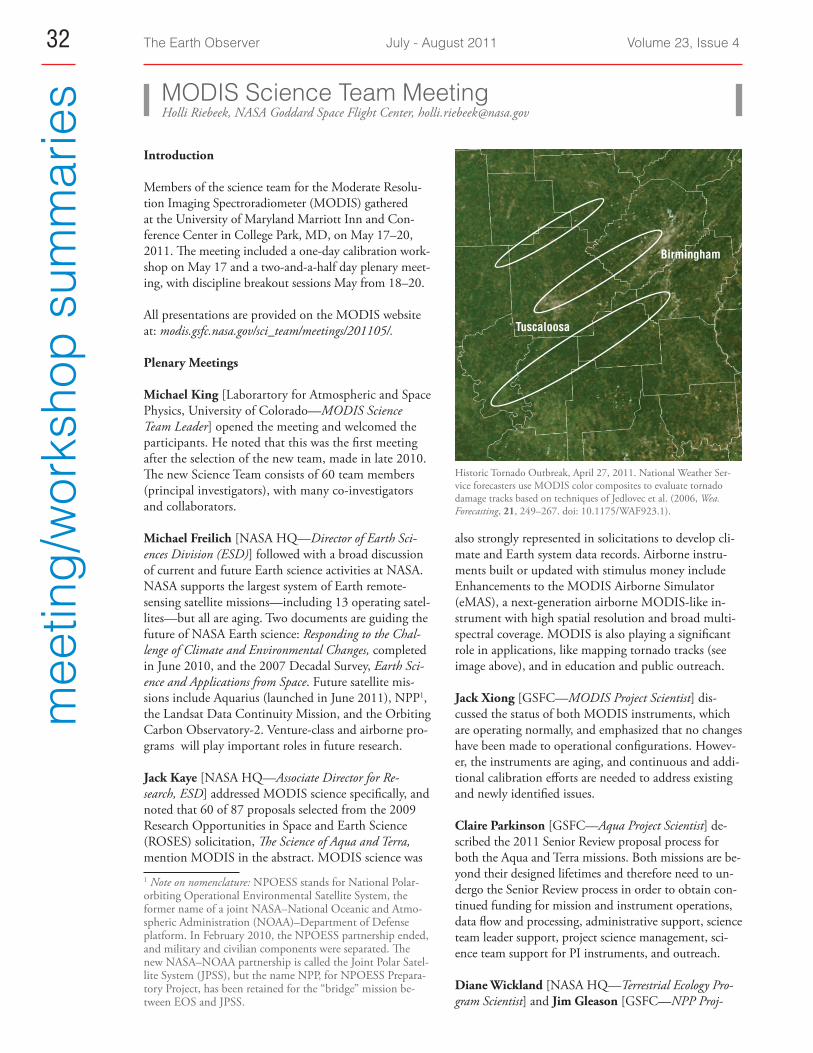
The Earth Observer July - August 2011 Volume 23, Issue 4 32m
eetin
g/w
orks
hop
sum
mar
ies MODIS Science Team Meeting
Holli Riebeek, NASA Goddard Space Flight Center, [email protected]
Introduction
Members of the science team for the Moderate Resolu-tion Imaging Spectroradiometer (MODIS) gathered at the University of Maryland Marriott Inn and Con-ference Center in College Park, MD, on May 17–20, 2011. The meeting included a one-day calibration work-shop on May 17 and a two-and-a-half day plenary meet-ing, with discipline breakout sessions May from 18–20.
All presentations are provided on the MODIS website at: modis.gsfc.nasa.gov/sci_team/meetings/201105/.
Plenary Meetings
Michael King [Laborartory for Atmospheric and Space Physics, University of Colorado—MODIS Science Team Leader] opened the meeting and welcomed the participants. He noted that this was the first meeting after the selection of the new team, made in late 2010. The new Science Team consists of 60 team members (principal investigators), with many co-investigators and collaborators.
Michael Freilich [NASA HQ—Director of Earth Sci-ences Division (ESD)] followed with a broad discussion of current and future Earth science activities at NASA. NASA supports the largest system of Earth remote-sensing satellite missions—including 13 operating satel-lites—but all are aging. Two documents are guiding the future of NASA Earth science: Responding to the Chal-lenge of Climate and Environmental Changes, completed in June 2010, and the 2007 Decadal Survey, Earth Sci-ence and Applications from Space. Future satellite mis-sions include Aquarius (launched in June 2011), NPP1, the Landsat Data Continuity Mission, and the Orbiting Carbon Observatory-2. Venture-class and airborne pro-grams will play important roles in future research.
Jack Kaye [NASA HQ—Associate Director for Re-search, ESD] addressed MODIS science specifically, and noted that 60 of 87 proposals selected from the 2009 Research Opportunities in Space and Earth Science (ROSES) solicitation, The Science of Aqua and Terra, mention MODIS in the abstract. MODIS science was 1 Note on nomenclature: NPOESS stands for National Polar-orbiting Operational Environmental Satellite System, the former name of a joint NASA–National Oceanic and Atmo-spheric Administration (NOAA)–Department of Defense platform. In February 2010, the NPOESS partnership ended, and military and civilian components were separated. The new NASA–NOAA partnership is called the Joint Polar Satel-lite System (JPSS), but the name NPP, for NPOESS Prepara-tory Project, has been retained for the “bridge” mission be-tween EOS and JPSS.
also strongly represented in solicitations to develop cli-mate and Earth system data records. Airborne instru-ments built or updated with stimulus money include Enhancements to the MODIS Airborne Simulator (eMAS), a next-generation airborne MODIS-like in-strument with high spatial resolution and broad multi-spectral coverage. MODIS is also playing a significant role in applications, like mapping tornado tracks (see image above), and in education and public outreach.
Jack Xiong [GSFC—MODIS Project Scientist] dis-cussed the status of both MODIS instruments, which are operating normally, and emphasized that no changes have been made to operational configurations. Howev-er, the instruments are aging, and continuous and addi-tional calibration efforts are needed to address existing and newly identified issues.
Claire Parkinson [GSFC—Aqua Project Scientist] de-scribed the 2011 Senior Review proposal process for both the Aqua and Terra missions. Both missions are be-yond their designed lifetimes and therefore need to un-dergo the Senior Review process in order to obtain con-tinued funding for mission and instrument operations, data flow and processing, administrative support, science team leader support, project science management, sci-ence team support for PI instruments, and outreach.
Diane Wickland [NASA HQ—Terrestrial Ecology Pro-gram Scientist] and Jim Gleason [GSFC—NPP Proj-
Historic Tornado Outbreak, April 27, 2011. National Weather Ser-vice forecasters use MODIS color composites to evaluate tornado damage tracks based on techniques of Jedlovec et al. (2006, Wea. Forecasting, 21, 249–267. doi: 10.1175/WAF923.1).
Birmingham
Tuscaloosa

The Earth Observer July - August 2011 Volume 23, Issue 4 33
mee
ting/
wor
ksho
p su
mm
arie
sect Scientist] described the first follow-on instrument to MODIS, the Visible Infrared Imager Radiometer Suite (VIIRS), which is scheduled to launch on October 25, 2011, as one of five instruments on the NPP satellite. The instrument will take measurements across 22 spec-tral bands to continue generation of key Earth system and/or climate data records started by the Earth Observ-ing System. VIIRS will also be used operationally. The NPP satellite has been in environmental testing for seven months; ground testing has been ongoing, as well. Ma-neuvers have been approved for implementation during the on-orbit intensive calibration and validation period.
The second plenary session included science presenta-tions from the land, atmosphere, and ocean discipline teams. Steve Running [University of Montana] de-scribed how the land discipline team has developed an eight-day Gross Primary Production (GPP) product for the entire MODIS record to track carbon2. GPP has
a slight downward trend through the MODIS record, posing significant questions about the limit of biospher-ic productivity and peak net primary productivity. Mat-thew Hansen [South Dakota State University] described a second land product—Vegetation Continuous Field—that integrates MODIS and Landsat data to monitor global land-cover change on a spatial scale relevant to land management (i.e, Landsat scenes) and a tempo-ral scale sufficient to see seasonal changes (i.e., MODIS scenes). The product uses MODIS data as an indicator of change, and Landsat data to quantify the change.2 The product can measure emissions from deforestation, help determine where anthropogenic carbon goes in land sinks, and chart ecosystem dynamics based on water, temperature, and light limitations.
Steve Platnick [GSFC—EOS Senior Project Scientist] on behalf of his collaborators presented a study analyz-ing the expected time needed to detect a statistically sig-nificant trend for a variety of atmospheric products. The “time for detection” depends on the size of the trend and the natural variability for the particular data product, which in turn is dependent on the spatial grid size under consideration. Even the Terra MODIS record is still, in general, too short to detect statistically significant trends of the amount expected. However, trend studies can be used to infer instrument issues. A relatively large Terra MODIS cloud optical thickness trend has been linked to Band 1 and 2 calibration trends using desert sites. Similarly, Terra Band 3 trends have been shown to cause significant aerosol dark target optical depth trends. A L1B correction for these Terra MODIS bands using des-ert sites is being implemented and studied.
J. Vanderlei Martins [University of Maryland, College Park] presented recent work performed by his team on characterizing the impact of various aerosol types on radiative forcing. Aerosol spectral dependencies vary with their chemical composition, size, and mixture. To calculate the total aerosol forcing, the researchers used a technique that calculates the surface albedo from 0.3–2.5 µm continuously, and then compares the MODIS aerosol forcing with measurements of shortwave radia-tive forcing from the Clouds and the Earth’s Radiant Energy System (CERES) instruments.
The ocean discipline team presented work designed to improve ocean color and sea surface temperature re-cords—important climate data records that require both duration and continuity. Bryan Franz [GSFC] discussed the approach for achieving global ocean color climate data records. To achieve sufficient time series length and the continuity that is required for this important climate dataset, measurements from multiple sensors must be combined. For ocean color, the Sea-viewing Wide Field-of-view Sensor (SeaWiFS) provided the first decadal-scale climate data record for ocean chlorophyll. Following the latest round of ocean color reprocessing, the MODIS Aqua record is now in close agreement with SeaWiFS, thus enabling the extension of a continuous and consistent data record into the future. The Terra MODIS record is now in better agreement with these other data after recharacterization of the instrument ra-diometric calibration based on SeaWiFS, but Terra still cannot be treated as an independent record. The Euro-pean Space Agency’s (ESA) MEdium Resolution Imag-ing Spectrometer (MERIS) may also provide continuity for the ocean color record after reprocessing with com-mon algorithms. Peter Minnett [University of Miami] showed how the Sea Surface Temperature (SST) record is another essential climate variable that enables the as-sessment of long-term climate change. Unfortunately, there are a number of sources of error and uncertainty in the SST product that the ocean team is working to
Environmental testing has been completed on NPP. Launch is tenta-tively planned for October 2011.

The Earth Observer July - August 2011 Volume 23, Issue 4 34m
eetin
g/w
orks
hop
sum
mar
ies
reduce. A refined product will be produced with algo-rithms that do not require a “first guess” estimate of temperature. Ongoing refinement will require validation over the lifetime of the MODIS missions using ship-based radiometers that measure ocean skin temperature.
The third (final) plenary session included broad science talks from each discipline and summary of each of the discipline breakout sessions, and a presentation about education and public outreach.
Rama Nemani [NASA Ames Research Center (ARC)] described a collaboration between the NASA supercom-puting center at ARC and NASA Earth Science that has resulted in a supercomputing environment intended to facilitate the study of global change. The collabora-tive supercomputing environment is called NASA Earth Exchange (NEX); it contains supercomputer resources, Earth science data, models, and software utilities to re-duce the time scientists must spend accessing and mov-ing data through a network. NEX is organized by the six science focus areas and includes tools for web meet-ings and workflows with three levels of access. Many sci-ence team members already have projects in place in the system. For example, the program has enabled Landsat land-cover monitoring because the supercomputer is able to process data quickly and reproduce workflows.
Robert Pincus [Cooperative Institute for Research in Environmental Sciences (CIRES), University of Colo-rado] compared Geophysical Fluid Dynamics Labora-tory’s Atmospheric Model (GFDL AM3) cloud fields to MODIS and International Satellite Cloud Climatology Project (ISCCP) cloud amount, cloud-top pressure, and optical thickness using the MODIS and ISCCP Simu-lators that are part of the Cloud Feedback Model Inter-comparison Project (CFMIP) Observation Simulator Package [COSP]. Differences between the two obser-vational datasets depend on instrument capability (i.e., cloud-top pressure) and how a cloud is defined (i.e., op-
tical thickness). The edges of water cloud fields or small sub-pixel clouds are intentionally not part of the MO-DIS Level-3 cloud optical thickness aggregation. How-ever, clouds less than 1 km in size cover roughly 15% of the planet. Comparison of either dataset with model fields is problematic because cloud structure heteroge-neity is not captured by the model.
Toby Westberry [Oregon State University] discussed how chlorophyll dissipates some of its absorbed energy as fluorescence, which is discernable in upwelled radi-ant flux. The MODIS fluorescence line height product characterizes the observed fluorescence peak to provide an independent measure of chlorophyll, especially in coastal environments, and to improve estimates of net primary production. Three things affect fluorescence distribution: pigment concentrations, pigment packag-ing (a self-shading phenomenon), and a photoprotec-tive response aimed at protecting organisms from too much sunlight. Variations in fluorescence have been used to diagnose iron stress in the Indian Ocean and North Atlantic—areas where people had not expected to find iron stress.
Holli Riebeek [Sigma Space Corporation/GSFC] de-scribed how the NASA Earth Observations (NEO) web-site was designed to distribute global datasets to both formal and informal educators. Recently, the focus has been on providing images for spherical display systems, like Science on a Sphere, Dynamic Planet, and planetari-ums. NEO currently hosts more than 50 datasets, and welcomes suggestions for additional datasets. The Earth Observatory (earthobservatory.nasa.gov/) provides articles and images about NASA Earth science for the science-attentive public and educators. The Earth Observatory site was recently redesigned to enhance navigation.
Steve Running, the new leader of the land discipline team, provided a summary of the land breakout ses-sions, in which he outlined needs raised by the commu-
How Much of the Planet is Cloudy?
Clouds are detected by the International Satellite Cloud Climatology Project (ISCCP) about as often as they are by MODIS, but MODIS determines cloud properties from a more restricted set, leading to higher accuracy, but smaller sample sizes.
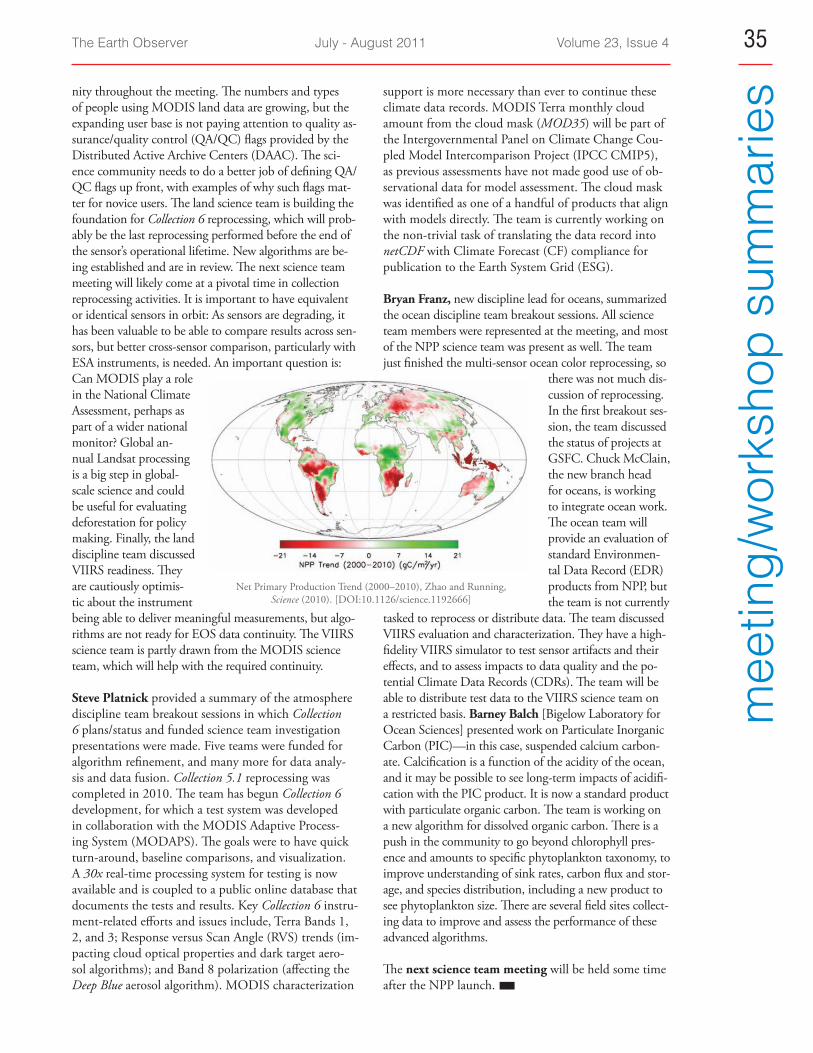
The Earth Observer July - August 2011 Volume 23, Issue 4 35
mee
ting/
wor
ksho
p su
mm
arie
snity throughout the meeting. The numbers and types of people using MODIS land data are growing, but the expanding user base is not paying attention to quality as-surance/quality control (QA/QC) flags provided by the Distributed Active Archive Centers (DAAC). The sci-ence community needs to do a better job of defining QA/QC flags up front, with examples of why such flags mat-ter for novice users. The land science team is building the foundation for Collection 6 reprocessing, which will prob-ably be the last reprocessing performed before the end of the sensor’s operational lifetime. New algorithms are be-ing established and are in review. The next science team meeting will likely come at a pivotal time in collection reprocessing activities. It is important to have equivalent or identical sensors in orbit: As sensors are degrading, it has been valuable to be able to compare results across sen-sors, but better cross-sensor comparison, particularly with ESA instruments, is needed. An important question is: Can MODIS play a role in the National Climate Assessment, perhaps as part of a wider national monitor? Global an-nual Landsat processing is a big step in global-scale science and could be useful for evaluating deforestation for policy making. Finally, the land discipline team discussed VIIRS readiness. They are cautiously optimis-tic about the instrument being able to deliver meaningful measurements, but algo-rithms are not ready for EOS data continuity. The VIIRS science team is partly drawn from the MODIS science team, which will help with the required continuity.
Steve Platnick provided a summary of the atmosphere discipline team breakout sessions in which Collection 6 plans/status and funded science team investigation presentations were made. Five teams were funded for algorithm refinement, and many more for data analy-sis and data fusion. Collection 5.1 reprocessing was completed in 2010. The team has begun Collection 6 development, for which a test system was developed in collaboration with the MODIS Adaptive Process-ing System (MODAPS). The goals were to have quick turn-around, baseline comparisons, and visualization. A 30x real-time processing system for testing is now available and is coupled to a public online database that documents the tests and results. Key Collection 6 instru-ment-related efforts and issues include, Terra Bands 1, 2, and 3; Response versus Scan Angle (RVS) trends (im-pacting cloud optical properties and dark target aero-sol algorithms); and Band 8 polarization (affecting the Deep Blue aerosol algorithm). MODIS characterization
support is more necessary than ever to continue these climate data records. MODIS Terra monthly cloud amount from the cloud mask (MOD35) will be part of the Intergovernmental Panel on Climate Change Cou-pled Model Intercomparison Project (IPCC CMIP5), as previous assessments have not made good use of ob-servational data for model assessment. The cloud mask was identified as one of a handful of products that align with models directly. The team is currently working on the non-trivial task of translating the data record into netCDF with Climate Forecast (CF) compliance for publication to the Earth System Grid (ESG).
Bryan Franz, new discipline lead for oceans, summarized the ocean discipline team breakout sessions. All science team members were represented at the meeting, and most of the NPP science team was present as well. The team just finished the multi-sensor ocean color reprocessing, so
there was not much dis-cussion of reprocessing. In the first breakout ses-sion, the team discussed the status of projects at GSFC. Chuck McClain, the new branch head for oceans, is working to integrate ocean work. The ocean team will provide an evaluation of standard Environmen-tal Data Record (EDR) products from NPP, but the team is not currently
tasked to reprocess or distribute data. The team discussed VIIRS evaluation and characterization. They have a high-fidelity VIIRS simulator to test sensor artifacts and their effects, and to assess impacts to data quality and the po-tential Climate Data Records (CDRs). The team will be able to distribute test data to the VIIRS science team on a restricted basis. Barney Balch [Bigelow Laboratory for Ocean Sciences] presented work on Particulate Inorganic Carbon (PIC)—in this case, suspended calcium carbon-ate. Calcification is a function of the acidity of the ocean, and it may be possible to see long-term impacts of acidifi-cation with the PIC product. It is now a standard product with particulate organic carbon. The team is working on a new algorithm for dissolved organic carbon. There is a push in the community to go beyond chlorophyll pres-ence and amounts to specific phytoplankton taxonomy, to improve understanding of sink rates, carbon flux and stor-age, and species distribution, including a new product to see phytoplankton size. There are several field sites collect-ing data to improve and assess the performance of these advanced algorithms.
The next science team meeting will be held some time after the NPP launch.
Net Primary Production Trend (2000–2010), Zhao and Running, Science (2010). [DOI:10.1126/science.1192666]
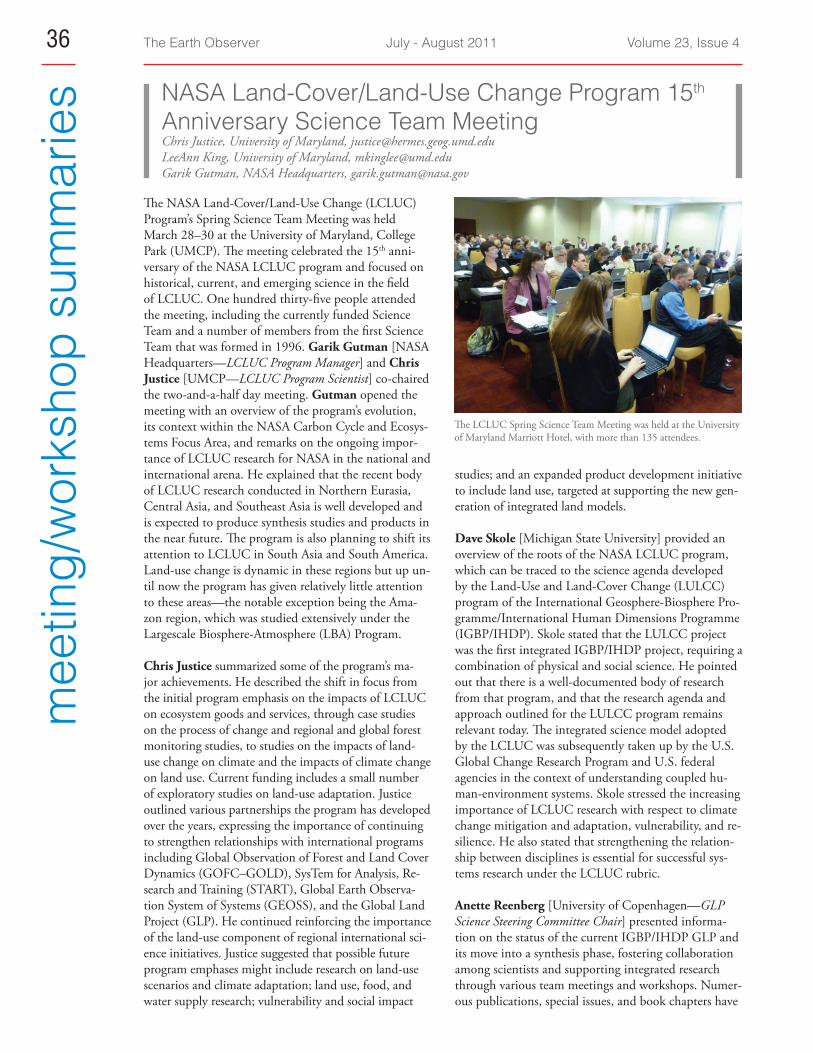
The Earth Observer July - August 2011 Volume 23, Issue 4 36m
eetin
g/w
orks
hop
sum
mar
ies NASA Land-Cover/Land-Use Change Program 15th
Anniversary Science Team MeetingChris Justice, University of Maryland, [email protected] LeeAnn King, University of Maryland, [email protected] Garik Gutman, NASA Headquarters, [email protected]
The NASA Land-Cover/Land-Use Change (LCLUC) Program’s Spring Science Team Meeting was held March 28–30 at the University of Maryland, College Park (UMCP). The meeting celebrated the 15th anni-versary of the NASA LCLUC program and focused on historical, current, and emerging science in the field of LCLUC. One hundred thirty-five people attended the meeting, including the currently funded Science Team and a number of members from the first Science Team that was formed in 1996. Garik Gutman [NASA Headquarters—LCLUC Program Manager] and Chris Justice [UMCP—LCLUC Program Scientist] co-chaired the two-and-a-half day meeting. Gutman opened the meeting with an overview of the program’s evolution, its context within the NASA Carbon Cycle and Ecosys-tems Focus Area, and remarks on the ongoing impor-tance of LCLUC research for NASA in the national and international arena. He explained that the recent body of LCLUC research conducted in Northern Eurasia, Central Asia, and Southeast Asia is well developed and is expected to produce synthesis studies and products in the near future. The program is also planning to shift its attention to LCLUC in South Asia and South America. Land-use change is dynamic in these regions but up un-til now the program has given relatively little attention to these areas—the notable exception being the Ama-zon region, which was studied extensively under the Largescale Biosphere-Atmosphere (LBA) Program.
Chris Justice summarized some of the program’s ma-jor achievements. He described the shift in focus from the initial program emphasis on the impacts of LCLUC on ecosystem goods and services, through case studies on the process of change and regional and global forest monitoring studies, to studies on the impacts of land-use change on climate and the impacts of climate change on land use. Current funding includes a small number of exploratory studies on land-use adaptation. Justice outlined various partnerships the program has developed over the years, expressing the importance of continuing to strengthen relationships with international programs including Global Observation of Forest and Land Cover Dynamics (GOFC–GOLD), SysTem for Analysis, Re-search and Training (START), Global Earth Observa-tion System of Systems (GEOSS), and the Global Land Project (GLP). He continued reinforcing the importance of the land-use component of regional international sci-ence initiatives. Justice suggested that possible future program emphases might include research on land-use scenarios and climate adaptation; land use, food, and water supply research; vulnerability and social impact
studies; and an expanded product development initiative to include land use, targeted at supporting the new gen-eration of integrated land models.
Dave Skole [Michigan State University] provided an overview of the roots of the NASA LCLUC program, which can be traced to the science agenda developed by the Land-Use and Land-Cover Change (LULCC) program of the International Geosphere-Biosphere Pro-gramme/International Human Dimensions Programme (IGBP/IHDP). Skole stated that the LULCC project was the first integrated IGBP/IHDP project, requiring a combination of physical and social science. He pointed out that there is a well-documented body of research from that program, and that the research agenda and approach outlined for the LULCC program remains relevant today. The integrated science model adopted by the LCLUC was subsequently taken up by the U.S. Global Change Research Program and U.S. federal agencies in the context of understanding coupled hu-man-environment systems. Skole stressed the increasing importance of LCLUC research with respect to climate change mitigation and adaptation, vulnerability, and re-silience. He also stated that strengthening the relation-ship between disciplines is essential for successful sys-tems research under the LCLUC rubric.
Anette Reenberg [University of Copenhagen—GLP Science Steering Committee Chair] presented informa-tion on the status of the current IGBP/IHDP GLP and its move into a synthesis phase, fostering collaboration among scientists and supporting integrated research through various team meetings and workshops. Numer-ous publications, special issues, and book chapters have
The LCLUC Spring Science Team Meeting was held at the University of Maryland Marriott Hotel, with more than 135 attendees.

The Earth Observer July - August 2011 Volume 23, Issue 4 37
mee
ting/
wor
ksho
p su
mm
arie
sresulted from GLP efforts to promote collaboration and synthesis among the program’s scientists.
Some of the current and past program PIs provided a re-view of the state of LCLUC science. Billie Turner [Ari-zona State University] described the importance of land use and sustainability, and stressed the need to move beyond “traditional” driver research before land-change science is surpassed by other global environmental change initiatives. He also noted that the critical driver-oriented research remaining is either aggregate, compar-ative, or synthetic in nature. Even though land-change monitoring remains an important element, a more sys-tematic and quantitative exploration is needed. Ruth DeFries [Columbia University] provided an overview of the complex relationships embedded in land-use change, describing that significant recent changes are driven by: distal drivers, such as demographics and markets and their gaining dominance; increases in competing objec-tives for land; and the fact that land-use decisions are be-ing influenced by climate change phenomena.
Tony Janetos [Joint Global Change Research Insti-tute] proposed that future priorities of the LCLUC program should involve increased interaction with the integrated modeling community. He suggested proj-ect topics for research including: further development of land-use models, to incorporate additional human factors involved in land-use change; assessment of re-lationships between models and observational data on land cover and land use; modeling interactions with the physical climate system, to illustrate potential fu-ture scenarios that meet societal demands; understand-ing sustained ecosystem services and interactions with a changing climate system; and understanding poten-tial climate change consequences through the lens of adaptation and vulnerability.
Dan Brown [University of Michigan] described differ-ent techniques for modeling processes and projections of land-use change. His presentation continued with a description of issues surrounding the representation of human processes that include understanding deci-sion-making strategies, heterogeneity, interactions and adaptability of populations, scales of actions in time and space, and the stochasticity of data and modeling. George Hurtt [University of Maryland] provided fur-ther description of integrated land-use change mod-eling. He showed the importance of using integrated models to understand Earth’s systems and land-use effects in the past, present, and future. Hurtt also ex-plained why studies are needed to further constrain land-use models with improved data on land-use and land-management practices, to prepare for the next generation of fully integrated models.
Alexander Shiklomanov [University of New Hamp-shire] reviewed the impacts of LCLUC on hydrologi-cal systems, with an emphasis on northern Eurasia. He showed that the water cycle in this region is intensifying and that changes in land cover in cold regions can sig-nificantly modify hydrological processes.
Dev Niyogi [Purdue University] reviewed the impact of LCLUC on weather, climate and energy balance. He suggested that the impact of LCLUC is likely equiva-lent to other major global forcing’s, but unlike warm-ing seen from GHG emissions, LCLUC forcing is multi-directional and can warm or cool and cause posi-tive or negative feedbacks depending on the region and timing. He stated that without an understanding of the role of LCLUC, we will have an incomplete under-standing of human impacts on the climate system.
LCLUC Spring Science Team meeting participants.

The Earth Observer July - August 2011 Volume 23, Issue 4 38m
eetin
g/w
orks
hop
sum
mar
ies The first day concluded with a panel discussion on fu-
ture directions for land-cover and land-use research, provided by senior members of the community: Ruth DeFries, Emilio Moran [Indiana University], Anette Reenberg, Dave Skole, Robert Kaufman [Boston Uni-versity], and Richard Moss [Joint Global Change Re-search Institute]. Moran identified key issues associated with future LCLUC science, including food security, the effects of land grabs and rural-to-urban migration, the effect of LCLUC policy implementation, and the usefulness of multiresolution data and multiple meth-ods for analysis. Reenberg emphasized that essential steps for the future involve strengthening the links be-tween decision making, ecosystem services, and global environmental change, as well as defining the impor-tant feedbacks for human activities at the local, re-gional, and global scales. Skole specified that LCLUC monitoring needs should continue to be an important focus of the program, taking advantage of the unique role that NASA plays in satellite observations and sci-ence. Defries stressed the importance of understanding LCLUC as an integral component of the Earth systems. Kaufmann added that the social factors should be giv-en equal attention, followed by Moss’s confirmation that the feedbacks between the physical and the social systems require new methodologies for research and collaboration within geographic regions and among nu-merous related disciplines.
The second day started with short presentations from early-career LCLUC scientists in the NASA New In-vestigators Program (NIP) and doctoral students sup-ported by the NASA Earth and Space Science Fellow-ship (NESSF). David Lobell [Lawrence Livermore National Laboratory—NIP 2007] presented research on agricultural applications of multiyear remote sens-ing to explore the relationship between weather and agricultural management and to explain drivers of crop growth, development, and yield. Kimberly Carlson [Yale University—NESSF 2008 recipient] presented her research on spatially explicit land-use change modeling and the impacts of oil palm expansion on carbon flux in the Ketapang District of Indonesian Borneo. Carl-son showed that 87% of oil palm plantations are con-verted from forests and that only 5–10% of the forests will remain intact in the future.
In the next session, LCLUC Science Team Members presented second-year project results. Jane Southworth [University of Florida] presented research on under-standing and predicting the impacts of climate vari-ability and climate change on land-use and land-cover change via socioeconomic institutions in Southern Af-rica. Southworth is collecting field measurements of social and ecological components to understand how households cope with climate variability, and which fac-tors lead to greater resilience in the face of current and anticipated variability. Preliminary results of the study
show that alternatives to land-based livelihoods enhance resilience to climate variability and highlight the need to place the research in a landscape context in terms of spatial patterns to evaluate finer-scale socioeconomic analyses in a broader context.
Xiangming Xiao [University of Oklahoma] described research currently being conducted for developing land-cover classification products in Monsoon Asia over the period 2004–2007 through the integration of Landsat and Advanced Land Observation Satellite/Phased Ar-ray type L-band Synthetic Aperture Radar (ALOS/PAL-SAR) images. Different approaches have been used to combine the data for operational rice monitoring.
As part of the anniversary meeting celebration, some of the project investigators reviewed various aspects of LCLUC monitoring and their past and proposed future directions. John Townshend [University of Maryland] reviewed progress made since the 1980s in coarse- and moderate-resolution remote sensing, and discussed vari-ous challenges associated with acquiring and processing global datasets. Townshend expressed the need for mul-tiple, moderate-resolution images per scene, continu-ous monitoring for areas of rapid land-cover change, and industrial-scale processing of land-cover-related products. He made the case for renewed international collaboration with respect to global-scale moderate-res-olution products and the need to implement a virtual global-land-surface-imaging constellation.
Matt Hansen [South Dakota State University] pre-sented results of monitoring land-cover change around the world using bulk processing of Landsat data. He pointed out that infrequent acquisition of Landsat data makes annual updates difficult for many parts of the world. Hansen’s presentation concluded with a descrip-tion of a new 30-m vegetation continuous-field product for the coterminous U.S. that used Web-Enabled Land-sat Data (WELD).
David Roy [South Dakota State University] then pre-sented information on the NASA Making Earth Sys-tem Data Records for Use in Research Environments (MEaSUREs) WELD project, which provides a con-sistent 30-m record of the land surface of the conter-minous United States (CONUS) and Alaska for eight years by applying MODIS data processing principles. He showed examples of the WELD products, de-scribed planned algorithm improvements to the prod-uct, and presented preliminary results for applying the Spectral Image Analysis Mapper (SIAM) software to develop automated continental scale land cover at 30-m spatial resolution. He concluded by showing the first WELD global composite for one month, made us-ing 7,000 Landsat scenes, and discussed the possibility of using NASA Earth Exchange (NEX) supercomput-ers for generating global WELD products.

The Earth Observer July - August 2011 Volume 23, Issue 4 39
mee
ting/
wor
ksho
p su
mm
arie
sChengquan Huang [University of Maryland] described a procedure—known as the Vegetation Change Tracker (VCT)—for extracting land-cover change history from dense time series stacks of Landsat data. Huang pre-sented results on characterizing land-cover disturbance and recovery for North America. He made a strong case for global high-temporal-frequency acquisitions from Landsat-class sensors. The session included presenta-tions from: Shunlin Liang [University of Maryland], on the Chinese Data Accessibility Project; Jeff Masek [GSFC], on the Global Land Survey (GLS); Jim Irons [GSFC], on the status of the Landsat Data Continuity Mission (LDCM); Chandra Giri [U.S. Geological Sur-vey], on LDCM processing plans; and Noel Gorelick [Google], on the Google Earth Engine.
On the third day, investigators on projects that were at the end of their funding cycle provided a final report of the significant results from their work. Hanqin Tian [Auburn University] presented results from the Land Use-Ecosystem-Climate Interactions in Monsoon Asia Project. Tian concluded that in Monsoon Asia total carbon storage decreased over the years 1700–2005. However, net carbon exchange for the past 10 years has been increasing—particularly in East Asia—primarily due to increased forest plantation and elevated nitro-gen inputs. He explained that climate extremes, espe-cially drought, have significantly reduced carbon stor-age and productivity in cropland, grassland, and forest. The negative impacts of climate change or extreme events, however, could be mitigated through optimiz-ing land management.
Sue Conard [U.S. Forest Service] summarized her long-term research on land cover and fire in Siberia, in-cluding results from a number of experimental burns and airborne campaigns. Conrad highlighted improve-ments to burned-area estimates, which showed signifi-cant interannual variability in extent and location. She showed a wide variability of fire intensity and severity within and between fires in larch and Scots pine, stress-ing that ground fires were more common than crown fires, with low tree mortality over much of the land-scape, with landscape return intervals of around 50 years. Conrad also pointed out that emissions from Si-berian fires can be highly variable.
Jeff Fox [East–West Center, Hawaii] provided re-sults from his research titled The Expansion of Rubber and Its Implications for Water and Carbon Dynamics in Montane Mainland Southeast Asia. The research docu-mented the expansion of rubber into nontraditional areas, and that monitoring at well-instrumented sites revealed that evapotranspiration from rubber may be
higher than for forest, with significant differences in seasonal cycles. Fox described how the annual carbon-flux cycle is strongly influenced by the phenology of rubber production.
Garik Gutman wrapped up the meeting by summariz-ing future plans for the program. He emphasized the need to synthesize and integrate past case study results. Essential components of synthesis and integration of LCLUC research include: summarizing the state-of-the-art knowledge; compiling available relevant data-sets and research studies; advancing our understand-ing of the processes, drivers and impacts of LCLUC; and developing new understandings and conceptual frameworks. He indicated that the future direction of the LCLUC program would continue existing interna-tional efforts and integration of the social sciences in LCLUC projects, balancing thematic and geographi-cal research. The program will continue to advance the monitoring of land cover and land use and to foster generation of global products, taking advantage of the new NASA sensors coming online in the next few years [e.g., LDCM, Visible Infrared Imager Radiometer Suite (VIIRS)] and to promote the broad use of NASA data and products.
Attending the poster session on Monday night. [Left to right] Kyle McDonald [City University New York], Kathleen Bergen [Univer-sity of Michigan], and Susan Conard [USDA Forest Service].
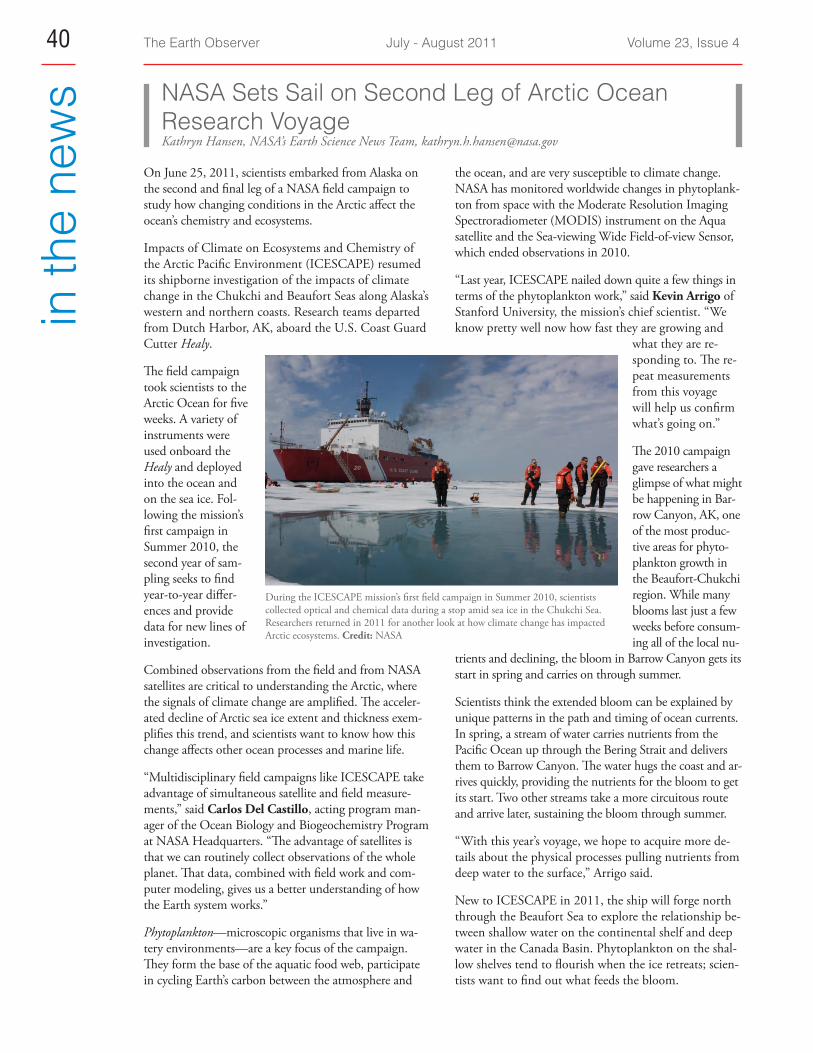
The Earth Observer July - August 2011 Volume 23, Issue 4 40in
the
new
s NASA Sets Sail on Second Leg of Arctic Ocean Research VoyageKathryn Hansen, NASA’s Earth Science News Team, [email protected]
On June 25, 2011, scientists embarked from Alaska on the second and final leg of a NASA field campaign to study how changing conditions in the Arctic affect the ocean’s chemistry and ecosystems.
Impacts of Climate on Ecosystems and Chemistry of the Arctic Pacific Environment (ICESCAPE) resumed its shipborne investigation of the impacts of climate change in the Chukchi and Beaufort Seas along Alaska’s western and northern coasts. Research teams departed from Dutch Harbor, AK, aboard the U.S. Coast Guard Cutter Healy.
The field campaign took scientists to the Arctic Ocean for five weeks. A variety of instruments were used onboard the Healy and deployed into the ocean and on the sea ice. Fol-lowing the mission’s first campaign in Summer 2010, the second year of sam-pling seeks to find year-to-year differ-ences and provide data for new lines of investigation.
Combined observations from the field and from NASA satellites are critical to understanding the Arctic, where the signals of climate change are amplified. The acceler-ated decline of Arctic sea ice extent and thickness exem-plifies this trend, and scientists want to know how this change affects other ocean processes and marine life.
“Multidisciplinary field campaigns like ICESCAPE take advantage of simultaneous satellite and field measure-ments,” said Carlos Del Castillo, acting program man-ager of the Ocean Biology and Biogeochemistry Program at NASA Headquarters. “The advantage of satellites is that we can routinely collect observations of the whole planet. That data, combined with field work and com-puter modeling, gives us a better understanding of how the Earth system works.”
Phytoplankton—micr oscopic organisms that live in wa-tery environments—are a key focus of the campaign. They form the base of the aquatic food web, participate in cycling Earth’s carbon between the atmosphere and
the ocean, and are very susceptible to climate change. NASA has monitored worldwide changes in phytoplank-ton from space with the Moderate Resolution Imaging Spectroradiometer (MODIS) instrument on the Aqua satellite and the Sea-viewing Wide Field-of-view Sensor, which ended observations in 2010.
“Last year, ICESCAPE nailed down quite a few things in terms of the phytoplankton work,” said Kevin Arrigo of Stanford University, the mission’s chief scientist. “We know pretty well now how fast they are growing and
what they are re-sponding to. The re-peat measurements from this voyage will help us confirm what’s going on.”
The 2010 campaign gave researchers a glimpse of what might be happening in Bar-row Canyon, AK, one of the most produc-tive areas for phyto-plankton growth in the Beaufort-Chukchi region. While many blooms last just a few weeks before consum-ing all of the local nu-
trients and declining, the bloom in Barrow Canyon gets its start in spring and carries on through summer.
Scientists think the extended bloom can be explained by unique patterns in the path and timing of ocean currents. In spring, a stream of water carries nutrients from the Pacific Ocean up through the Bering Strait and delivers them to Barrow Canyon. The water hugs the coast and ar-rives quickly, providing the nutrients for the bloom to get its start. Two other streams take a more circuitous route and arrive later, sustaining the bloom through summer.
“With this year’s voyage, we hope to acquire more de-tails about the physical processes pulling nutrients from deep water to the surface,” Arrigo said.
New to ICESCAPE in 2011, the ship will forge north through the Beaufort Sea to explore the relationship be-tween shallow water on the continental shelf and deep water in the Canada Basin. Phytoplankton on the shal-low shelves tend to flourish when the ice retreats; scien-tists want to find out what feeds the bloom.
During the ICESCAPE mission’s first field campaign in Summer 2010, scientists collected optical and chemical data during a stop amid sea ice in the Chukchi Sea. Researchers returned in 2011 for another look at how climate change has impacted Arctic ecosystems. Credit: NASA

The Earth Observer July - August 2011 Volume 23, Issue 4 41
in th
e ne
wsLast year, researchers saw some indication that nutrients
were moving between deep and shallow water. Wind unexpectedly blew thick, multiyear sea ice south to the edge of the shelf, up to 20 ft (6.1 m) thick in some places, which proved too thick for the icebreaker to pen-etrate. The Healy, the newest and most technologically advanced U.S. polar icebreaker, is designed to break 4.5 ft (1.37 m) of ice continuously at three knots.
This year, the field campaign begins two weeks later, which means the Healy is expected to encounter thin-ner, summer ice and thus have a better chance of ex-ploring the ecosystems in water that spends most of the year under a blanket of ice.
Various species of microscopic organisms called phytoplankton reflect light that when imaged from space show up as colorful blue and green swirls. This image, from the MODIS instrument on NASA’s Aqua satellite, captured a phytoplank-ton bloom in the Barents Sea on August 31, 2010. Image credit: NASA Earth Observatory

The Earth Observer July - August 2011 Volume 23, Issue 4 42in
the
new
s For Aquarius, Sampling Seas No ‘Grain of Salt’ TaskRosemary Sullivant, Jet Propulsion Laboratory, [email protected]
The breakthrough moment for oceanographer Gary Lagerloef, the principal investigator for NASA’s new Aquarius/SAC-D (Satélite de Aplicaciones Científicas) mission, came in 1991. That’s when he knew it would be possible to make precise measurements of ocean sa-linity from space. It has taken nearly two decades to turn that possibility into reality.
Lagerloef was looking at data collected by a NASA air-craft flying over the ocean off the coast of Maryland. It was testing a new mi-crowave radiometer, an instrument that can sense thermal signals emitted by land, clouds and the ocean surface. The instrument not only captured the unique signature of dissolved salt in the surface water below, it also showed how the wa-ter’s salt content var-ied from one side of the Gulf Stream to the other.
“That flight was a turning point,” said Lagerloef, a senior scientist at Earth & Space Research in Seattle , WA. “We could clearly see the range that we needed to study salinity from its lowest levels in the North Pacific to the highest salinity levels in the North Atlantic.”
Salinity, or saltiness, plays a critical role in ocean circu-lation and is a key tracer for understanding the ocean’s role in Earth’s global water cycle. While satellites rou-tinely provide information on sea surface temperature, sea level, ocean color, and ocean winds, historically, no global view of ocean surface salinity had been available. Salinity measurements were limited to those by ships, buoys and floats until recently —and are still few and far between.
Measuring salinity from space is extremely challenging and has been one of the last frontiers for ocean remote sensing. The European Space Agency (ESA) launched the Soil Moisture and Salinity Mission in 2009 to mea-sure both soil moisture and ocean salinity. On June 10, 2011, the Aquarius/SAC-D mission developed by
NASA and Argentina’s space agency, the Comisión Nacional de Actividades Espaciales, was launched. The two missions are complementary, but differ in fo-cus and technology. One important difference is that Aquarius uses both a passive radiometer to detect ocean salinity and an active scatterometer radar to correct the radiometer’s salinity measurements for wind roughness (waves) at the sea surface. This is the first combination of this kind used in space for Earth observations; the
ESA mission, on the other hand, uses only a passive microwave imaging radiometer.
Aquarius is dedi-cated to making pre-cise measurements of ocean salinity over months and years, providing important new information for climate studies. The mission will produce monthly maps of the surface salinity of the global ocean with a 93-mile (150-km) resolution and an ac-curacy of 0.2 practi-cal salinity units—which is equal to about one-eighth teaspoon of salt in a gallon of water1. The
ments continuously mission is to make these measurefor at least three years.
“This is a level of accuracy and stability that has never been achieved in space before,” said Aquarius Instru-ment Scientist Simon Yueh, of NASA’s Jet Propulsion Laboratory (JPL), which is managing the mission for NASA through its commissioning phase.
“The first challenge is that the signal we are measuring is very small,” said Aquarius Deputy Principal Investi-gator David Le Vine, of NASA’s Goddard Space Flight Center. “It is a very tiny signal in a noisy environment. In addition, the dynamic range—the difference in the signal that comes from water with low salinity and wa-ter with high salinity—is also small.”
The Aquarius instrument has three separate radiometers aimed at the ocean below. The radiometers are designed 1 Practical salinity is a scale used to describe the concentration of dissolved salts in seawater, nearly equivalent to parts per thousand by weight.
Gary Lagerloef [Earth & Space Research—Aquarius Principal Investigator] dem-onstrates how sensitive the instruments on the Aquarius/SAC-D spacecraft are by putting one-eighth of a teaspoon of salt into one gallon of water during the Aquar-ius/SAC-D mission science briefing on Tuesday, June 7, 2011, at the NASA Resi-dent Office at Vandenberg Air Force Base, CA. The joint U.S./Argentinian Aquar-ius/SAC-D mission will map the salinity at the ocean surface, information critical to improving our understanding of two major components of Earth’s climate sys-tem: the water cycle and ocean circulation. Image credit: NASA

The Earth Observer July - August 2011 Volume 23, Issue 4 43
in th
e ne
ws
to detect and measure a particular wavelength of micro-wave energy being emitted by the ocean.
“Everything radiates energy,” explained Le Vine. “When you see the glow of an electric stove, you’re seeing ther-mal radiation. It is in a range that our eyes can see. Night-vision goggles let you see radiation in the infra-red part of the spectrum. For Aquarius, we’re measuring radiation at microwave frequencies.”
The radiometers on Aquarius measure the microwave emissions from the sea surface at 1.4 GHz in the L-band portion of the electromagnetic spectrum. This en-ergy, which is measured as an equivalent temperature called the brightness temperature in Kelvin, has a direct correlation to surface salinity.
“Lots of things interfere with the salinity signal Aquar-ius is measuring, such as land and atmospheric effects,” said Le Vine. “Ocean waves are a particularly significant source of ‘noise’ that can confuse the signal from salin-ity. That’s why we have an additional instrument, a scat-terometer, onboard to help correct for this.” The scat-terometer sends a radar pulse to the ocean surface that is reflected back to the spacecraft, providing informa-tion about the ocean surface.
Because of its importance, the 1.4 GHz band is protect-ed for scientific use. Nevertheless, says Aquarius Science Team Member Frank Wentz, director of Remote Sens-ing Systems, stray signals from radar, telephone, and ra-dio occasionally cause problems. Aquarius’s radiometers are designed to detect much of this interference and eliminate contaminated measurements.
Wentz is part of the team creating the complicated mathematical formula—called a retrieval algorithm— that Aquarius will use to translate brightness tempera-ture into measurements of salinity. “It’s basically a big subtraction process,” he said. “We figure out all the things that interfere with the signal we want and elimi-
nate their effect on our measurement. This would be challenging enough to do even if the ocean were per-fectly flat like a mirror. Instead, because of waves, it’s more like a funhouse mirror that distorts everything.”
Aquarius’s primary focus is to see how salinity varies from place to place and with time. This task would be easier if there were a greater difference in the signal between the regions with low salinity and those with high salinity.
Over the open ocean, salinity is relatively constant. It ranges from about 32–37 parts per thousand. The cor-responding change in brightness temperature—what Aquarius measures—is very small. Aquarius has been designed to detect changes in salinity as small as about two parts per 10,000, which corresponds to about 0.1 Kelvin. “This will be about 10 times more accurate than previous spaceborne radiometer observations of other sea surface characteristics,” said Yueh.
Aquarius has to be extremely stable as well as sensitive. “If we want to see small things over long periods of time, we have to make sure that the instrument itself doesn’t change. We need to know that any variations we observe are real and not caused by the instrument itself,” said Yueh. Making this happen required special engineering attention to temperature control and calibration.
Controlling the temperature, critical for maintaining precision and stability, within a large instrument is dif-ficult. JPL engineers had to design special computer models to understand the system’s thermal behavior and its electronics. “This had never been done before for an instrument of this size operating over months and years,” said Yueh.
All microwave radiometers, including Aquarius, require a calibration reference point. Most operational space-craft radiometers routinely turn to look at cold space in order to calibrate their instruments. Aquarius, however, uses internal calibration to help retain its stability. “We have a big antenna and a large instrument,” said Yueh. “No one wants to spin this instrument around fre-quently to look at an external reference.”
While Aquarius benefits from advanced technologies such as internal calibration and sophisticated radiom-eters, its ability to measure global ocean surface salinity with unprecedented accuracy is the result of years of re-search and planning.
The key to making this challenging measurement, say Aquarius science team members, is in the details. And from the tiny, detailed measurements of salinity that Aquarius makes, a new “big” picture of Earth’s ocean will emerge.
For more information on Aquarius/SAC-D, visit: www.nasa.gov/aquarius.
An overhead crane lifts the Aquarius/SAC-D spacecraft, secured in-side its payload transportation canister, into the mobile service tower at NASA's Space Launch Complex-2 (SLC-2) at Vandenberg Air Force Base in California. Aquarius, the NASA-built instrument on the SAC-D spacecraft, will provide new insights into how variations in ocean surface salinity relate to fundamental climate processes on its three-year mission. Image credit: NASA VAFB

The Earth Observer July - August 2011 Volume 23, Issue 4 44N
ASA
ear
th s
cien
ce in
the
new
s
covers the Pacific Northwest. “Quickly identifying the size and source of major earthquakes may help save lives by directing emergency responders,” said Frank Webb [NASA JPL].
‘Wild and Weird’ Weather Leaves Its Mark, June 8; USA Today. Tornadoes, floods, wildfires, and wide-spread drought have put weather stories all over the news—anomalies in the jet stream have played a ma-jor role. “Sometimes it gets wild and weird,” said Bill Patzert [NASA JPL].
Massachusetts Tornado Track Seen From Space, June 7; ABC News Online. Landsat 5 captured a clearly vis-ible track of destruction left by a tornado that passed through western Massachusetts on June 1. The tornado outbreak in Massachusetts represented just one out-break of severe weather seen in the Southeast and Mid-west this spring.
Global Land Fluorescence Is Mapped For the First Time, June 8; Reuters. NASA scientists have, for the first time, used satellite imagery to produce a global map of how land plants fluoresce, a breakthrough that should enable researchers to more quickly identify when vegetation is stressed and to better track the car-bon cycle in terrestrial ecosystems, said Joanna Joiner [NASA GSFC]—see images below.
*NASA Ready To Test The Waters, May 18; Nature News. NASA prepares to make spaceborne measure-ments of salinity that were first envisioned in the 1970s with a mission, Aquarius/SAC-D, that will represent a major leap forward for oceanography, said project sci-entist Eric Lindstrom [NASA JPL—Aquarius Project Scientist].
Before & After: Mississippi River Floods, May 9; Our Amazing Planet. Landsat 5 images of the area around Cairo, IL offered a dramatic “before and after” view of the flooding there and the U.S. Army Corps of Engi-neers decision to flood the New Madrid Floodway in order to save Cairo from terrible flooding.
Groundwater Depletion Is Detected From Space, May 30; The New York Times. Scientists have been us-ing small variations in Earth’s gravity, using NASA’s GRACE satellite mission, to identify trouble spots around the globe where people are making unsustain-able demands on groundwater, one of the planet’s main sources of fresh water. GRACE’s gravity data has turned what was a “wide-open field” into a significant part of hydrology, said Matt Rodell [NASA GSFC].
Scientists Track Tectonic Motion Using GPS Sen-sors, June 6; The Seattle Times. Scientists use GPS to track miniscule motions in tectonic plates as they hap-pen, thanks to an expanded network of sensors that
NASA Earth Science in the NewsKathryn Hansen, NASA Earth Science News Team, [email protected]
A first-of-a-kind global map of land plant fluorescence shows stronger photosynthetic activity in the Northern Hemisphere in July when light and temperature conditions were most conducive to plant growth, and stronger photosynthetic activity in the Southern Hemisphere in December. The maps are based on data from a spectrometer aboard the Japanese satellite GOSAT. Credit: NASA’s Earth Observatory
July 2009 December 2009
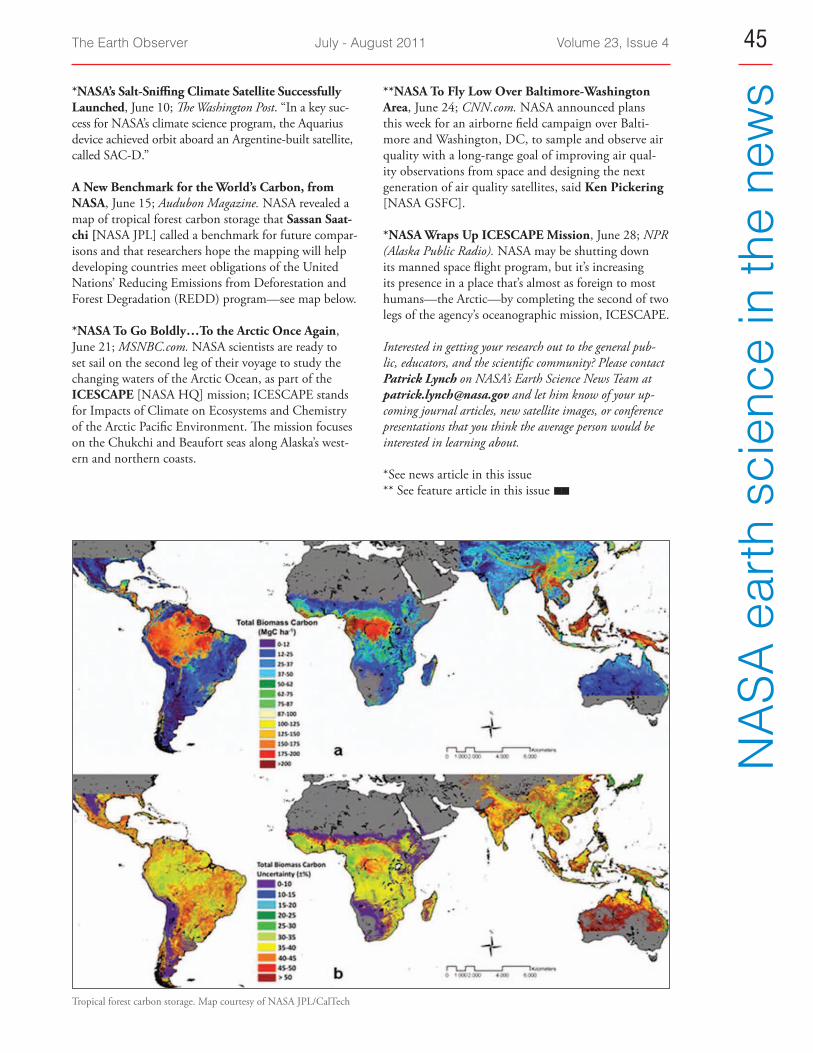
The Earth Observer July - August 2011 Volume 23, Issue 4 45
NA
SA e
arth
sci
ence
in th
e ne
ws*NASA’s Salt-Sniffing Climate Satellite Successfully
Launched, June 10; The Washington Post. “In a key suc-cess for NASA’s climate science program, the Aquarius device achieved orbit aboard an Argentine-built satellite, called SAC-D.”
A New Benchmark for the World’s Carbon, from NASA, June 15; Audubon Magazine. NASA revealed a map of tropical forest carbon storage that Sassan Saat-chi [NASA JPL] called a benchmark for future compar-isons and that researchers hope the mapping will help developing countries meet obligations of the United Nations’ Reducing Emissions from Deforestation and Forest Degradation (REDD) program—see map below.
*NASA To Go Boldly…To the Arctic Once Again, June 21; MSNBC.com. NASA scientists are ready to set sail on the second leg of their voyage to study the changing waters of the Arctic Ocean, as part of the ICESCAPE [NASA HQ] mission; ICESCAPE stands for Impacts of Climate on Ecosystems and Chemistry of the Arctic Pacific Environment. The mission focuses on the Chukchi and Beaufort seas along Alaska’s west-ern and northern coasts.
**NASA To Fly Low Over Baltimore-Washington Area, June 24; CNN.com. NASA announced plans this week for an airborne field campaign over Balti-more and Washington, DC, to sample and observe air quality with a long-range goal of improving air qual-ity observations from space and designing the next generation of air quality satellites, said Ken Pickering [NASA GSFC].
*NASA Wraps Up ICESCAPE Mission, June 28; NPR (Alaska Public Radio). NASA may be shutting down its manned space flight program, but it’s increasing its presence in a place that’s almost as foreign to most humans —the Arctic—by completing the second of two legs of the agency’s oceanographic mission, ICESCAPE.
Interested in getting your research out to the general pub-lic, educators, and the scientific community? Please contact Patrick Lynch on NASA’s Earth Science News Team at [email protected] and let him know of your up-coming journal articles, new satellite images, or conference presentations that you think the average person would be interested in learning about.
*See news article in this issue ** See feature article in this issue
Tropical forest carbon storage. Map courtesy of NASA JPL/CalTech

The Earth Observer July - August 2011 Volume 23, Issue 4 46ed
ucat
ion
and
publ
ic o
utre
ach
upda
te
learning about weather and climate through the use of NASA data and visualizations. The workshop will also give participants a behind-the-scenes look at Proj-ect 2061’s resource development process, plus guid-ance and practice in applying that process to their own work. Although the workshop is free, participants are responsible for their own travel expenses. A continental breakfast and lunch will be provided each day. To apply, visit: www.surveymonkey.com/s/98GZKG2. Space for this workshop is limited, and participants selected to attend will be notified by July 15.
MS PHD’s Professional Development Program for Graduate Students
Applications due by August 31
The application process is beginning for the Cohort VIII (2011–2013) of the Minorities Striving and Pur-suing Higher Degrees of Success in Earth System Sci-ence (i.e., MS and PhD) Professional Development Program. This program provides professional develop-ment experiences that facilitate the advancement of mi-norities committed to achieving outstanding Earth sys-tem science-related careers. Activities include oral and written presentation skill development; mentee/mentor partnerships with scientists; and networking experiences with professionals within academia, industry, federal government, and professional organizations. Those se-lected to participate in the program will also engage in two professional society meetings and a capstone event touring federal agencies in Washington, DC. To learn more and apply, visit: www.msphds.org.
Terra Viva SEDAC Viewer
Produced in collaboration with ISciences and the NASA Socioeconomic Data and Applications Cen-ter (SEDAC) operated by the Center for International Earth Science Information Network (CIESIN), the Ter-ra Viva SEDAC Viewer, a map viewer and standalone software application, has been updated for 2011 with the addition of several new SEDAC datasets, includ-ing climate change scenario data and indicator collec-tions with hundreds of variables. Terra Viva contains map data and GIS functions in one package. A helpful tool for educators as well as for researchers and ana-lysts working in diverse areas, Terra Viva has a library of maps organized by theme, a Gazeteer geographic lo-cator, and can create dynamic color-coded maps and charts, among other features. For more information, visit: sedac.ciesin.columbia.edu/terraVivaUserWeb/.
NASA Science Mission Directorate – Science Education and Public Outreach UpdateTheresa Schwerin, Institute of Global Environment and Society (IGES), [email protected] Woroner, Institute of Global Environment and Society (IGES), [email protected]
Hands-On Programs for Classroom Teachers as Part of ASP Meeting
July 30–August 3
The national Astronomical Society of the Pacific (ASP), in partnership with the American Geophysical Union and the Space Telescope Science Institute, is pleased to present a weekend workshop and six fascinating three-hour short courses for teachers in grades K-12 in Balti-more, MD. Presenters will include NASA mission edu-cation specialists and scientists, and most of the sessions include kits of materials and classroom-ready activity handouts. The sessions available for teachers are:
• In the Footsteps of Galileo: A Hands-On Work-shop on Astronomy for Teachers in Grades 3–12 (July 30–31)
• Active Astronomy: Classroom Activities for Learn-ing about the Electromagnetic Spectrum – Grades 6–12 (August 1)
• Eye on the Sky: Exploring the Sun with Activities for the Elementary Classroom – Grades K–5 (August 2)
• Light and Color in the Night Sky, in the City and in the Classroom – Grades K–8 (August 2)
• Evidence-based Science: Climate in the Classroom – Grades 6–12 (August 3)
• Global AND Local: Activity-based Explorations Con-necting Global Climate Change to Change in Stu-dents Own Communities – Grades 6–12 (August 3)
These sessions are open to all teachers; participants do not have to register for the full conference. Some schol-arship support is available to help with registration fees and travel expenses. For more information, visit: www.astrosociety.org/events/meeting.html.
Weather and Climate Workshop at AAAS Project 2061
You are invited to attend a free, three-day professional development workshop on weather and climate. The workshop is supported by a grant from NASA’s Global Climate Change Education program and is organized by the American Association for the Advancement of Science (AAAS) as Project 2061. The workshop will be held August 9–11, 2011, 9 A.M.–4 P.M. each day at the AAAS Headquarters in Washington, DC.
Workshop participants will explore new resources be-ing developed by Project 2061 to support teaching and

The Earth Observer July - August 2011 Volume 23, Issue 4 47
scie
nce
cale
ndar
sEOS Science Calendar
August 8–10, 2011 GRACE Science Team Meeting, University of Texas Center for Space Research. URL: www.csr.utexas.edu/grace/GSTM/
August 16–18, 2011 Landsat Science Team Meeting, USGS Earth Resources Observation and Science (EROS) Center near Sioux Falls, SD.
September 12, 2011 OMI Science Team Meeting, Helsinki, Finland
September 13–15, 2011 Aura Science Team Meeting, Helsinki, Finland
September 13–16, 2011 SORCE Science Meeting: Decadal Cycles in the Sun, Sun-like Stars, and Earth’s Climate System, Sedona, AZ. URL: lasp.colorado.edu/sorce/news/2011ScienceMeeting/index.html
October 4–6, 2011 CERES Science Team Meeting, Livermore, CA
October 13–14, 2011 LPVEx Data Coordination and User Workshop, Hel-sinki, Finland. URL: lpvex.fmi.fi/
October 19–21, 2011 Sea Surface Temperature Science Team Meeting, San Diego, CA
November 7–10, 2011 Precipitation Science Team Meeting, Denver, CO
November 8–11, 2011 Sounder Science Team Meeting, Greenbelt, MD
Global Change Calendar
August 8-12, 2011 Asia Oceania Geosciences Society Meeting, Taipei, Tiawan. URL: www.asiaoceania.org/society/index.asp
August 30–September 1, 2011 GEWEX Radiation Panel (GRP) Meeting (by invita-tion), Tokyo, Japan.
September 11–14, 2011 SPRS Commission VIII/WG-2 Symposium on Ad-vances in Geospatial Technologies for Health, Santa Fe, NM. URL: isprs-wg8-2.unm.edu/symposium
September 19–22, 2011 SPIE Europe Remote Sensing 2011 Symposium, Clar-ion Congress Hotel Prague, Czech Republic. URL: spie.org/remote-sensing-europe.xml
Oct. 15–21, 2011 36th National Weather Association (NWA) Annual Meeting/7th GOES Users’ Conference (GUC), Wynfrey Hotel, Birmingham, AL. NWA registration: www.nwas.org/meetings/nwa2011/ Contact for GUC: Kenneth Carey, [email protected], 703-610-1933, GUC registration: directreadout.noaa.gov/GUC_VII/index.htm
October 24–28, 2011 World Climate Research Programme Open Science Conference, Denver, CO. URL: www.wcrp-climate.org/conference2011/
November 28–December 9 United Nations Conference on Climate Change (COP 17), Durban, South Africa. URL: www.cop17durban.com/
December 5–9, 2011 American Geophysical Union Fall Meeting, San Fran-cisco, CA. URL: www.agu.org/meetings/

Code 610 National Aeronautics and Space Administration
Goddard Space Flight Center Greenbelt, MD 20771
PRSRT STD Postage and Fees Paid National Aeronautics and Space Administration Permit 396
Official Business Penalty for Private Use: $300
(affix mailing label here)
eos.nasa.govThe Earth Observer
The Earth Observer is published by the EOS Project Science Office, Code 610, NASA Goddard Space Flight Center, Greenbelt, Maryland 20771, telephone (301) 614-5561, FAX (301) 614-6530, and is available in color on the World Wide Web at eospso.gsfc.nasa.gov/eos_homepage/for_scientists/earth_observer.php. Black and white hard copies can be obtained by writing to the above address. Articles, contributions to the meeting calendar, and suggestions are welcomed. Contributions to the calendars should contain location, person to contact, telephone number, and e-mail address.
To subscribe to The Earth Observer, or to change your mailing address, please call Steve Graham at (301) 614-5561, or send a message to [email protected], or write to the address above. If you would like to stop receiving a hard copy and be noti-fied via email when future issues of The Earth Observer are available for download as a PDF, please send an email with the sub-ject “Go Green” to [email protected]. Your name and email address will then be added to an electronic distribution list and you will receive a bi-monthly email indicating that the next issue is available for download. If you change your mind, the email notification will provide an option for returning to the printed version.
The Earth Observer Staff
Executive Editor: Alan Ward ([email protected])
Assistant Editor: Heather Hyre ([email protected])
Technical Editors: Tim Suttles ([email protected]) Mitchell K. Hobish ([email protected])
Design, Production: Deborah McLean ([email protected])
Printed on Recycled Paper


![The Earth Observer the earth observer...The Earth Observer March–April 2008, [Volume 20, Issue 2] Special Edition 03 perspectives on EOS and debate on how to make the hopeful vision](https://img.pdfslide.us/doc/110x75/5f0336007e708231d40815d6/the-earth-observer-the-earth-observer-the-earth-observer-marchaapril-2008.jpg)