Embed Size (px)
Citation preview
The Early Detection of The Early Detection of Disease –Statistical Disease –Statistical
ChallengesChallengesMarvin ZelenMarvin Zelen
Harvard UniversityHarvard University
The R.A. Fisher Memorial LectureThe R.A. Fisher Memorial Lecture
August 1, 2007August 1, 2007Joint Statistical MeetingsJoint Statistical Meetings
Salt Lake City, Utah Salt Lake City, Utah
22
OutlineOutline
1. Background and Motivation
2. Statistical Challenges
3. The Early Detection Process
4. Applications
Breast Cancer : Screening with mammography
Do women under 50 benefit? --Controversial
Public Health Programs– U.S., U.K. and Nordic countries have different recommendations ----
tradeoffs?
Prostate Cancer : Probability of Over Diagnosis
33
Background and RationaleBackground and Rationale• Screening ProgramsScreening Programs : : Special exams Special exams
to diagnose disease when it is to diagnose disease when it is asymptomatic.asymptomatic.
• MotivationMotivation : : Diagnosing and treating Diagnosing and treating
the disease early, before the disease early, before signs/symptoms appear, may result in signs/symptoms appear, may result in more cures and lower mortality.more cures and lower mortality.
44
Examples of Screening ProgramsExamples of Screening Programs
TuberculosisTuberculosis •• HypertensionHypertension DiabetesDiabetes •• Coronary Artery DiseaseCoronary Artery Disease CancerCancer •• Thyroid Disease Thyroid Disease
Breast CancerBreast Cancer •• Osteoporosis Osteoporosis Cervical CancerCervical Cancer •• HIV HIV Colorectal Cancer Colorectal Cancer Lung CancerLung Cancer Prostate CancerProstate Cancer
55
Scientific Evidence of Screening BenefitScientific Evidence of Screening Benefit
• Diagnosing disease early does not necessarily result in benefit; Diagnosing disease early does not necessarily result in benefit; e.g. diagnosing a primary cancer earlier may not be of benefit e.g. diagnosing a primary cancer earlier may not be of benefit if the disease has already metastasized. if the disease has already metastasized.
• A necessary condition for benefit by early detection requires A necessary condition for benefit by early detection requires that the disease tends to be diagnosed in an earlier stage that the disease tends to be diagnosed in an earlier stage
• If an effective treatment does not exist, there is no benefit in If an effective treatment does not exist, there is no benefit in diagnosing disease early.diagnosing disease early.
• The general consensus is that randomized clinical trials are The general consensus is that randomized clinical trials are the only way to evaluate screening programs for potential the only way to evaluate screening programs for potential benefit.benefit.
66
Some Statistical ChallengesSome Statistical Challenges•
Planning early detection clinical trialsPlanning early detection clinical trials
Early detection clinical trials are different from Early detection clinical trials are different from therapeutic trials. Power depends on number of exams and therapeutic trials. Power depends on number of exams and time between exams. There exists an optimum time for time between exams. There exists an optimum time for follow up and analysisfollow up and analysis..
• Public Health Programs : RecommendationsPublic Health Programs : Recommendations
Initial age to begin screening, intervals between Initial age to begin screening, intervals between exams, high risk individuals. Recommendations should be exams, high risk individuals. Recommendations should be made by risk status. --- Costs may be an important made by risk status. --- Costs may be an important consideration.consideration.
• Over diagnosisOver diagnosis
Disease may be diagnosed early, but may never Disease may be diagnosed early, but may never evolve clinically in a person’s lifetime. Important to evolve clinically in a person’s lifetime. Important to estimate probability of over diagnosis? estimate probability of over diagnosis?
77
Early Detection Randomized Early Detection Randomized Clinical TrialsClinical Trials
• Typical trial consists of two groups . One group (control) Typical trial consists of two groups . One group (control) receives usual care; the other group (study group) receives receives usual care; the other group (study group) receives invitation to have a finite number of special examinations. invitation to have a finite number of special examinations.
• Follow up for disease occurrence and death continues Follow up for disease occurrence and death continues after the last exam. after the last exam.
• Endpoint is death from disease.Endpoint is death from disease.
• Randomization may be carried out on an individual basis Randomization may be carried out on an individual basis or by cluster randomization ;or by cluster randomization ;e. g. geographical region, physician practice.e. g. geographical region, physician practice.
88
Early Detection vs. Therapeutic TrialsEarly Detection vs. Therapeutic Trials
•
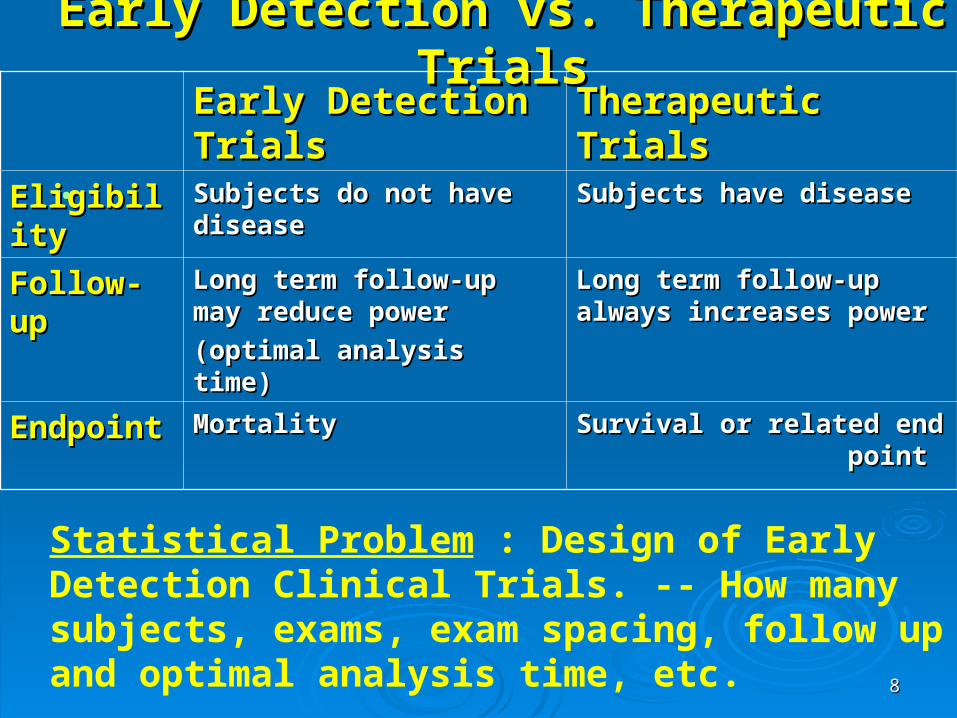
Early Detection Early Detection TrialsTrials
Therapeutic TrialsTherapeutic Trials
Eligibility Eligibility Subjects do not have Subjects do not have diseasedisease
Subjects have diseaseSubjects have disease
Follow-upFollow-up Long term follow-up may Long term follow-up may reduce powerreduce power
(optimal analysis time)(optimal analysis time)
Long term follow-up always Long term follow-up always increases powerincreases power
EndpointEndpoint MortalityMortality Survival or related end Survival or related end point point
Statistical Problem : Design of Early Detection Clinical Trials. -- How many subjects, exams, exam spacing, follow up and optimal analysis time, etc.
99
Early Detection Clinical TrialsEarly Detection Clinical Trials• Only subjects who are diagnosed with disease carry information Only subjects who are diagnosed with disease carry information
about benefit. about benefit.
• Trials need very large number of subjectsTrials need very large number of subjects
• Relatively low incidence is characteristic of many chronic diseases; e.g. Relatively low incidence is characteristic of many chronic diseases; e.g. female breast cancer incidence is about 80-100 per 100,000 women per female breast cancer incidence is about 80-100 per 100,000 women per year depending on age. year depending on age.
• Typical trial will require 10-20 years. During this time the technology for Typical trial will require 10-20 years. During this time the technology for diagnosing disease may have changed. diagnosing disease may have changed.
• Conclusions may be of limited interest.Conclusions may be of limited interest.
• Statistical challengeStatistical challenge: Is it possible to carry out an early analysis, with : Is it possible to carry out an early analysis, with limited follow up time?limited follow up time?
1010
Public Health ProgramsPublic Health Programs
• Screening ProgramScreening Program : Schedule of exams usually composed of : (1) : Schedule of exams usually composed of : (1) age to begin screening exams, (2) Intervals between exams and (3) age to begin screening exams, (2) Intervals between exams and (3) possibly the age to end exams.possibly the age to end exams.
• Positive screening examPositive screening exam would motivate a more definitive exam would motivate a more definitive exam (e.g. biopsy). (e.g. biopsy).
• CostsCosts of a public health screening program may be very large. of a public health screening program may be very large.
• Statistical challenge Statistical challenge : How does one optimize public health : How does one optimize public health screening programs? There are too many variables to carry out screening programs? There are too many variables to carry out clinical trials to find optimal schedules. clinical trials to find optimal schedules.
1111
Example : Breast Cancer Example : Breast Cancer Screening Using MammographyScreening Using Mammography
• The The American Cancer SocietyAmerican Cancer Society recommends that annual screening recommends that annual screening begin at age 40 for women at average risk. Costs of a screening begin at age 40 for women at average risk. Costs of a screening mammogram range from $100-150. (70 M women over the age of 40 in mammogram range from $100-150. (70 M women over the age of 40 in U.S.) Cost would be in billions of dollars if a significant number of U.S.) Cost would be in billions of dollars if a significant number of women complied. women complied.
• United KingdomUnited Kingdom : The National Health Service offers screening : The National Health Service offers screening beginning at age 50 with three year intervals for subsequent exams.beginning at age 50 with three year intervals for subsequent exams.
• Nordic countriesNordic countries : The recommendation is that screening begin at age : The recommendation is that screening begin at age
50 with two year intervals for subsequent exams.50 with two year intervals for subsequent exams. • Statistical challenge : How to choose appropriate public health Statistical challenge : How to choose appropriate public health
programs based on risk. programs based on risk.
1212
Over DiagnosisOver Diagnosis
• It is possible for some diseases to be diagnosed It is possible for some diseases to be diagnosed early which would never have clinical symptoms early which would never have clinical symptoms in a person’s lifetime.in a person’s lifetime.
• Ordinarily the disease is treated when diagnosed; Ordinarily the disease is treated when diagnosed; it is not known whether the disease may exhibit it is not known whether the disease may exhibit clinical symptoms during a person’s lifetime.clinical symptoms during a person’s lifetime.
• Statistical challengeStatistical challenge: : Estimate the Estimate the probability of over diagnosis. probability of over diagnosis.
1313
Need for ModelsNeed for Models
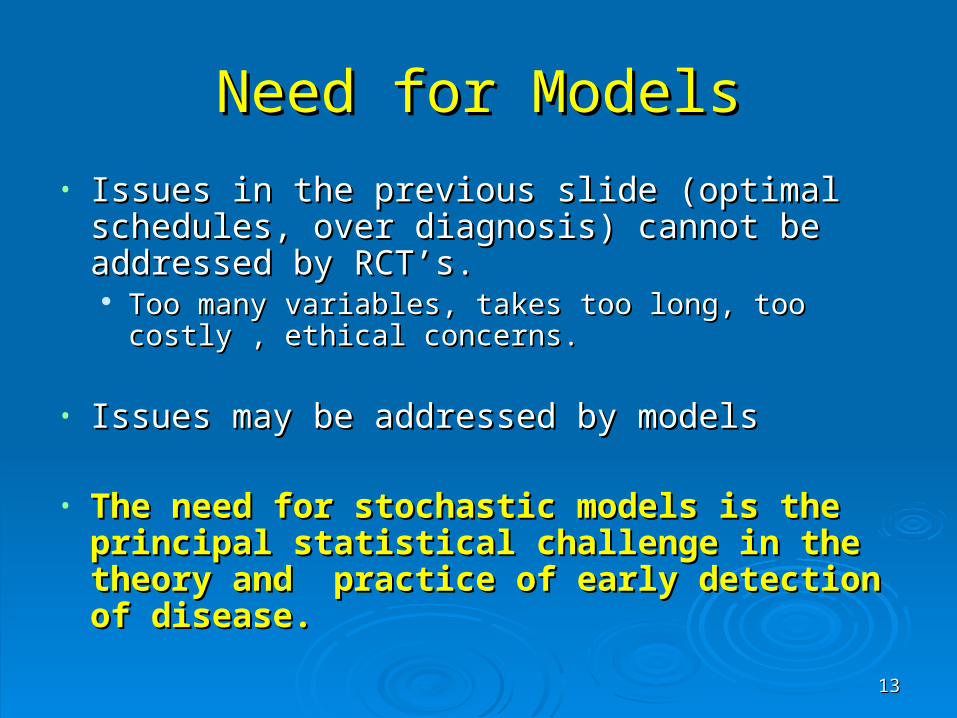
• Issues in the previous slide (optimal schedules, Issues in the previous slide (optimal schedules, over diagnosis) cannot be addressed by RCT’s. over diagnosis) cannot be addressed by RCT’s. Too many variables, takes too long, too costly , Too many variables, takes too long, too costly ,
ethical concerns.ethical concerns.
• Issues may be addressed by models Issues may be addressed by models
• The need for stochastic models is the principal The need for stochastic models is the principal statistical challenge in the theory and practice of statistical challenge in the theory and practice of early detection ofearly detection of disease. disease.
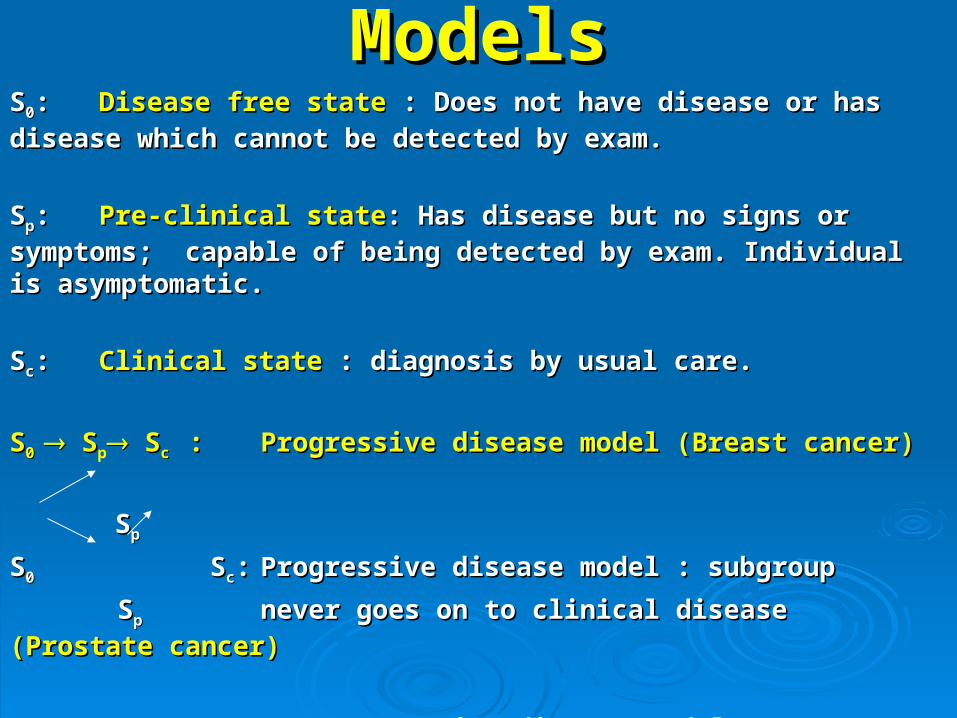
ModelsModelsSS00:: Disease free stateDisease free state : Does not have disease or has disease which : Does not have disease or has disease which
cannot be detected by exam.cannot be detected by exam.
SSpp:: Pre-clinical statePre-clinical state: Has disease but no signs or symptoms; : Has disease but no signs or symptoms;
capable of being detected by exam. Individual is asymptomatic. capable of being detected by exam. Individual is asymptomatic.
SScc:: Clinical stateClinical state : diagnosis by usual care. : diagnosis by usual care.
SS0 0 S Sp S Sc c :: Progressive disease model (Breast cancer)Progressive disease model (Breast cancer)
SSpp
SS00 SScc:: Progressive disease model : subgroupProgressive disease model : subgroup
SSpp never goes on to clinical disease never goes on to clinical disease (Prostate cancer)(Prostate cancer)
SS0 0 S Sp p S Sc c :: Non-progressive diseaseNon-progressive disease model (model (HPV ,Cervical HPV ,Cervical
cancer)cancer)
1515
Issues in the interpretation of Issues in the interpretation of datadata
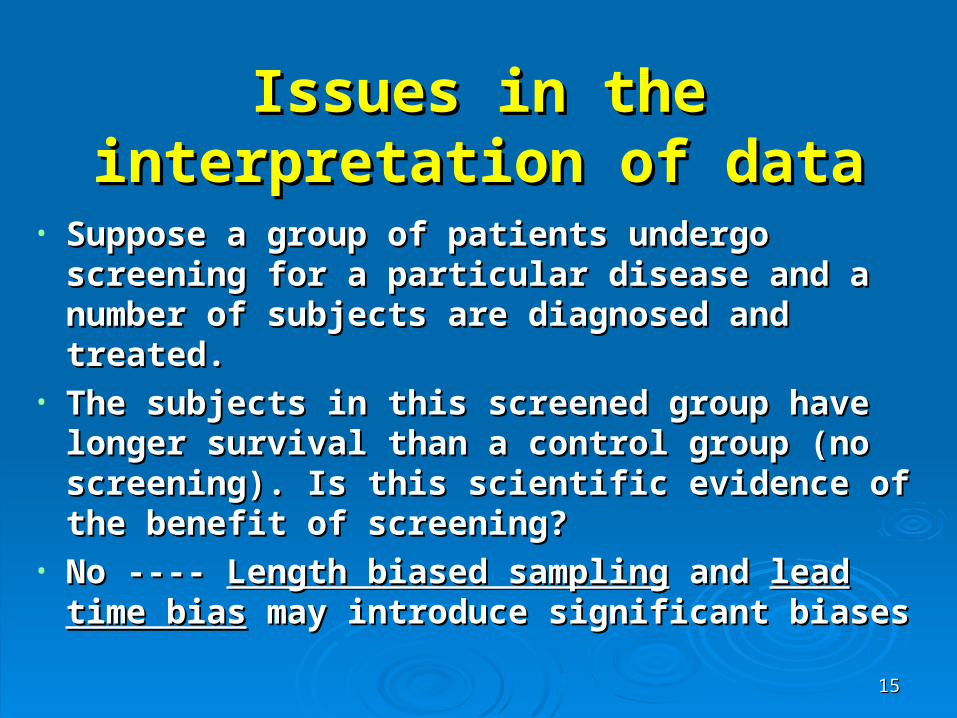
• Suppose a group of patients undergo screening Suppose a group of patients undergo screening for a particular disease and a number of subjects for a particular disease and a number of subjects are diagnosed and treated.are diagnosed and treated.
• The subjects in this screened group have longer The subjects in this screened group have longer survival than a control group (no screening). Is survival than a control group (no screening). Is this scientific evidence of the benefit of this scientific evidence of the benefit of screening?screening?
• No ---- No ---- Length biased samplingLength biased sampling and and lead time lead time biasbias may introduce significant biases may introduce significant biases
1616
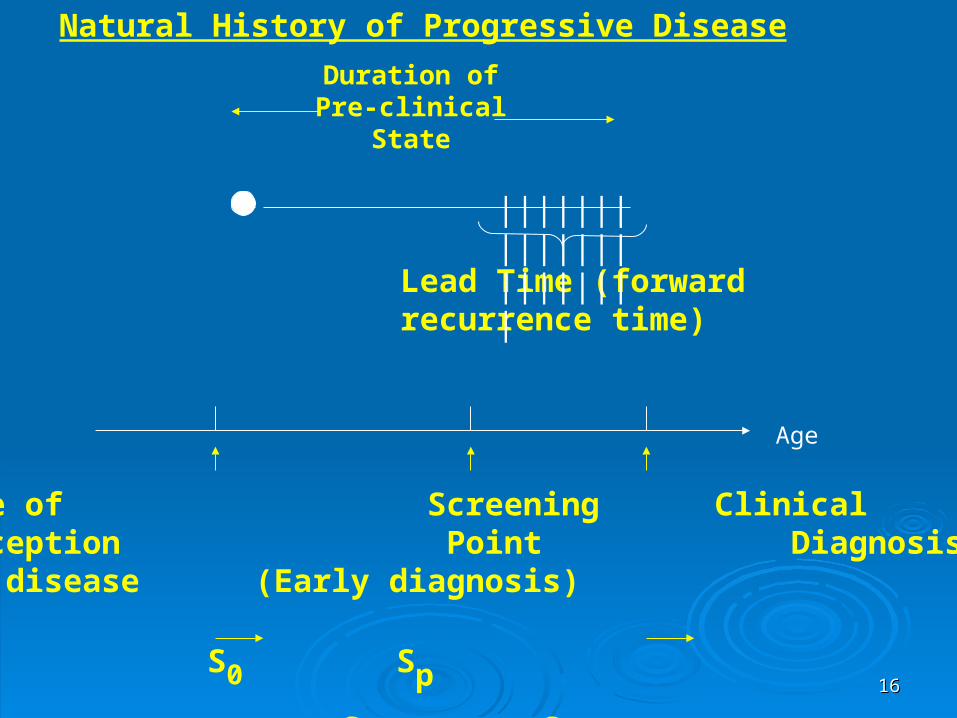
Duration ofPre-clinical
State
Lead Time (forward recurrence time)
Age of Screening ClinicalInception Point DiagnosisOf disease (Early diagnosis)
||||||||||||||||||||||
S0 Sp Sp Sc
Natural History of Progressive Disease
Age
1717
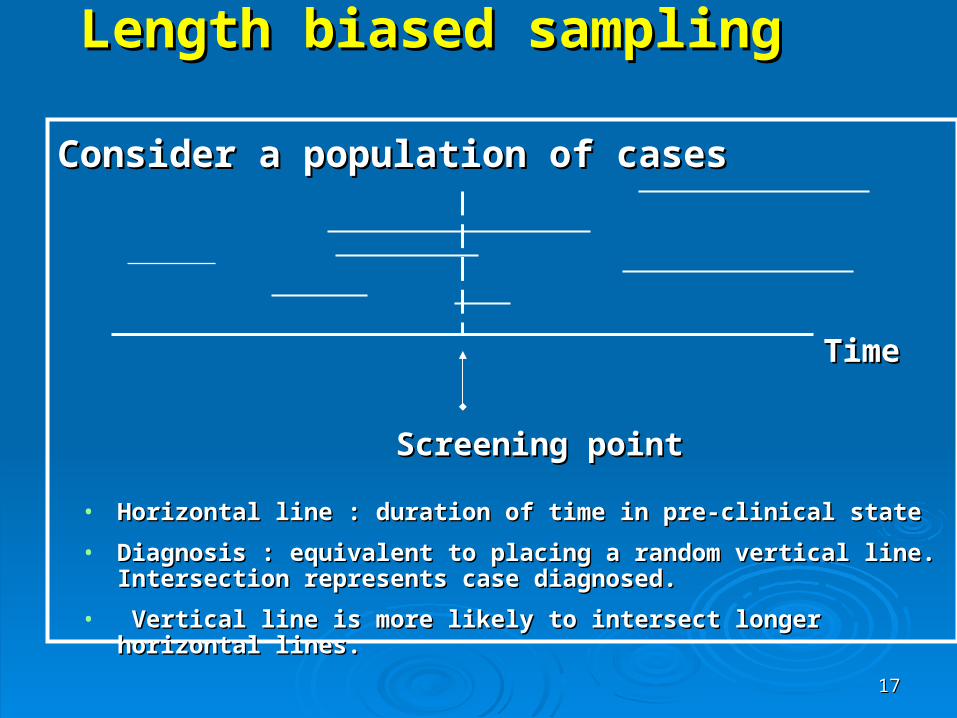
Length biased samplingLength biased sampling
Consider a population of casesConsider a population of cases
TimeTime
Screening point Screening point
• Horizontal line : duration of time in pre-clinical stateHorizontal line : duration of time in pre-clinical state
• Diagnosis : equivalent to placing a random vertical line. Intersection Diagnosis : equivalent to placing a random vertical line. Intersection represents case diagnosed.represents case diagnosed.
• Vertical line is more likely to intersect longer horizontal lines. Vertical line is more likely to intersect longer horizontal lines.
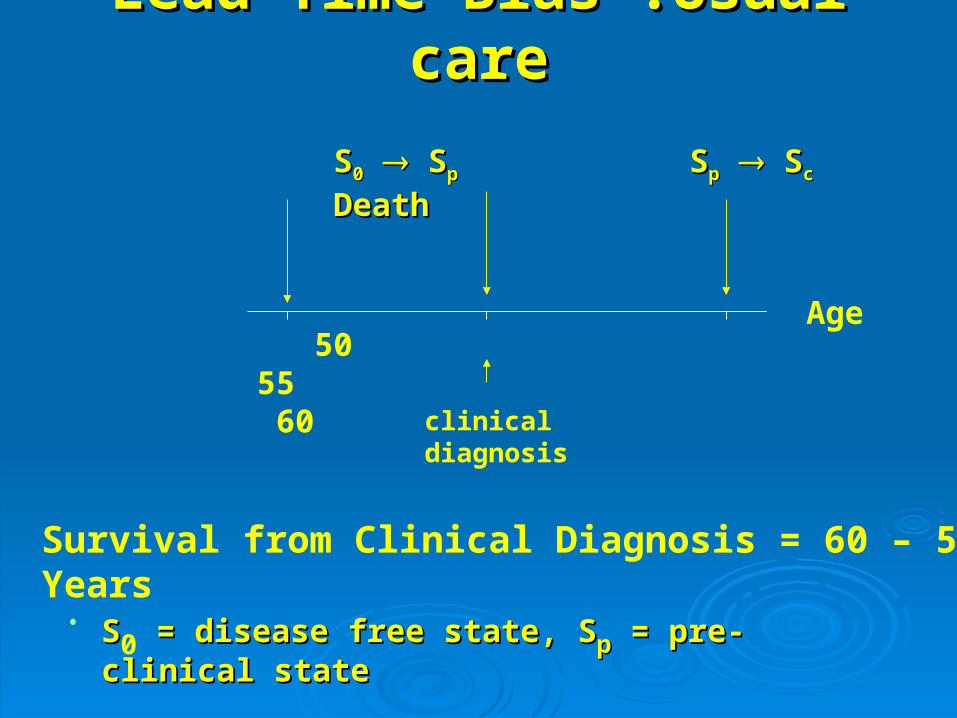
Lead Time Bias :Usual careLead Time Bias :Usual care
SS00 S Spp SSpp S Scc
DeathDeath
Age
50 55 60
Survival from Clinical Diagnosis = 60 – 55 = 5 Years
clinical diagnosis
• SS0 = disease free state, S = disease free state, Spp = pre-clinical state = pre-clinical state
• SSc = clinical state = clinical state
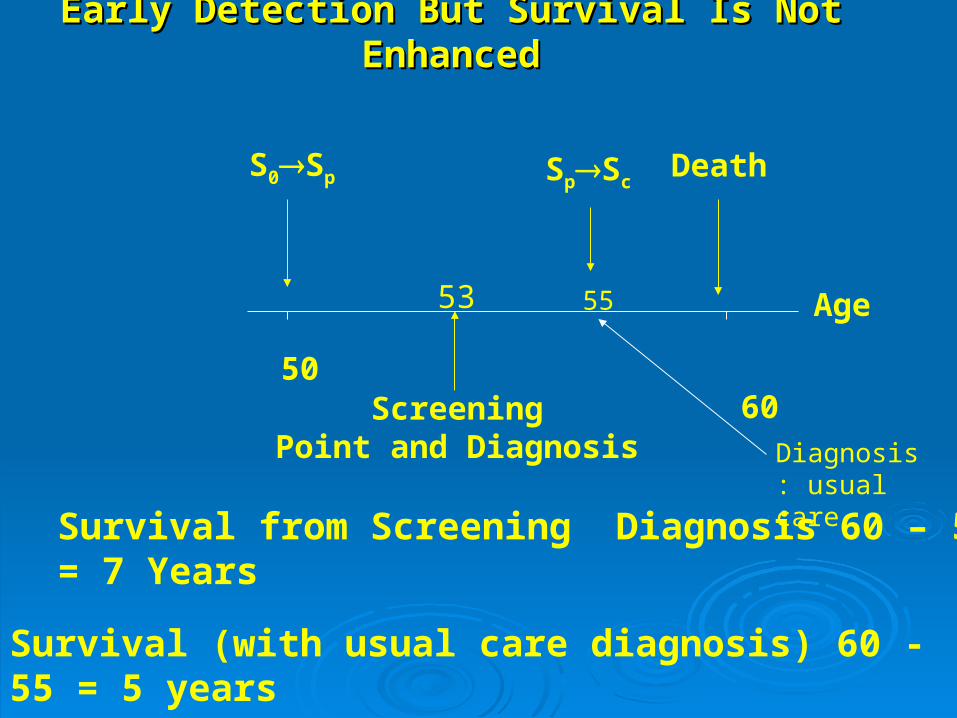
Early Detection But Survival Is Not EnhancedEarly Detection But Survival Is Not Enhanced
Age
50 60
Survival from Screening Diagnosis 60 – 53 = 7 Years
53
ScreeningPoint and Diagnosis
S0Sp SpScDeath
Survival (with usual care diagnosis) 60 - 55 = 5 years
Diagnosis: usual care
55
2020
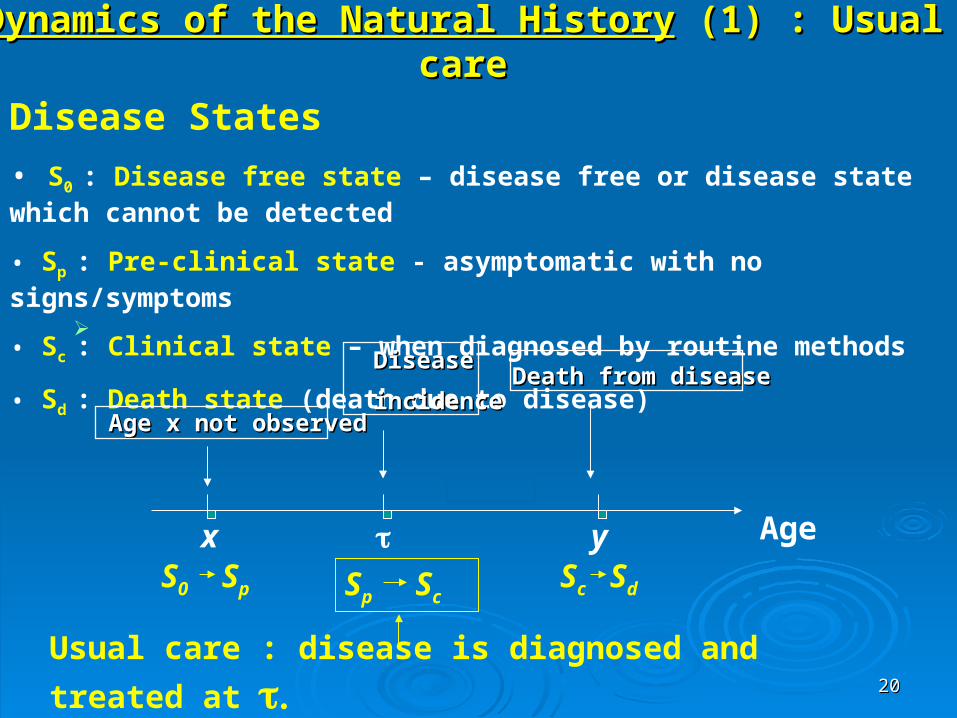
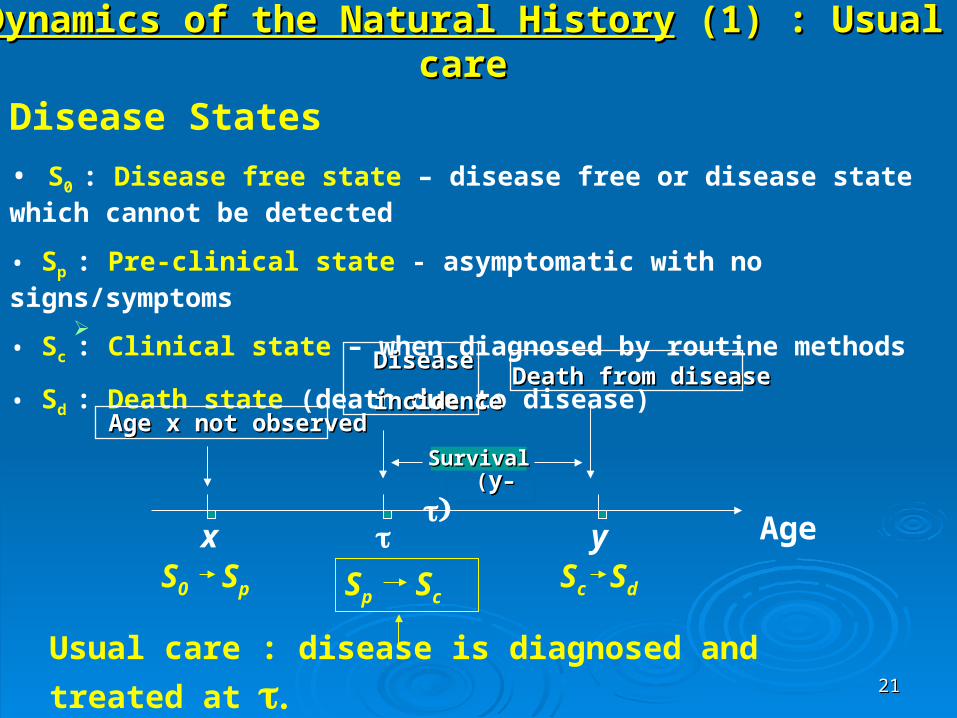
Dynamics of the Natural HistoryDynamics of the Natural History (1) : Usual care (1) : Usual care
Agex yS0 Sp Sp Sc
Sc Sd
Disease States
• S0 : Disease free state – disease free or disease state which cannot be detected
• Sp : Pre-clinical state - asymptomatic with no signs/symptoms
• Sc : Clinical state – when diagnosed by routine methods
• Sd : Death state (death due to disease)
Usual care : disease is diagnosed and treated at
Age x not observedAge x not observed
DiseaseDisease
incidence incidence Death from diseaseDeath from disease
2121
Dynamics of the Natural HistoryDynamics of the Natural History (1) : Usual care (1) : Usual care
Agex yS0 Sp Sp Sc
Sc Sd
Disease States
• S0 : Disease free state – disease free or disease state which cannot be detected
• Sp : Pre-clinical state - asymptomatic with no signs/symptoms
• Sc : Clinical state – when diagnosed by routine methods
• Sd : Death state (death due to disease)
Usual care : disease is diagnosed and treated at
Age x not observedAge x not observed
DiseaseDisease
incidence incidence Death from diseaseDeath from disease
SurvivalSurvival
((yy– –
2222
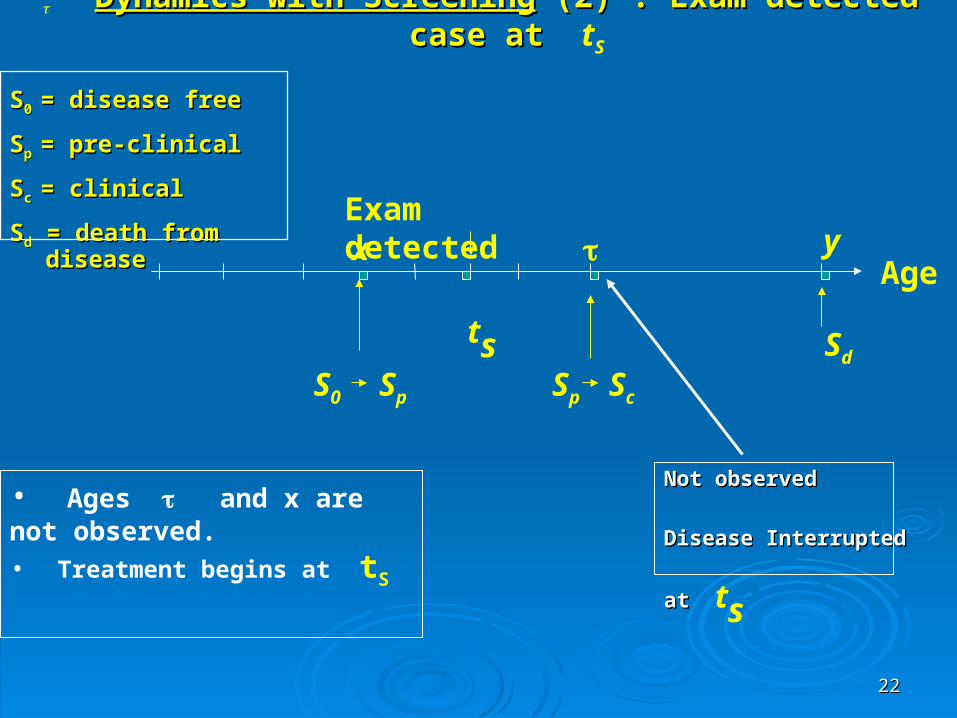
Dynamics with ScreeningDynamics with Screening (2) : Exam detected case at (2) : Exam detected case at tS
ts
Sd
S0 Sp Sp Sc
• Ages and x are not observed.
• Treatment begins at tS
x yExam detected
Age
SS0 0 = disease free= disease free
SSp p = pre-clinical= pre-clinical
SSc c = clinical = clinical
SSdd = death from disease = death from disease
Not observed Not observed
Disease Interrupted at Disease Interrupted at
ts
2323
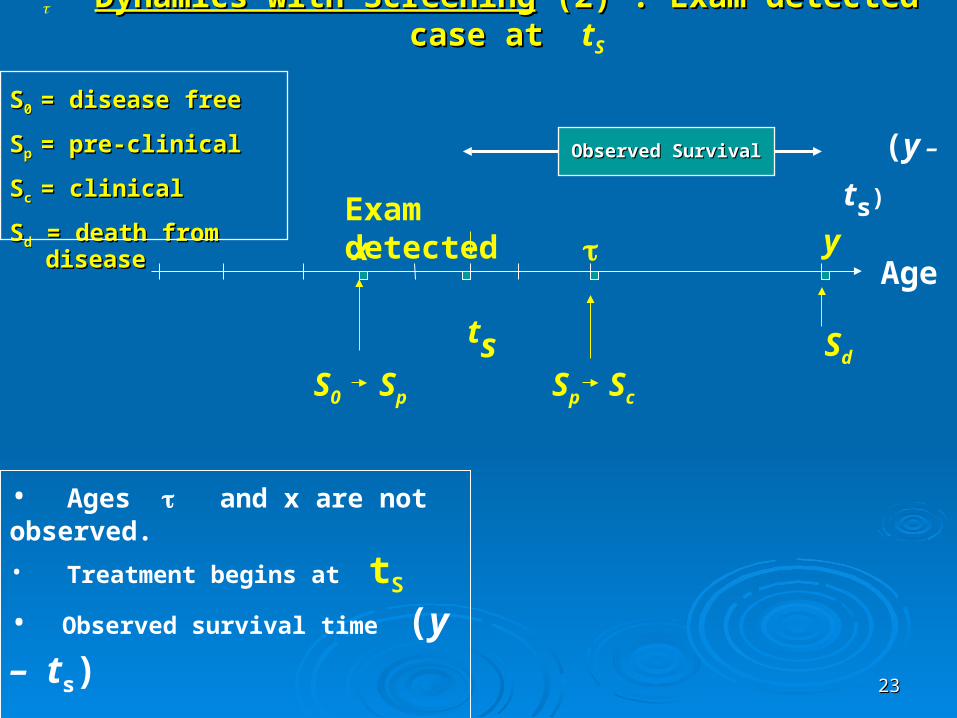
Dynamics with ScreeningDynamics with Screening (2) : Exam detected case at (2) : Exam detected case at tS
ts
Sd
S0 Sp Sp Sc
• Ages and x are not observed.
• Treatment begins at tS
• Observed survival time (y – ts)
x yExam detected
Age
(y – ts)
Observed SurvivalObserved Survival
SS0 0 = disease free= disease free
SSp p = pre-clinical= pre-clinical
SSc c = clinical = clinical
SSdd = death from disease = death from disease
2424
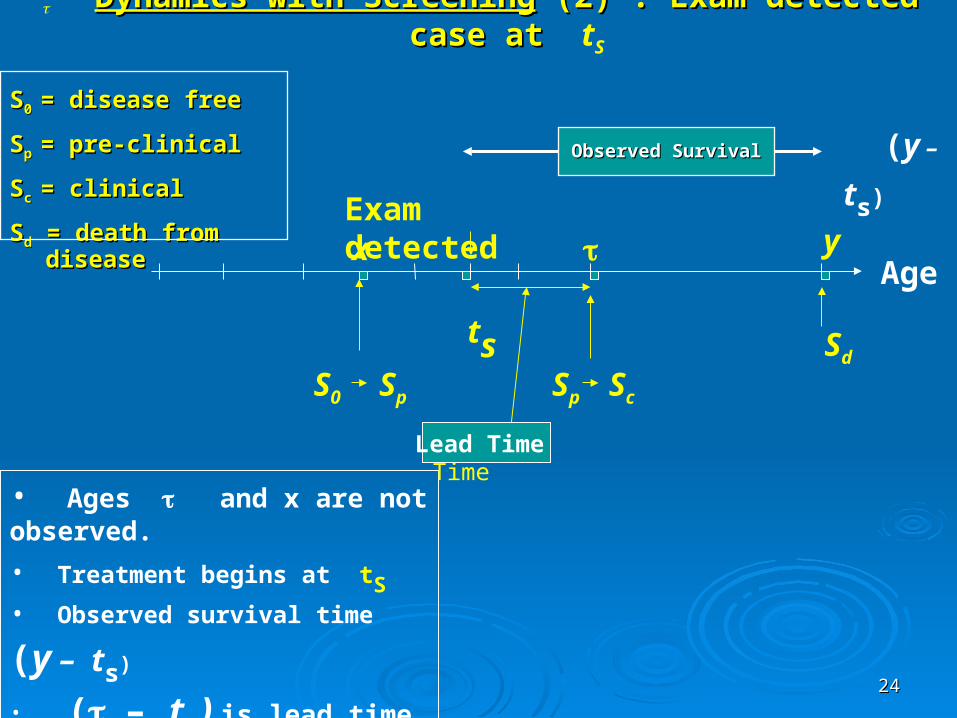
Dynamics with ScreeningDynamics with Screening (2) : Exam detected case at (2) : Exam detected case at tS
ts
Sd
S0 Sp Sp Sc
• Ages and x are not observed.
• Treatment begins at tS
• Observed survival time (y – ts)
• (– ts ) is lead time.
x yExam detected
Age
Lead TimeLead Time
(y – ts)
Observed SurvivalObserved Survival
SS0 0 = disease free= disease free
SSp p = pre-clinical= pre-clinical
SSc c = clinical = clinical
SSdd = death from disease = death from disease
2525
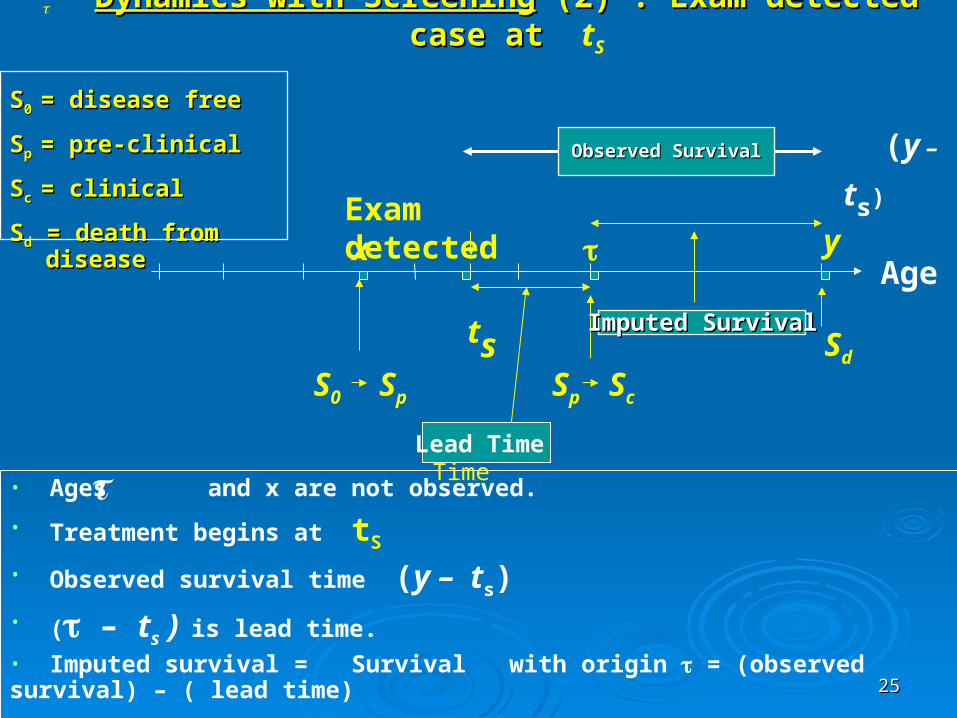
Dynamics with ScreeningDynamics with Screening (2) : Exam detected case at (2) : Exam detected case at tS
ts
Sd
S0 Sp Sp Sc
• Ages and x are not observed.
• Treatment begins at tS
• Observed survival time (y – ts)• ( – ts ) is lead time. • Imputed survival = Survival with origin = (observed survival) – ( lead time)
x yExam detected
Age
Lead TimeLead Time
(y – ts)
Imputed SurvivalImputed Survival
Observed SurvivalObserved Survival
SS0 0 = disease free= disease free
SSp p = pre-clinical= pre-clinical
SSc c = clinical = clinical
SSdd = death from disease = death from disease
2626
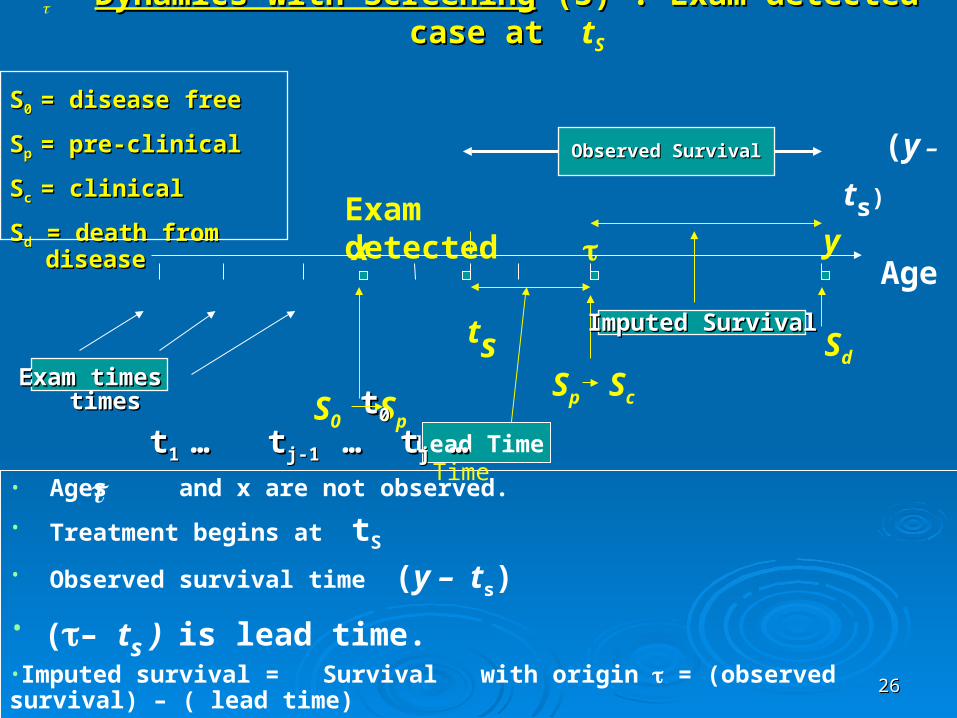
Dynamics with ScreeningDynamics with Screening (3) : Exam detected case at (3) : Exam detected case at tS
ts
Sd
S0 Sp
Sp Sc
• Ages and x are not observed.
• Treatment begins at tS
• Observed survival time (y – ts)
• (– ts ) is lead time.•Imputed survival = Survival with origin = (observed survival) – ( lead time)• There may be a number (unknown) of false negative exams
x yExam detected
Age
Lead TimeLead Time
(y – ts)
Imputed SurvivalImputed Survival
Observed SurvivalObserved Survival
SS0 0 = disease free= disease free
SSp p = pre-clinical= pre-clinical
SSc c = clinical = clinical
SSdd = death from disease = death from disease
tt00 t t1 1 … t… tj-1 j-1 … t… tjj … …
Exam timesExam times Exam timesExam times
2727
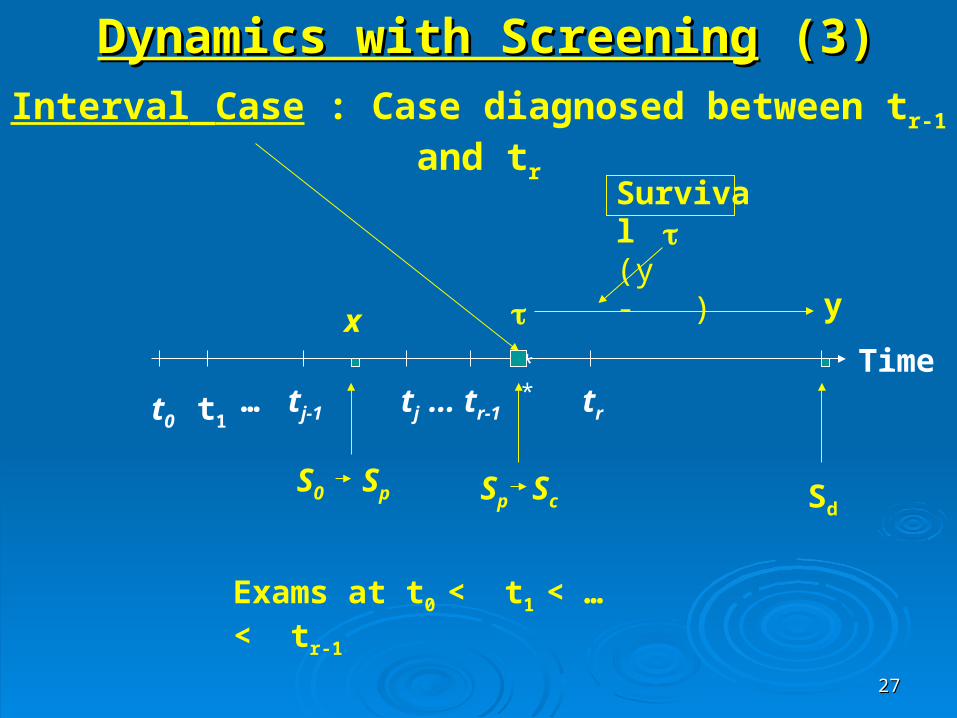
Dynamics with ScreeningDynamics with Screening (3)(3)
t0 t1tj-1 tj … tr-1
tr…
Survival(y - )
S0 Sp Sp Sc
x
Interval Case : Case diagnosed between tr-1 and tr
y
Sd
Time
Exams at t0 < t1 < … < tr-1
**
2828
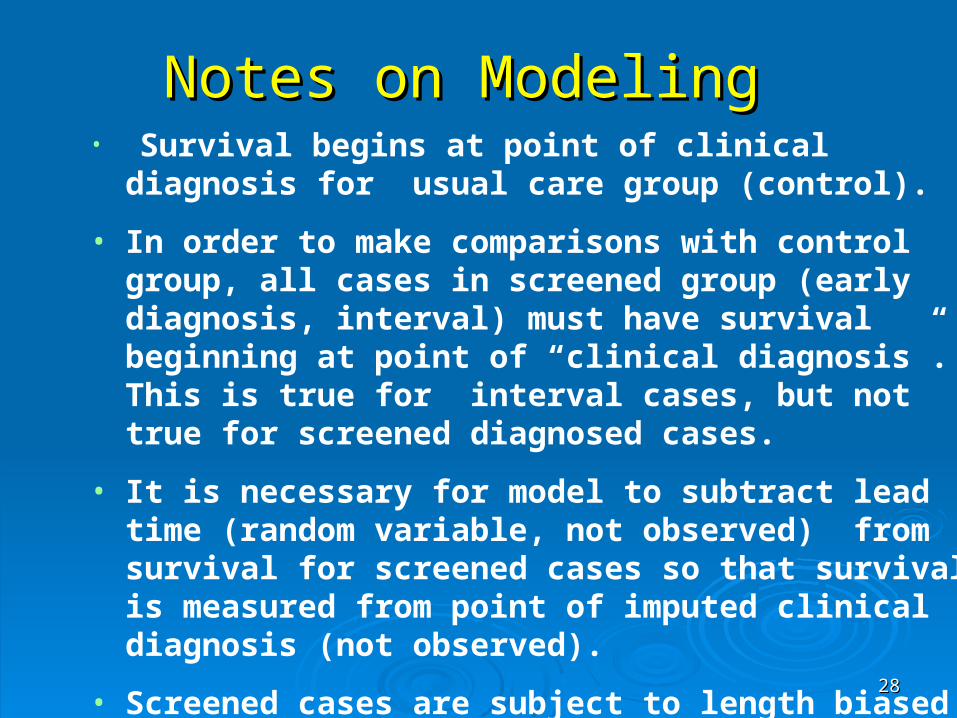
Notes on Modeling Notes on Modeling • Survival begins at point of clinical diagnosis for usual
care group (control).
• In order to make comparisons with control group, all cases in screened group (early diagnosis, interval) must have survival beginning at point of “clinical diagnosis”. This is true for interval cases, but not true for screened diagnosed cases.
• It is necessary for model to subtract lead time (random variable, not observed) from survival for screened cases so that survival is measured from point of imputed clinical diagnosis (not observed).
• Screened cases are subject to length biased sampling. This feature must be incorporated in the model.
2929
Applications to Breast and Prostate Applications to Breast and Prostate CancerCancer
Breast Cancer Screening (Mammography)Breast Cancer Screening (Mammography)• Benefit for women in their 40’s?Benefit for women in their 40’s?• Public Health ProgramsPublic Health Programs Choosing screening intervals according to risk.Choosing screening intervals according to risk.
Comparison of U.S., U.K. and Nordic countriesComparison of U.S., U.K. and Nordic countries
Prostate CancerProstate Cancer• Over diagnosis Over diagnosis
3030
Data Inputs for Breast Cancer ApplicationsData Inputs for Breast Cancer Applications : : ( ( From Clinical TrialsFrom Clinical Trials))
• Mean sojourn time in pre-clinical state varies by age:
♦ age 40: ~ 2 years
♦ age 50 and above: ~ 4 years
• Sensitivity varies by age:
♦ age 40: sensitivity ~ 0.7
♦ age 50 and above: sensitivity ~ 0.9
3131
Screening Younger Women [40, 49] for Screening Younger Women [40, 49] for Breast Cancer Using MammographyBreast Cancer Using Mammography
• Dispute whether women in their 40’s benefit from Dispute whether women in their 40’s benefit from screening. (clinical trials inadequate in this age group)screening. (clinical trials inadequate in this age group)
• Screening women in age group [40, 49]Screening women in age group [40, 49] Relatively low chance of developing breast cancerRelatively low chance of developing breast cancer Mammogram sensitivity is lower for this age groupMammogram sensitivity is lower for this age group Relatively high cost Relatively high cost
• 1997 NIH Consensus Development Panel1997 NIH Consensus Development Panel Review of data from 8 clinical trialsReview of data from 8 clinical trials ““The available data did not warrant a single The available data did not warrant a single
recommendation for all women in their forties.”recommendation for all women in their forties.”• Nevertheless ACS and NCI recommend screening Nevertheless ACS and NCI recommend screening
women in their 40’s.women in their 40’s.
3232
Use of Model: Evaluating Benefit Use of Model: Evaluating Benefit for Women Aged 40-49for Women Aged 40-49
•STRATEGY. Compare the mortality of a screened group ( exams only for women in their 40’s) with a control group.
• Note that these subjects may die of disease past the age of 49. The population who were in the pre-clinical state in their 40’s is the target population who can benefit.
• Clinical trials and recent data indicate a stage shift ( relative to usual diagnosis) with early detection for this age group. Node negative (good prognosis) ~77%% (screening) vs. 53% (usual care).
3333
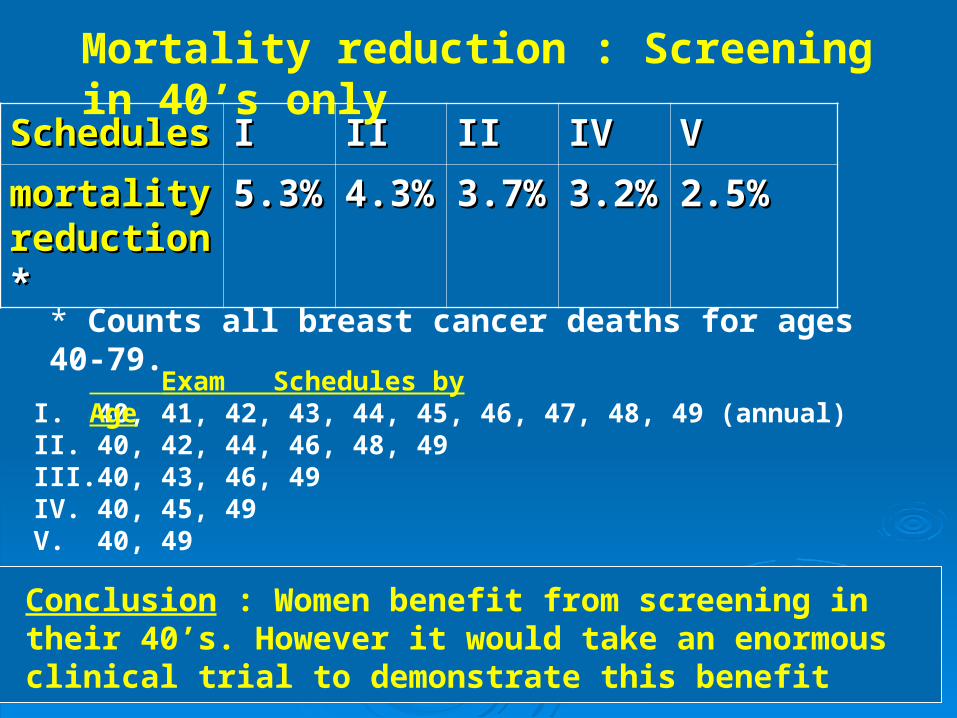
Schedules Schedules II IIII IIII IVIV VV
mortality mortality reductionreduction**
5.3%5.3% 4.3%4.3% 3.7%3.7% 3.2%3.2% 2.5%2.5%
Mortality reduction : Screening in 40’s only
I. 40, 41, 42, 43, 44, 45, 46, 47, 48, 49 (annual)II. 40, 42, 44, 46, 48, 49III. 40, 43, 46, 49IV. 40, 45, 49V. 40, 49
* Counts all breast cancer deaths for ages 40-79.
Exam Schedules by Age
Conclusion : Women benefit from screening in their 40’s. However it would take an enormous clinical trial to demonstrate this benefit
Conclusion : Women benefit from screening in their 40’s. However it would take an enormous clinical trial to demonstrate this benefit
3434
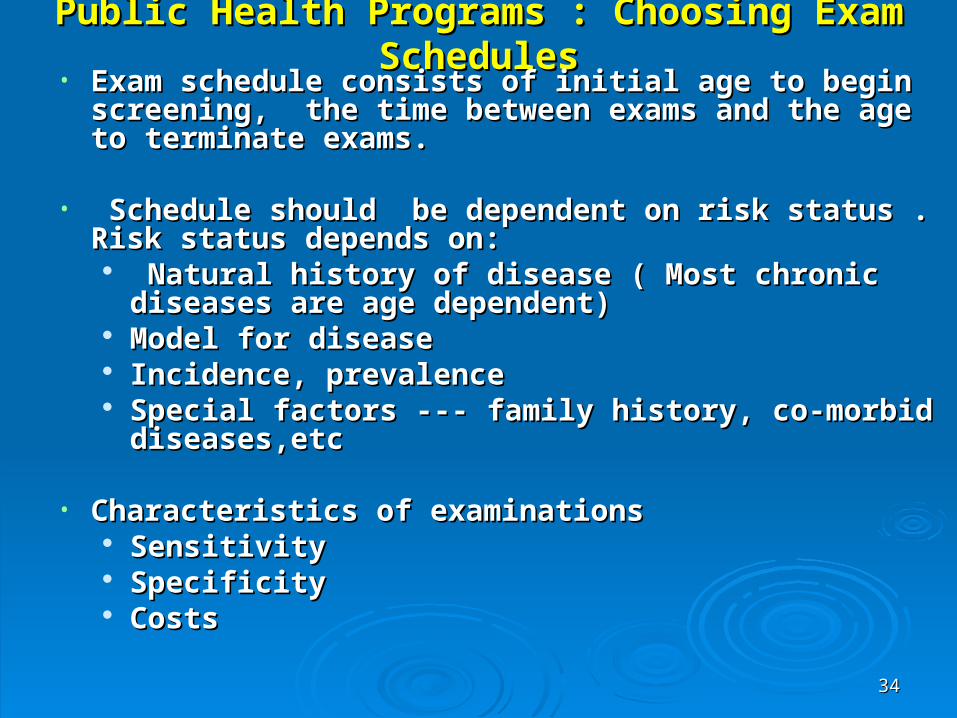
Public Health Programs : Choosing Exam SchedulesPublic Health Programs : Choosing Exam Schedules• Exam schedule consists of initial age to begin screening, Exam schedule consists of initial age to begin screening,
the time between exams and the age to terminate exams. the time between exams and the age to terminate exams.
• Schedule should be dependent on risk status . Risk Schedule should be dependent on risk status . Risk status depends on:status depends on: Natural history of disease ( Most chronic diseases are Natural history of disease ( Most chronic diseases are
age dependent) age dependent) Model for diseaseModel for disease Incidence, prevalenceIncidence, prevalence Special factors --- family history, co-morbid Special factors --- family history, co-morbid
diseases,etcdiseases,etc • Characteristics of examinationsCharacteristics of examinations
SensitivitySensitivity SpecificitySpecificity CostsCosts
3535
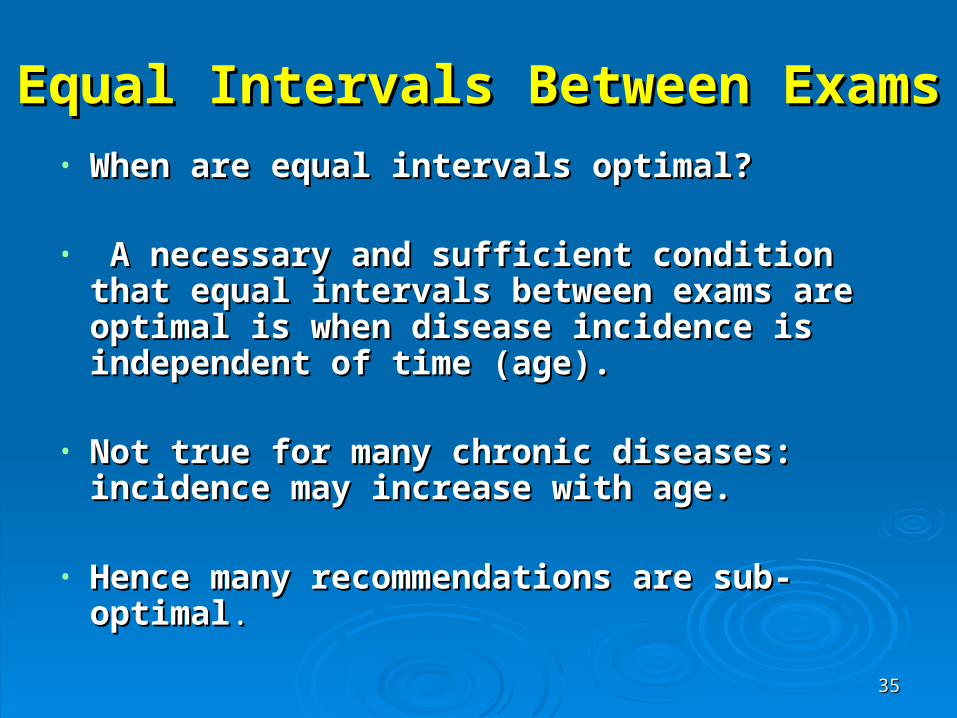
Equal Intervals Between Exams Equal Intervals Between Exams • When are equal intervals optimal?When are equal intervals optimal?
• A necessary and sufficient condition that equal A necessary and sufficient condition that equal intervals between exams are optimal is when intervals between exams are optimal is when disease incidence is independent of time (age). disease incidence is independent of time (age).
• Not true for many chronic diseases: incidence Not true for many chronic diseases: incidence may increase with age. may increase with age.
• Hence many recommendations are sub-optimalHence many recommendations are sub-optimal..
3636
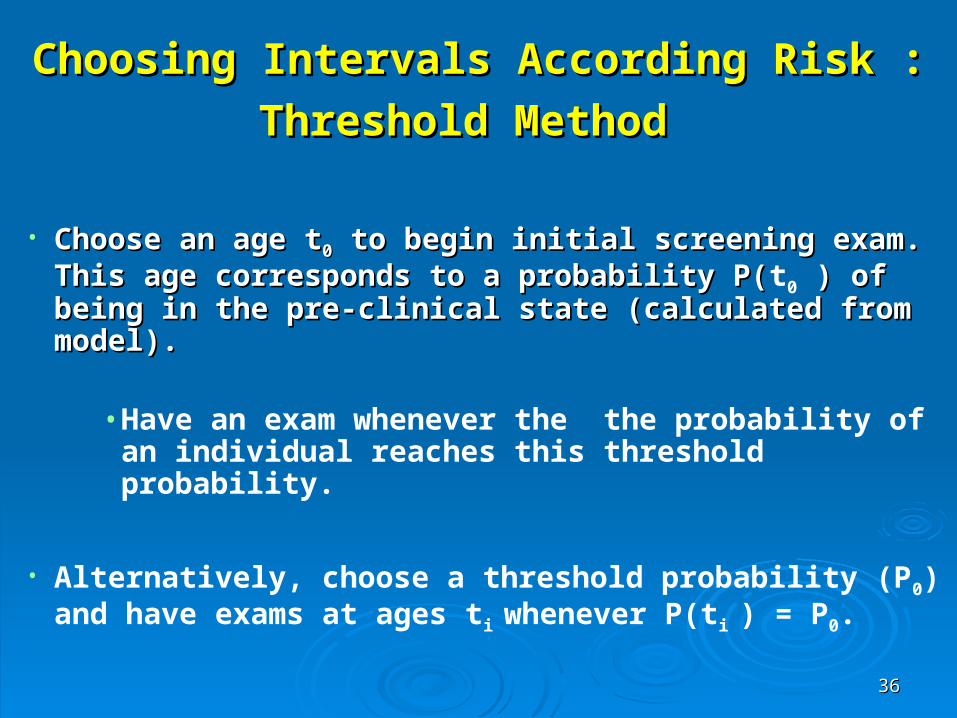
Choosing Intervals According Risk :Choosing Intervals According Risk :
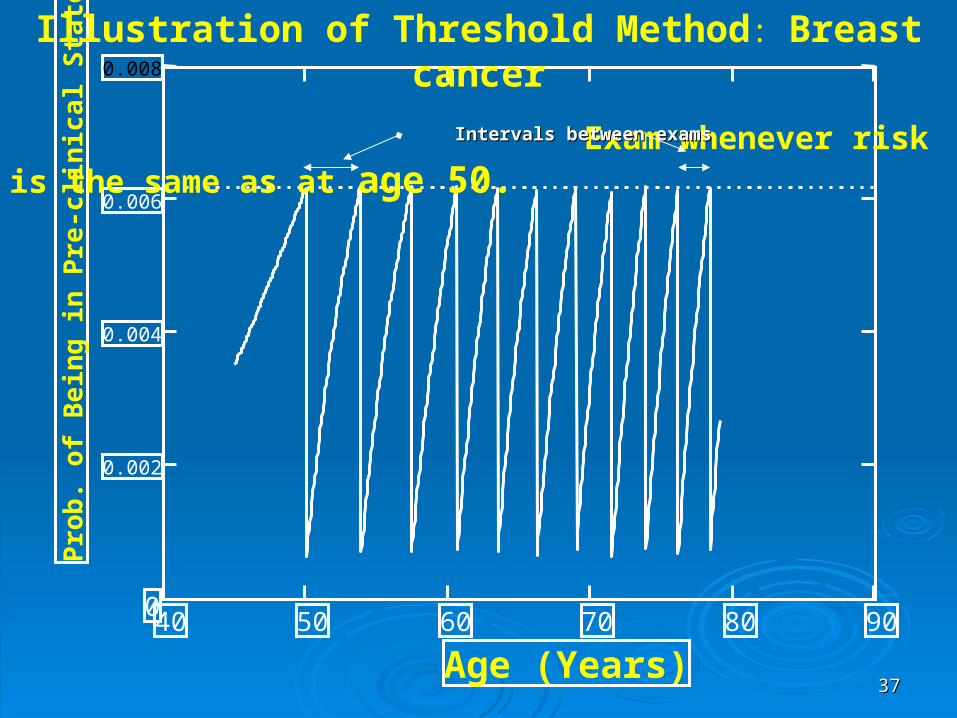
Threshold MethodThreshold Method
• Choose an age tChoose an age t00 to begin initial screening exam. to begin initial screening exam. This age corresponds to a probability P(This age corresponds to a probability P(t0 ) of being ) of being in the pre-clinical state (calculated from model).in the pre-clinical state (calculated from model).
• Have an exam whenever the the probability of
an individual reaches this threshold probability.
• Alternatively, choose a threshold probability (P0) and have exams at ages ti whenever P(ti ) = P0.
3737
40 50 60 70 80 900
0.002
0.004
0.006
0.008
Age (Years)
Pro
b. o
f B
ein
g in
Pre
-clin
ical
Sta
te
Illustration of Threshold Method: Breast cancer
Exam whenever risk is the same as at age 50. Intervals between exams Intervals between exams
3838
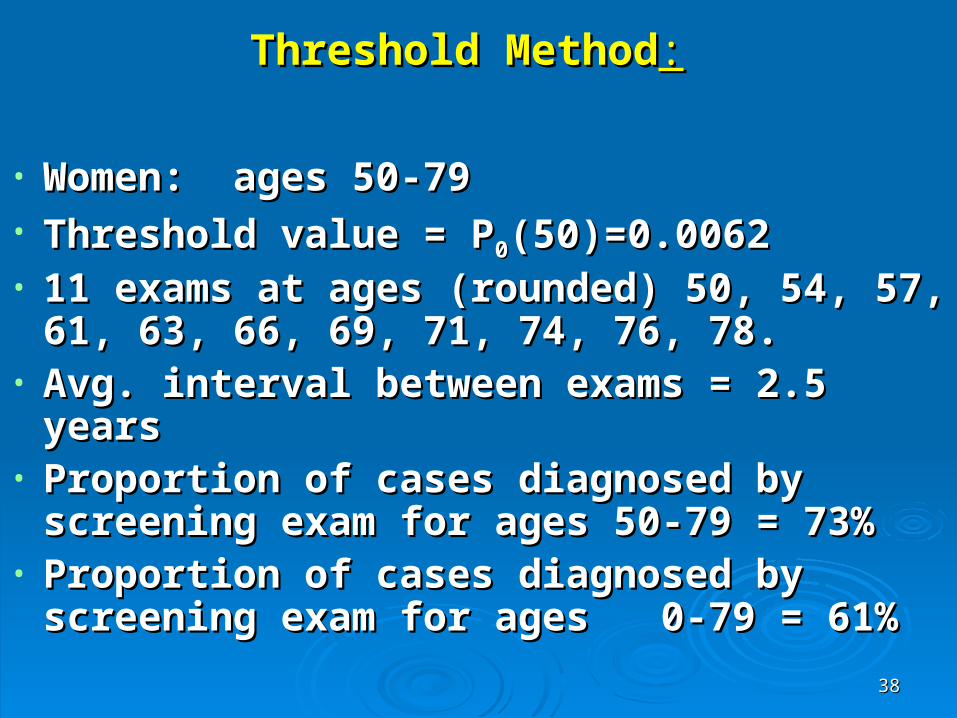
Threshold MethodThreshold Method::
• Women: ages 50-79Women: ages 50-79• Threshold value = PThreshold value = P00(50)=0.0062(50)=0.0062• 11 exams at ages (rounded) 50, 54, 57, 61, 11 exams at ages (rounded) 50, 54, 57, 61,
63, 66, 69, 71, 74, 76, 78.63, 66, 69, 71, 74, 76, 78.• Avg. interval between exams = 2.5 yearsAvg. interval between exams = 2.5 years• Proportion of cases diagnosed by screening Proportion of cases diagnosed by screening
exam for ages 50-79 = 73%exam for ages 50-79 = 73%• Proportion of cases diagnosed by screening Proportion of cases diagnosed by screening
exam for ages 0-79 = 61%exam for ages 0-79 = 61%
3939
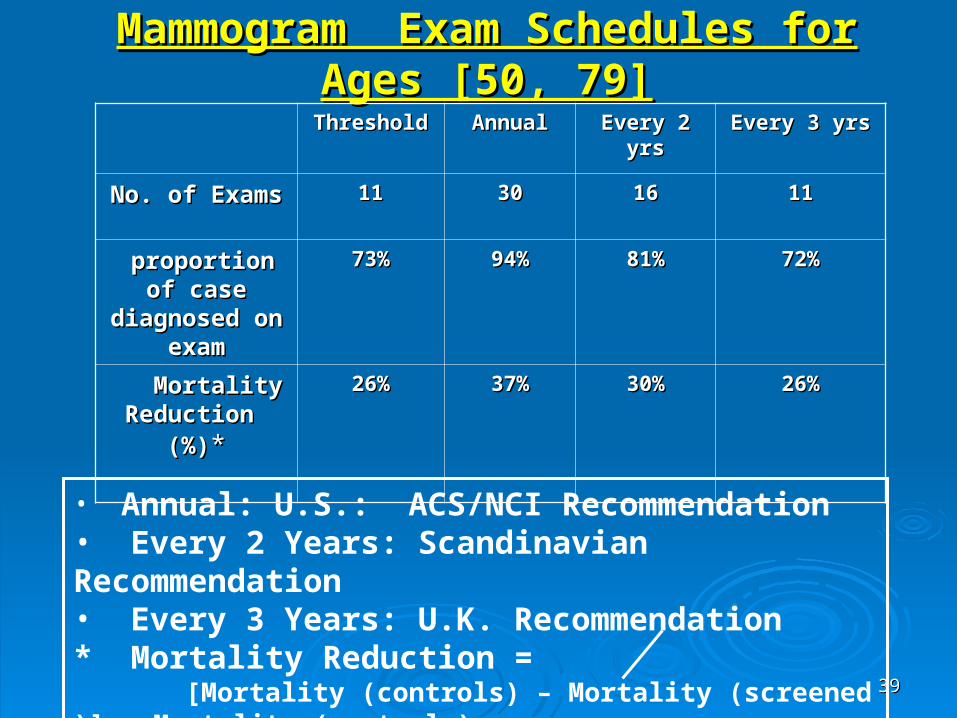
Mammogram Exam Schedules for Mammogram Exam Schedules for Ages [50, 79]Ages [50, 79]
ThresholdThreshold AnnualAnnual Every 2 yrsEvery 2 yrs Every 3 yrsEvery 3 yrs
No. of ExamsNo. of Exams 1111 3030 1616 1111
proportion of proportion of case diagnosed case diagnosed
on examon exam
73%73% 94%94% 81%81% 72%72%
Mortality Mortality Reduction (%)Reduction (%)**
26%26% 37%37% 30%30% 26%26%
• Annual: U.S.: ACS/NCI Recommendation• Every 2 Years: Scandinavian Recommendation• Every 3 Years: U.K. Recommendation* Mortality Reduction = [Mortality (controls) – Mortality (screened )] Mortality (controls)
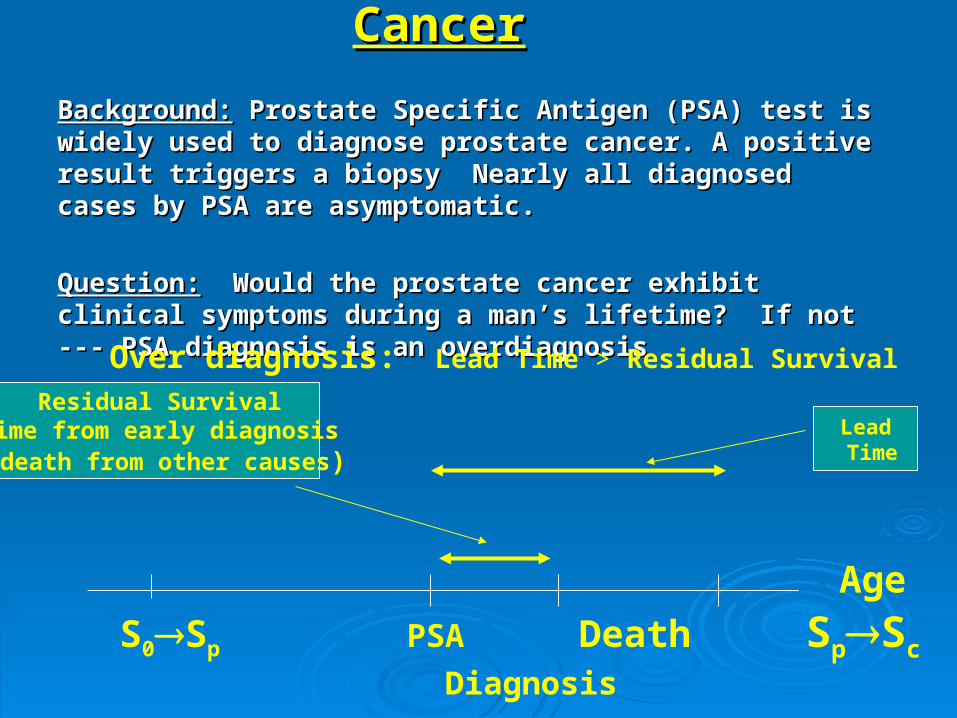
Overdiagnosis: Prostate CancerOverdiagnosis: Prostate Cancer
Background:Background: Prostate Specific Antigen (PSA) test is widely used Prostate Specific Antigen (PSA) test is widely used to diagnose prostate cancer. A positive result triggers a biopsy to diagnose prostate cancer. A positive result triggers a biopsy Nearly all diagnosed cases by PSA are asymptomatic.Nearly all diagnosed cases by PSA are asymptomatic.
Question:Question: Would the prostate cancer exhibit clinical symptoms Would the prostate cancer exhibit clinical symptoms during a man’s lifetime? If not --- PSA diagnosis is an during a man’s lifetime? If not --- PSA diagnosis is an overdiagnosisoverdiagnosis
S0Sp PSA Death SpSc
Diagnosis
Over diagnosis: Lead Time > Residual Survival
Age
Residual Survival(Time from early diagnosis to death from other causes)
Lead Time
4141
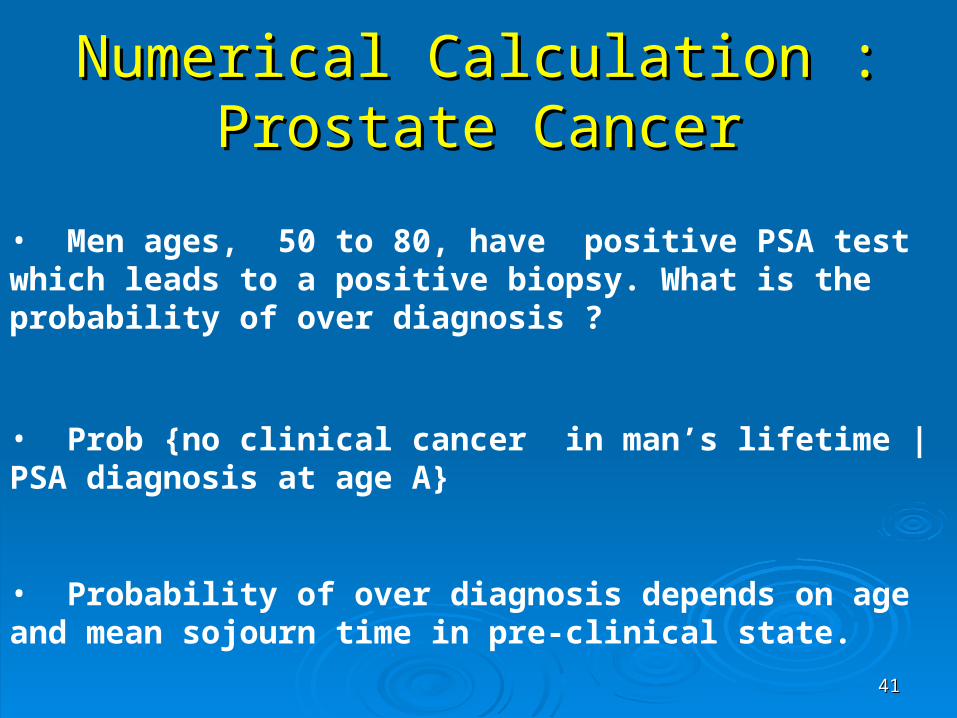
Numerical Calculation : Prostate Numerical Calculation : Prostate CancerCancer
• Men ages, 50 to 80, have positive PSA test which leads to a positive biopsy. What is the probability of over diagnosis ?
• Prob {no clinical cancer in man’s lifetime |PSA diagnosis at age A}
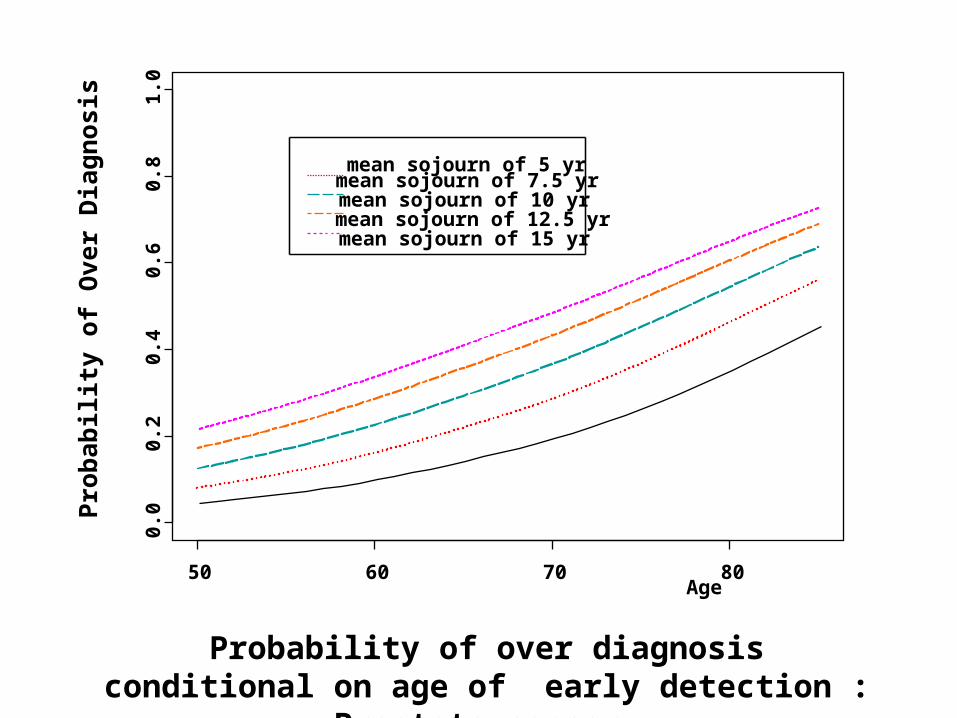
• Probability of over diagnosis depends on age and mean sojourn time in pre-clinical state.
Age
Pro
bab
ility
of
Ove
r D
iag
no
sis
50 60 70 80
0.0
0.2
0.4
0.6
0.8
1.0
mean sojourn of 5 yrmean sojourn of 7.5 yrmean sojourn of 10 yrmean sojourn of 12.5 yrmean sojourn of 15 yr
Probability of over diagnosis conditional on age of early detection : Prostate cancer Probability of over diagnosis conditional on age of
early detection : Prostate cancer
4343
ConclusionsConclusions• Early detection of chronic diseases has the potential of significant benefit (lower mortality , increased cure rates)
• Current recommendations for special exam programs not based on analytic considerations – weighing costs vs. benefits.
• Clinical trials to evaluate benefit require long term follow-up. Statistical models may be able to predict outcome using early clinical trial data.
• The advances in genomics are likely to generate candidate markers which may be used for the early detection of disease. Require a way of carrying out clinical trials which do not take a long time to complete.
• Need to estimate probability of over diagnosis with the discovery of markers.

4444
My CollaboratorsMy Collaborators
• Sandra J. Lee , Dana_Farber Cancer Institute Sandra J. Lee , Dana_Farber Cancer Institute and Harvard School of Public Healthand Harvard School of Public Health
• Yu Shen, M.D Anderson Cancer CenterYu Shen, M.D Anderson Cancer Center
• Ping Hu , National Cancer InstitutePing Hu , National Cancer Institute
• Ori Davidov, Haifa UniversityOri Davidov, Haifa University

4545
Thank you for coming

4646
4747
Why would screening result in Why would screening result in benefitbenefit ? ?
If screen diagnosed cases are found in an earlier If screen diagnosed cases are found in an earlier disease stage compared to usual care then there disease stage compared to usual care then there is likely to be benefit. This is referred to as a is likely to be benefit. This is referred to as a stage stage shiftshift..
Stage shift can be due to a long lead time ; Stage shift can be due to a long lead time ; i.e.cases are diagnosed before they transit to a i.e.cases are diagnosed before they transit to a more advanced prognostic stage.more advanced prognostic stage.
Stage shift may also arise from the length biased Stage shift may also arise from the length biased sampling. The selection of cases by screening sampling. The selection of cases by screening may also be associated with earlier prognostic may also be associated with earlier prognostic stages.stages.
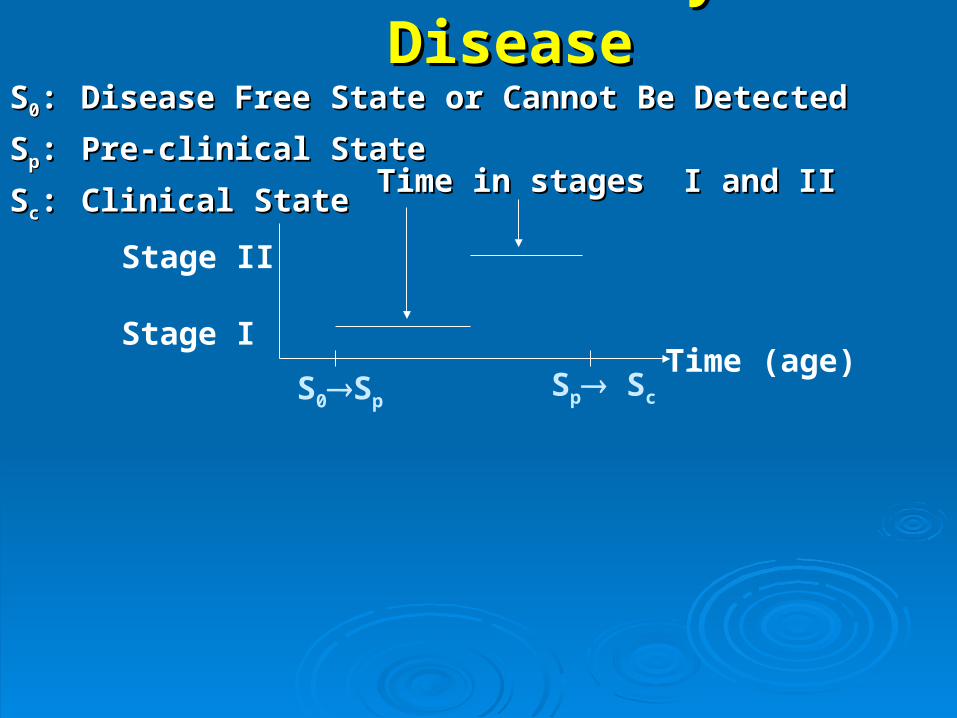
Natural History of DiseaseNatural History of DiseaseSS00:: Disease Free State or Cannot Be DetectedDisease Free State or Cannot Be Detected
SSpp:: Pre-clinical StatePre-clinical State
SScc:: Clinical StateClinical State
Time (age)
Stage II
Stage I
S0Sp Sp Sc
Time in stages I and IITime in stages I and II
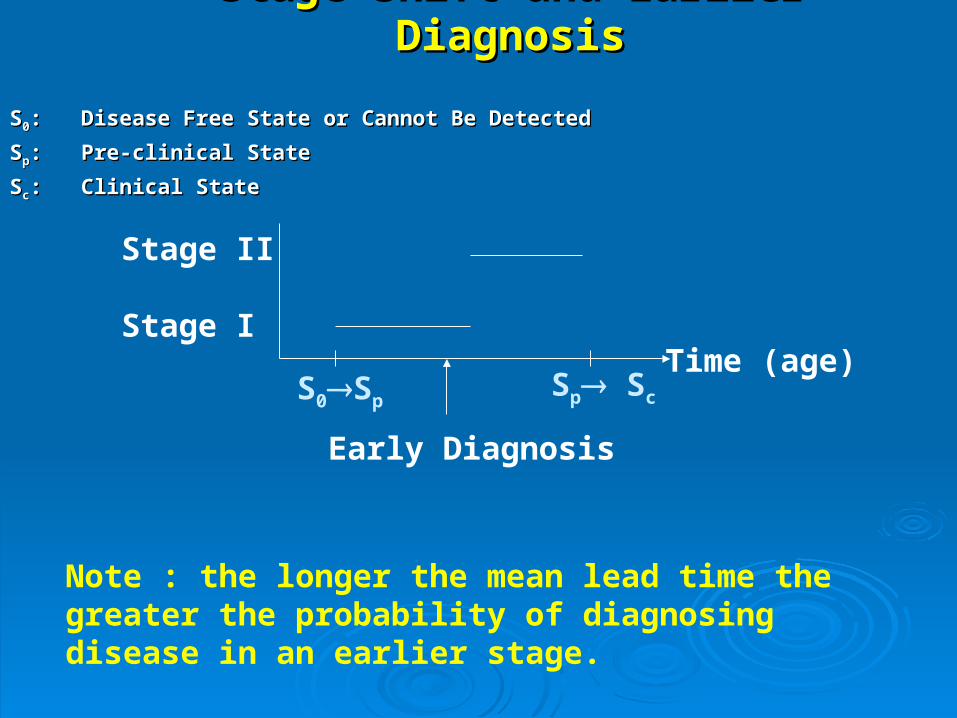
Stage Shift and Earlier DiagnosisStage Shift and Earlier Diagnosis
SS00:: Disease Free State or Cannot Be DetectedDisease Free State or Cannot Be Detected
SSpp:: Pre-clinical StatePre-clinical State
SScc:: Clinical StateClinical State
Time (age)
Stage II
Stage I
Early Diagnosis
S0Sp Sp Sc
Note : the longer the mean lead time the greater the probability of diagnosing disease in an earlier stage.
5050
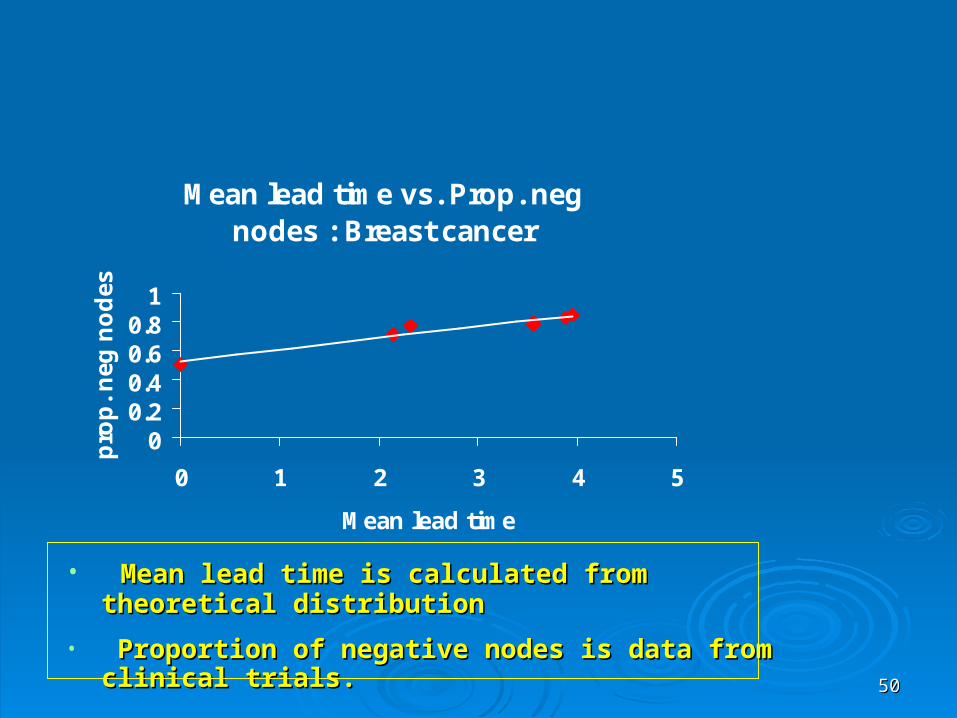
Mean lead time vs. Prop. neg nodes : Breast cancer
00.20.40.60.8
1
0 1 2 3 4 5
Mean lead time
pro
p.
neg
no
des
• Mean lead time is calculated from theoretical Mean lead time is calculated from theoretical distributiondistribution
• Proportion of negative nodes is data from clinical Proportion of negative nodes is data from clinical trials. trials.
5151
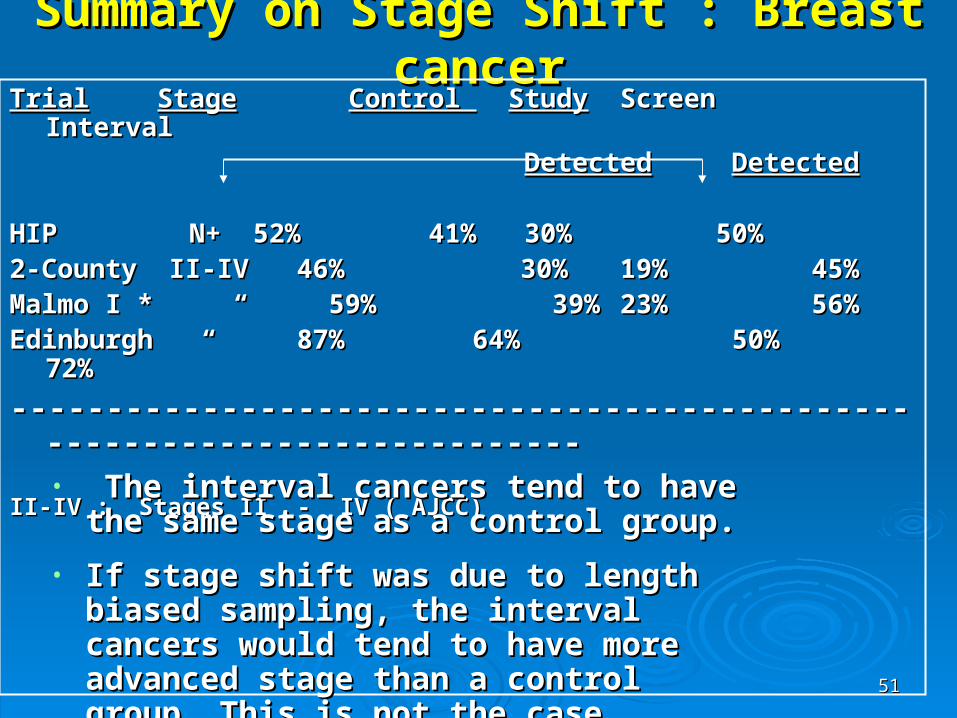
Summary on Stage Shift : Breast cancerSummary on Stage Shift : Breast cancerTrialTrial StageStage Control Control StudyStudy ScreenScreen IntervalInterval
DetectedDetected DetectedDetected
HIPHIP N+ N+ 52% 52% 41% 41% 30%30% 50%50%2-County II-IV 46% 30%2-County II-IV 46% 30% 19%19% 45%45%Malmo I * “ 59% 39%Malmo I * “ 59% 39% 23%23% 56%56%Edinburgh “ 87% 64%Edinburgh “ 87% 64% 50% 50% 72%72%
------------------------------------------------------------------------------------------------------------------------------------------------------
II-IV : Stages II - IV ( AJCC)II-IV : Stages II - IV ( AJCC)
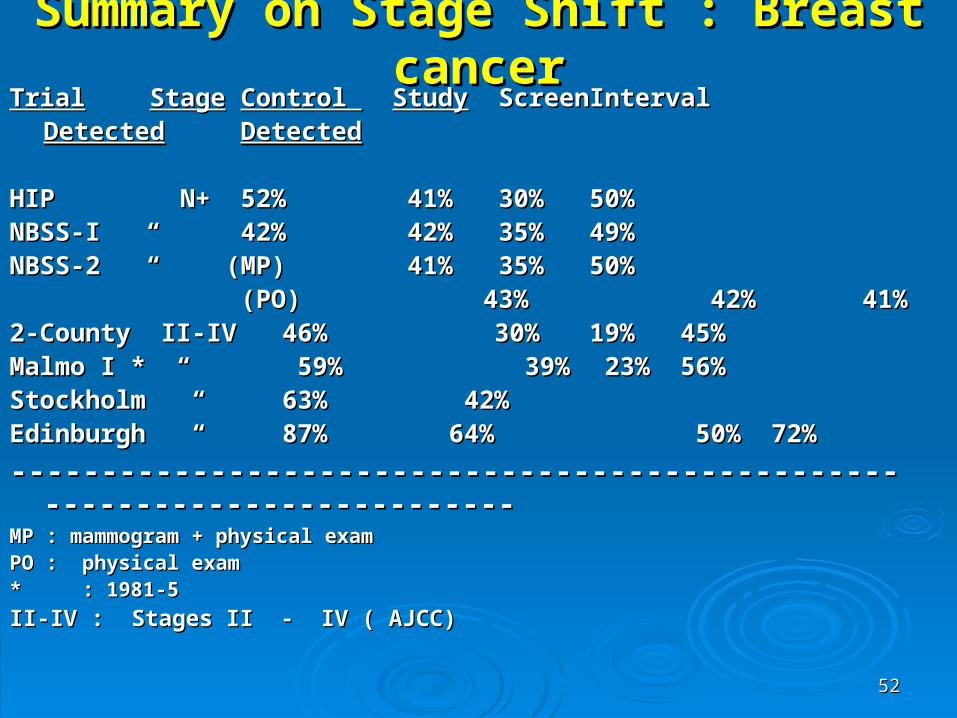
• The interval cancers tend to have the same The interval cancers tend to have the same stage as a control group.stage as a control group.
• If stage shift was due to length biased If stage shift was due to length biased sampling, the interval cancers would tend sampling, the interval cancers would tend to have more advanced stage than a to have more advanced stage than a control group. This is not the case. control group. This is not the case.
5252
Summary on Stage Shift : Breast cancerSummary on Stage Shift : Breast cancerTrialTrial StageStage Control Control StudyStudy ScreenScreen IntervalInterval
DetectedDetected DetectedDetected
HIPHIP N+ N+ 52% 52% 41% 41% 30%30% 50%50%NBSS-I “NBSS-I “ 42% 42% 42% 42% 35%35% 49%49%NBSS-2 “NBSS-2 “ (MP)(MP) 41% 41% 35%35% 50% 50%
(PO) 43% 42% (PO) 43% 42% 41%41%2-County II-IV 46% 30%2-County II-IV 46% 30% 19%19% 45%45%Malmo I * “ 59% 39%Malmo I * “ 59% 39% 23% 23% 56%56%Stockholm “ 63% 42%Stockholm “ 63% 42% Edinburgh “ 87% 64%Edinburgh “ 87% 64% 50% 50% 72%72%
------------------------------------------------------------------------------------------------------------------------------------------------------MP : mammogram + physical examMP : mammogram + physical examPO : physical examPO : physical exam* : 1981-5* : 1981-5
II-IV : Stages II - IV ( AJCC)II-IV : Stages II - IV ( AJCC)