Embed Size (px)
Citation preview
ANNALS OF ECONOMICS AND FINANCE 16-2, 425–447 (2015)
The Effect of Macro News on Volatility and Jumps
Dimitrios I. Vortelinos
Lincoln Business School, University of Lincoln, LN6 7TS, UK.E-mail: [email protected]
This paper investigates the impact of the major US macroeconomic an-nouncements on volatility and jumps of US financial markets. Results indi-cate significant volatility spillover effects on the following financial markets:exchange traded funds, exchange rates, equity index futures, Treasury bondsfutures, volatility indices and equity spot indices. The expected component ofchanges of macro variables insignificantly affect volatility. The correspondingsurprise component positively and significantly affect volatility. The exchangerate market is mostly affected by macro announcements. Moreover, news re-lated jumps are higher in magnitude than non-news-related jumps. Most ofthe announcements cause significant increases in jump size.
Key Words: Macroeconomic announcements; Volatility; Jumps; Financial mar-
kets.
JEL Classification Numbers: G14, C22, G13.
1. INTRODUCTION
Macroeconomic announcements can be considered as a market anomaly.According to the efficient market hypothesis, any non-expected informa-tion should not significantly affect a market. The impact of news surprisesat intraday intervals was examined by Adams et al. (2004) and Andesrenet al. (2007), among others. The impact of macroeconomic announce-ments on price reactions in the stock market is significant; see Birz andLott (2011), among others. Hausman and Wongswan (2014) examined theimpact of U.S. monetary policy announcement surprises in foreign equityindexes, short- and long-term interest rates, and exchange rates. Boudtand Petitjean (2014) provided a descriptive analysis of spreads and tradingvolume around jumps. They mainly resarched the impact of news on theliquidity dynamics around jumps, the contribution of liquidity shocks tojumps and contribution of liquidity shocks to prices.
425
1529-7373/2015
All rights of reproduction in any form reserved.

426 DIMITRIOS I. VORTELINOS
A recent trend in announcements literature is to examine the effect ofmacro announcements and surprises on volatility and jumps. Bauwens,Omrane and Giot (2005) studied the impact of nine categories of scheduledand unscheduled news announcements on the euro/dollar return GARCHvolatility. News announcements magnify asymmetric volatility and corre-lations which tend to be high when volatilities are high (Thomakos, Wang,Wu and Chuderewicz, 2008). The announcement effect of the federal fundstarget rate was studied in an intraday frequency on individual stock returns,volatilities and correlations (Chulia et al., 2010). Volatility (either impliedor realized) tends to decline in the hours following central bank interven-tions (Neely, 2011). Dimpfl (2011) researched the reaction of the Germanmarket to the US news announcements. It is also found significantly highervolatility on news days. Recently, using daily data from the Federal fundsfutures market, Marfatia (2014) estimated the response of S&P 500 stockreturns to monetary policy surprises within the time varying parameter(TVP) model.
We extend this literature by documenting the impact of macroeconomicnews announcements on volatility and jumps in an intraday frequencyacross many US financial markets over a decade. The effects of macroeco-nomic announcement surprises in most of realized volatilities are significantand negative. The expected component of announcement positively andsignificantly affect volatility series. The unexpected (surprise) componenthighly, positively and significantly affect volatility series.
Very few papers extensively examined macroeconomic announcementsupon intraday jumps. Evidence of significant effect of macroeconomic newson intraday price jumps is provided by Evans (2011). More recently, Cha-trath, Miao, Ramchander and Villupuram (2014) investigated the impactof US macro news on currency jumps and cojumps.
For all 8:30 and 10:00 announcements, the volatility-jump frequency ofoccurence after is higher than the volatility-jump frequency of occurencebefore each announcement. The number of occurences of jumps whichcoincide with all macro announcements is less than the total number ofjumps, meaning that not all jumps can be explained by announcementsreleases. Market momentums and/or liquidity may drive intraday jumps.Wang and Huang (2012) found that the continuous component of dailyvolatility of Hu-Shen 300 index is positively correlated with trading vol-ume, and the jump component reveals a significant and robust negativerelation with volume. Jumps tend to cluster around announcement timeson announcement days, for the majority of financial assets. The result thatthere are more positive than negative jumps, is a first indication of someasymmetry in reactions to news. For most of financial assets/markets andannouncements, the contribution of the announcement of news to the aver-age absolute size of intraday jumps is statistically significant and negative,

THE EFFECT OF MACRO NEWS ON VOLATILITY AND JUMPS 427
across assets and 8:30 as well as 10:00 macro announcements. The impactsof standardized news releases (announcement surprises) to intraday jumpsare negative for most of 8:30 announcements and positive for all 10:00 an-nouncements, across financial assets/markets. The impact (magnitude ofthe coefficient) of news-related jumps is higher than the impact of non-news-related jumps on realized volatility series. All impacts are significant.Across all results, there are not significant differences either in significanceor in magnitude between 8:30 and 10:00 announcements. Furthermore,the foreign exchange market is the market with the most significant news-releases effect on volatility and jumps. This is consistent across the boardof effect’s measurements as well as the various exchange rates within thismarket.
The outline of this paper is as follows. Section 2 describes the volatilityestimation and the jump detection scheme. Section 3 describes the dataused. Section 4 provides the results and Section 6 offers concluding remarks.
2. THEORETICAL FRAMEWORK
2.1. Volatility estimation
The equilibrium price evolves as a function of a stochastic volatility pro-cess as:
p∗ti=
ti∫0
σsdWs + jti (1)
where σt is a stochastic volatility process and Wt is standard Brownianmotion and where jti denotes the component that will appear in the priceprocess in the case there are discrete jumps. The integrated volatility overthe whole day is then given by:
Vt=
1∫0
σ2sds+ λt (2)
where λt =∑
0<s≤1 κ2s is the contribution of the jumps into the volatility,
with κsdenoting the size of the discrete jumps.To present the realized volatility estimator used, consider first the case
where jti = qt = 0 so that there are no jumps present. Then, a consistentestimator for volatility, as m→∞, is given by the sum of intraday squaredequilibrium returns as:
RV(m)t∗ =
m∑i=1
r∗2i,m → Vt (3)

428 DIMITRIOS I. VORTELINOS
However, r∗2i,m is latent and thus the above estimator cannot be imple-mented. The obvious alternative is to use the sum of intraday squaredobservable returns but this alternative is not robust to the presence of mi-crostructure noise (leading to various inconsistencies). One has therefore toconsider various other estimators. Let’s begin with the naive benchmark,the realized 5-minute estimator.
The currently accepted realized volatility estimator comes from Ander-sen, Bollerslev, Diebold and Labys (2001), ABDL hereafter, and is simplythe sum of the observable intraday squared returns:
RV(m)t =
m∑i=1
r2i,m (4)
In the absence of noise, this estimator is a consistent estimator of Vt as thesampling frequency increases. However, because the existing microstruc-ture noise makes realized volatility estimator being a biased volatility es-timator, another realized volatility estimator trying to correct for noise isused. The estimator selected is the two-scale realized volatility estimator(as examined, in Barndorff-Nielsen, Hansen, Lunde, and Shephard, 2008,and 2011, among others); however, the asymptotically optimal number ofsubsamples is selected as in Bandi and Russell (2008).
At first, suppose the full grid with all observations within the day isdefined as G and m is number of observations (the size of G). G is thenpartitioned into k non-overlapping sub-grids G(k) of size mk. If a sparsesampling (e.g. every 5 or 15-minutes) approach is used, only one portion ofthe data set will be used. For example, if the highest sampling frequency isevery minute, and 5-minute returns is the selected frequency in constructinga volatility estimator, then the rest four (4) data points within every fiveminutes that could have been used, are ignored. Therefore, one can useadditional information while doing sparse sampling. Defining the sparsesampling over sub-grid i as:
RV (k)sparse=
mk∑tj ,tj+∈G(k)
(ptj+ − ptj )2 (5)
where ptj+ is the next observation within grid k, the subsample averageestimator can be defined as the average of all of the possible grids, orsub-samples:
RV(Avg)t =
1
k
k∑i=1
RV (k)sparse (6)
This estimator, however, is still biased at high frequencies.

THE EFFECT OF MACRO NEWS ON VOLATILITY AND JUMPS 429
The first best estimator in Zhang et al. (2005), known as the two time-scales estimator, uses RV (Avg) together with realized volatility calculated
at the highest possible frequency possible m, RV(m)t :
RV(TS)t = RV
(Avg)t − m̄
mRV
(m)t (7)
where m̄ = (m− k+ 1)/k. The asymptotically optimal number of subsam-ples, kopt can be chosen as:
kopt=
(3σ̂4
e
Q̂t
) 13
m2/3 (8)
where σ̂2e and Q̂t are estimated as the optimal sampling frequency esti-
mation in the optimally-sampled realized volatility estimator) by Bandiand Russell (2008). The two-scale estimator used here, has its number ofsubsamples selected (as in Bandi and Russell, 2008) as:
kfsopt=
1.5
[RV
(m/15)t /m
]2Q̂t
1/3
m (9)
and the resulting estimator is denoted by RV(TS,fs)t .
2.2. Jump detection
Barndorff-Nielsen and Shephard (2004, 2006 and 2007) are early refer-ences on testing for jumps in the context of high-frequency intraday dataand realized volatility estimators. The main idea is based on the use ofthte difference between realized volatility (as an estimator of the integratedvariance of the price process including any jumps) and bi-power variation(the estimator of the integrated variance excluding the jumps λt). Theestimator for bi-power variation is given by:
BPV(m)t = µ−2p
m∑i=2
|ri,m| |ri−1,m| (10)
where µp = E (|Z|p) is the mean of the pth absolute moment of a standardnormal distribution. Under certain conditions we have that, as m → ∞,the bi-power variation estimator converges to Vt−λt and therefore we have
that, in general, RV(j)t −BPV (m)
t → λt, the jump component of volatility;
here RV(j)t denotes any of the estimators defined in the previous section.

430 DIMITRIOS I. VORTELINOS
Identifying significant jumps thus requires a test statistic with at leastthree components: an estimator of volatility that includes jumps, an esti-mator of volatility that excludes jumps, and estimators of various other mo-ments that make the asymptotic distribution of the test statistic tractableand operational. In the version of the test proposed by Huang and Tauchen(2005), the test statistic is given by (the log-based version of their test isused1):
Z(j)t = m1/2
log(RV
(j)t /BPV
(m)t
)[(µ−41 + 2µ−21 − 5
){TPQt
(BPV
(m)t
)−2}]1/2 (11)
with the statistic having a standard normal sampling distribution as m→∞.
A jump is deemed to be significant if the test statistic exceeds the appro-priate critical value of the standard normal distribution, denoted by Φα,at α level of significance. Although a jump can be defined without refer-
ence to the test statistic, as J̃(j)t = max
(RV
(j)t −BPV (m)
t , 0)
, the following
test-based version is used for defining a day with a significant jump:
J(j)t = I
(Z
(j)t > Φα
)(RV
(j)t −BPV (m)
t
)(12)
with the continuous component of volatility defined naturally as C(j)t =
RV(j)t −J
(j)t . Here, J
(j)t is the sample estimator of the theoretical jump com-
ponent λt in the sense that J(j)t → λt. In addition to the J
(j)t jump com-
ponent, the subset of significant jumps, namely J+(j)t =
{J(j)t |J
(j)t > 0
}and also in the binary series B
(j)t = I
(J(j)t 6= 0
)of jump occurrences can
be retrieved.
3. DATA
The impact of US macro announcements is evaluated in the followingfinancial markets: exchange traded funds (DIA, IWM , MDY , QQQ, andSPY ) (ETF market), foreign exchange rates (USD/CAD, USD/JPY ,GBP/USD, EUR/USD, AUD/USD) (FX market), equity index futures(S&P − 500 with the acronym ES) (EFI market), U.S. Treasury bondsfutures contract (with the acronym US) (BF market), volatility index
1Results are similar using the ratio-based version of the same statistic. See Huangand Tauchen (2005) and ABD (2007) for details.

THE EFFECT OF MACRO NEWS ON VOLATILITY AND JUMPS 431
(CBOE Volatility Index with the acronym V IX) (V OLmarket), and equityspot market (Nasdaq Composite, Dow Jones Industrial Average, S&P 500,and Russell 2000 indices with the acronyms COMPX, INDU , INX, andRUT , respectively) (ESI market). Data observations are sampled at a1-minute frequency. The related literature attempts to prove consistencyof results by a long span of high frequency time series data (LLN, 2011,Evans, 2011, and Rosa, 2011).
Week-ends and a set of fixed and irregular holidays, as well as the dayswith too many missing values are removed. Data series are collected fromand up to different time across this paper financial assets. In specific, forETFs in this paper, the trading day starts at 9:31 and ends at 16:152. Forequity spot indices and volatility index as well, the trading day starts at10:01 and ends at 16:003. For futures indices, the trading day starts at 10:01and ends at 16:154. For foreign exchange series, the trading day starts at0:01 and ends at 23:59 (all day long). So, where the 8:30 announcementsare examined, only the two futures (ES, and US) and the five exchangerates (USD/CAD, USD/JPY , GBP/USD, EUR/USD, AUD/USD)are used. For the 10:00 announcements, all time series data are used.Sample includes data from January 2001 to November 20115.
Announcements data come from the Bureau of Economic Analysis andthe US Census Bureau of the US Department of Commerce, the Bureauof Labor Statistics of the US Department of Labor, and the Board of gov-ernors of the Federal Reserve System. Announcements are classified intotwo categories based on the time of each announcement: six announce-ments at 8:30 am, and four at 10:00 am. Table 1 analytically lists theannouncements with the corresponding time. In total, there are 1,199 an-nouncements during the sample period; in detail, there are 771 announce-ments in the 8:30 am category and 428 in the 10:00 am category. The pre-announcement period selected is 5 minutes, and the post-announcement is25 minutes. These selections are the empirically appropriate ones for the1-min returns series used. They are also consistent with the recent liter-ature on macroeconomic announcements. Elder et al. (2012) selected 5minutes as both the pre- and post-aanouncement period in a tick-by-tickdata sampling frequency. He examines the impact of US macroeconomicnews announcements on return, volatility and volume for three commodi-
2All ETFs (DIA, IWM , MDY , QQQ, and SPY ) used in this paper track the INDU ,RUT , S&P − 400, NASDAQ− 100 and INX equity spot indices, respectively. That iswhy, data start at 9:31 and end at 16:15. Similar time span regarding ETFs has beenused by Rosa (2011) as well.
3Trading hours for these indices are the regular trading hours, from 9:30 up to 16:00EST (Eastern Standard Time); also, selected by Rosa (2011).
4Trading hours for these two futures contracts are from 8:20 up to 16:15 EST (EasternStandard Time); also, selected by Evans (2011).
5However, exchange rates start from October 2003.

432 DIMITRIOS I. VORTELINOS
TABLE 1.
List of US macroeconomic news announcements.
Time Announcement (abbreviation) obs
8:30 Trade Balance Goods & Services (TB) 127
8:30 Gross Domestic Product (GDP) 131
8:30 Personal Income (PI) 126
8:30 Producer Price Index (PPI) 128
8:30 Consumer Price Index (CPI) 129
8:30 Employment Situation Index (EM) 130
10:00 Construction Spending (CS) 80
10:00 US Import & Export Price Indexes (ES) 131
10:00 FED Funds Target Rate (TR) 88
10:00 Real Earnings (RE) 129
Total 1199
Notes. Table 1 lists the 10 different types of macroeconomicannouncements, the time of their release, the number of ob-servations, and the relative standard deviation (sv/µ) of thedifferences between actual and forecast (surprises). For Con-struction Spending only, there is data available from 2005.
ties futures. Evans and Speight (2010) analyzes the volatility dynamicssurrounding announcements by using 15 minutes as the pre-anouncementperiod and either 5 minutes or 25 minutes as the post-announcement oneat a 5-min data sampling frequency. Rosa (2011) investigates the effects ofFederal Reserve’s decisions on equity indices, where the pre-announcementperiod is 10 minutes and the post-announcement period is 20 minutes, in a5-min data samlping frequency.6 In terms of jumps detection, the selectionof the pre- and post-announcement period does not affect the frequency ofoccurrence of jumps. This holds because the jump detection scheme triesto detect the existence of one and only significant jump in the volatilityseries (either in the pre- or post-announcement period). So, the differencebetween 5 and 25 minutes does not affect the expectation of less or morejumps detected.
4. EMPIRICAL RESULTS
All regressions in the present section produce significant estimates ofcoefficients. Significance is answered in a 5% significance level and Neweyand West (1987) HAC standard errors are employed. However, the valuesof coefficients for all regressions are low in magnitude. That is why the
6However, it was depicted that the equity indices tend to incorporate FOMC monetarysurprises within 40 minutes after the announcement.

THE EFFECT OF MACRO NEWS ON VOLATILITY AND JUMPS 433
coefficients are scaled in order to make them close in scale to one. Inspecific, all coefficients are multiplied with 105. Scaling concerns Tables2A, 2B, 3A, 3B, 5A, 5B, 6A and 6B.
4.1. Response of volatility to macroeconomic announcements
This section complements literature on the response of US macroeco-nomic announcements on volatility. Recent relative studies are Andersen,Bollerslev, Diebold, and Vega (2007), Chulia et al. (2010) and Gospodinovand Jamali (2012).
In the present paper, event study regressions are employed for evalu-ating the effect of US macroeconomic announcements on volatility as inGospodinov and Jamali (2012). Equation (13) concerns regressing thechange of realized volatility (DRVt) on the standardized surpises (SAj,t)of the macroeconomic announcements:
DRVt= α+ βj · SAj,t + εt (13)
where SAj,t is the announcement surprise for announcement j, DRVt =RVt − RVt−1 is the change in the level of volatility between the day ofthe announcement and the previous day. The announcement surprise is astandardized measure:
SAj,t =Aj,t − Ej,t
σj,t(14)
where Aj,t is the actual macroeconomic variable, Ej,t is the expected (fore-casted) macroeconomic variable (last period actual value) and σj,t is thestandard deviation of the Aj,t−Ej,t difference. The change of the macroe-conomic variable from the news release is decomposed into an expected anda surprise component. The effect of each component on realized volatilityis studied via the following regression:
DRVt= α+ βej ·Diej,t + βuj ·Diuj,t + εt (15)
whereDiuj,t is the unexpected component (or announcement surprise, SAj,t),Diej,t is the expected component which equals to the difference between theactual value of the macroeconomic variable and the unexpected component(Dij,t −Diuj,t).
It is common in literature to use first differences in volatility7. Moreover,Newey and West’s (1987) heteroskedasticity and autocorrelation consistent(HAC) standard errors are used to ensure valid inference. The βj coefficientestimates the effect βj of macroeconomic surprises on realized volatility.The meaning of this coefficient is that a unit percentage change in the
7See, Nikkinen and Sahlstrom (2004).

434 DIMITRIOS I. VORTELINOS
TABLE 2A.
Effect (βj) of 8:30 announcements on volatilities.
TB GDP PI PPI CPI EM All 8:30 All 8:30 & 10:00
EURUSD −0.152∗ 0.049 0.018 0.080∗ 0.081 −0.093 0.053∗ 0.033∗
AUDUSD −0.017 0.123∗ −7.056e-3 0.132∗ −0.019∗ −0.164 0.041∗ 0.048∗
USDCAD −0.125 0.087∗ 0.016 0.023 −7.311e-3∗ −0.153 0.024∗ 2.596e-3
GBPUSD −0.020∗ 1.208e-4 −0.027 0.012 0.045 −0.298∗ 0.266∗ 21.420
USDJPY −7.205e-3∗ 0.014 −0.057 0.066 0.060 −0.059 −0.160∗ −0.050∗
ES 0.023 0.115∗ −0.153∗ 0.105∗ 0.253 0.277 −0.037∗ 0.044∗
US −0.032∗ −0.112 −0.124 0.038 −0.042 0.292 0.476∗ 0.047∗
Notes. Table 2A presents βj coefficient from estimating Eq. (13) for 8:30 announcements. The symbol ∗
indicates significance in a 5% significance level.
TABLE 2B.
Effect (βj) of 10:00 announcements on volatilities.
CS ES TR RE All 10:00
EURUSD 0.012 −0.027∗ 0.258 −0.042∗ −1.724e-3
AUDUSD 0.076∗ −0.070∗ 3.191 3.795e-4 0.232∗
USDCAD −0.053∗ −5.575e-4 0.768∗ −7.677e-4 5.636e-4
GBPUSD 0.013∗ −0.032 −0.190∗ −0.023 0.039∗
USDJPY −0.124∗ −0.029 0.763∗ 0.077∗ 0.074
ES 0.181∗ 0.304 −24.240 0.113∗ −0.634∗
US 0.053 −0.027∗ −5.495 0.071 −0.041∗
SPY −0.178∗ 0.242∗ −25.578 0.093 −0.294∗
QQQ 0.434 0.157∗ −25.826 0.068 −0.179∗
MDY −0.261∗ 6.000e-3 −26.443 0.258∗ −0.183∗
IWM 0.286 −0.157∗ −36.072 0.401∗ −0.223∗
DIA −0.078∗ 0.368 −21.900 0.051 −0.262∗
V IX −9.080 1.768 −296.477 20.827 −1.241
RUT −0.209∗ −3.488 9.027 0.359∗ −5.942e-3
INX 0.285 0.258∗ −23.401 0.063∗ 0.573∗
INDU 0.055∗ 0.321∗ −21.615 −0.012 −0.510
COMPX 0.104∗ 2.143 −16.428 0.155∗ −0.166∗
Notes. Table 2B presents β coefficient from estimating Eq. (13) for 10:00announcements. The symbol ∗ indicates significance in a 5% significance level.
announcement surprise (SAj,t) tends to increase or decrease the change inrealized volatility by βj percentage points. Analytical results are presentedin Tables 2A and 2B. According to Table 2A, the highest (lowest) 8:30announcement effect on volatility series is for US (GBPUSD) asset andEM (EM) announcements. Across all 8:30 & 10:00 announcements andin average, the highest (lowest) all-8:30-&-10:00 announcement effect on

THE EFFECT OF MACRO NEWS ON VOLATILITY AND JUMPS 435
volatility series is for GBPUSD (USDJPY ) asset. According to Table2B, the highest (lowest) 10:00 announcement effect on volatility series isfor V IX (V IX) asset and RE (TR) announcement. The effects in mostof volatilities are negative.
TABLE 3A.
Effect of the expected (βe) and unexpected (βu) components of 8:30announcements on volatilities.
TB GDP PI PPI CPI EM All 8:30 All 8:30 & 10:00
Panel A. Expected (βe) components
EURUSD 0.206 0.116∗ 7.122 0.094 0.063 −0.472∗ 4.576e-3 0.040∗
AUDUSD 0.106∗ 0.040 15.066 0.125 −0.011∗ −0.875 −0.019 0.052
USDCAD 0.615 0.184 9.908 −0.031 −0.027 −0.444∗ 0.020∗ −6.085e-3
GBPUSD −0.297∗ −0.012 19.788 −0.026∗ 0.048∗ −0.163 −7.909e-3∗ 194.230
USDJPY 0.071∗ −0.159 5.644 0.057∗ 0.064∗ −0.491 −0.124∗ −0.051∗
ES −0.513 0.068∗ 1.147 −0.504 0.679∗ 0.117 −0.053∗ 0.040
US −2.303 0.957 8.474 −0.080∗ −0.064 −1.837 0.415 0.048∗
Panel B. Unexpected (βu) components
EURUSD −0.117∗ 0.067 −0.055 −0.028∗ −0.158∗ −0.374 8.692e-3 −5.974e-3
AUDUSD −0.040∗ 0.027 −0.117∗ 0.016 0.072∗ −0.702 0.011∗ −2.712e-3
USDCAD −0.244∗ 0.097 −0.077 0.110 −0.171∗ −0.286∗ 6.581e-4 6.935e-3
GBPUSD 0.091 −0.012∗ −0.154∗ 0.079 0.020 0.133∗ 6.093e-3 11.111
USDJPY −0.026∗ −0.174∗ −0.044∗ 0.018∗ 0.034 −0.426∗ −6.406e-3∗ 2.058e-4
ES 0.177 −0.047∗ −0.010∗ 1.247 3.637 −0.157∗ 3.777e-3 5.668e-3
US 0.752 1.068 −0.067∗ 0.242 −0.184∗ −2.097 0.015 −1.355e-3∗
Notes. Table 3A presents the effects of the expected (βe coefficient) in Panel A and unexpected (βu
coefficient) in Panel B components of 8:30 macroeconomic announcements on volatilities. The symbol∗ indicates significance in a 5% significance level.
Tables 3A and 3B report the announcement effect on volatility series,when the announcement variable change is decomposed into an expectedand an unexpected component. Overall, the expected component insignifi-cantly affect volatility series. The unexpected (surprise) component highly,positively and significantly affect volatility as well for all 8:30 announce-ments. The result that the expected component insignificantly affect andsurprise component highly, negatively and significantly affect volatility, isconsistent with the market efficiency hypothesis, where only new informa-tion arrivals lead to a response of financial variables. 8
According to Table 3A, the highest (lowest) 8:30 announcement expectedeffect on volatility series is for USDCAD (US) asset and PI (TB) an-nouncement. Across all 8:30 & 10:00 announcements and in average, the
8Based on surprises of the Federal funds rate, Bernanke, and Kuttner (2005) providedevidence that stock returns and volatility only respond to the Federal funds rate surprisecomponent but not to the expected component.

436 DIMITRIOS I. VORTELINOS
TABLE 3B.
Effect of the expected (βe) and unexpected (βu) components of 10:00announcements on volatilities.
CS ES TR RE All 10:00
EURUSD −3.811 (0.243) 0.084∗ (0.112∗) 0.330 (−2.774e-3) −0.187∗ (−0.146) −9.573e-3∗ (5.383e-3∗)
AUDUSD −4.930 (0.318) −0.029∗ (0.042∗) 2.567 (0.024∗) −0.464 (−0.467) 0.215 (0.012∗)
USDCAD −4.290 (0.270∗) 0.023 (0.024) 3.751 (−0.115) −0.067 (−0.059∗) −2.648e-3 (5.681e-3∗)
GBPUSD −1.441 (0.092) −0.105∗ (−0.074) 0.057∗ (−9.538e-3) −0.153 (−0.131∗) 0.038∗ (1.019e-3∗)
USDJPY −4.856 (0.301∗) −0.131 (−0.103) 0.244 (0.020∗) −0.127 (−0.205) 0.061 (9.014e-3∗)
ES −15.207 (0.979∗) 0.731∗ (0.431∗) −15.555 (−0.335) −1.379 (−1.498) −0.596∗ (−0.033)
US −3.134 (0.203∗) 0.038 (0.065∗) −6.207 (0.028∗) −0.391∗ (−0.464∗) −0.032 (−7.840e-3)
SPY −17.915 (1.128) 0.602∗ (0.365∗) −18.520 (−0.273) −0.980 (−1.078) −0.458∗ (0.141∗)
QQQ −14.419 (0.945) 0.681 (0.530∗) −22.182 (−0.141) −1.075 (−1.148) −0.258 (0.068∗)
MDY −7.992 (0.492∗) 0.476∗ (0.474∗) −18.089 (−0.322∗) −1.996 (−2.263) −0.216∗ (0.028∗)
IWM −24.674 (1.587) 0.451 (0.613∗) −19.955 (−0.622) −1.629 (−2.038) −0.362 (0.120∗)
DIA −19.059 (1.208) 0.780∗ (0.417∗) −17.986 (−0.151∗) −0.804∗ (−0.859) −4.928e-3 (−0.168)
V IX −17.628 (1.149) −7.809 (−9.695) −221.145 (−2.908) −19.739 (−40.630) −5.324 (2.678)
RUT −5.367 (0.328∗) −3.625 (−0.139) 17.318 (−0.320∗) −0.479 (−0.841) −0.046 (0.034∗)
INX −7.874 (0.519∗) 0.734∗ (0.481∗) −15.210 (−0.316) −0.779∗ (−0.846) 0.516∗ (0.048∗)
INDU −14.887 (0.951) −0.696 (0.379∗) −18.149∗ (−0.134) −0.728 (−0.720) −0.492∗ (−0.016∗)
COMPX −9.860 (0.634∗) 2.345 (0.204∗) −13.122∗ (−0.127) −0.636 (−0.795) −0.229∗ (0.054∗)
Notes. Table 3B presents the effects of the expected (βe coefficient) and unexpected (βu coefficient) components of10:00 macroeconomic announcements on volatilities. The latter coefficients are included in parentheses. The symbol ∗
indicates significance in a 5% significance level.
highest (lowest) all-8:30-&-10:00 announcement effect on volatility series isfor GBPUSD (USDJPY ) asset. Morever, the highest (lowest) 8:30 an-nouncement unexpected (surprise) effect on volatility series is for V IX(V IX) asset and All − 10 : 00 (RE) announcement. Across all 8:30& 10:00 announcements and in average, the highest (lowest) all-8:30-&-10:00 announcement unexpected (surprise) effect on volatility series is forGBPUSD (USDJPY ) asset.
According to Table 3B, for the 10:00 announcements, the highest (lowest)10:00 announcement expected effect on volatility series is for RUT (V IX)asset and TR (TR) announcement. Morever, the highest (lowest) 10:00announcement unexpected (surprise) effect on volatility series is for V IX(V IX) asset and CS (RE) announcement.
4.2. Volatility jumps and their responses to macroeconomic an-nouncements
This subsection investigates the impact of macroeconomic news announce-ments on intraday jumps. Analysis is employed similarly to Evans (2011).Seperating intraday jumps into two sub-samples of news-related jumps and

THE EFFECT OF MACRO NEWS ON VOLATILITY AND JUMPS 437
non-news-related jumps reveals initial differences between these two jumpseries. Tests of equality of means show that news-related jumps are not sig-nificantly different from non-news-related jumps. An explanation may bethat positive and negative jumps are likely to offset each other. However,for the absolute values of jumps, news-related jumps are significantly largerin average than non-news-related jumps. Seperating positive and negativejumps also reveals important differences between the two groups with av-erage positive (negative) news-related jumps significantly larger (smaller)than average positive (negative) non-news-related jumps.
TABLE 4A.
Changes (∆JFj) of jump frequencies between the after (8:30-8:55) andthe before (8:25-8:30) period for each 8:30 announcement.
TB GDP PI PPI CPI EM All 8:30
EURUSD 22% (8%) 29% (10%) 16% (9%) 21% (9%) 14% (9%) 9% (9%) 19% (5%)
AUDUSD 30% (8%) 27% (10%) 77% (9%) 22% (9%) 21% (9%) 20% (9%) 21% (7%)
USDCAD 20% (9%) 24% (9%) 15% (8%) 21% (9%) 21% (9%) 8% (7%) 17% (4%)
GBPUSD 11% (7%) 17% (8%) 23% (9%) 22% (9%) 24% (9%) 11% (8%) 26% (6%)
USDJPY 20% (8%) 23% (10%) 16% (8%) 21% (9%) 18% (9%) 8% (8%) 19% (5%)
ES 54% (4%) 53% (3%) 60% (4%) 47% (3%) 54% (3%) 25% (2%) 51% (2%)
US 61% (4%) 72% (4%) 69% (5%) 61% (3%) 64% (5%) 32% (8%) 62% (0%)
Notes. Table 4A presents the changes (∆JFj) of the volatility-jump frequencies after and jump frequenciesbefore each 8:30 announcement. Values out of brackets concern number of days with jumps (J1
j,t) as a percentage
of the total sample of days with announcements; values in brackets concern number of days with jumps (J2j,t)
as a percentage of the total sample of days with or without announcements. Before is the time period 5-minbefore each announcement. After is the time period 25-min after each announcement. Sample is the days withjumps, as those are more than the ones with announcements. For the rest of the abbreviations, see Table 1.
Tables 4A and 4B report the changes (∆JFj) of the volatility-jump fre-quencies after and jump frequencies before each 8:30 (Table 4A) or 10:00(Table 4B) announcement for all financial assets. J1
j,t is the number of dayswith jumps (as a percentage of the total sample of days with announce-ments) more (or less) in the after period than those in the before period,and J2
j,t is the number of days with jumps (as a percentage of the totalsample of days with or without announcements) more (or less) in the afterperiod than those in the before period. After is the time period 25-minutesafter each announcement. Before is the time period 5-minutes from 5-minbefore each announcement. As far as all changes are positive, the numberof jumps after announcements is higher than before. The number of jumpsin each market is less than the total number of news announcements (lowerthan 100%) meaning that announcements are not the only factor causingjumps. The number of occurences of jumps which coincide with all macroannouncements is less than the total number of jumps, meaning that notall jumps can be explained by announcements releases. Results are similar

438 DIMITRIOS I. VORTELINOS
TABLE 4B.
Changes (∆JFj) of jump frequencies between the after (10:00-10:25) andbefore (9:55-10:00) period for each 10:00 announcement.
CS ES TR RE All 10:00 All 8:30 & 10:00
EURUSD 14% (11%) 12% (13%) 23% (15%) 10% (8%) 14% (15%) 15% (6%)
AUDUSD 23% (12%) 19% (15%) 36% (17%) 19% (11%) 23% (12%) 18% (8%)
USDCAD 16% (15%) 17% (12%) 15% (16%) 15% (12%) 16% (13%) 11% (6%)
GBPUSD 14% (11%) 10% (10%) 2% (15%) 12% (10%) 12% (15%) 11% (5%)
USDJPY 10% (13%) 16% (10%) 20% (14%) 5% (7%) 14% (16%) 12% (5%)
ES 25% (12%) 25% (11%) 29% (15%) 28% (11%) 26% (15%) 36% (18%)
US 58% (13%) 62% (13%) 56% (15%) 48% (10%) 58% (9%) 53% (17%)
SPY 13% (11%) 13% (11%) 23% (15%) 6% (12%) 12% (9%) -
QQQ 32% (12%) 25% (13%) 30% (17%) 20% (11%) 24% (10%) -
MDY 23% (12%) 12% (10%) 18% (15%) 15% (10%) 16% (12%) -
IWM 16% (15%) 17% (14%) 20% (20%) 10% (13%) 20% (9%) -
DIA 18% (13%) 13% (11%) 12% (15%) 13% (10%) 13% (10%) -
V IX 42% (15%) 46% (12%) 40% (18%) 35% (12%) 30% (6%) -
RUT 6% (15%) 7% (13%) 5% (17%) 5% (11%) 7% (10%) -
INX 5% (13%) 4% (11%) 10% (17%) 6% (10%) 9% (11%) -
INDU 4% (13%) 8% (13%) 7% (19%) 8% (8%) 8% (10%) -
COMPX 5% (14%) 3% (13%) 6% (17%) 3% (8%) 6% (10%) -
Notes. Table 4B presents changes (∆JFj) of the volatility-jump frequencies after and jump frequencies beforeeach 10:00 announcement. Values out of brackets concern number of days with jumps (J1
j,t) as a percentage
of the total sample of days with announcements; values in brackets concern number of days with jumps (J2j,t)
as a percentage of the total sample of days with or without announcements. Before is the time period 5-minbefore each announcement. After is the time period 25-min after each announcement. Sample is the dayswith jumps, as those are more than the ones with announcements. For the rest of the abbreviations, seeTable 1.
THE EFFECT OF MACRO NEWS ON VOLATILITY AND JUMPS 439
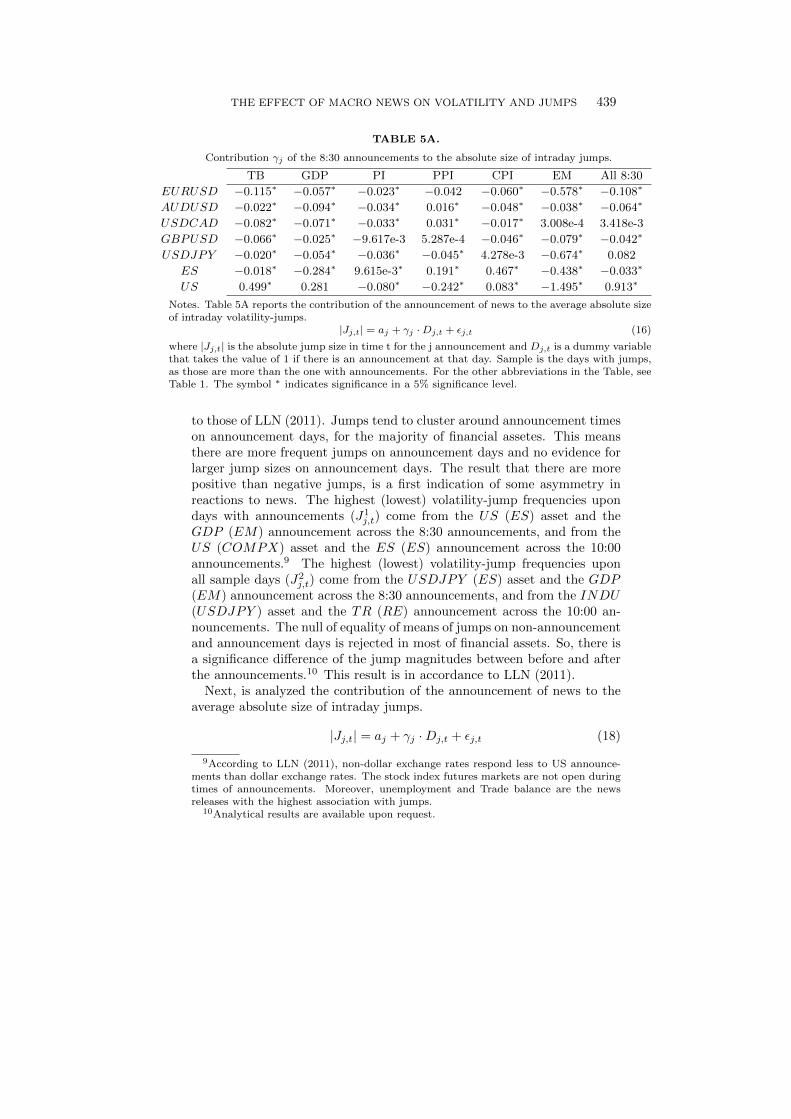
TABLE 5A.
Contribution γj of the 8:30 announcements to the absolute size of intraday jumps.
TB GDP PI PPI CPI EM All 8:30
EURUSD −0.115∗ −0.057∗ −0.023∗ −0.042 −0.060∗ −0.578∗ −0.108∗
AUDUSD −0.022∗ −0.094∗ −0.034∗ 0.016∗ −0.048∗ −0.038∗ −0.064∗
USDCAD −0.082∗ −0.071∗ −0.033∗ 0.031∗ −0.017∗ 3.008e-4 3.418e-3
GBPUSD −0.066∗ −0.025∗ −9.617e-3 5.287e-4 −0.046∗ −0.079∗ −0.042∗
USDJPY −0.020∗ −0.054∗ −0.036∗ −0.045∗ 4.278e-3 −0.674∗ 0.082
ES −0.018∗ −0.284∗ 9.615e-3∗ 0.191∗ 0.467∗ −0.438∗ −0.033∗
US 0.499∗ 0.281 −0.080∗ −0.242∗ 0.083∗ −1.495∗ 0.913∗
Notes. Table 5A reports the contribution of the announcement of news to the average absolute sizeof intraday volatility-jumps.
|Jj,t| = aj + γj ·Dj,t + εj,t (16)
where |Jj,t| is the absolute jump size in time t for the j announcement and Dj,t is a dummy variablethat takes the value of 1 if there is an announcement at that day. Sample is the days with jumps,as those are more than the one with announcements. For the other abbreviations in the Table, seeTable 1. The symbol ∗ indicates significance in a 5% significance level.
to those of LLN (2011). Jumps tend to cluster around announcement timeson announcement days, for the majority of financial assetes. This meansthere are more frequent jumps on announcement days and no evidence forlarger jump sizes on announcement days. The result that there are morepositive than negative jumps, is a first indication of some asymmetry inreactions to news. The highest (lowest) volatility-jump frequencies upondays with announcements (J1
j,t) come from the US (ES) asset and theGDP (EM) announcement across the 8:30 announcements, and from theUS (COMPX) asset and the ES (ES) announcement across the 10:00announcements.9 The highest (lowest) volatility-jump frequencies uponall sample days (J2
j,t) come from the USDJPY (ES) asset and the GDP(EM) announcement across the 8:30 announcements, and from the INDU(USDJPY ) asset and the TR (RE) announcement across the 10:00 an-nouncements. The null of equality of means of jumps on non-announcementand announcement days is rejected in most of financial assets. So, there isa significance difference of the jump magnitudes between before and afterthe announcements.10 This result is in accordance to LLN (2011).
Next, is analyzed the contribution of the announcement of news to theaverage absolute size of intraday jumps.
|Jj,t| = aj + γj ·Dj,t + εj,t (18)
9According to LLN (2011), non-dollar exchange rates respond less to US announce-ments than dollar exchange rates. The stock index futures markets are not open duringtimes of announcements. Moreover, unemployment and Trade balance are the newsreleases with the highest association with jumps.
10Analytical results are available upon request.

440 DIMITRIOS I. VORTELINOS
TABLE 5B.
Contribution γj of the 10:00 announcements to the absolute size of intradayvolatility-jumps.
CS ES TR RE All 10:00 All 8:30 & 10:00
EURUSD 0.258∗ 0.017∗ 0.257∗ −0.037 −7.379e-3∗ 0.025∗
AUDUSD 4.561e-3∗ −0.065∗ 0.389∗ −0.065∗ −0.019∗ 0.092∗
USDCAD 5.143e-3∗ −0.024∗ −0.032∗ −0.050∗ −0.011∗ −4.783e-3
GBPUSD 0.086∗ 9.915e-3 0.015∗ −0.021∗ −0.012∗ 53.258
USDJPY −0.078∗ −0.020∗ −6.055e-3 −0.050∗ −0.010∗ −0.036∗
ES 0.303∗ −0.029∗ −0.140∗ −0.245∗ −0.045∗ −4.836e-3∗
US 0.156∗ −0.011∗ −0.031∗ −0.041∗ 0.016∗ 0.177∗
SPY 0.173∗ −0.058∗ −0.114∗ −0.244∗ −0.020∗ -
QQQ 0.345∗ 0.434∗ −0.161∗ −0.117∗ 0.184∗ -
MDY −0.215∗ 0.048∗ −0.170∗ −0.324∗ −0.139∗ -
IWM 0.494∗ −0.186∗ −0.297∗ −0.328∗ 0.064 -
DIA 0.312∗ 0.053∗ −0.143∗ −0.227∗ −0.035∗ -
V IX 5.011 −7.069 −19.199 −9.197 −8.730 -
RUT −0.192∗ −0.092∗ −0.113∗ −0.164∗ −0.016∗ -
INX 0.117∗ −0.077∗ −0.203∗ −0.118∗ 0.035∗ -
INDU 0.202∗ −0.102∗ −0.153∗ −0.168∗ −0.083∗ -
COMPX 0.210∗ −0.025 −0.127∗ −0.094∗ 0.027∗ -
Notes. Table 5B reports the contribution of the announcement of news to the average absolute sizeof intraday volatility-jumps.
|Jj,t| = aj + γj ·Dj,t + εj,t (17)
where |Jj,t| is the absolute jump size in time t for the j announcement and Dj,t is a dummy variablethat takes the value of 1 if there is an announcement at that day; sample is the days with jumps.The symbol * indicates significance in a 5% significance level.For the other abbreviations in the Table, see Table 1.
where |Jj,t| is the absolute jump size in time t for the j announcementand Dj,t is a dummy variable that takes the value of 1 if there is anannouncement at that day; sample is the days with jumps. Results aredepicted in Tables 5A and 5B. The highest (lowest) contribution of theannouncement of news to the average absolute size of intraday jumps (γj)come from the US (US) asset and the TB (EM) announcement across the8:30 announcements, and from the V IX (V IX) asset and the ES (TR)announcement across the 10:00 announcements. For most of financial mar-kets and announcements, the γj coefficient is statistically significant andnegative, across assets and 8:30 as well as 10:00 macro announcements.11
This reveals that the arrival of macroeconomic news releases decreases theabsolute size of intraday jumps. This is true for all news combined (All-8:30, All-10:00 as well as All-8:30-&-10:00 announcements’ categories) as
11Few exceptions are present.

THE EFFECT OF MACRO NEWS ON VOLATILITY AND JUMPS 441
well. There are not significant in-magnitude differences either between 8:30and 10:00 announcements or between the financial markets.
TABLE 6A.
Impact (δj) of 8:30 macroeconomic standardized news releases to intradayvolatility-jumps.
TB GDP PI PPI CPI EM All 8:30
EURUSD −0.011∗ 2.667e-3 3.652e-3 −8.970e-3 −3.532e-3∗ 0.375∗ −0.162∗
AUDUSD −0.033∗ 2.627e-3 −6.322e-4∗ 0.023∗ −0.051∗ 0.107∗ −0.035∗
USDCAD −0.036∗ 0.010∗ 2.746e-3 −8.811e-4∗ −1.756e-3 0.042∗ −9.689e-3
GBPUSD −4.823e-3 5.138e-3∗ −4.115e-3∗ −0.019∗ 4.124e-3 0.038∗ −0.064∗
USDJPY −1.109e-4 5.298e-3∗ −5.021e-3 0.028∗ 0.015∗ 0.105∗ −0.017∗
ES −2.592e-3∗ 0.016 −0.030∗ −0.054∗ −5.116e-3 0.056∗ 0.109∗
US −1.676e-3 0.018∗ 7.757e-3∗ 0.026 −0.032 −0.296∗ −0.094∗
Notes. Table 6A reports the impact of 8:30 macroeconomic standardized news releases to intraday volatility-jumps. The standardized news is depicted as
SAj,t =Aj,t − Ej,t
svj,t(19)
where Aj,t is the actual macroeconomic variable, Ej,t is the expected (forecasted) macroeconomic variable (lastperiod actual value) and σj,t is the standard deviation of the Aj,t − Ej,t difference.
Jj,t = aj + δj · SAj,t + εj,t (20)
where Jj,t is the jump size in time t for the j announcement and SAj,t is the standardized macroeconomicnews; sample is the days with jumps. Sample is the days with jumps, as those are more than the one withannouncements. For the other abbreviations in the Table, see Table 1. The symbol ∗ indicates significance in a5% significance level.
The impact of macroeconomic standardized news releases (announce-ment surprises) to intraday jumps is revealed by:
Jj,t = aj + δj · SAj,t + εj,t (23)
where SAj,t is the standardized macroeconomic news as analyzed in sub-section 4.1 and Jj,t is the jump size in time t for the j announcement;sample is only the days with jumps. Regressions use only those intradayjumps that correspond to the relevant news releases. Results are depictedin Tables 6A and 6B. All impacts (δj) of 8:30 as well as 10:00 macroeco-nomic standardized news releases to intraday volatility-jumps are signif-icant. Among the 8:30 announcements, the highest (lowest) impact (δj)is for the ES (US) asset and the EM (EM) announcement, across allassets/markets. Among the 10:00 announcements, the highest (lowest) im-pact (δj) is for the V IX (V IX) and the TR (RE) announcement, acrossall assets/markets. The highest impact across all 10:00 announcements is

442 DIMITRIOS I. VORTELINOS
TABLE 6B.
Impact (δj) of 10:00 macroeconomic standardized news releases to intradayvolatility-jumps.
CS ES TR RE All 10:00 All 8:30 & 10:00
EURUSD 0.010∗ 3.518e-4 −0.424∗ −8.321e-3 9.523e-4 −0.026∗
AUDUSD −0.012∗ −3.969e-3 0.033∗ −5.233e-3∗ 0.015 −0.041∗
USDCAD −0.013∗ 3.306e-3 1.341 7.143e-3∗ 7.048e-3∗ −0.048∗
GBPUSD −0.013∗ 1.540e-3∗ 0.077∗ 5.524e-3 1.213e-3∗ −993.086
USDJPY −0.027∗ 9.407e-3∗ 2.658 −6.881e-3∗ 0.053∗ −0.047∗
ES 0.137∗ −0.027 10.264 0.152∗ 0.052∗ 0.056∗
US 0.030∗ 5.747e-3∗ 1.546∗ 4.824e-3 −2.191e-3∗ −0.028∗
SPY −0.072∗ −0.011∗ 7.598 0.169∗ 8.309e-3∗ -
QQQ 0.143∗ 0.054∗ 7.761 0.069∗ −0.021∗ -
MDY −0.091∗ −0.029∗ 7.085 0.098∗ 0.012∗ -
IWM 0.226∗ 0.071∗ 15.866 2.157e-3∗ −0.197∗ -
DIA 0.056∗ 6.000e-3∗ 9.752 0.158∗ 0.059∗ -
V IX 1.997 4.283 177.980 −0.710 −7.446 -
RUT −0.145 0.061∗ 2.308 0.086∗ 3.827e-3∗ -
INX 0.032∗ 1.274e-4 3.766 0.164∗ 0.163∗ -
INDU −0.067∗ −0.033∗ 10.117 0.033∗ 0.076∗ -
COMPX −8.723e-3∗ −0.113∗ 8.960 0.097∗ 0.017∗ -
Notes. Table 6B reports the impact of 10:00 macroeconomic standardized news releases to intradayvolatility-jumps. The standardized news is depicted as
SAj,t =Aj,t − Ej,t
svj,t(21)
where Aj,t is the actual macroeconomic variable, Ej,t is the expected (forecasted) macroeconomic variable(last period actual value) and σj,t is the standard deviation of the Aj,t − Ej,t difference.
Jj,t = aj + δj · SAj,t + εj,t (22)
where Jj,t is the jump size in time t for the j announcement and SAj,t is the standardized macroeconomicnews; sample is the days with jumps. Sample is the days with jumps, as those are more than the onewith announcements. For the other abbreviations in the Table, see Table 1. The symbol * indicatessignificance in a 5% significance level.
for V IX, across all financial assets.12 The impact (δj) is negative for mostof 8:30 announcements13 and positive for all 10:00 announcements, acrossfinancial assets/markets. Negative impacts indicate that positive macroe-conomic news surprises (good news) result in significant negative jumps.The TR is the category with the highest in-magnitude impact across all
12There is not any financial asset/market with much higher in-magnitude impactamong others, across the 8:30 announcements.
13Exceptions are the GDP and EM announcements. Negative impact have in averagethe All-8:30-&-10:00 announcements category.

THE EFFECT OF MACRO NEWS ON VOLATILITY AND JUMPS 443
8:30 and 10:00 announcements. The 8:30 announcements have a similarmagnitude of impact to the 10:00 announcements.
Nextly, the importance of macroeconomic news releases to returns andvolatility is examined. Firstly, the jumps series are split to news-related(jumps from those days with news releases) and non-news-related (jumpsfrom those days without news releases). Secondly, the method of Eder-ington and Lee (1993) is followed, as recently applied by Evans (2011), toestimate the impact of jumps from either days with or days without newsreleases to either returns or volatilities series.
rj,t = aj + βr,njj ·NJDj,t + βr,nnjj ·NNJDj,t + εj,t (24)
where rj,t is the returns series, NJDj,t is the dummy variable equal to 1 ifthe jump is news-related, and NNJDj,t is the dummy variable equal to 1if the jump is non-news-related.
RVj,t = aj + βRV,njj ·NJDj,t + βRV,nnjj ·NNJDj,t + εj,t (25)
where RVj,t is realized volatility.
TABLE 7A.
Changes (∆βrj ) between the magnitudes of the impacts of news-related
jumps (βr,njj ) and the coefficient of non-news-related jumps (βr,nnj
j )on returns.
All 8:30 All 10:00 All 8:30 & 10:00
EURUSD 77% 82% 57%
AUDUSD 70% 71% 56%
USDCAD 70% 81% 59%
GBPUSD 67% 79% 52%
USDJPY 73% 82% 57%
ES 38% 65% 14%
US 88% 88% 66%
Notes. Table 7A presents differences (∆βrj ) between the
impacts (magnitudes of the coefficient) of news-related
jumps (βr,njj ) and the coefficient of non-news-related
jumps (βr,nnjj ) on returns. For the rest of the abbrevi-
ations, see Table 1. All differences are statistically signif-icant n a 5% significance level.
Results concerning the importance of news-related jumps on returns(volatilities) are reported in Table 7A (7B). Tables concern the differences(∆βrj ) between the magnitudes of βr,njj and βr,nnjj (Table 7A) or (∆βRVj )
between βRV,njj and βRV,nnjj (Table 7B).
All differences (∆βRVj ) across both 8:30 and 10:00 announcements as wellas across all financial assets/markets are positive; so, the impact (magni-

444 DIMITRIOS I. VORTELINOS
TABLE 7B.
Changes (∆βRVj ) between the impacts of news-related jumps (βRV,nj
j ) and the
coefficient of non-news-related jumps (βRV,nnjj ) on realized volatilities.
All 8:30 All 10:00 All 8:30 & 10:00
EURUSD 80% 51% 53%
AUDUSD 71% 44% 52%
USDCAD 76% 50% 58%
GBPUSD 80% 53% 56%
USDJPY 86% 51% 55%
ES 64% 38% 32%
US 45% 13% 50%
SPY 85% 56% -
QQQ 72% 46% -
MDY 76% 52% -
IWM 84% 50% -
DIA 78% 56% -
V IX 58% 42% -
RUT 85% 61% -
INX 85% 58% -
INDU 83% 59% -
COMPX 82% 77% -
Notes. Table 7B presents differences (∆βRVj ) between the
impacts (magnitudes of the coefficient) of news-related
jumps (βRV,njj ) and the coefficient of non-news-related
jumps (βRV,nnjj ) on realized volatility series. For the rest
of the abbreviations, see Table 1. All differences are sta-tistically significant n a 5% significance level.
tude of the coefficient) of news-related jumps (βRV,njj ) is higher than the
coefficient of non-news-related jumps (βRV,nnjj ) on realized volatility series.The values reported, are the average differences among only the coefficientsthat are significant. Concerning 8:30 announcements (Table 7A), the high-est changes are for the US (ES) asset and the GDP (PI) announcement.Concerning 10:00 announcements (Table 7B), the highest changes are forthe GBPUSD (US) asset and the PI (ES) announcement.
Most of the coefficients from both days with and without news releasesare significant, across the board of US financial assets. These results arevalid for various lags as well, revealing volatility persistence. The coeffi-cients for news-related jump dummies are larger than the coefficients fornon-news-related jump dummies.
THE EFFECT OF MACRO NEWS ON VOLATILITY AND JUMPS 445
5. CONCLUDING REMARKS
The effects (βj) of macroeconomic announcement surprises (SAj,t) inmost of realized volatilities are significant and negative. The expected com-ponent of announcement (Diej,t) positively and insignificantly affect (βej )volatility series. The unexpected (surprise) component (Diuj,t) highly, pos-itively and significantly affect (βuj ) volatility series. For all 8:30 and 10:00announcements, the jump frequency of occurrence in the after-announcementperiod is higher than the jump frequency of occurrence in the period beforethe corresponding j announcement (i.e. ∆JFj is positive). The numberof occurrences of jumps which coincide with all macro announcements isless than the total number of jumps, meaning that not all jumps can beexplained by announcements’ releases. Jumps tend to cluster around an-nouncement times on announcement days, for the majority of financialassets. The result that there are more positive than negative jumps, isa first indication of some asymmetry in reactions to news. For most offinancial assets/markets and announcements, the contribution of the an-nouncement of news to the average absolute size of intraday jumps (γj)is statistically significant and negative, across assets and 8:30 as well as10:00 macro announcements. The impacts of standardized news releases(announcement surprises) to intraday jumps (δj) are negative for most of8:30 announcements and positive for all 10:00 announcements, across fi-nancial assets/markets. The impact (magnitude of the coefficient) of news-
related jumps (βRV,njj ) is higher than the impact of non-news-related jumps
(βRV,nnjj ) on realized volatility series (i.e. positive ∆βRVj ). Most of impactsare significant. Across all results, there are not significant differences eitherin significance or in magnitude between 8:30 and 10:00 announcements.
The foreign exchange market is the market with the most significantnews-releases effect on volatility and jumps. This is consistent across theboard of effect’s measurements. Consistency also comes from the resultsupon the various exchange rates. Across all 8:30 & 10:00 announcementsand in average, the highest (lowest) all-8:30-&-10:00 announcement effecton volatility series is for GBPUSD (USDJPY ) asset. The highest (lowest)volatility-jump frequencies upon all sample days comes from the USDJPYfor the 8:30 (10:00) announcements.
REFERENCES
Andersen, Torben, Bollerslev Tim, and Francis Diebold, 2007. Roughing it Up: In-cluding Jump Components in the Measurement, Modeling and Forecasting of ReturnVolatility. Review of Economics & Statistics 89, 701-720.
Adams, Greg, McQueen Grant, and Robert Wood, 2004. The Effects of Inflation Newson High Frequency Stock Returns. Journal of Business 77, 547-574.

446 DIMITRIOS I. VORTELINOS
Andersen, Torben, Bollerslev Tim, Francis Diebold, and Paul Labys, 2001. The Distri-bution of Exchange Rate Volatility. Journal of the American Statistical Association96, 42-55.
Andersen, Torben, Bollerslev Tim, Diebold Francis, and Clara Vega, 2007. Real-TimePrice Discovery in Stock, Bond and Foreign Exchange Markets.Journal of Interna-tional Economics 73, 251-277.
Bandi, Federico and Jeffrey Russell, 2008. Microstructure Noise, Realized Variance,and Optimal Sampling. Review of Economic Studies 75, 339-369.
Barndorff-Nielsen, Ole, Hansen Peter, Lunde Asger, and Neil Shephard, 2008. De-signing Realized Kernels to Measure the Ex Post Variation of Equity Prices in thePresence of Noise. Econometrica 76, 1481-1536.
Barndorff-Nielsen, Ole, Hansen Peter, Lunde Asger, and Neil Shephard, 2011. Mul-tivariate Realised Kernels: Consistent Positive Semi-Definite Estimators of the Co-variation of Equity Prices with Noise and Non-Synchronous Trading. Journal ofEconometrics 162, 149-169.
Barndorff-Nielsen, Ole and Neil Shephard, 2004. Power and Bipower Variation withStochastic Volatility and Jumps (With Discussion). Journal of Financial Economet-rics 2, 1-48.
Barndorff-Nielsen, Ole and Neil Shephard, 2006. Econometrics of Testing for Jumpsin Financial Economics using Bipower Variation. Journal of Financial Econometrics4, 1-30.
Barndorff-Nielsen, Ole and Neil Shephard, 2007. Variation, Jumps, Market Frictionsand High Frequency Data in Financial Econometrics: Advances in Economics andEconometrics: Theory and Applications, Edited by R. Blundell, P. Torsten and W.K. Newey. Ninth World Congress, Econometric Society monograph, Cambridge: Cam-bridge University Press.
Bernanke, Ben and Kenneth Kuttner, 2005. What Explains the Stock Market’s Re-action to Federal Reserve Policy? Journal of Finance 60, 1221-1257.
Birz, Gene and John Lott Jr, 2011. The Effect of Macroeconomic News on StockReturns: New Evidence from Newspaper Coverage. Journal of Banking and Finance35, 2791-2800.
Boudt, Kris and Mikael Petitjean, 2014. Intraday Liquidity Dynamics and News Re-leases around Price Jumps: Evidence from the DJIA Stocks. Journal of FinancialMarkets 17, 121-149.
Chatrath, Arjun, Miao Hong, Ramchander Sanjay, and Sriram Villupuram, 2014.Curency Jumps, Cojumps and the Role of Macro News. Journal of InternationalMoney and Finance 40, 42-62.
Chulia, Helena, Martens Martin, and Dick van Dijk, 2010. Asymmetric Effects ofFederal Funds Target Rate Changes on S&P 100 Stock Returns, Volatilities andCorrelations. Journal of Banking and Finance 34, 834-839.
Dimpfl, Thomas 2011. The Impact of US News on the German Stock Market - AnEvent Study Analysis. Quarterly Review of Economics and Finance 51, 389-398.
Ederington, Louis and Jae Lee, 1993. How Markets Process Information: News Re-leases and Volatility. Journal of Finance 48, 1161-1191.
Elder, John, Miao Hong, and Sanjay Ramchander, 2012. Impact of MacroeconomicNews on Metal Futures. Journal of Banking and Finance 36, 51-65.
Evans, Kevin, 2011. Intraday Jumps and US Macroeconomic News Announcements.Journal of Banking and Finance 35, 2511-2527.

THE EFFECT OF MACRO NEWS ON VOLATILITY AND JUMPS 447
Evans, Kevin and Alan Speight, 2010. Dynamic News Effects in High Frequency EuroExchange Rates. Journal of International Financial Markets, Institutions and Money20, 238-258.
Gospodinov, Nikolay and Ibrahim Jamali, 2012. The Effects of Federal Funds RateSurprises on S&P 500 Volatility and Volatility Risk Premium. Journal of EmpiricalFinance 19, 497-510.
Hausman, Joshua and Jon Wongswan, 2014. Global Asset Prices and FOMC An-nouncements. Journal of International Money and Finance 30, 547-571.
Huang, Xin, and George Tauchen, 2005. The Relative Contribution of Jumps to TotalPrice Variance. Journal of Financial Econometrics 3, 456-499.
Lahaye, Jerome, Laurent Sebastien, and Christopher Neely, 2011. Jumps, Cojumpsand Macro Announcements. Journal of Applied Econometrics 26, 893-921.
Marfatia, Hardik, 2014. Impact of Uncertainty on High Frequency Response of theU.S. Stock Markets to the Fed’s Policy Surprises. Quarterly Review of Economicsand Finance 54, 382-392.
Neely, Christopher, 2011. A Foreign Exchange Intervention in the Era of Restraint.Federal Reserve Bank of St. Louis Review 93, 303-324.
Newey, Whitney and Kenneth West, 1987. A Simple, Positive Semi-Definite, Het-eroskedasticity and Autocorrelation Consistent Covariance Matrix. Econometrica 55,703-708.
Nikkinen, Jussi and Petri Sahlstrom, 2004. Impact of the Federal Open Market Com-mittee’s Meetings and Scheduled Macroeconomic News on Stock Market Uncertainty.International Review of Financial Analysis 13, 1-12.
Rosa, Carlo, 2011. Words that Shake Traders. The Stock Market’s Reaction to CentralBank Communication in Real Time. Journal of Empirical Finance 18, 915-934.
Thomakos, Dimitrios, Wang Tao, Wu Jingtao, and Russell Chuderewicz 2008.Macroeconomic Announcements, Intraday Covariance Structure and Asymmetry inthe Interest Rate Futures Returns. Journal of Futures Markets 28, 815-844.
Wang, Tianyi and Zhuo Huang, 2012. The Relationship between Volatility and Trad-ing Volume in the Chinese Stock Market: A Volatility Decomposition Perspective.Annals of Economics and Finance 13, 211-236.
Zhang, Lan, Mykland Per, and Yacine Ait-Sahalia, 2005. A Tale of Two Time Scales:Determining Integrated Volatility with Noisy High-Frequency Data. Journal of theAmerican Statistical Association 472, 1394-1411.


![final version - revision1 - unibo.itpascucci/web/Ricerca/PDF/42_PP_SLV.pdfstochastic volatility) models or, as in [5] and [40], to local volatility models with Poisson jumps which](https://img.pdfslide.us/doc/110x75/5f41b1a63e92b0386724b632/final-version-revision1-uniboit-pascucciwebricercapdf42ppslvpdf-stochastic.jpg)