Embed Size (px)
Citation preview

Please cite this paper as: Lasek J., Gagolewski M., The efficacy of league formats in ranking teams, Statistical Mod-
elling 18(5–6), 2018, pp. 411–435. doi:10.1177/1471082X18798426
The Efficacy of League Formats in Ranking Teams
Jan Lasek 1 and Marek Gagolewski 2
1 Interdisciplinary PhD Studies Program, Institute of Computer Science,
Polish Academy of Sciences
2 Warsaw University of Technology, Faculty of Mathematics and Information Science
and Systems Research Institute, Polish Academy of Sciences
Address for correspondence: Jan Lasek, Institute of Computer Science, Polish
Academy of Sciences, ul. Jana Kazimierza 5, 01-248 Warsaw, Poland.
E-mail: [email protected].
Phone: —.
Fax: —.
Abstract: The efficacy of different league formats in ranking teams according to
their true latent strength is analysed. To this end, a new approach for estimating at-
tacking and defensive strengths based on the Poisson regression for modelling match
outcomes is proposed. Various performance metrics are estimated reflecting the agree-
ment between latent teams’ strength parameters and their final rank in the league
table. The tournament designs studied here are used in the majority of European

Please cite this paper as: Lasek J., Gagolewski M., The efficacy of league formats in ranking teams,Statistical Modelling 18(5–6), 2018, pp. 411–435. doi:10.1177/1471082X18798426
top-tier association football competitions. Based on numerical experiments, it turns
out that a two-stage league format comprising of the three round-robin tournament
together with an extra single round-robin is the most efficacious setting. In particu-
lar, it is the most accurate in selecting the best team as the winner of the league. Its
efficacy can be enhanced by setting the number of points allocated for a win to two
(instead of three that is currently in effect in association football).
Key words: association football; league formats; rankings; rating systems; simula-
tion; tournament design
1 Introduction
Revealing truthfully the latent abilities of competing agents is an important issue
in many domains. For example, when choosing among job applicants, one wants to
adapt a mechanism that helps us rank them according to their skills (Breaugh and
Starke, 2000). In information retrieval, search engines employ algorithms to select
relevant items by ranking them (Langville and Meyer, 2006; Li, 2011). In the multi-
armed bandit problem (Katehakis and Veinott, 1987) the goal is to maximise total
payoffs from slot machines with unknown rewards distributions. In sports (including
e-sports), the issue of designing an efficacious tournament in selecting the best partic-
ipants among competing individuals or teams occurs naturally (Langville and Meyer,
2012; Lasek et al., 2016; Stefani, 1997). Thus, the efficacy of competition formats is
among the most important criteria taken into account in tournament design.
In this paper we focus on league formats employed in the top-level association football
2

Please cite this paper as: Lasek J., Gagolewski M., The efficacy of league formats in ranking teams,Statistical Modelling 18(5–6), 2018, pp. 411–435. doi:10.1177/1471082X18798426
divisions in countries belonging to UEFA – the governing body for association football
in Europe and a few other countries. The main goal of this paper is to study which
tournament types rank teams according to their strengths best. To this end, we pro-
pose a detailed simulation methodology based on a team strength (rating) model, see
also (Ley et al., 2018). As a contribution to the theory and practice of team strength
modelling, we propose a Poisson model in which attacking and defensive strengths
exhibit a particular correlation structure that is achieved by adjusting the model’s
regularisation term. This approach shares some ideas with Stenerud (2015) which
is, to the best of our knowledge, the first attempt toward exploiting the correlated
structure of team strength parameters in the Poisson regression for modelling sport
results (Maher, 1982). The model is calibrated to real-world football data and anal-
ysed for a grid of parameter values.
It is important to emphasise the particular aspects of tournament design considered
in this study. In general, the choice of tournament format is driven by a variety of
factors (e.g., Goossens and Spieksma 2012; Szymanski 2003; Wright 2014), including,
e.g., the number of teams taking part in the competition. On the one hand, the goal
may be to produce accurate rankings with respect to the teams’ true abilities. In this
way, designs that minimise the uncertainty of a tournament’s outcome are desired.
We refer to such designs as being efficacious in the sense that they produce accurate
team rankings. On the other hand, the uncertainty of a match’s outcome contributes
to the fans’ excitement and the overall “beauty” of sport. What is more, the choice
of a tournament format impacts multiple organisations involved in buying and selling
the TV broadcast rights. This paper takes the perspective of tournament “fairness”
based on its accuracy in ranking participants which is among the most important
aspects of the tournament design problem.
3

Please cite this paper as: Lasek J., Gagolewski M., The efficacy of league formats in ranking teams,Statistical Modelling 18(5–6), 2018, pp. 411–435. doi:10.1177/1471082X18798426
Before we proceed with the discussion on the related literature and different league
formats employed in individual countries, let us focus on two particular tournament
designs commonly applied in sports. They form a basis for an array of hybrid systems
(e.g., McGarry and Schutz, 1997). The first tournament structure is a k-round-robin
(kRR) tournament, in which every team plays against each other k times. With
n competing teams, such a tournament requires k · (n − 1) rounds (assuming time-
constrained scheduling) and k ·(n2
)matches to be played. Along with RR, single (or
knock-outs, KO) and double elimination tournaments are amongst the most popular
tournament structures. In knock-outs, the teams are paired off in successive rounds
with a loss causing immediate elimination and the final match determines the winner.
The double elimination tournament extends this structure by allowing first-time losers
to be paired off with only the second loss resulting in elimination.
When investigating the efficacy of different tournament structures, a typical approach
is to assume a theoretical model for participants’ strengths and generate results
of pairwise comparisons (for example, match outcomes in sport) using this model.
The results are aggregated according to the rules of a specific tournament and next
the outcome is compared to the latent team strengths. Due to the complexity of
the problem, the vast majority of the current studies address it by means of simula-
tions.
Scarf et al. (2009) studied a range of tournament formats –KO, RR and multiple com-
binations thereof – and their ability to rank teams according to their latent strengths.
For modelling teams’ strength, the authors used the Poisson model in which each team
is described by its attacking and defensive skills (Maher, 1982). The conclusion was
that 2RR is the most effective tournament design among the alternatives considered.
4
Please cite this paper as: Lasek J., Gagolewski M., The efficacy of league formats in ranking teams,Statistical Modelling 18(5–6), 2018, pp. 411–435. doi:10.1177/1471082X18798426
Ryvkin (2010) considered a theoretical model of players’ strength, and also concluded
that RR is a more efficacious tournament in comparison to KO and contests (where
each participant performs individually once and next all the participants are ranked
according to their performance measured by a specified criterion). The efficacy of
RR comes at high costs due to the fact that it requires relatively large number of
matches to be played. The author also studied the dependency of the expected rank
of a winner in relation to the number of participants, which turns out to exhibit non-
monotonic dependency on the number of competing agents. McGarry and Schutz
(1997), by considering various tournament designs involving eight teams, concluded
that in general RR is the most efficacious format. However, enhanced versions of sin-
gle and double elimination tournaments (by, e.g, seeding teams) are also competitive
in terms of their accuracy. Notably, they may be preferred due to a smaller number
of matches to be played. Mendonca and Raghavachari (2000) studied multiple RR
tournaments and the methods of aggregating their results into a single ranking for
all players. These rankings are then compared to latent teams abilities. The authors
used two different team strength models. Different methods are found to perform
better depending on the distribution of initial team strengths. The study provides
guidelines for ranking participants based on many RR tournaments in which not all
of them participate in each tournament.
In general, RR is considered to be the most efficient competition format that produces
a ranking of teams that conforms with their latent strengths. This may justify its
prevalence among different structures for domestic championships. Since RR-type
tournaments require the number of matches played to be a quadratic function of
the teams involved, they are considered to be costly. On the other hand, KO requires
relatively few matches – linear in the number of teams. However, due to this reason it
5
Please cite this paper as: Lasek J., Gagolewski M., The efficacy of league formats in ranking teams,Statistical Modelling 18(5–6), 2018, pp. 411–435. doi:10.1177/1471082X18798426
produces less stable results with respect to the true team abilities. There is a trade-off
between tournament efficacy and the number of required matches to complete it.
The studies discussed above analyse different combinations of KO and RR tour-
naments or ranking of teams based on the outcomes of multiple RR tournaments.
However, according to the best of our knowledge, except for our preliminary dis-
cussion in a conference paper (Lasek and Gagolewski, 2015), so far there was no
comprehensive study of real-world tournament formats that are commonly applied
in domestic championships. This is especially important as some countries recently
employed quite non-standard scheduling schemes. In particular, Poland introduced
a new format in the 2013/14 season: after a 2RR tournament, the points are halved
and there is an additional 1RR tournament in the top and bottom half of the league
table. On the other hand, from the 2017/18 season the league format was main-
tained but halving points after the first stage was abandoned. Without a deeper
investigation it is unclear what are the advantages (if any) of such schedule upgrades.
Therefore, the main contribution of this paper is the analysis and comparison of
different tournament designs employed for football leagues in UEFA countries.
The paper is set out as follows. In the next section we provide background on different
tournament designs for the UEFA member countries. Sect. 3 gives the details of
team strength model used in this study. Next, in Sect. 4 we propose a methodology
to evaluate the league formats under investigation. Sect. 5 analyses the results of
the simulation study. Finally, in Sect. 6 we discuss the practical side of the results.
The code to reproduce the experiments and supplementary material is available online
at github.com/janekl/league-formats-efficacy. For the empirical analysis and the es-
timation of model parameters, we used data obtained from www.football-data.co.uk.
6
Please cite this paper as: Lasek J., Gagolewski M., The efficacy of league formats in ranking teams,Statistical Modelling 18(5–6), 2018, pp. 411–435. doi:10.1177/1471082X18798426
Match attendance statistics were obtained from www.90minut.pl. The data on bet-
ting odds for model calibration and benchmarking purposes were obtained from
www.betexplorer.com. The historical odds for the outright league winner were ob-
tained from www.sts.pl, www.efortuna.pl and www.oddschecker.com.
2 Background
Most domestic championships in the UEFA countries operate as a kRR tournament
or one of its creative variations. In particular, a 2RR tournament is prevalent among
league designs with every pair of teams playing against one another twice – a home
and an away game. However, there are a few noteworthy exceptions. For example, in
the 2017/18 season the league formats in Finland or Hungary are designed as 3RR
and leagues in Estonia or Switzerland as 4RR and the league in Armenia as 6RR.
Moreover, sometimes the competition runs in two stages. In an initial phase all teams
compete against each other in a kRR tournament. Next, the league table is split into
two parts. This gives two sets of teams which compete further on in the championship
and relegation groups. The competition lasts within each of the groups separately
based on another kRR tournament. We will refer to such designs as two-stage league
formats. Such a league format has been applied in, among others, Belgium, Cyprus,
Israel, Poland, Romania, Serbia and Ukraine. Notably, in certain leagues – including
the Belgian, Polish, Romanian and Serbian – the points gained by the teams after
the first stage are divided by two and halves are rounded up if necessary. We will
refer to such structures as league formats with a points division.1
1All the league formats employed in UEFA countries in the 2017/18 season are detailed in the on-line supplementary material.
7

Please cite this paper as: Lasek J., Gagolewski M., The efficacy of league formats in ranking teams,Statistical Modelling 18(5–6), 2018, pp. 411–435. doi:10.1177/1471082X18798426
Let us take a closer look at the leagues which operate in a two-stage manner with
the points division. Most importantly, given a standard way of allocating three points
for a win, one point for a draw and no points for a loss, the division of points changes
payoffs for wins and draws to be effectively 1.5 and 0.5, respectively. As a result,
one may expect it to impact a team’s attitude and motivation in the initial part of
the competition compared to its final stage when the wins are worth more points.
However, it should be emphasised that possible changes in a team’s attitude may be
also partially attributed to the final stage of the competition when many high-stake
(and many irrelevant too) matches take place. During this part of the season there is
no room for mistakes and the matches are played under higher pressure. This should
be taken into account when considering any possible influence of the differences in
the number of points awarded for a match. As far as the number of points for
a particular result is concerned, prior to 1995, two points for a win and one point for
a draw were officially awarded. This was then changed to allocating three points for
winning a match. The change was introduced by FIFA to promote a more offensive
play. The impact on the teams’ attitude and tactic after introducing the extra point
for a win has been studied in the literature. For example, Moschini (2010) and Dilger
and Geyer (2009) concluded that both the fraction of draws decreased and the number
of goals increased under the three-points-for-a-win system. There is some evidence
that introducing the new point allocation system changed the game process itself,
however, the conclusions are mixed (Hon and Parinduri, 2016). In case of league
formats, dividing points by two may result in analogous effects.
To investigate the influence of points division, we decided to compute the average
number of goals scored in a match and the fraction of draws for the Polish league
before and after a two-stage league format was introduced. Namely, from the 2013/14
8
Please cite this paper as: Lasek J., Gagolewski M., The efficacy of league formats in ranking teams,Statistical Modelling 18(5–6), 2018, pp. 411–435. doi:10.1177/1471082X18798426
season the league operates as a two-stage tournament which replaced the standard
2RR structure. For four seasons in which the new format is in force – from 2013/14
to 2016/17 – we found that the average number of goals scored in a match during
the first part of the season equals 2.668 and the fraction of draws equals 0.284. This
compares to 2.328 and 0.264 for four seasons in the past – from 2009/10 to 2012/13
– in which the Polish league operated as a 2RR tournament. Thus, the difference
in the average number of goals scored increased significantly (based on the Mann-
Whitney-Wilcoxon test, p-value < 0.0001). Moreover, the number of draws slightly
increased (but not significantly; test for equality of proportions, p-value = 0.331).
Note that the effect observed for the number of goals scored is opposite to what some
of the authors observed after the change introduced by FIFA. However, this may also
be possibly attributed to the overall increase in the level of play.
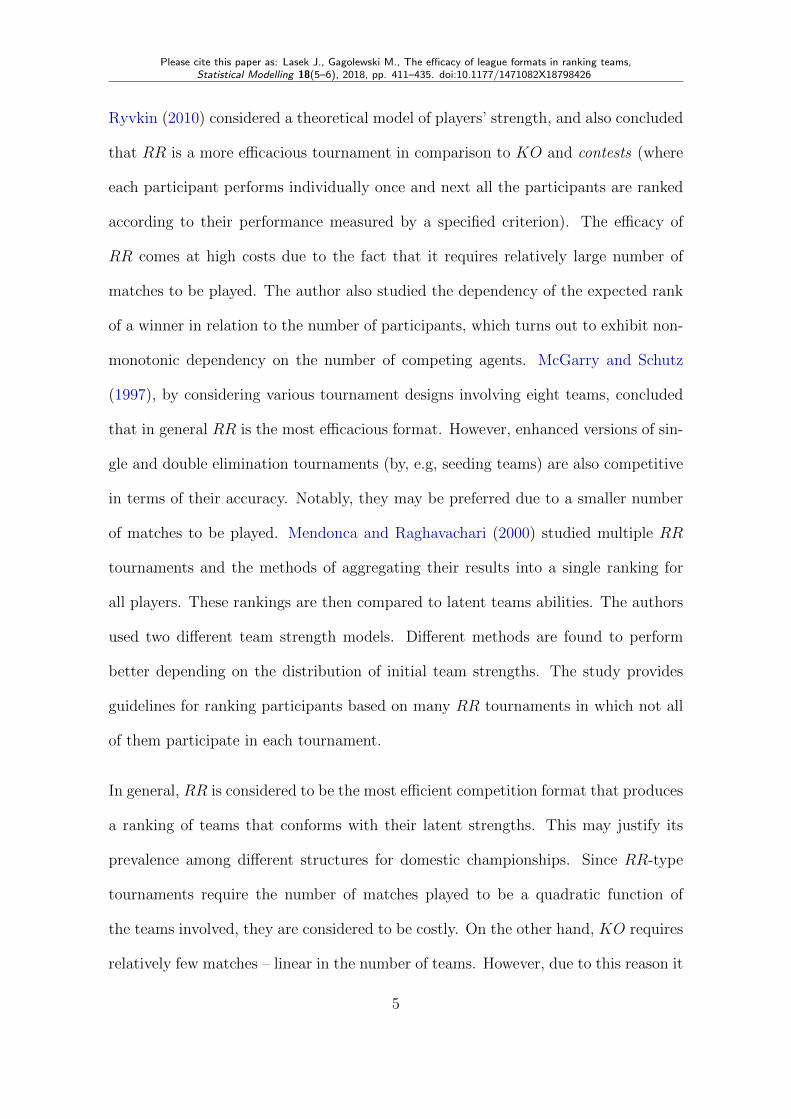
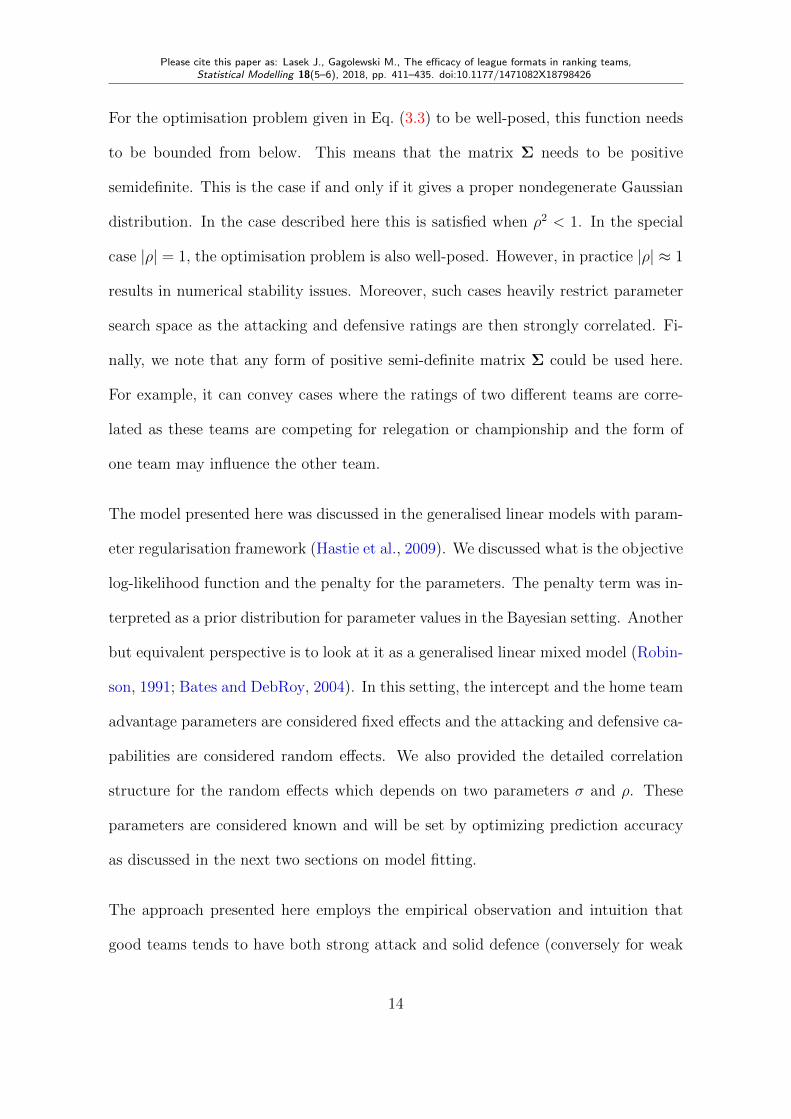
Another feature of a two-stage league format is that it has two major breakpoints –
prior to the table split and at the end of the competition. Undoubtedly, the interest of
supporters skyrockets during these parts of the season. For example, Fig. 1 presents
the match attendance for Polish league matches, averaged over the four seasons dis-
cussed in which it operates in a two-stage manner with the first stage finishing after
30 rounds of play. While the match attendance hits an all-season high at the end of
the league, it is also significantly higher at the first stage’s ending (see also Pawlowski
and Nalbantis, 2015, for a study of other factors influencing match attendance).
Yet another important factor in designing domestic leagues is the equality in the num-
ber of matches that teams play at home and away against one another. This is a rel-
evant aspect, since it is assumed that a team playing at its home stadium might
have some advantage over its opponent (Neave and Wolfson, 2003; Boyko et al.,
9

Please cite this paper as: Lasek J., Gagolewski M., The efficacy of league formats in ranking teams,Statistical Modelling 18(5–6), 2018, pp. 411–435. doi:10.1177/1471082X18798426
1 5 10 15 20 25 30 35
7000
8000
9000
10000
11000
Rounds
Atte
ndan
ce
Figure 1: Average attendance in the Polish league over seasons 2013/14 – 2016/17.
2007). The majority of league formats conform to this rule. However, for example in
the case of a 3RR tournament discussed above, this requirement cannot be satisfied
as the number of games each team plays one another is odd. Schedules balanced in
this sense are another feature of a league design.
3 Team strength modelling
In order to run the simulations, a method for generating league results is needed. A
model for sampling individual match results is its key building block. We shall focus
on rating based models, i.e., frameworks in which a team is described by a single or
a pair of parameters indicating its strength. Such models allow us to specify the true
ranking of teams based on their latent strength parameters as they are explicitly
given. In this section we recall the model in which a Poisson distribution is assumed
for the number of goals scored (the Poisson model for short). This model is quite
popular in the context of modelling and forecasting of football match outcomes (see,
e.g., Maher 1982; Dixon and Coles 1997; Crowder et al. 2002; Goddard 2005; Graham
and Stott 2008; Groll et al. 2015). There is also a wide array of other approaches
10

Please cite this paper as: Lasek J., Gagolewski M., The efficacy of league formats in ranking teams,Statistical Modelling 18(5–6), 2018, pp. 411–435. doi:10.1177/1471082X18798426
including Bassett (2007), McHale and Scarf (2011), Constantinou et al. (2012), Bosh-
nakov et al. (2017) or Groll et al. (2018). Here, as an alternative approach, we propose
extending the Poisson model with a correlation component for attacking and defensive
capabilities. The approach resembles the model proposed by Stenerud (2015) and is
based on the observation that a team’s attacking and defensive strengths are corre-
lated. The differences stem from implementation details. Stenerud (2015) sketched
the idea in a fully Bayesian approach to estimate parameters. Here, we propose
including the correlation structure in the regularisation component for model param-
eters and employing maximum likelihood for parameter estimation. Moreover, we
use Bayesian interpretation of the regularisation term to aid model analysis and we
evaluate the predictive power of the approach against a basic version of the Poisson
model.
3.1 Basic Poisson regression model
The Poisson model is based on the assumption that the number of goals scored by
the two teams in a match are random variables that follow a Poisson distribution.
Maher (1982) suggests modelling scores by the two teams competing in a match as
independent Poisson variables. This is one of the basic approaches for modelling
association football scores and it serves as a basis for more involved models (Dixon
and Coles, 1997; Rue and Salvesen, 2000; Crowder et al., 2002; Karlis and Ntzoufras,
2003; Groll and Abedieh, 2013; Koopman and Lit, 2015).
Let us introduce Maher’s model in more detail. Let Gi and Gj be random variables
that express the goals scored by home team i and away team j, in an encounter
between them. We assume that these random variables are independent and follow
11

Please cite this paper as: Lasek J., Gagolewski M., The efficacy of league formats in ranking teams,Statistical Modelling 18(5–6), 2018, pp. 411–435. doi:10.1177/1471082X18798426
the Poisson distributions with means λ and µ:
P(Gi = x,Gj = y|λ, µ) =λx
x!exp(−λ) · µ
y
y!exp(−µ).
When a log-linear model for the goal scoring rates is assumed, log(λ) = c+h+ai−dj
and log(µ) = c+ aj − di, where c is an intercept, ai, aj and di, dj stand for attacking
and defensive capabilities of teams i and j, respectively. Parameter h is introduced to
capture the advantage of the home team (see, e.g., Neave and Wolfson, 2003; Boyko
et al., 2007).
The model parameters are estimated by the maximum likelihood principle. We also
impose the parameter regularisation (Hoerl and Kennard, 1970; Schauberger et al.,
2018). Let r = (a,d) = (a1, a2, . . . , an, d1, d2, . . . , dn) be team rating parameters
and let us denote by L(r, h, c|M) the likelihood function of the results observed in
dataset M:
L(r, h, c|M) =∑m∈M
logP(g(m)i |r, h, c) + logP(g
(m)j |r, h, c)−
λ
2‖r‖22. (3.1)
We note that regularisation also enables to identify parameters. Finally, since this
approach takes into account the exact number of goals scored by the teams rather
than only the full-time three-way outcome, it can be expressed by:
P(Hij) = P(Fij > 0), P(Dij) = P(Fij = 0), P(Aij) = 1− P(Hij)− P(Dij) (3.2)
for the random variable Fij = Gi −Gj that follows a Skellam distribution.
3.2 Correlated Poisson regression model
We propose the following extension to the model given in Equation (3.1). As it
will be demonstrated below, the estimated parameter pairs for teams (ai, di) exhibit
12

Please cite this paper as: Lasek J., Gagolewski M., The efficacy of league formats in ranking teams,Statistical Modelling 18(5–6), 2018, pp. 411–435. doi:10.1177/1471082X18798426
positive correlation. We suggest extending the regularisation operator by a correlation
component and maximise the following function:
L(r, h, c|M) =∑m∈M
logP(g(m)i |r, h, c) + logP(g
(m)j |r, h, c)− λ
(‖r‖22
2− ρ 〈a,d〉
), (3.3)
where ρ ∈ [−1, 1] is a correlation parameter and 〈·, ·〉 denotes the inner product. Thus,
highly positively correlated attack and defence teams’ parameters reduce the penalty
component. Henceforth we refer to this model as the correlated Poisson model and
its counterpart given by Eq. (3.1) as the basic Poisson model.
In order to examine this model in greater detail, that is, investigate whether the opti-
misation problem given by maximizing the penalised log-likelihood function in Eq. (3.3)
is well-defined as well as to aid interpretation, we discuss the regularisation component
in the Bayesian setting. For simplicity, let us focus on the attacking and defensive
ratings (a, d) for a single team (we omit the subscripts not to clutter notation). By
exponentiating the penalty term, we obtain:
exp
(−λ ·
(1
2a2 +
1
2d2 − ρad
))= exp
(− 1
1− ρ2· a
2 + d2 − 2ρad
2σ2
)(3.4)
with σ2 = (λ(1− ρ2))−1
. This can be recognised as the (not normalised) bivariate
Gaussian density with mean 0, variance σ2 in both dimensions and correlation ρ
between them. In general, for all teams, the regularisation component for vector
r = (a,d) can be viewed as 2n-dimensional Gaussian distribution with mean 0 and
correlation matrix Σ = [Σij] ∈ R2n×2n, where Σij = σ2 for i = j, Σij = ρσ2 for
|i− j| = n, and Σij = 0 otherwise.
Let us now consider the penalty as a function of model parameters. For |ρ| 6= 1
the inverse Σ−1 exists and the penalty term can be rewritten as:
Fλ(a,d) = λ ·(
1
2‖r‖2
2 − ρ · 〈a,d〉)
=1
2· rΣ−1r>.
13
Please cite this paper as: Lasek J., Gagolewski M., The efficacy of league formats in ranking teams,Statistical Modelling 18(5–6), 2018, pp. 411–435. doi:10.1177/1471082X18798426
For the optimisation problem given in Eq. (3.3) to be well-posed, this function needs
to be bounded from below. This means that the matrix Σ needs to be positive
semidefinite. This is the case if and only if it gives a proper nondegenerate Gaussian
distribution. In the case described here this is satisfied when ρ2 < 1. In the special
case |ρ| = 1, the optimisation problem is also well-posed. However, in practice |ρ| ≈ 1
results in numerical stability issues. Moreover, such cases heavily restrict parameter
search space as the attacking and defensive ratings are then strongly correlated. Fi-
nally, we note that any form of positive semi-definite matrix Σ could be used here.
For example, it can convey cases where the ratings of two different teams are corre-
lated as these teams are competing for relegation or championship and the form of
one team may influence the other team.
The model presented here was discussed in the generalised linear models with param-
eter regularisation framework (Hastie et al., 2009). We discussed what is the objective
log-likelihood function and the penalty for the parameters. The penalty term was in-
terpreted as a prior distribution for parameter values in the Bayesian setting. Another
but equivalent perspective is to look at it as a generalised linear mixed model (Robin-
son, 1991; Bates and DebRoy, 2004). In this setting, the intercept and the home team
advantage parameters are considered fixed effects and the attacking and defensive ca-
pabilities are considered random effects. We also provided the detailed correlation
structure for the random effects which depends on two parameters σ and ρ. These
parameters are considered known and will be set by optimizing prediction accuracy
as discussed in the next two sections on model fitting.
The approach presented here employs the empirical observation and intuition that
good teams tends to have both strong attack and solid defence (conversely for weak
14

Please cite this paper as: Lasek J., Gagolewski M., The efficacy of league formats in ranking teams,Statistical Modelling 18(5–6), 2018, pp. 411–435. doi:10.1177/1471082X18798426
teams) and incorporates this in the model’s regularisation term. Along those lines,
an interesting model for rating chess players was proposed by Sismanis (2010). The au-
thor defined the regularisation component of the model in such a way that player rat-
ings are of similar magnitude to their opponents’ ratings. This stems from observation
that players tend to compete with other ones that are of similar strength.
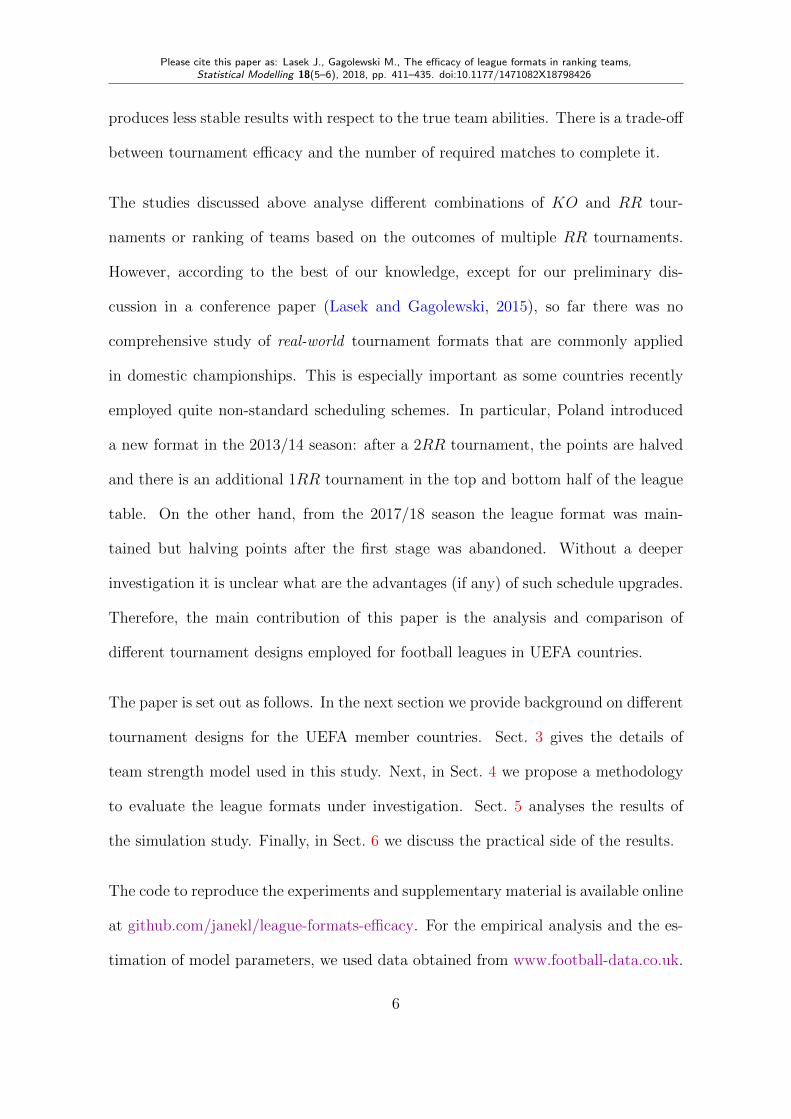
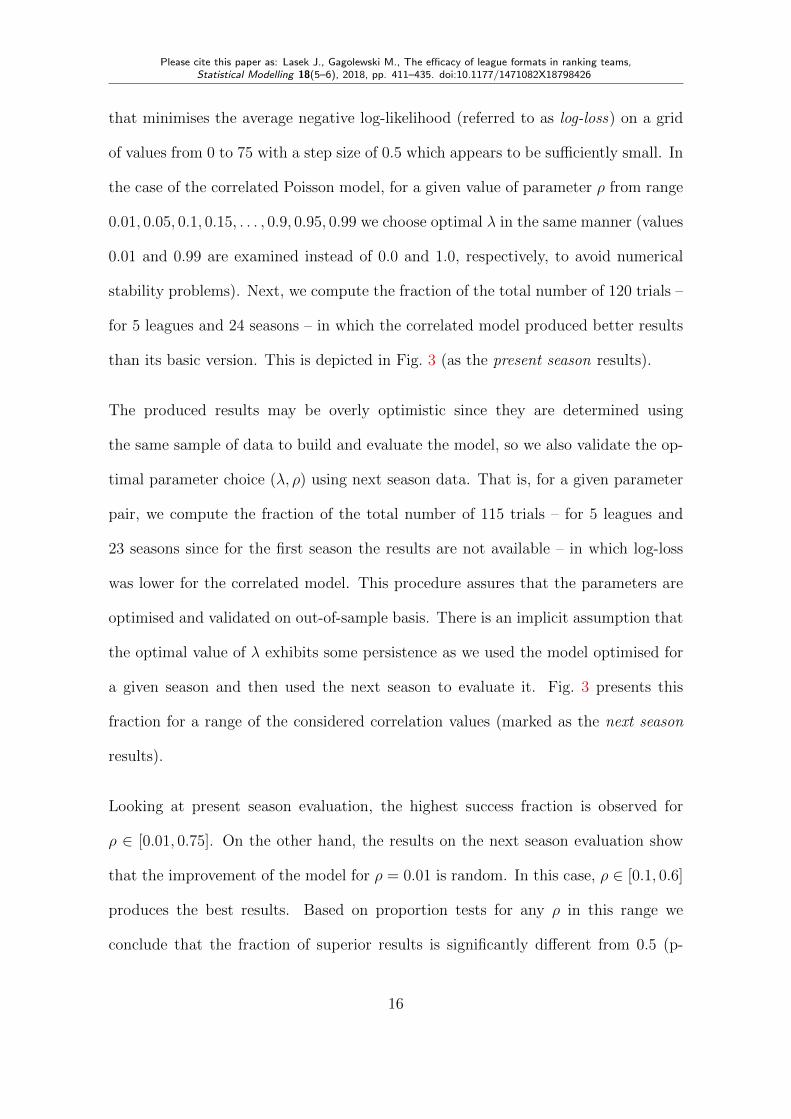
To evaluate the model we use 24 seasons’ data (from 1993/94 until 2016/17) for five
major European leagues – English, French, German, Italian and Spanish. First, we
observe that the parameter pairs (ai, di) exhibit positive correlation. Fig. 2 illustrates
the estimated pairs of coefficients for each team during each of the considered seasons
(a pair of rating per season per team) for the basic model given in Equation (3.1)
with a relatively small penalty parameter λ = 0.001 to ensure model identification.
The observation that the attacking and defensive ratings are positively correlated will
also be exploited when simulating team ratings in Sect. 3.5.
●
●
●
●
●
●
●
●
●
●
●
●
●
●
●●
●
●
●
●●
●
●
●
●
●
●
●
●
●
●
●
●
●
●
●
●
●
●●
●
●
●
●
●
●
●
●
●
●
●
●
●
●
●
●
●
●●
●
●
●
●
●
●●
●
●●
●●
●
●
●
●
●
●
●
●
●
●●
●●
●
●
●
●
●
●●
●
●
●
●
●●
●
●
●
●●●
●
●
●
●
●
●
●
●●
●
●
●
●
●●
●
●
●
●
●
●
●
●
●
●
●
●
●
●
●
●
●
●
●
●
●
●
●
●
●
●
●
●
●
●
●
●
● ●
●●
●
●
●
●
●
●●
●
●
●
●
●
●
●
●
●
●
●
●
●
●
●
●
●●
●●
●
●
●
●
●●
●
●
●
●
●●
●
●
●
●
●
●
●
● ●●
●
●
●
●
●
●
●
●
●
●
●
●
●
●
●
●
●
●
●
●
●
●
●
●
●●
●
●
●
●
●
●
●
●
●
●
●
●
●
●
●
●
●
●
●●
●
●
●
●
●
●
●
●
●
●
●
●
●●
●
●
●
●●
●
●
●
●
●
●
●
●
●
●
●
● ●
● ● ●
●
●
●
●
●
●
●
●
●
●
●
●
●
●
●
●
●
●
●●
●
●
●
●
●
●
●
●
●
●
●
●
●●●
●
●
●
●●
●
●
●
●
●
●
●
●
●
●
●
●
●
●
●
●
●
●
●
●
●
●●
●
●
●
●
●
●●
●
●
●
●
●
●
●●
●
●
●●
●●
●
●
●
●
●
●
●
●●
●
●
●
●
●
●
●
●
●
●●
●
●
●
●
●
●●
●
●
●
●
●
●
●
●
●
●
●
●
●
●
●
●
● ●
●
●
●●
●
●
●
●
●
●
●
●
●
●
●
●●●
●
●
●
●
●
●
●
●
●
●
●
●
●
●
●
●
●
●
●
●
●
●
●
●●
●
●
●
●
●
●
●
●
●
●
●
●
●
●
●
●
●
●
●
●
●
●
●●
●
●
●
●
●
●
●
●
●
●
●
●
●
●
●
●
●●
●
●
●
●
●
●
●
●
●
●
●●
●●
●
●
●
●
●
●
●
●
●
●
●
●
●
●
●●
●
●
●
●
●
●
●
●
●●●
●
●
●
●
●
●
●
●
●
●
●
●
●
●
●
●
●●
●
●
●
●
●
●
●●
●
●
●●
●
●
●
●
●●
●
●●
●
●
●
● ●●
●
●
●
●
●
●
●
●
●
●
●●
●
●
●
●
● ●●
●
●●
●
●
●
●
●
●●
●
●
●
●●
●●
●
●
●
●
●
●
●
●
●
●
●●
●
●
●
●
●
●
●
●
●●
●
●
●
●
●
●
●
●
●
●●
●
●
●
●
●
●●
●
●●
●
●
●
●
●
●
●
●
●
●
●
●
●
●
●
●●
●
●
●
●
●
●
●
●
●
●
●
●
●
●●
●●
●
●
●
●
●
●
●
●
●
●
●
●●
●
●
●●
●
●
●
●●
●●
●
●
●●
●
●
●
●
●
●
●
●●
●
●
●
●●
●
●
●●
●
●
●
●
●
●
●
●
●
●
●
●
●
●
●
●
●
●
●
●
●
●
●●
● ●●
●
●
●●
● ●
●
●
●
●
●
●
●
●
●●
●
●
●
●
●
●
●
●
●
●
●●●
●
●●
●
●
●
●
●
●
●
●
●
●
●
●
●
●●●
●
●
●
●
●●●
●
●●
●
●
●
●
●
●
●
●
●
●
●
●
●
●
●
●
●
●
●●
●●
●
●
●
●●
●
●
●
●
●
●
●
●
●
●
●
●
●
●●
●
●
●
●
●
●
●
●
●
●
●
●
●
●
●
●●
●
●
●
●
●
●
●
●●
●
●
●
●
●
●
●
●
●
●
●●
●
●
●
●
●
●
●
●
●
●
●
●
●
●
●●
●
●
●●
●
●●
●
●
●
●
●
●
●
●
●
●
●
●
●
●
●
●
●
●
●
●
● ●●
●
●●
●
●
●
●
●
●
●
●
●
●
●
●
●
●
●
●
●
●
●
●
●
●
●
●
●
●
●
●
●●
●
●
●
●
●
●
●
●
●
●
●
●
●
●
●
●
●
●
●
●
●
●
●
●
●
●
●
●
●
●
●●
●
●
●
●
●
●
●
●
●
●
●
●
●
●●
●
●
●
●
●
●
●
●
●
●
●
●
●
●
●
●
●
●
●
●
●
●
●
●
●
●●
●
●
●
●
●
●
●
●
●
●
●
●
●
●
●
●
●
●
●
●
●
●
●
●
●
●
●
●
●●
●
●
●
●
●
●
●
●
●
●
●
●
●
●
●
●
●
●
●
●
●
●
● ●
●
●
●
●
●
●
●
●
●
●●
●
●
●
●
● ●
●
●
●●
●
●
●
●
●
●
●
●●
●
●
●
●
●
●
●
●
●
●
●
●
●
●
●
●
●
●
●
●
●
●
●
●
●
●
●
●
●
●
●
●
●●
●
●
●
●●
●
● ●
●
●
●
●●
●
●
●
●
●
●
●
●
●
● ●
●
●
●
●
●
●●
●
●
●
●
●
●
●
●
●
●
●
●
●●
●
● ●●
●
●
●●
●
●
●
●
●
●
●
●
●
●
●
●
●
●
●
●
●
●
●
●
●
●
●
●
●
● ●
●
●
●
●
●
●●
●
●●
●
●
●
●●
●
●●
●
●
●
●
●
●
●
●
●
●
●
●
●
●
●
●●
●●
●
●
●
●
●
●
●
●
●
●
●
●
●
●
●
●
●
●
●
●
●
●
●
●
●
●
●
●
●
●
●
●
●
●
●
●●
●
●
●
●
●
●
●
●
●
●
●
●
●
●
●
●
●
●
●
●
●
●
●
●
●
●
●
●●
●
●●
●
●
●●
●
●
●● ●
●●
●
●
● ●●
●
●●
●
●
●
●
●
●
●
●
●
●
●
●
● ●
●
●
●
●
●
●
●
●
●●
●
● ●
●●
●
●
●
●
●
●
●
●
●●
●
●
●
●
●
●
●
●
●
●
●
●
●
●
●
●
●
●●
●
●
●
●
●
●●
●
●
●
●
● ●
●
●
●
●
●
●
●
●
●
●●
●
●
●
●
●
●
●
●
●
●
●
●
●
●
●
●
●
●
●
●
●
●●●
●●
●●
●
●
●
●●
●
●
●
●
●
●
●
●
●
● ●
●
●
●
●
●
●
●
●
●
●
●
●
●
●
●
●
●
●●
●●
●
●●
●
●
●
●
●
●
●●
●
●
●
●
●
●
● ●
●●
●
●
●
●
●
●
●
●
●
●
●
●
●
●
●
●
●
●
●
●
●
●
●
●
●●
●
●
●
●
●
●●
●
●
●
●●
●
●
●
●
●
●
●
●
●
●
●
●
●
●
●●
●
●
●
●
●
●
●
●
●
●
●
●
●
●
●
●
●●
●
●
●
●
●
●
●
●
●
●
●
●
●
●
●
●
●
●●
● ●●
●
●
●
●
●
●
●
●
●
●
●
●
●
●
●●
●
●
●
●
●●●
●●
●
●
●
●
●
●
●
●●
●
●
●
●●
●
●
●
●
●
●
●
●
●
●
●
●
●
●
●
●●
●
●●
●● ●●●
●
●
●
●
●
●
●
●
●
●
●
●
●
●●●
●
●
●
●●
●
●
●
●
●
●
●
●●
●●
●
●
●
●
●
●
●
●
●
●
●
●
●
●
●
●
●
●
●
●●
●
●
●
●
●
●
●
●
●
●
●
●
●
●
●
●
●
●
●
●
●
●
●
●
●
●
●●●
●
●
●
●●
●
●
●
●
●
●
●
●
●
●
●
●
●
●
●
●
●
●
●
●
●
●
●
●
●
●
●
●
●
●
●
●●
●
●
●
●
●
●
●
●
●
●
●
●
●
●
●
●
●
●
●
●
●
●
●
●●
● ●
●
● ●
●●
●
●
●
●
●
●
●
●
●
●
●
●
●
●
●
●
●
●
●
●
●
●
●
●
●
●
●
●
●
●
●
●
●
●
●
●
●●
●
●
●
●
●
●●
●
●
●
●
●
●
●
●
●
●
●
●
●
●
●
●
●●
●
●
●
●
●●
●
●
●
●
●
●
●●
●●
●
●
●
●
●
●
●
●
●
●
●
●
●
●
●
●
●
●
●●
●
●
●
●
●
●
●
●
●
●
●
●
●
●
●
●
●
●●
●●
●
●
●
●
●
●
●● ●
●
●●
● ●
●
●
●
●
●
●
●
●
●
●
●
●
●
●
●
●
●
●
●
●
●
●
●
●
●
●
●
●
●
●
●●
●
●
●
●
●
●
●
●●
●
●
●
●
●
●
●
●
●
●
●
●●
●
●
●
●
●
●
●
●
●
●
●
●
●
●
●
●
●
●● ●
●
●
●
●●
●
●
●
●●
●
●
●
●
●
●●
●●
●
● ●
●●
●
●
●
●
●
●
●
●
●
●
●
●
●
●
●
●
●
●
●
●
●
●
●
●
●
●
●
●
●
●
●
●● ●
●
●
●
●
●●
●●
●
●
●
●
●
●
●
●
●
●
●
●
● ●
●
●
●
●
●
●
●●
●
●
●●
●
●
●
●
●
●
●●
●
●
●
●● ●
●●
●
●
●●
●
●
●
●
●●
●
●●
●
●
●●
●
●
●
●
●
●
●
●
●
●
●●
●●
●
●
●●
●
●
●
●
●
●
●
●
●
●
●
●
●
●
●●
●
●
●
● ●
●
●
●
●
●
●
●
●
●
●
●
●
●
●
●
●
●
●
●
●
●●
●●
●
●
●
●
●
●
●
●
●
●
●
●
●
●
●
●
●
●
●
●●
●
●
●
●
●
●
●
●
●
●
●
●
●
●●
●
●●
●
●
●
●●
●
●
●
●
●
●
● ●
●
●
●
●
●●
●
●
●
● ●
●
●
●
●
●
●
●
y
−1.0 −0.5 0.0 0.5 1.0
−0.5
0.0
0.5
1.0
Attack
Def
ence
Figure 2: Attacking against defensivecapabilities for a group of teams witha linear trend line. Correlation be-tween the two ratings is ca. 0.467.
●
●
●
● ● ●
●
●
●
●
● ● ●
● ●
●
●
●
●
●
●
0.0 0.2 0.4 0.6 0.8 1.0
0.50
0.55
0.60
0.65
Correlation
Suc
cess
frac
tion
● Next seasonPresent season
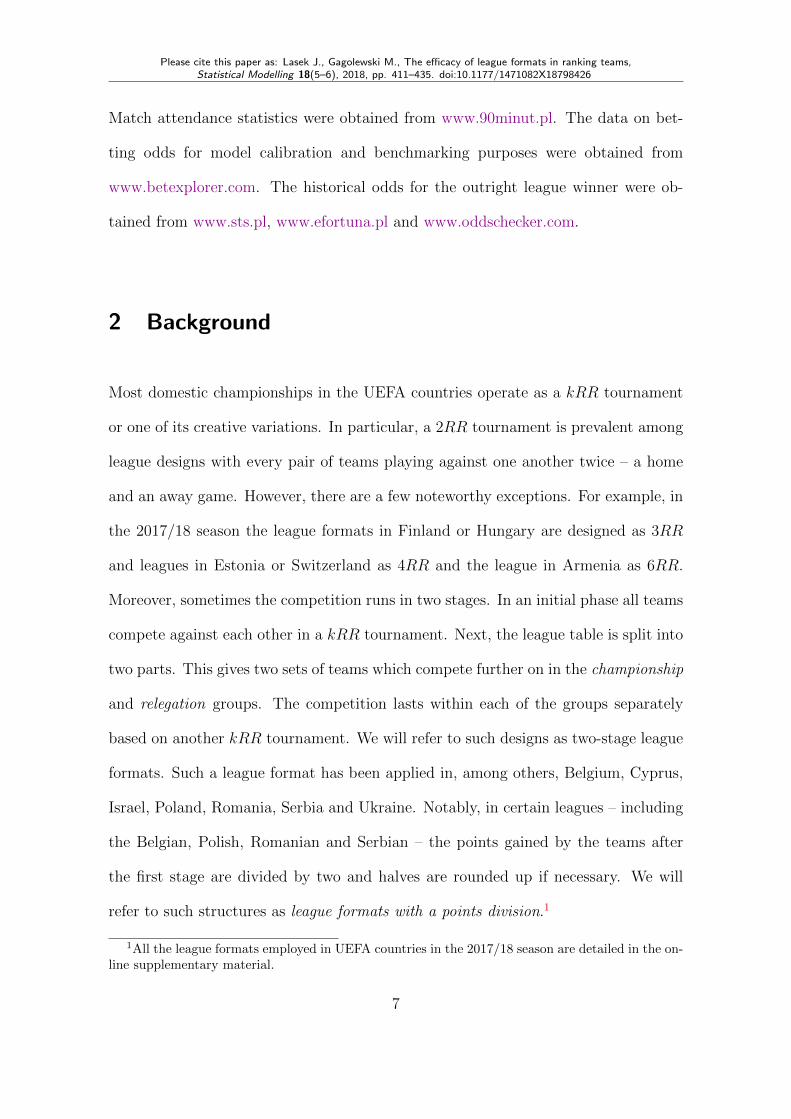
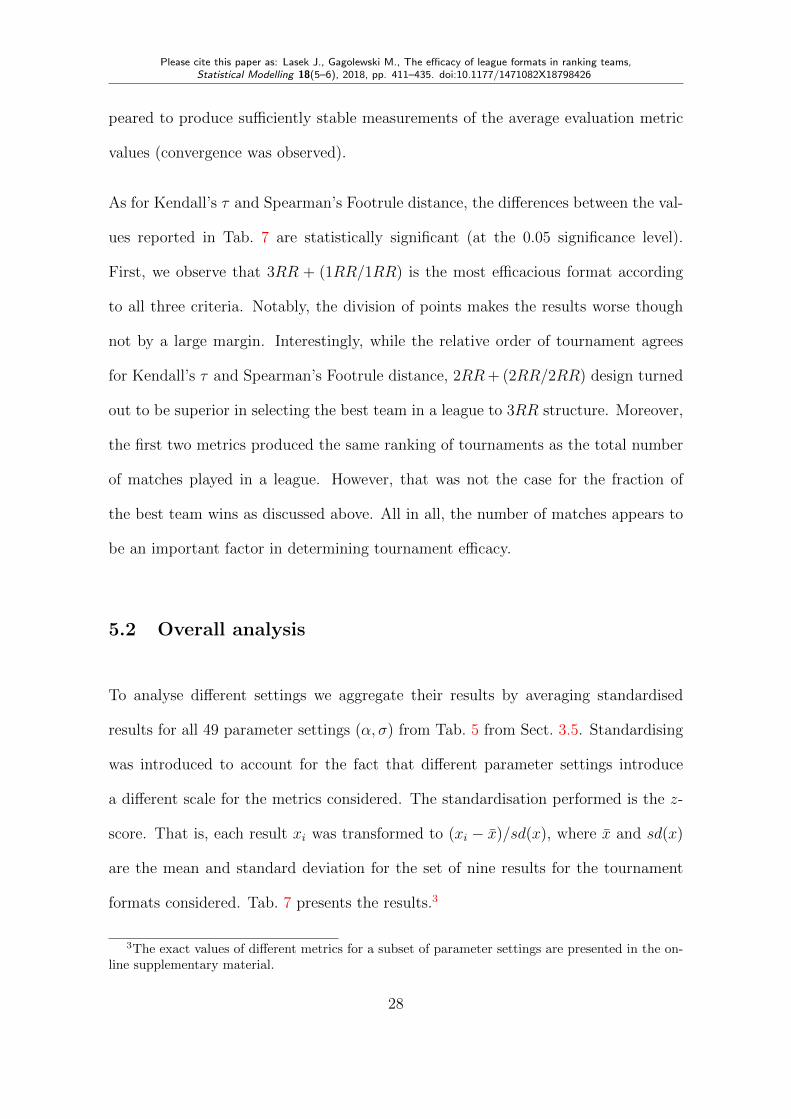
Figure 3: Fraction of test set sea-sons evaluation in which the corre-lated Poisson model achieves lower er-ror rate than the basic model.
In order to verify the usefulness of the model for prediction we propose the following
evaluation procedure. In case of the basic Poisson model, for a given season, we
generate predictions (as detailed in Sect. 3.3) and choose the optimal parameter λ
15
Please cite this paper as: Lasek J., Gagolewski M., The efficacy of league formats in ranking teams,Statistical Modelling 18(5–6), 2018, pp. 411–435. doi:10.1177/1471082X18798426
that minimises the average negative log-likelihood (referred to as log-loss) on a grid
of values from 0 to 75 with a step size of 0.5 which appears to be sufficiently small. In
the case of the correlated Poisson model, for a given value of parameter ρ from range
0.01, 0.05, 0.1, 0.15, . . . , 0.9, 0.95, 0.99 we choose optimal λ in the same manner (values
0.01 and 0.99 are examined instead of 0.0 and 1.0, respectively, to avoid numerical
stability problems). Next, we compute the fraction of the total number of 120 trials –
for 5 leagues and 24 seasons – in which the correlated model produced better results
than its basic version. This is depicted in Fig. 3 (as the present season results).
The produced results may be overly optimistic since they are determined using
the same sample of data to build and evaluate the model, so we also validate the op-
timal parameter choice (λ, ρ) using next season data. That is, for a given parameter
pair, we compute the fraction of the total number of 115 trials – for 5 leagues and
23 seasons since for the first season the results are not available – in which log-loss
was lower for the correlated model. This procedure assures that the parameters are
optimised and validated on out-of-sample basis. There is an implicit assumption that
the optimal value of λ exhibits some persistence as we used the model optimised for
a given season and then used the next season to evaluate it. Fig. 3 presents this
fraction for a range of the considered correlation values (marked as the next season
results).
Looking at present season evaluation, the highest success fraction is observed for
ρ ∈ [0.01, 0.75]. On the other hand, the results on the next season evaluation show
that the improvement of the model for ρ = 0.01 is random. In this case, ρ ∈ [0.1, 0.6]
produces the best results. Based on proportion tests for any ρ in this range we
conclude that the fraction of superior results is significantly different from 0.5 (p-
16

Please cite this paper as: Lasek J., Gagolewski M., The efficacy of league formats in ranking teams,Statistical Modelling 18(5–6), 2018, pp. 411–435. doi:10.1177/1471082X18798426
values < 0.01) which would be expected under no effect (as in the case of ρ =
0.01). The best results are observed for ρ equal 0.1 or 0.3 and are equal 67%. We
also observe that increasing the parameter ρ decreases the overall success rate, that
is, the fraction of seasons in which the log-loss improved. In fact, the correlation
values greater than 0.95 produce inferior results to the basic model. Finally, we
remark that the median and average improvement in log-loss over the 115 tests are
equal 0.0005 and 0.0003, respectively. While this is a modest improvement, however,
based on the analysis above we conclude that the correlated Poisson model provides
a significant improvement over its basic version for correlation values in the range
ρ ∈ [0.1, 0.6] and over 60% success rate is observed for those values.
3.3 Fitting model to data
3.3.1 Actual parameters setting. In this part discusses how parameters (c, h, λ)
are set in the simulation. The team abilities are estimated as well but their applica-
tion in the simulation is discussed later in Sect. 3.4. The choice of the regularisation
parameter λ is driven by minimising prediction error for future game outcomes. To
determine this parameter, we employ the following procedure. For a given league
and a given season, the predictions are performed in a sliding window manner. More
precisely, starting from round k – accounting for approximately 40% of all matches in
a given season – the model is estimated and the predictions are generated for round
k+ 1. Next, the model is estimated again using first k+ 1 rounds and the predictions
are generated for round k + 2 until the predictions are generated for all rounds from
the validation sample (accounting for about 60% of all matches). Again, the pre-
dictions are evaluated using log-loss. The model was estimated for three different
17

Please cite this paper as: Lasek J., Gagolewski M., The efficacy of league formats in ranking teams,Statistical Modelling 18(5–6), 2018, pp. 411–435. doi:10.1177/1471082X18798426
leagues – the German, Polish and Scottish – for the 2015/16 season. Tab. 1 presents
the computed parameters. Each entry in the table presents an optimal parameter
triple (c, h, λ). The regularisation parameter was found by using grid search and the
correlation is set to ρ = 0.45 which roughly equals to the correlation observed in
historical data as discussed in the previous section (see Fig. 2). Finally, parameters
(c, h) were set to their estimates obtained on the sample of all matches in a given
season.
Table 1: Optimal parameter values (c, h, λ) for different leagues in the 2015/16 season.
Germany Poland ScotlandPoisson (ρ = 0.45) (0.085, 0.371, 14.5) (0.063, 0.37, 27.5) (0.124, 0.196, 13)
To set the parameters (c, h) in the simulation, we averaged their values across the three
leagues which results in (0.091, 0.312). This means that for equally rated teams
the prediction determined by Eq. (3.2) yields (0.464, 0.258, 0.277). Tab. 2 compares
these results with the overall empirical frequency of these particular events in the three
leagues considered. As expected, we observe that prediction for equally rated teams
roughly corresponds to the frequency of particular results.
Table 2: Frequency of the home team win (H), draw (D) and the away team win (A)events in the 2016/17 season in the three leagues considered.
(H,D,A) (H,D,A)Germany (0.490, 0.242, 0.268) Scotland (0.412, 0.254, 0.333)
Poland (0.449, 0.253, 0.297) Overall (0.454, 0.249, 0.296)
3.3.2 Model diagnostic. We perform a model diagnostic by investigating the pre-
dictive power. Given the optimised parameter value λ for the 2015/16 season, the pre-
dictions are generated in a sliding window manner as described in the previous section
using a different sample of matches from the next 2016/17 season. Thus, the number
18

Please cite this paper as: Lasek J., Gagolewski M., The efficacy of league formats in ranking teams,Statistical Modelling 18(5–6), 2018, pp. 411–435. doi:10.1177/1471082X18798426
of matches used for evaluation accounts for approximately 60% of all matches for
these leagues in the 2016/17 season. The first 40% of matches are used to obtain
initial team strength estimates for a given season and for these matches predictions
are not generated. The model performance is presented in Tab. 3 for both log-loss
and accuracy, that is, the fraction of correctly predicted results (to aid interpreta-
tion). For reference, the results are compared to the benchmark forecasts derived
from bookmaker odds. For a baseline random model, which assigns probability of 13
to each possible outcome, log-loss and accuracy would be log 13≈ 1.099 and 33.3%,
respectively. In the case of the German league, the prediction results are compara-
ble to that of the average bookmaker odds. Overall, the model produces relatively
accurate predictions bearing in mind its simplicity.
Table 3: Performance of the methods for the 2016/2017 season.
ModelGermany Poland Scotland
Log-loss Acc. Log-loss Acc. Log-loss Acc.Poisson 1.010 49.4% 1.023 51.7% 0.944 55.9%
Bookmaker odds 1.000 53.3% 0.980 53.4% 0.912 55.9%
3.4 Team strength distribution
To run league simulations, we need to start with team ratings that enable to sample
match results. To assign teams’ strengths (ratings) parameters we use Bayesian in-
terpretation of the penalty (regularisation) component in the log-likelihood function
in Eq. (3.3). For the correlated Poisson model we have σ2 = (λ(1− ρ2))−1
as shown
in Eq. (3.4). We use this relation and sample initial team ratings independently for
each team from a bivariate normal distribution with mean zero and correlation struc-
ture as discussed in Sect. 3.2. Using values reported in Tab. 1 we find that – for
the German, Polish and Scottish league, respectively – optimal values for parameter
19

Please cite this paper as: Lasek J., Gagolewski M., The efficacy of league formats in ranking teams,Statistical Modelling 18(5–6), 2018, pp. 411–435. doi:10.1177/1471082X18798426
σ are 0.294, 0.214, and 0.311. In the simulations, parameter σ is varied on a grid
of points 0.1, 0.15, 0.2, . . . , 0.4. This extends the range of parameter values obtained
when tuning the model.
We may also refer to the parameter λ as an alternative measure of competitive balance
of teams in a league (Koning, 2000). The higher the value of the parameter, the tighter
competition within a league (and in turn the results become less predictable). On
the other hand, lower values of λ push toward higher discrepancy in teams’ strengths.
In Sect. 3.3 we indicated that the optimal regularisation parameter λ is higher for
the Polish league than in the other two leagues studied. This may indicate that
the competition is more balanced in the Polish league.
3.5 Towards a dynamic model
The model presented in the previous section is static in the sense that a team’s
shape does not change throughout the season at all. Various dynamic models for
team strength evolution have been proposed in the literature. In order to extend
our set-up we adopt the model considered by, for example, Glickman (2001) in which
a team’s shape parameter varies according to a random walk. Other studies con-
sidering dynamic models were, for example, the time-varying Poisson model by Rue
and Salvesen (2000) or ratings modelled by exponential weighted moving average
processes by Cattelan et al. (2013). Such dynamic models are more realistic as they
allow the team strength to vary during the season due to, for example, player injuries
or form breakdown.
In the Poisson model, in the consecutive rounds of play, for each team the attack-
ing and defensive ratings are updated by adding to them a sample from a bivariate
20

Please cite this paper as: Lasek J., Gagolewski M., The efficacy of league formats in ranking teams,Statistical Modelling 18(5–6), 2018, pp. 411–435. doi:10.1177/1471082X18798426
Gaussian distribution with mean zero, standard deviation σi (a team-specific drift pa-
rameter) and correlation ρ = 0.45. More precisely, in round k, a(k)i = a
(k−1)i + ε
(k−1)i =
a(1)i +
∑k−1j=1 ε
(j)i , where the rating in the first round a
(1)i is set as discussed in Sect. 3.4
and where the updates ε(j)i are sampled from a Gaussian distribution N (0, σ2
i ) (anal-
ogously for the defensive rating with correlated updates). We assume that the rating
updates are independent over the rounds and teams. This means that a random
walk model is assumed for the team strength evolution throughout the season (see,
e.g., Glickman, 2001 and Rue and Salvesen, 2000). The question is how to set pa-
rameter σi. First, let us focus on the overall season drift σi for the ratings. It is
sampled from the inverse Gamma distribution Γ−1(α, 1) with the density function
g(x|α, 1) = x−α−1
Γ(α)· exp
(− 1x
)· 1(x > 0), where α > 0 is a shape parameter and 1(E)
is the indicator function equal to one if a predicate E is satisfied and zero other-
wise. Based on the properties of this distribution, the higher the shape parameter
α, the lower the variation of team strength. In the special case α =∞, we arrive at
the static model in which a team’s shape remains constant throughout the season.
Once the overall season drift σi is chosen, it should be distributed over the rounds
of play to obtain σi. We consider two cases. First, we employ constant drift across
all league formats. That is, for team i, we assume that its strength changes in ev-
ery round by σi = 1√K−1
σi where K is the number of rounds played in a particular
league format. Using a(K)i = a
(1)i +
∑K−1j=1 ε
(j)i it follows that the rating at the end
of the season is normally distributed a(K)i |a
(1)i ∼ N (a
(1)i , σ2
i ) as a sum of independent
Gaussian variables. As a(1)i is a normally distributed random variable itself (inde-
pendent of all the updates) it also holds that a(K)i ∼ N (0, σ2 + σ2
i ). Second, to
allow to model a larger variation in team strength for the league formats involving
a higher number of rounds, we assume that for each league format the drift rate is
21

Please cite this paper as: Lasek J., Gagolewski M., The efficacy of league formats in ranking teams,Statistical Modelling 18(5–6), 2018, pp. 411–435. doi:10.1177/1471082X18798426
σi = 1√Kmed−1
σi, where Kmed = 35 is the median length of the season measured by
the number of rounds according to Tab. 6. Thus, a(K)i |a
(1)i ∼ N (a
(1)i , K−1
Kmed−1σ2i ) and
a(K)i ∼ N (0, σ2 + K−1
Kmed−1σ2i ). This way, the league formats with more rounds are going
to produce higher variation in team strength in the end of the season.
A question that arises now is how to choose α for sampling the teams’ overall drift
distribution σi. The lower the value of this parameter, the higher is the variation of
team strength at the end of a league in comparison to its prior ratings. To set it,
we look at Kendall’s τ correlation coefficient (see Sect. 4.2) between the probability
of becoming champion before the start of the season derived from bookmaker odds
and final league rankings for three league seasons: 2013/14, 2014/15 and 2015/16.
The correlation values are given in Tab. 4.
Table 4: Kendall’s τ correlation between probability of outright winner derived frombookmaker odds and final league position.
Germany Poland Scotland2013/14 0.499 0.333 0.7882014/15 0.569 0.700 0.3642015/16 0.464 0.346 0.515
These values serve as a proxy for the change of the prior and end distribution of
an overall team’s strength defined as the sum of its attacking and defensive rating.
The parameter α is varied on the geometric scale: 10, 20, 50, 100, 200, 500. Moreover,
the special case α = ∞ is considered. This produces the following correlations for
a grid of parameter values presented in Tab. 5. It also includes prior team strength
distribution σ discussed in the previous section. The table was produced by sampling
10,000 values for every parameter combination for the prior and final ratings for
a given season.
Naturally, the correlation approaches one as α → ∞. On the other hand, for lower
22

Please cite this paper as: Lasek J., Gagolewski M., The efficacy of league formats in ranking teams,Statistical Modelling 18(5–6), 2018, pp. 411–435. doi:10.1177/1471082X18798426
Table 5: Kendall’s τ correlation coefficient between the initial and the final teamstrength for different parameter settings (α, σ).
0.1 0.15 0.2 0.25 0.3 0.35 0.410 0.082 0.120 0.163 0.199 0.239 0.268 0.30320 0.169 0.245 0.315 0.376 0.431 0.477 0.51950 0.384 0.509 0.599 0.666 0.712 0.749 0.778100 0.602 0.715 0.779 0.821 0.849 0.871 0.887200 0.781 0.852 0.888 0.909 0.924 0.935 0.944500 0.909 0.940 0.954 0.964 0.970 0.974 0.977∞ 1.000 1.000 1.000 1.000 1.000 1.000 1.000
values of this parameter we observe a small correlation between the initial and end
team strength. However, based on the reported correlation of bookmaker odds and
final league ratings, this parameter is relevant in practice. For example, the estimated
correlation of 0.431 for a parameter pair (α, σ) = (20, 0.3) is close to 0.499 which is
the median empirical correlation given in Tab. 4. In this case, the prior team strength
drift is roughly equal to 0.294 and 0.311 which are the optimal values of this parameter
for German and Scottish leagues for the 2016/17 season (see Sect. 3.4).
1 5 10 15 20 25 30 35Rounds
Rat
ings
1 5 10 15 20 25 30 35Rounds
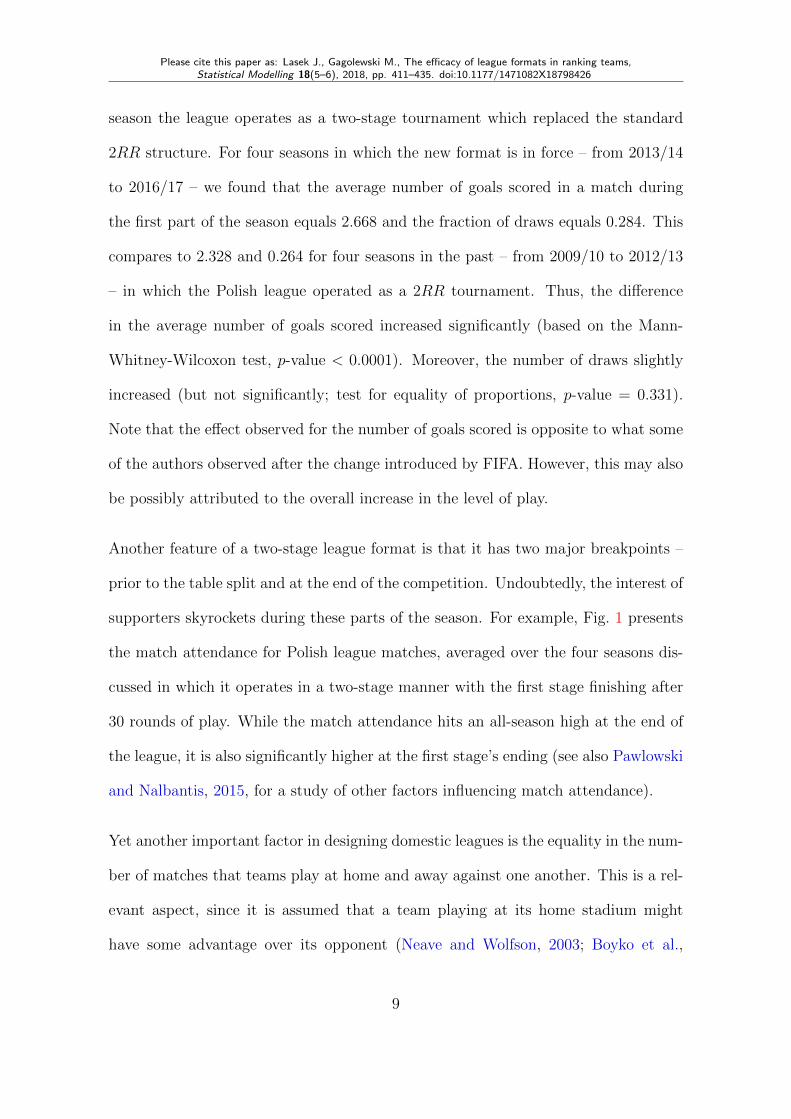
Figure 4: Difference in simulation for the correlated (left) and uncorrelated (right)attacking and defensive ratings for a single team throughout a 35-rounds season.
Finally, Fig. 4 exposes the benefits of using correlated Poisson model over the basic
version. In consecutive rounds, the ratings are sampled from correlated Gaussian
distribution rather than independent one. This enables to maintain rather than fade
away the prior correlation between them.
23

Please cite this paper as: Lasek J., Gagolewski M., The efficacy of league formats in ranking teams,Statistical Modelling 18(5–6), 2018, pp. 411–435. doi:10.1177/1471082X18798426
4 Experiment set-up
4.1 League formats
One of the parameters of a league format is the number of teams involved. Here we
decided to study the league designs that involve either 12 or 16 teams – such settings
cover almost half of the UEFA countries.
Tab. 6 presents nine league designs chosen in our comparative study. In addition to
kRR tournaments (k = 1, 2, 3), it contains two-stage designs. For example, 2RR +
(1RR/1RR) denotes a league design in which the first round comprises 2RR after
which the league table is split into two groups. The brackets indicate that there is
an extra 1RR played in each of the groups after the table split. Prefix “12” denotes
possible division of points by two after the first round. Additionally, each tournament
format is described by the total number of rounds and matches it requires to be
played. The league formats given in Tab. 6 are the most popular league designs
overall. They account for about 70% of all league formats employed in the countries
considered. The rows of the table are sorted according to the number of matches
played in a given league design.
Let us move on to implementation details. First of all, the algorithm for generating a
1RR tournament schedule given in de Werra (1981) was used. Moreover, for breaking
possible ties in ranks in the end of the season, head-to-head match results between
tied teams were used (considering only win-draw-loss result, without referring to
the exact number of goals scored). This is one of the possible methods employed as
a first choice rule for tie breaking, for example, in Montenegro, Poland (first round
24

Please cite this paper as: Lasek J., Gagolewski M., The efficacy of league formats in ranking teams,Statistical Modelling 18(5–6), 2018, pp. 411–435. doi:10.1177/1471082X18798426
Table 6: League formats under investigation; “rounds” and “matches” denote the to-tal number of rounds and matches in a league with 12 or 16 teams, respectively.
FormatFormat Rounds Matchesshort 12 16 12 16
12· 3RR + (1RR/1RR) a1 38 52 228 416
12· 3RR + (1RR/1RR) a2 38 52 228 416
3RR b 33 45 198 36012· 2RR + (2RR/2RR) c1 32 44 192 352
12· 2RR + (2RR/2RR) c2 32 44 192 352
12· 2RR + (1RR/1RR) d1 27 37 162 296
12· 2RR + (1RR/1RR) d2 27 37 162 296
2RR e 22 30 132 2401RR f 11 15 66 120
results), Romania (second round results), Slovakia or Spain. If the teams are still tied
after considering mutual match results, ties are resolved randomly. Finally, we note
that in the case of two stage league formats and RR tournaments with odd number of
rounds in the second stage, teams play an uneven number of home and away matches
against one another. This is the case for 2RR+ (1RR/1RR) and 3RR+ (1RR/1RR)
formats (and their variations by points division after the first stage) for the pairs of
teams which compete against each other only during the second and the first stage,
respectively. To obtain a match schedule for the second stage for the former format we
follow the rules that have been applied in the Polish league since the 2013/14 season
(i.e., when a two-stage league format was introduced).2 In case of the latter format,
after three rounds of matches in the first stage, the fourth match in the second stage
was set so that the teams play each other two matches home and away in total.
2The on-line supplementary material gives the details of the schedule in case of 12 and 16 teams.
25

Please cite this paper as: Lasek J., Gagolewski M., The efficacy of league formats in ranking teams,Statistical Modelling 18(5–6), 2018, pp. 411–435. doi:10.1177/1471082X18798426
4.2 Definition of a team’s strength and evaluation methods
With varying teams’ strength parameters there is a need for an aggregation procedure
for the overall season strength zi in order to be able to compare it with the final league
standings. We suggest that the team ratings are averaged throughout the season,
zi = 1K
∑Kk=1 a
(k)i + d
(k)i . That is, the overall team strength is taken to be the sum of
its attacking and defensive capabilities. We also investigated an aggregation scheme
based on the median team strength. However, we noted that the obtained results
were virtually identical with the same qualitative conclusions applying to them.
To evaluate the results, the true team ranking needs to be compared with the one
produced at the end of a tournament. We propose to compare the rankings in three
ways: based on the Kendall’s τ correlation, Spearman’s Footrule distance and also
the fraction of the best team wins (Appleton, 1995). Let us describe these metrics
in detail. First, we introduce some notation. For team i, let ri denote its rank based
on the theoretical strength discussed above and si its final league standing. Since
the team ratings are drawn from continuous distributions, ties in the ranks of latent
team strength occur with probability zero. The ties in league standings were resolved
according to the tie-breaking rule discussed in Sect. 4.1. Hence, no ties are possible
in the lists of ranks ri and si.
Kendall’s τ is defined as a normalised difference between the number of concordant
pairs and disconcordant pairs in both lists. A pair of teams i, j is said to be con-
cordant if ri > rj and si > sj or ri < rj and si < sj. It is called disconcordant
otherwise. Normalisation by(n2
)assures that this metric values are in the interval
[−1, 1]. Spearman’s Footrule distance is defined as∑n
i=1 |ri − si|. Finally, in a single
26

Please cite this paper as: Lasek J., Gagolewski M., The efficacy of league formats in ranking teams,Statistical Modelling 18(5–6), 2018, pp. 411–435. doi:10.1177/1471082X18798426
simulation, the best team wins means that both ri = 1 and si = 1 for some team
i. In the context of information retrieval or recommendation systems, this metric is
equivalent to precision at k for k = 1 if we define the set of relevant items to be
a singleton consisting of the strongest team in a league (Li, 2011). By looking at dif-
ferent values of k, we may investigate whether the best team finishes in one of the top
k places. We decide to include this metric for comparison due to its simplicity and
direct interpretation.
The metrics presented have been popular tools for evaluation of tournament struc-
tures (Appleton, 1995; Langville and Meyer, 2012; Mendonca and Raghavachari, 2000;
Scarf et al., 2009). In the following part, we simulate the tournament for a large num-
ber of times and compute average tournament metrics over all runs.
5 Results
This section presents the results of the simulations under the various settings pre-
sented above. To start with, we demonstrate the results for 12 teams and the total
drift in team strength equal across all the league formats considered (see Sect. 3.5).
That is, the variance in team strength at the end of a season is kept equal among all
the formats.
5.1 Special case analysis
First, we present the results for the special case of parameter settings (α, σ) =
(20, 0.3). This case turned out to be realistic based on our analysis in Sect. 3.5.
Tab. 7 presents the results for 100,000 simulation runs. This many simulations ap-
27
Please cite this paper as: Lasek J., Gagolewski M., The efficacy of league formats in ranking teams,Statistical Modelling 18(5–6), 2018, pp. 411–435. doi:10.1177/1471082X18798426
peared to produce sufficiently stable measurements of the average evaluation metric
values (convergence was observed).
As for Kendall’s τ and Spearman’s Footrule distance, the differences between the val-
ues reported in Tab. 7 are statistically significant (at the 0.05 significance level).
First, we observe that 3RR + (1RR/1RR) is the most efficacious format according
to all three criteria. Notably, the division of points makes the results worse though
not by a large margin. Interestingly, while the relative order of tournament agrees
for Kendall’s τ and Spearman’s Footrule distance, 2RR+ (2RR/2RR) design turned
out to be superior in selecting the best team in a league to 3RR structure. Moreover,
the first two metrics produced the same ranking of tournaments as the total number
of matches played in a league. However, that was not the case for the fraction of
the best team wins as discussed above. All in all, the number of matches appears to
be an important factor in determining tournament efficacy.
5.2 Overall analysis
To analyse different settings we aggregate their results by averaging standardised
results for all 49 parameter settings (α, σ) from Tab. 5 from Sect. 3.5. Standardising
was introduced to account for the fact that different parameter settings introduce
a different scale for the metrics considered. The standardisation performed is the z-
score. That is, each result xi was transformed to (xi − x)/sd(x), where x and sd(x)
are the mean and standard deviation for the set of nine results for the tournament
formats considered. Tab. 7 presents the results.3
3The exact values of different metrics for a subset of parameter settings are presented in the on-line supplementary material.
28

Please cite this paper as: Lasek J., Gagolewski M., The efficacy of league formats in ranking teams,Statistical Modelling 18(5–6), 2018, pp. 411–435. doi:10.1177/1471082X18798426
Table 7: Average tournament metrics (Kendall’s τ , Spearman’s Footrule Distance(SFR), and the fraction of best team wins (Frac)) for the parameter setting (α, σ) =(20, 0.3) as well as their average z-scores across all simulation settings.
FormatFormat Average metrics for (20, 0.3) Average z-scores for allshort τ SFR Frac τ SFR Frac
12· 3RR + (1RR/1RR) a1 0.730 1.256 0.646 0.932 -0.946 0.946
12· 3RR + (1RR/1RR) a2 0.721 1.290 0.631 0.778 -0.785 0.681
3RR b 0.714 1.322 0.621 0.612 -0.618 0.51412· 2RR + (2RR/2RR) c1 0.704 1.364 0.625 0.367 -0.363 0.581
12· 2RR + (2RR/2RR) c2 0.696 1.397 0.607 0.224 -0.215 0.298
12· 2RR + (1RR/1RR) d1 0.686 1.434 0.598 0.026 -0.019 0.069
12· 2RR + (1RR/1RR) d2 0.680 1.462 0.584 -0.087 0.097 -0.161
2RR e 0.662 1.536 0.563 -0.456 0.466 -0.5671RR f 0.558 1.951 0.455 -2.395 2.384 -2.361
First, we note that the most efficacious format with respect to all three metrics con-
sidered is 3RR+ (1RR/1RR). The table also reveals that there is a high correlation
between the metric values and the number of matches played in a particular format.
Moreover, optional dividing of points by two after the first round of play produces
inferior results as compared to awarding three points for a win in each match. How-
ever, the results are not considerably worse as can be seen from the relative ordering
of different tournament formats.
We also observed that there is almost perfect agreement between Kendall’s τ and
Spearman’s Footrule in terms of the relative ordering of different tournaments across
different parameter settings. Therefore, we henceforth discuss the results on the basis
of Kendall’s τ statistic. Moreover, this order agrees with the total number of matches
played in a given design. Again, the fraction of the best team wins is higher in the case
of 2RR+ (2RR/2RR) than for 3RR as opposed to the other two criteria considered.
This was also observed in the analysis of the special case above.
To investigate the influence of given parameters on the results, we compare their val-
29

Please cite this paper as: Lasek J., Gagolewski M., The efficacy of league formats in ranking teams,Statistical Modelling 18(5–6), 2018, pp. 411–435. doi:10.1177/1471082X18798426
0.1 0.15 0.2 0.25 0.3 0.35 0.4
0.2
0.3
0.4
0.5
0.6
0.7
0.8
Prior ratings σ
Ken
dall'
s τ
a1
bc1
d1
ef
10 20 50 100 200
0.2
0.3
0.4
0.5
Temporal drift α
a1
bc1
d1
ef
Figure 5: The influence of parameters on Kendall’s τ : prior ratings variance σ givenα = 20 (left) and shape parameter α governing the drift (log-scale) given σ = 0.1.
ues against values of a given metric on a plot, see Fig. 5. For clarity, the designs with
the points division were omitted. Their performance is analogous to their versions
without it. We observe that as the discrepancy of the prior strength distribution σ
increases, the separation between the teams increases as measured by Kendall’s τ .
The effect of decreasing the seasonal drift parameter α is analogous but less promi-
nent. Usually, the prior team strength is a major determinant of its final league rank
(see the discussion in Sect. 3.5). Finally, different designs are superior with respect
to all parameter settings as can be seen by that the lines do not cross.
5.3 Influence of particular factors
In the simulations, different parameter settings were used. We investigated different
numbers of teams involved: 12 and 16. We note that similar qualitative conclusions
applied in both cases. With respect to quantitative differences in different metrics,
we observed that in the case of 16 teams, higher values for Kendall’s τ and the
fraction of the best teams wins were observed by a narrow margin. We conclude that
a larger number of teams increases efficacy in terms of the probability of the best
team to win and the rank correlation. On the other hand, the formats for 16 teams
produced higher Spearman’s Footrule distance values. A larger number of teams
30

Please cite this paper as: Lasek J., Gagolewski M., The efficacy of league formats in ranking teams,Statistical Modelling 18(5–6), 2018, pp. 411–435. doi:10.1177/1471082X18798426
possibly introduces wider gaps between the true teams’ ranks and their final league
position. We also note that the range of this metric depends on the number of teams
involved, whereas the other two metrics are normalised to the intervals [−1, 1] and
[0, 1]. The analysis proceeds with 12 teams henceforth.
Finally, as far as the normalisation of the drift parameter is considered as discussed
at the end of Sect. 3.5, the conclusions were similar. We did not observe changes in
the overall performance of the leagues for low values of σ and high variation of team
strength α. For every parameter setting, the relative ordering of tournament formats
measured by both Kendall’s τ and Spearman’s Footrule distance was identical to
the ranking presented in Tab. 7.
5.4 Influence of the number of matches
It is interesting to inspect the relation between the number of matches (rounds) played
in a league and the tournament metrics. We perform such an analysis in the case of
the RR structures and an example simulation setting (α, σ) = (0.3, 20). The different
metrics considered are estimated using 10,000 simulation runs for kRR design for k =
1, 2, . . . , 10 and 12 teams. The results are presented in Fig. 6 for the number of rounds
played (matchdays) in kRR format equal to 11k. We inspected the relation between
metrics using the linear regression model with the metric values as the dependent
variable and the logarithm of the number of rounds as the explanatory variable. We
found that this logarithmic model fits data very well (R2 ≈ 0.99). The conclusion is
that the impact of additional rounds exhibit diminishing improvements which may
be approximated by a logarithmic dependency.
31

Please cite this paper as: Lasek J., Gagolewski M., The efficacy of league formats in ranking teams,Statistical Modelling 18(5–6), 2018, pp. 411–435. doi:10.1177/1471082X18798426
●
●
●
●
●
●
●
●●
●
y = 0.29+0.12 log(x)
10 20 50 100
0.55
0.60
0.65
0.70
0.75
0.80
0.85K
enda
ll's
τ
●
●
●
●
●
●
●
●●
●
y = 3.07−0.49 log(x)
10 20 50 100
0.8
1.0
1.2
1.4
1.6
1.8
2.0
Rounds
Spe
arm
an's
ρ
●
●
●
●
●
●
●
●● ●
y = 0.15+0.13 log(x)
10 20 50 100
0.45
0.50
0.55
0.60
0.65
0.70
0.75
0.80
Bes
t tea
m w
in
Figure 6: The three metrics considered (from the left): Kendall’s τ correlation, Spear-man’s Footrule distance and the fraction of the best team wins (y-axis) as the func-tion of the number of rounds (x-axis, on the logarithmic scale) in kRR tournament,k = 1, 2, . . . , 10.
5.5 Enhancing the 3RR + (1RR/1RR) format
An interesting question that arises is whether the most efficacious league design 3RR+
(1RR/1RR) can be further improved. The basic modification of this format would
be to introduce a different number of points awarded for a particular result. Since
we are considering a league format in which the points for the results in a series of
matches are summed, this may be investigated by changing only the number of points
allocated for a win, setting the number of points allocated for a draw and a loss to one
and zero, respectively – any other point allocation rule obeys such a representation.
Fig. 7 presents the values of different metrics for the modified 3RR + (1RR/1RR)
format by awarding 1.5, 2, 2.5, . . . , 5 points for a win in a match.
We observe that the efficacy of the format can be improved by allocating two points
for a win in terms of Kendall’s τ and Spearman’s Footrule distance. The differences
in average values of these metrics are small but significant for different allocations
of points for winning a match. Awarding two points for a win was the official rule
applied in most of the European leagues until it was replaced by three points for a win
32

Please cite this paper as: Lasek J., Gagolewski M., The efficacy of league formats in ranking teams,Statistical Modelling 18(5–6), 2018, pp. 411–435. doi:10.1177/1471082X18798426
●
●
●
●
●
●
●
●
1.5 2.0 2.5 3.0 3.5 4.0 4.5 5.0
0.722
0.724
0.726
0.728
0.730
0.732
0.734K
enda
ll's
τ
●
●
●
●
●
●
●
●
1.5 2.0 2.5 3.0 3.5 4.0 4.5 5.0
1.24
1.25
1.26
1.27
1.28
1.29
Points
Spe
arm
an's
ρ
●
● ●
●
●
●
●
●
1.5 2.0 2.5 3.0 3.5 4.0 4.5 5.0
0.635
0.640
0.645
0.650
Bes
t tea
m w
in
Figure 7: The three metrics considered (from the left): Kendall’s τ correlation, Spear-man’s Footrule distance and the fraction of the best team wins (y-axis) as the functionof the number of points awarded for a win (x-axis).
standard after its introduction by FIFA. On the other hand, there are no significant
differences in awarding two or more points for a win for the fraction of the best team
wins. With respect to this metric, in the case of 1.5 points for a win, the results are
significantly inferior.
It should be noted that the analysis comes with certain limitations. The number of
points awarded for a particular outcome may influence a team’s attitude and style of
playing. For example, if four points are awarded for a win, a team may impose a more
attacking style of play in case of a draw in the end of the game as there is a relatively
large pay-off for winning it as compared to a single point for a draw. The opposite
effect may be observed if the number of points for a win is set to two. It should
be noted that the data used in the analysis stem from three-points-for-a-win system,
which may produce some bias when studying different points allocation rules. We
leave a detailed analysis of such effects as a part of further work in this area.
33

Please cite this paper as: Lasek J., Gagolewski M., The efficacy of league formats in ranking teams,Statistical Modelling 18(5–6), 2018, pp. 411–435. doi:10.1177/1471082X18798426
6 Discussion and conclusions
From the experiments (in particular, Tab. 7) we conclude that 3RR + (1RR/1RR)
is the most efficacious league format when the agreement between the competitors
ranking it produces and their latent abilities is considered.
The simulations revealed that Kendall’s τ and Spearman’s Footrule distance yielded
the same qualitative conclusion as far as comparison between different designs are
concerned. The ordering of the tournament formats for these two metrics are identical.
On the other hand, the fraction of the best team wins provides mixed, yet very
interesting results. In particular, we observe that it ranks 2RR + (2RR/2RR) over
3RR in certain cases. The reason may be that the second stage of the competition
allows for a more refined selection of the best team while the table split after the first
two round-robin rounds appears to be premature as for determining the whole ranking
of teams. Moreover, based on the analysis of the points allocated for a win for the most
efficacious 3RR+(1RR/1RR) league design, we found that it can be further enhanced
in terms of Kendall’s τ correlation and Spearman’s Footrule distance by awarding
two or two and a half points for a win instead of the current official three-points-
setting. However, allocating a different number of points did not result in significant
improvement in the fraction of the best team wins.
One of the most important findings is that the performance of a given league format
highly depends on the total number of matches played. In fact, there is a perfect
agreement between the number of matches played and Kendall’s τ . This conclusion
is in line with the intuition as well as the principle of statistics that more samples lead
to better estimates. Moreover, the modification of the two-stage designs by dividing
34

Please cite this paper as: Lasek J., Gagolewski M., The efficacy of league formats in ranking teams,Statistical Modelling 18(5–6), 2018, pp. 411–435. doi:10.1177/1471082X18798426
points after the first stage of the competition does not introduce a significant amount
of noise in the efficacy of a league format.
The influence of extra round-robin rounds on the accuracy of the results was also
investigated. We identified that the improvement in the efficacy of kRR design is
logarithmic in the number of rounds (matches) played. This relation was found
empirically by fitting a linear regression model. In terms of further research, it would
be interesting to come up with an analytical approximation of this finding.
We also note that in the strongest European leagues which also involve the high-
est number of teams (for example, English, French, German, Italian and Spanish)
the 2RR tournament design is employed. Since these leagues operate on larger num-
ber of teams (18 or 20), it appears that the implementation of more complex league
formats would be impractical due to the large number of matches required to com-
plete them. This may justify the prevalence of this particular league design among
the strongest leagues in the UEFA countries. Moreover, among the league formats
studied here it is the only design in which each team plays against one another ex-
actly the same number of matches home and away. This may be a desirable feature of
a tournament. Playing equal number of matches home and away against each team is
also the feature of the 2RR+ (2RR/2RR) design. In this case the teams play against
one another two or four matches depending on the group they compete in during
the second stage of the season (championship or relegation).
It should be noted that the conclusions are based on a particular match result model
and, hence, may possess certain limitations. In particular, many factors can influence
the matches’ outcomes. For example, international cup matches, players’ injuries or
transfers may impact a team’s form. By studying a variety of parameter settings
35

Please cite this paper as: Lasek J., Gagolewski M., The efficacy of league formats in ranking teams,Statistical Modelling 18(5–6), 2018, pp. 411–435. doi:10.1177/1471082X18798426
for a team’s strength and its fluctuations, the effort was made to minimise these
limitations. Another limitation stems from the fact that in the case of two stage
league formats and the points division, teams may exhibit a different attitude toward
the first stage of the competition since in practice each game is worth half of the points.
Moreover, the decisive matches in domestic competition are played at the season’s
end. These factors may influence a team’s attitude toward a match in different parts
of the season. The assumed model does not include such psychological factors. On
the other hand, the following implicit conclusion might be drawn. For a team to
benefit from the efficacy of a particular format, it needs to play with all its might to
win each match regardless of the league stage in order to reach a final rank reflecting
its true strength (in particular, to claim the championship title).
Design of tournaments has many aspects. Among others there is fan excitement,
profit from distribution of television rights and the tournament efficacy as discussed
in depth in this work. In particular, based on the conclusions obtained in a simulation
study, we note that the recent changes in, for example, Danish, Polish, Ukrainian or
Serbian leagues to the extended league designs should have a rather positive impact
on the efficacy of competition in these countries. It should be also emphasised that
halving points decreases tournament efficacy in producing accurate team rankings.
The question of how many points to award for a win is also worth revisiting. We
observed that tournament efficacy may be improved in certain aspects by setting it
to two as in the previously applied standard.
Acknowledgements Jan Lasek would like to acknowledge the partial support of
this study by the European Union from resources of the European Social Fund,
36

Please cite this paper as: Lasek J., Gagolewski M., The efficacy of league formats in ranking teams,Statistical Modelling 18(5–6), 2018, pp. 411–435. doi:10.1177/1471082X18798426
Project PO KL “Information technologies: Research and their interdisciplinary ap-
plications”, agreement UDA-POKL.04.01.01-00-051/10-00 via the Interdisciplinary
PhD Studies Program.
References
Appleton, D. (1995). May the best man win? Journal of the Royal Statistical Society:
Series C (The Statistician), 44(4), 529–538.
Bassett, G. W. (2007). Quantile regression for rating teams. Statistical Modelling, 7
(4), 301–313.
Bates, D. M. and DebRoy, S. (2004). Linear mixed models and penalized least squares.
Journal of Multivariate Analysis, 91(1), 1–17.
Boshnakov, G., Kharrat, T., and McHale, I. G. (2017). A bivariate Weibull count
model for forecasting association football scores. International Journal of Forecast-
ing, 33(2), 458–466.
Boyko, R. H., Boyko, A. R., and Boyko, M. G. (2007). Referee bias contributes to
home advantage in English Premiership football. Journal of Sports Sciences, 25
(11), 1185–1194.
Breaugh, J. and Starke, M. (2000). Research on employee recruitment: So many
studies, so many remaining questions. Journal of Management, 26(3), 405–434.
Cattelan, M., Varin, C., and Firth, D. (2013). Dynamic Bradley-Terry modelling of
sports tournaments. Journal of the Royal Statistical Society: Series C (Applied
Statistics), 62(1), 135–150.
37

Please cite this paper as: Lasek J., Gagolewski M., The efficacy of league formats in ranking teams,Statistical Modelling 18(5–6), 2018, pp. 411–435. doi:10.1177/1471082X18798426
Constantinou, A. C., Fenton, N. E., and Neil, M. (2012). pi-football: A Bayesian
network model for forecasting association football match outcomes. Knowledge-
Based Systems, 36, 322–339.
Crowder, M., Dixon, M., Ledford, A., and Robinson, M. (2002). Dynamic modelling
and prediction of English football league matches for betting. Journal of the Royal
Statistical Society: Series D (The Statistician), 51(2), 157–168.
de Werra, D. (1981). Scheduling in sports. In Hansen, P., editor, Annals of Discrete
Mathematics (11) Studies on Graphs and Discrete Programming, volume 59 of
North-Holland Mathematics Studies, pages 381–395. North-Holland.
Dilger, A. and Geyer, H. (2009). Are three points for a win really better than two?: A
comparison of German soccer league and cup games. Journal of Sports Economics,
10(3), 305–318.
Dixon, M. J. and Coles, S. G. (1997). Modelling association football scores and
inefficiencies in the football betting market. Journal of the Royal Statistical Society:
Series C (Applied Statistics), 46(2), 265–280.
Glickman, M. E. (2001). Dynamic paired comparison models with stochastic vari-
ances. Journal of Applied Statistics, 28(6), 673–689.
Goddard, J. (2005). Regression models for forecasting goals and match results in
association football. International Journal of Forecasting, 21(2), 331–340.
Goossens, D. R. and Spieksma, F. C. R. (2012). Soccer schedules in Europe: An
overview. Journal of Scheduling, 15(5), 641–651.
Graham, I. and Stott, H. (2008). Predicting bookmaker odds and efficiency for UK
football. Applied Economics, 40(1), 99–109.
38

Please cite this paper as: Lasek J., Gagolewski M., The efficacy of league formats in ranking teams,Statistical Modelling 18(5–6), 2018, pp. 411–435. doi:10.1177/1471082X18798426
Groll, A. and Abedieh, J. (2013). Spain retains its title and sets a new record –
generalized linear mixed models on European football championships. Journal of
Quantitative Analysis in Sports, 9(1), 51–66.
Groll, A., Schauberger, G., and Tutz, G. (2015). Prediction of major international
soccer tournaments based on team-specific regularized Poisson regression: An ap-
plication to the FIFA World Cup 2014. Journal of Quantitative Analysis in Sports,
11(2), 97–115.
Groll, A., Kneib, T., Mayr, A., and Schauberger, G. (2018). On the dependency of
soccer scores – A sparse bivariate Poisson model for the UEFA European Football
Championship 2016. Journal of Quantitative Analysis in Sports. (to appear).
Hastie, T., Tibshirani, R., and Friedman, J. (2009). The Elements of Statistical
Learning. Springer, New York, NY.
Hoerl, A. E. and Kennard, R. W. (1970). Ridge regression: Biased estimation for
nonorthogonal problems. Technometrics, 12(1), 55–67.
Hon, L. Y. and Parinduri, R. A. (2016). Does the three-point rule make soccer
more exciting? Evidence from a regression discontinuity design. Journal of Sports
Economics, 17(4), 377–395.
Karlis, D. and Ntzoufras, I. (2003). Analysis of sports data by using bivariate Poisson
models. Journal of the Royal Statistical Society: Series D (The Statistician), 52
(3), 381–393.
Katehakis, M. N. and Veinott, A. F. (1987). The multi-armed bandit problem: De-
composition and computation. Mathematics of Operations Research, 12, 262–268.
39

Please cite this paper as: Lasek J., Gagolewski M., The efficacy of league formats in ranking teams,Statistical Modelling 18(5–6), 2018, pp. 411–435. doi:10.1177/1471082X18798426
Koning, R. H. (2000). Balance in competition in Dutch soccer. Journal of the Royal
Statistical Society: Series C (The Statistician), 49(3), 419–431.
Koopman, S. J. and Lit, R. (2015). A dynamic bivariate Poisson model for analysing
and forecasting match results in the English Premier League. Journal of the Royal
Statistical Society: Series A (Statistics in Society), 178(1), 167–186.
Langville, A. N. and Meyer, C. D. (2006). Google’s PageRank and Beyond: The
Science of Search Engine Rankings. Princeton University Press, Princeton, NJ.
Langville, A. N. and Meyer, C. D. (2012). Who’s #1?: The Science of Rating and
Ranking. Princeton University Press.
Lasek, J. and Gagolewski, M. (2015). Predictive efficacy of a new association foot-
ball league format in Polish Ekstraklasa. In Proceedings of the 2nd Workshop on
Machine Learning and Data Mining for Sports Analytics, pages 1–9.
Lasek, J., Szlavik, Z., Gagolewski, M., and Bhulai, S. (2016). How to improve a team’s
position in the FIFA ranking? A simulation study. Journal of Applied Statistics,
43(7), 1349–1368.
Ley, C., Van de Wiele, T., and Van Eetvelde, H. (2018). Ranking soccer teams on
their current strength: A comparison of maximum likelihood approaches. Statistical
Modelling. (to appear).
Li, H. (2011). A short introduction to learning to rank. IEICE Transactions on
Information and Systems, 94-D, 1854–1862.
Maher, M. J. (1982). Modelling association football scores. Statistica Neerlandica,
36(3), 109–118.
40

Please cite this paper as: Lasek J., Gagolewski M., The efficacy of league formats in ranking teams,Statistical Modelling 18(5–6), 2018, pp. 411–435. doi:10.1177/1471082X18798426
McGarry, T. and Schutz, R. W. (1997). Efficacy of traditional sport tournament
structures. The Journal of the Operational Research Society, 48(1), 65–74.
McHale, I. and Scarf, P. (2011). Modelling the dependence of goals scored by opposing
teams in international soccer matches. Statistical Modelling, 11(3), 219–236.
Mendonca, D. and Raghavachari, M. (2000). Comparing the efficacy of ranking meth-
ods for multiple round-robin tournaments. European Journal of Operational Re-
search, 123(3), 593–605.
Moschini, G. (2010). Incentives and outcomes in a strategic setting: The 3-points-
for-a-win system in soccer. Economic Inquiry, 48(1), 65–79.
Neave, N. and Wolfson, S. (2003). Testosterone, territoriality, and the ‘home advan-
tage’. Physiology & Behavior, 78(2), 269–275.
Pawlowski, T. and Nalbantis, G. (2015). Competition format, championship uncer-
tainty and stadium attendance in European football – a small league perspective.
Applied Economics, 47(38), 4128–4139.
Robinson, G. K. (1991). That BLUP is a good thing: The estimation of random
effects. Statistical Science, 6(1), 15–32.
Rue, H. and Salvesen, O. (2000). Prediction and retrospective analysis of soccer
matches in a league. Journal of the Royal Statistical Society: Series D (The Statis-
tician), 49(3), 399–418.
Ryvkin, D. (2010). The selection efficiency of tournaments. European Journal of
Operational Research, 206(3), 667–675.
41

Please cite this paper as: Lasek J., Gagolewski M., The efficacy of league formats in ranking teams,Statistical Modelling 18(5–6), 2018, pp. 411–435. doi:10.1177/1471082X18798426
Scarf, P., Yusof, M. M., and Bilbao, M. (2009). A numerical study of designs for
sporting contests. European Journal of Operational Research, 198(1), 190–198.
Schauberger, G., Groll, A., and Tutz, G. (2018). Analysis of the importance of on-
field covariates in the German Bundesliga. Journal of Applied Statistics, 45(9),
1–18.
Sismanis, Y. (2010). How I won the “Chess Ratings - Elo vs the Rest of the World”
competition. CoRR, abs/1012.4571. URL http://arxiv.org/abs/1012.4571.
Stefani, R. T. (1997). Survey of the major world sports rating systems. Journal of
Applied Statistics, 24(6), 635–646.
Stenerud, S. G. (2015). A study on soccer prediction using goals and shots on target.
Master’s thesis, Norwegian University of Science and Technology, NTNU, NO-7491
Trondheim, Norway. URL http://hdl.handle.net/11250/2352708.
Szymanski, S. (2003). The economic design of sporting contests. Journal of Economic
Literature, 41(4), 1137–1187.
Wright, M. (2014). OR analysis of sporting rules – A survey. European Journal of
Operational Research, 232(1), 1–8.
42