Embed Size (px)
Citation preview

Ž .Research Policy 30 2001 535–588www.elsevier.nlrlocatereconbase
The dynamics of technological innovation: the case of thepharmaceutical industry
Basil Achilladelis a,), Nicholas Antonakis b
a 39, Ionias Street, Kifissia, Athens 14563, Greeceb Ministry of DeÕelopment and UniÕersity of Athens, Athens Greece
Received 9 April 1999; received in revised form 7 October 1999; accepted 18 January 2000
Abstract
Ž .This is an empirical and historical study of the dynamics of technological innovation TI in the pharmaceutical industryfrom its establishment at the beginning of the 19th century to 1990. It is based on the identification and evaluation of the
Ž .originality and commercial significance of 1736 product innovations new medicines commercialized between 1800 and1990, and on company economic data for the period 1950–1990. The study is presented in the framework of establishedmacroeconomic theory of technical change.
Ž .Applying both empirical and historical evidence, the study: a identifies the technological, social and economic drivingŽ . Ž .forces for TI; b examines the relation between originality and market performance of medicinal innovations; c studies the
Žmechanisms of the diffusion of medicinal technologies that led to the formation of five successive generations of drugs long. Ž .waves ; d describes the structural changes forced on the pharmaceutical industry by the introduction and development of
Ž .each successive generation of drugs; e provides evidence of the concentration of the innovative segment of thepharmaceutical industry among few large companies, which sustained high levels of growth and R&D expenditures bymeans of inhouse innovation, technological and therapeutic market specialization, and mergers and acquisitions of
Ž .companies within and outside the pharmaceutical industry; and f shows that the localization of the innovative segment ofthe pharmaceutical industry in the USA, UK, Germany, Switzerland and France was caused by the influence of nationalenvironments on the intensities of the driving forces for TI. q 2001 Elsevier Science B.V. All rights reserved.
Keywords: Dynamics of technological innovation; Pharmaceutical industry; Long waves of technical change
1. Introduction
Ž .Technological innovation TI is a dynamic pro-cess, perhaps the most dynamic of all industrial
Ž .activities. Schumpeter 1943 with his Agales of cre-ative destructionB gave a vivid description of theeffects of the introduction and diffusion of major
) Corresponding author. Tel.: q30-1-800-01-52; fax: q30-1-800-01-52.
technological discoveries and inventions in industryand the world economy.
Schumpeter’s seminal theory was further elabo-rated at the macroeconomic level by many authorsŽ . Že.g., Freeman, 1996 , notably Rosenberg 1969,
. Ž . Ž .1976 , Nelson and Winter 1977 , Dosi 1982 , Free-Ž .man and Perez 1988 , who, by incorporating Kon-
Ž .dratiev’s 1925 theory of Along wavesB in theŽ .world economy and Kuhn’s 1962 theory of scien-
tific revolutions, introduced the concepts of Atechno-
0048-7333r01r$ - see front matter q 2001 Elsevier Science B.V. All rights reserved.Ž .PII: S0048-7333 00 00093-7

( )B. Achilladelis, N. AntonakisrResearch Policy 30 2001 535–588536
logical imperativesB or Atechnological paradigmsBŽ .TPs , which initiate Atechnological trajectoriesBŽ .TTs whose pathways determine the fluctuating ratesof technical change. TT were, in turn, found tocluster together forming Atechnology systemsB andAtechno-economic paradigmsB which, by spreadingacross numerous industrial and service sectors, causethe formation and succession of Along wavesB in theworld economy.
These concepts provided an extremely usefulframework for the study of TI, which offered anumber of plausible macroeconomic interpretationsregarding the fluctuations of the rates of technicalchange, the diffusion of technologies and their inter-actions with the economy. Less attention was, how-ever, addressed at the microeconomic aspects oftechnological advance, notably the dynamics of TI atthe level of innovating institutions where they arefirst expressed and can be more accurately detectedand evaluated. Indeed, the dynamism of TI is ex-pressed in more subtle ways before it integrates intoAtechno-economic paradigmsB and Along wavesB.For example, TI acts as a catalyst in the interactionof science and technology accelerating their other-wise arduous advance, in the technological develop-ment and market expansion of industrial sectors, inthe research intensity, technological specializationand business performance of industrial companies,and in the competitive advantage of national indus-tries.
The mechanisms by which TI exerts such influ-ence can be identified and evaluated by studies ofthe technological and business histories of research-intensive industrial sectors. Long-term sectoral stud-ies of TI offer the advantage of a homogeneousscientific, technological and commercial frameworkwhich allows for the study of the rates of technicalchange and for comparisons in science, technologyand business among historical periods, companiesand countries. The use of technology inputroutputindicators is essential because they provide quantita-tive evidence for or against any proposed hypothesis.
This is a study of the dynamics of TI in thepharmaceutical industry from its establishment at thebeginning of the 19th century to 1990. The pharma-ceutical industry is a relatively small research-inten-sive industry that showed a consistently strong inno-vative record throughout its 200-year-long history.
From its establishment to this day, it has maintaineda close and fruitful two-way relation with academicresearch institutions in chemistry, pharmacology, thelife sciences and medicine. The succession of tech-nologies did not create waves but only ripples ofcreative destruction because leading companies wereflexible enough to adapt to the exigencies of the newregimes and even to prosper from them. A thrivingand extremely profitable business was created withsome of its innovations becoming household namesfor nearly a century and others having deeply af-fected the nature, structure and morals of our society.Indeed, in this latter aspect, there is no other industrythat had a comparable effect.
The study is presented in the following threesections.
Section 2 describes the sources and assesses thedata used in the study.
Section 3 presents an empirical study of the dy-namics of TI in the pharmaceutical industry in theframework of established theory of technical change.
Ž .a DriÕing forces of TI. TI involves scientificrtechnological and commercial uncertainties and hencethe acceptance of financial risks on the part of publicand private innovating institutions. It is, therefore,essential to identify the scientific, technological, so-cial and economic forces that have compelled thepharmaceutical industry throughout its long historyto discover, develop and commercialize newmedicines.
Ž . ( )b Dynamic effects of radical innoÕations RIs .Highly original innovations cause the establishmentof new industrial sectors or subsectors and contributeto the diffusion of technology. The pharmaceuticalindustry is not an exception to this rule. In ouranalysis, we examine the technological and commer-cial characteristics of RIs, which impart to them theirdynamic properties, and investigate the companies’justifications in accepting the higher risks associatedwith their development and commercialization.
Ž .c Diffusion of innoÕation. The 200-year-longinnovation history of the pharmaceutical industry isunique in manufacturing. To identify the dynamicsand mechanisms by which it maintained a nearlycontinuous drive for innovation over such a longperiod, we examine the patterns of distribution over
Ž .time of radical and incremental innovations IIs bytherapeutic sector; we identify the characteristics of

( )B. Achilladelis, N. AntonakisrResearch Policy 30 2001 535–588 537
innovations that served as TPs and of the TTs theygenerated; and we find that the clustering of TPs andtrajectories gave rise to five successive generationsof pharmaceuticals that have kept alive the industry’sdrive for innovation.
Ž .d The innoÕatiÕe performance of pharmaceuti-cal companies. Our innovation data show that 30companies introduced more than 70% of all theinnovations of our sample. Most of these companiesstayed in business for about a century despite therevolutionary changes of the competitive environ-ment of the pharmaceutical industry caused by theintroduction of successive generations of technology.We examine the patterns of growth of some of thesecompanies, their innovation records, and the strate-gies they adopted to ensure growth including techno-logical and market specialization, mergers and acqui-sitions and R&D intensity.
Ž .e The geography of innoÕation. Despite theuniversal need for medicines, our data show a strongconcentration of the innovative segment of the phar-maceutical industry in five countries, namely theUSA, Germany, Switzerland, the UK and France.We examine the causes of this concentration and inparticular the influence of national policies on theintensities of the driving forces of TI.
Section 4 presents an interpretation of the historyof innovation in the pharmaceutical industry fromthe beginning of the 19th century to 1990 based onthe findings and analysis of the previous section.
2. Sources, evaluation and interpretation of data
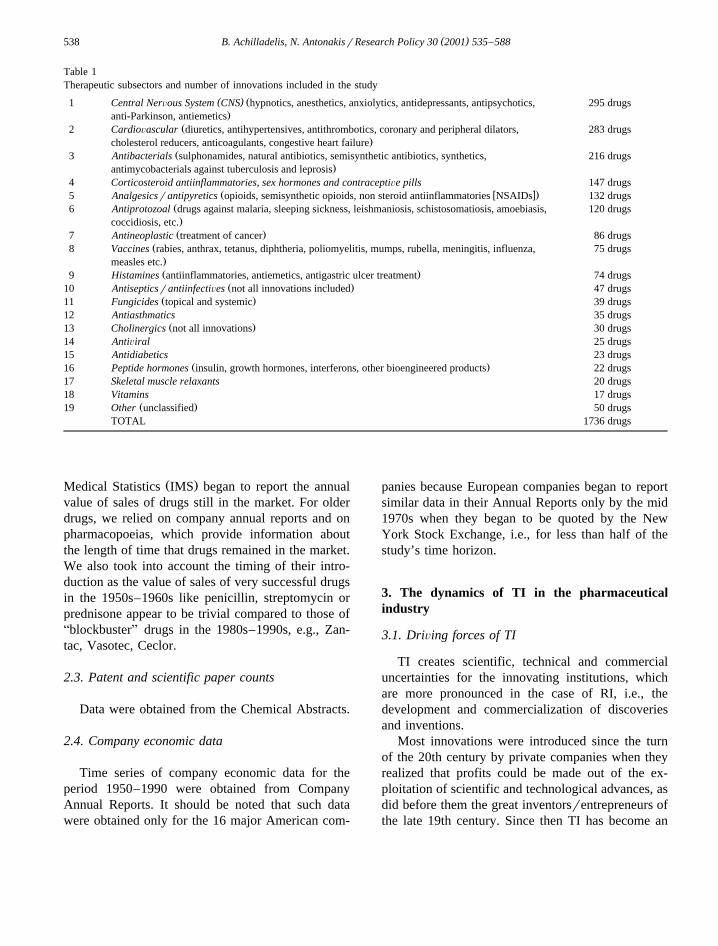
2.1. InnoÕation counts
The study is primarily based on the identificationand evaluation of product innovations of the pharma-ceutical industry, which were commercialized from
Ž .about 1800 to 1990. Product innovations new drugsŽ .that are included are new chemical entities NCEs ,
i.e., they differ in chemical composition and struc-ture. Mixtures and diverse formulations of NCEs are
Žnot included. From previous studies Achilladelis et.al., 1987; Achilladelis, 1993 , we came to understand
that the identification of all the innovations of anindustrial sector or subsector is essential if we are toarrive to useful conclusions about the dynamics of
TI. To this end, we identified all the innovationsŽ .1736 of 16 subsectors of the pharmaceutical indus-
Žtry described in Martindale’s Pharmacopoeia Re-.ynolds, 1989 , which account for about 80% of all
Ž .subsectors Table 1 . The chemical structure andcomposition of each drug were obtained from the
ŽUSAN and USP Dictionary of Drug Names Fleeger,.1994 ; tradenames, innovating companies and years
of commercialization were obtained by crosscheck-ing the above references with the World’s Pharma-
Ž .ceutical Directory Anon, 1991 . To ensure againstomissions of significant drugs, we cross-checked ourlists with those of the USA Food and Drug Admi-
Ž .nistration’s FDA Center for Drug Evaluation andŽResearch U.S. Department of Health and Human
.Services, 1989 ; with the American Medical Associa-Ž .tion’s 1980 AAMA Drug EvaluationsB; and with
Ž .Sneader’s 1996 book ADrug Prototypes and theirExploitationB, which describes about 1300 drugs.Thus, although there must be some omissions, ourdata base is adequate for the purposes of our re-search and analysis.
2.1.1. Process innoÕationsAlthough extremely important, we have not in-
cluded them because, with few notable exceptions,they are hard to identify and evaluate with certainty.Most of them are used for the manufacture of one ora few products so that the study of product innova-tions covers indirectly processing as well. Further-more, process innovations are seldom commercial-ized because companies seldom license their pro-cesses unless they license the corresponding product.
2.2. EÕaluation of innoÕations
2.2.1. OriginalityThe evaluation of the originality of innovations
was based on their chemical composition, therapeuticaction and effectiveness, timing of their commercial-ization and the extent to which they were imitated.
2.2.2. Market performanceThe measurement of commercial success of phar-
maceutical innovations is easier than it is in othersectors of manufacturing because of governmentalagencies’ reports on the subject, particularly sincethe 1970s when annual reports of the International
( )B. Achilladelis, N. AntonakisrResearch Policy 30 2001 535–588538
Table 1Therapeutic subsectors and number of innovations included in the study
( ) Ž1 Central NerÕous System CNS hypnotics, anesthetics, anxiolytics, antidepressants, antipsychotics, 295 drugs.anti-Parkinson, antiemetics
Ž2 CardioÕascular diuretics, antihypertensives, antithrombotics, coronary and peripheral dilators, 283 drugs.cholesterol reducers, anticoagulants, congestive heart failure
Ž3 Antibacterials sulphonamides, natural antibiotics, semisynthetic antibiotics, synthetics, 216 drugs.antimycobacterials against tuberculosis and leprosis
4 Corticosteroid antiinflammatories, sex hormones and contraceptiÕe pills 147 drugsŽ w x.5 Analgesicsrantipyretics opioids, semisynthetic opioids, non steroid antiinflammatories NSAIDs 132 drugs
Ž6 Antiprotozoal drugs against malaria, sleeping sickness, leishmaniosis, schistosomatiosis, amoebiasis, 120 drugs.coccidiosis, etc.Ž .7 Antineoplastic treatment of cancer 86 drugs
Ž8 Vaccines rabies, anthrax, tetanus, diphtheria, poliomyelitis, mumps, rubella, meningitis, influenza, 75 drugs.measles etc.Ž .9 Histamines antiinflammatories, antiemetics, antigastric ulcer treatment 74 drugs
Ž .10 AntisepticsrantiinfectiÕes not all innovations included 47 drugsŽ .11 Fungicides topical and systemic 39 drugs
12 Antiasthmatics 35 drugsŽ .13 Cholinergics not all innovations 30 drugs
14 AntiÕiral 25 drugs15 Antidiabetics 23 drugs
Ž .16 Peptide hormones insulin, growth hormones, interferons, other bioengineered products 22 drugs17 Skeletal muscle relaxants 20 drugs18 Vitamins 17 drugs
Ž .19 Other unclassified 50 drugsTOTAL 1736 drugs
Ž .Medical Statistics IMS began to report the annualvalue of sales of drugs still in the market. For olderdrugs, we relied on company annual reports and onpharmacopoeias, which provide information aboutthe length of time that drugs remained in the market.We also took into account the timing of their intro-duction as the value of sales of very successful drugsin the 1950s–1960s like penicillin, streptomycin orprednisone appear to be trivial compared to those ofAblockbusterB drugs in the 1980s–1990s, e.g., Zan-tac, Vasotec, Ceclor.
2.3. Patent and scientific paper counts
Data were obtained from the Chemical Abstracts.
2.4. Company economic data
Time series of company economic data for theperiod 1950–1990 were obtained from CompanyAnnual Reports. It should be noted that such datawere obtained only for the 16 major American com-
panies because European companies began to reportsimilar data in their Annual Reports only by the mid1970s when they began to be quoted by the NewYork Stock Exchange, i.e., for less than half of thestudy’s time horizon.
3. The dynamics of TI in the pharmaceuticalindustry
3.1. DriÕing forces of TI
TI creates scientific, technical and commercialuncertainties for the innovating institutions, whichare more pronounced in the case of RI, i.e., thedevelopment and commercialization of discoveriesand inventions.
Most innovations were introduced since the turnof the 20th century by private companies when theyrealized that profits could be made out of the ex-ploitation of scientific and technological advances, asdid before them the great inventorsrentrepreneurs ofthe late 19th century. Since then TI has become an
( )B. Achilladelis, N. AntonakisrResearch Policy 30 2001 535–588 539
essential activity for companies in research-intensivesectors. The acceptance of financial risks associatedwith TI on the part of companies indicates that thereare social and economic forces which compel themto innovate.
However, TIs were also introduced in socialistcountries or when the capitalist system was stillyoung and research-intensive companies did not ex-ist, as was the case of the pharmaceutical industryfor most of the 19th century. Forces of a less capital-istic nature acted upon individual scientists, engi-neers, physicians and on institutions, such as univer-sities, hospitals, public or private, not for profithealth-care organizations, which discovered and de-veloped new medicines and made them available tothe public. These forces were effective because oftheir relation to AnoncommercialB characteristics ofTI, namely its dependence on scientific advance,creative individuals and the recognition of societalneeds rather than on market demand, commercialcompetition and profit.
Sciencertechnology ApushB and market ApullBwere considered the main driving forces for TI andmany scholars have argued in favor of one or the
Žother Schmookler, 1976; Mowery and Rosenberg,.1979; Walsh, 1984 . For economists, in particular,
this concept accommodated the treatment of all eco-nomic parameters under Amarket demandB leavingAsciencertechnologyB as an externality. Because ofthe complexity of the process of TI, this concept hasa weak explanatory power regarding the interpreta-tion of historical facts and is inadequate for thesupport of a theory of the dynamics of TI. Theseshortcomings were realized and authors of morerecent studies found it necessary to introduce a mul-titude of more specific factors to account for differ-ences and fluctuations over time of the innovationrecord of industrial sectors, companies and countriesŽ .Dosi et al., 1988; Mokyr, 1990; Porter, 1990 .
To identify the driving forces that impel compa-nies and other institutions to innovate, we havereviewed numerous case studies and applied thefindings of two empirical studies that were con-ducted with the participation of researchers, inven-tors, managers and many research-intensive compa-nies: Project ASAPPHOB examined the factors thatare associated with success and failure in industrial
Ž .innovation Freeman et al., 1971, 1972 and project
AInnovation and the firm in the chemical industryBstudied the dynamics of TI including the forces that
Ž .drive innovation Achilladelis et al., 1982, 1990 .Seven driving forces were identified and defined
as follows:
v ŽScientific and technological adÕances external.to the innovating institution ;
v Ž .Raw materials availability or scarcity ;v ŽMarket demand evaluated by companies prior
to the decision to proceed with the development.of an innovation ;
v ŽCompetition response to scientificrtechnicalrcommercial advances made by competing com-
.panies ;v ŽSocietal needs which could not be evaluated in
terms of market demand prior to the decision to.proceed with the development of an innovation ;
v ŽGoÕernment legislation legislation that affectsR&D and the competitive setting of an indus-
.trial sector ;v Company scientific, technological and market
Žspecialization a company has introduced in thepast innovations based on related science, tech-
.nology and markets .
These driving forces are not independent fromeach other but their effects on TI are distinct asare the responses to them by innovating institutions.The first six are AenvironmentalB in character, i.e.,they affect all research-intensive companies of oneor a number of industries. Indeed, they were im-
Ž .plicitly identified by Landes 1970 in AUnboundPrometheusB as factors responsible for technicalchange since the Industrial Revolution. The seventhis company-specific and exerts a strong influence ona company’s innovation record over long periods oftime.
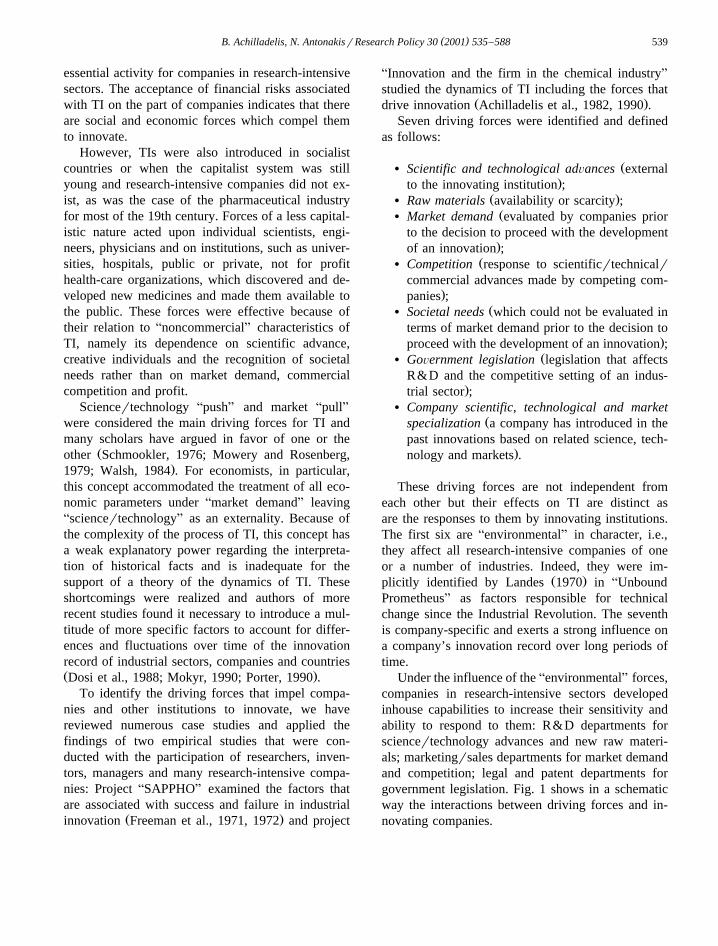
Under the influence of the AenvironmentalB forces,companies in research-intensive sectors developedinhouse capabilities to increase their sensitivity andability to respond to them: R&D departments forsciencertechnology advances and new raw materi-als; marketingrsales departments for market demandand competition; legal and patent departments forgovernment legislation. Fig. 1 shows in a schematicway the interactions between driving forces and in-novating companies.
( )B. Achilladelis, N. AntonakisrResearch Policy 30 2001 535–588540
Fig. 1. Driving forces of technological innovation.
The intensities of driving forces are time depen-dent as are the synergies among them. Their fluctua-tions determine to a considerable extent the rate oftechnical change and the quantity and quality of TI.They also vary among individual countries as theydepend on national endowment, culture and legisla-tion and, hence, strongly affect the geography of TI.
3.2. Originality of innoÕations
The origins of new products and new processesŽare frequently discoveries revelations of new knowl-
. Žedge or inventions devices, contrivances or pro-.cesses originated after study and experimentation
hence the contributions to individual innovations ofboth luck, serendipity and of systematic R&D andmeticulous development. The classification of TIsaccording to their originality is not a straightforwardprocess because of the absence of easily defineddiscontinuities in the space separating the inspiredfrom the trivial. The term RI is sometimes appliedonly for innovations that made history by giving riseto new sectors of industry, e.g., the steam engine, the
Žrailroad, the dynamo, mauveine the first synthetic. Ž .dye bakelite the first plastic material , the DC3
aircraft, nylon, DDT, the jet engine, the transistor,the electronic computer, etc. Among pharmaceuti-
Ž . Žcals, morphine the first alkaloid , carbolic acid the.first antiseptic , the rabies vaccine, the analgesicran-
Ž .tipyretic phenazone the first synthetic medicineŽ .arsphenamine the first chemotherapeutic agent ,
penicillin, and the process for recombinant DNAŽhave had a comparable effect. Some authors Free-
.man et al., 1982 have used the same term, RI, in awider sense by including also innovations, whichhave widened the scope and markets of existingindustries by the application or introduction of newscientific principles, technology or materials and,having displaced or competed successfully againstproducts or processes already in the market, servedas models for further innovations. Some examplesfrom the pharmaceutical industry are: the hypnotic
Ž .barbital VERONAL; 32 imitations , the diureticŽ .chlorthiazide DIURIL; 15 imitations , the antihyper-
Ž .tensive propranolol INDERAL; 24 imitations , andŽthe anxiolytic chlordiazepoxide LIBRIUM; 37 imi-
.tations . In this study, the term RI is used in thiswider sense.
The term II is applied to innovations designed onthe model of existing products or processes withtrivial differences in science, technology, materials,composition and properties and which, because ofthat, do not provide scope for further innovation byimitation. IIs are sometimes commercially successful

( )B. Achilladelis, N. AntonakisrResearch Policy 30 2001 535–588 541
and are the vehicle par excellence for the diffusionof technologies among companies and countries.
3.3. The dynamic effects of RI
RIs play a capital role in the advances of bothscience and technology, in the establishment andgrowth of industrial sectors, in the diffusion of tech-nology, and in the technological and scientific com-petencies and market specialization of companies.
3.3.1. RI and the adÕance of science and technologyScience advances following its own mechanisms,
dynamics and pace, which are determined, on onehand, by the curiosity of scientists, the strength oftheir intellect, their ability to design and performexperiments, the precision of their observations, thedepth, scope and interpretative power of their theo-ries and, on the other hand, by the excellence ofacademic institutions and research schools, the qual-ity of their leadership, the financial support providedby the public and private sectors and the prestige thatacademic and research communities enjoy on thepart of society and the public at large.
Until the middle of the 18th century, scientists,with the exception of mathematicians, studied naturalphenomena and classified mineral, plant and animalspecies. When inventors began to transform theproperties of materials by chemical and physicalmethods and to introduce new forms of energy,scientists extended the scope of their interests to thestudy of man made phenomena as well. Science andtechnology were—and remain since—inexorablylinked together so that apart of its traditional mecha-nisms, scientific advance is also influenced by socialand economic forces.
The strongest links between science and technol-ogy were forged by RIs—commercializations of in-ventions and discoveries—introduced when the sci-entific knowledge on which they depended was onlypartially understood. Such RIs resulted frequently bytrial-and-error experimentation, by luck or serendip-ity and attracted the curiosity of scientists and engi-neers, who strived to discover the missing scientificprinciples that were responsible for the properties ofthe new products and the mechanisms of the newprocesses. Their efforts to that end led to the advanceof both science and technology and, in some in-stances, even to the creation of new scientific disci-
plines, e.g., the steam engine and thermodynamics,mauveine and synthetic organic chemistry, the tran-sistor and solid state physics. In the pharmaceuticalindustry, morphine and pharmacology, the rabiesvaccine and bacteriology, arsphenamine and chemo-therapy, and the process for recombinant DNA andbiotechnology are such examples.
For most of the 19th century, and even today,academic researchers who made such discoveries lefttheir development to others and pursued their aca-demic careers, as were, for example, the physiciansand academics who discovered the first anaesthetics,hypnotics and antiseptics. However, some amongthem with business acumen recognized the commer-cial opportunities created by their discoveries andinventions and established companies to develop theircommercial applications. Some of these en-trepreneurial companies became the first R&D-intensive companies and led to the orientation of asignificant segment of academic research towardssubjects related to technology. Examples: W. Perkinin the dyestuffs industry; J. Lawes in the fertilizerindustry; Th. Edison and A.G. Bell in the telecom-munications industry; and, in the pharmaceutical in-
Ž .dustry, P.J. Pelletier and J. Caventou quinine , G.Ž . Ž .Merck alkaloids , E.R. Squibb ether , R. Marker
Ž . Ž .corticosteroids , H. Boyer bioengineering .With the growth of capitalist economies in the
second half of the 19th century, companies that madeprofits from the development and commercializationof academic discoveries and inventions became in-terested in improving and standardizing the qualityof their products, in expanding their markets byintroducing new products, in ameliorating the yields,minimizing the operational costs and eliminatinglosses and accidents when running their processes.All this called for a better understanding of thescientific principles on which their innovations andoperations depended, hence the work undertaken inacademia out of curiosity and scientific interest wasof commercial interest for entrepreneurs and manu-facturers. These common interests caused the forgingof relations between academic researchers and indus-trialists as the latter, encouraged by the profits madefrom such RIs, did not hesitate to back their interestwith money. They began by employing leading aca-demic scientists and engineers as consultants but, asthe urgency for industrial results could not be met by

( )B. Achilladelis, N. AntonakisrResearch Policy 30 2001 535–588542
the normal pace of academic advance, they began tofund research projects in universities and polytech-nics, and ended by organizing inhouse R&D labora-tories that were frequently directed by universityprofessors and staffed by well-trained scientists andengineers. These activities created synergies betweenacademic and industrial interests, which had orientat-ing and accelerating effects in the direction andadvance of both science and technology.
The archetypal example of academia–industry co-operation is that of the German chemical companiesŽ .Beer, 1959 , which became R&D-intensive to de-velop synthetic dyes since the 1860s and whichapplied their expertise in synthetic organic chemistryfor the discovery and manufacture of drugs in the1880s. The pharmaceutical divisions of Bayer andHoechst were the first AmodernB pharmaceuticalcompanies and, by being adopted as models byEuropean and American manufacturing apothecaries,they helped shape the structure and practices of the
Žpharmaceutical industry Baumler, 1968; Verg, 1988;.Lesch, 1993 .
Apart from the commercialization of intra- andextra-mural discoveries and inventions, research-in-tensive companies play a leading role in the diffu-sion of technologies by the introduction of IIs. Incontrast to RIs, which require contributions fromleading scientists and engineers who work at theforefront of their disciplines, the science and technol-ogy of IIs follows the advancing frontier of therelevant disciplines at best by a margin equal to thelead time of the RI, which was the adopted modelbut usually by much longer intervals so that leadingresearchers are not keen in stepping back to developIIs. This task is, however, important for researchteams in industrial laboratories, which have eitherintroduced the original RI and want to strengthentheir position by exploiting their own leads or bycompetitors who strive to get a foot in a promisingmarket. In some instances, IIs prove superior to theoriginal models and become very successful com-mercially. For example, among AblockbusterB drugs,Glaxo’s anti-gastric ulcer ZANTAC was made on
Ž .the model of Smith, Kline and French’s SKFTAGAMET, and Merck’s antihypertensive VA-SOTEC on that of Squibb’s CAPOTEN.
Lastly, a discovery, which is not commercializedor does not succeed in the marketplace, may be
scientifically or therapeutically interesting but failsto gain the financial support from industry and tocreate competition among companies. Progress insuch cases follows the pace of scientific advanceuntil this or an improved RI gets the nod from themarket. Such was the case of penicillin between itsdiscovery in 1928 and the realization that it was an
Žeffective antibacterial for humans in 1941 Hare,.1970 .
3.3.2. RI and market performanceThe relation between originality and commercial
performance of innovations is one of the most impor-tant aspects of the dynamics of TI. Only a strongpositive relation of originality to profitability couldkeep open the channels of communication and coop-eration between centers of academic excellence andindustrial laboratories and the employment of out-standing scientists and engineers by industry. If thisrelation did not exist, the interaction of academic andindustrial research would have been haphazard andconsequential. A linear relation between science andtechnology would have, most probably, ensued, eachsystem obeying its own dynamics and pace withhardly any acceleration caused by the synergies ofinteraction.
Apart from these macroeconomic aspects, the re-lation between originality and market success is amajor concern for company R&D managers whofrequently have to ponder over whether to proceedwith the development of inhouse expertise, buildnetworks of cooperation with academic leaders andface the technological and financial uncertainties of aproject aiming at an RI rather than follow a competi-tor’s lead hoping that with a relatively modest in-vestment in men and means, an improvement to anexisting process or product may turn out to be moreprofitable.
There was much anecdotal information butscarcely any statistical evidence for the relation be-tween originality and market performance of innova-tions. To this end, we have carried out three studieson subsectors of the chemical and the pharmaceutical
Žindustries organic chemical intermediates, pesticides.and antibacterial medicines for each of which we
have identified all the innovations introducedŽthroughout their history Achilladelis, 1993;.Achilladelis et al., 1987, 1990 . We repeated this

( )B. Achilladelis, N. AntonakisrResearch Policy 30 2001 535–588 543
Table 2The relation between originality and commercial performance ofinnovations
M OR
1 2 3 Total
PesticidesŽ . Ž . Ž . Ž .A 40% 36% 24% 100%34 31 21 85Ž . Ž . Ž . Ž .37% 22% 5% 13%Ž . Ž . Ž . Ž .B 17% 39% 44% 100%18 42 48 105Ž . Ž . Ž . Ž .20% 30% 12% 17%Ž . Ž . Ž . Ž .C 9% 15% 76% 100%39 68 338 445Ž . Ž . Ž . Ž .43% 48% 83% 70%
Ž .Total 100%89 140 405 634Ž . Ž . Ž . Ž .14% 22% 64% 100%
Organic intermediatesŽ . Ž . Ž . Ž .A 66% 28% 6% 100%118 50 11 179Ž . Ž . Ž . Ž .70% 25% 2% 22%Ž . Ž . Ž . Ž .B 18% 53% 29% 100%31 90 50 171Ž . Ž . Ž . Ž .19% 45% 11% 12%Ž . Ž . Ž . Ž .C 4% 12% 84% 100%20 58 393 471Ž . Ž . Ž . Ž .12% 30% 87% 57%Ž . Ž . Ž . Ž .Total 21% 24% 55% 100%169 198 454 821Ž . Ž . Ž . Ž .100% 100% 100% 100%
AntibacterialsŽ . Ž . Ž . Ž .A 61% 18% 21% 100%27 8 9 44Ž . Ž . Ž . Ž .64% 25% 7% 21%Ž . Ž . Ž . Ž .B 22% 28% 50% 100%8 10 18 36Ž . Ž . Ž . Ž .19% 31% 14% 18%Ž . Ž . Ž . Ž .C 6% 11% 83% 100%7 14 103 124Ž . Ž . Ž . Ž .17% 44% 79% 61%Ž . Ž . Ž . Ž .Total 20% 16% 64% 100%42 32 130 204Ž . Ž . Ž . Ž .100% 100% 100% 100%
CorticosteroidsŽ . Ž . Ž . Ž .A 56% 23% 21% 100%29 12 11 52Ž . Ž . Ž . Ž .66% 27% 15% 32%Ž . Ž . Ž . Ž .B 25% 41% 34% 100%8 13 11 32Ž . Ž . Ž . Ž .18% 30% 15% 20%Ž . Ž . Ž . Ž .C 9% 24% 67% 100%7 19 52 78Ž . Ž . Ž . Ž .16% 43% 70% 48%
Ž .Table 2 continued
M OR
1 2 3 Total
Ž . Ž . Ž . Ž .Total 27% 27% 46% 100%44 44 74 162Ž . Ž . Ž . Ž .14% 22% 64% 100%
CardioÕascularŽ . Ž . Ž . Ž .A 57% 17% 26% 100%40 12 18 70Ž . Ž . Ž . Ž .59% 20% 12% 26%Ž . Ž . Ž . Ž .B 23% 36% 42% 100%12 19 22 53Ž . Ž . Ž . Ž .18% 31% 16% 19%Ž . Ž . Ž . Ž .C 10% 20% 70% 100%16 30 105 151Ž . Ž . Ž . Ž .24% 49% 72% 55%Ž . Ž . Ž . Ž .Total 25% 22% 53% 100%68 61 145 274Ž . Ž . Ž . Ž .100% 100% 100% 100%
Central nerÕous systemŽ . Ž . Ž . Ž .A 43% 32% 25% 100%27 20 16 63Ž . Ž . Ž . Ž .59% 27% 13% 26%Ž . Ž . Ž . Ž .B 19% 40% 40% 100%9 19 19 47Ž . Ž . Ž . Ž .20% 26% 15% 19%Ž . Ž . Ž . Ž .C 7% 25% 67% 100%10 34 90 134Ž . Ž . Ž . Ž .21% 47% 72% 55%Ž . Ž . Ž . Ž .Total 19% 30% 15% 100%46 73 125 244Ž . Ž . Ž . Ž .100% 100% 100% 100%
OR: originality ranking:1 s radical; 2 s intermediate; 3 sincremental.M: market ranking: Asbig market success; Bsaverage; Csunsuccessful.The figure in bold characters indicates the number of productsclassified in each originalityrmarket rank. The upper percentage
Ž .figure refers to the horizontal row same market classification .ŽThe lower percentage figure refers to the vertical row same
.originality classification .
exercise for three subsectors of the pharmaceuticalindustry: corticosteroids, cardiovascular and CNSdrugs. Each innovation was then evaluated with thehelp of academic researchers and industrial managersin terms of originality and market performance on a
Ž . Ž . Ž .three level scale: RI 1 , intermediate 2 , and II 3 ;Ž . Ž .commercially successful A , intermediate B and
Ž .modest or failure C . The data are presented inTable 2. They show a statistically significant positive
( )B. Achilladelis, N. AntonakisrResearch Policy 30 2001 535–588544
relation of originality with commercial success, andof triviality with modest market performance or fail-ure. RIs, which represent about 20% of the innova-tions of each subsector, appear to have a greaterchance to succeed commercially: about 60% of themwere market successes and only 10% were modestmarket performers or failures. On the other hand, IIs,which represent about 60% of all innovations, wereusually commercially unsuccessful: about 70% ofthem were poor market performers and only 10–15%were commercially successful.
This relation lies at the heart of the dynamicfunction of RI in a capitalist economy as companiesleading in science and technology have a betterchance to be rewarded for their commitment.
3.3.3. The diffusion of technology: RI, TPs and TTsThe hypotheses proposed by Rosenberg, Nelson
and Winter, and Dosi about TPs and TTs offered anumber of plausible mechanisms regarding the ad-vance and diffusion of technologies and their interac-tions with the economy. The scarcity, however, ofquantitative empirical evidence led to a proliferationof related hypotheses regarding the microeconomicmechanisms by which science and technology ad-vance under a multitude of economic and marketconditions and on how the accelerating synergies andthe decelerating bottlenecks, which characterize thedynamics of TI, form and exert their influence.
To a great extent, the scarcity of empirical quanti-tative evidence was due to the lack of appropriatetechnology output indicators, which are indispens-able for the systematic testing of the proposed micro-and macro-economic hypotheses of technical change.The study of the technological and business history
Ž .of an industrial sector or subsector , the identifica-tion of all its innovations, the evaluation of theiroriginality and commercial success and their distri-bution over time offer an extremely useful tool forthat purpose. They provide a precise description ofthe rate of technical change, of the volume andquality of innovation of an industrial sector, andallow for comparisons of the innovation record, tim-ing, period of commitment and commercial perfor-mance of individual companies and countries.
A TP, defined as a model for the solution ofŽ .related technological problems Dosi, 1982 , was, in
most cases in the pharmaceutical industry, either aŽ .commercially successful radical innovation RIrMS ,
which was introduced when the scientific and medi-cal principles on which it depended were not com-pletely elucidated and offered a robust and versatilemodel for imitation, or a radical process innovation,which made possible the discovery or developmentof numerous drugs in one or more therapeutic cate-gories. Examples of the first case include: cortisoneŽ .CORTONE, Merck, 1948 in corticosteroids, barbi-
Ž .tal VERONAL, Bayer, 1903 in barbiturate hyp-notics; propranolol, the first beta adrenergic blockerŽ .INDERAL, ICI, 1964 in antihypertensives; chlor-
Ž .promazine LARGACTIL, Rhone Poulenc, 1952 inˆŽtranquilizers; chlordiazepoxide LIBRIUM, Roche,
. Ž1960 , in anxiolytics. For more examples, see Table.3 . Examples of the second case include: the chemi-
cal processes for the isolation and purification ofalkaloids, which led to the development of manydrugs for a score of therapeutic uses, such as mor-phine, quinine, papaverine, codeine, noscapine, etc.;the process of screening soil samples for the identifi-cation of fungal metabolites with antibacterial prop-erties and the process of deep aerobic fermentation,which made possible the industrial production ofpenicillin and the discovery of a score of antibiotics,such as streptomycin, tetracycline, chloramphenicol,erythromycin, etc., which have nothing in commonin terms of structure or composition. Fermentationprocesses for the production of 6-aminopenicillanicacid and 7-aminocephalosporanic acid made possiblethe manufacture of a wide range of semisyntheticpenicillins and cephalosporins. The processes forrecombinant DNA and cell fusion opened the bio-technology era for the pharmaceutical industry andled to biosynthetic proteins, such as human insulinand growth hormone, antineoplastic drugs and diag-nostics.
It should be noted that there are many commer-cially successful RIs that cannot be imitated fortechnological reasons as was the case of vitamins,centrally acting antihypertensives, e.g., methyl DOPAŽ . ŽALDOMET, Merck, 1961 , clonidine CATA-
.PRESS, Boehringer, 1966 , and antineoplastic drugs,Ž .e.g., tamoxifen NOLVADEX, ICI, 1971 and cis-
Ž .platin PLATINOL, Bristol, 1978 . Thus, the tech-nology of an industrial sector or subsector advancesby both paradigms and by innovations unrelated to

( )B. Achilladelis, N. AntonakisrResearch Policy 30 2001 535–588 545
Table 3Ž .Generations, clusters of technologies, and radical innovations in the pharmaceutical industry 1800–1995
Generations Technologies First radical Year Company Countryinnovations
Ž .First 1 Alkaloids Morphine 1806 – GEŽ .1802–1880 Quinine 1820 – FR
Ž .2 Organic chemicals Ether 1842 – USAŽ .Second 1 AnalgesicsrAntipyretics Phenazone ANTIPYRIN 1884 HOECHST GE
Ž .1880–1930 Acetanilide ANTIFEBRIN 1886 KALLE GEŽ .2 Hypnotics Sulfonmethane SULFONAL 1888 BAYER GE
Barbital VERONAL 1903 BAYER GEŽ .3 Biologicals Anthrax vaccine 1881 – FR
Diphtheria serum 1890 HOECHST GEŽ .4 Local anesthetics Cocaine 1860 – GErAUS
Orthocaine ORTHOFORM 1896 HOECHST GEŽ .5 Antiprotozoal Arsphenamine SALVARSAN 1911 HOECHST GEŽ .Third 1 Vitamins Ergosterol PRO-VITAMIN D 1927 – GE
Ž .1930–1960 Retinol VITAMIN A 1931 ROCHE SWAscorbic acid VITAMIN C 1934 ROCHE SW
Ž .2 Sex hormones Estrone – 1931 PARKE-DAVIS, USrGESCHERING
Testosterone – 1935 PARKE-DAVIS, USrGErSCHERING, NErSWORGANON
Ž .3 Sulphonamides Sulphamido- PRONTOSIL 1935 BAYER GEchrysoidine
Ž .4 Antihistamines Phenbenzamine ANTEGRAN 1942 RHONE FRŽ .5 Antibiotics Penicillin PENALEN 1943 MERCK, PFIZER USŽ .6 Corticosteroids Cortisone CORTONE 1948 MERCK USŽ .Fourth 1 Antihypertensiverdiuretics Chlorothiazide DIURIL 1958 MERCK US
Ž . Ž .1960–1980 2 Antihypertensive B-blockers Propranolol INDERAL 1964 ICI UKŽ .3 CNS drugs Chlorpromazine LARGACTIL 1952 RHONE FRŽ .4 Tranquilizers Haloperidol HALDOL 1958 JANSSEN BEŽ .5 Antidepressants Imipramine TOFRANIL 1959 GEIGY SWŽ .6 Anxiolytics Chlordiazepoxide LIBRIUM 1960 ROCHE SWŽ .7 Semisynthetic antibiotics Phenethicillin BROXIL 1959 BEECHAM UK
Cephalothin KEFLIN 1964 LILLY USCephaloridine CEPORIN 1964 GLAXO UK
Ž .8 Non-steroid antiinflammatory Phenyl butazone BUTAZOLIDIN 1952 GEIGY SWŽ .drugs NSAIDS Ibuprofen BRUFEN 1964 BOOTS UK
Indomethacin INDOCID 1964 MERCK USŽ .9 Oral contraceptives Mestranolr ENOVID 1961 SEARLE US
norethynodrelŽ .Fifth 1 Calcium ion channel antagonists Nifedipine ADALAT 1974 BAYER GE
Ž . Ž .1980–1993 2 ACE inhibitors Captopril CAPOTEN 1977 SQUIBB USŽ .3 Hypolipidemics Lovastatin MEVACOR 1987 MERCK USŽ .4 Serotonin inhibitors Methysergide SANSERT 1962 SANDOZ SWŽ .5 Anti-Parkinson Carbidopa SINEMET 1967 MERCK US
Bromocryptine PARLODEL 1978 SANDOZ SWŽ .6 Anti-nausea Domperidone MOTILIUM 1979 JANSSEN BEŽ .7 Gastric and duodenal ulcers Cimetidine TAGAMET 1976 SKF USŽ .8 Antiviral Acyclovir ZOVIRAX 1982 WELLCOME UKŽ .9 Biotechnology Human insulin HUMULIN 1983 GENENTECHr US
LILLYSomatrem PROTROPIN 1985 GENENTECH US

( )B. Achilladelis, N. AntonakisrResearch Policy 30 2001 535–588546
them. The greater the contribution of paradigms, theŽfaster the advance e.g., in the case of CNS drugs,
.antihistamines and corticosteroids because the pres-ence of versatile models for imitation reduces thedependence of innovating firms on further discover-ies, inventions or advances in academic science,which are less predictable and more difficult to comeŽe.g., antihypertensives up to the late 1950s and of
.antineoplastic drugs .TTs, defined as the patterns of problem solving
Žactivities, i.e., of progress based on a TP Dosi,.1982 , describe the rate of diffusion of technologies.
They are initiated by a commercially successful radi-Ž .cal innovation RIrMS , which is followed by many
other RIs and IIs. Robustness and versatility of theoriginal RIrMS, the size of the market and thenumber of competing companies determine the ex-tent to which the model will be imitated, i.e., thestrength and time span of the TT.
The distribution of innovations over time providesan accurate profile of a TT because the totality ofinnovations introduced up to any moment in timerepresents the progress of a technology made thatfar. Even the stock of academic research and of tacit
knowledge accumulated by researchers and compa-nies is embodied in the innovations, while this is notthe case when using other R&D output indicators,such as scientific papers or patents.
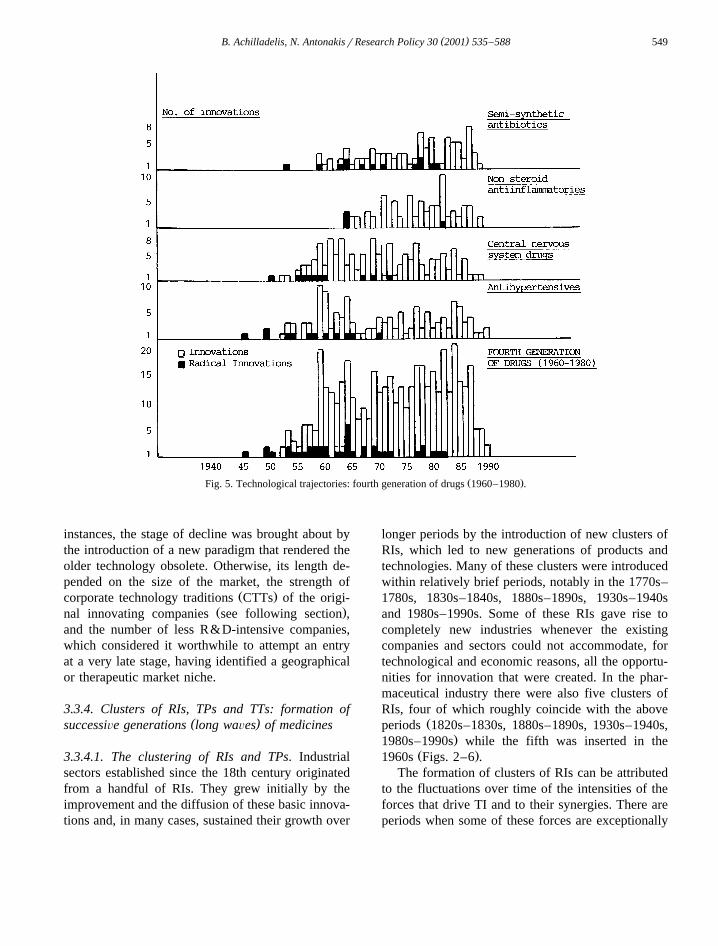
Figs. 2–6 present the most important TTs of thepharmaceutical industry traced by the distributionover time of the RIs and IIs related to each TP. Theyare arranged chronologically in the order of the fiveconsecutive generations of drugs, which are profiledby integrating the corresponding TTs. Fig. 7 showsthe overlap of the last three generations of drugsŽ .1930–1990 . Lastly, Fig. 8 shows the distributionover time of all RIs and IIs whether they belong toTTs or not. All TTs are roughly bell-shaped butshow important differences among them caused bythe changing intensities of the driving forces. Forexample, the time span varies from nearly 80 yearsfor the TTs of the first two generations to about 50years for the TTs of the next two generations, whilethose of the last generation have not yet run their fullcourse. However, even among contemporary TTs,some have a shorter span either because of very fastdiffusion of the technology due to inadequate patentprotection, e.g., antihistamines and corticosteroids,
Ž .Fig. 2. Technological trajectories: first generation of drugs 1820–1880 .

( )B. Achilladelis, N. AntonakisrResearch Policy 30 2001 535–588 547
Ž .Fig. 3. Technological trajectories: second generation of drugs 1880–1930 .
or because a new paradigm rendered the technologyobsolete, e.g., corticosteroids.
TTs are divided into four rather distinct stages:Ž .a The stage of youth, shown by the early, nearly
flat part of the curve, was usually of short durationand was characterized by a few, mostly radical,innovations. Unless the new technology addressed apreviously untreatable disease, e.g., Salvarsan forsyphilis, market demand was usually weak at thatstage because of the familiarity of the medical pro-fession with drugs already in the market, e.g., thecase of penicillin in 1942 following the introduction
Ž .of antibacterial sulphonamides 1935 . Pharmaceuti-cal companies were, however, aware of both thesocietal need and the potential of a therapeuticmarket from national and worldwide health statistics.The stage of youth ended by the introduction of a
Ž .commercially successful radical innovation RIrMS ,which triggered the process of imitation by the inno-vating company and its competitors.
Ž .b The stage of growth is represented by thesharply rising part of the bell-shaped curve. It is
characterized by a sharp increase in the number ofinnovating companies and innovations many of whichare RIs because TPs were usually sufficiently versa-tile to offer opportunities for radical departures, notonly for IIs. Many of them were also commerciallysuccessful because the markets were rapidly expand-ing. Competing companies tried to improve the ther-apeutic effectiveness of the original drug, to elimi-nate side effects, to develop better manufacturingprocesses and to circumvent patent barriers. Most
Ž .RIs and market successful drugs MSs of a TT wereintroduced at that stage and the technology expandedalong unexpected directions hardly envisaged by theoriginal innovators. The strength of the stage ofgrowth determined to a considerable extent the lengthof the span of the TT, the size and diversity of themarkets and the leading companies of the sector.
Whenever patent protection was particularly ef-fective andror when only few companies could takeadvantage of the opportunities opened by the TPbecause of low R&D intensity in the industry as a
Ž .whole 1820–1920 , the stage of growth spread over

( )B. Achilladelis, N. AntonakisrResearch Policy 30 2001 535–588548
Ž .Fig. 4. Technological trajectories: third generation of drugs 1930–1960 .
decades rather than years. Thus, the stages of matu-rity and decline of the second generation of drugswas located in the 1940s and beyond, i.e., whencompetition sharpened by the entry of many R&D-intensive companies. On the contrary, the span of theTTs of the third and fourth generations was muchshorter because of the presence at the time of theirintroduction of many R&D-intensive companiesŽ .Section 4 .
Ž .c The stage of maturity is represented by therather flat segment of the TT during which thenumber of innovations introduced annually reachesand passes its peak. Most innovations were incre-mental as the potential of the technology was by thenlargely exhausted. The numerous IIs represent theefforts of latecomer, less expert, companies, whichstrived to gain entry in a vigorous market which bythen was reaching its peak. Depending on the size ofthe market, some of these IIs became commerciallysuccessful. In many cases, the patents of the originalinnovations expired at that stage facilitating the entry
of less expert companies as shown by the vigor ofthe Abandwagon effectB, i.e., the number of compa-nies entering the market with an own innovationŽ .Fig. 9 . The length of this stage depends primarilyon the size of the market which, as the technology isby then unable to create new radical departures,provides the only initiative for companies already inthe market to pursue their R&D and innovation inthat area, or for newcomers to attempt an entry inthat market despite the established position of theearly innovators. The modest commercial perfor-
Ž .mance of IIs Table 2 can be attributed to theirlaunching at the later stages of TTs when the leadingdrugs were well established in the market and weredifficult to dislocate by newer products most ofwhich did not offer substantial therapeutic advan-tages.
Ž .d The stage of decline is represented by the tailsegment of the bell-shaped curve and is character-ized by a drastic reduction in the number of innova-tions and the absence of both RIs and MSs. In many
( )B. Achilladelis, N. AntonakisrResearch Policy 30 2001 535–588 549
Ž .Fig. 5. Technological trajectories: fourth generation of drugs 1960–1980 .
instances, the stage of decline was brought about bythe introduction of a new paradigm that rendered theolder technology obsolete. Otherwise, its length de-pended on the size of the market, the strength of
Ž .corporate technology traditions CTTs of the origi-Ž .nal innovating companies see following section ,
and the number of less R&D-intensive companies,which considered it worthwhile to attempt an entryat a very late stage, having identified a geographicalor therapeutic market niche.
3.3.4. Clusters of RIs, TPs and TTs: formation of( )successiÕe generations long waÕes of medicines
3.3.4.1. The clustering of RIs and TPs. Industrialsectors established since the 18th century originatedfrom a handful of RIs. They grew initially by theimprovement and the diffusion of these basic innova-tions and, in many cases, sustained their growth over
longer periods by the introduction of new clusters ofRIs, which led to new generations of products andtechnologies. Many of these clusters were introducedwithin relatively brief periods, notably in the 1770s–1780s, 1830s–1840s, 1880s–1890s, 1930s–1940sand 1980s–1990s. Some of these RIs gave rise tocompletely new industries whenever the existingcompanies and sectors could not accommodate, fortechnological and economic reasons, all the opportu-nities for innovation that were created. In the phar-maceutical industry there were also five clusters ofRIs, four of which roughly coincide with the above
Žperiods 1820s–1830s, 1880s–1890s, 1930s–1940s,.1980s–1990s while the fifth was inserted in the
Ž .1960s Figs. 2–6 .The formation of clusters of RIs can be attributed
to the fluctuations over time of the intensities of theforces that drive TI and to their synergies. There areperiods when some of these forces are exceptionally

( )B. Achilladelis, N. AntonakisrResearch Policy 30 2001 535–588550
strong and exert powerful pressures on innovatinginstitutions causing the introduction of numerous RIssome of which have the qualities—robustness, versa-tility, commercial appeal—which lead to the initia-tion of TTs. Among driving forces, those whichshow abrupt changes in intensity are: scientificrtechnological advance, new materials and govern-ment legislation.
3.3.4.2. Scientific adÕance. For the pharmaceuticalindustry that thrived on a two-way vigorous relationwith chemistry, the life sciences and medicine, scien-tific advance was the major driving force for all five
Ž .clusters Section 4 . Science and technology advanceby quantum jumps, which are followed by periods ofless adventurous steps along the established path-ways. Such discontinuities are not caused only by thescientific revolutions of historical dimensions de-
Ž .scribed by Kuhn 1962 but also by the gradualaccumulation of knowledge, which at certain mo-ments in time makes possible the understanding of agroup of previously incomprehensible phenomena,by the introduction of novel scientific instruments
that make possible the observation and study of agroup of natural and man made phenomena, and bythe interaction and cross-fertilization of disciplines,which open new horizons for study and interpreta-tion. TPs are closely associated with the advancingfrontier of scientific disciplines so that periods ofrevolutionary advance create opportunities for moreTPs than do periods of evolutionary advance.
Raw materials are, perhaps, the most obviousdriving force that cause clustering of RIs: cottonŽ . Ž .1770s , coal and cheap steel 1830s , coal tarŽ . Ž .1880s , oil and petrochemicals 1930s , have allcreated clusters of TPs and new R&D-intensiveindustries. In the case of the pharmaceutical industry,
Ž .tropical medicinal plants 1820s and coal tar derivedŽ .organic chemicals 1880s have contributed to the
corresponding clusters of TPs.GoÕernment legislation has led to clustering of
RIs particularly when it was related to armed con-flicts or the preparation for war but in the case of thepharmaceutical industry, because of its relevance topublic health, it contributed also during peacetime.The establishment of public medical research labora-
Ž .Fig. 6. Technological trajectories: fifth generation of drugs 1980–1993 .

( )B. Achilladelis, N. AntonakisrResearch Policy 30 2001 535–588 551
Ž .Fig. 7. Overlap of successive Along wavesB third, fourth, and fifth generations of drugs up to 1990 .
Ž .tories 1880s , funding of the wartime projects forŽ .penicillin, malaria, and corticosteroids 1940s , the
Ž .patenting of drugs Germany, 1880s , of naturalŽ .antibiotics USA, 1940s and of bioengineered pro-
Ž .teins USA, 1980s have all contributed to the clus-tering of RIs and TPs.
3.3.4.3. The clustering of TTs: successiÕe genera-( )tions A long waÕesB in the pharmaceutical indus-
try. The trajectories that technologies follow beyondtheir stage of youth are determined by the qualitiesof the TPs, the inherent properties of each technol-ogy and by the driving forces for TI, which exert
ŽFig. 8. Distribution of innovations, radical innovations, and innovations related to technological trajectories over time 3-year moving.average .

( )B. Achilladelis, N. AntonakisrResearch Policy 30 2001 535–588552
Fig. 9. ABandwagon effectB: technological trajectories and first entry of companies by an own innovation.
their influence throughout their span, in particular,by market demand and competition which becomeincreasingly important at the later stages of the TTs.Thus, many of the technologies that are launchedwithin brief periods are likely to follow paralleldiffusion patterns, i.e., TTs cluster together through-out their span, because innovating institutions areexposed to the influence of a homogeneous commer-cial and competitive environment, or, in other words,
Ž .to driving forces of similar intensities Figs. 2–7 .Whenever such a cluster of TTs is formed within
a particular industry, it dominates its technologicaland commercial development. The coincidence oftheir stages of growth and maturity creates waves ofradical and particularly of IIs, a fast growth ofmarket demand, a powerful Abandwagon effectB andthe industry as a whole expands and flourishes.When they reach the stage of decline, they followone of two alternative pathways depending on the
rate of advance of the scientific disciplines and thetechnologies on which the industry depends: either anew cluster of RIs is introduced and the industry isregenerated by riding a new wave of innovation andcommercial expansion, or it becomes a technologi-cally mature sector with declining profitability andan oligopolistic market due to the dropping out ofmany companies and the merger of the rest into fewlarge, less R&D-intensive companies.
There was considerable overlap between succes-Ž .sive clusters of TTs Fig. 7 and substantial depen-
dence of the more recent TTs on their predecessorsbecause of the cumulative character of scientific andtechnological knowledge and of the common mar-kets they addressed. However, the clustering of RIsand TTs and the formation of successive generationsof drugs is clearly documented by the patterns ofdistribution of innovations, the identification of thescientific and technological advances that caused the

( )B. Achilladelis, N. AntonakisrResearch Policy 30 2001 535–588 553
emergence of the newer and the obsolescence of theolder technologies, and by significant changes in thecompetitive environment of the pharmaceutical in-dustry that were associated with the successions of
Ž .generations Section 4 . These characteristics and thecoincidence in the timing of introduction of four outof the five generations of drugs with those of theAlong wavesB of world economic growth indicatethat the pharmaceutical industry has followed thegeneral pattern of economic development as de-scribed by macroeconomic theory but showed anexceptional flexibility and adaptability, which en-sured its survival as one of the most innovative andprofitable businesses.
As in the case of Along wavesB, the transitionfrom generation to generation required considerableskills and ingenuity on the part of individual pharma-ceutical companies that were forced to drop tradi-tional products, technologies and markets to developnew ones and adapt to new competitive settings.Those companies that failed to make these adjust-ments lost their competitive edge and either mergedwith or were acquired by their more successful com-petitors.
3.4. The pharmaceutical firm as innoÕating institu-( )tion Corporate Technology Traditions CTTs
3.4.1. Corporate technology traditionsA common characteristic of companies in R&D-
intensive industries is that they tend to specialize infew technologies on which they rely for the develop-
Ž .ment of their new products. Pavitt 1984 attributedthis phenomenon to a process of knowledge accumu-lation in industrial firms: A.industrial firms cannotand do not identify and evaluate all innovation possi-bilities indifferently, but are constrained in theirsearch by their existing knowledge and skills toclosely related zonesB. We propose that the synergiesof the driving forces of TI, and the dynamic effectsof RIs and TTs provide a plausible explanation ofhow and why this happens.
External driving forces are effective only to theextent that they generate internal forces within theinstitutions that foster innovation: private companiesfirst and foremost and then academic institutions,government research laboratories, public and privatenot for profit research institutions. The research-in-
tensive pharmaceutical firm is the most effectiveagency for TI because it is sensitive and able torespond to the stimuli of all the driving forces; it isespecially sensitive to market demand and competi-
Ž .tion Fig. 1 .Research-intensive companies respond to external
stimuli by the investment of capital for the develop-ment of new products and processes in anticipationof sizable returns from their commercialization.Making profit is the Araison d’ etreB of a capitalistˆenterprise so that however strong the external stimuliand the conviction of company managers that R&Dand innovation are essential for survival in the com-petitive setting of an R&D-intensive industry, theywill not support for long—and may eventually re-treat from the sector—unless the company’s cashflow can provide for the required investments. Com-pany R&D budgets are not determined by expecta-
Ž .tions but by the size of cash flow Section 3.4.3 .As shown in Table 2, RIs are more frequently
commercially successful than IIs and, hence, moreprofitable, so that innovating companies can spendmore on further R&D to perpetuate their advantagethan competitors who introduce IIs. However, theintroduction of an RI has another important conse-quence: although it is a company’s response to thestimulus of external driving forces, once launched, itintensifies rather than satisfies them. It has beenargued earlier that the introduction of a commer-
Ž .cially successful radical innovation RIrMS exertsan orientating effect on scientific or technologicaladvance, strengthens market demand and sharpenscompetition. Thus, the innovating company findsitself under stronger pressure to pursue R&D andinnovation in the same technology and market afterrather than before the introduction of the RI. This isan important, but not the only, reason that leadsresearch-intensive companies to specialize in sci-ence, technology and markets.
Apart from intensifying the AenvironmentalB driv-ing forces, RIrMSs when introduced at the earlystages of a TT, create a powerful internal drivingforce within innovating companies, which stronglyinfluences their subsequent R&D, innovation andmarkets. We have called this driving force a ACTTBŽ .Achilladelis, 1973; Achilladelis et al., 1987, 1990and defined it as AA company’s specialization in atechnology, its underlying science and the markets of

( )B. Achilladelis, N. AntonakisrResearch Policy 30 2001 535–588554
the products derived from it, achieved by an earlycommercially successful RI and followed by theconcentration of its resources, the specialization ofits staff and the introduction of many technologicallyrelated innovations over a very long period of timeranging from 20 to 40 yearsB.
The strong, post innovation, commitment to moreR&D leads, on one hand, to the concentration of thecompany’s finite R&D resources on one or a fewareas depending on its R&D budget and creativity atthat time and, on the other hand, to an accumulationof knowledge and experience, including markets andmarketing. This expertise creates opportunities forthe improvement of the original innovation by IIsand even by further RIs.
This drive for further innovation is caused by theemergence of the following strong corporate forces.
3.4.1.1. Scientific leadership. The underlying scienceof an RIrMS introduced at an early stage of a TT isusually close to the advancing frontier of the relevantscientific disciplines so that company researchers,encouraged by their success and the availability offunds, deepen and widen their knowledge and, inmany instances, come to be recognized by theiracademic and industrial peers as authorities in theirdisciplines. This distinction is appreciated by bothresearchers and managers who project it as proof ofthe company’s technological leadership and are ea-ger to nurse and to maintain it for as long as it ispossible.
3.4.1.2. Influence on top management. Innovatorsand managers associated with an original and lucra-tive innovation are usually promoted to positions ofinfluence from which they steer the company’s inno-vative efforts towards technologies and markets withwhich they are most familiar.
3.4.1.3. Time lag. As R&D begins on average 8–10years before commercialization of an RI, companiesare eager to consolidate their position by introducingIIs with improved properties before their competitorscover that lag and become able to compete.
3.4.1.4. Familiarity with markets. Early commercial-ization of an RI requires the opening of a new or thedevelopment of an existing market, which lead to
specialization of company marketingrsales depart-ments, a feature particularly important in the phar-maceutical industry whose markets are global andthe investments required for that purpose immense.Feedback from users and the medical professionleads to market expansion by the design of IIs withimproved properties.
3.4.1.5. Economies of size and scope. Cash flowcreated by an RIrMS leads to further investments inR&D, manufacturing capacity and marketingrsales,which create economies of size and scope. Theselection of subsequent R&D projects whose costcan be cut by sharing accumulated knowledge, re-search facilities and marketing networks, becomeseasier and leads, in turn, to further specializationŽ .Henderson and Cockburn, 1996 .
3.4.1.6. The A inÕented hereB syndrome. Companiesshow a strong tendency to pursue their own leadsrather than those of their competitors. This is fre-quently the case of very innovative firms.
The resultant of these forces is the establishmentof CTTs that acquire their own momentum so thatover periods ranging from 20 to 40 years, a dispro-portionate number of innovations result from thesame technology. Although the originality of allthese innovations cannot be high, some are commer-cially successful and help perpetuate the CTT.
The study of innovations in subsectors of thepharmaceutical industry shows that leading compa-nies in each one of them have all introduced RIrMSat the early stages of the corresponding TTs andhave created long lasting CTTs by which they gained
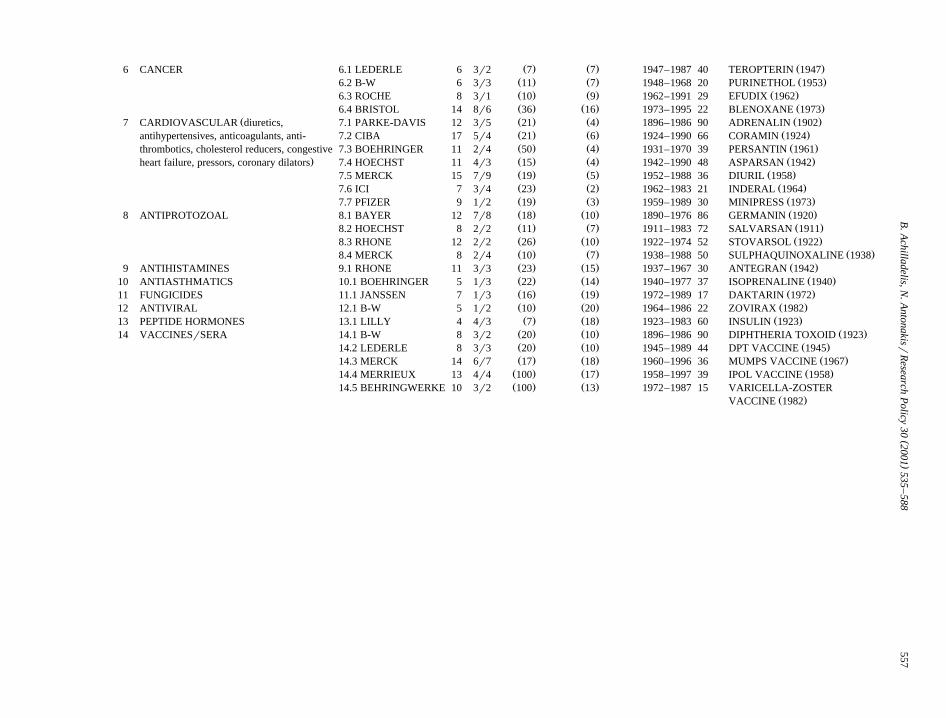
Ž .important competitive advantages Tables 4, 5 . Table5 lists all the CTTs that we identified in the thera-peutic sectors reviewed in this paper.
3.4.2. CTTs, TTs and the A riding B of A long waÕesBMany innovations of a CTT belong to a particular
TT and it may be said that they represent that part ofthe TT, which was appropriated by a particularcompany. The strength of this relation is manifestedby the fact that although companies innovate insuccessive TTs within a therapeutic market, theyseldom introduce the TP that launches the newerTTs. The blurred sensitivity of companies with CTTs

()
B.A
chilladelis,N.A
ntonakisrR
esearchP
olicy30
2001535
–588
555
Table 4Ž . w Ž . Ž . Ž .xTop innovating companies 1880–1992 innovations, radical innovations RIs , market successes MSs and the contribution of corporate technology traditions CTTs
No. Company Country 1880–1930 1930–1960 1960–1980 1980–1992 Total CTTs
No Innvs RI MS No Innvs RI MS No Innvs RI MS No Innvs RI MS No Innvs RI MS No of Innvs of % of totalCTTs CTTs Innvs
Ž .1 CIBA-GEIGY SW 2 0 2 48 19 14 23 8 8 9 1 1 82 28 25 5 61 74Ž .2 ROCHE SW 3 0 1 30 12 8 25 4 7 24 4 4 82 20 20 5 50 61Ž .3 MERCK US – – – 33 17 18 30 14 15 16 7 10 79 38 43 7 60 75Ž .4 HOECHST GE 19 8 8 12 3 5 24 4 6 18 2 2 73 17 21 3 31 42Ž .5 BAYER GE 25 11 11 19 6 11 16 6 4 6 2 1 66 25 27 3 39 60Ž .6 LILLY US 5 4 4 15 8 6 28 8 10 10 5 4 58 25 24 2 18 31Ž .7 PARKE DAVIS US 6 3 3 21 6 7 22 3 6 8 0 2 57 12 18 1 12 21
a Ž .8 B-W UK 8 3 3 20 8 6 9 3 3 14 2 2 51 16 14 3 19 38Ž .9 PFIZER US – – – 18 4 7 22 5 7 7 3 1 47 12 15 2 24 51Ž .10 RHONErM&B FR 3 1 1 27 11 10 14 2 0 2 0 0 46 14 11 2 23 50Ž .11 UPJOHN US – – – 19 5 5 18 5 4 7 3 1 44 13 10 1 14 32Ž .12 JANSSEN BE – – – 4 1 1 28 4 5 12 0 3 44 5 9 3 34 77Ž .13 LEDERLE US – – – 27 14 12 11 1 2 3 0 1 41 15 15 3 26 63Ž .14 BRISTOL US – – – 7 2 1 19 6 4 13 2 3 39 10 8 2 29 74Ž .15 SANDOZ SW 1 1 1 8 2 0 17 1 2 12 3 4 38 7 7 1 13 34Ž .16 ABBOTT US 8 0 2 12 3 3 13 6 0 3 0 0 36 9 5 1 14 39
17 STERLING US – – – 13 0 4 15 1 3 6 0 0 34 1 7 – – –18 SCHERING US – – – 14 4 8 9 2 2 10 3 0 33 9 10 – – –
Ž .19 GLAXO UK – – – 11 3 2 13 4 4 8 2 4 32 9 10 1 8 25b20 AHP US – – – 9 0 1 15 0 3 7 1 1 31 1 5 – – –
c Ž .21 ICI UK – – – 13 3 4 12 6 4 5 0 2 30 9 10 1 7 23d22 SKF US – – – 13 3 9 14 3 4 1 0 0 28 6 13 – – –
23 SQUIBB US – – – 13 6 7 9 4 3 4 2 2 26 12 12 – – –Ž .24 SCHERING AG GE 4 4 0 10 7 4 11 0 0 1 1 0 26 12 4 1 16 61
25 MERRELL-DOW US – – – 9 0 0 8 1 0 6 1 1 23 2 1 – – –Ž .26 BOEHRINGER GE 1 0 – 6 1 2 13 2 6 2 0 0 22 3 8 2 16 73Ž .27 SYNTEX US – – – 8 3 2 8 0 4 6 0 0 22 3 6 1 16 72Ž .28 BEECHAM UK – – – 2 1 0 11 2 2 8 2 1 21 5 3 1 15 71Ž .29 SEARLE US – – – 8 3 4 8 1 4 1 0 0 17 4 8 1 9 53Ž .30 ORGANON NE – – – 6 3 3 7 0 1 1 0 0 14 3 4 1 11 78
a Burroughs-Wellcome.bAmerican Home Products.c Imperial Chemical Industries, Zeneca since the 1980s.dSmith Kline French.

()
B.A
chilladelis,N.A
ntonakisrR
esearchP
olicy30
2001535
–588
556
Table 5Ž .Corporate technology traditions CTTs by therapeutic sector
No. Sector Company Innovations Commitment First RIrMS
No. RIrMS % of company % of sector Period Yearsinnovations innovations
Ž . Ž . Ž .1 ANALGESICSrANTIPYRETICS 1.1 HOECHST 12 3r5 16 9 1882–1981 99 ANTIPYRIN 1884Ž . Ž . Ž .1.2 MERCK 6 2r5 7 4.5 1945–1979 34 MYOCRISIN 1945Ž . Ž . Ž .1.3 CIBA 6 1r1 7 4.5 1950–1976 26 BUTAZOLIDIN 1952Ž . Ž . Ž .1.4 ROCHE 8 1r1 10 6 1946–1982 36 DROMORAN 1946Ž . Ž . Ž .1.5 JANSSEN 7 1r2 16 5 1958–1984 26 PALFIUM 1958
Ž Ž . Ž . Ž .2 ANTIBACTERIALS Sulphonamides, 2.1 BAYER 11 4r5 16 5 1935–1985 50 PRONTOSIL 1935. Ž . Ž . Ž .Antibiotics, Synthetics 2.2 MERCK 13 9r5 16 6 1939–1986 47 PENICILLIN 1943
Ž . Ž . Ž .2.3 LEDERLE 12 4r5 30 6 1940–1987 47 AUREOMYCIN 1948Ž . Ž . Ž .2.4 PFIZER 15 5r6 32 7 1943–1986 43 PENICILLIN 1943Ž . Ž . Ž .2.5 LILLY 14 8r7 24 7 1952–1983 31 ILOTICIN 1952Ž . Ž . Ž .2.6 GLAXO 8 4r5 25 4 1955–1987 32 SEPORAN 1964Ž . Ž . Ž .2.7 BRISTOL 15 2r1 38 7 1956–1987 31 TETREX 1956Ž . Ž . Ž .2.8 BEECHAM 15 4r3 70 7 1959–1985 26 BROXIL 1959Ž . Ž . Ž .3 VITAMINS 3.1 ROCHE 5 4r4 5 35 1934–1978 44 VITAMIN C 1934Ž . Ž . Ž .3.2 MERCK 4 4r4 5 25 1937–1949 12 VITAMIN B1 1937Ž . Ž . Ž .4 SEX HORMONESrCORTICOSTEROIDS 4.1 CIBA 14 8r4 17 10 1934–1973 39 PROGESTERONE 1934Ž . Ž . Ž .4.2 SCHERING AG 16 7r4 61 11 1931–1977 46 PROGYNON 1931Ž . Ž . Ž .4.3 ORGANON 11 3r4 78 8 1920–1975 55 OVARIAN EXTRACT 1920Ž . Ž .4.4 SYNTEX 16 3r5 73 11 1944–1981 37 PROGESTERONE FROM
Ž .DIOSGENIN 1944Ž . Ž . Ž .4.5 SEARLE 9 3r5 53 6 1951–1965 14 NILEVAR 1955Ž . Ž .4.6 UPJOHN 14 3r4 32 10 1935–1979 44 CORTISONE FROM
Ž .PROGESTERONE 1952Ž Ž . Ž . Ž .5 CNS MEDICINES anesthetics, hypnotics, 5.1 BAYER 13 3r5 20 4 1888–1996 78 SULPHONAL 1888
Ž . Ž . Ž .antidepressants, anxiolytics, neuroleptics, 5.2 ABBOTT 14 1r3 40 5 1922–1977 55 NEONAL 1922. Ž . Ž . Ž .anti-Parkinson, antiemetics 5.3 CIBA-GEIGY 11 5r4 13 4 1945–1977 32 RESERPINE 1953
Ž . Ž . Ž .5.4 ROCHE 24 4r5 30 8 1948–1989 41 MARSILID 1957Ž . Ž . Ž .5.5 SANDOZ 13 2r2 34 4 1952–1992 40 SANSERT 1962Ž . Ž . Ž .5.6 JANSSEN 20 3r3 45 7 1958–1988 30 HALDOL 1958
()
B.A
chilladelis,N.A
ntonakisrR
esearchP
olicy30
2001535
–588
557
Ž . Ž . Ž .6 CANCER 6.1 LEDERLE 6 3r2 7 7 1947–1987 40 TEROPTERIN 1947Ž . Ž . Ž .6.2 B-W 6 3r3 11 7 1948–1968 20 PURINETHOL 1953Ž . Ž . Ž .6.3 ROCHE 8 3r1 10 9 1962–1991 29 EFUDIX 1962Ž . Ž . Ž .6.4 BRISTOL 14 8r6 36 16 1973–1995 22 BLENOXANE 1973
Ž Ž . Ž . Ž .7 CARDIOVASCULAR diuretics, 7.1 PARKE-DAVIS 12 3r5 21 4 1896–1986 90 ADRENALIN 1902Ž . Ž . Ž .antihypertensives, anticoagulants, anti- 7.2 CIBA 17 5r4 21 6 1924–1990 66 CORAMIN 1924Ž . Ž . Ž .thrombotics, cholesterol reducers, congestive 7.3 BOEHRINGER 11 2r4 50 4 1931–1970 39 PERSANTIN 1961
. Ž . Ž . Ž .heart failure, pressors, coronary dilators 7.4 HOECHST 11 4r3 15 4 1942–1990 48 ASPARSAN 1942Ž . Ž . Ž .7.5 MERCK 15 7r9 19 5 1952–1988 36 DIURIL 1958Ž . Ž . Ž .7.6 ICI 7 3r4 23 2 1962–1983 21 INDERAL 1964Ž . Ž . Ž .7.7 PFIZER 9 1r2 19 3 1959–1989 30 MINIPRESS 1973Ž . Ž . Ž .8 ANTIPROTOZOAL 8.1 BAYER 12 7r8 18 10 1890–1976 86 GERMANIN 1920Ž . Ž . Ž .8.2 HOECHST 8 2r2 11 7 1911–1983 72 SALVARSAN 1911Ž . Ž . Ž .8.3 RHONE 12 2r2 26 10 1922–1974 52 STOVARSOL 1922Ž . Ž . Ž .8.4 MERCK 8 2r4 10 7 1938–1988 50 SULPHAQUINOXALINE 1938Ž . Ž . Ž .9 ANTIHISTAMINES 9.1 RHONE 11 3r3 23 15 1937–1967 30 ANTEGRAN 1942Ž . Ž . Ž .10 ANTIASTHMATICS 10.1 BOEHRINGER 5 1r3 22 14 1940–1977 37 ISOPRENALINE 1940Ž . Ž . Ž .11 FUNGICIDES 11.1 JANSSEN 7 1r3 16 19 1972–1989 17 DAKTARIN 1972Ž . Ž . Ž .12 ANTIVIRAL 12.1 B-W 5 1r2 10 20 1964–1986 22 ZOVIRAX 1982Ž . Ž . Ž .13 PEPTIDE HORMONES 13.1 LILLY 4 4r3 7 18 1923–1983 60 INSULIN 1923Ž . Ž . Ž .14 VACCINESrSERA 14.1 B-W 8 3r2 20 10 1896–1986 90 DIPHTHERIA TOXOID 1923Ž . Ž . Ž .14.2 LEDERLE 8 3r3 20 10 1945–1989 44 DPT VACCINE 1945Ž . Ž . Ž .14.3 MERCK 14 6r7 17 18 1960–1996 36 MUMPS VACCINE 1967Ž . Ž . Ž .14.4 MERRIEUX 13 4r4 100 17 1958–1997 39 IPOL VACCINE 1958Ž . Ž .14.5 BEHRINGWERKE 10 3r2 100 13 1972–1987 15 VARICELLA-ZOSTER
Ž .VACCINE 1982

( )B. Achilladelis, N. AntonakisrResearch Policy 30 2001 535–588558
to the AenvironmentalB driving forces that lead to thenew TT is discerned at the stage of decline of a
technology when most of the companies that intro-duced and profited from it, doggedly pursue their
Fig. 10. Major mergers and acquisitions among pharmaceutical companies.

( )B. Achilladelis, N. AntonakisrResearch Policy 30 2001 535–588 559
efforts even after it has become obsolete. In theseinstances, the CTT has become so deeply embeddedin the corporate psyche, that acts as a factor oftechnological inertia, blocks its sensitivity to theAenvironmentalB driving forces and undermines thecompany’s technology and market positions. Thus,CTTs contribute to the Schumpeterean destructionassociated with the waves of creativity, wherebycompanies that have thrived from a technology dis-appear with its obsolescence.
The relation between CTTs and TTs raises someintriguing questions regarding the survival of phar-maceutical companies over periods far longer thanindividual Along wavesB. Although many manufac-turing apothecaries and pharmaceutical companieshave folded in the course of the 200-year-long his-tory of the pharmaceutical industry, nearly all oftoday’s large companies were established about acentury ago and this indicates that they overcame thecrises associated with the technologies they have
Ž .championed Fig. 10 .Company histories and innovation records indi-
cate that their ability to Aride the long wavesB wasprimarily due to the fact that they were multiproductcompanies either within or outside the pharmaceuti-cal industry and, accordingly, they did not depend onone but on a number of TTs. As the life span of TTsdiffers even within the same Along waveB, multi-product companies afforded some time for readjust-ment during periods of succession of Along wavesB.
3.4.2.1. Horizontal diÕersification within the phar-maceutical industry. The most research-intensivecompanies developed numerous technologies and
Ž .markets by means of inhouse R&D Tables 4, 5 .However, diversification was also achieved by merg-ers and acquisitions of companies with CTTs intherapeutic markets complementary to their own.Examples: Merck ’s CTT in diuretics originatedfrom its merger with Sharp & Dohme; Bristol’s CTTin antineoplastic drugs originated from its acquisitionof Mead and Johnson; Roche’s entry into bioengi-neering resulted from its cooperation and, later,merger with Genentech. This policy was adopted inthe 1940s–1950s and, particularly, in the 1980s–1990s as shown by the super mergers, which createdglobal companies with a very wide spread of thera-
Ž .peutic markets Fig. 10 .
3.4.2.2. Horizontal diÕersification outside the phar-maceutical industry. Many pharmaceutical compa-nies were established as branches of chemicalrdy-
Žestuffs companies Bayer, Hoechst, Rhone Poulenc,ˆ.Ciba, Geigy, Sandoz, ICI, American Cyanamid and
were from their beginnings members of multiproductcompanies benefiting in periods of turbulence causedby the succession of Along wavesB from cash flowsgenerated by the chemical businesses of the parentcompanies. This was possible until the mid 1970swhen the chemical industry began to decline andcompanies concentrated on high value added chemi-cals and pharmaceuticals. Other pharmaceutical com-panies that began as manufacturing apothecaries—aswas the case of most American companies—hadkept during the interwar and early postwar periodssome businesses in proprietary products, such as
Ž .over-the-counter OTC medicines, toiletries andcosmetics. However, these businesses were modestcompared to chemicals or pharmaceuticals and couldnot extricate them during the slow down that accom-panied the succession of drug generations. Thus, inthe early 1960s, when the pharmaceutical industrycould not attain rates of growth comparable to thoseof many consumer product industries, the Americanpharmaceutical companies diversified by merger and
Ž .acquisition into a host of sectors Table 6 . Most ofthese businesses were less research-intensive andless profitable than pharmaceuticals but they showedvery high rates of growth. The higher turnover thusattained allowed the pharmaceutical companies tosustain, even to increase, their expenditures for R&Dand innovation at a time when they had to overcomeimportant technological barriers. This diversificationhelped the American pharmaceutical companies tosail through the 1960–1980 period at the end ofwhich they divested these acquisitions as the techno-logical and market conditions of the 1980s–1990sguaranteed for the pharmaceutical industry bothgrowth and profits.
3.4.2.3. InnoÕation in successiÕe TTs. Companiesthat have established a CTT in a therapeutic marketseldom introduce the TP that initiates the next TT.The case of Lilly and Pfizer, which were protago-nists in both natural and semisynthetic antibiotics,two successive TTs, is one of the very few excep-tions that prove the rule. Many companies dropped

( )B. Achilladelis, N. AntonakisrResearch Policy 30 2001 535–588560
out of a therapeutic market because they missed theopportunities opened by a new technology. For ex-ample, Bayer and Abbott both with strong CTTsŽ . Ž1890–1940 in CNS depressants barbiturate hyp-
.notics, anticonvulsants missed the post World WarTwo launching of antidepressants, antipsychotics andanxiolytics; Merck, a protagonist in natural antibi-
Ž .otics penicillin, streptomycin missed the opportuni-ties of semisynthetic penicillins and cephalosporins,
Žreturning to them after a lapse of 20 years cefoxitin,.MEFOXIN, 1977 . Also, ICI, which introduced the
Žantihypertensive beta blockers propranolol, IN-.DERAL, 1964 , missed the challenge of ACE in-
Ž .hibitors captopril, CAPOTEN, Squibb, 1977 , andŽof calcium ion blockers nifedipine, ADALAT,
.Bayer, 1974 .Many companies, however, were able to extend
their CTTs over two, even more, TTs on account oftheir research and, especially, market specializationthat allowed them to regain the lost ground bydeveloping and introducing therapeutically effectiveIIs. The marketing of drugs requires vast, worldwideand long-term investments so that a company, whichhas attained a leading position in a market, does notgive it up easily but strives to regain with an imita-tive drug the lead time of the competitor that intro-duced the new technology. This is by no means easyas it takes time, 5 to 10 years, for a company torealize the therapeutic and commercial potential of aAnot invented hereB new drug over its own estab-lished products, to shake off its CTT, to circumventpatent and other barriers and to develop its owncompetitive product. Its success depends entirely onthe improvements in therapeutic effectiveness of theimitative over the original drug but also on themarketing strategies adopted to compete against anestablished product.
3.4.2.4. InnoÕations independent of TTs. TTs providethe drive for innovation in a therapeutic market butonly about 70% or less of all the innovations are
Ž .related to them Fig. 8 . Systematic screening ofthousands of organic compounds, spinoffs from othertherapeutic sectors and serendipity lead to drugsunrelated to TTs in terms of composition or chemicalstructure with exceptional therapeutic properties butbecause of technological prerogatives they are noteasy to imitate. Such drugs are only occasionally
affected by the succession of TTs so that the compa-nies that introduced them are less susceptible to theupheaval, which characterizes these periods.
Lastly, some drugs with outstanding therapeuticproperties withstood the challenge of time and ofmany successive Along wavesB, e.g., ASPIRINŽ . Ž .Bayer, 1899 , PREMARIN Ayerst, 1943 and IN-
Ž .DERAL ICI, 1964 . Despite the expiration of theirpatents and their manufacture and sale as generics bymany companies, the original innovating companiesstill maintain a very considerable slice of the marketbecause of consumer familiarity with the companyand tradename and the long established goodwill ofthe medical profession.
3.4.3. A Long waÕesB corporate growth, innoÕationand R&D expenditures of major American pharma-ceutical companies
The pharmaceutical industry is one of the mostprofitable sectors of manufacturing. Inhouse R&Dand innovation is the route par excellence by whichpharmaceutical companies make profits and grow insize. However, there were periods in the history ofthe industry when innovation could not ensure formost companies growth rates commensurate withthose of their more successful competitors or ofcompanies in other fast growing sectors of manufac-turing industry putting their investor’s confidence injeopardy. To restore their rates of growth, companiesdiversified by mergers and acquisitions either withinthe pharmaceutical industry—thus widening theirtherapeutic markets—or into other manufacturingsectors showing high rates of growth albeit withlower profit margins. The adoption of these policiesprovides support to the argument that growth maxi-mization subject to a profit constraint is a morerealistic explanation of firm behaviour than profit
Ž .maximization Marris, 1964; Freeman, 1974 .Fig. 11a and b presents the trends of annual sales,
ethical drug sales, net profits and R&D expendituresfor major American pharmaceutical companies from1950 to 1990. Table 7 presents for each company thecumulative figures for the 40-year period of sales,ethical drug sales, net profits, R&D expenditures,
Žemployment, profitability net profit as percentage of. Žsales , R&D intensity R&D expenditure as percent-
.age of sales , numbers of innovations and patents,and average R&D cost of innovations and patents.
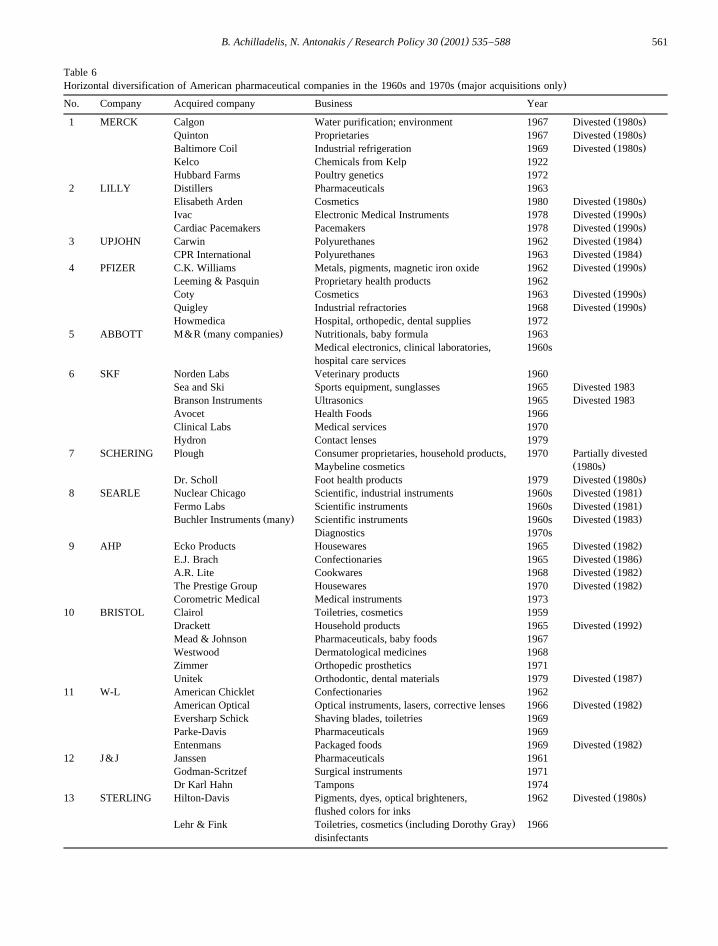
( )B. Achilladelis, N. AntonakisrResearch Policy 30 2001 535–588 561
Table 6Ž .Horizontal diversification of American pharmaceutical companies in the 1960s and 1970s major acquisitions only
No. Company Acquired company Business Year
Ž .1 MERCK Calgon Water purification; environment 1967 Divested 1980sŽ .Quinton Proprietaries 1967 Divested 1980sŽ .Baltimore Coil Industrial refrigeration 1969 Divested 1980s
Kelco Chemicals from Kelp 1922Hubbard Farms Poultry genetics 1972
2 LILLY Distillers Pharmaceuticals 1963Ž .Elisabeth Arden Cosmetics 1980 Divested 1980sŽ .Ivac Electronic Medical Instruments 1978 Divested 1990sŽ .Cardiac Pacemakers Pacemakers 1978 Divested 1990sŽ .3 UPJOHN Carwin Polyurethanes 1962 Divested 1984Ž .CPR International Polyurethanes 1963 Divested 1984Ž .4 PFIZER C.K. Williams Metals, pigments, magnetic iron oxide 1962 Divested 1990s
Leeming & Pasquin Proprietary health products 1962Ž .Coty Cosmetics 1963 Divested 1990sŽ .Quigley Industrial refractories 1968 Divested 1990s
Howmedica Hospital, orthopedic, dental supplies 1972Ž .5 ABBOTT M&R many companies Nutritionals, baby formula 1963
Medical electronics, clinical laboratories, 1960shospital care services
6 SKF Norden Labs Veterinary products 1960Sea and Ski Sports equipment, sunglasses 1965 Divested 1983Branson Instruments Ultrasonics 1965 Divested 1983Avocet Health Foods 1966Clinical Labs Medical services 1970Hydron Contact lenses 1979
7 SCHERING Plough Consumer proprietaries, household products, 1970 Partially divestedŽ .Maybeline cosmetics 1980s
Ž .Dr. Scholl Foot health products 1979 Divested 1980sŽ .8 SEARLE Nuclear Chicago Scientific, industrial instruments 1960s Divested 1981Ž .Fermo Labs Scientific instruments 1960s Divested 1981
Ž . Ž .Buchler Instruments many Scientific instruments 1960s Divested 1983Diagnostics 1970s
Ž .9 AHP Ecko Products Housewares 1965 Divested 1982Ž .E.J. Brach Confectionaries 1965 Divested 1986Ž .A.R. Lite Cookwares 1968 Divested 1982Ž .The Prestige Group Housewares 1970 Divested 1982
Corometric Medical Medical instruments 197310 BRISTOL Clairol Toiletries, cosmetics 1959
Ž .Drackett Household products 1965 Divested 1992Mead & Johnson Pharmaceuticals, baby foods 1967Westwood Dermatological medicines 1968Zimmer Orthopedic prosthetics 1971
Ž .Unitek Orthodontic, dental materials 1979 Divested 198711 W-L American Chicklet Confectionaries 1962
Ž .American Optical Optical instruments, lasers, corrective lenses 1966 Divested 1982Eversharp Schick Shaving blades, toiletries 1969Parke-Davis Pharmaceuticals 1969
Ž .Entenmans Packaged foods 1969 Divested 198212 J&J Janssen Pharmaceuticals 1961
Godman-Scritzef Surgical instruments 1971Dr Karl Hahn Tampons 1974
Ž .13 STERLING Hilton-Davis Pigments, dyes, optical brighteners, 1962 Divested 1980sflushed colors for inks
Ž .Lehr & Fink Toiletries, cosmetics including Dorothy Gray 1966disinfectants
( )B. Achilladelis, N. AntonakisrResearch Policy 30 2001 535–588562
The figures and the cumulative data show thedivergences of company rates of growth, which canbe attributed to their successes and failures in theapplication of commonly adopted policies but also toa multitude of company-specific factors and histori-cal circumstances, some of which were related to theuncertainty that characterizes innovation projects.Detailed company case studies can only lead to a fullunderstanding of the interplay of such factors andtheir effects on the rates of company growth. Here,
we examine some common features, notably theeffects on corporate growth of the succession of druggenerations and the relation between innovation andR&D intensity.
( )3.4.3.1. Drug generations long waÕes and companyŽ .growth. Freeman and Perez 1988 have suggested
that the succession of Along wavesB brings aboutsignificant changes not only in the technological butalso in the economic and competitive setting of an
Ž .Fig. 11. a and b Trends of annual sales, ethical pharmaceutical sales net profits, and R&D expenditures of American PharmaceuticalŽ . Ž .1950–1990 in constant 1990 US$ . Source: Company Annual Reports.

( )B. Achilladelis, N. AntonakisrResearch Policy 30 2001 535–588 563
Ž .Fig. 11 continued .
industry or a group of industries. This was undoubt-edly the case of the pharmaceutical industry.
ŽEmpirical studies have shown Mansfield, 1968a;.Freeman, 1974 that in research-intensive sectors,
company growth is related to innovativeness and thepharmaceutical industry provides ample support tothis hypothesis. Tables 4 and 9 show that today’sbiggest companies were among the most innovativeat least since the 1930s, and some of them, e.g.,
Hoechst, Bayer, Rhone, B-W, Ciba, Roche, since theˆturn of the century. And yet, only Merck and Lillyamong large American companies were able to growthroughout this period only on account of their inno-vative record. Uncertainties as to the outcome ofinnovation projects, upheavals associated with thesuccession of drug generations, inertia related todeclining CTTs and competitors’ successes, com-bined to frustrate companies’ efforts to sustain high

()
B.A
chilladelis,N.A
ntonakisrR
esearchP
olicy30
2001535
–588
564
Table 7Ž .Cumulative economic and technological data of American pharmaceutical companies 1950–1990
MERCK LILLY UPJOHN PFIZER ABBOTT SKF STERLING SEARLE SCHERING BRISTOL J&J AHP W-LaTotal sales 133.5 111.0 79.0 146.5 94.5 90.0 83.5 34.0 68.5 145.0 213.5 206.0 143.5
aETH.PH.Sales 104.5 70.5 59.5 76.0 27.0 55.0 26.5 19.5 43.0 52.5 42.5 87.0 50.0% ETHrTotal 75 64 75 52 30 61 32 57 62 36 20 42 34
bEmployment 820 743 486 1150 778 546 732 278 474 807 1612 1340 1200aNet profits 21.5 16.0 8.5 15.5 10.5 12.5 7.0 4.0 8.5 15.5 17.5 24.5 9.5
Profitability 16.2 14.6 10.6 10.4 11.0 13.7 8.4 11.8 12.4 10.7 8.2 11.9 6.6aR&D Exp. 13.0 10.5 8.5 7.5 6.5 7.5 2.7 2.9 5.0 7.5 11.0 6.0 6.0
R&D Exp.rT. Sales 9.7 9.5 10.7 5.1 6.9 8.3 3.2 8.5 7.3 5.2 5.2 2.9 4.2d dNo. of innvs. 79 58 44 47 36 28 34 17 33 39 NA 31 NA
dŽ .No. of patents 5066 2316 4047 2562 1365 1487 1440 1656 530 1141 1206 1464 NA 1369c d dR&D exp.rinnv. 32.9 36.2 38.6 31.9 36.1 53.6 15.8 34.2 30.8 38.4 NA 38.7 NA
cR&D exp.rpat. 0.5 0.9 0.4 0.6 0.9 1.0 0.4 0.4 1.9 1.1 1.8 0.8 0.9
Source: Calculated from Company Annual Reports; Chemical Abstracts; Survey of innovations.a In billion constant 1990 US$.b In thousand man years.c In million constant 1990 US$.d NA: not available because of major mergers.

( )B. Achilladelis, N. AntonakisrResearch Policy 30 2001 535–588 565
rates of growth by means of innovation. For somecompanies, such adversities frequently caused their
Ž .takeover by stronger competitors Fig. 11 .Most American pharmaceutical companies were
established as manufacturing apothecaries during theŽ . Ž .Second Generation of drugs 1880–1930 Fig. 10
and began their transformation into modern, re-search-intensive pharmaceutical companies after theFirst World War. The advent of the third generationof drugs in the 1930s–1940s caused the dramatic
Ž .acceleration of this process Section 4 . By the 1950s—the tail segment of the third Along waveB—most
Žcompanies were of medium size annual sales aroundUS$1000 million; employment between 3500 and
.15,000 and showed a modest growth rate largelybased on innovation. There were two groups of
Ž .companies: a those which evolved from manufac-Žturing apothecaries Upjohn, P-D, Abbott, Searle,.Schering, Lilly, SKF or from manufactures of chem-
Ž .icalrpharmaceutical specialties Merck, Pfizerwhose ethical drug sales exceeded 60% of the total,and with R&D expenditures about 7% of sales; andŽ .b those which were consumer proprietary productmanufactures recently drawn into the pharmaceutical
Ž .industry J&J, B-M, W-L, AHP whose ethical drugsales accounted for up to 30% of the total and withR&D expenditures about 3–4% of sales.
Ž .During the fourth generation 1960–1980 , mostcompanies showed very significant rates of growth
Žand became very large in terms of sales US$2–6000. Ž .million and employment 26–50,000 employees .
This growth was primarily caused by their diversifi-cation by means of mergers and acquisitions outsidethe pharmaceutical industry as shown by their declin-ing share of ethical drugs in total sales. Indeed, withthe exception of Merck and Lilly, companies that did
Žnot diversify significantly Upjohn, Searle, P-D, Syn-.tex, Schering did not grow as much as their com-
Žpetitors that diversified B-M, Pfizer, W-L, J&J,. Ž .AHP Fig. 11a and b . Diversification into less
R&D-intensive, less profitable sectors guaranteed asmoother rate of growth by balancing the risks inher-ent in the dynamics of TI described in previoussections. Cash flows from well-established, trade-marked proprietary products during periods of strongeconomic growth as were the 1960s and early 1970swere more secure than those of ethical drugs whosecommercial lives were frequently shortened by the
introduction of ever-more effective drugs. AnnualR&D expenditures in dollar values increased for allcompanies but when expressed as percentage of salesincreased only for predominantly pharmaceuticalcompanies and fell for companies that diversifiedinto less research-intensive sectors. This can be takenas an indication that the size of cash flow is relatedto the level of a company’s R&D expenditure.
The slowdown in economic growth in the indus-trialized world in the 1980s caused capital to flowinto sectors, which provided sizable returns to in-vestors, notably to Ahigh-techB sectors of electronics,materials, computers, pharmaceuticals. To improvetheir profitability, American pharmaceutical compa-nies divested their nonpharmaceutical businesses, andto ensure growth, they applied the proceeds to theformation of giant oligopolistic global companies bymergers among them. This allowed the simultaneousworldwide launch of their new drugs that, coupled tothe flexibility in the pricing of drugs allowed bygovernments, inflated the dollar value of the marketsand gave rise to AblockbusterB drugs, i.e., productswith annual sales ranging from US$300 to US$3000million. These strong cash flows allowed companiesto raise their R&D expenditures and to face the risksassociated with breaking into the technologies of thefifth generation including biotechnology. Further-more, their horizontal diversification within the phar-maceutical sector, reduced the risks and multipliedthe opportunities associated with innovation byspreading them across a much wider range of tech-nologies and markets.
It was not possible to put together comparableŽ .figures for the fifth generation 1980–1993 for all
companies of our sample because of the wave ofmergers among them, but those companies that oper-ated independently in the 1980s show a strong accel-eration of rates of growth, a higher ratio ofethicalrtotal sales, increased profitability and a risein R&D expenditures both in dollar values and aspercentage of sales.
3.4.3.2. Company R&D expenditure, innoÕation andgrowth. The relation between level of R&D expen-diture, innovation and company growth is by nomeans straightforward due to uncertainties as to theoutcome of innovation projects, the wide variation incommercial performance of innovations, and exter-

( )B. Achilladelis, N. AntonakisrResearch Policy 30 2001 535–588566
nalities in the research function, namely contribu-tions made by academic and public research institu-tions and by competitors. Empirical studies haveshown that there is no strong association between
Ž .high growth and research intensity Freeman, 1974 .Positive but weak correlations were found only at theextremes, i.e., companies with very high R&D in-vestments showed considerable growth and thosewith very low investments stagnated or disappeared,but in the middle zone uncertainty predominated.
Ž .Our data Table 7 provide some support to thishypothesis: Merck and Lilly, among the most re-search-intensive companies in terms of the dollarvalue of their investments, are among the largestcompanies of today while Sterling and Searle, amongthe least research-intensive, showed the weakestgrowth rates and were taken over in the 1980s.However, Upjohn, one of the most research-intensivecompanies, showed a modest rate of growth whileAHP, J&J, Pfizer, Bristol and W-L with averageR&D investments showed very high rates of growth.
Studies of the financing of company R&D sug-gest that most large companies allocate annual R&Dfunds on a rule of thumb basis, such as percentage ofsales and that most companies in the same sector
Žspend about the same percentage Mansfield, 1968b;.Freeman, 1974; Kay, 1979 .
Our data show that R&D expenditures expressedas percentage of sales ranged between 7.3 and 10.7for companies with ethical drug sales exceeding 50%of the total, and between 2.9 and 6.9 for morediversified companies. When R&D expenditureswere expressed as percentage of ethical drug sales,variations among companies became smoother butare still important: with the exception of Abbott,J&J and AHP, they range between 9.9% and 14.9%.It seems, therefore, that even if some companiesdesired to spend on R&D as much as their competi-tors, there were important structural or financialconstraints that did not allow that.
R&D expenditure and innoÕation. The long timehorizon of our data allowed us to search for somerelation between R&D expenditure and innovation.Assuming that the ultimate goal of research in thepharmaceutical industry is to develop and commer-cialize new drugs, we calculated the average R&Dcost of innovation for each company by dividingtotal R&D expenditures by the number of innova-
Ž .tions introduced over that long period Table 7 .With the exception of SKF and Sterling, the figuresobtained are remarkably close ranging between
Ž .US$30 and US$40 million. It should be noted athat R&D expenditure for new drugs in the 1950s
Ž .was trivial compared to that of the 1980s, and bthat although the most important, we have coveredonly 80% of therapeutic sectors so that companiesmust have introduced more innovations than thosewe have counted.
We derived in the same way R&D cost figuresper patent granted. Again, the figures are remarkablyclose: except for J&J and Schering, the R&D costfor each patent ranges among companies betweenUS$0.4 and US$1.0 million.
We may, therefore, conclude that despite of theirshortcomings, the data provide some evidence thatR&D expenditures are related to innovativeness, andthat the average R&D cost of an innovation is of thesame order of magnitude among large pharmaceuti-cal companies.
3.4.3.3. The determinants of company R&D expendi-ture. Because of the importance of R&D expendi-ture for companies in research-intensive sectors andits relation to innovativeness, we have assumed thatthe levels of funds devoted to R&D cannot bedecided on a rule of thumb basis. Diversification intoless profitable sectors indicated that there must besome relation between cash flow and company R&Dexpenditure. Also, Fig. 11a and b shows that thetrends of annual R&D expenditure are rather smoothand run parallel to those of total sales and net profits.We decided, therefore, to test the hypothesis thatannual R&D expenditures in any 1 year are deter-mined by cash flow and R&D expenditure of therecent past, namely of the previous 2 years.
3.4.3.4. Empirical results. R&D expenditure–cashflow relationships were tested with an equation modelof the following type:
R&D s f S , PŽ .j j j
where R&D stands for R&D expenditure, S fortotal sales, P for net profits and j for the jthcompany. The explanatory variables S and P wereused to represent the cash flow of each company,
( )B. Achilladelis, N. AntonakisrResearch Policy 30 2001 535–588 567
which, in turn, was expected to affect the company’sR&D expenditure.
In estimating the above equation, the data wereallowed to determine the particular short-run dy-namic form using a general-to-specific methodologyfor testing exclusion restrictions, in line with preva-
Ž .lent practice Davidson et al., 1978; Harvey, 1983 .The data were annual time series in constant 1990US$ for the 1950–1989 period. The first step was totest the variables of interest for cointegration, sinceotherwise the disturbances will be nonstationary andeither relevant variables are missing or a subset ofthe variables are cointegrated and the remainder are
Ž .included by mistake Holden and Thompson, 1992 .For a set of variables to be cointegrated it is required
Ž .that a the individual series should be integrated toŽ .the same order, and b the residuals from fitting the
postulated relationship should be integrated to a lowerŽorder than the individual series Engle and Granger,
.1987 .As far as our companies’ data were concerned,
Ž .the relevant Dickey–Fuller DF and AugmentedŽ .Dickey–Fuller ADF tests for unit roots and station-
arity indicate that the hypothesis of a unit root in thevariables included in the above equation cannot berejected at least at the 5% level. Therefore, thevariables in question are integrated of order onew Ž .xI i and we then tested the null hypothesis ofnon-cointegration of the variables. The relevant ADF
Ž .test Davidson and MacKinnon, 1993 suggested thatthis hypothesis should be rejected.
Having established that the variables of interestare cointegrated, we proceeded with general esti-mated equations in line with the above model andgradually imposed parameter restrictions in order tofind our ApreferredB equations. The above model isestimated for each company by the OLS method
Ž .using the following general ADL n, k:m form:
n m n
y sa q a y q b x qu ,Ý Ý Ýj , t o i j , ty1 k , i j ,k , tyi j , tis1 ks1 is0
where y is the dependent variable, x is the k thk
explanatory variable and u is a white noise distur-t
bance. In this form, the lagged dependent variable’spresence can be justified per se, namely R&D ex-penditure of the previous period is expected to affectnext period’s one for reasons related to trend and
expectations. Besides, however, the lagged depen-dent variable’s presence results from a number of
Žeconomometric models distributed lags, partial ad-. Ž .justment, etc. Wallis, 1979 , which provided extra
justification for its inclusion.Due to sample size limitations, two lags were
introduced in each of the dependent and the explana-tory variables. Nonsignificant lags were excluded onthe basis of the F-test and the Likelihood Ratio testfor the validity of exclusion restrictions. After anefficient specification search, the more parsimoniousrepresentations were the following:
Abbott.
R&D sy0.647 q 0.938)))
R&D q0.099))
P ,Ž . Ž .t ty1 tŽ . Ž . Ž .y0.837 9.432 2.112
where R2 s 0.992, F s 2266.705, LMs 1.592,Ž .ARCHs1.078, RESET F s4.654.
Merck.
R&D s 0.262 q 0.764)))
R&DŽ . Ž .t ty1Ž . Ž .0.339 5.353
q 0.303))
R&DŽ . ty2Ž .2.000
q 0.020)))
S yS ,Ž .t ty2Ž .2.757
where R2 s 0.995, F s 3002.015, LMs 2.477,Ž .ARCHs1.531, RESET F s1.609.
Johnson & Johnson.
R&D s 3.908 q 0.360)
R&DŽ . Ž .t ty1Ž . Ž .0.531 1.906
q 0.634)))
R&D q 0.018)
SŽ . ty2 ty2Ž . Ž .3.272 1.962
y 0.141)
P ,ty1Ž .y1.980
where R2 s 0.974, F s 175.330, LM s 0.397,Ž .ARCHs0.289, RESET F s0.600.
Warner-Lambert.
R&D s 4.736)))
q 1.298)))
R&DŽ . Ž .t ty1Ž . Ž .2.822 20.808
q 0.051)))
S yS y 0.098))
PŽ .t ty1 tŽ . Ž .5.900 y2.565
y 0.119)))
P ,ty1Ž .y3.979

( )B. Achilladelis, N. AntonakisrResearch Policy 30 2001 535–588568
where R2 s 0.976, F s 278.617, LM s 1.267,Ž .ARCHs0.253, RESET F s2.377.
Sterling-Winthrop.
R&D s 12.987))
q 0.930)))
R&DŽ . Ž .t ty1Ž . Ž .2.353 11.539
q 0.188)))
P yP y 0.209))
P ,Ž .t ty1 ty2Ž . Ž .4.863 y 2.409
where R2s0.951, Fs93.204, LMs5.848, ARCHŽ .s1.284, RESET F s1.983.
Bristol-Myers.
R&D sy0.983 q 0.470))
R&DŽ . Ž .t ty1Ž . Ž .y1.052 2.529
y R&D q 0.476)))
P ,Ž . ty2 tŽ .53.693
where R2 s 0.991, F s 2100.779, LMs 6.273,Ž .ARCHs6.504, RESET F s3.928.
Lilly.
R&D sy0.965 q 1.161)))
R&DŽ . Ž .t ty2Ž . Ž .y0.604 44.233
q 0.273)))
P yP ,Ž .t ty1Ž .5.350
where R2 s 0.984, F s 1141.137, LMs 7.647,Ž .ARCHs18.392, RESET F s6.044.
SKF.
R&D sy0.223 q 0.219))
R&DŽ . Ž .t ty1Ž . Ž .y0.518 2.064
q 0.477)))
R&D q 0.104)))
S ySŽ . Ž .ty2 t ty2Ž . Ž .5.012 9.684
y 0.228)))
P q 0.195)))
P q 0.211)))
P ,t ty1 ty2Ž . Ž . Ž .y5.842 2.951 2.924
where R2 s 0.998, F s 3353.708, LMs 1.245,Ž .ARCHs5.667, RESET F s0.507.
Schering-Plough.
R&D s 0.082 q 0.699)))
R&DŽ . Ž .t ty1Ž . Ž .0.274 4.866
q 0.306))
R&D q 0.011)))
SŽ . ty2 tŽ . Ž .1.946 3.403
q 0.009))
S y 0.111)))
P ,ty2 ty2Ž . Ž .2.137 5.450
where R2 s 0.997, F s 3256.690, LMs 1.140,Ž .ARCHs1.532, RESET F s7.543.
Upjohn.
R&D s 2.289)))
q 1.113)))
R&D q 0.007)
SŽ . Ž .t ty1 ty2Ž . Ž . Ž .3.180 29.527 1.874
y 0.179)))
P ,ty1Ž .y3.920
where R2 s 0.995, F s 2839.208, LMs 3.685,Ž .ARCHs0.038, RESET F s4.101.
R2 is the coefficient of determination adjusted fordf , F is the regression F-statistic, LM is the x 2 testfor residual autocorrelation, ARCH is the Engle’sŽ . 21982 x statistic for autoregressive conditional
Ž .heteroscedasticity, RESET F is the Ramsey’sŽ .1974 F-statistic for functional misspecification,with the t-values of the respective regression coeffi-
Ž)cients appearing in the parentheses denotes signif-icance at the 10% level, )) at the 5% level, and )))
.at the 1% level .Before discussing the results, the following points
are worth making. First, and as already noted, theexact form of the equation of each company resultedfrom the data and estimation procedure. Accord-ingly, the difference in the right-hand side of theequations resulted from accepted equality restrictionson the more general forms. Second, all conventionaleconometric tests were passed by our preferred equa-
Ž .tions, with the exception of the RESET F test forthe LILLY and SCHERING equations and the ARCHtest for the LILLY equation. This suggests that theeconometric results are reliable.
With the above explanations, it now feels safe toproceed to the results, which suggest the following.
Ž .a The cash flow variables appear to affect signif-icantly R&D expenditure in all regressions. Most ofthe regression coefficients are significant at the 1–5%level, indicating that the inclusion of the respectiveindependent variables in the equations adds consider-ably to the explanation of R&D expenditure.
Ž .b The explanatory power of the regressions isextremely high, even for time series. The variation ofthe explanatory variables explains 95.1–99.8% of thevariation of R&D expenditure in all equations. Thissuggests that even if there were other noncash flow

( )B. Achilladelis, N. AntonakisrResearch Policy 30 2001 535–588 569
factors, which could appear as explanatory variablesin the regressions, their impact on R&D expenditurewould prove trivial.
Ž .c Overall, the results support the R&D expendi-ture–cash flow strong relationship.
Thus, annual R&D budgets are determined bycash flow and the level of R&D expenditure of therecent past. Continuity in the support of the researchfunction is essential because of the long-term hori-zon of medicinal innovation projects and becauseR&D departments and their highly specialized re-searchers represent a valuable resource that cannotbe upset by frequent or abrupt changes in the alloca-tion of funds.
To conclude, large pharmaceutical companieswere able to survive the upheavals associated withthe succession of generations of medicinal technolo-gies by their strong commitment to R&D and inno-vation, by the high profitability of new drugs, by thedevelopment of CTTs, and by their adaptability to achanging competitive environment. The latter wasachieved by means of drastic structural changes in-cluding mergers and acquisitions of companies withinor outside the pharmaceutical sector by which theywidened their markets and the scope of their tech-nologies and ensured company growth and cash flowcommensurate with the expectations of investors andtheir needs for further R&D and innovation. Lastly,the relation between cash flow and R&D expendi-
ture combined to the fact that the average R&D costof a new drug is of the same order of magnitudeamong firms, accounts for the strong innovativerecord of large companies compared to that of smallercompetitors even when the latter are more research-intensive, i.e., spend a higher percentage of theirincome on R&D.
3.5. The competitive advantage of national phar-maceutical industries
Technologies since the 18th century originated ina handful of West European countries, the USA andJapan and technological advance was successivelyled by Britain, Germany, the USA and Japan. In thecase of the pharmaceutical industry, the USA,Switzerland, Germany, Britain and France con-
Žtributed more than 80% of all the innovations Sec-.tion 4 , their exports exceeded 60% of worldwide
trade, and were the home countries of nearly all theŽ .large innovative companies Tables 8, 9 .
The competitive advantage of national industrieswas studied by economic historians, historians ofscience and technology and scholars of business and
Žmanagement Bernal, 1954; Servan-Schreiber, 1968;.Landes, 1970; Mokyr, 1990; Porter, 1990 , and was
attributed to a score of factors including: a stronghigher education system, a technically well-trainedand abundant work force, the presence of specialized
Table 8Ž .The competive advantage of national pharmaceutical industries 1988
No. Industry Value of exports Exports % of Of whichŽ .in million US$ world exports Medicines Active ingredients
1 USA 3540 13.4 47.5 52.52 GERMANY 4000 15.1 66.0 34.03 SWITZERLAND 3172 12.0 67.3 32.74 UK 2800 10.5 78.6 21.45 FRANCE 2345 8.8 80.0 20.06 ITALY 1282 4.8 48.5 51.57 NETHERLANDS 1040 4.0 89.0 11.08 BELGIUM 1026 3.9 70.5 29.59 DENMARK 840 3.2 78.0 22.0
10 SWEDEN 830 3.1 94.0 6.011 HUNGARY 740 2.8 62.0 37.012 JAPAN 721 2.7 22.3 77.7
Ž .Source: R. Ballance, J. Pegany, H. Forstner, The World’s Pharmaceutical Industries Edward Elgar, Aldershot, 1992 .

( )B. Achilladelis, N. AntonakisrResearch Policy 30 2001 535–588570
Table 9Ž .The largest pharmaceutical companies 1990
No. Company Country Drug sales Market share
1 MERCK US 5700 3.82 BRISTOLrSQUIBB US 5260 3.53 GLAXO UK 5180 3.34 JOHNSON & JOHNSON US 4455 3.05 SMITH KLINE BEECHAM UK 4322 2.96 CIBA-GEIGY SW 4224 2.87 AMERICAN HOME PRODUCTS US 3912 2.68 HOECHST GE 3845 2.69 LILLY US 3680 2.5
10 BAYER GE 3260 2.211 ROCHE SW 3240 2.212 PFIZER US 3234 2.213 SANDOZ SW 3230 2.214 RHONE POULENC FRA 3160 2.115 UPJOHN US 2400 1.616 SCHERING-PLOUGH US 2330 1.617 BOEHRINGER GE 2310 1.518 MARION MERRELL-DOW US 2260 1.519 ICI-STUART UK 2150 1.420 WARNER-LAMBERT US 2080 1.421 LEDERLE US 2000 1.322 BURROUGHS-WELLCOME UK 1880 1.323 TAKEDA JP 1700 1.124 SCHERING GE 1530 1.0
Source: Sanford C. Bernstein and Co.
research-intensive companies and supportive indus-tries, a strong home market demand and the relativeprice of factor inputs.
3.5.1. DriÕing forces for TI and the competitiÕeadÕantage of national pharmaceutical industries
Although some of these factors have contributedto the concentration of the pharmaceutical industryin very few countries, we shall argue that for re-search-intensive industries, which have depended ontechnological advance throughout their history, thegeography of technological advance and the competi-tive advantage of national industries were deter-mined to a considerable extent by the intensities andsynergies of the driving forces for TI, which, apartfrom their fluctuations over time, are strongly influ-enced by national environments.
3.5.1.1. Scientific adÕanceScientific knowledge is widely conceived as flow-
ing freely across national boundaries because of the
speedy communication and publication of the find-ings of academic research. However, this is only partof what happens in reality: the creation of knowledgeand its application are strongly influenced by na-tional environments and its diffusion across bordersis tempered by the presence or absence in universi-ties or companies of the skills required for its assimi-lation and also by barriers raised by industrial andcommercial interests.
A country’s academic institutions, however largeand wealthy she is, may excel in a few or many butcertainly not in all scientific disciplines. Universitiesand research-intensive companies cooperate withinrather than across national frontiers. Indeed, somestudies have shown that this cooperation is evenstronger whenever universities and companies are inclose geographical proximity within the same coun-
Ž .try Cockburn and Henderson, 1995 . Thus, the spe-cialization and scientific leadership of academic in-stitutions are strongly related to the specializationand excellence of a country’s research-intensive in-dustries. Examples: chemistry and the German

( )B. Achilladelis, N. AntonakisrResearch Policy 30 2001 535–588 571
dyestuffsrchemical industry; mechanicalrelectricalengineering and the French motor car, railways,aircraft and power generation industries; chemicalengineering and the American oil refining, petro-chemical and chemical plant construction industries.
The pharmaceutical industry has dependedthroughout its history on advances in a score ofscientific disciplines: medicine, physiology, organicchemistry, pharmacology, bacteriology, biology, en-zymology, molecular biology, and because of thisdependence, innovative companies were establishedonly in countries with robust academic systems,
Ž .research schools Geison, 1981 and other institu-tions, which had attained excellence in many of these
Ž .disciplines Section 4 .
3.5.1.2. GoÕernment legislationThe pharmaceutical industry is the most closely
regulated manufacturing sector because of the signif-icance of medicines for public health, and of publichealth insurance systems, which are in most coun-tries the industry’s most important customers. Regu-lation of companies’ business practices, pricing ofmedicines by Government Agencies, measures toprotect domestic markets, patent legislation, wartimemeasures to ensure availability of drugs, regulationsfor the testing and approval of new drugs, andAWelfare StateB legislation have contributed in apositive or negative way to the growth and competi-tiveness of national pharmaceutical industries.
3.5.1.3. Societal needsThe perception of and sensitivity towards societal
needs is influenced by a nation’s history, culture,values and political system of government. Publicmedical and medicinal research laboratories, publicfunding of medicinal R&D and of national healthinsurance systems created competitive advantagesfor national pharmaceutical industries by enhancinginnovation, strengthening demand and making it in-dependent of the effects of business cycles.
3.5.1.4. Market demandA strong domestic market can create competitive
Ž .advantages for national industries Porter, 1990 butin the pharmaceutical industry this happened only inthe case of the American industry. The Japanese andFrench markets—second and third in size—had a
rather negative effect on the competitivity of theirpharmaceutical industries because, due to protection-ist government measures, the companies were led toconcentrate on the development of imitativemedicines for home consumption rather than of orig-inal drugs for the world markets. Access to foreignmarkets was essential not only for small countrieslike Switzerland, the Netherlands, Denmark, Bel-gium and Sweden but also for the most populousbecause the ability of pharmaceutical companies tocompete worldwide is indispensable. Penetration ofoverseas markets was affected, in turn, by geogra-phy, traditional bilateral and multilateral relationsand alliances, even by language.
3.5.1.5. Raw materialsAbundance, access and, sometimes, scarcity of
raw materials have enhanced the competitive advan-tage of national industries even before the advent ofthe industrial revolution. In the case of the pharma-ceutical industry, access to sources of tropical medic-
Ž .inal plants 1800s and coal tar derived organicŽ .chemicals 1880s created competitive advantages
for the French, British and German industries.
3.5.1.6. Competition, R&D-intensiÕe companies andCTTs
In a competitive environment largely determinedby the performance of private companies, the com-petitive advantage of national R&D-intensive indus-tries should be sought primarily in the qualities andcharacteristics of these companies. Most nationalpharmaceutical industries are composed of hundredsof companies but those among them, which showedstrong competitive advantages, owe that to a handfulof large R&D-intensive companies, which have in-
Žtroduced the great majority of new medicines Table.4 .
Driving forces, which are influenced by the na-tional environment, create opportunities for RIs thatcan, and are, seized by national companies. How-ever, the locus of an RI does not necessarily create acompetitive national advantage as were the cases ofmauveine in dyestuffs, bakelite in plastics, the tran-sistor, colour TV, video recorder, CD player inelectronics, Prontosil and penicillin in antibacterialmedicines, Phenergan in antihistamines, chlorproma-zine in CNS drugs. In all these cases, a swift transfer
( )B. Achilladelis, N. AntonakisrResearch Policy 30 2001 535–588572
of the technology across national boundaries tookplace even before the expiration of the originalpatents, usually by the innovating companies’ licens-ing their overseas competitors, or by governmentintervention as was the case with penicillin and thetransistor.
As shown earlier, the temporary advantage gainedby the introduction of a commercially successful
Ž .radical innovation RIrMS is extended over muchlonger periods of time if companies pursue theirefforts and establish CTTs. Financial and technologi-cal constraints limit the number of CTTs that anyone company can develop however big, prosperousand creative. Thus, national industries gain competi-tive advantages when composed of many R&D-intensive companies whose CTTs, put together, covermost of the technologies and markets of the sector.This was the case of the German pharmaceuticalindustry between 1880 and 1930 and of the Ameri-can pharmaceutical industry since the 1940s.
3.5.2. The declining influence of national policies onthe driÕing forces for TI
From the 1880s, when they were established, tothe 1990s, the competitive setting of R&D-intensivepharmaceutical companies went through three dis-tinct phases.
Ž .During the first phase 1880–1950 , they operatedwithin a national framework of rules and policieseven when their export markets were significant.Protectionist policies at the turn of the centuryŽ .Thompson, 1977 , the First World War, the eco-nomic recession of the 1920s, the depression of theearly 1930s and the preparations for the SecondWorld War led governments to raise barriers tointernational trade, curtail imports and apply policiesof national autarky. Transfer of technology acrossnational frontiers was very limited and companiesseldom licensed their products and processes to thirdparties. Thus, the driving forces for TI were stronglyinfluenced by the national environment and the com-panies, which attained excellence during that phasedid so because of the advantages of their homecountry. All the large R&D-intensive pharmaceuti-cal companies of today were established during thatperiod.
Ž .In the second phase 1950–1980 , peacetime eco-nomic growth and liberalized world trade created a
new competitive environment based on both interna-tional agreements and national rules. R&D-intensivecompanies became multinational but kept the opera-tions they considered vital—including their R&Ddepartments—in the home country. Transfer of tech-nology accelerated because of the multinational char-acter of the large companies, the easy movement ofresearchers across national frontiers and thewidespread licensing of technologies. Thus, the com-petitive environment was shaped by both nationaland international rules and practices, which alsoaffected the intensity of the driving forces for TI.
Ž .In the third phase 1980– , the globalization offinancial markets and the expansion of internationaltrade led to the globalization of the large R&D-intensive companies by direct investments overseasor by mergers and acquisitions of foreign companies.Thus, the competitive setting of the pharmaceuticalindustry is shaped today by large global companiesoperating in the framework of international regula-tions aimed largely at liberalizing trade. Thus theeffects of national policies on the intensities of thedriving forces for TI became marginal. And yet, ahandful of national pharmaceutical industries stillenjoy substantial competitive advantages because oftheir highly competent companies, which consoli-dated their position in the world markets by researchintensity, CTTs, and corporate growth by mergersand acquisitions of foreign companies, rendering ex-tremely difficult the entry of new competitors.
4. Historical development of innovation in thepharmaceutical industry
ŽIn previous papers Achilladelis, 1993;.Achilladelis et al., 1987 , we have stressed the sig-
nificance of historical evidence in supporting ornegating findings and conclusions about the dynam-ics of TI arrived at by quantitative analysis ofinputroutput indicators. This is particularly impor-tant for a study that has a time horizon of twocenturies. This section describes the interplay andsynergies of the driving forces for TI that caused theemergence of five successive generations of medici-nal technologies and their role in influencing the rateof technical change and in creating competitive ad-vantages for some national industries. For a detailed
Ž .historical account, see Achilladelis 1999 .

( )B. Achilladelis, N. AntonakisrResearch Policy 30 2001 535–588 573
( )4.1. The first generation of medicines 1820–1880
The first Along-waveB was formed by the cluster-Ž .ing of two TTs Table 3, Fig. 2 .
4.1.1. Scientific adÕance and raw materialsThe innovations of the first generation were a
consequence of the Chemical Revolution introducedby Antoine Lavoisier and the French School of
ŽChemistry at the end of the 18th century Guerlac,.1975 . The adoption of experimental methods in
Ž .chemistry made possible a the isolation and purifi-cation of the Aactive principlesB of medicinal plantsŽ .e.g., morphine, quinine, curare, belladonna whosemedicinal properties were known since antiquity or
Ž .the Renaissance; and b the synthesis or isolationfrom plants or coal tar of simple organic chemicals,which were found to possess medicinal propertiesŽe.g., ether as anaesthetic, chloroform as hypnotic,carbolic acid as antiseptic, salicylic acid as an-
. Ž .tipyretic Mann, 1984 .The isolation of Aactive principlesB in pure form
allowed physicians and physiologists to study sys-tematically their physiological effects and gave riseto the new scientific discipline of pharmacology.Francois Magendie, Claude Bernard of the Collegede France, Rudolf Buccheim of the University of
Ž .Dorpat Tartu in Estonia, and Oswald Schmiedebergof the University of Strasbourg were the leaders in
Ž .this new discipline Holmstedt and Liljestrand, 1963 .
4.1.2. InnoÕating institutions, market demand andcompetition
Medicines of the first generation were discoveredby physicians turned chemists and academic re-searchers at a time when early capitalist, largely
Ž .mercantilistic, economies prevailed Table 10 .Apothecaries, the pharmaceutical companies of thatearly period, were mercantilistic import–export en-terprises, which traded in medicinal inorganic chemi-cals and tropical, subtropical or indigenous medicinal
Ž .plant products Sneader, 1985 and as such they didnot employ scientists able to follow the leads madeby academics. Mass production processes and ma-chines were not yet invented, e.g., pill-making ma-chines, so that medicines were formulated, preparedand dispensed by physicians and druggists in smallquantities at a time. Chemical companies, on the
Table 10ŽGeographical distribution of innovations, 1800–1880 first genera-
.tion
No. Country Innovations
Academic Industrial Total %
Ž .1 FRANCE 14 0 14 28Ž .2 UK 13 1 14 28Ž .3 GERMANY 10 3 13 26Ž .4 USA 3 1 4 8Ž .5 SWITZERLAND 2 0 2 4Ž .6 BRAZIL 2 0 2 4Ž .7 NETHERLANDS 1 0 1 2
Ž .TOTAL 46 4 50 100
other hand, were, up to the 1860s, manufactures ofŽ .inorganic chemicals alkalis, acids sold in bulk to
the textile, soap and glass industries. A few inventorsbecame entrepreneurs: Joseph Pelletier and JosephCaventou who isolated quinine from cinchona barkestablished their own manufacture north of Paris;Georg Merck, an apothecary in Darmstadt who iso-lated the alkaloid papaverine, began the manufactureof many alkaloids in pure form; and E.R. Squibb inNew York established a manufacture of medicalgrade ether based on a process he developedŽ .Liebenau, 1987 . As the rather simple technologiesdiffused, some apothecaries added ApureB medicinesto their long lists of plant, animal and mineral pow-ders, syrups and diverse concoctions.
Market demand and competition were weak driv-ing forces for TI during this period as shown by thesmall number of innovations. The introduction ofnearly all the innovations by academics and theabsence of IIs indicate the limited role played by
Ž .industrial companies Table 10 .
4.1.3. The geography of innoÕationFrance was the leading country in medicinal re-
search and innovation having introduced the Chemi-cal Revolution and the experimental method in thephysical and life sciences and modernized its institu-
Ž .tions of learning Table 10 . The German States werequick to adopt these advances and by the middle ofthe century took the lead in chemistry and phar-
Ž .macology Mann, 1984 . British apothecaries led inthe lucrative trade of medicinal plants and showed
Žno interest in the new scientific developments Mat-

( )B. Achilladelis, N. AntonakisrResearch Policy 30 2001 535–588574
.theus, 1962 , British and American physicians con-tributing to the early innovations as individualsŽ .Haagensen et al., 1943 .
( )4.2. The second generation of medicines 1880–1930
The second Along waveB was formed by theŽ .clustering of five TTs Table 3, Fig. 3 .
4.2.1. Societal needsOvercrowding, poverty, malnutrition, lack of run-
ning water and public sanitation facilities in theŽexpanding cities of the industrial revolution Porter,
.1997 caused the spread of deadly contagious ill-nesses, such as smallpox, typhoid fever, tuberculosis,cholera and diphtheria. Antiquated, filthy and over-crowded hospitals became sources of infections caus-ing very high mortality rates among patients duringand after surgery. Endemic debilitating diseases incolonial Africa, Asia and Latin America, such assleeping sickness, malaria, plague, schistosomatiosis,spread among indigenous populations and Europeansettlers and impeded the exploitation of their naturalresources. These acute societal needs drew the atten-tion of physicians, academic researchers, govern-ments and industry to the discovery of medicines,
Žwhich could control and cure these diseases Boyd,.1950 .
4.2.2. Scientific adÕanceMost of these societal needs existed at least since
the 1840s when European governments took mea-sures for improving the environment by buildingpublic sanitation facilities but scientific knowledgewas not available for the prevention or therapy ofthese diseases. This became possible around the1870s following the application for that purpose of
Žhistorical advances in scientific instruments the. Žachromatic microscope , organic chemistry synthe-
. Žsis and structure determination , pharmacology iden-tification and evaluation of medicinal properties of
. Ž .chemicals , physiology the theory of the cell , bac-Žteriology identification of disease carrying microor-
. Žganisms , and chemotherapy systematic tests of.chemicals on infected animals .
4.2.3. InnoÕating institutions, market demand andcompetition
As in the first generation, most of the medicinaldiscoveries were made by physicians and academic
researchers in universities and teaching hospitals buttheir development and commercialization were un-
Ž .dertaken in many cases by two new institutions: aPublic medicalrmedicinal research laboratories es-tablished by European and American governments inresponse to the pressing societal needs and, in partic-ular, for the discovery, manufacture and distribution
Žof the life saving sera and vaccines e.g., PasteurInstitute, Lister Institute, Rockefeller Institute, Berlin
.Institute for Contagious Diseases, Kitasato Institute ;Ž .b German dyestuffs companies, especially Bayerand Hoechst, which, having developed strong in-house R & D capabilities in organic chemistryŽ .Baumler, 1968; Verg, 1988 , saw an opportunity inapplying their expertise to a commercially promising
Ž .new sector Behnisch, 1986 . To this end, they estab-lished close links with academic institutions and
Ž .public medical research laboratories Table 11 . Theirexample was imitated at the turn of the century bythe Swiss dyestuffs companies Ciba and Sandoz andthe pharmaceutical company Hoffman LaRocheŽ . Ž .Roche Riedl, 1990 , and by the French chemicalcompanies Poulenc Freres and Etablissements du`
Ž .Rhone Robson, 1990 . The entry of these researchˆconscious companies led to the establishment of themodern pharmaceutical industry and introduced mar-ket demand and competition as effective drivingforces for innovation. This is shown by the introduc-tion of both RIs and IIs since the 1890s most ofwhich were academic discoveries developed by
Ž .chemical companies Fig. 3 .The invention of pill-making machines and indus-
trial manufacturing processes helped transform manyapothecaries into manufacturing apothecaries, whichorganized marketing, distribution and sales depart-ments to reach and sell their prepackaged pills,powders and syrups under registered trademarks to awidening clientele of drugstores and hospitals ratherthan directly to the consumer. By the 1910s, andespecially during the Great War, when German drugsbecame sparse, manufacturing apothecaries began toinvest in inhouse R&D and produce sera, vaccines
Žand synthetic medicines e.g., Burroughs-Wellcome,.Parke-Davis, Abbott, Lilly, E. Merck, K. Mulford .
Thus, most large pharmaceutical companies of todaywere established during the second generation butcompetition remained weak because of their smallnumber and the domineering position of Bayer and

()
B.A
chilladelis,N.A
ntonakisrR
esearchP
olicy30
2001535
–588
575
Table 11Ž .Innovative performance of national pharmaceutical industries in the period 1880–1930 second generation
No. Country Innovations RIs MSs
Academic Industrial Total % Academic Industrial Total % Academic Industrial Total %
Ž . Ž . Ž .1 GERMANY 20 62 82 56 8 27 35 64 4 21 25 50Ž . Ž . Ž .2 USA 6 24 30 20 0 8 8 14 3 9 12 24Ž . Ž . Ž .3 UK 4 8 12 8 0 3 3 6 0 3 3 6Ž . Ž . Ž .4 FRANCE 5 3 8 5 4 5 5 9 3 1 4 8Ž . Ž . Ž .5 SWITZERLAND 2 6 8 5 0 1 1 2 0 4 4 8Ž . Ž . Ž .6 CANADA 2 0 2 2 1 1 1 2 2 0 2 4Ž . Ž . Ž .7 SWEDEN 1 0 1 1 1 1 1 2 0 0 0 0Ž . Ž . Ž .8 ITALY 1 0 1 1 0 0 0 0 1 0 1 2Ž . Ž . Ž .9 INDIA 1 0 1 1 1 1 1 2 0 0 0 0
Ž . Ž . Ž .TOTAL 42 103 145 100 15 40 55 100 13 38 51 100
RIs: radical innovations; MSs: market successful innovations.

( )B. Achilladelis, N. AntonakisrResearch Policy 30 2001 535–588576
Hoechst: the top twenty companies introduced 99%Ž .of all industrial innovations Table 12 .
4.2.4. GoÕernment legislation and the geography ofinnoÕation
Germany introduced all five TTs of this AlongwaveB and was the undisputed leader in medicinal
Ž .innovation Table 12 . All the driving forces forinnovation were exceptionally strong: her universi-ties led in organic chemistry, pharmacology andbacteriology; she produced a wealth of coal tarchemicals, which served as raw materials for syn-thetic medicines; both domestic and overseas marketdemand was very strong on account of her largepopulation and a near world monopoly in moderndrugs; competition was strong among her few re-search-intensive companies; societal needs were acutein a country that was among the leaders of theindustrial revolution in the 19th century; and last,apart from the establishment of medicinal researchlaboratories and Bismark’s AsocialB legislation of themid 1880s, the German patent law of 1876 applied tosynthetic drugs and proved a key factor for theprominence of the German industry up to the 1930s.Monopoly creation in medicines was considered tobe unethical by other European countries, e.g., theFrench patent law of 1844 specifically excludedmedicines.
In the USA, the 1902 Licensing Act and the 1906Pure Foods and Drugs Act, weeded out many drugswhose claims were unsubstantiated, forced compa-nies to organize inhouse quality control laboratoriesand, indirectly, caused the merger of smaller compa-nies to attain the size that allowed them to improvetheir scientific capabilities. The 1917, Trading withthe Enemy Act, permitted the manufacture of Ger-man patented medicines. Finally, New Deal legisla-tion in the 1930s, which culminated with the 1938,Food, Drug and Cosmetic Act, separated prescriptionfrom OTC drugs. The requirement of safety datafrom clinical tests before approval by the FDA ofprescription medicines, forced pharmaceutical com-panies to expand their research function. This legisla-tion helped accelerate the progress of the American
Ž .companies in the interwar years Table 11 and putthem on the way to the leadership of the industryŽ .Liebenau, 1987 .
The absence of patent protection for drugs andantiquated regulatory legislation delayed the devel-opment of the French pharmaceutical industry. Thislegislation can be traced back to the 1803 Loi deGerminal, which gave pharmacists and drugstores a
Žmonopoly in the preparation of medicines Robson,.1990 . After 1919, when industrial companies began
producing prepackaged drugs, the requirements ofthis law, which was not abolished, restricted thescale of manufacturing operations and led to theestablishment of numerous, usually family owned,small and narrowly specialized companies with inad-equate means for R & D and innovation. OnlyRhone-Poulenc and Institut Merrieux were able toˆtake advantage of the historical discoveries of thePasteur Institute and emerged as strong competitorsduring the third Along waveB.
(4.3. The third generation of pharmaceuticals 1930–)1960
The third Along waveB was formed by the cluster-Ž .ing of six TTs Table 3, Fig. 4 .
4.3.1. Scientific adÕanceScientific advances that made possible the discov-
ery, development and clinical use of these medicineswere in organic chemical syntheses, natural productschemistry—as vitamins, corticosteroids, sex hor-mones and antibiotics are all natural products; spec-troscopic methods for composition and structure de-
Žtermination requiring very small samples e.g., infra-red, ultra-violet and nuclear magnetic resonancespectroscopy, X-ray crystallography and paper chro-
.matography ; and the development of screeningmethods using biological, microbiological, animaland tissue tests for the evaluation of physiological,medicinal and antibacterial properties.
Universities and research schools specialized inthese disciplines in many European countries and theUSA and by their close cooperation with pharmaceu-tical companies helped accelerate the rate of techni-cal change and influenced the geography of innova-
Ž .tion, e.g., the Zurich Polytechnic ETH in Switzer-land; the universities of London, Cambridge, Oxfordand the Medical Research Council LaboratoryŽ .MRCL in the UK; the universities of Wisconsin,Illinois and Chicago, Johns Hopkins, Harvard,

()
B.A
chilladelis,N.A
ntonakisrR
esearchP
olicy30
2001535
–588
577
Table 12Ž .Top twenty innovative pharmaceutical companies of each successive drug generation 1880–1990
Ž .No. Second generation Third generation Fourth generation Fifth generation up to 1990
Company INNVS RIs MSs Company INNVS RIs MSs Company INNVS RIs MSs Company INNVS RIs MSs
Ž . Ž . Ž . Ž .1 BAYER GE 25 11 11 CIBA-GEIGY SW 48 19 14 MERCK US 30 14 15 ROCHE SW 24 4 4Ž . Ž . Ž . Ž .2 HOECHST GE 19 8 8 MERCK US 33 17 18 LILLY US 28 8 10 HOECHST GE 18 2 2
Ž . Ž . Ž . Ž .3 B-W UK 8 3 3 ROCHE SW 30 12 8 JANSSEN BE 28 4 5 MERCK US 16 7 10Ž . Ž . Ž . Ž .4 ABBOTT US 8 0 2 LEDERLE US 27 14 12 ROCHE SW 25 4 7 B-W UK 14 2 2
Ž . Ž . Ž .5 P-D US 6 3 3 RHONErM and B 27 11 10 HOECHST GE 24 4 6 BRISTOL US 13 2 3Ž .FR
Subtotal top 5 66 25 27 Subtotal top 5 165 73 62 Subtotal top 5 135 34 43 Subtotal top 5 85 17 21Ž . Ž . Ž . Ž . Ž . Ž . Ž . Ž . Ž . Ž . Ž . Ž .64% 62% 69% 33% 47% 36% 20% 25% 30% 22% 21% 31%
Ž . Ž . Ž . Ž .6 LILLY US 5 4 4 P-D US 21 6 7 CIBA-GEIGY SW 23 8 8 SANDOZ SW 12 3 4Ž . Ž . Ž . Ž .7 SCHERING AG GE 4 4 0 B-W UK 20 8 6 PFIZER US 22 5 7 JANSSEN BE 12 0 3
Ž . Ž . Ž . Ž .8 von HEYDEN GE 4 1 0 BAYER GE 19 6 11 P-D US 22 3 6 LILLY US 10 5 4Ž . Ž . Ž . Ž .9 RHONE FR 3 1 1 UPJOHN US 19 5 5 BRISTOL US 19 6 4 SCHERING US 10 3 0
Ž . Ž . Ž . Ž .10 E.MERCK GE 3 1 1 PFIZER US 18 4 7 UPJOHN US 18 5 4 BEHRING GE 9 3 2Ž .Subtotal top 10 85 36 85% Subtotal top 10 262 102 98 Subtotal top 10 239 61 72 Subtotal top 10 138 31 34
Ž . Ž . Ž . Ž . Ž . Ž . Ž . Ž . Ž . Ž . Ž .83% 90% 52% 66% 57% 36% 45% 50% 36% 38% 51%Ž . Ž . Ž . Ž .11 ROCHE SW 3 0 1 LILLY US 15 8 6 SANDOZ SW 14 2 0 GENENTECH US 8 8 6Ž . Ž . Ž . Ž .12 KNOLL GE 3 0 0 SCHERING US 14 4 8 BAYER GE 13 4 4 MERRIEUX FR 8 3 2Ž . Ž . Ž . Ž .13 KALLE GE 2 1 1 SQUIBB US 13 6 7 AHP US 13 2 6 BEECHAM UK 8 2 1
Ž . Ž . Ž . Ž .14 CIBA SW 2 0 2 SKF US 13 3 9 STERLING US 15 1 3 GLAXO UK 8 2 4Ž . Ž . Ž . Ž .15 Dr.BYKE US 2 0 0 ICI UK 13 3 4 SKF US 14 3 4 P-D US 8 0 2Ž . Ž . Ž . Ž .16 ARMOUR US 1 1 1 STERLING US 13 0 4 RHONE FR 14 2 0 UPJOHN US 7 3 1Ž . Ž . Ž . Ž .17 SANDOZ SW 1 1 1 HOECHST GE 12 3 5 GLAXO UK 13 4 4 PFIZER US 7 3 1Ž . Ž . Ž . Ž .18 MULFORD US 1 0 1 ABBOTT US 12 3 3 BOEHRINGER GE 13 2 6 AHP US 7 1 1
Ž . Ž . Ž . Ž .19 ZIMMER GE 1 1 0 GLAXO UK 11 3 2 ABBOTT US 13 6 0 BAYER GE 6 2 1Ž . Ž . Ž .20 BOEHRINGER GE 1 0 0 SCHERING AG GE 10 7 4 ICI UK 12 6 4 MERRELL 6 1 1
TOTAL TOP 20 102 40 39 TOTAL TOP 20 388 142 150 TOTAL TOP 20 381 92 102 TOTAL TOP 20 211 56 54Ž . Ž . Ž . Ž . Ž . Ž . Ž . Ž . Ž . Ž . Ž . Ž .99% 100% 100% 78% 91% 88% 57% 70% 71% 56% 68% 81%
RIs: radical innovations; MSs: market successful innovations.

( )B. Achilladelis, N. AntonakisrResearch Policy 30 2001 535–588578
Columbia and Washington of St. Louis and theMayo Clinic of the University of Rochester in theUSA; the Karolinska Institute and the University ofStockholm in Sweden; the University of Toronto inCanada; the University of Amsterdam in the Nether-lands. Despite the strong contribution of academicinstitutions in the discovery of new drugs, it shouldbe noted that in contrast to previous generations,
Ž .only 16 out of a total of 535 innovations 3% wereŽ .introduced by them Table 13 . This important devel-
opment resulted from the companies’ R&D inten-sity, their effective cooperation with academic insti-tutions and the importance of marketing and sales inthe post war competitive environment.
4.3.2. Societal needs and goÕernment legislationDuring the Second World War, governments ac-
tively supported innovation and the production ofmedicines to provide for the needs of the armedforces and their civilian population. This was particu-larly the case of the USA where the Federal Govern-ment’s research projects on penicillin, corticosteroids
Ž .and antimalarials catalysed Hare, 1970 the transfor-mation of many manufacturing apothecaries, e.g.,Upjohn, Lilly, Sharp & Dohme, Parke-Davis, SKF,Abbott, and proprietary products manufactures, e.g.,Bristol-Myers, Warner-Lambert, American HomeProducts, Johnson & Johnson, into research-intensivepharmaceutical companies. The cooperative projectscontributed to the fast diffusion of these technologiesamong participating companies so that by the end ofthe 1950s, the American industry comprised morethan fifteen R&D-intensive companies, i.e., three to
Žfour times as many as other national industries Ta-.bles 12 and 13 .
The British Government mindful of the hardshipcaused by the lack of critical medicines during theFirst World War, e.g., tetanus vaccine, of Germansuperiority in chemotherapy, and of the low R&Dlevel in British companies, established in 1941 the
Ž .Therapeutic Research Corporation TRC with theparticipation of Boots, May and Baker, the British
Ž .Drug Homes BDH , ICI, Burroughs-Wellcome,Glaxo, and the MRCL, to fund and coordinatemedicinal research in universities and to pool manu-
Žfacturing facilities for new products Davenport-.Hines and Slinn, 1992 . The TRC contributed to the
manufacture of penicillin and the development of
antimalarials and, especially, to the commitment ofthe participating companies in research. In 1948, theBritish Government established the National Re-
Ž .search and Development Corporation NRDC forthe development of British inventions and discover-ies that the private sector would not support. TheNRDC played a key role in the development of the
Ž .cephalosporins 1955–1964 .During the early post-war period, governments in
many countries followed the example set by Britain’sLabour Government and passed AWelfare StateB leg-islation a central feature of which was the establish-ment of national health care systems, which, byproviding complete or partial reimbursement of thecost of medical prescriptions, widened and guaran-
Žteed the markets of the pharmaceutical industry Mc-.Nalty, 1950; Foot, 1973 . Reimbursements ranged
from 100% in Britain and Switzerland, 90% in Japan,65–80% in most European countries, to 10% in theUSA.
4.3.3. Market demandFrom the end of the War to the late 1950s, the
American market was by far the most significantbecause of the physical destruction of manufacturingplants and the economic consequences of the War inEurope and Japan. This gave a strong incentive forinnovation to the American companies, but also tothe Swiss Companies, which had established sub-sidiaries in the USA and operated as American com-panies.
A major development during the third AlongwaveB, which, together with research intensity, hascharacterized since the pharmaceutical industry, wasthe adoption of intensive marketing methods aimedat physicians, hospitals and drugstores. This cameabout as a result of competition among Americancompanies, which was sharpened because of theincrease in their numbers and the accelerated diffu-sion of the wartime technologies, which facilitatedpatent circumvention by molecular manipulationleading to the commercialization of numerousmedicines with comparable therapeutic efficacies.There were 535 new medicines introduced by 73companies compared to just 103 and 21 companies
Ž .in the previous period Tables 12, 13 . To defendtheir markets, companies began to sell their products
Ž .under both the generic chemical and a trade name

( )B. Achilladelis, N. AntonakisrResearch Policy 30 2001 535–588 579
Ž .trademark giving medicines the character of propri-etary products. To this end, they established largespecialized marketingrsales departments that devel-oped elaborate, highly specialized marketing meth-ods. The importance—and cost—of marketing grewexponentially with the internationalization and, later,the globalization of the markets and the entry ofEuropean and Japanese companies, which alsoadopted these practices.
4.3.4. CTTs, competition and geography of innoÕa-tion
During the third Along waveB the structure of thepharmaceutical industry took the shape that charac-terized it at least until the 1980s. The American
Žreplaced the German industry as world leader Table.13 . Between 1930 and 1960, all the driving forces
for TI were exceptionally strong in the USA. Withthe exception of the sulphonamides and antihis-tamines, American companies either introduced orwere major contributors in the TTs of this period.Many of them created strong CTTs by which theyprolonged their competitive advantages up to the
Ž .1960s and beyond Table 5 . The German industrydeclined because all driving forces were weakened:as a consequence of the War, she lost many of heroverseas markets; research laboratories and manufac-turing plants were destroyed; academic researchslowed down; her patents became common propertyas they were included in the reparations to the Allies.However, the decline started even before the War:among the TTs of the third Along waveB, Germancompanies contributed only the sulphonamides be-cause they were under the spell of their CTTs of theprevious generation. This is manifested by their ma-jor innovations of the 1930s–1940s, which wereantiprotozoal drugs, hypnotics and analgesics, i.e.,technologies initiated at the turn of the century.
The Swiss industry enjoyed advantages compara-ble to those of the American industry having escapedfrom the destruction of the War and because of theirsubsidiaries in the USA. CTTs were initiated by
Ž . ŽRoche vitamins , Ciba corticosteroids, antihyper-. Ž .tensives , Geigy antihistamines . The British indus-
try, which up to the 1930s was composed of manymanufacturing apothecaries and proprietary manufac-turers unable to take advantage of the discoveriesmade by British universities, began to change under
the prodding of the Government during and after theWar: ICI established a pharmaceutical division in1935 and worked on sulphonamides and antimalari-
Ž .als Reader, 1978 ; May and Baker, owned byRhone-Poulenc since 1927, became a leader inˆ
Ž .sulphonamides Lesch, 1997 ; Glaxo pursued its workon vitamins began in 1929 and became a leader in
Ž .antibiotics Davenport-Hines and Slinn, 1992 andB-W, the only research-intensive British company atthe time, made important contributions in a score ofsectors other than those of the TTs of the third
Žgeneration, including antihypertensives Hill and.Bernbridge, 1986 . The French industry continued to
suffer from the fossilized legislative framework.Rhone-Poulenc made outstanding contributions inˆcooperation with the Pasteur Institute but by licens-ing them to American and Swiss companies failed tofully exploit them commercially. They were protago-nists in sulphonamides, discovered the antihistaminesŽ .Ennis and Lorenz, 1984 , and, in 1952, introducedchlorpromazine, the first neurolepticrsedative that
Žrevolutionized the treatment of mental illness Thuil-.lier, 1980 .
Tables 12 and 13 show the dramatic changes ininnovation and the structure of the pharmaceuticalindustry brought about by the third generation ofdrugs in terms of numbers of competing companies,innovations, RIs and MSs. The top five nationalindustries accounted for 76% of innovating compa-nies and more than 90% of innovations, RIs andMSs.
The Japanese pharmaceutical industry shows apoor innovation record at least until the 1980s, whichcan be attributed to the interplay of the drivingforces for innovation. In the 1950s, the JapaneseGovernment adopted measures to create a strongnational industry by strengthening the domestic drugmarket and protecting it against foreign competitionŽ .Yoshikawa, 1989; Reich, 1990; Anonymous, 1996 .Prices of drugs were set at levels higher than those inEurope, a universal health insurance system waslegislated, which required very small copayments on
Ž .the part of the insured 10% that, coupled to atradition of Japanese physicians to overprescribedrugs, led to the Japanese becoming second only to
Žthe American drug market US$ 26 billion against.US$ 32 billion . Barriers were raised against the
operation of foreign companies in Japan forcing

()
B.A
chilladelis,N.A
ntonakisrR
esearchP
olicy30
2001535
–588
580
Table 13Ž .Innovative performance of national pharmaceutical industries in the period 1930–1960 third generation
No. Country Innovating companies Innovations RIs MSs
No. % Acade- Indust- Total % Acade- Indust- Total % Acade- Indust- Total %mic rial mic rial mic rial
Ž . Ž . Ž . Ž .1 USA 32 44 3 267 270 50 1 82 83 48 1 99 100 56Ž . Ž . Ž . Ž .2 SWITZERLAND 3 4 1 86 87 16 1 33 34 20 0 22 22 12
Ž . Ž . Ž . Ž .3 GERMANY 8 11 2 54 56 10 0 19 19 11 0 23 23 12Ž . Ž . Ž . Ž .4 UK 9 12 2 52 54 10 1 15 16 9 1 13 14 8Ž . Ž . Ž . Ž .5 FRANCE 4 5 1 30 31 6 0 11 11 6 0 11 11 6
Ž . Ž . Ž . Ž .TOP FIVE 56 76 9 489 498 92 3 160 163 94 2 168 170 946 BELGIUM 3 0 8 8 0 1 1 0 1 17 NETHERLANDS 2 0 7 7 0 3 3 0 3 38 SWEDEN 4 0 6 6 0 2 2 0 2 29 AUSTRIA 2 0 3 3 0 0 0 0 0 0
10 JAPAN 1 2 1 3 1 0 1 0 0 011 DANEMARK 2 1 2 3 1 0 1 0 0 012 INDIA 0 2 0 2 1 0 1 0 0 013 ITALY 2 0 2 2 0 0 0 0 0 014 AUSTRALIA 0 1 0 1 1 0 1 1 0 115 EGYPT 0 1 0 1 1 0 1 0 0 016 SPAIN 1 0 1 1 0 0 0 0 0 0
Ž . Ž . Ž . Ž .TOTAL 73 100 16 519 535 100 8 166 174 100 3 174 177 100
RIs: radical innovations; MSs: market successful innovations.

( )B. Achilladelis, N. AntonakisrResearch Policy 30 2001 535–588 581
them to license their products to Japanese compa-nies. As a result, 35–40% of drugs in Japan were offoreign origin including the most widely prescribed.Furthermore, Japan’s patent law covered only manu-facturing processes but not products encouragingJapanese companies to develop processes for themanufacture of existing or slightly modified productsrather than developing original drugs that could notbe adequately protected even in their home market.Thus, the great majority of Japanese innovationswere imitative drugs developed for the lucrativedomestic market rather than for the world markets.Under these conditions, both Government and com-panies underinvested in R&D and innovation andthe industry became highly fragmented: there weremore than 1700 companies with the biggest amongthem, Takeda, listed 23rd in the world in 1990Ž .Table 9 .
4.4. The fourth generation of drugs
The fourth Along waveB was formed by the clus-Ž .tering of five TTs Table 3 and Fig. 5 .
4.4.1. Scientific adÕanceInnovations of the fourth—and fifth—generations
resulted from a marked shift in the scientific basis ofthe industry from chemistry and pharmacology to thelife sciences. This was essential because, in contrastto medicines introduced that far, which consisted ofAmagic bulletsB that destroyed disease carrying in-
Žtruders e.g., sera, vaccines, antiprotozoal drugs,.antibacterial sulphonamides and antibiotics and of
physiological or natural products made syntheticallyand used for the treatment of diseases caused by
Žabnormal deficiencies vitamins, hormones, some.corticosteroids , the most important drugs of the
1960s and beyond were used for the treatment ofŽchronic physiologicalrpathological diseases cardio-
Ž . .vascular, central nervous system CNS , cancer .Their development necessitated the understanding ofthe mechanisms of biologicalrphysiological pro-cesses at the cellular level. Paramount among themwas the elucidation of the chemical transmission ofnervous impulses to diverse organs by the identifica-tion of chemical transmitters and receptors of the
Žperipheral autonomic system and the CNS Bacq,.1984 . This made possible the synthesis of hundreds
of new drugs and the understanding of the action of
older, serendipitously discovered, cardiovascular andCNS medicines.
4.4.2. Societal needs and goÕernment legislationGovernments, because of the research intensity
and profitability of pharmaceutical companies, con-fined their substantial support of medicinal researchto universities and public medical research laborato-ries, which concentrated on long-term exploratoryprojects for cancer, heart, viral, age debilitating andless common diseases.
Ž .Due to the proliferation of new drugs Table 13 ,many of which simply duplicated the properties ofexisting products without offering further therapeuticadvantages, of the overheated competition among
Ž .companies, and of the Thalidomide incident 1961 ,governments imposed strict regulatory measures forthe conduct of clinical trials, and the approval of newmedicines, which required the provision on the partof innovating companies of substantial evidence forthe effectiveness and efficacy of candidate drugs.The 1962 US Congress, Drug Amendments to the
ŽFederal Food, Drug and Cosmetic Act of 1938 U.S..Congress 1938, 1962 imposed regulatory procedures
for that purpose, which were strongly criticized bythe American industry because of the delay theyintroduced in the approval and commercialization of
Ž .new drugs Grabowski, 1976; Commanor, 1986 . Afurther criticism, namely that this legislation causeda slowdown in innovation in the USA between 1964and 1975, is only partially justified by facts as theAmerican industry faced then a penury of opportuni-
Ž .ties for innovation see below . Similar legislationwas adopted in the 1970s by most European coun-tries and turned out to be beneficial for both thepublic and the companies as they minimized thecommercialization of ineffective or harmful drugs.
4.4.3. Market demandDuring these decades of worldwide strong eco-
nomic growth, demand for medicines increasedrapidly. The recovery in the economies of WesternEurope and Japan created new, fast-growing marketswhile growth in manufacturing industry and nearlyfull employment encouraged governments and com-panies to raise their contributions for health insur-ance. Pharmaceutical companies grew in size, somebecoming very large with employment reaching

( )B. Achilladelis, N. AntonakisrResearch Policy 30 2001 535–588582
30,000 or more. European companies made a strongcomeback while most American companies grew notonly by increasing their drug sales by means ofinnovation and a systematic expansion in the Euro-
Žpean markets by the late 1970s, more than 40% of.their sales were made overseas but also by horizon-
tal diversification by mergers and acquisitions into aŽ .score of related or unrelated businesses Section 3 .
The discovery, development, approval and marketingof new medicines became a costly process so thatlarge companies with strong cash flows dominatedsince the pharmaceutical industry.
4.4.4. CTTs, competition and the geography of inno-Õation
Competition reached its peak during this period asshown by the commercialization of 672 newdrugs—compared to 535 for the third generation—and the substantial increase of innovating companiesfrom 73 to 126. There was also considerable geo-graphic expansion caused by the entry of manyGerman, British, French, Japanese and Italian com-panies as the universal acceptance of the patenting ofmedicines removed a key obstacle to innovationŽ .Table 14 . Most of the top companies were the samebut their relative order changed as a consequence oftheir success or failure in breaking into the new
Ž .technologies Table 12 . Their share of innovations,RIs and MSs, however, was significantly reduced bythe entry of numerous newcomers, which must haveplayed a role for the wave of mergers and acquisi-tions of the 1980s–1990s.
For the American companies that thrived on CTTsof the 1930s–1940s, their technologies reached thestages of maturity or decline while entry in thetechnologies of the fourth generation required sub-stantial and costly reorientation of their R&D. Acertain scepticism concerning the future of the indus-try spread among company managers who turned todiversification into less R&D-intensive but growingsectors of proprietary products to ensure growthŽ .Section 3 . The American companies were chal-lenged by many European firms, which, by the early1960s, had recovered much of the lost ground and,as they were not saddled with mature CTTs, intro-duced most of the TPs of the fourth generationŽ .Table 3 . They did not, however, take full advan-tage of their discoveries because, with the exceptionof the Swiss companies, they had not establishedmarketingrsales departments in the USA but reliedon licensing them to their American competitors.Thus, the American industry kept its leadership. TheGerman industry replaced the Swiss in the secondposition. The top five continued to dominate the
Table 14Ž .Innovation performance of national pharmaceutical industries in the period 1960–1980 fourth generation
No. Country Innovating companies Innovations RIs MSs
No. % No. % No. % No. %
Ž . Ž . Ž . Ž .1 USA 31 24 292 43 69 50 79 55Ž . Ž . Ž . Ž .2 GERMANY 22 17 88 13 14 10 17 12Ž . Ž . Ž . Ž .3 SWITZERLAND 3 3 65 10 13 10 17 12Ž . Ž . Ž . Ž .4 UK 14 11 64 10 19 14 15 11Ž . Ž . Ž . Ž .5 FRANCE 18 14 46 7 4 3 2 1Ž . Ž . Ž . Ž .TOP FIVE 88 70 555 82 119 87 130 91
Ž . Ž . Ž .6 BELGIUM 4 36 5 6 4 7 5Ž . Ž .7 JAPAN 13 25 4 3 2 1Ž . Ž .8 ITALY 9 20 3 3 2 1Ž . Ž .9 NETHERLANDS 3 15 2 1 1 2
Ž .10 SWEDEN 2 10 3 2 2Ž .11 DANEMARK 3 7 2 2 0
12 HUNGARY 2 2 0 – 013 SPAIN 1 1 0 – 014 CHECHOSLOVAKIA 1 1 0 – 0
Ž . Ž . Ž . Ž .TOTAL 126 100 672 100 137 100 143 100
RIs: radical innovations; MSs: market successful innovations.

( )B. Achilladelis, N. AntonakisrResearch Policy 30 2001 535–588 583
industry although other countries’ industries, notablythose of Japan, Belgium, the Netherlands, Italy andSweden raised their share of innovating companies,
Ž .innovations, RIs and MSs Table 14 .The improved performance of the Japanese indus-
try was caused by important changes of the regula-tory framework introduced in the mid 1970s. Tocontrol the rise of medical expenditures as the econ-omy was slowing down, the Japanese Governmentslashed prices by 44% while allowing higher pricesfor new drugs and, under pressure from the USA,relaxed the protective measures against the entry of
Ž .foreign firms Yoshikawa, 1989; Reich, 1990 . Assome companies began to introduce original drugs,the patent law was extended to cover both processand product. Japanese companies were forced tocompete in the world markets, increased their R&Dexpenditures, launched new products abroad—albeitmostly IIs—licensed products and established jointventures with foreign companies and initiated a strongdrive for the development of biotechnology.
4.5. The fifth generation of drugs
The fifth Along waveB, which has not yet run itsfull course, was formed by the clustering of six TTsŽ .Table 3, Fig. 6 of which biotechnology may revolu-tionize the industry.
4.5.1. Scientific adÕanceThe major characteristic of the technologies of the
1980s and beyond was the completion of the shiftfrom organic chemistry, pharmacology and the sys-tematic screening of molecules with promising struc-tures, to the life sciences: physiology, biology, bio-chemistry, biophysics, enzymology and molecularbiology. The identification and elucidation of themechanisms of action of numerous physiologicaltransmitters and of synthetic medicines, the identifi-cation and structure determination of drug receptorsand active sites of enzymes, and computer imagingtechnologies, allowed for the design of medicineswith high specificity and replaced, to a considerableextent, the systematic screening of candidate drugs.A major advance, whose influence began to be felt inthe 1980s–1990s, was the discovery and application
Žof biotechnology processes recombinant DNA and.monoclonal antibodies in the production of physio-
logical proteins used in therapy or diagnosis of manydiseases, particularly cancer, viral and age debilitat-ing diseases for which relatively little progress wasmade that far. Research schools in biotechnologywere formed in universities, particularly in Californiaand Massachusetts but also in Britain, France andGermany. Some of their leaders became en-trepreneurs and established small biotechnology firmsto develop and commercialize their discoveries.
4.5.2. Societal needs and goÕernment legislationWidespread unemployment, the aging of the pop-
ulation and policies adopted for the contraction ofthe public sector in Europe and the USA, led to thecurtailment of public support for health care insur-ance, i.e., to a reversal of a trend that had began 150years ago. To keep their expenditures within thelimits set by decreasing budgets, public and privatehealth care agencies advocate the use of cheaperdrugs and, especially, generic drugs rather than ex-pensive new ones, use their buying power as majorclients to obtain lower prices from companies, andraise the contributions of the insured. Under theseconditions, many people and especially the unem-ployed cannot afford health insurance while in East-ern Europe, Asia, Africa and Latin America, largesegments of the population cannot afford to buymedicines at all. Diseases that were nearly eradi-cated, such as tuberculosis, diphtheria, cholera,meningitis and malaria, made a comeback among thepoor in both industrialized and third world countries.Societal needs became less significant as a drivingforce for innovation.
4.5.3. Market demand, competition and geography ofinnoÕation
The strong innovation record of the 1950s, 1960sand 1970s caused the technological and market ma-turity of some of the major sectors of pharmaceuti-cals, such as antihypertensives, analgesicsrantipyret-ics, antibacterials and CNS medicines, for whichnumerous effective drugs became available in the1980s–1990s as generics and nonprescription drugsŽ .OTC . Companies directed their research to cardio-vascular, age debilitating, cancer and viral diseases,which represent the sharpest current needs and thestrongest potential markets. This situation of matu-rity of a significant segment of the pharmaceutical

( )B. Achilladelis, N. AntonakisrResearch Policy 30 2001 535–588584
industry while another showed revolutionary ad-vance led companies, on one hand, to integrate verti-cally into generics and OTCs and, on the other hand,to maintain a strong commitment to R&D and inno-vation.
The delocalization in the 1980s of many techno-logically mature, low profitability, manufacturingsectors to third world countries, created a strong flowof capital towards research-intensive sectors. Phar-maceutical companies, because of their strong inno-vative record, the promise held by the revolutionaryadvances in the life sciences and their vastly im-proved profitability caused by the introduction ofAblockbusterB drugs, attracted the keen interest ofinvestors so that the prices of their stocks reachedunprecedented levels. As the manufacture of pharma-ceuticals alone guaranteed both corporate growth andhigh profitability, companies divested their nonphar-maceutical businesses and invested the proceeds inmergers and acquisitions within the health care sec-tor including generics manufactures and drug distrib-
Ž .utors James, 1990 . The formation of very large,vertically integrated global companies led to an un-precedented concentration of the industry and thereduction in the number of competing firms, a char-
acteristic of industrial sectors whose technologiesŽ .and markets approach maturity Fig. 10 . On the
other hand, venture capital, which became availableto academic research teams, led to the formation ofhundreds of small biotechnology firms. This was thefirst time in the 20th century that a new technologywas introduced by newcomers rather than by thelarge innovative pharmaceutical companies. To avoida Schumpeterean Acreative destructionB, pharmaceu-tical companies either formed joint ventures or ac-quired some of the most successful biotechnologyfirms. By applying their immense financial and tech-nical resources to the development and marketing ofthe biotech firms’ discoveries, they entered into aprocess of assimilation of the new technology, which
Ž .is still in progress Galambos and Sturchio, 1998 .The Japanese industry made significant progress
Ž .and overtook France in the fifth position Table 15 .The American industry kept its position at the topparticularly because of the leadership of Americanuniversities in biotechnology, but many Europeancompanies by their innovations, mergers and acquisi-tions of American companies, expanded their mar-kets worldwide and competed at a par with the largeAmerican companies. Thus, by the 1990s, pharma-
Table 15Ž .Innovation performance of national pharmaceutical industries in the period 1980 1993 fifth generation–
No. Country Innovating companies Innovations RIs MSs
No. % No. % No. % No. %
Ž . Ž . Ž . Ž .1 USA 34 29 147 39 52 63 36 54Ž . Ž . Ž . Ž .2 GERMANY 14 12 44 12 8 10 5 7Ž . Ž . Ž . Ž .3 SWITZERLAND 3 3 45 12 8 10 9 13Ž . Ž . Ž . Ž .4 UK 10 9 43 11 6 7 9 13Ž . Ž .5 JAPAN 20 17 31 8 1 1Ž . Ž . Ž . Ž .TOP FIVE 81 69 310 82 75 91 60 90Ž . Ž . Ž . Ž .6 FRANCE 11 9 22 6 3 4 2 3Ž . Ž .7 BELGIUM 3 3 15 4 0 3Ž . Ž .8 ITALY 7 6 12 3 2 0Ž . Ž .9 SWEDEN 5 4 11 3 1 2Ž .10 DANEMARK 3 3 3 0 0
11 NETHERLANDS 2 2 0 012 SPAIN 2 2 0 013 HUNGARY 1 1 0 014 YUGOSLAVIA 1 1 1 015 AUSTRIA 1 1 0 0
Ž . Ž . Ž . Ž .TOTAL 117 100 380 100 82 100 67 100
RIs: radical innovations; MSs: market successful innovations.

( )B. Achilladelis, N. AntonakisrResearch Policy 30 2001 535–588 585
ceutical companies became truly global and compar-isons among national industries became largely irrel-evant.
5. Conclusions
From its establishment in the mid 19th century tothis day, the pharmaceutical industry was one of themost research-intensive and innovative sectors ofmanufacturing. It offers, therefore, an extremely in-teresting case for a long-term study of the dynamicsof TI.
Our analysis was based on both empirical andhistorical evidence and was carried out in the light ofestablished macroeconomic theory of technicalchange. Most of our findings agree with that theorybut there are also discrepancies, some of which maybe attributed to characteristics unique to the pharma-ceutical industry. As it is inevitable that other re-search-intensive sectors have also their own specialcharacteristics, a set of similar empiricalrhistoricalstudies of the handful of research-intensive sectorswill ascertain which factors are industry-specific andwhich are innovation generic and will lead to adeeper understanding of the dynamics of TI.
Our main findings may be summarized as fol-lows.
5.1. DriÕing forces of TI
Historical and empirical evidence concerning thetiming of introduction of RIs, variations in the rate oftechnical change, diffusion of technologies, innova-tive performance of individual companies, and thecompetitive advantage of national pharmaceutical in-dustries, showed that they did not depend only onscientificrtechnological advances and market de-mand, but also on societal needs, government legisla-tion, new raw materials, competition among firms,and the creation of CTTs, all of which have acted asdriving forces for innovation. The intensities of thesedriving forces and their synergies varied over timeand thus determined the rate of technical change. Asthey were influenced also by national environment,they were largely responsible for the competitiveadvantages of national pharmaceutical industries.
5.2. Dynamic effects of RIs
Highly original drugs in composition and thera-peutic action catalysed the interaction and acceler-ated the advance of both science and technology,created strong demand by opening new markets, andcontributed to the growth of innovating companiesbecause they were usually more profitable than IIs.
5.3. The diffusion of technologies
Highly original in composition and therapeuticactivity, but also commercially successful RIs, whichoffered a robust model for imitation while the scien-tific and therapeutic principles on which they de-pended, were not fully elucidated at the time of theircommercialization, functioned as TPs and influencedthe direction and rate of technical change. The distri-bution over time of innovations related to them andof companies, which entered the sector by an own
Ž .innovation bandwagon effect , profile the TTs theycreated.
This process of diffusion by imitation providedthe drive for technological advance and for the de-velopment of the most important markets but did notaccount for all the innovations of a therapeutic sec-tor. Indeed only about 70% of the innovations of oursample were found to belong to TTs. Systematicscreening of thousands of chemicals, spinoffs fromother sectors, serendipity, etc., led to importantmedicines unrelated to the TTs, which for technicalreasons could not be extensively imitated. Thus, thediffusion of technologies in the pharmaceutical in-dustry was not as straightforward as presented inmacroeconomic models.
5.4. Clustering of TTs: formation of successiÕe gen-( )erations long waÕes of pharmaceuticals
Innovation distribution patterns showed that TPsin a number of therapeutic sectors clustered withinrelatively short time intervals, and the TTs theyinitiated grew, matured and declined in a parallelway over time spans ranging from 30 to 80 years.There were five such clusters initiated in the 1820s,1880s, 1930s, 1960s and 1980s, which gave rise tofive successive generations of pharmaceuticals. The

( )B. Achilladelis, N. AntonakisrResearch Policy 30 2001 535–588586
close succession of these generations, shown by theiroverlapping at their ends, accounted for the researchintensity and unique innovative record of the phar-maceutical industry over its 200-year-long history.
Historical evidence shows that apart from revolu-tionary changes in science and technology, eachgeneration involved also important changes in thesocial, legislative and commercial environment ofthe pharmaceutical industry and called for substantialchanges in the structure and business practices of thepharmaceutical companies, i.e., showed similar char-acteristics with those of Along wavesB in macroeco-nomic theory of technical change. Furthermore, thespans of four of the five generations coincide withthose of the Along wavesB of world economic growthwhile that of the 1960s has no counterpart inmacroeconomic theory. Thus the development of thepharmaceutical industry followed closely—but notabsolutely—the pattern of world economic growth.
5.5. Pharmaceutical companies
Despite the great contributions of academic andpublic research laboratories in the physical and lifesciences and in medicine, and in the identification ofthe therapeutic properties of many compounds, mostnew medicines were introduced by pharmaceuticalcompanies. There are thousands of pharmaceuticalcompanies all over the world and yet, more than70% of the innovations of our sample were intro-duced by 30 companies. Most of them sustained theircreativity and remained in business for more than acentury despite the upheavals associated with thesuccession of generations of technologies, i.e., theywere able to ArideB the long waves and escape theSchumpeterian destruction associated with them.Their success depended on the following.
Ž .i The establishment of CTTs by means of whichthey created long-term scientificrtechnological andmarketing competitive advantages in selected thera-peutic sectors.
Ž .ii Their multiproduct—within and outside thepharmaceutical industry—character attained both byinhouse R&D and by strategic mergers and acquisi-tions that moderated their dependence on the va-garies of a narrow range of technologies while ensur-ing adequate rates of growth and profitability.
Ž .iii The consistent high levels of R&D expendi-ture. Company data show that the number of innova-
Ž .tions and patents is related to the level of R&Dexpenditure. Econometric analysis proved that thelevel of R&D expenditure is determined by cashflow. Large, innovative companies applied strategiesby which they sustained strong cash flows—andR&D expenditures—when opportunities for innova-tion became scarce due to the decline of the tech-nologies by which they had prospered in the past.
5.6. The geography of innoÕation
Despite the universal need for medicines and thepresence of pharmaceutical companies in most coun-tries, the innovative segment of the industry washighly concentrated in five countries, namely theUSA, Germany, Switzerland, the UK, and France;their innovations accounting for about 80% of oursample. This concentration was caused by the na-tional environment of these countries, which, at leastup to the 1970s, strongly affected the intensities ofmost driving forces for innovation, and by the cre-ativity, business acumen and export orientation oftheir major companies.
References
Achilladelis, B., 1973. Process Innovation in the Chemical Indus-try, D. Phil. Thesis, University of Sussex.
Achilladelis, B., 1993. The dynamics of technological innovation:the sector of antibacterial medicines. Res. Policy 22, 279–308.
Achilladelis, B., 1999. Innovation in the pharmaceutical industry.Ž .In: Landau, R., Achilladelis, B., Scriabine, A. Eds. , Pharma-
ceutical Innovation. Chemical Heritage Press, Philadelphia.Achilladelis, B., Schwarzkopf, A., Cines, M., 1982. Innovation
and the Firm in the Chemical Industry, Report to the NationalScience Foundation, mimeo.
Achilladelis, B., Cines, M., Schwarzkopf, A., 1987. A study ofinnovation in the pesticide industry: analysis of the innovationrecord of an industrial sector. Res. Policy 16, 175–212.
Achilladelis, B., Schwarzkopf, A., Cines, M., 1990. The dynamicsof technological innovation: the case of the chemical industry.Res. Policy 19, 1–34.
American Medical Association, 1980. AMA Drug Evaluations.American Medical Association, Chicago, IL.
Anonymous, 1991. The World’s Pharmaceutical Directory, Phar-maco-Medical Documentation, Chatham, NJ.
Anonymous, 1996. Japan’s Sickly Drug Firms, The Economist,October 19th, 65.

( )B. Achilladelis, N. AntonakisrResearch Policy 30 2001 535–588 587
Bacq, Z.M., 1984. Chemical transmission of nervous impulses. In:Ž .Parnham, M.J., Bruinvels, J. Eds. , Discoveries in Pharmacol-
ogy, Vol. 1, Elsevier, Amsterdam.Baumler, E., 1968. A Century of Chemistry. Econ Verlag, Dussel-
dorf, translated by D. Goodman.Beer, J.J., 1959. The Emergence of the German Dye Industry.
Univ. Illinois Press, Urbana, IL.Behnisch, R., 1986. From dyes to drugs. In: Parnham, M.J.,
Ž .Bruinvels, J. Eds. , Discoveries in Pharmacology, Vol. 3,Elsevier, Amsterdam.
Bernal, J.D., 1954. Science in History. Hawthorn Books, NewYork.
Boyd, J.S.K., 1950. Fifty years of tropical medicine, in BritishMedical Association, Fifty Years of Medicine. A Symposiumfrom the British Medical Journal. Thanet Press, Margate.
Cockburn, I., Henderson, R., 1995. Public–Private Interaction inŽ .Pharmaceutical Research mimeo, MIT .
Commanor, S., 1986. The political economy of the pharmaceuticalindustry. J. Econ. Lit. 24, 1187–1217.
Davenport-Hines, R., Slinn, J., 1992. Glaxo: A History to 1962.Cambridge Univ. Press, Cambridge.
Davidson, J.E.H., Hendry, D.F., Srba, F., Yeo, S., 1978. Econo-metric modelling of the aggregate time series relationshipbetween consumer’s expenditure and income in the UnitedKingdom. Econ. J. 88, 661–692.
Davidson, R., MacKinnon, J.G., 1993. Estimation and Inferencein Econometrics. Oxford Univ. Press, Oxford.
Dosi, G., 1982. Technological paradigms and technological trajec-tories. Res. Policy 11, 147.
Dosi, G., Freeman, C., Nelson, R., Silverberg, G., Soete, L., 1988.Technical Change and Economic Theory. Pinter Publishers,London.
Engle, R.F., 1982. Autoregressive conditional heteroskedasticitywith estimates of the variance of United Kingdom inflation.Econometrica 50, 987–1007.
Engle, R.F., Granger, C.W.J., 1987. Co-integration and errorcorrection: representation, estimation and testing. Economet-rica 55, 251–276.
Ennis, M., Lorenz, W., 1984. Histamine receptor antagonists. In:Ž .Parnham, M.J., Bruinvels, J. Eds. , Discoveries in Pharmacol-
ogy, Vol. 2, Elsevier, Amsterdam.Ž .Fleeger, C.A. Ed. , 1994. USAN and USP Dictionary of Drug
Names. U.S. Pharmaceutical Convention, Rockville, MD.Foot, M., 1973. Aneurin Bevan, A Biography, Vol. Two: 1945–
1960. Davis-Poynter, London.Freeman, C., 1974. The Economics of Industrial Innovation.
Penguin Books, Harmondsworth, Middlesex.Ž .Freeman, C. Ed. , 1996. Long Wave Theory. Edward Elgar
Publishing, Cheltenham.Freeman, C., Perez, C., 1988. Structural crises of adjustment:
business cycles and investment behaviour. In: Dosi, G., Free-Ž .man, C., Nelson, R., Silverberg, G., Soete, L. Eds. , Techni-
cal Change and Economic Theory. Pinter Publishers, London.Freeman, C., Achilladelis, B., Jervis, P., Robertson, A., Curnow,
R., Fuller, J., Horsley, A., 1971. A Study of Success andFailure in Innovation. Science Policy Research Unit, Univer-sity of Sussex, mimeo.
Freeman, C., Achilladelis, B., Jervis, P., Robertson, A., Horsley,A., Curnow, R., Fuller, J., 1972. Success and Failure inIndustrial Innovation. Report on Project SAPPHO, Centre forthe Study of Industrial Innovation, London.
Freeman, C., Clark, J., Soete, L., 1982. Unemployment andTechnical Innovation: A Study of Long Waves in EconomicDevelopment. Frances Pinter, London.
Galambos, L., Sturchio, J.L., 1998. Pharmaceutical firms and thetransition to biotechnology: a study in strategic innovation.Bus. Hist. Rev. 72, 250–278.
Geison, G., 1981. Scientific change, emerging specialties andresearch schools. Hist. Sci. 20–40.
Grabowski, H., 1976. Drug Regulation and Innovation: EmpiricalEvidence and Policy Options. American Enterprise Institutefor Policy Research, Washington, DC.
Guerlac, H., 1975. Antoine-Laurent Lavoisier, Chemist and Revo-lutionary. Charles Scribner’s Sons, New York.
Haagensen, C.D., Wyndham, C., Lloyd, E.B., 1943. A HundredYears of Medicine. Sheridan House, New York.
Hare, R., 1970. The Birth of Penicillin and the Disarming ofMicrobes. Allen and Unwin, London.
Harvey, A.C., 1983. The Econometric Analysis of Time Series.Philip Allan Publishers, London.
Henderson, R., Cockburn, I., 1996. Scale, scope and spillovers:the determinants of drug productivity in drug discovery. RAND
Ž .J. Econ. 27 1 , 32–59.Hill, R.A., Bernbridge, B.A., 1986. Physics and Philanthropy: A
History of the Wellcome Trust 1931–1986. Wellcome Founda-tion, London.
Holden, K., Thompson, J., 1992. Co-integration: an introductorysurvey. Br. Rev. Econ. Issues 14, 1–55.
Ž .Holmstedt, R., Liljestrand, G. Eds. , 1963. Readings in Pharma-cology. Pergamon, New York.
James, B., 1990. The Global Pharmaceutical Industry in the1990s: the Challenge of Change, The Economist IntelligenceUnit, Special Report 2071, London.
Kay, N.M., 1979. The Innovating Firm, A Behavioural Theory ofCorporate R&D. Macmillan, London.
Kondratiev, N.D., 1925. The long waves in economic life. Rev.Econ. Stat. 17, 105–115.
Kuhn, T.H., 1962. The Structure of Scientific Revolutions. ChicagoUniv. Press, Chicago.
Landes, D., 1970. The Unbound Prometheus. Cambridge Univ.Press, Cambridge.
Lesch, J.E., 1993. Chemistry and biomedicine in an industrialsetting: the invention of the sulfa drugs. In: Mauskopf, S.H.Ž .Ed. , Chemical Sciences in the Modern World. Univ. Penn-sylvania Press, Philadelphia.
Ž .Lesch, J.E., 1997. The discovery of M and B 693 sulphapyridine .Ž .In: Highby, G.J., Strout, C. Eds. , The Inside Story of
Medicines. American Institute of the History of Pharmacy,Madison, WI.
Liebenau, J., 1987. Medical Science and Medical Industry. TheFormation of the American Pharmaceutical Industry. Macmil-lan, London.
McNalty, A.S., 1950. Fifty Years in Public Health Legislation, inBritish Medical Association, Fifty Years of Medicine, A Sym-

( )B. Achilladelis, N. AntonakisrResearch Policy 30 2001 535–588588
posium from the British Medical Journal. Thanet Press, Mar-gate.
ŽMann, R.D., 1984. Modern Drug Use An Inquiry on Historical.Principles . MTP Press, Lancaster.
Mansfield, E., 1968a. Industrial Research and Technological Inno-vation. Norton, New York.
Mansfield, E., 1968b. The Economics of Technical Change. Long-man, London.
Marris, R., 1964. The Economic Theory of Managerial Capital-ism. Macmillan, London.
Mattheus, L.G., 1962. History of Pharmacy in Britain. E.&SLivingstone, Edinburgh.
Mokyr, J., 1990. The Lever of Riches. Technological Creativityand Economic Progress. Oxford Univ. Press, New York, Ox-ford.
Mowery, D., Rosenberg, N., 1979. The influence of marketdemand upon innovation: a critical review of some recentempirical studies. Res. Policy 8, 102–153.
Nelson, R.R., Winter, S.G., 1977. In search of a useful theory ofinnovation. Res. Policy 6, 36–76.
Pavitt, K., 1984. Sectoral patterns of technical change: towards ataxonomy and a theory. Res. Policy 13, 343–373.
Porter, M., 1990. The Competitive Advantage of Nations. FreePress, New York.
Porter, R., 1997. Greatest Benefit to Mankind. A Medical Historyof Humanity. W.W. Norton and Company, New York.
Ramsey, J.B., 1974. Classical model selection through specifica-Ž .tion error tests. In: Zarembka, P. Ed. , Frontiers in Economet-
rics. Academic Press, New York.Reader, W.J., 1978. Imperial Chemical Industries: A History, Vol.
2, The First Quarter Century, 1926–1952. Oxford Univ. Press,Oxford.
Reich, M.R., 1990. Why the Japanese don’t export more pharma-ceuticals: health policy as industrial policy. Calif. Manag. Rev.
Ž .Reprint Ser. 32 2 , 124–150.Ž .Reynolds, J.E.F. Ed. , 1989. Martindale, the Extra Pharma-
copoeia. The Pharmaceutical Press, London.Riedl, R.A., 1990. A brief history of the pharmaceutical industry
Ž .in Basel. In: Liebenau, J., Highby, G., Stroud, E. Eds. , PillPeddlers: Essays on the History of the Pharmaceutical Indus-try. American Institute for the History of Pharmacy, Madison,WI.
Robson, M., 1990. The French pharmaceutical industry, 1919–
Ž .1939. In: Liebenau, J., Highby, G., Stroud, E. Eds. , PillPeddlers: Essays on the History of the Pharmaceutical Indus-try. American Institute for the History of Pharmacy, Madison,WI.
Rosenberg, N., 1969. The direction of technological change:inducement mechanisms and focussing devices. Econ. Dev.Cult. Change 18, 6.
Rosenberg, N., 1976. Perspectives on Technology. CambridgeUniv. Press, Cambridge.
Schmookler, J., 1976. Innovation and Economic Growth. HarvardUniv. Press, Cambridge, MA.
Schumpeter, J.A., 1943. Capitalism, Socialism and Democracy.Unwin Univ. Books, London.
ŽServan-Schreiber, J.E., 1968. The American Challenge Le Defi.Americain . Hamish Hamilton, London.
Sneader, W., 1985. Drug Discovery and Evolution of ModernMedicines. Wiley, Chichester.
Sneader, W., 1996. Drug Prototypes and Their Exploitation. Wi-ley, Chichester.
Thompson, D., 1977. Europe Since Napoleon. Penguin Books,Harmondsworth, Middlesex.
Thuillier, J., 1980. Les Dix Ans qui ont change la Folie, Vol. 1, R.´Lafont, Paris.
U.S. Congress, 1938. Federal Food, Drug and Cosmetic Act, 21U.S.C.r3016392, 52 Stat. 1040.
U.S. Congress, 1962. Drug Amendments of 1962, 21Ž . Ž . Ž .Ž .Ž .U.S.C.rr321 p - 1 , 351 a 2 B 360 et seq., PL 87-781, 76
Stat. 780, 10 October.U.S. Department of Health and Human Services, Public Health
Service, Food and Drug Admnistration, 1989, Offices of DrugEvaluation Statistical Report, 1987–1988. Publication No.
ŽB89-233530 National Technical Information Service, Spring-.field, VA .
Verg, E., 1988. Milestones: The Bayer Story, 1863–1988. Bayer,Leverkusen, translated by J. Wicks.
Wallis, K., 1979. Topics in Applied Econometrics. Blackwell,Oxford.
Walsh, V., 1984. Invention and innovation in the chemical indus-try: demand-pull or discovery-push? Res. Policy 13, 211–234.
Yoshikawa, A., 1989. The other drug war: U.S.–Japan trade inŽ .pharmaceuticals. Calif. Manage. Rev. Reprint Ser. 31 2 ,
76–90.