Embed Size (px)
Citation preview
66 Rahman and Herdinansyah
Int. J. Biosci. 2016
RESEARCH PAPER OPEN ACCESS
The dynamics of phytoplanktonic community in relation to
water quality regimes, In flood plain of Bangkau Swampy lake,
South Kalimantan, Indonesia
Mijani Rahman*1, Herliwati Herdinansyah2
1Department of Aquatic Resources Management, University of Lambung Mangkurat,
Banjarbaru, Indonesia
2Department of Aquaculture, University of Lambung Mangkurat, Banjarbaru, Indonesia
Key words: Phytoplankton, Flood plain, Swampy lake, Water quality
http://dx.doi.org/10.12692/ijb/9.5.66-77 Article published on November 21, 2016
Abstract
This research aims to investigate the the effect of the dynamic of water physico-chemical changes to structural
community of phytoplantonic creatures in swampy flood plain. Water samples were taken in May to November
2015 in Bangkau swampy flood plain. Multivariate analysis non-metric multidimension scaling (NMDS) was
used for statistically analysis the relationship of biotic and water physico-chemical data. Oscillatoria,
Gonatozygon and Thallasiossira are three of twenty species, which they always present in each observations.
Abundance of phytoplanktonic ranges between 148 to 23,740 cell L-1. The presence of phytoplanktonic mainly
abundance in November (16 to 20 genera) and very rare in May. Identified 20 genera, there 6 genera have a
correlation to the dynamic of water quality parameters. Binuclearia and Cryptomonas have positiey correlated
to parameters of depth, SO4 and PO4. Both Binuclearia and Cryptomonas were present dominantly in May and
June. In the other hand, Oscillatoria (Cyanophyta), Sphaeroplea (Chlorophyta), Diatoma and Nitszchia
(Chrysophyta) shows negatively correlated to the dinamic water quality.
* Corresponding Author: Mijani Rahman [email protected]
International Journal of Biosciences | IJB |
ISSN: 2220-6655 (Print), 2222-5234 (Online)
http://www.innspub.net
Vol. 9, No. 5, p. 66-77, 2016
67 Rahman and Herdinansyah
Int. J. Biosci. 2016
Introduction
Bangkau swampy lake is siatuated at western part of
South Kalimantan, Indonesia. It is a monotone
swamp which is bordered by flooding swampy plain.
The change of surface water create high variation of
lake width. In the dry season, the depth of surface
water droops and is collected in the middle of lake,
while in the rainy season the width of lake expands in
larger area.
The dynamic of water depth is the most important
environmental parameter in aquatic environment of
flood plain (Mihaljevi´c et al.,2010), because of as a
hub of energy, material and organisme between
theriver and flood plain (Tockner and Stanford,
2002).
The different of water depth between dry and rain
season can possibly interact between hidrology and
ecology (Junk et al., 1989; Junk and Wantzen, 2004)
that it differenciates physico-chemical aquatic
characteristic and biological adaptation.
The different of water fluctuation may affect to the
change of behavior and pattern of local fish migration
(Lowe-McConell, 1989; Schagerl et al., 2009). During
flooding, aquatic environmental diversity is reduced
(Cardoso et al., 2012).
As a natural flood plain ecosystem, such as Bangkau
Swampy Lake is the ecosystem which has high
productivity and biodiversity (Mihaljević et al., 2013).
However it is the most threated and sensitve
ecosystem. It’s degradation will affect to reduction of
biodiversity and aquatc productvity.
Trend of reducing of fishing yield has been detected
by local fisherman since the last five years. Therefore,
management and habitat conservation of flood plain
must be revitalized for sustaining the ecosystem
(Abdullah-Al Mamun, 2010).
The success of management and conservation of flood
plain swamp will be determined by the understanding
to environmental aquatic condition, which consists of
quantity and physico-chemical fluctuation of water
(Alam et al., 2016), and biological communty in this
ecosystem. Planktonic organisms is the first biological
comunity that will gives dinamically response to the
aquatic changes(Kozak et al., 2015; Yu et al.,2016).
Thus, planktonic organism presence in aquatic
environment can be used to be an indicator for
aquatic condition and water producivity level.
Materials and methods
Study area
Bangkau swampy lake is located in western part of
Meratus highland with plain topographic lowland.
According to hydrological processes maintaining the
wetland, this lake is categorised to be a basin
landform type (Semeniuk, 2011). Almost al of surface
water is covered by emergen
t and free-floating plants.Administratively, Bangkau
lake has been registered in Hulu Sungai Selatan
District of South Kalimantan, Indonesia.
Geographycally, it is located at 2°37’30”S - 2°40’18”S
dan 115°11’06”E - 115°13’02”E., with area covers of 65
Ha. This lake has flooding area which increases in
rainy season dramatically.
Sampling site and sample processing
The dynamics of phytoplankton community and
physical-chemical features of Danau Bangkau
swampy flood plain waters were observed from May
2015 to November 2015.
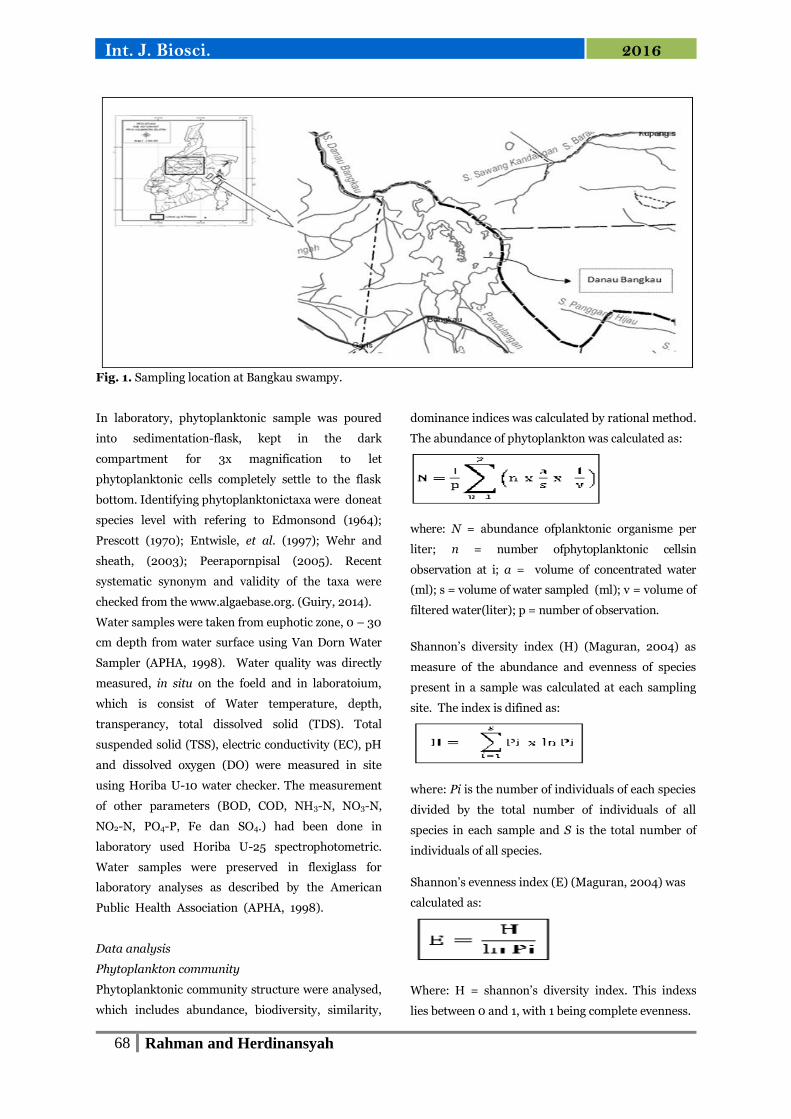
The data of phytoplankton and water quality were
taken regularly every monthin every last week. Three
sampling sites were chosen to be evaluated for
featuring of phytoplanktonic community and water
quality parameters (Fig.1).
Planktonic samples weretaken by filtering water from
(0 – 30 cm) depth from the surface using plankton
net No. 20. About 15 ml of concentrated filtered water
was added by 4 drops of 48% formaldehide.
Phytoplanktonic creatures were identified and
counted at 400x magnification using Binocular
microscope.
68 Rahman and Herdinansyah
Int. J. Biosci. 2016
Fig. 1. Sampling location at Bangkau swampy.
In laboratory, phytoplanktonic sample was poured
into sedimentation-flask, kept in the dark
compartment for 3x magnification to let
phytoplanktonic cells completely settle to the flask
bottom. Identifying phytoplanktonictaxa were doneat
species level with refering to Edmonsond (1964);
Prescott (1970); Entwisle, et al. (1997); Wehr and
sheath, (2003); Peerapornpisal (2005). Recent
systematic synonym and validity of the taxa were
checked from the www.algaebase.org. (Guiry, 2014).
Water samples were taken from euphotic zone, 0 – 30
cm depth from water surface using Van Dorn Water
Sampler (APHA, 1998). Water quality was directly
measured, in situ on the foeld and in laboratoium,
which is consist of Water temperature, depth,
transperancy, total dissolved solid (TDS). Total
suspended solid (TSS), electric conductivity (EC), pH
and dissolved oxygen (DO) were measured in site
using Horiba U-10 water checker. The measurement
of other parameters (BOD, COD, NH3-N, NO3-N,
NO2-N, PO4-P, Fe dan SO4.) had been done in
laboratory used Horiba U-25 spectrophotometric.
Water samples were preserved in flexiglass for
laboratory analyses as described by the American
Public Health Association (APHA, 1998).
Data analysis
Phytoplankton community
Phytoplanktonic community structure were analysed,
which includes abundance, biodiversity, similarity,
dominance indices was calculated by rational method.
The abundance of phytoplankton was calculated as:
where: N = abundance ofplanktonic organisme per
liter; n = number ofphytoplanktonic cellsin
observation at i; a = volume of concentrated water
(ml); s = volume of water sampled (ml); v = volume of
filtered water(liter); p = number of observation.
Shannon’s diversity index (H) (Maguran, 2004) as
measure of the abundance and evenness of species
present in a sample was calculated at each sampling
site. The index is difined as:
where: Pi is the number of individuals of each species
divided by the total number of individuals of all
species in each sample and S is the total number of
individuals of all species.
Shannon’s evenness index (E) (Maguran, 2004) was
calculated as:
Where: H = shannon’s diversity index. This indexs
lies between 0 and 1, with 1 being complete evenness.
69 Rahman and Herdinansyah
Int. J. Biosci. 2016
Relation of water quality and phytoplanktonic
community
Non-Metric Multidimensional Scaling (NMDS) with
env.fit to ordination (scalling) was used to summarize
phytoplanktonic data variation in relation to extract
environmental factors, which is affecting
phytoplanktonic community. Statistical program of R
ver.2.8.0., especially the vegan package for NMDS
was used to analyze data and drawing figure (RDCT,
2008). Independent variables consist of physico-
chemical parameters of water and dependent
variables areabundance (N), diversity (Div), Eveness
(Eve) dan dominancy (Dom). Especially for the data
matrix abundance of phytoplankton species
(dependent variable, Y) transformation with the
function Log (x + 1) prior to analysis, to reduce the
abnormal data. NMDS analysis of the matrix
dependent variable (Y) using the Bray-Curtis
dissimilarity, double standardization
Results and discussion
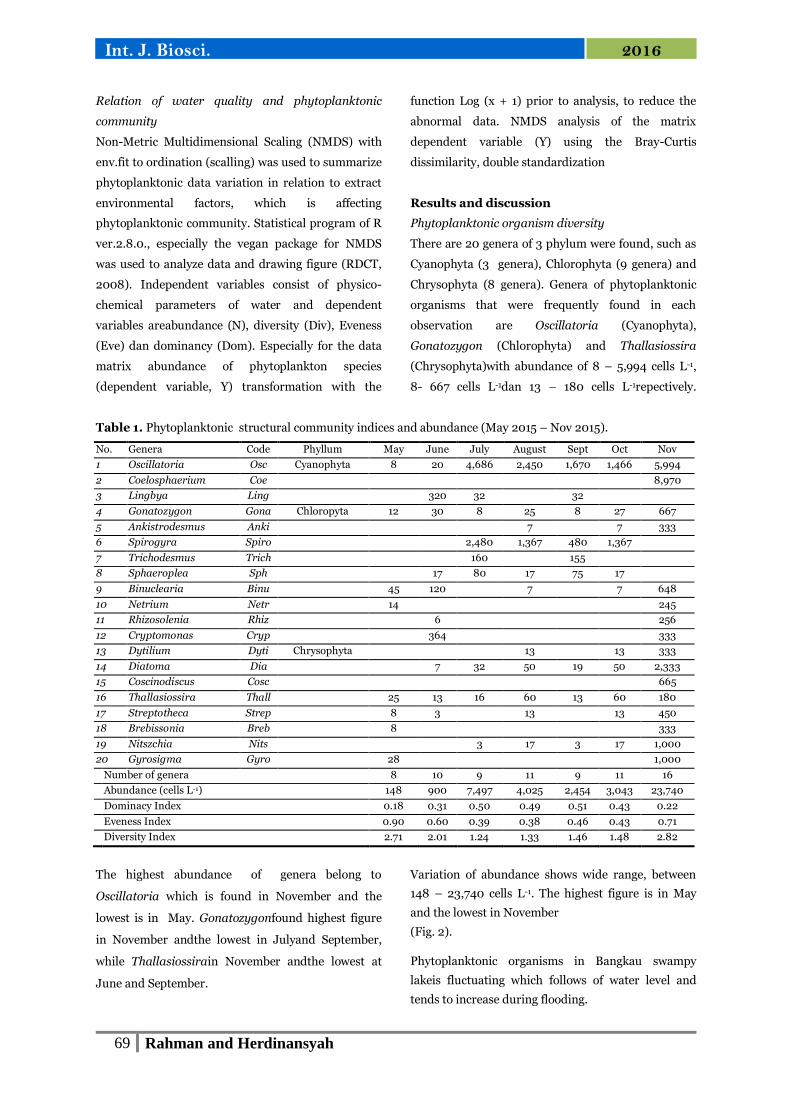
Phytoplanktonic organism diversity
There are 20 genera of 3 phylum were found, such as
Cyanophyta (3 genera), Chlorophyta (9 genera) and
Chrysophyta (8 genera). Genera of phytoplanktonic
organisms that were frequently found in each
observation are Oscillatoria (Cyanophyta),
Gonatozygon (Chlorophyta) and Thallasiossira
(Chrysophyta)with abundance of 8 – 5,994 cells L-1,
8- 667 cells L-1dan 13 – 180 cells L-1repectively.
Table 1. Phytoplanktonic structural community indices and abundance (May 2015 – Nov 2015).
No. Genera Code Phyllum May June July August Sept Oct Nov
1 Oscillatoria Osc Cyanophyta 8 20 4,686 2,450 1,670 1,466 5,994
2 Coelosphaerium Coe 8,970
3 Lingbya Ling 320 32 32
4 Gonatozygon Gona Chloropyta 12 30 8 25 8 27 667
5 Ankistrodesmus Anki 7 7 333
6 Spirogyra Spiro 2,480 1,367 480 1,367
7 Trichodesmus Trich 160 155
8 Sphaeroplea Sph 17 80 17 75 17
9 Binuclearia Binu 45 120 7 7 648
10 Netrium Netr 14 245
11 Rhizosolenia Rhiz 6 256
12 Cryptomonas Cryp 364 333
13 Dytilium Dyti Chrysophyta 13 13 333
14 Diatoma Dia 7 32 50 19 50 2,333
15 Coscinodiscus Cosc 665
16 Thallasiossira Thall 25 13 16 60 13 60 180
17 Streptotheca Strep 8 3 13 13 450
18 Brebissonia Breb 8 333
19 Nitszchia Nits 3 17 3 17 1,000
20 Gyrosigma Gyro 28 1,000
Number of genera 8 10 9 11 9 11 16
Abundance (cells L-1) 148 900 7,497 4,025 2,454 3,043 23,740
Dominacy Index 0.18 0.31 0.50 0.49 0.51 0.43 0.22
Eveness Index 0.90 0.60 0.39 0.38 0.46 0.43 0.71
Diversity Index 2.71 2.01 1.24 1.33 1.46 1.48 2.82
The highest abundance of genera belong to
Oscillatoria which is found in November and the
lowest is in May. Gonatozygonfound highest figure
in November andthe lowest in Julyand September,
while Thallasiossirain November andthe lowest at
June and September.
Variation of abundance shows wide range, between
148 – 23,740 cells L-1. The highest figure is in May
and the lowest in November
(Fig. 2).
Phytoplanktonic organisms in Bangkau swampy
lakeis fluctuating which follows of water level and
tends to increase during flooding.
70 Rahman and Herdinansyah
Int. J. Biosci. 2016
The highest figure of abundance were occured in
October – November, while the lowest was in May –
June and September – October. The highest value
may caused by the increase simultaneously of lake
and river watervolume. Swampy–river
interconnection during the rainy season would
increase the quality of aquatic environment, brings
and spreads nutritions
into swampy flood plain (Alam et al., 2016; Nabout et
al., 2007; Yu et al., 2016). Water brings nutrition
from allochonous materials and pushes
autochrotonus (autochthonous) to mix
simulaneously, which finally triggers the increase the
growth of phytoplanktonic organisms and thus
increase productivity of zooplankton (Okogwu, 2010;
Liu et al., 2010).
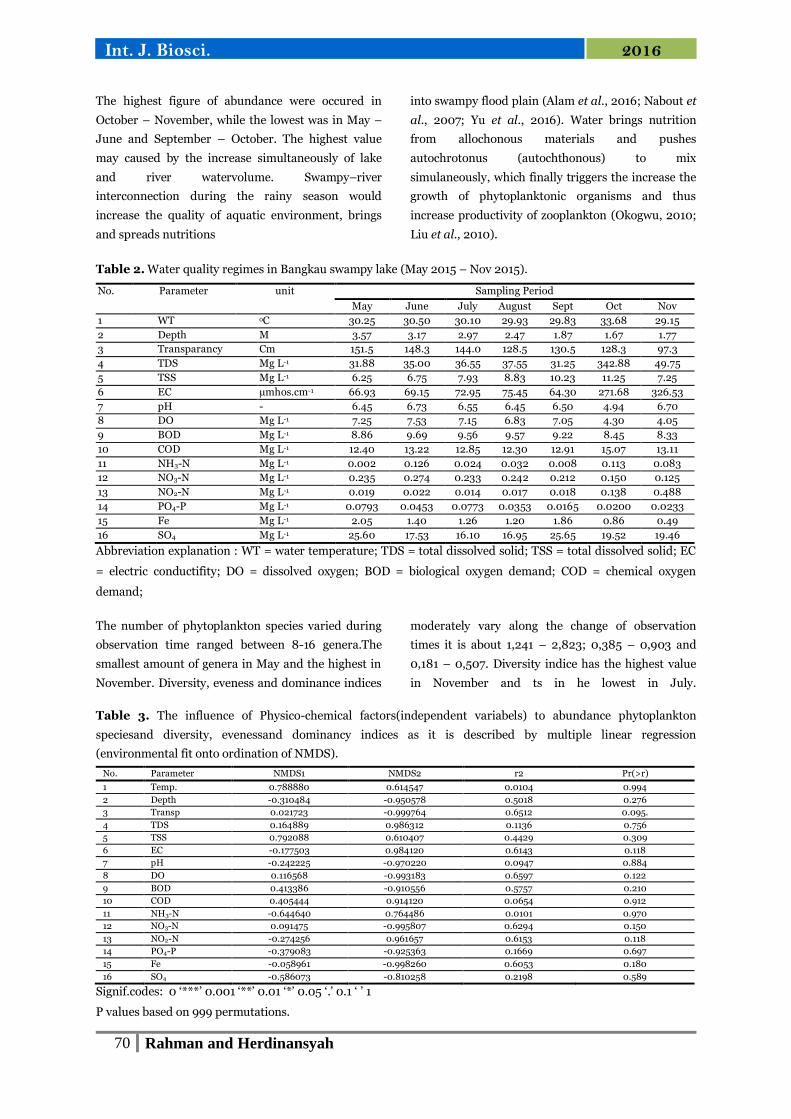
Table 2. Water quality regimes in Bangkau swampy lake (May 2015 – Nov 2015).
No. Parameter unit Sampling Period
May June July August Sept Oct Nov
1 WT oC 30.25 30.50 30.10 29.93 29.83 33.68 29.15
2 Depth M 3.57 3.17 2.97 2.47 1.87 1.67 1.77
3 Transparancy Cm 151.5 148.3 144.0 128.5 130.5 128.3 97.3
4 TDS Mg L-1 31.88 35.00 36.55 37.55 31.25 342.88 49.75
5 TSS Mg L-1 6.25 6.75 7.93 8.83 10.23 11.25 7.25
6 EC µmhos.cm-1 66.93 69.15 72.95 75.45 64.30 271.68 326.53
7 pH - 6.45 6.73 6.55 6.45 6.50 4.94 6.70
8 DO Mg L-1 7.25 7.53 7.15 6.83 7.05 4.30 4.05
9 BOD Mg L-1 8.86 9.69 9.56 9.57 9.22 8.45 8.33
10 COD Mg L-1 12.40 13.22 12.85 12.30 12.91 15.07 13.11
11 NH3-N Mg L-1 0.002 0.126 0.024 0.032 0.008 0.113 0.083
12 NO3-N Mg L-1 0.235 0.274 0.233 0.242 0.212 0.150 0.125
13 NO2-N Mg L-1 0.019 0.022 0.014 0.017 0.018 0.138 0.488
14 PO4-P Mg L-1 0.0793 0.0453 0.0773 0.0353 0.0165 0.0200 0.0233
15 Fe Mg L-1 2.05 1.40 1.26 1.20 1.86 0.86 0.49
16 SO4 Mg L-1 25.60 17.53 16.10 16.95 25.65 19.52 19.46
Abbreviation explanation : WT = water temperature; TDS = total dissolved solid; TSS = total dissolved solid; EC
= electric conductifity; DO = dissolved oxygen; BOD = biological oxygen demand; COD = chemical oxygen
demand;
The number of phytoplankton species varied during
observation time ranged between 8-16 genera.The
smallest amount of genera in May and the highest in
November. Diversity, eveness and dominance indices
moderately vary along the change of observation
times it is about 1,241 – 2,823; 0,385 – 0,903 and
0,181 – 0,507. Diversity indice has the highest value
in November and ts in he lowest in July.
Table 3. The influence of Physico-chemical factors(independent variabels) to abundance phytoplankton
speciesand diversity, evenessand dominancy indices as it is described by multiple linear regression
(environmental fit onto ordination of NMDS).
No. Parameter NMDS1 NMDS2 r2 Pr(>r)
1 Temp. 0.788880 0.614547 0.0104 0.994
2 Depth -0.310484 -0.950578 0.5018 0.276
3 Transp 0.021723 -0.999764 0.6512 0.095.
4 TDS 0.164889 0.986312 0.1136 0.756
5 TSS 0.792088 0.610407 0.4429 0.309
6 EC -0.177503 0.984120 0.6143 0.118
7 pH -0.242225 -0.970220 0.0947 0.884
8 DO 0.116568 -0.993183 0.6597 0.122
9 BOD 0.413386 -0.910556 0.5757 0.210
10 COD 0.405444 0.914120 0.0654 0.912
11 NH3-N -0.644640 0.764486 0.0101 0.970
12 NO3-N 0.091475 -0.995807 0.6294 0.150
13 NO2-N -0.274256 0.961657 0.6153 0.118
14 PO4-P -0.379083 -0.925363 0.1669 0.697
15 Fe -0.058961 -0.998260 0.6053 0.180
16 SO4 -0.586073 -0.810258 0.2198 0.589
Signif.codes: 0 ‘***’ 0.001 ‘**’ 0.01 ‘*’ 0.05 ‘.’ 0.1 ‘ ’ 1
P values based on 999 permutations.
71 Rahman and Herdinansyah
Int. J. Biosci. 2016
The eveness indice figure out the highest in May and
the lowest value in August. Dominance indice shows
the highest value in September and the lowest in May.
The changes of structural community indices do not
follow the change of planktonic abundance. It occurs
due to an increase in certain species. Phytoplantonic
community profile can be seen in Table 1.
Table 1 shows that the trend of reduction of diversity
indice in July – October because of the increase in
abundance of organism cells, such as Oscillatoria sp
and Spirogyra sp. Therefore, diversity indice
increases to be 0.501, 0.486 and 0,507. In addition to
that, the presence of Spirogyra sp. with huge number
is only resent in those months.
72 Rahman and Herdinansyah
Int. J. Biosci. 2016
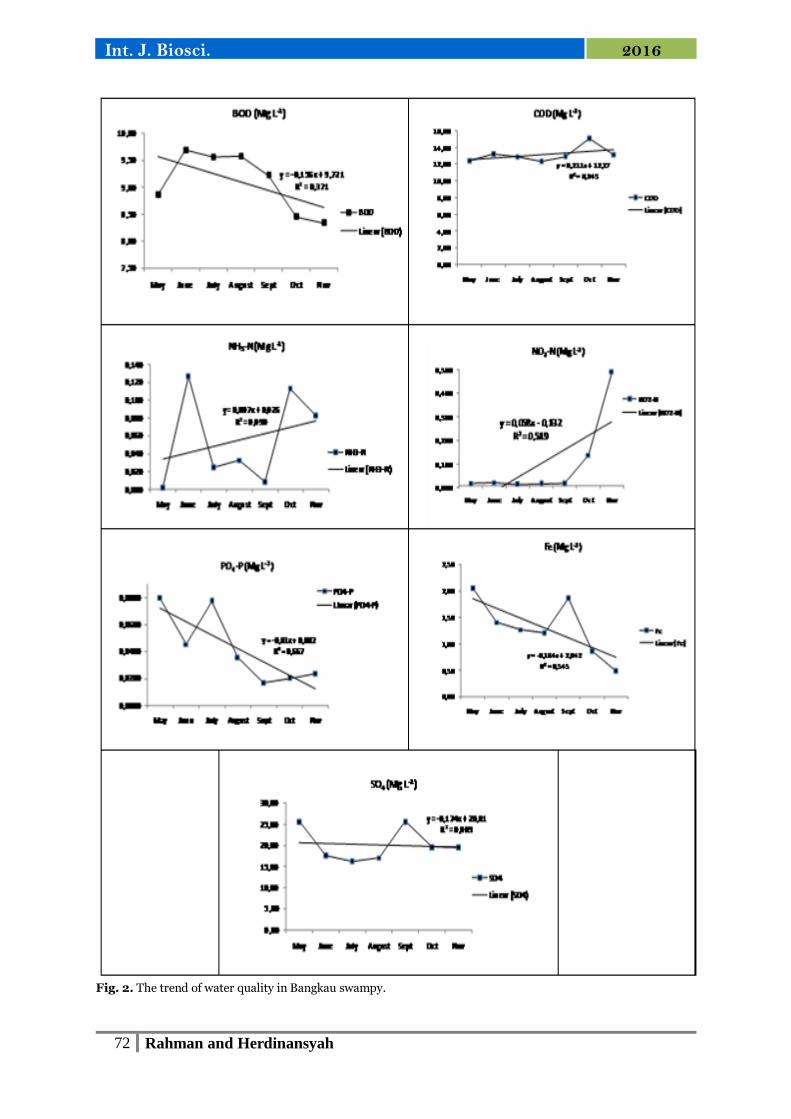
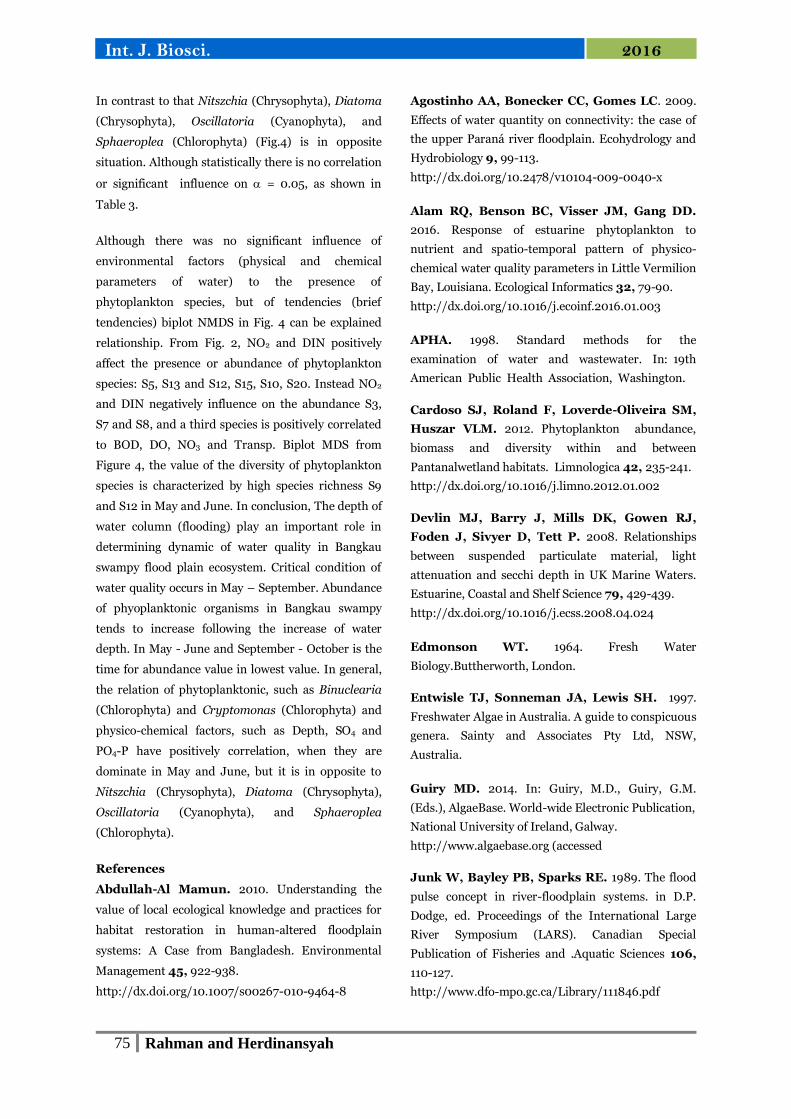
Fig. 2. The trend of water quality in Bangkau swampy.
73 Rahman and Herdinansyah
Int. J. Biosci. 2016
The dynamic of water quality features
Measuring of water quality in Bangkau swampy lake
in period of May to November showed fluctuation.
This occure due to the change of volume and the
depth of water which marely due to rainfall and river
water. The change in water quality regime is shown in
Table 2.
Additional water volume results in reducing
concentration of diluted and suspended particles, and
thus will reduce the concentration of water in the
flood plain area. Therefore, the water quality in flood
plain during flooding will be affected the quality of
water from rivers which are connected to the flood
plain areas (Agostinho et al., 2009).
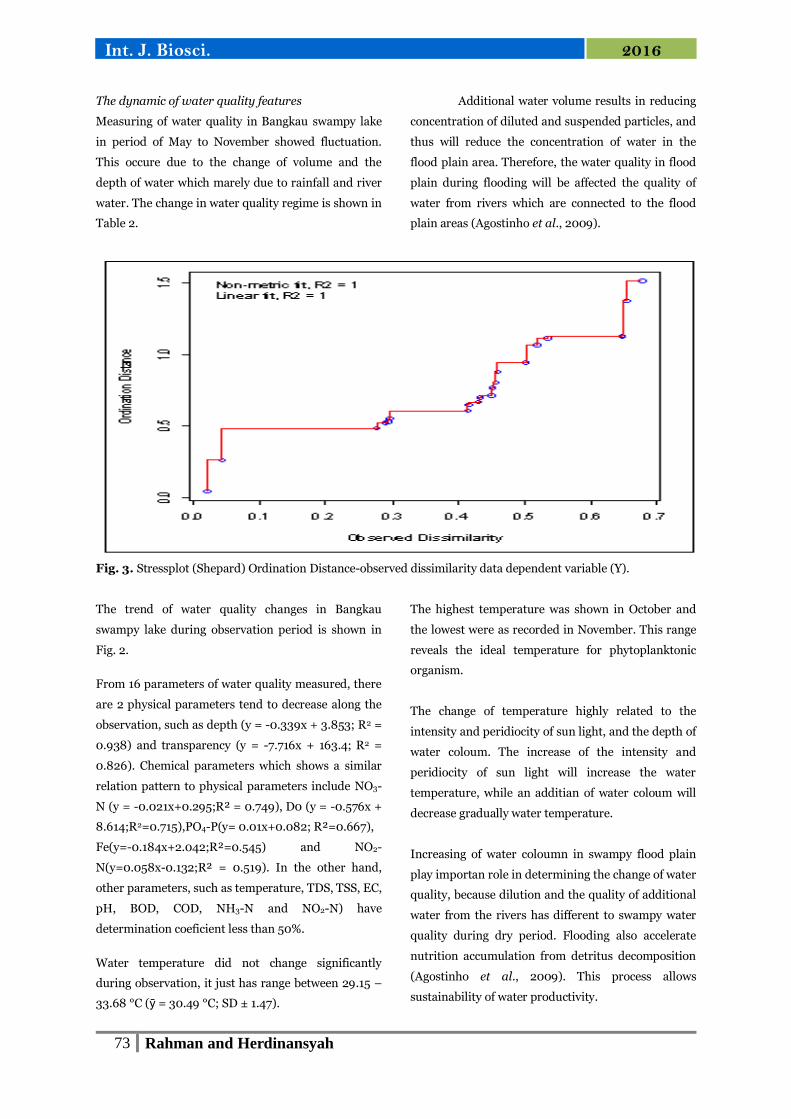
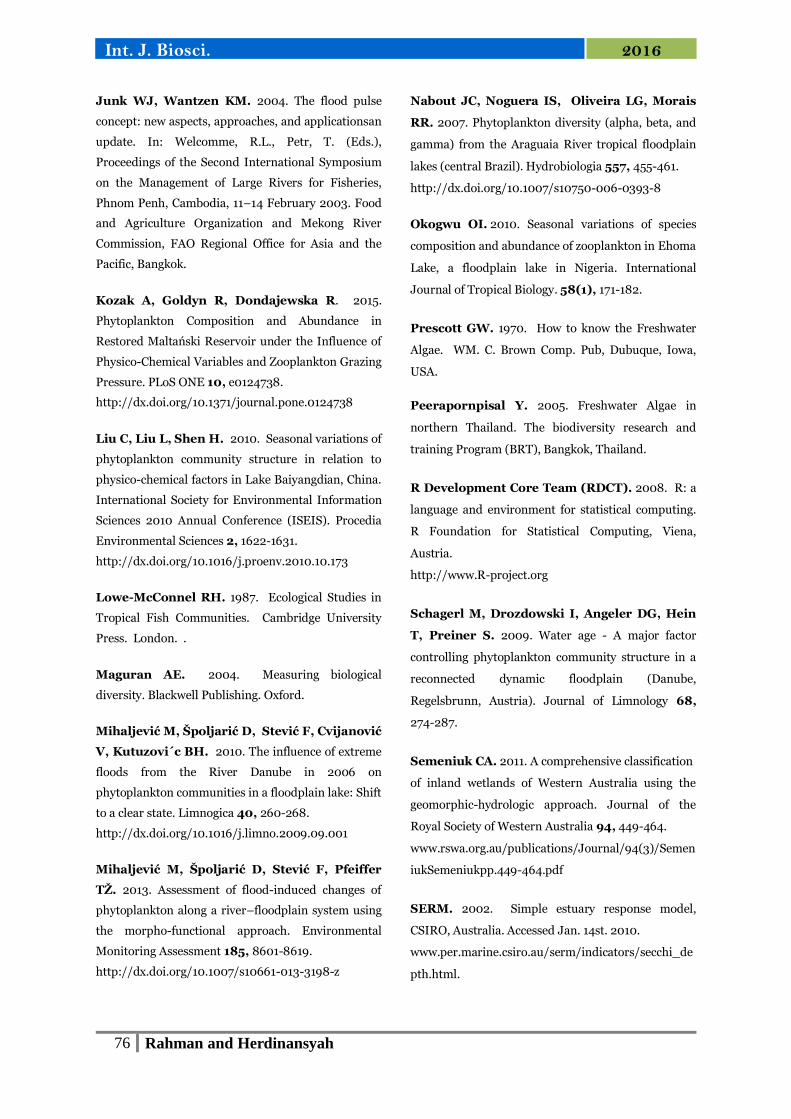
Fig. 3. Stressplot (Shepard) Ordination Distance-observed dissimilarity data dependent variable (Y).
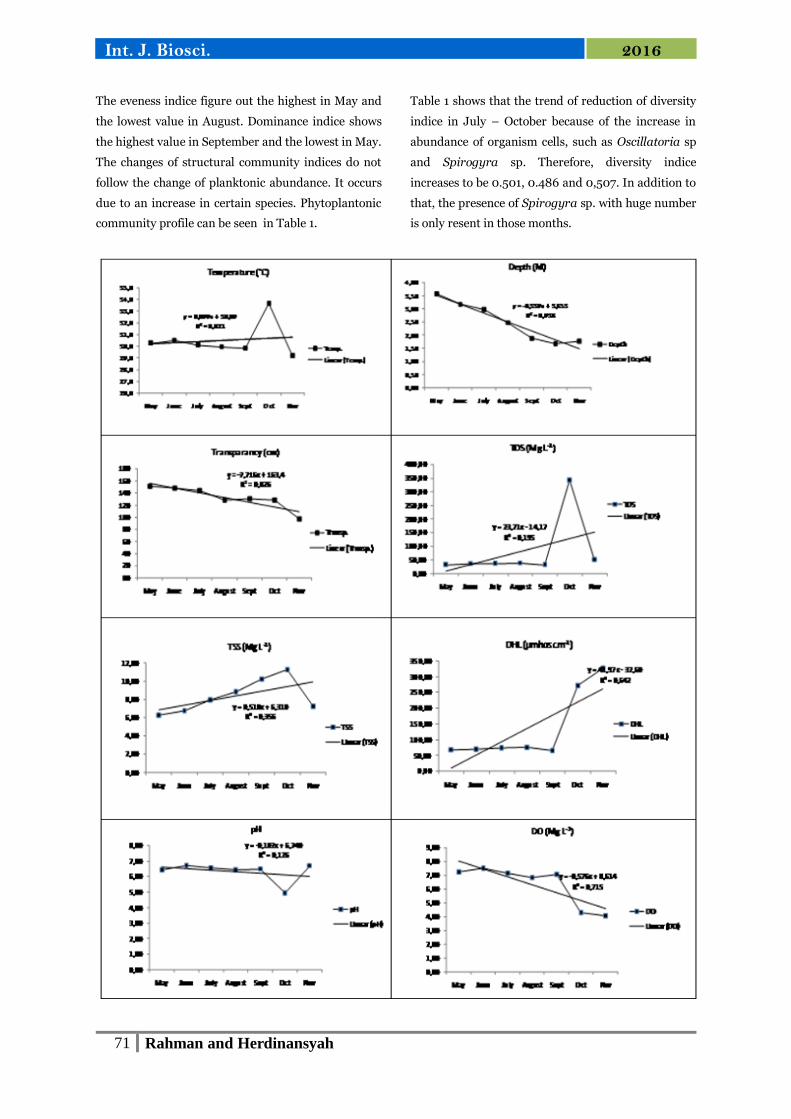
The trend of water quality changes in Bangkau
swampy lake during observation period is shown in
Fig. 2.
From 16 parameters of water quality measured, there
are 2 physical parameters tend to decrease along the
observation, such as depth (y = -0.339x + 3.853; R2 =
0.938) and transparency (y = -7.716x + 163.4; R2 =
0.826). Chemical parameters which shows a similar
relation pattern to physical parameters include NO3-
N (y = -0.021x+0.295;R² = 0.749), D0 (y = -0.576x +
8.614;R2=0.715),PO4-P(y= 0.01x+0.082; R²=0.667),
Fe(y=-0.184x+2.042;R²=0.545) and NO2-
N(y=0.058x-0.132;R² = 0.519). In the other hand,
other parameters, such as temperature, TDS, TSS, EC,
pH, BOD, COD, NH3-N and NO2-N) have
determination coeficient less than 50%.
Water temperature did not change significantly
during observation, it just has range between 29.15 –
33.68 °C (ȳ = 30.49 °C; SD ± 1.47).
The highest temperature was shown in October and
the lowest were as recorded in November. This range
reveals the ideal temperature for phytoplanktonic
organism.
The change of temperature highly related to the
intensity and peridiocity of sun light, and the depth of
water coloum. The increase of the intensity and
peridiocity of sun light will increase the water
temperature, while an additian of water coloum will
decrease gradually water temperature.
Increasing of water coloumn in swampy flood plain
play importan role in determining the change of water
quality, because dilution and the quality of additional
water from the rivers has different to swampy water
quality during dry period. Flooding also accelerate
nutrition accumulation from detritus decomposition
(Agostinho et al., 2009). This process allows
sustainability of water productivity.
74 Rahman and Herdinansyah
Int. J. Biosci. 2016
The average of tranparency is about 97.3 – 151.5 Cm
(ȳ = 132.62 Cm; SD ± 18.34). The biggest feature is in
May and the smallest in November. Photosynthetic
Active Radiation is calculated base on depth reading
of Secchi disk (SERM, 2002) and Beer-Lambert’ s
equation (Devlin et al., 2008; Srifa et al., 2016),
it is about 2.3 of Secchi’s depth. Base on this PAR
value, photosynthetic depth in Bangkau lake is 42.3 –
65.9 cm. The increase of phytoplantonic abundance
will reduce photosynthetic depth (Cardoso et al.,
2012) as it is occured in November.
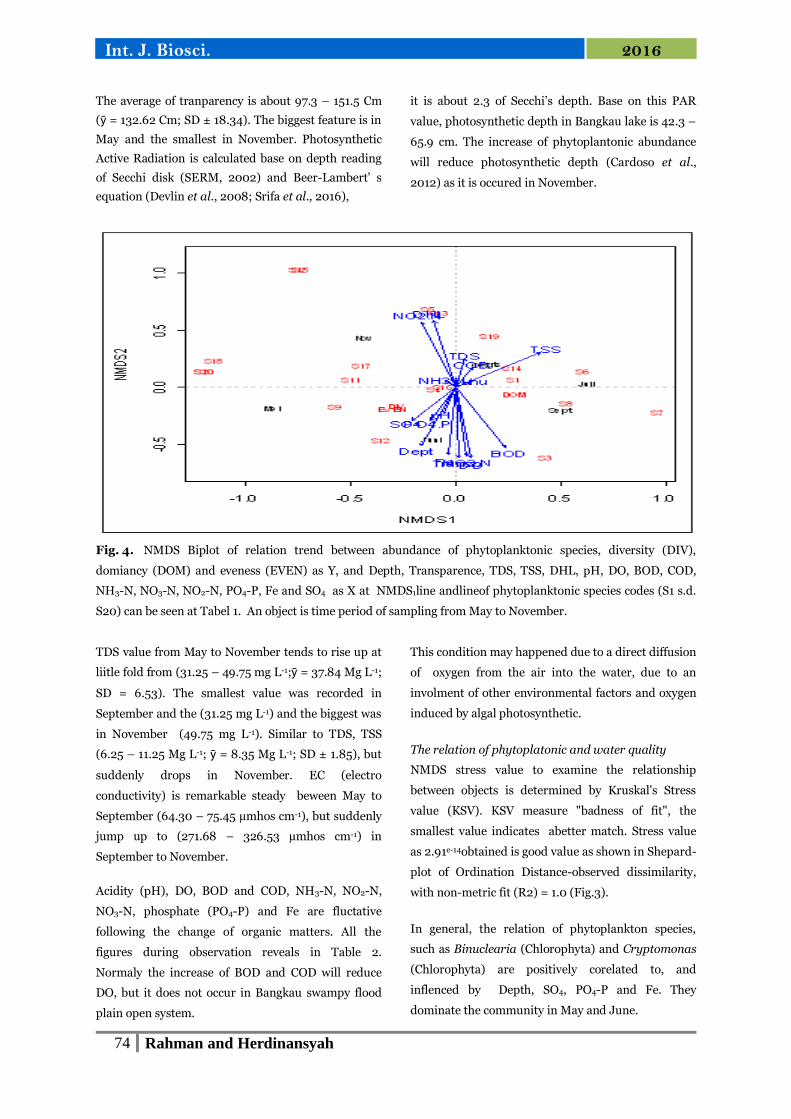
Fig. 4. NMDS Biplot of relation trend between abundance of phytoplanktonic species, diversity (DIV),
domiancy (DOM) and eveness (EVEN) as Y, and Depth, Transparence, TDS, TSS, DHL, pH, DO, BOD, COD,
NH3-N, NO3-N, NO2-N, PO4-P, Fe and SO4 as X at NMDS1line andlineof phytoplanktonic species codes (S1 s.d.
S20) can be seen at Tabel 1. An object is time period of sampling from May to November.
TDS value from May to November tends to rise up at
liitle fold from (31.25 – 49.75 mg L-1;ȳ = 37.84 Mg L-1;
SD = 6.53). The smallest value was recorded in
September and the (31.25 mg L-1) and the biggest was
in November (49.75 mg L-1). Similar to TDS, TSS
(6.25 – 11.25 Mg L-1; ȳ = 8.35 Mg L-1; SD ± 1.85), but
suddenly drops in November. EC (electro
conductivity) is remarkable steady beween May to
September (64.30 – 75.45 µmhos cm-1), but suddenly
jump up to (271.68 – 326.53 µmhos cm-1) in
September to November.
Acidity (pH), DO, BOD and COD, NH3-N, NO2-N,
NO3-N, phosphate (PO4-P) and Fe are fluctative
following the change of organic matters. All the
figures during observation reveals in Table 2.
Normaly the increase of BOD and COD will reduce
DO, but it does not occur in Bangkau swampy flood
plain open system.
This condition may happened due to a direct diffusion
of oxygen from the air into the water, due to an
involment of other environmental factors and oxygen
induced by algal photosynthetic.
The relation of phytoplatonic and water quality
NMDS stress value to examine the relationship
between objects is determined by Kruskal's Stress
value (KSV). KSV measure "badness of fit", the
smallest value indicates abetter match. Stress value
as 2.91e-14obtained is good value as shown in Shepard-
plot of Ordination Distance-observed dissimilarity,
with non-metric fit (R2) = 1.0 (Fig.3).
In general, the relation of phytoplankton species,
such as Binuclearia (Chlorophyta) and Cryptomonas
(Chlorophyta) are positively corelated to, and
inflenced by Depth, SO4, PO4-P and Fe. They
dominate the community in May and June.
75 Rahman and Herdinansyah
Int. J. Biosci. 2016
In contrast to that Nitszchia (Chrysophyta), Diatoma
(Chrysophyta), Oscillatoria (Cyanophyta), and
Sphaeroplea (Chlorophyta) (Fig.4) is in opposite
situation. Although statistically there is no correlation
or significant influence on = 0.05, as shown in
Table 3.
Although there was no significant influence of
environmental factors (physical and chemical
parameters of water) to the presence of
phytoplankton species, but of tendencies (brief
tendencies) biplot NMDS in Fig. 4 can be explained
relationship. From Fig. 2, NO2 and DIN positively
affect the presence or abundance of phytoplankton
species: S5, S13 and S12, S15, S10, S20. Instead NO2
and DIN negatively influence on the abundance S3,
S7 and S8, and a third species is positively correlated
to BOD, DO, NO3 and Transp. Biplot MDS from
Figure 4, the value of the diversity of phytoplankton
species is characterized by high species richness S9
and S12 in May and June. In conclusion, The depth of
water column (flooding) play an important role in
determining dynamic of water quality in Bangkau
swampy flood plain ecosystem. Critical condition of
water quality occurs in May – September. Abundance
of phyoplanktonic organisms in Bangkau swampy
tends to increase following the increase of water
depth. In May - June and September - October is the
time for abundance value in lowest value. In general,
the relation of phytoplanktonic, such as Binuclearia
(Chlorophyta) and Cryptomonas (Chlorophyta) and
physico-chemical factors, such as Depth, SO4 and
PO4-P have positively correlation, when they are
dominate in May and June, but it is in opposite to
Nitszchia (Chrysophyta), Diatoma (Chrysophyta),
Oscillatoria (Cyanophyta), and Sphaeroplea
(Chlorophyta).
References
Abdullah-Al Mamun. 2010. Understanding the
value of local ecological knowledge and practices for
habitat restoration in human-altered floodplain
systems: A Case from Bangladesh. Environmental
Management 45, 922-938.
http://dx.doi.org/10.1007/s00267-010-9464-8
Agostinho AA, Bonecker CC, Gomes LC. 2009.
Effects of water quantity on connectivity: the case of
the upper Paraná river floodplain. Ecohydrology and
Hydrobiology 9, 99-113.
http://dx.doi.org/10.2478/v10104-009-0040-x
Alam RQ, Benson BC, Visser JM, Gang DD.
2016. Response of estuarine phytoplankton to
nutrient and spatio-temporal pattern of physico-
chemical water quality parameters in Little Vermilion
Bay, Louisiana. Ecological Informatics 32, 79-90.
http://dx.doi.org/10.1016/j.ecoinf.2016.01.003
APHA. 1998. Standard methods for the
examination of water and wastewater. In: 19th
American Public Health Association, Washington.
Cardoso SJ, Roland F, Loverde-Oliveira SM,
Huszar VLM. 2012. Phytoplankton abundance,
biomass and diversity within and between
Pantanalwetland habitats. Limnologica 42, 235-241.
http://dx.doi.org/10.1016/j.limno.2012.01.002
Devlin MJ, Barry J, Mills DK, Gowen RJ,
Foden J, Sivyer D, Tett P. 2008. Relationships
between suspended particulate material, light
attenuation and secchi depth in UK Marine Waters.
Estuarine, Coastal and Shelf Science 79, 429-439.
http://dx.doi.org/10.1016/j.ecss.2008.04.024
Edmonson WT. 1964. Fresh Water
Biology.Buttherworth, London.
Entwisle TJ, Sonneman JA, Lewis SH. 1997.
Freshwater Algae in Australia. A guide to conspicuous
genera. Sainty and Associates Pty Ltd, NSW,
Australia.
Guiry MD. 2014. In: Guiry, M.D., Guiry, G.M.
(Eds.), AlgaeBase. World-wide Electronic Publication,
National University of Ireland, Galway.
http://www.algaebase.org (accessed
Junk W, Bayley PB, Sparks RE. 1989. The flood
pulse concept in river-floodplain systems. in D.P.
Dodge, ed. Proceedings of the International Large
River Symposium (LARS). Canadian Special
Publication of Fisheries and .Aquatic Sciences 106,
110-127.
http://www.dfo-mpo.gc.ca/Library/111846.pdf
76 Rahman and Herdinansyah
Int. J. Biosci. 2016
Junk WJ, Wantzen KM. 2004. The flood pulse
concept: new aspects, approaches, and applicationsan
update. In: Welcomme, R.L., Petr, T. (Eds.),
Proceedings of the Second International Symposium
on the Management of Large Rivers for Fisheries,
Phnom Penh, Cambodia, 11–14 February 2003. Food
and Agriculture Organization and Mekong River
Commission, FAO Regional Office for Asia and the
Pacific, Bangkok.
Kozak A, Goldyn R, Dondajewska R. 2015.
Phytoplankton Composition and Abundance in
Restored Maltański Reservoir under the Influence of
Physico-Chemical Variables and Zooplankton Grazing
Pressure. PLoS ONE 10, e0124738.
http://dx.doi.org/10.1371/journal.pone.0124738
Liu C, Liu L, Shen H. 2010. Seasonal variations of
phytoplankton community structure in relation to
physico-chemical factors in Lake Baiyangdian, China.
International Society for Environmental Information
Sciences 2010 Annual Conference (ISEIS). Procedia
Environmental Sciences 2, 1622-1631.
http://dx.doi.org/10.1016/j.proenv.2010.10.173
Lowe-McConnel RH. 1987. Ecological Studies in
Tropical Fish Communities. Cambridge University
Press. London. .
Maguran AE. 2004. Measuring biological
diversity. Blackwell Publishing. Oxford.
Mihaljević M, Špoljarić D, Stević F, Cvijanović
V, Kutuzovi´c BH. 2010. The influence of extreme
floods from the River Danube in 2006 on
phytoplankton communities in a floodplain lake: Shift
to a clear state. Limnogica 40, 260-268.
http://dx.doi.org/10.1016/j.limno.2009.09.001
Mihaljević M, Špoljarić D, Stević F, Pfeiffer
TŽ. 2013. Assessment of flood-induced changes of
phytoplankton along a river–floodplain system using
the morpho-functional approach. Environmental
Monitoring Assessment 185, 8601-8619.
http://dx.doi.org/10.1007/s10661-013-3198-z
Nabout JC, Noguera IS, Oliveira LG, Morais
RR. 2007. Phytoplankton diversity (alpha, beta, and
gamma) from the Araguaia River tropical floodplain
lakes (central Brazil). Hydrobiologia 557, 455-461.
http://dx.doi.org/10.1007/s10750-006-0393-8
Okogwu OI. 2010. Seasonal variations of species
composition and abundance of zooplankton in Ehoma
Lake, a floodplain lake in Nigeria. International
Journal of Tropical Biology. 58(1), 171-182.
Prescott GW. 1970. How to know the Freshwater
Algae. WM. C. Brown Comp. Pub, Dubuque, Iowa,
USA.
Peerapornpisal Y. 2005. Freshwater Algae in
northern Thailand. The biodiversity research and
training Program (BRT), Bangkok, Thailand.
R Development Core Team (RDCT). 2008. R: a
language and environment for statistical computing.
R Foundation for Statistical Computing, Viena,
Austria.
http://www.R-project.org
Schagerl M, Drozdowski I, Angeler DG, Hein
T, Preiner S. 2009. Water age - A major factor
controlling phytoplankton community structure in a
reconnected dynamic floodplain (Danube,
Regelsbrunn, Austria). Journal of Limnology 68,
274-287.
Semeniuk CA. 2011. A comprehensive classification
of inland wetlands of Western Australia using the
geomorphic-hydrologic approach. Journal of the
Royal Society of Western Australia 94, 449-464.
www.rswa.org.au/publications/Journal/94(3)/Semen
iukSemeniukpp.449-464.pdf
SERM. 2002. Simple estuary response model,
CSIRO, Australia. Accessed Jan. 14st. 2010.
www.per.marine.csiro.au/serm/indicators/secchi_de
pth.html.

77 Rahman and Herdinansyah
Int. J. Biosci. 2016
Srifa A, Philip EJ, Hendrickson J. 2016. How
many seasons are there in a sub-tropical lake? A
multivariate statistical approach to determine
seasonality and its application to phytoplankton
dynamics. Limnogica 60, 39-50.
http://dx.doi.org/10.1016/j.limno.2016.05.011
Tockner K, Stanford JA. 2002. Riverine flood
plains: present state and future trends.
Environmental Conservation 29, 308-330.
http://dx.doi.org/10.1017/S037689290200022X
Yu Q, Chen Y, Liu Z, Zhu D, Wang H. 2016.
Longitudinal variations of phytoplankton
compositions in lake-to-river systems. Limnologica.
In Press.
http://dx.doi.org/10.1016/j.limno.2016.02.007
Wehr JD, Sheath RG. 2003. Introduction to
Freshwater Algae. In Wehr, JD and Sheath G (ed.).
Freshwater Algae of North America, Ecology and
classification.Academic Press, San Diego, California,
USA.