Embed Size (px)
Citation preview

1
The dynamics of PdO-Pd phase transformation in the presence of water over Si-
doped Pd/CeO2 methane oxidation catalysts
Alessandra Tosoa, Sara Colussia*, Jordi Llorcab, Alessandro Trovarellia
a Polytechnic Department, University of Udine, via del Cotonificio 108, 33100 Udine (Italy) b Institute of Energy Technologies, Department of Chemical Engineering and Barcelona
Research Centre in Multiscale Science and Engineering
Universitat Politècnica de Catalunya, Eduard Maristany 10-14, 08019 Barcelona
Abstract
One of the main issues for the catalytic abatement of methane from natural gas fueled
vehicles over Pd-based materials is due to the large amount of water vapor in the exhausts, which
can severely deactivate the catalyst. In this work, we investigated the effect of water added during
methane oxidation on a series of silica doped Pd/ceria catalysts prepared by solution combustion
synthesis, using different characterization techniques. The results obtained by coupling Temperature
Programmed Oxidation (TPO) experiments and High Resolution Transmission Electron
Microscopy (HRTEM) indicate that the mechanism of PdO-Pd-PdO phase transformation over Si-
doped catalysts is different in dry and wet conditions. The presence of water not only shifts the
onset of PdO decomposition to higher temperature, but also PdO-Pd transition is found to proceed
via the formation of multi-domain PdO/Pd particles. This effect is tentatively attributed to the
suppression of oxygen exchange induced by the presence of stable hydroxyl groups on silica.
Keywords
CH4 oxidation, ceria, silica, water poisoning, PdO decomposition
*corresponding author [email protected]
1. Introduction
Methane emissions coming from natural gas fuelled vehicles (NGVs) are of great concern
due to the high global warming potential of CH4 (~ 30 times higher than CO2). Catalytic oxidation
of methane over Pd-based catalysts is recognized as the best strategy to reduce methane emissions
at tailpipe, even if these materials still present some issues. In particular, PdO-Pd phase
transformation taking place at high temperature and water poisoning are regarded as the key
challenges to overcome in order to design efficient and durable catalysts to control methane
emissions from NGVs [1, 2].

2
Pd-based catalysts show a peculiar redox behavior during methane oxidation with a
pronounced deactivation in the high temperature region which is attributed to the decomposition of
PdO during heating and its re-formation during cooling taking place at different temperatures with a
large thermal hysteresis. The decomposition/re-oxidation process evolves with a complex redox
mechanism, in which a key role is played by the support [3-5]. In this respect, CeO2 has been found
to affect the dynamics of Pd re-oxidation by promoting PdO re-formation at higher temperature
with the consequent reduction of the hysteresis and the improvement of the catalytic activity during
the cooling part of the oxidation cycle [4, 6-9].
The other issue to be addressed is related to the presence of high concentrations of water
vapor (5–15.0%) in the exhausts of NGVs. This inhibits methane oxidation over Pd-based catalysts
by increasing the light-off temperature and by reducing their long-term stability at steady-state
conditions [2, 10, 11]. Different mechanisms have been proposed to explain the deactivation of Pd-
based catalysts in wet atmosphere [2, 10, 12-17]. Some authors indicated that water can react with
PdO particles leading to the formation of inactive Pd(OH)2 species at low temperature and during
long time operation [12, 15, 17]. Other groups attributed the deactivation induced by water to the
inhibition of oxygen exchange between the active sites and the support due to the adsorption of
hydroxyls on the metal oxide and/or at the metal/support interface [10, 14, 16]. In this respect, the
nature of the support has been demonstrated to influence strongly the extent of deactivation.
Catalysts based on reducible oxides, such as pure CeO2 and ceria containing supports, showed an
enhanced resistance to water poisoning: the use of oxides with high oxygen mobility reduces the
build-up of the hydroxyls on the catalytic surface maintaining high levels of methane conversion
[13, 14]. This mechanism is consistent with our recent results on solution combustion synthesized
Pd/ceria catalysts: Pd/CeO2 and Pd/Ce0.75Zr0.25O2 having high oxygen exchange capacity and a
strong Pd/ceria interaction showed an excellent hydrothermal stability for methane oxidation in wet
atmosphere [18]. All the above mentioned results suggest that ceria-based catalysts are a promising
starting point to try to improve the activity of palladium catalysts for methane oxidation as well as
their resistance to water deactivation.
Beside the oxygen exchange capability, some studies suggest that the resistance to water
deactivation might be tuned also by playing with the acidity of the support. Acid/base properties
were reported to affect the oxidation state of Pd and the possible formation of inactive Pd
hydroxides and, consequently, the activity and the stability of the catalysts in the presence of water
[2, 15, 19].
In this work we report how the addition of an acidic compound such as SiO2 to Pd/ceria
catalysts can influence their redox behaviour and catalytic performance in wet atmosphere, the

3
choice of silica being motivated also by its beneficial effect on the overall redox ability of ceria
[20]. We prepared a series of Pd/ceria-silica catalysts and investigated the dynamics of PdO-Pd-
PdO phase transformation in dry and wet atmosphere by means of Temperature Programmed
Oxidation (TPO) measurements. Particular attention was addressed to the study of catalyst
morphology during PdO decomposition by ex situ HRTEM and XRD analysis. The catalysts were
prepared by solution combustion synthesis, a procedure confirmed to be a promising method to
obtain Pd/ceria based materials with enhanced activity and stability towards methane oxidation
compared to standard incipient wetness impregnation [18].

4
2. Experimental
2.1. Catalysts preparation
Catalysts with a nominal loading of 1 wt.% Pd supported on Si-doped ceria were prepared by
solution combustion synthesis (SCS), following a well-established protocol [18, 21, 22]. Catalysts
with different SiO2 loading (2, 5, 13 and 20 wt.%) were synthesized starting from Pd(NO3)2 salt
(Johnson Matthey), dissolved in a little amount of distilled water. A suitable amount of cerium and
silicon has then been poured in the form of ceric ammonium nitrate (CAN, (NH4)2Ce(NO3)6)
(Treibacher Industrie AG) and silicon tetraacetate Si(OCOCH3)4 (Sigma Aldrich). Then, oxalyl
dihydrazide (C2H6N4O2) was added as reducing agent to the precursors mixture until a clear
aqueous solution was obtained. The solution was then transferred in a furnace heated up to 623 K,
temperature at which the ignition process starts with complete evaporation of water, leading to the
formation of a fine powder. Following the same procedure, 1 wt.% Pd/CeO2 was prepared as a
reference sample. Details of the synthesis procedure have been summarized in the Supplementary
Information. Noble metal loading was measured by ICP-MS analysis.
2.2. Catalysts characterization
Catalysts were characterized by a morphological and structural point of view by means of
BET surface area measurements, X-ray diffraction analysis (XRD) and high-resolution transmission
electron microscopy (HRTEM). The surface area was measured using N2 adsorption/desorption at
77 K in a Micromeritics Tristar porosimeter. Prior to the measurements, each sample was degassed
in vacuum for 2 hours at 423 K. X-ray spectra were collected in a Philips X’Pert diffractometer
equipped with an X’Celerator detector, using Ni-filtered Cu Kα radiation (λ = 1.542 Å) and
operating at 40 kVand 40 mA, with a step size of 0.02° and 40 counts per step. High Resolution
Transmission Electron Microscopy images were collected on a JEOL 2010F instrument equipped
with a field emission gun and at an accelerator voltage of 200 kV.
Temperature programmed oxidation (TPO) experiments were carried out in a quartz micro-
reactor (i.d = 6mm and l = 420 mm), loading 150 mg of catalyst over a quartz wool bed. Each
sample was subjected to three heating/cooling ramps in a mixture of 2 vol. % O2 in N2 (60 ml/min),
while increasing the temperature up to 1273 K at a ramp rate of 10 K/min and a subsequent cooling
down to ~ 623 K (10 K/min). To evaluate the effect of water vapor on the reversible PdO-Pd-PdO
transformation, TPO experiments were repeated in the presence of water by adding 10 vol.% H2O
(v) to the 2% O2/N2 mixture by using a Waters 515 HPLC pump, following the same experimental
procedure for TPO measurements without water vapor. Oxygen release and consumption was
monitored continuously with an ABB paramagnetic Magnos 106 oxygen analyzer. During TPO

5
experiments, samples were collected for ex situ HRTEM analysis. The heating ramp was stopped at
a fixed temperature, then the sample was cooled down in pure nitrogen avoiding any contact with
oxygen to maintain the reduced-oxidized state reached at the set point temperature.
2.3. Catalytic tests
Temperature programmed combustion experiments were carried out in a quartz micro-
reactor by loading 120 mg of catalyst (particle size 100 < ϕ < 200 μm) on a quartz wool bed. The
reactor was placed in a tubular furnace and the reaction gas mixture was fed at a flow rate of 180
ml/min with gas hourly space velocity (GHSV) of about 180000 h-1. For each sample two oxidation
cycles (heating/cooling) up to 1173 K at 10 K/min were performed in the absence of water (0.5%
CH4, 2% O2, in He as balance). To study the effect of water poisoning on the catalytic performance,
the activity tests were repeated in the presence of water, adding continuously 10 vol.% H2O (v) to
the reaction mixture by means of a Waters 515 HPLC pump through heated lines.
Time-on-stream tests (TOS) were carried out at 723 K to investigate the stability of the
catalysts during long-time exposure to dry (0.5% CH4, 2% O2 in He) or wet reaction atmosphere
(0.5% CH4, 2% O2, 10% H2O in He). After a first oxidation cycle (heating/cooling) up to 1173 K in
the same reaction conditions (dry or wet), the temperature was increased up to 723 K and held for
24 hours, monitoring methane conversion against time-on-stream. The reactants and products
concentration was monitored with a Varian CP4900 micro gaschromatograph, equipped with a
molecular sieve and a PoraPLOT Q column.
3. Results and discussion
Sample name, compositions and BET surface areas of the catalysts studied in this work are
summarized in Table 1.
Table 1: composition and BET surface areas of all catalysts
Catalyst Sample
name
Actual Pd
loading (wt. %)1
Nominal SiO2
content
BET surface
area (m2/g)
wt.% mol.%
1%Pd/CeO2 PdCe 0.93 - - 7.6
1%Pd/CeO2-2 %SiO2 PdCeSi 0.91 2 5.5 14.4
1%Pd/CeO2-5 %SiO2 PdCeSi5 0.95 5 13 12.7
1%Pd/CeO2-13 %SiO2 PdCeSi13 0.92 13 29 11.4
1%Pd/CeO2-20 %SiO2 PdCeSi20 0.94 20 41 7.8
1: determined by ICP-MS analysis.

6
During solution combustion synthesis, the temperature in the furnace can easily reach values
higher than 1273 K due to the highly exothermic nature of the reaction between the precursor salts
and the organic fuel, and for this reason all samples display quite low surface area even if the
addition of SiO2 slightly improves the surface area of PdCe. Figure 1 shows the XRD patterns of
the catalysts.
Figure 1. XRD patterns of a) PdCe, b) PdCeSi2, c) PdCeSi5, d) PdCeSi13 and e) PdCeSi20; ■
CeO2, ●Ce4.67Si3O13; x SiO2 tetragonal; ○ SiO2 hexagonal. In the inset details of the area between
20 and 40 degrees are reported.
Looking at the XRD patterns, no diffraction peaks belonging to Pd or PdO are detected due
to the high dispersion and/or to the low loading of the active phase. Focusing on the XRD patterns
of PdCeSi5, PdCeSi13 and PdCeSi20, it can be observed that ceria-silica support consists of a
mixture of cubic CeO2, tetragonal and/or hexagonal SiO2 and hexagonal cerium silicate phase. Ce-

7
Si phase shows the characteristics peaks at 2θ = 21.2°, 22.4°, 30.9° (see insets in Figure 1) which
are attributed to the formation of (Ce4.67Si3O13) on the basis of JCPDS database (JCPDS file 22-
0169). For PdCeSi2 only the features of cubic ceria are observable and no indication of Ce-Si phase
is detected likely due to the lower amount of SiO2. The presence of cerium silicate indicates that part
of cerium is stabilized in reduced 3+ form and its occurrence has been previously attributed to the
reaction of CeO2 with SiO2 at high temperature under reducing or inert atmosphere [23, 24]. In our
case it is reasonable to attribute the formation of Ce-Si phase to a reaction between ceria and silica
in presence of palladium due to the severe conditions realized during the combustion synthesis.
Even if the synthesis is carried out in a muffle with air circulation, a redox reaction takes place
between the salt precursors and the fuel, which might give rise locally to reducing conditions during
powder formation somehow catalysed by the presence of the metal [23]. In fact, preparing Ce-SiO2
alone by combustion synthesis does not lead to the formation of cerium-silicate as inferred from the
corresponding XRD pattern (see Figure S.1 of the Supplementary Information). The presence of
cerium silicate is observed also by HRTEM on the as prepared PdCeSi13 chosen as reference, as
shown in Figure 2a. Palladium is observed by HRTEM in the form of PdO particles well dispersed
over the support (Figure 2b).
Figure 2. (a) HRTEM images of fresh PdCeSi13. Inset: Fourier Transform image of each particle
with spots corresponding to CeO2[110] and Ce4.67Si3O13[011] crystallographic directions; (b) PdO
particle over ceria support.
To study the PdO-Pd-PdO transformation over Pd-based catalysts, which is known to strongly
affect the high temperature catalytic behaviour of these materials, TPO experiments are commonly
employed. In this work the TPO profiles have been first collected in the absence of water (dry
conditions), following the procedure described in the Experimental Section. Figure 3 shows the

8
oxygen uptake/release profile during the first and second TPO cycle, since after the second cycle
the redox behaviour is completely reproducible (See Supplementary, Figure S.2).
Figure 3. First (purple) and second (green) TPO cycle for Pd/CeO2-SiO2 catalysts in dry conditions
(2% O2/N2); solid line: heating; dotted line: cooling. Point A indicates the temperature at which the
sample has been collected for ex situ XRD and HRTEM analysis.
Focusing on the heating part of the first TPO cycle (cycle 1, solid line in purple) for the
reference PdCe sample, the decomposition of PdO takes place with two oxygen release peaks on
PdCe with maxima at 1020 K and 1070 K, with the majority of PdO decomposing in the second
step. During the cooling part (dotted line), an oxygen uptake peak (negative peak) is observed with
a minimum at 929 K which is associated to the re-oxidation of Pd to PdO. The process is
accompanied by a large thermal hysteresis of about 90 K. Looking at the TPO profiles collected for
Si-doped samples, PdCeSi5 and PdCeSi13 show a broad oxygen consumption peak in the range
620-780 K, attributable to the oxidation of metallic Pd particles, not detected by XRD analysis and
HRTEM due their small dimensions and/or fine dispersion. This oxygen consumption is much less
evident on PdCeSi20. Beside this peak, in general the addition of an amount of silica higher than 2

9
wt. % strongly modifies the redox profile of Pd/ceria catalysts. Between 950 and 1050 K a large
oxygen uptake peak appears, partially masking the oxygen release due to PdO decomposition. This
oxygen consumption (950-1050 K) is associated to the oxidation of Ce4.67Si3O13 phase into ceria
and amorphous silica, as inferred from HRTEM and XRD analysis performed on PdCeSi13
obtained after stopping the TPO heating ramp at 1053 K (point A in Figure 3), following the
procedure described in the experimental section.
Figure 4. XRD and HRTEM analysis of PdCeSi13 after stop@1053 K during the first TPO cycle.
Figure 4 shows that indeed on this sample no traces of cerium silicate phase could be
observed by HRTEM: only ceria crystallites are visible along with amorphous patches of SiO2. The
corresponding XRD pattern confirms that Ce4.67Si3O13 disappears, whereas the intensity of the
diffraction peaks of cubic CeO2 increases with respect to the fresh sample, corroborating HRTEM
findings. Consistently with this picture, the amount of oxygen consumed for the oxidation of Ce
silicate increases with SiO2 content in the support.
The results are in agreement with those obtained by Rocchini et al.: they observed the
formation of cerium silicate after a reducing treatment of CeO2-SiO2 mixed oxides, which
subsequently decomposed into small ceria crystallites and amorphous silica upon oxidation at 773-
973 K [20].

10
The second TPO cycle is not very much affected by the presence of silica in the support, and
the dynamics of PdO-Pd-PdO transformation is similar to that of the silica-free sample (PdCe). The
decomposition of PdO takes place in three distinct steps, with the typical redox profile of solution
combustion synthesized catalysts [18, 25]. This is different from what recorded during the first
cycle, possibly due to a different oxidation of PdO occurred during the synthesis in air and during
TPO measurements (2 % O2) [26]. The occurrence of separate PdO decomposition stages during the
second cycle was associated in the literature to different PdO species and/or to PdO with different
interaction with the support [27-30]. The peak at lower temperature can be associated with the
oxygen removal from smaller PdO particles or surface PdO, the second step is usually ascribed to
bulk PdO and the high temperature peak to PdO interacting with the support or to the
decomposition of a PdO core surrounded by a metallic Pd shell. During the second TPO cycle, the
incorporation of SiO2 does not influence the temperature threshold at which PdO-Pd transformation
starts, but it affects only the fraction of PdO decomposed in each step, as shown by the
deconvolution of oxygen release profile (Figure S.3).
PdO-Pd-PdO phase transformation was studied also in the presence of water by adding 10
vol.% of H2O to the 2%O2/N2 TPO mixture. Also in this case the first cycle is different from the
following ones, and shows the oxygen consumption due to the decomposition of cerium silicate (see
Figure S.4). For this reason, we report again cycle 2 as the standard one. Figure 5 shows the redox
profile recorded during the second TPO cycle in wet atmosphere (cycle 2 wet). The second cycle in
dry conditions (same as Figure 3) is added for a direct comparison.

11
Fig. 5. Comparison of the second TPO cycle in wet (2% O2/N2, 10% H2O, light blue) and dry (2%
O2/N2, black) conditions; solid line: heating, dotted line: cooling. Arrows indicate the collection
points for HRTEM analysis during heating.

12
Table 2. Temperature maximum of the third oxygen release peak and minimum of the oxygen
uptake peak during cooling in dry and wet conditions (second TPO cycle).
heating cooling
Sample Tmax of third O2 release
peak
Tmin of O2 uptake
peak
dry wet Ta dry wet
PdCe 1140 1140 0 929 929
PdCeSi2 1144 1189 45 926 909
PdCeSi5 1151 1227 76 926 914
PdCeSi13 1152 1226 74 917 913
PdCeSi20 1150 1220 70 924 915 a calculated as temperature difference between T max of the third oxygen release peak in dry and wet conditions
When water is added to the reaction mixture, the dynamics of PdO-Pd-PdO phase
transformation over PdCe resembles that observed in dry conditions [18]. A peculiar situation is
observed instead on SiO2-doped samples: in wet atmosphere and in the presence of silica PdO
decomposition still takes place with three oxygen release peaks, but the shape as well the position
of the oxygen desorption steps markedly change. The thermal stability of the first PdO species
(surface PdO species or small PdO particles) seems to be not affected by water, while the second
decomposition peak becomes broader and less defined. The major effect, however, is observed on
the high temperature peak: the oxygen release of this step is shifted towards higher temperature in
wet atmosphere (see also Table 2), indicating that the addition of silica increases the thermal
stability of this PdO species compared to dry atmosphere. Recently, Kinnunen et al. observed a
similar phenomenon on Pd-based catalysts after sulphur poisoning in the presence of water,
resulting in an increase of the decomposition temperature of PdO on hydrothermally and sulphur
aged samples [31]. From Table 2 it can be observed that an opposite effect of the presence of water
is detected during cooling: the minimum of the oxygen uptake during cycle 2 in wet atmosphere is
shifted to slightly lower temperature with respect to dry conditions. This behaviour might be linked
to the inhibition of Pd re-oxidation due to the accumulation of hydroxyls on the support [14].
In order to get a deeper understanding of the mechanism of PdO-Pd transition in wet
atmosphere and its effect on the catalytic activity, PdCeSi13 was selected as a reference sample for
a more detailed study of the redox behaviour. Samples of PdCeSi13 were collected during the
heating ramp of the second TPO cycle. During cycle 2 dry, the heating ramp was stopped before the
third decomposition peak at 1123 K (point 1 in Figure 5) and at the end of PdO decomposition
process at 1180 K (point 1′ in Figure 5), switching from 2% O2/N2 to pure nitrogen and quenching

13
the sample to ~ 473 K. Following the same experimental procedure, cycle 2 wet was stopped at
1153 K (point 2 in Figure 5) and the collected samples were characterized by ex situ HRTEM
analysis (Figures 6 and 7 for stop@1123 K and stop@1153 K, respectively). This procedure was
employed to preserve the structure of the catalyst, as previously reported [8].
Figure 6. HRTEM images of PdCeSi13 stop@1123 K in dry conditions
Figure 7. HRTEM image of PdCeSi13 stop@1153 K in wet conditions
The HRTEM images of PdCeSi13 collected at 1123 K during TPO in dry conditions, i.e. before the
third decomposition step (Figure 6), show clearly the evolution of the PdO decomposition process:
metallic Pd particles showing the (111) crystallographic planes (epitaxy with the (111) planes of the
ceria crystallite support) are detected all over the sample along with residual PdO. Interestingly,
HRTEM image of the sample collected at 1153 K in wet conditions (again before the third PdO
decomposition peak), reveals the coexistence of metallic Pd and PdO within the same nanoparticle

14
(Figure 7). This nanoparticle, spotted at the junction of two ceria crystallites, contains both Pd and
PdO, is highly disordered and shows two domains. One domain corresponds to Pd metal oriented
along the [110] direction and shows the (111) and (200) crystallographic planes of Pd at 2.25 and
1.95 Å, respectively; the other domain shows lattice fringes at 2.65 Å, which corresponds to the
(101) crystallographic planes of PdO. The amorphous SiO2, generated by the decomposition of
Ce4.94Si3O13 during the first TPO cycle (see Figure 3), cannot be properly analyzed by HRTEM.
The co-existence of Pd and PdO within the same particle has been previously reported
during the reverse Pd-PdO transformation. In a previous work from our group we observed that
over Pd/Al2O3 the process of Pd re-oxidation involved the formation of multi-domain Pd/PdO
particles [8]. Similar results have been obtained recently by Datye et al., who found the occurrence
of metastable Pd-PdO structure during Pd re-oxidation [32]. In both cases the origin of Pd-PdO co-
existence was attributed to the kinetic limitation of PdO re-formation at high temperature. To our
best knowledge, this is the first time that the formation of bimetallic Pd-PdO nanoparticles is
observed instead during PdO decomposition, as if the simultaneous presence of silica on the support
and water in the reaction atmosphere could somehow hinder the PdO-Pd transformation. The
adsorption of water on the support might affect the thermal stability of PdO species interacting with
the support itself, changing the mechanism of PdO decomposition similarly to what reported by
Kinnunen et al. on S-poisoned and hydrothermally aged Pd-based catalysts [31]. They explained
this behaviour with a stabilization effect of structural oxygen by sulphur, making it less mobile. In
the case of silica, some hydroxyl groups which are known to inhibit the oxygen exchange between
Pd and the support [14] have been detected on SiO2 up to 1173 K [33], a temperature that well
corresponds with the onset of the third oxygen release peak on PdCeSi samples in presence of
water. The shift in the PdO decomposition could be also influenced by the acid-base properties of
the support. We observed, in fact, a similar redox behavior when Pd/ceria is doped with Al2O3
(Figure S.5) which is another more acidic oxide like silica compared to Ce-based oxides [34]. In
this respect, it should be observed that also S-based oxides are considered acidic and this could shed
some light on the results obtained by Kinnunen et al. Some authors suggest that acid/base properties
of the support can be an effective factor to control the oxidation state of supported noble metal and,
consequently, the activity and stability of the catalysts in dry and wet conditions for the oxidation of
hydrocarbons [15, 34, 35]. A further possibility that should be taken into account to explain the
effect of silica and alumina on PdO decomposition in presence of water is the formation of Pd-Si-O
(or Pd-Al-O) compounds at high temperature, as observed by Rodriguez and coworkers [36]. They
reported the formation of metastable intermetallic compounds after heating Pd deposited on alumina
or silica films in oxygen at temperatures higher than 800°C, which then decomposed upon cooling

15
to room temperature. These compounds were not detected when Pd was deposited on ZrO2. Despite
the different nature of the samples investigated in this work, and the different reaction atmosphere
(pure oxygen, no water present), these results give another interesting hint on the possible effect of
silica on PdO decomposition in presence of water.
To check the reversibility of the process, after the second TPO cycle in wet conditions
(cycle 2 wet) a third thermal cycle was performed without water (2% O2/N2, cycle 3 dry). The
results are reported in Figure 8, where cycle 2 wet is reported for an immediate comparison.
Figure 8. Comparison of the second TPO profile in wet conditions (cycle 2 wet, light blue) (2%
O2/N2, 10% H2O) and after water removal (cycle 3 dry, red) (2% O2/N2).
After removing water from the feed (in red), the position of the third oxygen release peak shifts
back to lower temperature, likely due to the slow desorption of hydroxyls groups from the catalytic
surface. This indicates that the phenomenon is reversible when water is switched off, and in fact
after 2 cycles without water the TPO profiles of PdCeSi samples become again equal to those
recorded in dry conditions (Figure S.6, Supplementary Information).
The results of catalytic performance for methane oxidation in dry and wet atmosphere are
shown in Figure 9, but no evident correlation with what observed during TPO could be assessed.

16
For each sample two heating/cooling ramps were performed in the presence of water (cycle 1 wet
and cycle 2 wet) and compared with the second cycle carried out in dry conditions (cycle 2 dry),
chosen as the most representative one.
Figure 9. Light-off curves of PdCe and Si-doped catalysts in dry and wet conditions. Solid line:
heating, dotted line: cooling
All samples show the typical light-off profile of Pd-based catalysts, where a pronounced
deactivation is clearly observed during the cooling part of the cycle due to the reversible PdO-Pd
transformation. The addition of water into the reaction feed causes an increase in the onset of
methane oxidation, accordingly to the inhibition effect of water on the reaction. For PdCe, the two
oxidation cycles in wet conditions are almost identical and the T10 (temperature at which 10% CH4
conversion is achieved) increases of 74 K with respect to that recorded during cycle 2 dry. For Si-
doped samples, the catalytic performance slightly improves after the first heating/cooling ramp in
wet atmosphere, but the shift of T10 is of 75-80 K for PdCeSi2, PdCeSi5 and PdCeSi20, whereas for
PdCeS13 the effect of water poisoning is less severe (66 K). Focusing on the cooling part of cycle 1
wet, the extent of the loss in activity is less pronounced with respect to cycle 2 dry, especially for
PdCeSi5, PdCeSi13 and PdCeSi20 (the minimum in methane conversion being 50-55% against 38-
17
40% in dry conditions). This might be related to the different PdO-Pd dynamics observed in the
presence of water (Figure 5), even if the connection is not straightforward. It should be kept in mind
though that catalytic activity measurements have been carried out only up to 1173 K, differently
from TPO (up to 1273 K) thus changing the overall conditions of the samples.
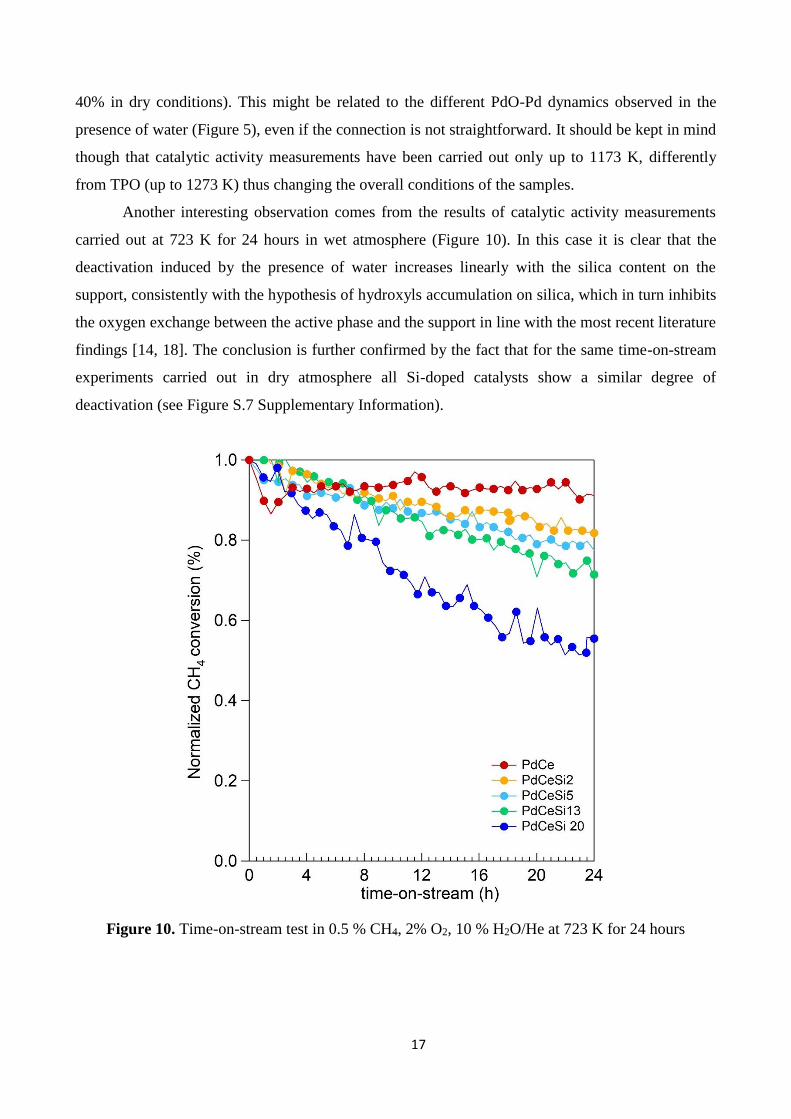
Another interesting observation comes from the results of catalytic activity measurements
carried out at 723 K for 24 hours in wet atmosphere (Figure 10). In this case it is clear that the
deactivation induced by the presence of water increases linearly with the silica content on the
support, consistently with the hypothesis of hydroxyls accumulation on silica, which in turn inhibits
the oxygen exchange between the active phase and the support in line with the most recent literature
findings [14, 18]. The conclusion is further confirmed by the fact that for the same time-on-stream
experiments carried out in dry atmosphere all Si-doped catalysts show a similar degree of
deactivation (see Figure S.7 Supplementary Information).
Figure 10. Time-on-stream test in 0.5 % CH4, 2% O2, 10 % H2O/He at 723 K for 24 hours

18
Conclusions
In this work, the catalytic behaviour and the redox properties of Pd/CeO2-SiO2 catalysts
were investigated in the presence of water, using different experimental techniques. The doping of
Pd/ceria with SiO2 induces important structural changes: on the as-prepared catalysts with a SiO2
content higher than 2 wt.%, the support consists of a mixture of CeO2, SiO2 and cerium silicate
(Ce4.67Si3O13) phase. An oxidation treatment between 950-1050 K causes the decomposition of Ce-
Si phase into ceria and amorphous silica. Over Si-doped catalysts and in the presence of 10 vol%
water in the feed, the decomposition of more stable PdO species, i.e PdO interacting with the
support, occurs at 50-70 K higher than in the absence of water. Ex situ HRTEM analysis of Pd/Ce-
Si samples collected during TPO experiments evidences that PdO-Pd decomposition in wet
atmosphere involves the formation of multi-domain Pd/PdO particles where Pd and PdO phases co-
exist, a situation not detected in dry conditions. This peculiar behaviour is not unique for Pd/CeO2-
SiO2, but it can be observed also over similar alumina-doped Pd/ceria samples and it has been
attributed to the accumulation of hydroxyl groups on silica (or alumina) that can hinder the oxygen
exchange between the support and the active phase. Moreover, the introduction of a more acidic
metal oxide might contribute to change the thermal stability of PdO and, thus, the evolution of PdO-
Pd transition in wet atmosphere. These results further enlighten the key role played by the support
on the complex redox mechanism of Pd-PdO-Pd transformation and provide a valid tool to design
more resistant Pd-based catalysts for methane abatement in presence of water.
Acknowledgements
Funding by Ford Motor Company under 2014-2195R University Research Program Award
“Three-way catalyst materials for compressed natural gas vehicles” is kindly acknowledged. JL is
Serra Húnter Fellow and is grateful to ICREA Academia program and MINECO/FEDER
ENE2015-63969-R and GC 2017 SGR 128.

19
References
[1] R.J. Farrauto, Science 337 (2012) 659-660.
[2] R. Gholami, M. Alyani, K. Smith, Catalysts 5 (2015) 561.
[3] R.J. Farrauto, J.K. Lampert, M.C. Hobson, E.M. Waterman, Appl. Catal. B-Environ. 6
(1995) 263-270.
[4] G. Groppi, C. Cristiani, L. Lietti, C. Ramella, M. Valentini, P. Forzatti, Catal. Today 50
(1999) 399-412.
[5] S. Colussi, A. Trovarelli, C. Cristiani, L. Lietti, G. Groppi, Catal. Today 180 (2012) 124-
130.
[6] R.J. Farrauto, M.C. Hobson, T. Kennelly, E.M. Waterman, Appl. Catal. A-Gen. 81 (1992)
227-237.
[7] P.O. Thevenin, A. Alcalde, L.J. Pettersson, S.G. Jaras, J.L.G. Fierro, J. Catal. 215 (2003) 78-
86.
[8] S. Colussi, A. Trovarelli, G. Groppi, J. Llorca, Catal. Commun. 8 (2007) 1263-1266.
[9] L.M.T. Simplicio, S.T. Brandao, D. Domingos, F. Bozon-Verduraz, E.A. Sales, Appl. Catal.
A-Gen. 360 (2009) 2-7.
[10] M. Alyani, K.J. Smith, Ind. Eng. Chem. Res. 55 (2016) 8309-8318.
[11] W.X. Huang, E.D. Goodman, P. Losch, M. Cargnello, Ind. Eng. Chem. Res. 57 (2018)
10261-10268.
[12] R. Burch, F.J. Urbano, P.K. Loader, Appl. Catal. A-Gen. 123 (1995) 173-184.
[13] D. Ciuparu, E. Perkins, L. Pfefferle, Appl. Catal. A-Gen. 263 (2004) 145-153.
[14] W.R. Schwartz, D. Ciuparu, L.D. Pfefferle, J. Phys. Chem. C 116 (2012) 8587-8593.
[15] Y. Liu, S. Wang, D.N. Gao, T.J. Sun, C.X. Zhang, S.D. Wang, Fuel Process. Technol. 111
(2013) 55-61.
[16] M. Monai, T. Montini, C. Chen, E. Fonda, R.J. Gorte, P. Fornasiero, Chemcatchem 7 (2015)
2038-2046.
[17] A. Setiawan, J. Friggieri, E.M. Kennedy, B.Z. Dlugogorski, M. Stockenhuber, Catal. Sci.
Technol. 4 (2014) 1793-1802.
[18] A. Toso, S. Colussi, S. Padigapaty, C. de Leitenburg, A. Trovarelli, Appl. Catal. B-Environ.
230 (2018) 237-245.
[19] B. Zhang, X.Y. Wang, O. M'Ramadj, D. Li, H. Zhang, G.Z. Lu, J. Nat. Gas Chem. 17
(2008) 87-92.
[20] E. Rocchini, A. Trovarelli, J. Llorca, G.W. Graham, W.H. Weber, M. Maciejewski, A.
Baiker, J. Catal. 194 (2000) 461-478.
[21] S. Colussi, A. Gayen, M.F. Camellone, M. Boaro, J. Llorca, S. Fabris, A. Trovarelli, Angew.
Chem. Int. Edit. 48 (2009) 8481-8484.
[22] S. Colussi, A. Gayen, J. Llorca, C. de Leitenburg, G. Dolcetti, A. Trovarelli, Ind. Eng.
Chem. Res. 51 (2012) 7510-7517.
[23] L. Kepinski, M. Wolcyrz, J. Solid State Chem. 131 (1997) 121-130.
[24] E. Rocchini, M. Vicario, J. Llorca, C. de Leitenburg, G. Dolcetti, A. Trovarelli, J. Catal. 211
(2002) 407-421.
[25] S. Colussi, A. Gayen, M. Boaro, J. Llorca, A. Trovarelli, Chemcatchem 7 (2015) 2222-2229.
[26] H. Gabasch, W. Unterberger, K. Hayek, B. Klotzer, G. Kresse, C. Klein, M. Schmid, P.
Varga, Surface Science 600 (2006) 205-218.
[27] J.G. McCarty, Catal. Today 26 (1995) 283-293.
[28] G. Groppi, C. Cristiani, L. Lietti, P. Forzatti, in: A. Corma, F.V. Melo, S. Mendioroz, J.L.G.
Fierro (Eds.), Studies Surf. Sci. Catal., Elsevier, 2000, pp. 3801-3806.
[29] S. Colussi, A. Trovarelli, E. Vesselli, A. Baraldi, G. Comelli, G. Groppi, J. Llorca, Appl.
Catal. A-Gen. 390 (2010) 1-10.

20
[30] X.Y. Chen, J.W. Schwank, G.B. Fisher, Y.S. Cheng, M. Jagner, R.W. McCabe, M.B. Katz,
G.W. Graham, X.Q. Pan, Appl. Catal. A-Gen. 475 (2014) 420-426.
[31] N.M. Kinnunen, J.T. Hirvi, K. Kallinen, T. Maunula, M. Keenan, M. Suvanto, Appl. Catal.
B-Environ. 207 (2017) 114-119.
[32] H.F. Xiong, K. Lester, T. Ressler, R. Schlogl, L.F. Allard, A. Datye, Catal. Lett. 147 (2017)
1095-1103.
[33] O. Sneh, S.M. George, J. Phys. Chem. 99 (1995) 4639-4647.
[34] H. Yoshida, T. Nakajima, Y. Yazawa, T. Hattori, Appl. Catal. B-Environ. 71 (2007) 70-79.
[35] Y. Yazawa, N. Takagi, H. Yoshida, S. Komai, A. Satsuma, T. Tanaka, S. Yoshida, T.
Hattori, Appl. Catal. A-Gen. 233 (2002) 103-112.
[36] N.M. Rodriguez, S.G. Oh, R.A. DallaBetta, R.T.K. Baker, J. Catal. 157 (1995) 676-686.