Embed Size (px)
Citation preview

The Dynamics of HIV Infectionof CD4+ T CellsAlan S. PerelsonDenise E. KirschnerGeorge W. NelsonRob J. De Boer
SFI WORKING PAPER: 1992-01-005
SFI Working Papers contain accounts of scientific work of the author(s) and do not necessarily represent theviews of the Santa Fe Institute. We accept papers intended for publication in peer-reviewed journals or proceedings volumes, but not papers that have already appeared in print. Except for papers by our externalfaculty, papers must be based on work done at SFI, inspired by an invited visit to or collaboration at SFI, orfunded by an SFI grant.©NOTICE: This working paper is included by permission of the contributing author(s) as a means to ensuretimely distribution of the scholarly and technical work on a non-commercial basis. Copyright and all rightstherein are maintained by the author(s). It is understood that all persons copying this information willadhere to the terms and constraints invoked by each author's copyright. These works may be reposted onlywith the explicit permission of the copyright holder.www.santafe.edu
SANTA FE INSTITUTE
The Dynamics of HIV Infection of CD4+ T cells
ALAN S. PERELSONt
DENISE E. KIRSCHNER:j: GEORGE W. NELSONt & ROB J. DE BOERF
t Theoretical Division, Los Alamos National Laboratory, Mail Stop K710J Los Alamos, NM87545, USA, :j:Department of Mathematics, Vanderbilt University, Nashville, TN 37235
(Received on , Accepted in revised form on )
Abstract
Infection by HIV has many puzzling quantitative features. There is an averagelag of nearly 10 years between infection and the onset of AIDS in adults. Eventhough T cells are normally rapidly replenished in the body, the infection of ratherfew T cells can cause massive CD4+ T cell depletion. (Only 1 in 104 or 105 CD4+T cells is actively infected and only 1 in 100 to 1000 is latently infected). Here weexamine a previously developed model (Perelson, 1989) for the interaction of HIVwith CD4+ T cells. The model considers four populations: uninfected T cells,latently infected T cell, actively infected T cells, and free virus. Using this simplemodel we show that many of the puzzling quantitative features of HIV infectioncan simply be explained. We also rigorously examine many of the model's featuresthat were previously explored through simulation. We also consider new aspects,such as the effects of AZT on viral growth and T cell population dynamics.
The model exhibits two steady states, an uninfected state in which no virus ispresent and an endemically infected state, in which virus and infected T cellsare present. We show that if N, the number of infectious virions produced peractively infected T cell, is less than a critical value, Ncrit, then the uninfected stateis the only steady state in the non-negative orthant and that this state is stable.For N > N crit , the uninfected state is unstable, and the endemically infectedstate can be either stable or unstable depending upon parameter values. If theendemically infected state is unstable, we find that it is surrounded by a stablelimit cycle. Using numerical bifurcation techniques we map out the parameterregimes of these various behaviors. Oscillatory behavior seems to lie outside theregion of biologically realistic parameter values. ViThen the endemically infectedstate is stable, it is characterized by a reduced number of T cells when comparedwith the uninfected state. Thus T cell depletion occurs through the establishment
1 Present address: Bioinformatics Group, University of Utrecht, Padualaan 8,5384 CH Utrecht, The Netherlands.
2

of a new steady state. The dynamics of the establishment of this new steady stateis examined both numerically and via the quasi-steady state approximation. Wedevelop approximations for the dynamics at early times, in which the free virusrapidly binds to T cells, during an intermediate time scale in which the virusgrows exponentially, and then a third time scale on which viral growth slows andthe endemically infected steady state is approached. We compute the level of Tcells in the endemically infected state, and show how that level varies with theparameters in the model. The model predicts that different viral strains can causediffering amounts of T cell depletion and generate depletion at different rates.
1. Introduction
One of the consequences of infection by the human immunodeficiency virus (HIV) isthe selective depletion of CD4+ T cells, the cells commonly known as "helper T cells" orT4 cells. Because of the central role of CD4+ T cells in immune regulation their depletioncan have widespread deleterious effects on the functioning of the immune system as awhole. In fact, the decline in CD4+ T cell number in peripheral blood and the peripheralblood ratio of CD4+ / CD8+ T cells are both used in a clinical setting as indicators of thedisease stage (Redfield et al., 1986; Goedert et al., 1987; Taylor et al., 1989; Phillips etal., 1989). In this paper we will present and analyze a simple model for the populationdynamics of CD4+ T cells in the presence and absence of HIV. We feel it is importantthat any model that purports to quantitatively characterize the effects of HIV infection beable to make realistic predictions about the status of the immune system in the absenceof HIV infection. In order to focus the model on the effects of HIV on T cell populationdynamics, we do not deal with the immune response to HIV. Here we are interested in thequestion of whether HIV infection by itself can account for T cell depletion in seropositivepatients.
Over the past decade, a number of models have been developed to describe the immunesystem and its interaction with HIV. Both stochastic and deterministic models have beendeveloped. Stochastic models, such as the ones presented by Merrill (1988, 1989), can beused to account for the early events in the disease when there are few infected cells anda small number of viruses, or in situations where the variability among individuals is ofinterest. The model of Nowak (Nowak et al., 1990, Nowak and May, 1991) looks at theeffects of variability among viral strains. Deterministic models, such as the ones developedby Cooper (1986), Intrator et al. (1988), McLean (1988), McLean and Kirkwood (1990),Reibnegger et al. (1987), Dolezal and Hraba (1988), Hraba and Dolezal (1989), Hraba etal. (1990), Anderson and May (1989), and Perelson (1989), examine the changes in meancell numbers, and are more applicable to later stages of the process in which populationsizes are large. These models typically consider the dynamics of the CD4+ helper and
3

virus populations. In some of these models other immune system populations, such as Bcells or CD8+ cells, have been included.
The model explored here is aimed at explaining a number of quantitative featuresof HIV infection that are unusual and in the absence of a model seem perplexing. Aswe shall show, our basic model can account for the long latency between infection andthe onset of clinical AIDS, as well as the low concentration of free virus observed in theblood. The model exhibits substantial CD4+ T cell depletion but in its current form isunable to obtain the very low CD4+ cell counts seen during the late stages of the disease,particularly if the frequency of latently infected CD4+ T cells is kept at realisticly lowlevels and the long latency period is maintained. The depletion of CD4+ cells has beenparticularly puzzling, since only 1 in 104 to 105 cells in the peripheral blood of infectedHIV individuals express viral proteins or mRNA (Fauci, 1988; Harper et al., 1986), andonly 1 in 102 to 103 T cells harbor viral DNA (Schnittman et al., 1989; Schnittman et al.,1990). In view of the natural turnover of CD4+ T cells in the body, it would seem as if theT cell pool should be able to compensate for such a low rate of T cell infection (d. Fauci,1988). Our model partially supports this observation, in that extreme reduction of CD4+cells only occurs if the population of latently infected cells is larger than that observed.Realistic population levels of latently and actively infected cells, as well as long latency andlow blood viremia, are obtained in a version of the model in which T cell precursors canbe infected, thus reducing the supply of new T cells to the periphery. Thus the naturalturnover and replenishment of T cells may be important processes in determining theCD4+ T cell count in AIDS patients.
The model developed here is not meant to be a comprehensive model of HIV's interaction with the immune system. It is aimed at examining the kinetics and degree ofT cell depletion that can be caused by viral cytopathicity and thus does not deal withthe immune response to HIV. However there have been a number of observations of viralstrains which appear not to induce an effective immune response; these strains have beencalled escape mutants. Such strains are observed to be of the slow/low type (Albert et al.,1990); that is, they replicate slowly and have low expression in CD4+ T cells. Generally,virus isolated during the latent period is of the slow/low type, while rapid/high strains arecharacteristically isolated during the period of active AIDS. Rapid/high strains have alsobeen isolated during a period of initial HIV viremia, which often follows infection (Tindalland Cooper, 1991). It has been suggested that the anti-HIV immune response which seemsto occur during or following the initial viremia is able to suppress rapid/high strains, whilethe slow/low strains are able to avoid the immune response.
In Nelson and Perelson (1992) we present a model that shows how some viral variantsmay be able to escape generating an effective immune response. In that model, consistentwith observations, the escape mutants are of slow/low type. The model presented inthis paper deals with viral strains which, though not identical in their activity to the
4

escape mutants considered by Nelson and Perelson (1992), still have the property of slowreplication in CD4+ T cells. Thus, our model which ignores an immune response, mayin fact be relevant to the population dynamics of slow/low escape mutants. We also useour model to show that if slow/low strains are replaced by rapid/high strains in end stagedisease then significant T cell depletion, approaching that seen in patients, can be obtainedin the model.
2. Model
In order to generate a realistic model of T cell infection by HIV, we first need toconsider the population dynamics of T cells in the absence of HIV. T cells, like otherlymphocytes, are produced in the bone marrow. Immature cells migrate to the thymuswhere they undergo further differentiation and maturation into immunocompetent T cells.The thymus is subject to involution, a decrease in weight and volume associated withmicroscopic evidence of degeneration. In humans, the thymus reaches it greatest weight atabout the time of puberty, and then begins to gradually involute (d. Weiss, 1972). Removalof the thymus from an adult usually has minimal effects, although the adult thymus isfunctional and some of its lymphocytes serve as T cell precursors and immunocompetentT cells (Eisen, 1980). Within healthy individuals the number of T cells in the blood ismaintained relatively constant, with CD4+ T cells comprising about 1000 cells/mm3 (Laneand Fauci, 1987). The model discussed below focuses on CD4+ T cells. Thus we shall usethe term T cell to mean CD4+ T cell throughout the remainder of this paper.
2.1. T CELL GROWTH IN AN UNINFECTED INDIVIDUAL.
As a model of T cell dynamics we propose the following:
dT T- = s +rT(l - --) - /-lTT , (1)dt Tmax
where T is the number of CD4+ T cells, say as measured in the blood. The three termsin the equation represent the rates of production and destruction of T cells; s being therate of supply of immunocompetent T cells from precursors in the thymus. T cells, like allcells in the body have a finite lifetime. The lifetime may vary among T cells, with memoryT cells thought to have a longer lifespan than virgin T cells. Here we do not distinguishbetween these classes of T cells and thus /-IT in Eq. (1) represents the average per capitadeath rate of T cells. Lastly, T cells, when stimulated by antigen or mitogen, can divideand increase in population. We assume that the growth of T cells is governed by a logisticequation, where r is the average specific T cell growth rate obtained in the absence ofpopulation limitation. As will be discussed in more detail in the next section, r dependson the average degree of antigen or idiotypic network stimulation of T cell proliferation.However, even when highly stimulated the total number of T cells in the body remains
5

bounded. The term in parentheses shuts off T cell growth as the population level Tmax isapproached.
Let To denote the normal steady state T cell population size found by solving
TJ(T) = s + rT(l - -T ) - JLTT = 0 , (2)
maxI.e.
To = Tmax [r - JLT + I(r _ fLT)2 + 4sr ] (3)2r \I Tmax
The other root of Eq. (2) is negative and thus Eq. (3) represents the only possible steadystate of the system.
There are certain parameter restrictions that we shall impose to ensure that this modelgives realistic population dynamics. Even after thymic involution, the thymus remainsfunctional (Eisen, 1980). Thus we shall assume s > O. The steady state population size Toshould be less than Tmax , so that the T cell population will expand when stimulated, as sayoccurs during infection. Further, if the population ever reaches Tmax it should decrease.Thus, we choose
fLTTmax > s , (4)so that the death rate at Tmax is larger than the supply rate. If this were not the case,then the population could increase past Tmax . Further, Eqs. (3) and (4) and the conditions > 0 imply that To < Tmax as we desire. To see this note, J(O) = s > 0 and J(Tmax ) =s - fLTTmax < O. Thus, all solutions to Eq. (1) that begin with an initial number of Tcells, T(O), in the interval 1= [0, Tmax] will remain bounded and stay in the open interval0< T(t) < Tmax for all t. Because To is the only fixed point in I, To is stable and globallyattracting in I.
Besides controlling the T cell population level, Eq. (1) has the nice property that thedeath of T cells can be balanced either by the supply of new T cells, the division of T cellsin the periphery, or both. Consequently, the net T cell proliferation rate p = r - fLT neednot be positive. In the absence of environmental antigen and with little idiotypic networkstimulation one might imagine that r is small or even zero and p < 0 but that the totalT cell population is maintained at a positive value through the creation of new T cells.One might also expect that before thymic involution the source s is more important thandivision in the periphery so that small or negative values of p could still give positive steadystates. After thymic involution, which causes s to decrease, or following adult thymectomy,which causes s to equal zero, one might assume that humoral or growth factor regulatedcontrol mechanisms insure that p > 0 so as to give a positive steady state T cell populationsize. Thus, the parameter s and possibly the parameter r may vary with age and antigenicexperience. These parameter variations could be important in explaining the observed
6
(5b)
(5c)
(5a)
differences in the dynamics of T cell depletion due to HIV infection in people of differentages (see Perelson, 1989).
2.2. HIV INFECTION
In order to model the influence of HIV on T cell growth we need to take into consideration a number of features of the life history of the virus. HIV is an RNA virus. However,when it infects a cell the enzyme reverse transciptase, which it carries, makes a DNA copyof its RNA genome. This DNA copy is then integrated into the DNA of the infected cell.The viral DNA, called the "provirus," is then duplicated with the cell's DNA every timethe cell divides. Thus a cell, once infected, remains infected for life. Within a T cell theprovirus can remain latent, giving no sign of its presence for months or years (Ho et al.,1987). Stimulation of the T cell by antigen or a mitogen can lead to the production of newvirus particles that bud from the surface of the infected cell. The budding can take placeslowly, sparing the host cell, or it can take place very rapidly, possibly leading to the lysisof the T cell (cf. Leonard et al., 1988).
In order to model these events, we shall consider T cells that are uninfected, T cellsthat are latently infected, i.e., that contain the virus but are not producing it, and Tcells that are actively infected, i.e., that are producing virus. We shall also consider thepopulation of free infectious viral particles. To describe the dynamics of these populationswe shall formulate an ordinary differential equation model. Thus spatial dependence isignored and the various interactions are imagined to occur in well-mixed compartmentsuch as the bloodstream. To correctly account for interactions in the tissues, more complex models involving multiple compartments and/or partial differential equations may beneeded. Also, because the model is deterministic, it does not correctly account for thevery early stages of the infection nor can it totally account for the variability seen amonginfected individuals. Some variability can be ascribed to different parameter values beingcharacteristic of different viral strains or different patients.
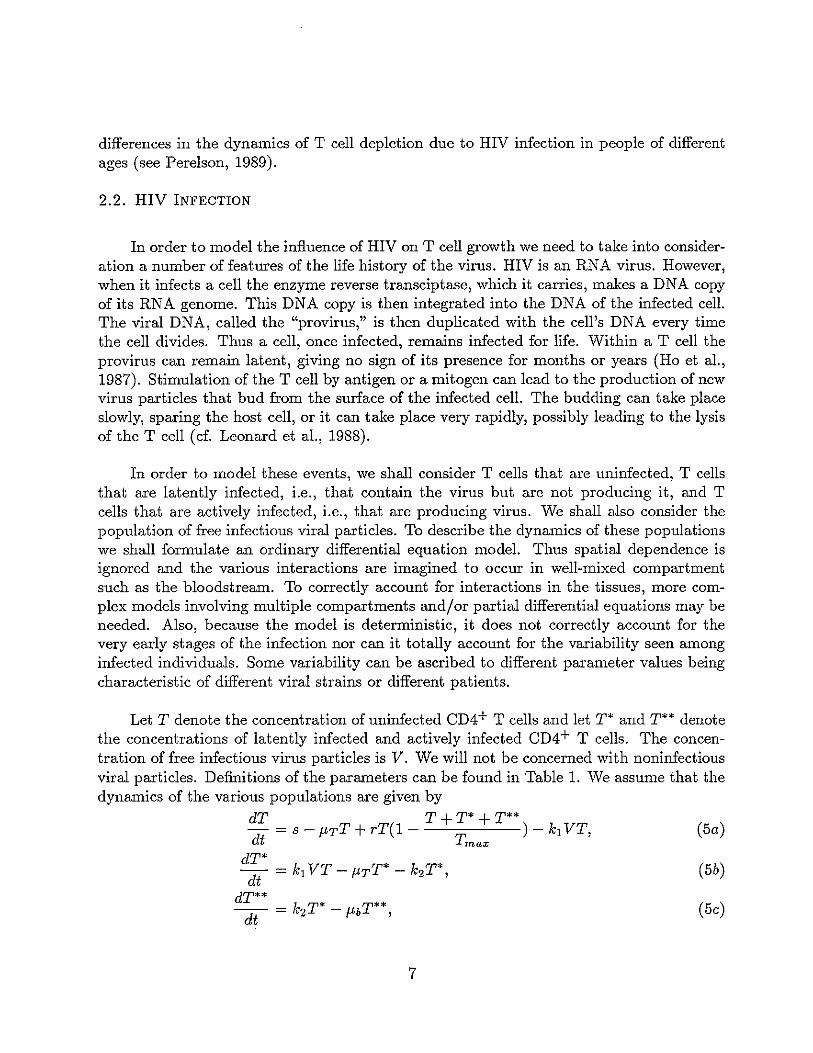
Let T denote the concentration of uninfected CD4+ T cells and let T* and T** denotethe concentrations of latently infected and actively infected CD4+ T cells. The concentration of free infectious virus particles is V. We will not be concerned with noninfectiousviral particles. Definitions of the parameters can be found in Table 1. We assume that thedynamics of the various populations are given by
dT T+T* +T**- = S - f.lrT + rT(l - ) - k1VT,dt Tmax
d~* = k1VT - f.lrT * - k2T*,
dT** _ k T* - T**dt - 2 f.lb ,
7

dV =NJ1bT**-k1VT-J1vV.dt
(5d)
Equation (5a) is a modified form of Eq. (1). Again s is a source term and representsthe rate of generation of new (presumably uninfected) CD4+ T cells from precursors inthe bone marrow and thymus. HIV can infect precursor cells and may have the effect ofdecreasing the supply of new cells (cf. Edelman and Zolla-Pazner, 1989). Thus, in morerefined models one may need to consider s as a decreasing function of v. This case isconsidered in Section 7 and in Perelson (1989). Uninfected T cells have a finite life-spanand are assumed to die at the same rate per cell, J1T, as in uninfected individuals. In Eq.(5b), latently infected T cells are also assumed to have precisely the same natural lifespan(~ 1/J1T), although other factors can augment the natural death rate.
If a T cell encounters the antigen for which it is specific, it may be stimulated to grow.T cell stimulation is a complex matter. Here, we are dealing with T cells of all specificitiesand thus we shall simply assume that a constant fraction of T cells are stimulated togrow. In the mouse, Freitas et al. (1986) find that about 10% of peripheral T cells areactivated large cells. In humans the situation may be different. Analyzing peripheralblood lymphocytes (PBLs) of a healthy individual one typically finds that on the orderof 1% of the cells are activated using the criterion of IL-2 receptor expression (K. Smith,personal communication). Since many of the PBLs with IL-2 receptors may be naturalkiller cells, fewer than 1% of CD4+ T cells may be activated. In a more complex modelone can make the fraction of cells stimulated, is, a variable in the model and let it be afunction of the antigen concentration, and possibly other factors such as lymphokines andantigen presentation by macrophages. As the HIV infection progresses the fraction of cellsstimulated may change so this enhancement may be quite interesting. Here we assumethat is is a constant, and that the parameter r in Eqs. (1) and (5a) is given by r = i'is,where i' is the average antigen or idiotypic network induced per capita T cell growth ratein the absence of population density limitation.
The other terms in Eqs. (5a) and (5b) deal with the effects of HIV. The term k1VTmodels the rate at which free virus V infects a CD4+ T cell. A simple mass-action typeterm has been used with rate constant k1 . Once a T cell has been infected, it becomes alatently infected or T* cell; thus this term is subtracted from Eq. (5a) and added to Eq.(5b).
Equation (5c) models the population dynamics of actively infected T cells. Activelyinfected cells are presumed to be generated from latently infected cells with rate constantk2 • This activation event probably involves the latently infected cell being stimulated todivide. In vitro a variety of stimuli including antigens and mitogens have been shown toinduce HIV expression (Margolick et al., 1987; Folks et al., 1986) Thus k2 , like r, shouldbe a function of antigen concentration, and the fraction of cells stimulated by antigen.
8

However, it also includes the probability that stimulation leads to viral production. Activeviral replication and budding from these cells is assumed to lead to lysis at rate {Lb (cf.Leonard et al., 1988). Although actively infected cells may divide once or twice andgenerate a few daughter cells (Leonard et al., 1988), we feel this expansion is sufficientlyminor that it can be ignored. The major factor that needs to be modeled correctly is thetotal number of infectious virus particles produced by one infected cell during its lifetimeincluding any of its daughter cells. We call this quantity N. In this model we treat both {Lb
and N as parameters characteristic of a particular viral species. Both parameters, however,may be related to the viral replication rate. One would expect that viral strains with highreplication rates would have high values of N. However, the lytic rate {Lb may also dependon the replication rate - viruses with low replication rate may kill poorly, if at all, whilethose with high replication rates may kill rapidly, say by membrane disruption duringviral budding. A detailed model of these relationships will be presented elsewhere. Herewe treat N, {Lb, as well as other parameters as constants. If slow/low strains are replacedby rapid/high variants then various parameters, such as N, could be slowly varying (seediscussion) .
Equation (5d) models the free infectious virus population. As stated above, we assumethat an actively infected CD4+ T cell produces N virus particles. For simplicity, we takethe rate of virus production equal to N times the death rate of the cell. For example,this would be the case if the viruses were released upon cell death. Free virus is lost bybinding to uninfected CD4+ T cells at rate k1VT. Binding might also occur to latentlyinfected cells and cause "superinfection". Here we neglect this possibility in order tokeep the model as simple as possible. Recent measurements using the polymerase chainreaction (Schnittman et al., 1989), indicate that in patients with AIDS approximately 1 in100 cells are latently infected, while in HIV.- seropositive patients that are asymptomatic,< 1/10,000 to 1/1000 CD4+ T cells are infected (Schnittman et al., 1990). Thus neglectingbinding to latently infected cells should not introduce much error. Actively infected cellstend to lose their CD4 (Hoxie et al., 1986), and hence viral binding to actively infectedcells can also be justifiably neglected. The last term in Eq. (5d), -{LvV, accounts for lossof viral infectivity, viral death and/or clearance from the body.
In the absence of virus, the T cell population has the steady state value To. Thus reasonable initial conditions for this system of equations are T(O) = To, T*(O) = 0, T**(O) = 0,and V(O) = Vo for infection by free virus, or T(O) = To, T*(O) = T;, T**(O) = T;*,V(O) = Vo for infection by both infected cells and virus.
3. Analysis
We first remark that the model is reasonable in the sense that no population goesnegative and no population grows unbounded. The non-negative orthant Rt = {x E
9

R4 1x <:: O} is called a positively invariant region if a trajectory that starts in the nonnegative orthant remains there forever. What is needed for this is to show that on eachhyperplane bounding the non-negative orthant the vector field points into Rt. From Eqs.(5) we find precisely this, i.e.,
dTdilT=o = s <:: 0 ,
dT*diIT'=o = kl VT <:: 0 ,
dT**----;u-IT"=O = k2T* <:: 0 ,
dV I N T**dt v=o = flb <:: 0 .
One of the properties of the logistic equation for T cell growth, Eq. (1), is that ifT(O) < Tmax, then T(t) < Tmax for all t. Since the presence of HIV only decreases the Tcell population, this property should remain true for Ttot = T +T* +T**. To prove thiswe show that (dTtot/dt)IT,ot=Tma• < O. From Eqs. (5a)-(5c) we see
dTtot T T(l Ttot ) T* T**-- = s - flT + r - -- -flT - flb .dt Tmax
Death by viral cytopathicity occurs faster than death by natural means, i.e. flb > flT.Therefore
dTtot ( Ttot )-- < s - flTTtot +rT 1 - -- .dt Tmax
Hence at Ttot = Tmax ,dTdiIT,a,=Tma. < S - flTTmax < 0 .
The last inequality follows from Eq. (4). Thus, in the case of HIV infection, the total Tcell population, Ttot , and hence the various subpopulations, T(t), T*(t) and T** are allbounded by Tmax .
We now show that within the non-negative orthant there are two possible steadystates, one with no virus present, an uninfected steady state, and another with a constantlevel of virus, an endemically infected steady state. Setting the left hand sides of Eqs. (5b)and (5c) to zero yields:
T* _ kl VT- k2 + flT '
T** = k2T* = k2k l VTflb flb (k2 + flT)
Substituting Eqs. (6) and (7) into Eq. (5d) one finds
a; - [(k2:k:T -1) klT - flV)] V .
10
(6)
(7)
(8)

The equation dVI dt = 0 has two possible solutions, V = 0 and T = f'v I a, where
[Nk2 ]a=k1k -1.
2 + fIT(9)
(lOa)(10b,c,d)
If V = 0, then from Eqs. (6) and (7), T* = T** = O. Substituting into Eq. (5a), wefind quite obviously that there exists one steady state in which the virus is totally absent.We call this the uninfected state. It is given by:
T=ToT* = T** = V = 0 ,
where an overbar denotes a steady state value and To is given by Eq. (3). Introducing theparameters
p=r-f'T, and ,=rITmax ,
we can rewrite Eq. (3) in a form that will be useful later
p+ Vp2 +4s,To = .
2,
(l1a, b)
(12)
If V =!= 0 then substituting T = f'vla, and Eqs. (6) and (7) into Eq. (5a) leads to asecond steady state, which we call the endemically infected state. In this state
- f'v k3T = f'v la = k1(Nk
2_ k3) ,
T* = k1f'vV = f'vVak3 Nk2 - k3
T** = k2 k1f'vV = k2 f'vVf'bak3 f'b(Nk2 - k3)
V = sa2 +paf'v -,f'tk1f'v(a + (3M)
where
(13a)
(13b)
(13c)
(13d)
(3 = :J.... (1 + k2)
k3 fIb(14a, b)
3.1. STABILITY OF THE UNINFECTED STATE
For the uninfected steady state to be asymptotically stable we require that after anintroduction of a small amount of virus, dVldt < O. Setting T = To and examining (8) we
11
(15)
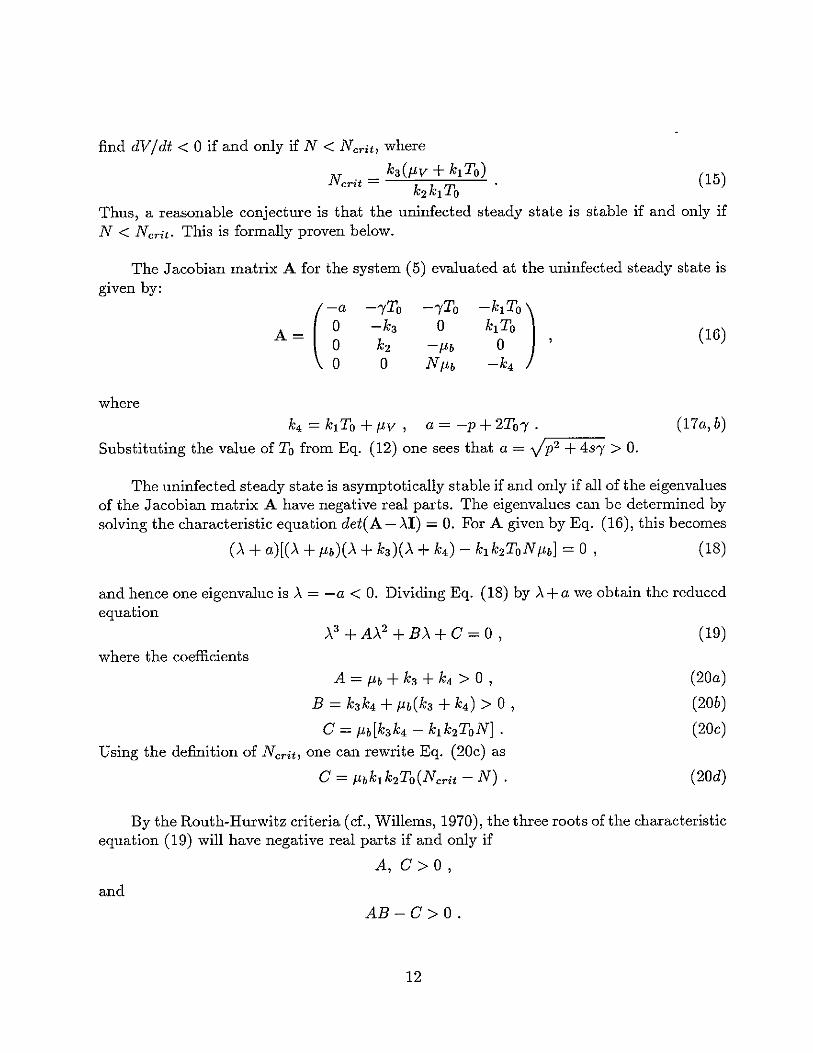
find dV/dt < 0 if and only if N < N crit , where
N . _ k3 (JLv + klTo)cr,t - k k rnz 'p 0
Thus, a reasonable conjecture is that the uninfected steady state is stable if and only ifN < Ncrit. This is formally proven below.
The Jacobian matrix A for the system (5) evaluated at the uninfected steady state isgiven by:
A~(T-,To -,To -"To)-k3 0 klTo (16)
kz -JLb o '0 NJLb -k4
where
k4 = k1To + JLV, a = -p + 2To, .Substituting the value of To from Eq. (12) one sees that a = ";'p""""z-+-4'-8-, > O.
(17a,b)
The uninfected steady state is asymptotically stable if and only if all of the eigenvaluesof the Jacobian matrix A have negative real parts. The eigenvalues can be determined bysolving the characteristic equation det(A-AI) = O. For A given by Eq. (16), this becomes
(A + a)[(A + JLb)(A + k3 )(A + k4 ) - k1kzToNJLb] = 0, (18)
and hence one eigenvalue is A = -a < o. Dividing Eq. (18) by A+a we obtain the reducedequation
where the coefficients
A = JLb + k3 + k4 > 0 ,
B = k3 k4 + JLb(k3 + k4 ) > 0 ,
C = JLb[k3 k4 - k1kzToN] .Using the definition of N crit , one can rewrite Eq. (20c) as
C = JLbklkzTo(Ncrit - N) .
(19)
(20a)
(20b)
(20c)
(20d)
By the Routh-Hurwitz criteria (cf., Willems, 1970), the three roots of the characteristicequation (19) will have negative real parts if and only if
A, C > 0,
and
AB-C>O.
12
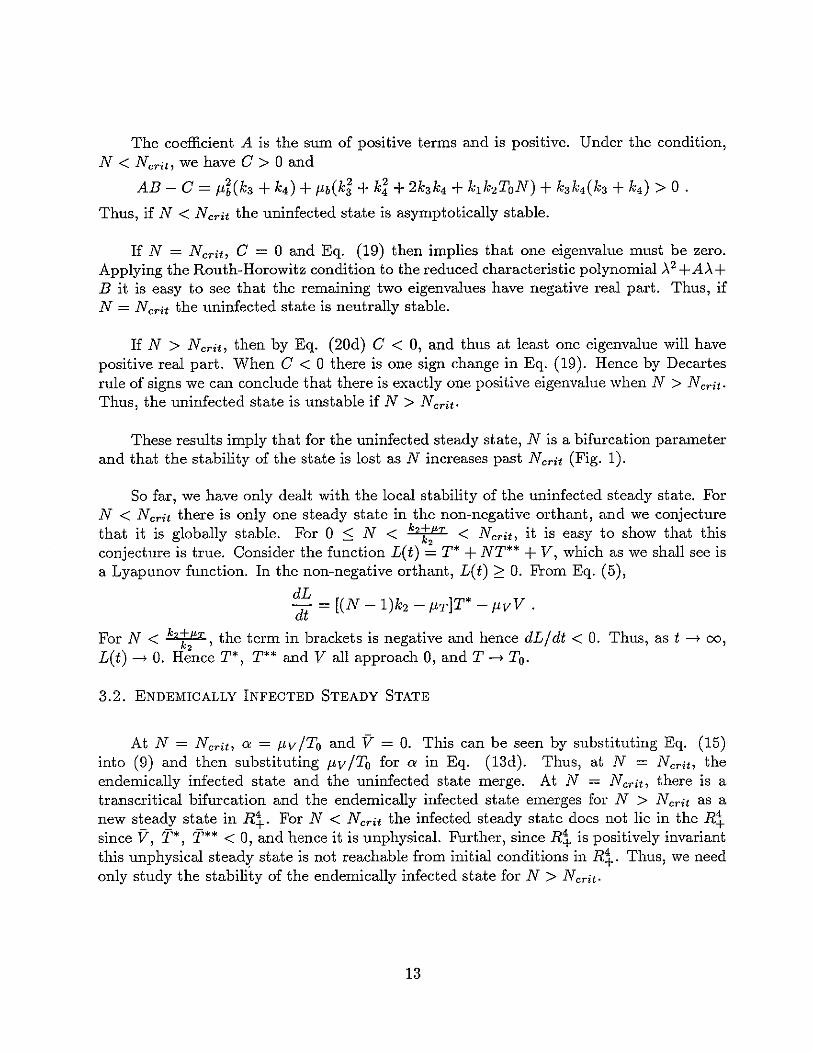
The coefficient A is the sum of positive terms and is positive. Under the condition,N < N crit ' we have C > 0 and
AB - C = fJ-t(k3 + k4 ) + fJ-b(ki + kl + 2k3 k4 + k1 k2 ToN) + k3 k4 (k3 + k4 ) > 0 .
Thus, if N < Ncrit the uninfected state is asymptotically stable.
If N = N crit , C = 0 and Eq. (19) then implies that one eigenvalue must be zero.Applying the Routh-Horowitz condition to the reduced characteristic polynomial >.2 +A>'+B it is easy to see that the remaining two eigenvalues have negative real part. Thus, ifN = N crit the uninfected state is neutrally stable.
If N > Ncrit, then by Eq. (20d) C < 0, and thus at least one eigenvalue will havepositive real part. When C < 0 there is one sign change in Eq. (19). Hence by Decartesrule of signs we can conclude that there is exactly one positive eigenvalue when N > N crit .Thus, the uninfected state is unstable if N > N crit .
These results imply that for the uninfected steady state, N is a bifurcation parameterand that the stability of the state is lost as N increases past Ncrit (Fig. 1).
So far, we have only dealt with the local stability of the uninfected steady state. ForN < Ncrit there is only one steady state in the non-negative orthant, and we conjecturethat it is globally stable. For 0 :":: N < k,t,'!T < Ncrit, it is easy to show that thisconjecture is true. Consider the function L(t) = T* + NT** + V, which as we shall see isa Lyapunov function. In the non-negative orthant, L(t) ~ O. From Eq. (5),
dL = [(N -1)k2 - fJ-T]T* - fJ-vVdt .
For N < k,t,f!T, the term in brackets is negative and hence dL/dt < O. Thus, as t ---> 00,
L(t) ---> O. Hence T*, T** and V all approach 0, and T ---> To.
3.2. ENDEMICALLY INFECTED STEADY STATE
At N = N crit , Q = f-lv /To and V = O. This can be seen by substituting Eq. (15)into (9) and then substituting f-lv /To for Q in Eq. (13d). Thus, at N = N crit , theendemically infected state and the uninfected state merge. At N = Ncrit, there is atranscritical bifurcation and the endemically infected state emerges for N > Ncrit as anew steady state in Rt. For N < N crit the infected steady state does not lie in the Rtsince V, T*, T** < 0, and hence it is unphysical. Further, since Rt is positively invariantthis unphysical stead~ state is not reachable from initial conditions in Rt. Thus, we needonly study the stability of the endemically infected state for N > Ncrit.
13

Linearizing equations (5) around the endemically infected state we obtain the Jacobianmatrix A:
(21)
where
ka = k2 + I-'T, k4 = krT+ I-'V, a = -p+,(2T +1'* +1'**) +k1V, (22a,b,c)
and 1', 1'*, 1'** and V are given by Eqs. (13). Using the steady state form of Eq. (5a),
o= s + pT - ,1'(1' + 1'* + 1'**) - k1VT ,
one easily sees aT = s + ,1'2, and hence
a = ,1' + siT> 0 . (23)
Examining the characteristic polynomial, det(A - AI), we find it has the form A4 +bAa + cA2 + dA + e where the coefficients are:
b=a+ka+k4 +l-'b>O, (24a)
e = a(ka + k4 + I-'b) + I-'b(ka + k4 ) + kak4 + k1TV(, - k1 ) , (24b)
d = a[kak4 + I-'b(ka+ k4 )] + k1 VT[,(I-'v + k2 + I-'b) - k1 (ka+ I-'b)] , (24e)
e = k1 VT[k1I-'b(Nk2 - ka) + 'I-'v(k2 + I-'b)] . (24d)
In calculating the coefficients of the characteristic polynomial we have eliminated aterm proportional to kak4 - k1k2 NT from both d and e, since substituting the definitionsof k4 and l' shows that this term is zero.
Analyzing the characteristic polynomial, it is obvious that b is positive. For N > N crit ,
Nk2 > ka. Thus e is positive as well.
To establish the stability of this steady state, it is also necessary to show that bothc and d are positive and that (be - d)dlb2 > e. For the parameters given in Table 1 allthree conditions are met, however, for some parameter regimes this steady state is unstable(Table 2).
4. T Cell Depletion
In the endemically infected state normal T cell population regulation is disturbed bythe presence of HIV. In this new steady state the T cell level can be considerably lowerthan in the uninfected steady state. Thus, one of the main conclusions of this model is
14

that HIV infection itself may be sufficient to account for a substantial amount of the T celldepletion seen in AIDS. To establish under what conditions this is the case, we examineEq. (11) in some detail.
As a simplifying approximation let us assume that with appropriate parameter choicesthe model can mimic the population distribution in vivo in which say 1 in 100 cells arelatently infected and 1 in 10,000 to 1 in 100,000 are actively infected. In this case, T celldepletion must occur predominately in the uninfected pool. According to Eq. (13a), atsteady state the uninfected T cell population size is
T _ /-Lv- k (Nk. - 1) ,
1 ks
where k3 = k2 + /-LT. Since N > Ncrit, let N = N crit + n. Then, substituting the value ofNcrit from Eq. (15) one can write
(25)
where
8 = kInTa (26)
f.LV(r,-+1)Since 8 :> 0, T < To and there is depletion of uninfected cells at the endemically infectedsteady state. As a useful measure of the degree of depletion of uninfected cells, we introduce
D = 1- (T/To) = 8/(1 + 8) . (27)
Thus, D = 0 implies no depletion and D = 1 means total depletion. The larger 8 thelarger the depletion. Consequently, there is increased depletion of uninfected T cells:
• if virus lives longer (i.e., if /-LV is decreased).
• if there is a higher rate of viral infection (i.e., if kI is increased).
• if a larger number of viruses are produced per T cell (i.e., if n is increased).
Further, if /-LT / k2 ::'P 1, then there is also increased depletion:
• if there is more rapid conversion from the latent to the actively infected state (i.e., ifk2 is increased).
• or if T cells live longer (i.e., if /-LT is decreased).
We also note that the depletion of uninfected cells is independent of /-Lb, the death rateof actively infected cells, and s, the rate of supply of uninfected cells. However, increasing/-Lb will have a small effect on the total T cell population since it will decrease T**. Also,
15
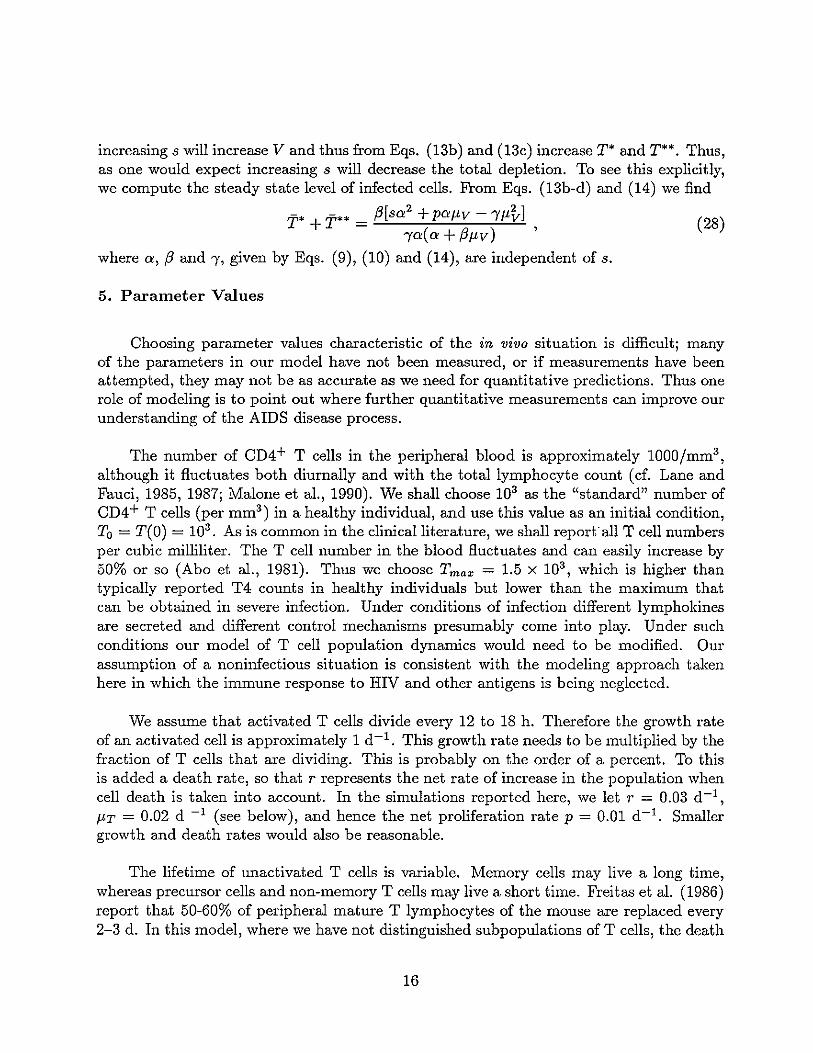
increasing s will increase V and thus from Eqs. (13b) and (13c) increase T* and T**. Thus,as one would expect increasing s will decrease the total depletion. To see this explicitly,we compute the steady state level of infected cells. From Eqs. (I3b-d) and (14) we find
T* +T** - ,8[sa2 +paf-lv - 'Yf-ltJ (28)
- 'Ya (a + ,8f-lV) ,
where a, ,8 and 'Y, given by Eqs. (9), (10) and (14), are independent of s.
5. Parameter Values
Choosing parameter values characteristic of the in vivo situation is difficult; manyof the parameters in our model have not been measured, or if measurements have beenattempted, they may not be as accurate as we need for quantitative predictions. Thus onerole of modeling is to point out where further quantitative measurements can improve ourunderstanding of the AIDS disease process.
The number of CD4+ T cells in the peripheral blood is approximately 1000/mm3 ,
although it fluctuates both diurnally and with the total lymphocyte count (d. Lane andFauci, 1985, 1987; Malone et al., 1990). We shall choose 103 as the "standard" number ofCD4+ T cells (per mm3 ) in a healthy individual, and use this value as an initial condition,To = T(O) = 103 . As is common in the clinical literature, we shall report" all T cell numbersper cubic milliliter. The T cell number in the blood fluctuates and can easily increase by50% or so (Abo et al., 1981). Thus we choose Tmax = 1.5 X 10³ , which is higher thantypically reported T4 counts in healthy individuals but lower than the maximum thatcan be obtained in severe infection. Under conditions of infection different lymphokinesare secreted and different control mechanisms presumably come into play. Under suchconditions our model of T cell population dynamics would need to be modified. Ourassumption of a noninfectious situation is consistent with the modeling approach takenhere in which the immune response to HIV and other antigens is being neglected.
We assume that activated T cells divide every 12 to 18 h. Therefore the growth rateof an activated cell is approximately 1 d-1 . This growth rate needs to be multiplied by thefraction of T cells that are dividing. This is probably on the order of a percent. To thisis added a death rate, so that r represents the net rate of increase in the population whencell death is taken into account. In the simulations reported here, we let r = 0.03 d-1 ,
f-lT = 0.02 d -1 (see below), and hence the net proliferation rate p = 0.01 d-1 . Smallergrowth and death rates would also be reasonable.
The lifetime of unactivated T cells is variable. Memory cells may live a long time,whereas precursor cells and non-memory T cells may live a short time. Freitas et al. (1986)report that 50-60% of peripheral mature T lymphocytes of the mouse are replaced every2-3 d. In this model, where we have not distinguished subpopulations of T cells, the death
16

rate itT represents an average over all subpopulations. Thus, while some human T cellsmay live for years, it is clear that many T cells have much shorter lifetimes. Recent workof Gray (1989) and Gray and Leanderson (1991) indicates that memory T cells may live 2to 6 weeks in the absence of antigen stimulated replication. This we feel is reasonable asan average. Thus we take itT = 0.02 d-1
, which corresponds to a half-life of 36 d.
The supply of new T cells from precursor populations must be less than the numberrequired to maintain the T cell population constant. Thus s ::::: ItTTo. With To = 103
mm-3 , and itT as above, s ::::: 20 d-1 mm-3 • If we take s = 10 d-1 mm-3 , with r asgiven above, half of the T cell replenishment is by proliferation in the periphery and halffrom the supply term. The parameters r, s, and itT have been chosen so that, in theabsence of virus, the population of CD4+ T cells is maintained at its initial value To = 103
mm-3. Other choices of these parameters, of course, can also maintain this steady statepopulation level.
Estimating the rate k1 at which virus infects T cells is difficult. Because k1 is abimolecular rate constant, it has the dimensions of one over cell concentration per unittime. A useful scaling is therefore to consider k1To which has the units of time-1 . In orderfor a virus to infect a cell, it must encounter the cell, bind CD4 or some other receptorand then enter the cell. Thus infection can not be any faster than the rate of transportto the cell surface. We can thus use Smoluchowski's formula for the diffusion limited rateconstant to provide an upper bound on k1 . For interaction between two spherical particlesof radii, rT and rv, with diffusion coefficients DT and D v , k1 :s; 47l'(rT + rv)(DT + Dv).Using rv = 5 X 10⁻⁶ cm, rT = 4 X 10⁻⁴ cm, D v = 2 X 10⁻⁸ cm2s-1 , and DT = 2.5 X 10⁻¹⁰
cm2s-1 as given in Layne et al. (1989), k1 ::::: 10-10 cm3s-1 = 0.36 X 10⁻³ mm3 h-1 . Hencek1To ::::: 0.36 h-1 . For particles the size of HIV, convective transport would not be able toraise this rate (Purcell, 1977). Once a virus particle encounters a cell, it need not infect it.The CD4 level will vary among T cells. Cells with low levels of CD4 may resist infection.Further, the state of activation of the cell may be important. Some work has suggestedthat only activated T cells can be successfully infected (Gowda et al., 1989; Zack et al.,1990). Kiernan et al. (1990) using an in vitro system found that while 40% of input virusattached to cells, only 2 to 3% of cells became actively infected. Thus, it seems reasonableto suppose that only a fraction of the encounters between HIV and T cells will lead toto infection. As an initial guess, we assume k1To = 10-3 h-1 = 2.4 X 10⁻² d-1 • Sincedifferent viral strains have different tropisms and different degrees of virulence, one mightsafely assume that k1 is a strain dependent parameter that can vary greatly.
Latently infected cells behave the same as normal T cells and thus should have thesame death rate. However, we assume that when they interact with antigen, rather thandividing, they become actively infected. The time for death of an actively infected cell isprobably a few days to a week. Somasundaran and Robinson (1988) found that in cells ofthe T cell line C8166, a 3- to 4-day lag occurred between expression of viral proteins and
17

cell death in actively infected cells. Kiernan et al. (1990) found that HIV-infected MT-2cells remain viable up to 62 h post-infection, after which viability rapidly decreases. Thuswe shall choose flb = 0.24 d-1 .
The number of infectious viruses released N is not known precisely. Merrill (1988)suggests N is between 50 and 1000. Layne et al. (1989) estimate N > 300 from data on theminimum concentration of soluble CD4 needed to block HIV infectivity in an in vitro assay.Somasundaran and Robinson (1988) find that the standard laboratory strain of HIV, lIIB,selected to grow well in culture, can produce between 300,000 and 2.5 million copies of viralRNA in actively infected cells. The number of these viral RNAs that are packaged intoviral particles and released was not measured but such high levels of expression indicatethat values of N well above 103 are possible. Viral isolates exhibit great variability, somereplicate fast and are highly cytopathic while others replicate slowly (cf., Cheng-Mayeret aI., 1988; Fenyo et aI., 1988). In order to study the differences in disease course withdifferent viral strains we will vary N in our studies. However, we keep N in the low rangeof permissible values since this model is only applicable to strains of HIV that do notstimulate an immune response. As argued elsewhere, we believe such strains should be lowviral producers (Nelson and Perelson, 1992).
Free virus loses its infectivity over time, probably due to the shedding of gp120(Gelderblom, et aI., 1987). For example, in a viral infectivity assay HIV-1 strains lIIBand RFlI lose half of their infectivity in 4-6 hr at 37° C (Layne et aI., 1989). Thus we takeflv = 2.4 d-1
.
The rate of conversion of a latently infected cell to an actively infected cell is k2 • Weassume that only those latently infected T cells that recognize and respond to the antigenactivate HIV replication. Thus, as in the calculation of the average T cell growth rate r,k2 has embedded in it a factor proportional to the average fraction of T cells stimulatedby environmental antigen. Because the process of activating HIV replication requires celldivision, we expect k2 :s; r. Further, the conversion process may not be 100% efficient,i.e., some latently infected cells that are activated by antigen may not produce virus, ormay produce defective virus. Thus, k2 may be considerably smaller than r. Here wechoose k2 = 0.1 and r = 3 X 10⁻³ d-1
, where the value of l' is our default value forhealthy individuals responding to normal environmental antigens. If one focuses on timesof infection by disease causing agents other than HIV, the parameters r and hence k2 couldchange. Models by Cooper (1986), Intrator et al. (1988), Reibnegger et ai. (1987), McLean(1988), McLean and Kirkwood (1990), Anderson (1989), and Anderson and May (1989)all consider the effects of secondary infection. Here we are modeling the course of HIVon a long time scale and the specific effects of one infection or another are not explicitlyconsidered. Rather the net effect of all such antigen encounters is used to estimate thevalue of r.
18
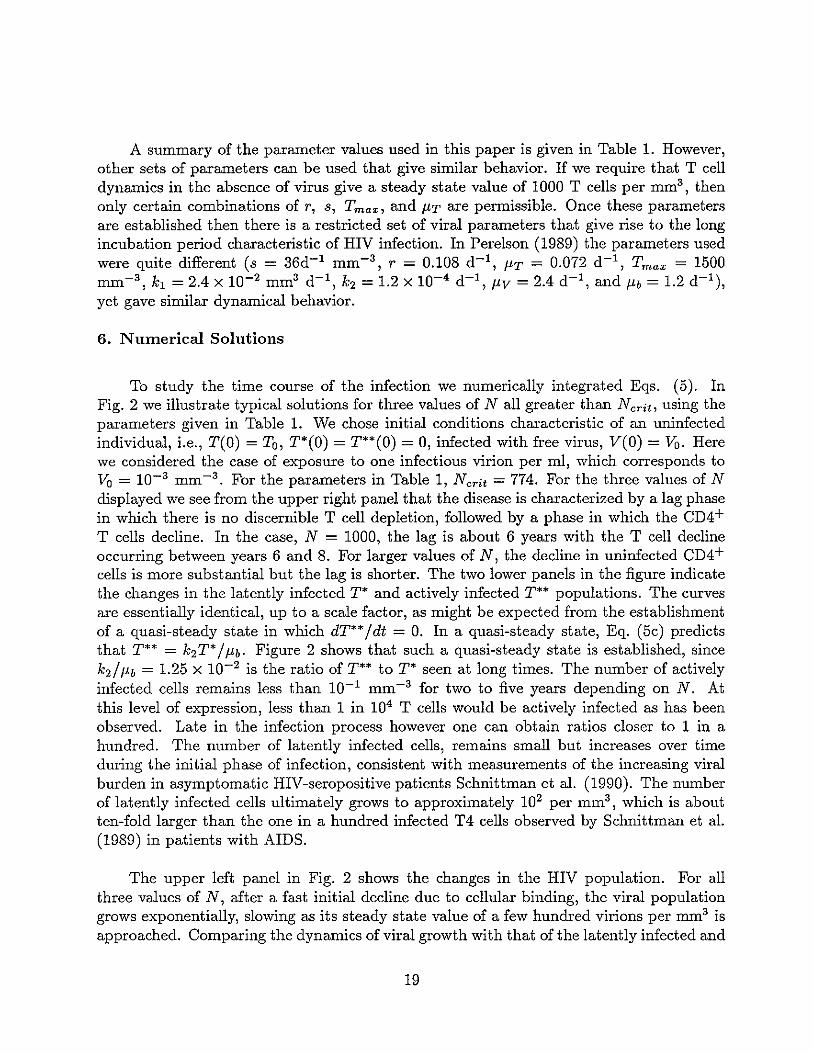
A summary of the parameter values used in this paper is given in Table 1. However,other sets of parameters can be used that give similar behavior. If we require that T celldynamics in the absence of virus give a steady state value of 1000 T cells per mm3 , thenonly certain combinations of r, s, Tmax , and flT are permissible. Once these parametersare established then there is a restricted set of viral parameters that give rise to the longincubation period characteristic of HIV infection. In Perelson (1989) the parameters usedwere quite different (s = 36d-1 mm-3 , r = 0.108 d-1 , flT = 0.072 d-l, Tmax = 1500mm-3 , k1 = 2.4 X 10⁻² mm3 d- 1 , k2 = 1.2 X 10⁻⁴ d-1 , flv = 2.4 d-1 , and flb = 1.2 d-1 ),
yet gave similar dynamical behavior.
6. Numerical Solutions
To study the time course of the infection we numerically integrated Eqs. (5). InFig. 2 we illustrate typical solutions for three values of N all greater than N crit , using theparameters given in Table 1. We chose initial conditions characteristic of an uninfectedindividual, i.e., T(O) = To, T*(O) = T**(O) = 0, infected with free virus, V(O) = Vo. Herewe considered the case of exposure to one infectious virion per ml, which corresponds toVa = 10-3 mm-3 • For the parameters in Table 1, N crit = 774. For the three values of Ndisplayed we see from the upper right panel that the disease is characterized by a lag phasein which there is no discernible T cell depletion, followed by a phase in which the CD4+T cells decline. In the case, N = 1000, the lag is about 6 years with the T cell declineoccurring between years 6 and 8. For larger values of N, the decline in uninfected CD4+cells is more substantial but the lag is shorter. The two lower panels in the figure indicatethe changes in the latently infected T* and actively infected T** populations. The curvesare essentially identical, up to a scale factor, as might be expected from the establishmentof a quasi-steady state in which dT** /dt = O. In a quasi-steady state, Eq. (5c) predictsthat T** = k2T* / /lb. Figure 2 shows that such a quasi-steady state is established, sincekd flb = 1.25 X 10⁻² is the ratio of T** to T* seen at long times. The number of activelyinfected cells remains less than 10-1 mm-3 for two to five years depending on N. Atthis level of expression, less than 1 in 104 T cells would be actively infected as has beenobserved. Late in the infection process however one can obtain ratios closer to 1 in ahundred. The number of latently infected cells, remains small but increases over timeduring the initial phase of infection, consistent with measurements of the increasing viralburden in asymptomatic HIV-seropositive patients Schnittman et al. (1990). The numberof latently infected cells ultimately grows to approximately 102 per mm3 , which is aboutten-fold larger than the one in a hundred infected T4 cells observed by Schnittman et al.(1989) in patients with AIDS.
The upper left panel in Fig. 2 shows the changes in the HIV population. For allthree values of N, after a fast initial decline due to cellular binding, the viral populationgrows exponentially, slowing as its steady state value of a few hundred virions per mm3 isapproached. Comparing the dynamics of viral growth with that of the latently infected and
19

actively infected T cell populations shows that V (t) follows essentially the same dynamicsas the infected T cells. Thus, a quasi-steady state approximation could again be usedwith benefit. We return to this point later. Figure 3 shows the change in the free viruspopulation as N is decreased further. If N < Ncrit, then after the initial binding Vet)decreases exponentially indicating that the infection will not cause disease and that theuninfected state is being approached. With N > N crit , the virus grows after the initialdecline, while with N = Ncrit the virus rapidly attains a constant level and no T celldepletion is seen (not shown).
Changing the parameters in the model changes the details of the dynamics. Forexample, increasing N gives rise to larger amounts of T cells depletion, which is morecharacteristic of AIDS, but also speeds up the depletion, which is less characteristic (Fig. 4).Earlier, we predicted that increased depletion would also occur if !-LV were decreased, i.e.,if infective virus lived longer. This is what we see in Fig. 5. Changing the initial conditionsaffects the time from infection to depletion. As shown in Fig. 6, depletion is noticeableonce Vet) reaches a level of about 50/mm3 • Thus, as expected, increasing Vo decreasesthe time to depletion. Similar effects are seen if infected cells are used as initial conditionsrather than free virus.
6.1. OSCILLATIONS
When the infected steady state is in the positive orthant, i.e., for N > N crit , it is alsostable for most parameter values of biological interest. In parameter regimes where theinfected state is unstable, the system undergoes sustained oscillations around the infectedstate. We studied the behavior of the system in these regimes by numerical integration,using GRIND (De Boer, 1983), and by numerical bifurcation, using AUTO (Doedel, 1981).The parameter regime for oscillations is necessarily different than that in Table 1. Table2 gives the default parameters used in our study of oscillations. Figure 7 illustrates thedynamics of the system using the parameters in Table 2. The effects of changing theparameters r, k1 and !-LT, which are all quite different than in Table 1, were studied usingAUTO. All parameters were set at the default values given in Table 2 except N. ExaminingFig. 8 for the transcritical bifurcation obtained with these parameters, one notes that theendemically infected state that became stable at N = N crit = 502, loses its stability ata slightly larger value of N and then regains its stability at N f':j 1229. Oscillations arisevia a Hopf bifurcation when the endemically infected state becomes unstable (light curvein Fig. 8). In order to detennine the boundary in parameter space for oscillations, wetrace one of the two Hopf bifurcations (the upper one at N = 1229.34) varying rand!-LT simultaneously in Fig. 9a. The region in which oscillations are found is indicated. Atthe boundaries of the region, the endelnically infected steady state changes stability viaa Hopf bifurcation. Thus, for example, for !-LT = 0.1 d-1 at r = 1.04, there is a Hopfbifurcation giving birth to a stable limit cycle. For smaller values of r the infected steadystate is stable. If one fixes r, say at r = 10 d-1 , and varies !-LT, one finds that for small
20
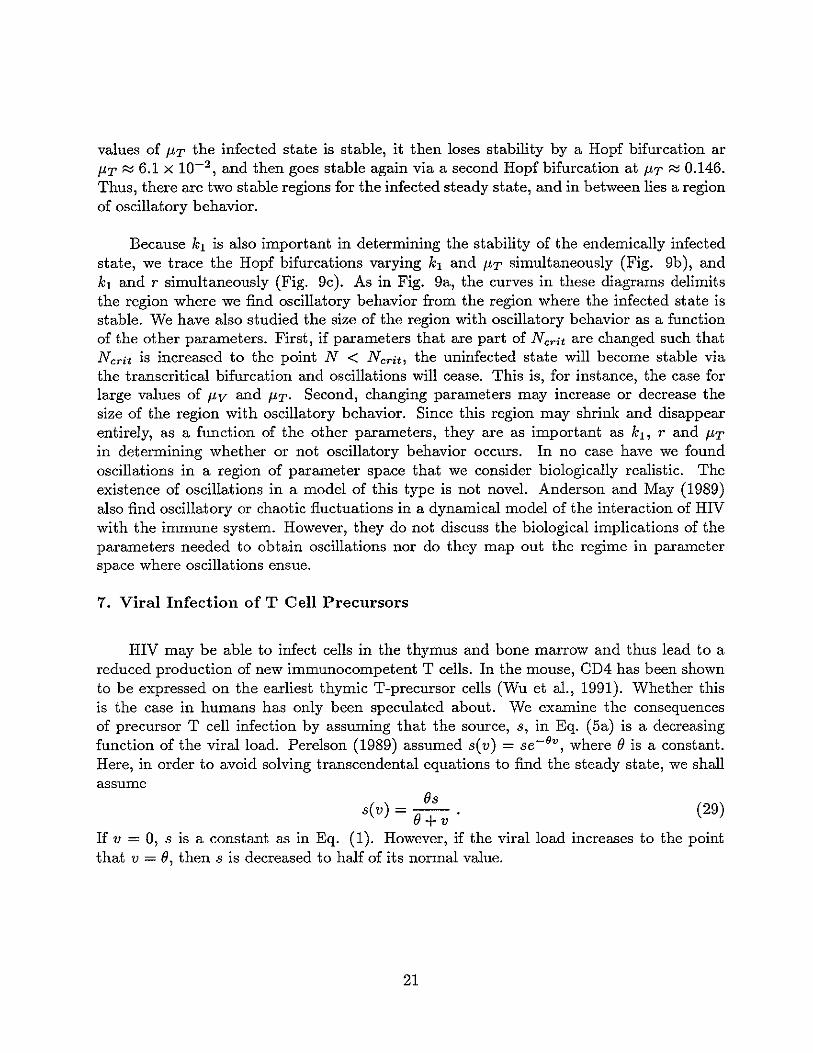
values of {IT the infected state is stable, it then loses stability by a Hopf bifurcation ar{IT f';; 6.1 X 10⁻² , and then goes stable again via a second Hopf bifurcation at {IT f';; 0.146.Thus, there are two stable regions for the infected steady state, and in between lies a regionof oscillatory behavior.
Because k1 is also important in determining the stability of the endemically infectedstate, we trace the Hopf bifurcations varying k1 and {IT simultaneously (Fig. 9b), andk1 and r simultaneously (Fig. 9c). As in Fig. 9a, the curves in these diagrams delimitsthe region where we find oscillatory behavior from the region where the infected state isstable. We have also studied the size of the region with oscillatory behavior as a functionof the other parameters. First, if parameters that are part of N eri , are changed such thatNed' is increased to the point N < Ned', the uninfected state will become stable viathe transcritical bifurcation and oscillations will cease. This is, for instance, the case forlarge values of {Iv and {IT. Second, changing parameters may increase or decrease thesize of the region with oscillatory behavior. Since this region may shrink and disappearentirely, as a function of the other parameters, they are as important as k1 , r and {IT
in determining whether or not oscillatory behavior occurs. In no case have we foundoscillations in a region of parameter space that we consider biologically realistic. Theexistence of oscillations in a model of this type is not novel. Anderson and May (1989)also find oscillatory or chaotic fluctuations in a dynamical model of the interaction of HIVwith the immune system. However, they do not discuss the biological implications of theparameters needed to obtain oscillations nor do they map out the regime in parameterspace where oscillations ensue.
7. Viral Infection of T Cell Precursors
HIV may be able to infect cells in the thymus and bone marrow and thus lead to areduced production of new immunocompetent T cells. In the mouse, CD4 has been shownto be expressed on the earliest thymic T-precursor cells (Wu et al., 1991). Whether thisis the case in humans has only been speculated about. We examine the consequencesof precursor T cell infection by assuming that the source, s, in Eq. (5a) is a decreasingfunction of the viral load. Perelson (1989) assumed s(v) = se-Bv , where e is a constant.Here, in order to avoid solving transcendental equations to find the steady state, we shallassume
ess(v) = -e- . (29)+v
If v = 0, s is a constant as in Eq. (1). However, if the viral load increases to the pointthat v = e, then s is decreased to half of its normal value.
21
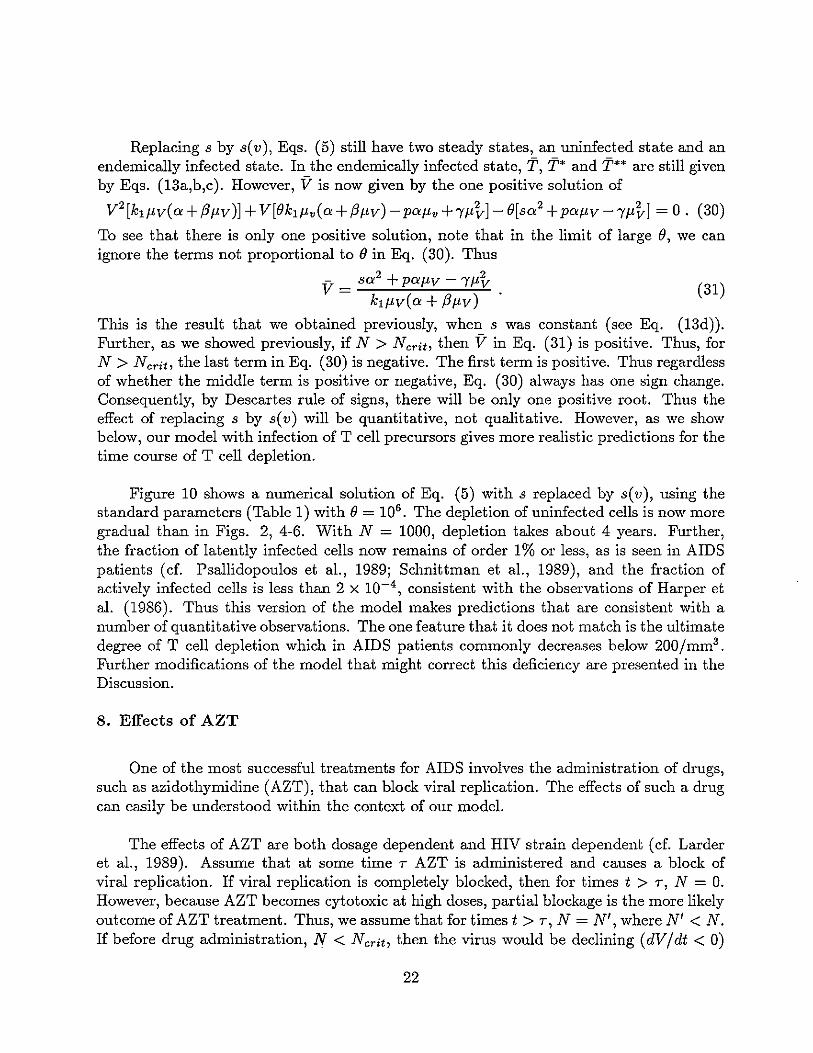
Replacing s by s(v), Eqs. (5) still have two steady states, an uninfected state and anendemically infected state. In the endemically infected state, '1', '1'* and '1'** are still givenby Eqs. (13a,b,c). However, V is now given by the one positive solution of
V 2 [k1ltv( a +Ihw)] +V[ek1ltv(a +,8ltv) - paltv +'wt] - e[sa2 +paf!V -iltt J = O. (30)
To see that there is only one positive solution, note that in the limit of large e, we canignore the terms not proportional to e in Eq. (30). Thus
V = sa2 +paltv -iltt (31)
k1ltv(a + f3ltv)
This is the result that we obtained previously, when s was constant (see Eq. (13d)).Further, as we showed previously, if N > N crit , then V in Eq. (31) is positive. Thus, forN > N crit , the last term in Eq. (30) is negative. The first term is positive. Thus regardlessof whether the middle term is positive or negative, Eq. (30) always has one sign change.Consequently, by Descartes rule of signs, there will be only one positive root. Thus theeffect of replacing s by s(v) will be quantitative, not qualitative. However, as we showbelow, our model with infection of T cell precursors gives more realistic predictions for thetime course of T cell depletion.
Figure 10 shows a numerical solution of Eq. (5) with s replaced by s(v), using thestandard parameters (Table 1) with e= 106
• The depletion of uninfected cells is now moregradual than in Figs. 2, 4-6. With N = 1000, depletion takes about 4 years. Further,the fraction of latently infected cells now remains of order 1% or less, as is seen in AIDSpatients (cf. Psallidopoulos et al., 1989; Schnittman et al., 1989), and the fraction ofactively infected cells is less than 2 x 10⁻⁴ , consistent with the observations of Harper etal. (1986). Thus this version of the model makes predictions that are consistent with anumber of quantitative observations. The one feature that it does not match is the ultimatedegree of T cell depletion which in AIDS patients commonly decreases below 200/mm3 .
Further modifications of the model that might correct this deficiency are presented in theDiscussion.
8. Effects of AZT
One of the most successful treatments for AIDS involves the administration of drugs,such as azidothymidine (AZT), that can block viral replication. The effects of such a drugcan easily be understood within the context of our model.
The effects of AZT are both dosage dependent and HIV strain dependent (cf. Larderet al., 1989). Assume that at some time T AZT is administered and causes a block ofviral replication. If viral replication is completely blocked, then for times t > T, N = O.However, because AZT becomes cytotoxic at high doses, partial blockage is the more likelyoutcome of AZT treatment. Thus, we assume that for times t > T, N = N', where N' < N.If before drug administration, N < N crit , then the virus would be declining (dV/dt < 0)
22

and the drug would simply hasten its elimination. In such cases the drug may not beneeded. However, if N > N crit before treatment, the virus would have been growing aswould be the populations of infected T cells. After drug treatment, if N' < Ncrit, thenV, T* and T** would all decline and, assuming that the virus had not affected the thymusor T cell precursors, T would eventually recover to its initial value To. This is illustrated inFig. 11 (curve marked 0). If AZT is given in low doses, then even after treatment N maybe larger than N crit , so that only partial recovery of the T cell population occurs (curve 0
in Fig. 10). Partial recovery may also occur if thymic or bone marrow infection occurredor if AZT affected the stem cells responsible for the generation of new T cells. Under suchcircumstances the source of new cells, s, could be diminished, so that even after treatmentand viral elimination the T cell population would establish a new steady state consistentwith a decreased value of s, as is typically the case after adult thymectomy.
9. Quasi-steady State Approximation to the Dynamics
The total dynamical picture seems to naturally break up into three distinct timedomains. In the first, virus rapidly binds to T cells. This corresponds to the rapid initialdecay in the free virus population seen in Fig. 3. Next virus and infected T cells increaseexponentially and uninfected T cells maintain a population level close to To. In the lastregion, uninfected T cells decline in number, the virus and infected T cells populationgrowth slows, and steady state is established. In this section we will approximate thedynamics in these regions and estimate the time intervals for each type of behavior. Wewill also show how one can use a quasi-steady state approximation to obtain either a oneor two dimensional reduced description of the long-time behavior of the system.
9.1. EARLY TIME BEHAVIOR.
Assume that the initial conditions are V(O) = Vo, T(O) = To, T*(O) = 0 and T**(O) =0, i.e., that infection is by free virus. The earliest event is the binding of virus to uninfectedT cells. As can be seen in Fig. 3 this causes a rapid decrease in the concentration of freevirus. We estimate the depletion of free virus as follows:
Initially, and at early times, T(t) ~ To and T**(t) ~ O. We will use a method ofsuccessive approximation to refine these estimates. Thus, first assume T = To = constant,and T**(t) = O. Equation (5d) then becomes
dVdt =-k4V,
where
(29)
23

Hence virus decays exponentially according to
V(t) = Voe- k4t . (30a)
During this initial period some infection of T cells occurs. From Eq. (5a), withT=To,
~~ = S - /-lTTo+ rTo(1- To) - kl Voe-k4t
= -kl Voe-k4t ,
with solution
T(t) = To [1- k~~o (1- e-k4t
)] (30b)
If kl Vo~ k4 , T(t) ~To. For the parameters used to generate Fig. 3, kl VO/k4 ~ 10-6 , andhence there is no observable depletion of T cells.
From Eq. (5b)
dT* k -k t k *---;It = ITo Voe 4 - 3T ,
and thus
From Eq. (5c) these latently infected cells can create actively infected cells.tuting Eq. (30c) into Eq. (5c) and solving, yields
k2kl To Vo ( e-k4t e- kat (k4 - k3 )e-P.b t )T** (t) = + + -=-,---=---....,.;:-c-...,..---,-
k4 - k3 k4 - /-lb /-lb - k3 (k4 - /-lb)(/-lb - k3 )
(30c)
Substi-
(30d)
Substituting Eq. (30a) into Eq. (5d) for V(t) we find
dV ** k Vr -k t ( )dt = N /-lbT - 4 oe 4 , 31
where T**(t) is given by Eq. (30d). Although this equation can be used to generate thenext order approximation to V(t), we shall use it to estimate the time at which V stopsdecreasing, i.e., when dV/dt = O. From Eq. (31) this occurs at t = tmin, where tmin is thesolution of the transcendental equation
N /-lb k2kl TO [ e-kat
_ e-P.bt
] _ [k4
_ N /-lb k2 kl TO ] e-k4t _ 0 (32)/-lb - k3 k4 - k3 k4 - /-lb (k4 - k3 )(k4 - /-lb) -.
Further, at tmin,(33)
Evaluating tmin and Vmin for the parameters used to generate Fig. 3, we find that withN = 1000, tmin = 2.3 d and Vmin = 4.2x10⁻⁶ . Solving the full system, Eq. (5), numerically
24

for the same parameters gives tmin = 2 d and Vmin = 3 X 10⁻⁵ These approximations aresufficiently accurate for our purposes and show that the initial decrease in V due to thebinding and infection of T cells is quite rapid.
9.2. MID AND LONG-TIME BEHAVIOR
(34)
(35)
(36b)
(36a)
Examining Fig. 2, one immediately obvious feature is that the T**(t), T*(t) and V(t)curves all look similar. This motivates us to use a quasi-steady-state analysis to simplifythe system. Due to rapid absorption by CD4+ cells we expect that after a fast transient,the level of free virus will be well approximated by its quasi-steady state level. Similarly,actively infected cells equilibrate rapidly with latently infected cells. Assuming that on along time scale dT** / dt = dV/ dt = 0 leads to the algebraic equations
T ** _ k2T*- ,P,b
V = Nk2 T*kIT + p,v
Substituting into Eqs. (5a) and (5b) leads to
dT 2 ( Nk1 k2 ) *-d =s+pT-"(T - k3 (3+ k T TT ,t "I + p,v
dT* Nk1 k2 TT* k *-- - 3T
dt k1T+p,v .The solution of this two differential equation model is shown in Fig. 12. As initial conditionswe used T(O) = To and computed T*(O) from Eq. (30c) evaluated at t = tmin. Comparingwith Fig. 2, one notices that the solutions are very similar to the solutions of the fullsystem of equations, (5a)-(5d), although there is a detectable difference in the time neededto reach steady state.
(37)
During the initial and middle phases of the infection, a good approximation to T isThus, during this period we can substitute T = To into Eq. (36b) and obtain
dT* _ T*dt - 'TJ ,
where
(38)
From this we predict
T*(t)=ne~, (~)
where To* is determined by matching with a fast-time solution. The time-scale 1/'TJ dependson the difference between Nand Ncrit. Thus, as seen in the simulations, the infection is
25

slow when N is near N crit and becomes fast as N increases. Substituting Eq. (39) intoEq. (35) with T = To yields
Vet) = Vo+eqt, (40)
where v;t = N k2To / k4 . Rather than using a formal matching procedure to find To, wecan simply take Vmin as an approximation to Vo+'
10. Discussion
Starting from a description of T cell population dynamics in a healthy individual,we have developed a dynamical model for T cell depletion due to HlV infection. Whileour model is overly simple in that it does not account for the immune response to HlVinfection or mechanisms of cell death other than direct HlV mediated killing, it doesdemonstrate that HlV by itself can cause CD4+ T cell depletion in the face of normal Tcell replenishment. Further, the model demonstrates that the loss of T cells can take placeon a time scale of years, as is characteristic of the disease process in most HlV infectedindividuals.
We considered two forms of the model. In the first, s the rate of T cell productionfrom precursors is constant. In this case we find that T cell depletion occurs over a periodof one to three years depending on the value of N, the number of new virions producedby an infected CD4+ T cell (Fig. 2). However, the number of latently infected cells growsto unrealistically high levels, where over 10% of the T cells are infected. Modifying themodel so that s decreases with increasing viral burden, mimicking the effects of infectionof T cell precursors, we obtain dynamics very reminiscent of clinical data. T cell depletionis now more gradual taking between 3 and 5 years, depending on the value of N (Fig. 10).More importantly, this depletion is accomplished with between 1 in a 100 and 1 in 1000T cells latently infected, and 1 in 104 cells actively infected, precisely the numbers seen inAIDS patients (Schnittman et aI., 1989, 1990). In both models, using what we consider tobe realistic parameter values, we find that the T cell level can be depleted to a count ofapproximately 500/mm3 , but not to the < 200/mm3 level seen in many AIDS patients.
Modifications of the model that include more realistic assumptions about the biology ofHlV may correct this deficiency. By increasing N (Fig. 4) or k1 (not shown) more realisticlevels of depletion can be obtained but the rate of depletion becomes unrealistically rapid.This suggests, for example, that if N increases with time, rather than being constant, onemay be able to attain realistic levels of depletion on the correct time scale. Preliminarysimulations (not shown) confirm this. A switch from slow- to rapid-replicating strains ofvirus, which is observed as HlV-infected patients progress from latent to active AIDS,would correspond to an increase in N with time. (Also, a decline in the potential togenerate an immune response to HlV as the disease progresses would in some respectscorrespond to an increase in the effective value of N.) An increase in k1 with time wouldcorrespond to the establishment of a more infectious mutant strain.
26
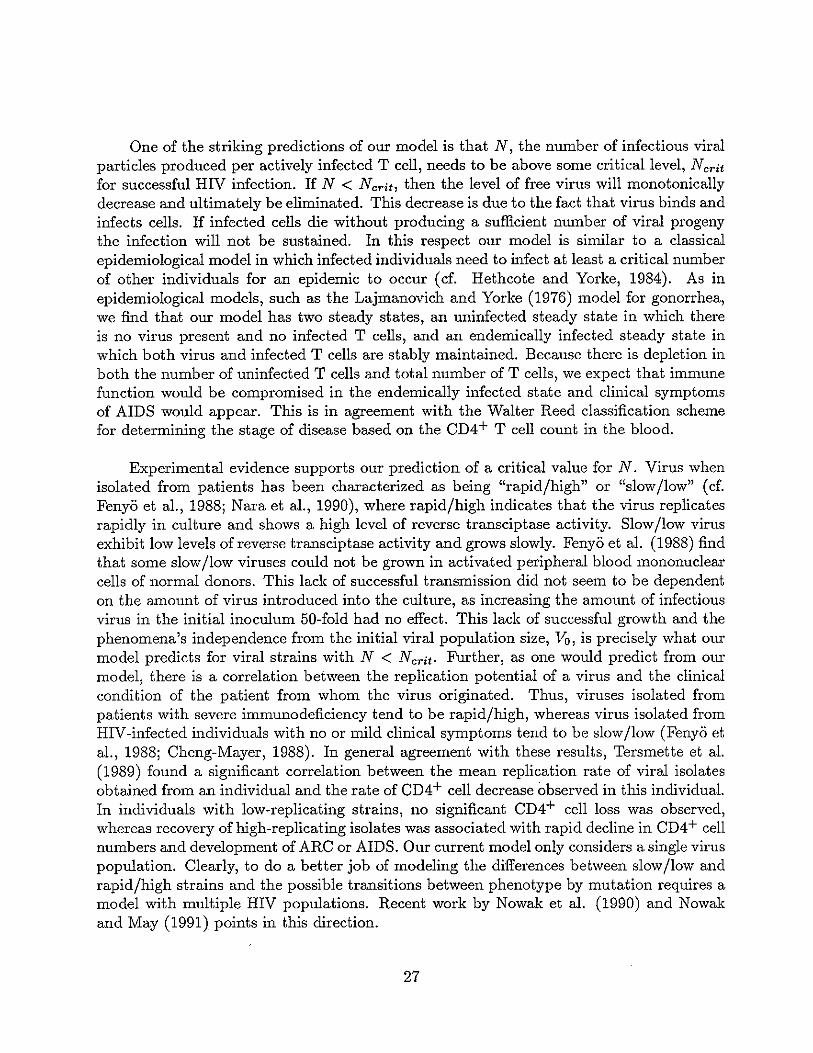
One of the striking predictions of our model is that N, the number of infectious viralparticles produced per actively infected T cell, needs to be above some critical level, Ncr;tfor successful HIV infection. If N < Ncrit, then the level of free virus will monotonicallydecrease and ultimately be eliminated. This decrease is due to the fact that virus binds andinfects cells. If infected cells die without producing a sufficient number of viral progenythe infection will not be sustained. In this respect our model is similar to a classicalepidemiological model in which infected individuals need to infect at least a critical numberof other individuals for an epidemic to occur (d. Hethcote and Yorke, 1984). As inepidemiological models, such as the Lajmanovich and Yorke (1976) model for gonorrhea,we find that our model has two steady states, an uninfected steady state in which thereis no virus present and no infected T cells, and an endemically infected steady state inwhich both virus and infected T cells are stably maintained. Because there is depletion inboth the number of uninfected T cells and total number of T cells, we expect that immunefunction would be compromised in the endemically infected state and clinical symptomsof AIDS would appear. This is in agreement with the Walter Reed classification schemefor determining the stage of disease based on the CD4+ T cell count in the blood.
Experimental evidence supports our prediction of a critical value for N. Virus whenisolated from patients has been characterized as being "rapid/high" or "slow/low" (d.Fenyo et al., 1988; Nara et al., 1990), where rapid/high indicates that the virus replicatesrapidly in culture and shows a high level of reverse transciptase activity. Slow/low virusexhibit low levels of reverse transciptase activity and grows slowly. Fenyo et al. (1988) findthat some slow/low viruses could not be grown in activated peripheral blood mononuclearcells of normal donors. This lack of successful transmission did not seem to be dependenton the amount of virus introduced into the culture, as increasing the amount of infectiousvirus in the initial inoculum 50-fold had no effect. This lack of successful growth and thephenomena's independence from the initial viral population size, Vo, is precisely what ourmodel predicts for viral strains with N < Ncr;t. Further, as one would predict from ourmodel, there is a correlation between the replication potential of a virus and the clinicalcondition of the patient from whom the virus originated. Thus, viruses isolated frompatients with severe immunodeficiency tend to be rapid/high, whereas virus isolated fromHIV-infected individuals with no or mild clinical symptoms tend to be slow/low (Fenyo etal., 1988; Cheng-Mayer, 1988). In general agreement with these results, Tersmette et al.(1989) found a significant correlation between the mean replication rate of viral isolatesobtained from an individual and the rate of CD4+ cell decrease observed in this individual.In individuals with low-replicating strains, no significant CD4+ cell loss was observed,whereas recovery of high-replicating isolates was associated with rapid decline in CD4+ cellnumbers and development of ARC or AIDS. Our current model only considers a single viruspopulation. Clearly, to do a better job of modeling the differences between slow/low andrapid/high strains and the possible transitions between phenotype by mutation requires amodel with multiple HIV populations. Recent work by Nowak et al. (1990) and Nowakand May (1991) points in this direction.
27

From the model presented in this paper we conclude that HIV cytopathicity is amajor factor in producing many of the quantitative features of HIV infection. Our modelshows that HIV cytopathicity gives rise to T cell depletion, that it can account for thelong latency from infection to symptomatic disease, and that it can account for the lowlevels of infected T cells seen in seropositive patients. However, infection and direct Tcell killing by a single viral strain, as depicted in the our model, is probably not the onlyfactor involved in T cell depletion. Changes in cytopathicity (i.e. increases in N or k1 ora decrease in {tv) due to the rapid mutation of HIV may also contribute to the observedphenomenology. Further, the killing of uninfected T cells by other mechanisms, such assyncytium formation or autoimmune reactions, is not ruled out by our model. However,our results show that such mechanisms need not play a major role to get the observedquantitative phenomenology.
Acknowledgements
We thank Stephen J. Merrill and James M. Hyman for critical comments and suggestions. This work was performed under the auspices of the U.S. Department of Energy andsupported by the Center for Nonlinear Studies, Los Alamos National Laboratory, and theSanta Fe Institute through their Theoretical Immunology Program, as well as by grantsfrom the University of California Universitywide Task Force on AIDS (R89LANL003) andthe National Institutes of Health (AI28433).
28

Table 1
Dependent Variables Initial or Default Values
T
T*
T**
v
= Uninfected CD4+ cell population size
= Latently infected CD4+ helper cell population size
= Actively infected CD4+ helper cell population size
= HIV population size
1000 mm-3
oo10-3 mm-3
Parameters and Constants
s
r
Tmax
= rate of supply of CD4+ T cells from precursors
= rate of growth for the CD4+ cell population
= maximum CD4+ cell population level
= death rate of uninfected and latently infected CD4+ cells
= death rate of actively infected CD4+ cell population
= death rate of free virus
= rate constant for CD4+ cells becoming infected by free virus
= rate latently infected cells convert to actively infected
= number of free virus produced by lysing a CD4+ cell
= viral concentration needed to decrease s to s /2
10 d- I mm-3
0.03 d-I
1500 mm-3
0.02 d-I
0.24 d-I
2.4 d-I
2.4 x 10⁻⁵ mm3 d-I
3 X 10⁻³ d- I
varies
106
Derived Quantities
Ncrit
= steady state level of CD4+ cells in uninfected individuals
= critical number of viral progeny needed for endemic infection
= k2 + /l-T
= klTo + /l-v
= kIT + /l-v
= r/Tmax
=r-/l-T
29
1000 mm-3
7740.023 d-I
2.424 d-I
2 X 10⁻⁵ d- I
0.01 d- I

Table 2 - Parameters For Oscillations
Parameters and Constants
s
r
Tmax
= rate of supply of CD4+ T cells from precursors
= rate of growth for the CD4+ cell population
= maximum CD4+ cell population level
= death rate of uninfected and latently infected CD4+ cells
= death rate of actively infected CD4+ cell population
= death rate of free virus
= rate constant for CD4+ cells becoming infected by free virus
= rate latently infected cells convert to actively infected
= number of free virus produced by lysing a CD4+ cell
30
10 d-1 mm-3
12 d-1
1500 mm-3
0.06 d-1
0.24 d-1
5 d-1
2.4 mm3 d-1
1.2 X 10⁻⁴ d-1
1200

Figure Captions
Figure 1. Transcritical bifurcation. The steady state values of T are plotted versus N.
Stable steady states are indicated by dark heavy lines, unstable steady states by light lines.
Parameter values are given in Table 1. For N < Neri! = 774, the uninfected steady state
with T = 1000 is stable. At N = Ned!, this state loses its stability and the endemically
infected state with T a decreasing function of N becomes stable.
Figure 2. Dynamics of HIV infection. Parameters are given in Table 1. In each
panel the three curves correspond to three different values of N, the number of infectious
virus particles produced per actively infected cell. Here N eri! = 774 and N = 1000 (*),
N = 1200 (0), N = 1400 (0).
Figure 3. The change in free virus population for different values of N. Parameters
are given in Table 1. For N < N eri! = 774, i.e., N = 600 (*), the virus decays and the
system returns to the uninfected state. For N > Neri!, i.e. N = 1000 (0) the virus grows,
whereas at N = N eri ! (0) the virus remains constant.
Figure 4. The degree of T cell depletion depends upon N. Parameters are given in
Table 1. N = 1500 (*), N = 2000 (0), and N = 3000 (0) are shown. As N increases the
depletion increases but the time until depletion decreases.
Figure 5. The influence of the viral death rate j-t v on T cell depletion. Parameters
are given in Table 1, N = 1400. j-tv = 2.4 d-1 (*); 1.2 d-1 (0), and 0.24 d-1 (0).
Figure 6. The effect of changing the initial viral load. Parameters are given in Table
1, N = 1400, Va = 10-6 (*), 10-4 (0), and 10-2 (0) per mm3 .
Figure 7. Dynamics of the system with parameters set in the oscillatory region given
in Table 2.
Figure 8. Transcritical bifurcation. The steady state values of T are plotted versus N.
Stable steady states are indicated by dark heavy lines, unstable steady states by light lines.
31

Parameter values are given in Table 2. For N < N crit = 502, the uninfected steady state
with T = 1000 is stable. At N = N crit , this state loses its stability and the endemically
infected state with T a decreasing function of N becomes stable. This state quickly loses
its stability at a Hopf bifurcation and then regains stability at a second Hopf bifurcation
at N = 1229.34.
Figure 9. Mapping the region of oscillatory behavior in parameter space. The solid
curve indicates the boundary of stability for the infected steady state. As parameters are
varied, the state goes unstable and then regains its stability via Hopf bifurcations. In the
unstable region, the infected steady state is surrounded by a stable limit cycle. Region of
oscillation in the (a) f-LT - r plane; (b) fl.T - k1 plane; (c) k1 - r plane. Parameters not
varied are given in Table 2, except N = 1229.34.
Figure 10. Viral infection of T cell precursors. The same model as in Fig. 3 is
illustrated except here the source term s decreases with the viral load according to Eq.
(29) with (J = 106. Parameters are as in Table 1, N crit = 774 and N = 1000 (*), N = 1200
(0), N = 1400 (0).
Figure 11. Effects of AZT. At time r = 3 years, N is reduced from N = 1400 (*)to N = 1050 (o),i.e. 75% of its original value, or to N = 350 (0), i.e., 25% of its original
value, to mimic the effects of AZT treatment. Here N crit = 774, so N = 1050 is above
N crit , while N = 350 is well below N crit ' Parameters are as in Table 1.
Figure 12. The quasi-steady state approximation. Illustrated is the solution of Eqs.
(36) for T and T*, with T(O) = 1000 and T*(O) given by (30b) with t = tmin. The algebraic
equations (34) and (35) were used to determine T** and V. Parameters are as in Table 1,
N = 1000 *), N = 1200 (0), N = 1400 (0).
32

References
Abo, T., Kawate, T., Itoh, K and Kumagai, K (1981). Studies on the bioperiodicity
of the immune response. 1. Circadian rhythms of human T, B, and K cell traffic in the
peripheral blood. J. Immunol. 126, 1360-1363.
Albert, J., Abrahamsson, B., Nagy, K., Aurelius, E., Gaines, H., Nystrom, G., and
Fenyo, E. M. (1990). Rapid development of isolate-specific neutralizing antibodies and
consequent emergence of virus variants which resist neutralization by autologous sera.
AIDS, 4, 107-112.
Anderson, R. M. (1989). Mathematical and statistical studies of the epidemiology of
HIV. AIDS 3, 333-346.
Anderson, R. M. and May, R. M. (1989). Complex dynamical behavior in the interac
tion between HIV and the immune system. In Cell to Cell Signalling: From Experiments
to Theoretical Models. A. Goldbeter, ed., Academic Press, New York, pp. 335-349.
Asjo, B., Morfeldt-Manson, L., Albert, J., Biberfeld, G., Karlsson, A., Lidman, K,and Fenyo, E. M. (1986). Replicative capacity of human immunodeficiency virus from
patients with varying severity of infection. Lancet ii, 660-662.
Cheng-Mayer, C., Seto, D., Tateno, M. and Levy, J. A. (1988). Biologic features of
HIV-1 that correlate with virulence in the host. Science 240, 80-82.
Cooper, L. N. (1986). Theory of an immune system retrovirus. Proc. Natl. Acad.
Sci. U.S.A. 83, 9159-9163.
De Boer, R. J. (1983). GRIND: Great Integrator of Differential Equations, Bioinfor
matics Group, University of Utrecht, The Netherlands.
Doedel, E. J. (1981). AUTO: a program for the bifurcation analysis of autonomous
systems. Congo Num. 30, 265-285.
Dolezal, J. and Hraba, T. (1988). Application of the mathematical model of immuno
logical tolerance to HIV infection. Folio Biologica (Praha) 34, 336-341.
Edelman, A. S. and Zolla-Pazner, S. (1989). AIDS: a syndrome of immune dysregu
lation, dysfunction, and deficiency. FASEB J. 3, 22-30.
33
Eisen, H. N. (1980). Immunology,2nd. ed., Harper and Row, Hagerstown, Maryland.
Fauci, A. S. (1986). Current issues in developing a strategy for dealing with the
acquired immunodeficiency syndrome. Proc. Natl Acad. Sci USA, 83, 9278-9283.
Fauci, A. S. (1988). The human immunodeficiency virus: infectivity and mechanisms
of pathogenesis. Science 239, 617-622.
Fenyo, E. M., Morfeldt-Manson, L., Chiodi, F., Lind, B., Grerfelt, A. v., Albert, J.,
Olausson, E. and Asjo, B. (1988). Distinct replicative and cytopathic characteristics of
human immunodeficiency virus isolates. J. Virol. 62, 4414-4419.
Fletcher, J. E., Shrager, R. 1., Bailey, J. J. (1988). A kinetic model of T-lymphocyte
interactions with HIV. Preprint
Folks, T., Kelly, J., Benn, S., Kinter, A., Justement, J., Gold, J., Redfield, R., Sell,
K. W. and Fauci, A. S. (1986). Susceptibility of normal human lymphocytes to infection
with HTLV-III/LAV. J. Immunol. 136,4049-4053.
Freitas, A. A., Rocha, B. and Coutinho, A. A. (1986). Lymphocyte population kinetics
in the mouse. Immunol. Rev. 91, 5-37.
Gelderblom, H. R., Hausmann, E. H. S., Ozel, M., Pauli, G. and Koch, M. A. (1987).
Fine structure of human immunodeficiency virus (HIV) and immunolocalization of struc
tural proteins. Virol. 156, 171-176.
Goedert, J. J., Biggar, R. J., Melbye, M., Mann, D. L., Wilson, S., Gail, M. H.,
Grossman, R. J., DiGioia, R. A., Sanchez, W. C., Weiss, S. H. and Blattner, W. A. (1987).
Effect of T4 count and cofactors on the incidence of AIDS in homosexual men infected
with human immunodeficiency virus. JAMA 257, 331-334.
Gowda, S. D., Stein, B. S., Mohagheghpour, N., Benike, C. J. and Engleman, E. G.
(1989). Evidence that T cell activation is required for HIV-1 entry in CD4+ lymphocytes.
J. Immunol. 142, 773-780.
Gray, D. (1989). T cell and B cell memory are short lived in the absence of antigen.
J. Cell. Biochem. Supp!. 13A, COlO.
34

Gray, D. and Leanderson, T. (1990). Expansion, selection and maintenance of memory
B cell clones. Curro Topics Microbiol. Immunol. 159, 1-17.
Harper, M. E., Marselle, L. M., Gallo, r. c. and Wong-Stall, F. (1986). Detection of
lymphocytes expressing human T-lymphotropic virus type III in lymph nodes and periph
eral blood from infected individuals by in situ hybridization. Pmc. Natl. Acad. Sci USA,
83, 772-776.
Hraba, T. and Dolezal, J. (1989). Mathematical model of CD4+ lymphocyte depletion
in HIV infection. Folio Biologica (Praha) 35,156-163.
Hraba, T., Dolezal, J., and Celikovsky, S. (1990). Model-based analysis of CD4+
lymphocyte dynamics in HIV infected individuals. Immunobiol. 181, 108-118.
Hethcote, H. W. and Yorke, J. A. (1984). Gonorrhea Transmission Dynamics and
Control, Lect. Notes Biomath., vol. 56, Springer-Verlag, New York.
Ho, D. D., R. J. Pomerantz, and J. C. Kaplan. (1987). Pathogenesis of infection with
human immunodeficiency virus. N. Engl. J. Med., 317, 278.
Hoxie, J. A., Alpers, J. D., Rackowski, J. L., Huebner, K., Haggarty, B. S., Cedar
baum, A. J., and Reed, J. C. (1986). Alterations in T4 (CD4) protein and mRNA synthesis
in cells infected with HIV. Science 234, 1123-1127.
Intrator, N., G. P. Deocampo, and L. N. Cooper. (1988). Analysis of immune system
retrovirus equations. In Theoretical Immunology, Part Two, A. S. Perelson (ed.), Addison
Wesley, Redwood City, CA, pp. 85-100.
Kiernan, R., Marshall, J., Bowers, R., Doherty, R. and McPhee, D. (1990). Kinetics
of HIV-1 replication and intracellular accumulation of particles in HTLV-1 transformed
cells. AIDS Research and Human Retrovirus 6, 743-752.
Lajmanovich, A., and Yorke, J. A. (1976). A deterministic model for gonorrhea in a
nonhomogeneous population. Math. Biosciences 28, 221-236.
Lane, H. C. and Fauci, A. S. (1985). Immunologic abnormalities in the acquired
immunodeficiency syndrome. Ann. Rev. Immunol. 3,477-500.
35

Lane, H. C. and Fauci, A. S. (1987). Infectious complications of AIDS. In AIDS:
Modern Concepts and Therapeutic Challenges, S. Broder, ed., Marcel Dekker, New York,
pp. 185-203.
Larder, B. A., Darby, G. and Richman, D. D. (1989). HIV with reduced sensitivity
to zidovudine (AZT) isolated during prolonged therapy. Science 243, 1731-1734.
Layne, S. P., J. L. Spouge, and M. Dembo. (1989). Quantifying the infectivity of
HIV. Proc. Natl. Acad. Sci. USA, 86, 4644-4648.
Leonard, R., Zagury, D., Desportes, 1., Bernard, J., Zagury, J.-F., and Gallo, R. C.
(1988). Cytopathic effect of human immunodeficiency virus in T4 cells is linked to the last
stage of virus infection. Proc. Natl. Acad. Sci. USA 85, 3570-3574.
Malone, J. L., Simms, T. E., Gray, G. C., Wagner, K. F., Burge, J. R. and Burke,
D. S. (1990). Sources of variability in repeated T-helper lymphocyte counts from human
immunodeficiency virus type I-infected patients: Total lymphocyte count fluctuations and
diurnal cycle are important. J. AIDS 3, 144-15l.,
Margolick, J. B., Volkman, D. J., Folks, T. M. and Fauci, A. S. (1987). Amplification
of HTLV-Ill/LAV infection by antigen-induced activation of T cells and direct suppression
by virus oflymphocyte blastogenic responses. J. Immunol. 138, 1719-1723.
McLean, A. (1988). HIV infection from an ecological viewpoint. Theoretical Immunol
ogy, Part Two, A. S. Perelson, ed., Addison-Wesley, Redwood City, CA, pp. 77-84.
McLean, A. R. and Kirkwood, T. B. L. (1990). A model of human immunodeficiency
virus infection in T helper cell clones. J. Theoret. Bioi. 147, 177-203.
Merrill, S. (1987). AIDS: Background and the dynamics of the decline of immuno
competence. In Theoretical Immunology, Part Two, A. S. Perelson, ed., Addison-Wesley,
Redwood City, CA, pp. 59-75.
Merrill, S. (1989). Modeling the interaction of HIV with cells of the immune response.
In Mathematical and Statistical Approaches to AIDS Epidemiology, C. Castillo-Chavez, ed.,
Lect. Notes in Biomath., Vol. 83, Springer-Verlag, New York, pp. 371-385.
Murray, J. D. (1989). Mathematical Biology. Springer-Verlag, New York.
36

Nara, P. L., Smit, L., Dunlop, N., Hatch, W., Merges, M., Waters, D., Kelliher, J.,
Gallo, R C., Fischinger, P. J. and Goudsmit, J. (1990). Emergence of viruses resistant
to neutralization by V3-specific antibodies in experimental human immunodeficiency virus
type 1 IIIB infection of chimpanzees. J. Virol. 64, 3779-3791.
Nelson, G. W. and Perelson, A. S. (1992). A mechanism of immune escape by slow
replicating HIV strains. J. AIDS (in press).
Nowak, M. A. and May, R. M. (1991). Mathematical biology of HIV infections:
Antigenic variation and diversity threshold. Math. Biosci. 106, 1-21.
Nowak, M. A., May, R M. and Anderson, R. M. (1990). The evolutionary dynamics of
HIV-1 quasispecies and the development of immunodeficiency disease. AIDS 4,1095-1103.
Perelson, A. S. (1989). Modeling the interaction of the immune system with HIV,
Mathematical and Statistical Approaches to AIDS Epidemiology, C. Castillo-Chavez, ed.,
Lect. Notes in Biomath., Vol. 83, Springer-Verlag, New York, pp. 350-370.
Phillips, A., Lee, C. A., Elford, J., Janossy, G., Bofill, M., Timms, A. and Kernoff, P.
B. A. (1989). Prediction of progression to AIDS by analysis of CD4lymphocyte counts in
a haemophilic cohort. AIDS 3, 737-741.
Psallidopoulos, M. C., Schnittman, S. M., Thompson, L. M., Baseler, M., Fauci, A.
S., Lane, H. C., and Salzman, N. P. (1989). Integrated proviral human immunodeficiency
virus type 1 is present in CD4+ peripheral blood lymphocytes in healthy seropositive
individuals. J. Virol. 63, 4626-4631.
Purcell, E. M. (1977). Life at low Reynolds number. Am. J. Phys. 45, 3-11.
Redfield, R. R, Wright, D. C. and Tramont, E. C. (1986). The Walter Reed Staging
classification for HTLV-III/LAV infection. N. Engl. J. Med. 314, 131-132.
Reibnegger, G., Fuchs, D., Hausen, A., Werner, E. R., Dierich, M. P. and Wachter, H.
(1987). Theoretical implications of cellular immune reactions against helper lymphocytes
infected by an immune system retrovirus. Proc. Nail. Acad. Sci. USA, 84, 7270-7274.
Schnittman, S. M., Psallidopoulos, M. C., Lane, H. C., Thompson, L., Baseler, M.,
Massari, F., Fox, C. H., Salzman, N. P. and Fauci, A. S. (1989). The reservoir for HIV-1
37

in human peripheral blood is a T cell that maintains expression of CD4. Science 245,
305-308.
Schnittman, S. M., Greenhouse, J. J., Psallidopoulos, M. C., Baseler, M., Salzman,
N. P., and Fauci, A. S. (1990). Increasing viral burden in CD4+ T cells from patients
with human immunodeficiency virus (HIV) infection reflects rapidly progressive immuno
suppression and clinical disease. Ann. Int. Med. 113, 438-443.
Somasundaran, M. and Robinson, H. 1. (1988). Unexpectedly high levels of HIV-1
RNA and protein synthesis in a cytocidal infection. Science 242, 1554-1557.
Taylor, J. M. G., Fahey, J. L., Detels, R. and Giorgi, J. V. (1989). CD4 percentage,
CD4 number and CD4:CD8 ratio in HIV infection: Which to choose and how to use. J.
AIDS 2,114-124.
Tersmette, M., Gruters, R. A., de Wolf, F., de Goede, R. E. Y., Lange, J. M. A.,
Schellekens, P. T. A., Goudsmit, J., Huisman, H. G. and Miedema, F. (1989). Evidence
for a role of virulent human immunodeficiency virus (HIV) variants in the pathogenesis of
acquired immunodeficiency syndrome: Studies on sequential HIV isolates. J. Virol. 63,
2118-2125.
Tindall, B. and Cooper, D. A. (1991). Primary HIV infection. AIDS 5, 1-14.
Weiss, L. (1972). The Cells and Tissues of the Immune System. Prentice-Hall, En
glewood Cliffs, New Jersey
Wiggins, S. (1990). Introduction to Applied Nonlinear Dynamical Systems and Chaos,
Springer-Verlag, New York.
Willems, J. L. (1970). Stability Theory of Dynamical Systems, Wiley, New York.
Wu, L., Scollay, R., Egerton, M., Pearse, M., Spangrude, G. J. and Shortman, K.
(1991). CD4 expressed on earliest T-lineage precursor cells in adult murine thymus. Nature
349,71-74.
Zack, J. A., Arrigo, S. J., Weitsman, S. R., Go, A. S., Haislip, A. and Chen, 1. S.
y. (1990). HIV-1 entry into quiescent primary lymphocytes: Molecular analysis reveals a
labile, latent viral structure. Cell 61, 213-222.
38

200015001000500o
o
2000
T 1000 I---------.,;~----------j
N

103 1000
102
'00
10' Vl
-'-'
"'Vl 100 U::> ... 800
'" ....> 10-1 0
"' "'...."' U
'" 10-2 "' 700"- "-
Z
z10-3 ::>
600
10-'
10-5 5000 2 3 4 5 6 7 8 , 10 0 2 3 4 5 , 7 8 , 10
YEARS YEARS
103 10 '
102 100V> V>-' -'-' -'W 10 '
w 10- 1U U
... .......100 ....
10-20 0w w.... ....U 10-1 U 10-3w "'"- "-Z Z
>-10-2
>-10-4
~ -'.... Wz 10-3 > 10-5w.... ....« u~ «
10-4 10-6
10-5 10-70 2 3 4 5 6 7 8 , 10 0 2 3 4 5 6 7 8 , 10
YEARS YEARS
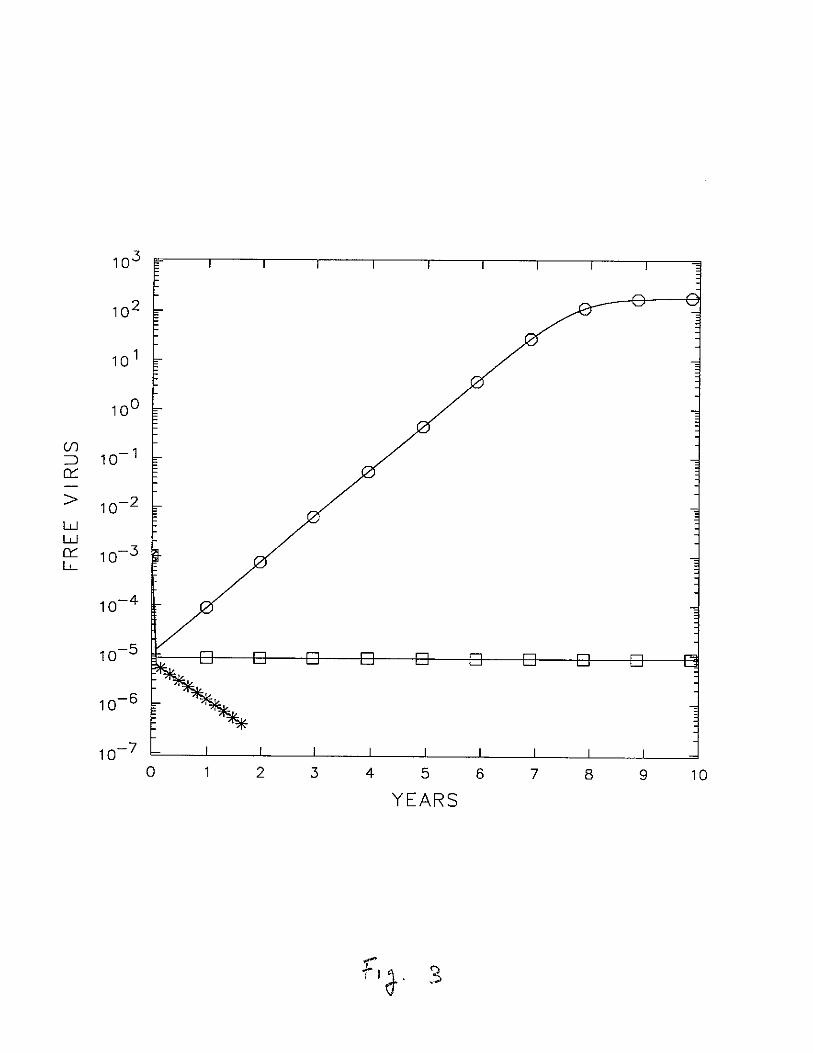
10 3
10 2
10 1
100
Ul10- 1
~
0:::
> 10-2
WW0::: 10-3u...
10-4
10-5
10-6
10-7
0 2 3 4 5 6 7 8 9 10
YEARS

'\ \I I I I I I I
- -
- -
I- CD -
I- -,,
I- '" ':::.
I-~ - - - ~ ~ - ...=
(g/ '-' '-' L.J -= L.J '-' L.J L
I- -
- ~ ~ ~ ~ ~ ~ ~
,V '--' '-' '-" '-' '-' '-" '-' '-' '-'
I I I I I I I I
1000
900
(/) 800-l-lWU 700~
I-
0 600wI-Uw
500l...LZ
Z=:> 400
300
200a 2 3 4 5
YEARS
6 7 8 9 10
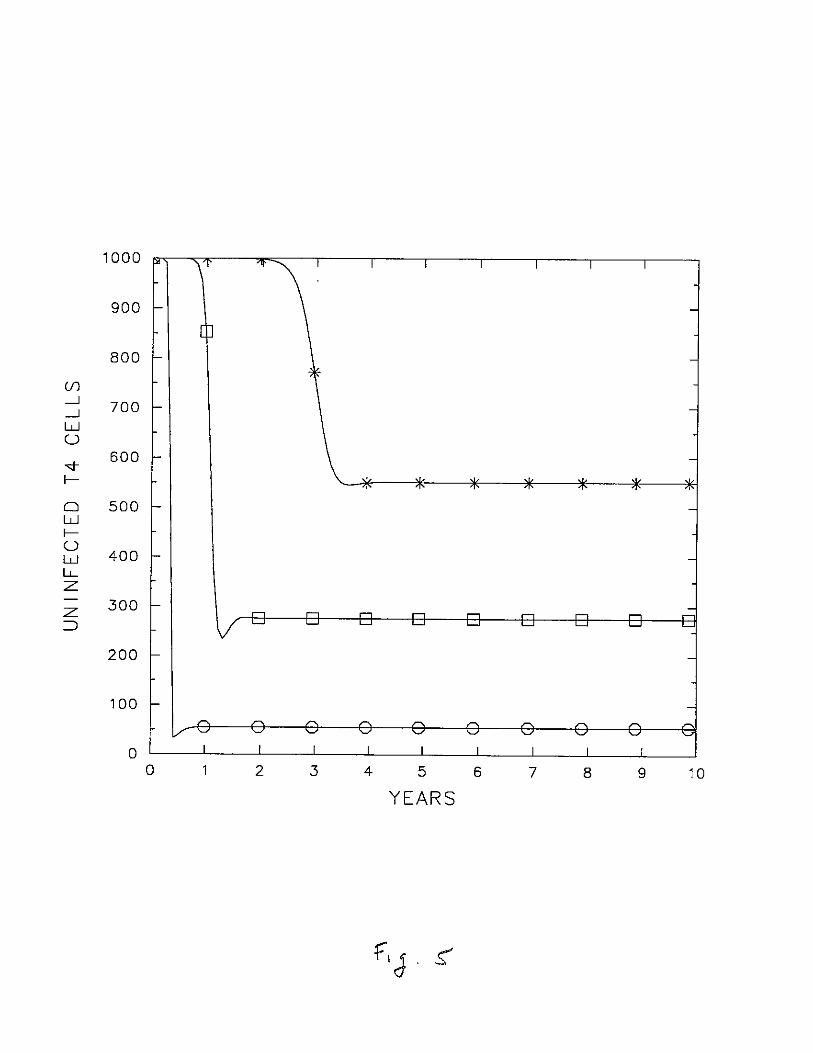
I" T '. I I I I I I I
~
f- -
[J
r- -
f- -
f- -
."-'" 0'
f- -
I- -
r-~ ~ ~ ~ ~ ~ ~ ~ ...::;
V ~ ~ ~ ~ ~
r- -
f- -
~ ~ ~ ~ ~ ~ ~ ~ ~ ~
v~ ~ '-/ '-/ '-/ '-/ '-/ ~ '-'
I I I I I I I I I
1000
900
800
U1-.J 700-.JWU
-<;J-600
f-
a 500wf-U
400Wl.J....Z
Z 300=:J
200
100
aa 2 3 4 5
YEARS
6 7 8 9 10

'03 1000
'02
'00
10' Vl-'-'W
Vl '00 u::> ... BOO
'" ~
> 10-1 "w w~w u
'" 10-2 w 700"- "-
Z
Z10-3 ::>
.00
10-4
10-5 500° 2 3 • 5 • ° 2 3 • 5 •
YEARS YEARS
'03 '0'
102 '0°Vl Vl-' -'-' -'W 10 '
W 10- 1U U
... ...~
10°~
10-2
" "W W~ ~
U 10-1 U 10-3w w"- "-Z Z
>-10-2
>-10-4
-' -'~ WZ
10-3 > 10-5W.... ...."" U-' ""'0-" 10-6
10-5 10-70 2 3 • • ° 2 3 • 5 •
YEARS YEARS

102 1600
1\ \ \ 1400 '\100
'" 1200-'-'W
'"<.> 1000
:::> 10-2 ....'" ~
> '" BOOw w
~w <.>'" 10-4
W"- "- BOOzz:::> '00
10-5
200
10-8 0.0 .5 1.0 1.5 2.0 2.5 3.0 .0 .5 1.0 1.5 2.0 2.5 3.0
YEARS YEARS
10' 10 '
'" '" 10- 1-' -'-' -'W w<.> <.>
.... 10-1 .... 10-3~ ~
'" '"W W~ ~
<.> <.> 10-5w w"- "-Z Z
>- 10-6 >- 10-7-' -'... WZ >w... ...« <.>
10-9-' «
10- 11 10-11.0 .5 1.0 1.5 2.0 2.5 3.0 .0 .5 1.0 1.5 2.0 2.S 3.0
YEARS YEARS

I-
2000 f-
1000
oo
,"-
500
N
1000
-
1500

0.15 rl------------J
f-
::t 0.10
0.05 - .
Oscillations
25
r
-
-
50

0.15
0.10 Oscillations
0.05
0.000.0 5.0 10.0
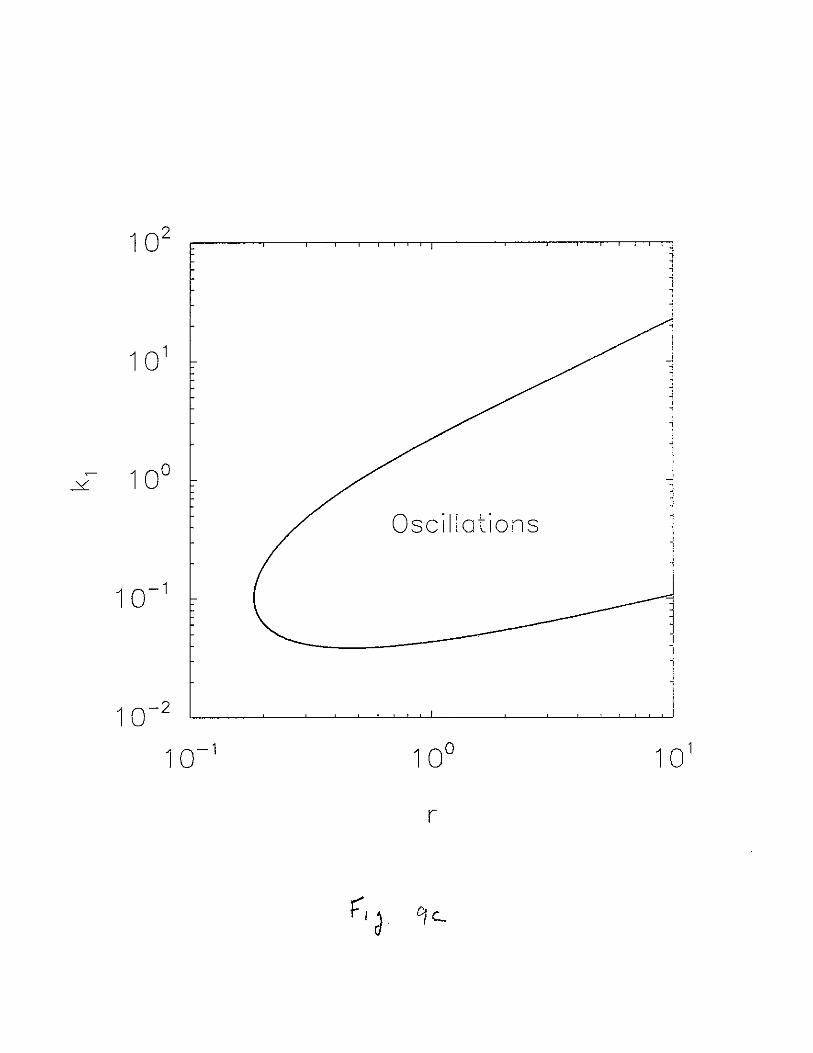
Oscillations
r

102 '000
'0 '900
Vl'00 -'
-'W
Vlu
:::>10- 1 ... 800
'" ....;; C
Ww
10-2 ....w U
'" w 700"- "-
Z
10-.3 Z:::>
600
10-04
10-5 5000 2 3 4 5 8 7 8 9 10 0 2 3 4 5 , 7 8 9 '0
YEARS YEARS
'0' 10- 1
Vl 100 Vl 10-2~ -'-' -'W WU U
... 10- t ... 10-3.... ....C CW W.... ....U 10-2 U 10-"w w"- "-Z Z
>- 10-3 >- 10-5-' -'.... WZ >W.... ....« 10-4 U
10-6-' «
10-5 10-7
0 2 3 4 , , 7 8 9 '0 0 2 3 4 5 , 7 8 9 '0
YEARS YEARS
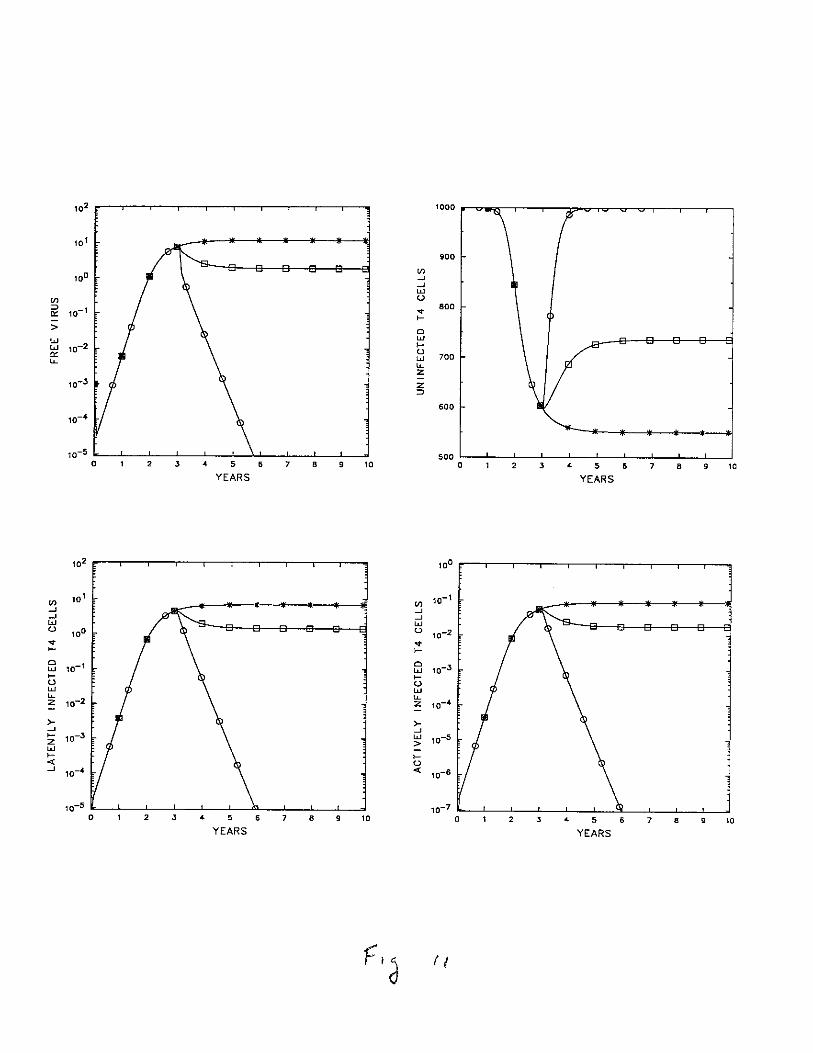
'02 1000
'0 ''00
Vl100 --'
--'W
Vl u::>
10- 1 ... 8000: >-> '"Ww
10-2 >-w U0: w 700"- "-
Z
10-3-Z::>
600
10-4
10-5 5000 2 3 • 5 6 7 a , '0 0 2 3 • 5 , 7 a , 10
YEARS YEARS
102 100
Vl 10' til10- 1
-' --'-' --'W WU
100 U 10-2... ...>- >-
'" 10- 1 '" 10-3w w>- >-U Uw w"-
10-2 "-10-4Z Z
>- >--' --'>- 10-3 w 10-5Z >W>- >-
'" U--' 10-4 '" 10-6
10-5 10-7
0 2 3 • 5 , 7 a , 10 0 2 3 • 5 , 7 a , 10
YEARS YEARS

to,87456
YEARS,2
\\
~
10
500o
700
'00
600
800
100010'
t02
'0 ' Vl-'-'W
Vl tOO '-'=> ...'" ....> 10- 1 CW W....W '-''" 10-2 W"- "-
Z
Z10-3 ::>
10-4
10-5
0 2 , 4 5 6 7 8 , 10
YEARS
10' tO '
t02 tOOVl Vl-' -'-' -'W tot W 10-1'-' '-'... .......
tOO....
10-2C CW W.... ....'-' 10-1 '-' 10-3W W"- "-Z Z
>-10-2
>-10-4 ~
-' -'
~.... WZ 10-.3 > 10-5w.... ...... '-'-' ..
10-4 10-6
10-5 10-70 2 , 4 5 6 7 8 , to 0 2 , 4 5 6 7 8 , to
YEARS YEARS
(, <j
d


![Enhanced Separation and Counting of CD4+ T Lymphocytes from … … · widely available [1-3]. Monitoring the progression of HIV infection is particularly important in determining](https://img.pdfslide.us/doc/110x75/5f9c87dd87abf0447f68afbd/enhanced-separation-and-counting-of-cd4-t-lymphocytes-from-widely-available.jpg)