Embed Size (px)
Citation preview

1
THE DYNAMIC EFFECTS OF LEADER EMOTIONAL INTELLIGENCE AND ORGANISATIONAL CULTURE ON
ORGANISATIONAL PERFORMANCE
by
MINNESH BIPATH
Submitted in accordance with the requirements for the degree of
DOCTORATE IN BUSINESS LEADERSHIP
at the
UNIVERSITY OF SOUTH AFRICA
GRADUATE SCHOOL OF BUSINESS LEADERSHIP
PROMOTER: PROFESSOR STELLA NKOMO
JUNE 2007

ii
Declarations Student number: 3006-475-9 I declare that ‘THE DYNAMIC EFFECTS OF LEADER EMOTIONAL INTELLIGENCE AND ORGANISATIONAL CULTURE ON ORGANISATIONAL PERFORMANCE’ is my own work and that all sources that I have quoted have been indicated and acknowledged by means of complete references. ___________________ __________________ Signature Date (Mr. M. Bipath)

iii
Abstract The topic of emotional intelligence (EQ) and organisational culture has attracted
considerable interest from both academics and practitioners for many years. Much of the
interest in the two areas is based on explicit and implicit claims that both leader’s emotional
intelligence and organisational culture are linked to organisational performance. However,
while the links between emotional intelligence and organisational performance and between
organisational culture and organisational performance have been examined independently,
few studies have investigated the association among the three concepts. This study
examines the nature of this relationship and presents empirical evidence that suggests there
is a complex relationship between emotional intelligence, organisational culture and
organisational performance. The study concludes with implications for theory and practice.
Keywords emotional intelligence, leadership, organisational culture, leadership, organisational performance.

iv
JAI SHRI KRISHNA
DEDICATION
This thesis is dedicated to Kesh, Shrimay and Ziya – for all their love and support during
my endeavours.

v
Acknowledgements I would like to express my sincerest thanks to the following people for their invaluable
assistance in this research project.
1. Professor Stella Nkomo (Promoter) o her guidance and expertise,
o for being firm and resolute and yet caring during our discussion stages,
o having made time to critically evaluate and edit my project with an unparalleled sense
of commitment.
You deserve my praise, honour and respect.
2. Dr. Riëtte Eiselen from Statkon, University of Johannesburg, for: o her analysis and explanations of the statistical models and tools.
3. HayGroup o for permission to use the Emotional Competency Inventory (ECI 2.0) questionnaire for
research purposes.
4. Professor Sarros, Monash University o for permission to use his revised Organisational Culture Profile Questionnaire.
5. Eskom Research and Innovation Department o for the research funding.
6. My parents o for teaching me the value and importance of education.
7. My parents in-law
o for their love and moral support throughout the study.
8. To my gurus
o for their guidance and support.

vi
Table of Contents
1 CHAPTER 1: OVERVIEW ........................................................................................... 1
1.1 Introduction ................................................................................................................ 1
1.2 Background to the research problem ...................................................................... 2 1.2.1 Leadership theories – a historical perspective 2 1.2.2 Leadership and EQ 5 1.2.3 Background to the development of emotional intelligence 6
1.3 Statement of the research problem .......................................................................... 9 1.3.1 Major research question 9 1.3.2 Secondary research questions 9
1.4 Aim of the research .................................................................................................. 10
1.5 Research design and methods ............................................................................... 11
1.6 Methodological assumptions .................................................................................. 13
1.7 Demarcation of the research ................................................................................... 13
1.8 Concept clarification ................................................................................................ 14 1.8.1 Emotional intelligence 14 1.8.2 Organisational culture 14
1.9 Defining organisational performance ..................................................................... 16 1.9.1 Measuring organisational performance 17 1.9.2 Organisational performance measures 17
1.10 Approach to data analysis ....................................................................................... 18 1.10.1 Canonical correlation 18 1.10.2 Multiple regression 18
1.11 Significance of the study ......................................................................................... 19
1.12 Outline of the research ............................................................................................ 19
2 CHAPTER 2: LITERATURE STUDY ......................................................................... 21
2.1 Introduction .............................................................................................................. 21
2.2 Leadership and emotional intelligence .................................................................. 22
2.3 Effective leaders have emotional intelligence ....................................................... 24
2.4 Development of the ECI instrument ....................................................................... 25

vii
2.4.1 Approaches to the measurement of emotional intelligence (EQ) 27 2.4.1.1 The impact of self-awareness 29 2.4.1.2 The impact of self-awareness on self-management 29 2.4.1.3 The impact of self-awareness on social awareness 30 2.4.1.4 Self-awareness 31 2.4.2 Emotional intelligence and organisational performance 32 2.4.3 Emotional intelligence (EQ) and organisational culture 34
2.5 Criticism of emotional intelligence ......................................................................... 35
2.6 Leadership and organisational culture .................................................................. 35
2.7 Three theoretical views of organisational culture ................................................. 36
2.8 Leader EQ, organisation culture and organisational life-cycle: A theoretical .......
linkage ....................................................................................................................... 41
2.9 The levels of organisational culture ....................................................................... 44 2.9.1 How do leaders create organisational culture? 52 2.9.2 Primary embedding mechanisms 53 2.9.2.1 What leaders pay attention to, measure, and control on a regular basis 53 2.9.2.2 How leaders react to critical incidents and organisational crisis 54 2.9.2.3 Observed criteria by which leaders allocate scarce resources 55 2.9.2.4 Deliberate role modelling, teaching, and coaching 55 2.9.2.5 Observed criteria for allocation of rewards and status 56 2.9.2.6 Observed criteria for recruitment, selection, promotion, retirement and excommunication 56 2.9.3 Secondary articulation and reinforcement mechanisms 57 2.9.3.1 Organisation design and structure 58 2.9.3.2 Organisational systems and procedures 59 2.9.3.3 Rites and rituals of the organisation 60 2.9.3.4 Design of physical space, facades, and buildings 60 2.9.3.5 Stories about important events and people 60 2.9.3.6 Formal statements of organisational philosophy, creeds, and charters 61
2.10 Measuring organisational culture: Organisational Culture Profile (OCP) ........... 61
2.11 The relationship between organisation culture and organisational .......................
performance .............................................................................................................. 64
2.12 Organisational performance ................................................................................... 70 2.12.1 Performance measurement 70 2.12.2 The balanced scorecard 70
2.13 Conclusion ................................................................................................................ 72
3 Chapter 3: Research design and methodology ..................................................... 75
viii
3.1 Introduction .............................................................................................................. 75
3.2 Research approach .................................................................................................. 75 3.2.1 Scientific beliefs 76 3.2.2 The qualitative and quantitative approaches 78 3.2.3 Research approach selected 81
3.3 Research objectives, problems, hypotheses, constructs, variables and ............
empirical research questions .................................................................................. 83 3.3.1 Problem statement and objectives of the study 83 3.3.2 Research hypotheses 84 3.3.3 Research concepts and constructs 85 3.3.4 Research variables 86
3.4 Research methods ................................................................................................... 89 3.4.1 The study sample 89 3.4.1.1 The study setting 89 3.4.1.2 The organisational business model 90 3.4.1.3 Field Services 91 3.4.1.4 Background to the creation of Field Services Centres and Technical Services Centres 91 3.4.1.4.1 The history of the TSC 91 3.4.1.4.2 Field services centres 92 3.4.1.4.3 Technical services centre (TSC) 92 3.4.1.4.4 Technical services officer (TSO) 93 3.4.1.4.5 TSO key performance areas 93 3.4.1.4.6 Sample selection criteria 94 3.4.1.4.7 The questionnaire 95 3.4.2 Data collection procedures 95 3.4.2.1 Data sources for all variables 95 3.4.2.1.1 Emotional intelligence 95 3.4.2.1.1.1 The emotional competency framework 96 3.4.2.1.1.2 Clustering of competencies 97 3.4.2.1.1.3 The ECI measurement scales 99 3.4.2.1.1.4 Competency levels 99 3.4.2.1.2 Organisational culture 100 3.4.2.1.2.1 The organisational culture profile (OCP) 100 3.4.2.1.2.2 The OCP measurement scales 101 3.4.2.1.3 Organisational performances measures 104 3.4.2.1.3.1 TSC performance measures 104 3.4.2.1.3.2 TSO performance appraisal measures 105 3.4.2.2 Moderator variables 106
3.5 Data analysis .......................................................................................................... 107 3.5.1 Empirical research question 1: What are the basic statistical features of the data? 108 3.5.2 Empirical research question 2: What is the reliability and construct validity of the dimensions of the ECI and OCP instruments? 108 3.5.3 Empirical research question 3: What are the descriptors of ECI, OCP and organisational performance as variables for this sample? 109

ix
3.5.3.1 Assessment of the ECI results 109 3.5.3.2 Assessment of the OCP results 109 3.5.3.3 Assessment of the performance data 109 3.5.4 Empirical research question 4: What is the impact of the moderator variables on the independent and dependent variables? 110 3.5.5 Empirical research question 5: What predictive value can be derived from the independent variables on the dependent variables? 110 3.5.5.1 Canonical correlation study 110 3.5.5.2 Stepwise multiple regression analysis 111
3.6 Sample design and sampling methods ................................................................ 111 3.6.1 Sample population 111 3.6.2 Sampling techniques 112 3.6.3 Sample size 112
3.7 Ethical considerations ........................................................................................... 112
3.8 Chapter summary and conclusions ..................................................................... 114
4 Chapter 4: Results .................................................................................................. 116
4.1 Introduction ............................................................................................................ 116
4.2 Sampling the independent variables .................................................................... 117
4.3 Empirical Question 1: What are the basic statistical features of the data? ...... 118 4.3.1 Descriptive statistics for the ECI instrument 118 4.3.2 Descriptive statistics for the OCP instrument 119 4.3.3 Descriptive statistics for performance 120 4.3.4 Initial data screening 121
4.4 Empirical question 2: What are the reliability and construct validity of the ..........
dimensions of the ECI and OCP instruments ...................................................... 121 4.4.1 Reliability of the ECI and OCP 122 4.4.1.1 Reliability of the ECI instrument 122 4.4.1.2 Reliability of the OCP instrument 123 4.4.2 Construct validation using exploratory factor analysis 124
4.5 Empirical question 3: What are the descriptors of ECI, OCP and organisational .
performance as variables for this sample? ......................................................... 128 4.5.1 Assessment of the ECI and comparison of the ECI results obtained in this study, to the Haygroup norm 128 4.5.1.1 The self-awareness cluster 128 4.5.1.2 The self-management cluster 129 4.5.1.3 Social-awareness cluster 131 4.5.1.4 Relationship management cluster 132 4.5.2 Assessment of the OCP and comparison of the OCP sample results to the Australian Norm 133
x
4.5.3 Assessment of performance 135 4.5.3.1 Assessment of the TSO performance appraisal scores 135 4.5.3.2 Assessment of the TSC performance scores 135
4.6 Empirical question 4: What are the effects of the moderator variables on ............
the dependent and independent variables? (ECI, OCP and organisational .........
performance) .......................................................................................................... 136 4.6.1 Moderator variables 136 4.6.2 Moderator variables on ECI 136 4.6.3 Moderator variables on OCP 138 4.6.4 Moderator variables on organisational performance 139 4.6.5 Conclusion regarding moderator variables when applied to ECI, OCP and organisational performance 141
4.7 Empirical question 5: What predictive value can be derived from the ...................
independent variables on the dependent variables? .......................................... 141 4.7.1 Canonical correlations 142 4.7.1.1 Objectives of canonical correlation analysis 142 4.7.1.2 Deriving the canonical functions and assessing overall fit 143 4.7.1.3 Statistical and practical significance 146 4.7.1.4 Redundancy measure of shared variance 147 4.7.1.5 Canonical loadings 149 4.7.1.6 Canonical correlation conclusions 155 4.7.2 Multiple stepwise regression 156 4.7.2.1 Objectives of multiple regression 156 4.7.2.2 Research design of a multiple regression 157 4.7.2.3 Assumptions in multiple regression 158 4.7.2.4 Estimating the regression model 158 4.7.2.5 Interpreting the regression variate 159 4.7.2.5.1 Variable information 159 4.7.2.5.2 Computing bivariate correlations 160 4.7.2.6 Interpreting the multiple stepwise regressions between ECI and TSO performance 163 4.7.2.7 Interpreting the multiple regression between organisational culture and TSO performance 168 4.7.2.8 Interpreting the multiple stepwise regression between emotional competency and organisational culture on TSO performance 171 4.7.2.9 Multiple regression conclusions 176
4.8 Summary of analysis ............................................................................................. 177
5 Chapter 5: Discussions, conclusions and recommendations ........................... 179
5.1 Introduction ............................................................................................................ 179
5.2 Empirical findings .................................................................................................. 180 5.2.1 Emotional intelligence 180

xi
5.2.1.1 Self-awareness cluster 180 5.2.1.2 Self-management cluster 181 5.2.1.3 Social awareness cluster 181 5.2.1.4 Relationship management cluster 182 5.2.2 Moderator variables applied to ECI using t-Test 182 5.2.3 What EQ dimensions distinguish effective leaders? 183
5.3 Organisational culture ........................................................................................... 184 5.3.1 Moderator variables applied to organisational culture using t-Test 185
5.4 Organisational performance ................................................................................. 186 5.4.1 Moderator variables on organisational performance 186
5.5 EQ and organisational performance .................................................................... 187
5.6 Organisational culture and organisational performance ................................... 188
5.7 EQ and organisational culture .............................................................................. 189
5.8 EQ and organisational culture on organisational performance......................... 190
5.9 Study contributions ............................................................................................... 191
5.10 Study limitations .................................................................................................... 192
5.11 Recommendations for further research ............................................................... 193
5.12 Conclusions ............................................................................................................ 194
6 Bibliography ........................................................................................................... 195
7 Appendix A: The Technical Services Officer (TSO) Questionnaire ................... 223
8 Appendix B: The FSAM and FSE Questionnaire ................................................. 228
9 Appendix C: The TSC staff Questionnaire ........................................................... 233
10 Appendix D: List of Technical Services Centres ................................................. 238
11 Appendix E: Descriptive statistics for the ECI, OCP and Organisational ..............
Performance ........................................................................................................... 244
12 Appendix F: Details regarding moderator variables ........................................... 259

xii
13 Appendix G: Moderator variables applied to ECI, OCP and Organisational ..........
Performance using t-Test ...................................................................................... 267
14 Appendix H: Criteria for the significance of factor loadings.............................. 327
15 Appendix I : Approvals from the HayGroup for the use of the ECI 2.0 ............. 328
16 Appendix J: Approvals from Prof. Sarros for the use of his modified OCP ..........
instrument ............................................................................................................... 330
17 Appendix K: ECI 2.0 Accreditation ....................................................................... 331

xiii
List of tables
Table Name Page No.
1.1 Historical development of leadership theory 3
2.1 The five components of emotional intelligence at work 25
2.2(a+b) The impact of self-awareness on self-management 30
2.3(a+b) The impact of self-awareness on social-awareness 30/31
2.4 Empirical studies related to the 3 perspectives of organisational culture 40
2.5 The steps of external adaptation and survival, internal integration issues
and deeper dimensions around which basic underlying assumptions
form
49
2.6 Organisational culture embedding mechanisms 52
2.7 Dimensions of organisational culture and their properties 62
3.1 Difference between the quantitative and qualitative research paradigms 77
3.2 Differences between the quantitative and qualitative research
approaches
79
3.3 Differences between the quantitative and qualitative research
processes
80
3.4 The organisation’s operating model 90
3.5 Dimensions of organisational culture and their properties 103
4.1 Descriptive statistics for the ECI questionnaire completed by the ‘Total
Others’ score
118
4.2 Descriptive statistics for the OCP questionnaire completed by the ‘Total’
score
120
4.3a Descriptive statistics for TSO performance appraisal 120
4.3b Descriptive statistics for TSC performance 121
4.4 Cronbach’s alpha coefficient for Total Others ECI 2.0 ratings and scores
taken for this study
122
4.5 Cronbach’s alpha coefficient for the OCP ratings and scores taken for
this study
123
4.6 Measures of sampling adequacy and Bartlett’s test for emotional
competency inventory (ECI)
125
4.7 Measure of sampling adequacy and Bartlett’s test for the organisational
culture profile (OCP)
126
xiv
Table Name Page No.
4.8 Communalities for the ECI 126
4.9 Communalities for the OCP 127
4.10 Total variance explained for the ECI 127
4.11 Total variance explained for the OCP 127
4.12 Summary of the mean scores for the self-awareness cluster of the ECI
questionnaire
129
4.13 Summary of the mean scores for the self-management cluster of the
ECI questionnaire
130
4.14 Summary of the mean scores for the social-awareness cluster of the
ECI questionnaire
132
4.15 Summary of the mean scores for the relationship management cluster
of the ECI questionnaire
133
4.16 Summary of the OCP questionnaire mean scores of all questionnaires
filled in
134
4.17 Canonical correlation and eigenvalues 144
4.18 Likelihood tests 145
4.19 Multivariate statistics and approximate F tests 146
4.20 Standardised variance of the emotional competency variables
(independent variables)
147
4.21 Standardised variance of the organisational culture variables
(dependent variables)
147
4.22 Correlations between the organisational culture profile variables and
their canonical variables
152
4.23 Correlations between the emotional competency variables and their
canonical variables
152
4.24 Properties of the first dependent/independent variate set 154
4.25 Properties of the second dependent/independent variate set 155
4.26a Description of the ECI variables 159
4.26b Description of the OCP variables 160
4.27 Pearson correlation between ECI and organisational performance 162
4.28 Pearson correlation between OCP and organisational performance 162
4.29 The relationship between ECI and organisational performance: 163

xv
Table Name Page No.
Variables entered/removed
4.30 The relationship between ECI and organisational performance: Model
summary
164
4.31 The relationship between ECI and organisational performance: ANOVA 165
4.32 The relationship between ECI and organisational performance:
Coefficients
166
4.33 The relationship between ECI and organisational performance:
Collinearity diagnostics
167
4.34 The relationship between OCP and organisational performance:
Variables entered/removed
168
4.35 The relationship between OCP and organisational performance: Model
summary
169
4.36 The relationship between OCP and organisational performance:
ANOVA
169
4.37 The relationship between OCP and organisational performance:
Coefficients
170
4.38 The relationship between OCP and organisational performance:
Collinearity diagnostics
171
4.39 The relationship between ECI and OCP on organisational performance:
Variables entered/removed
172
4.40 The relationship between ECI and OCP on organisational performance:
Model summary
173
4.41 The relationship between ECI and OCP on organisational performance:
ANOVA
174
4.42 The relationship between ECI and OCP on organisational performance:
Coefficients
175
4.43 The relationship between ECI and OCP on organisational performance:
Collinearity diagnostics
176

xvi
List of figures
Figure Name Page No.
2.1 How emotional intelligence is developed 3
2.2 Diagrammatic representation of Schein’s organisational life cycle
model
44
2.3 Levels of organisational culture 45
3.1 The research variables 87
3.2 Regional field services organisational chart 91
4.1 Study sample 117
4.2 Moderator variables applied to ECI using t-Test 136
4.3 Results of moderator variables applied to the ECI dimensions using
t-Test
137
4.4 Moderator variables applied to OCP using t-Test 138
4.5 Results of moderator variables applied to the OCP using t-Test 139
4.6 Moderator variables applied to TSO performance scores using t-
Test
139
4.7 Results of moderator variables applied to TSO performance score
using t-Test
140
4.8 Empirical relationship among ECI, OCP and organisational
Performance
141
4.9 Relationship between ECI and OCP 142
4.10 First dependent/independent variate set 153
4.11 Second dependent/independent variate set 155
4.12 The relationship between ECI and organisational performance 163
4.13 The relationship between organisational culture and organisational
performance
168
4.14 The relationship between ECI and OCP on organisational
performance
171

1
1 CHAPTER 1: OVERVIEW
1.1 Introduction
In the last few years, two organisational concepts, emotional intelligence and organisational
culture, have attracted much scholarly interest in respect to their potential effects on the
success and superior performance of organisations. Organisational culture has received
much attention in the last two decades due to its effects and potential impact on
organisational success (Rashid, Sambasivan & Johari, 2002: 708). The pioneering work of
Deal and Kennedy (1982) incited the interest of researchers in the concept of organisational
culture, and how these values and philosophy guide employees’ behaviour in the
organisation towards greater success.
A lot of scholarly attention has been focused on the hypothesis that strong cultures, defined
as “a set of norms and values that are widely shared and strongly held throughout the
organisation” (O’Reilly & Chatman, 1996; Van de Post, De Coning & Smit, 1998; Rasid, et
al., 2003; Ogaard, Larsen & Marnburg, 2005), enhanced organisational performance. Schein
(1985) argued that the role of leader was fundamental in the process of creating this strong
culture of the organisation. This hypothesis was based on the intuitively powerful idea that
organisations benefit from having highly motivated employees dedicated to common goals
(Peters & Waterman, 1982; Deal & Kennedy, 1982; Kotter & Heskett, 1992; Ogaard, et al.,
2005). The organisational performance benefits of a strong culture were thought to derive
from three consequences of having widely shared and strongly held norms and values:
enhanced coordination and control within the organisation, improved goal alignment between
the organisational members and the increased employee effort. In support of this argument,
quantitative analyses have shown that organisations with strong cultures outperform
organisations with weak cultures (Kotter & Heskett, 1992; Gordon & DiTomaso, 1992; Burt,
Gabbay, Holts & Moran, 1994).
Research during the last twenty five years has consistently pointed to a set of competencies
– some purely cognitive but most emotional – such as self confidence, initiative and
teamwork as making a significant difference in the performance of individuals. These
competencies represent what is called emotional intelligence and are believed to be
predictive of superior performance in work roles (Goleman, 2001). Increasing attention has

2
been given to the role of leader emotional intelligence not only in organisational effectiveness
but also in organisational performance (Goleman, 2001).
Goleman, Boyatzis and McKee (2002) have shown the link between EQ and organisational
climate. There is also a small body of work that had examined the relationship between
organisational culture and organisational performance. For example, Higgs and McGuire
(2001) had shown the relationship between individual emotional intelligence and
organisational culture and the relationship between leadership and emotional intelligence.
However, the weaknesses of Higgs and McGuire (2001) study was that it was an exploratory
study and researched only eight companies that provided up to 20 managers to complete
each tool. Denison (1990) as well as Kotter and Heskett (1992) had shown the linkage
between organisational culture and organisational performance. However, no studies have
explored the empirical relationship among leader (EQ), organisational culture and
organisational performance, which is the aim of this study. The researcher also makes a
practical contribution in advancing the understanding of these three relationships in the
Technical Services Centres of a large industrial organisation in South Africa. It is one of the
first studies to empirically test the linkages between the leader’s EQ, organisational culture
and organisational performance. Although these ideas have been primarily theoretically
promulgated, they have not been empirically linked and tested. The novelty and significance
of the present study was confirmed when the researcher had to apply for permission to utilise
Goleman’s well-known and validated EQ measurement tool—the ECI 2.0 (Appendix A, B, C).
The research proposal for the study had to be submitted to an international research
committee for review prior to the granting of permission to use the scale. Subsequently
permission was granted and the significance of the study was endorsed. The background to
the research problem is discussed next.
1.2 Background to the research problem
1.2.1 Leadership theories – a historical perspective
There is little doubt that mankind has been intrigued by the nature of leaders and leadership
since the times of Plato. However, as Goffee and Jones (2000) pointed out, the belief in
rationality, which has dominated our thinking since the enlightenment, was challenged by the
work of Max Weber and Sigmund Freud. This led to the start of a reappraisal of our thinking
3
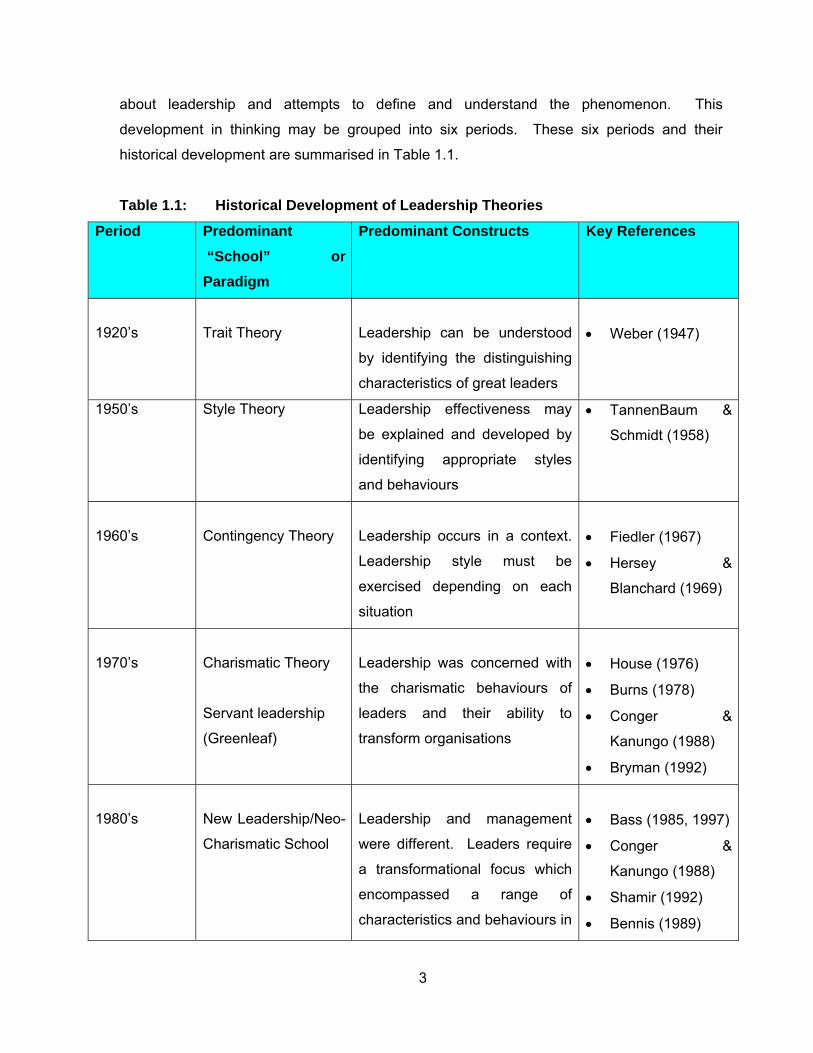
about leadership and attempts to define and understand the phenomenon. This
development in thinking may be grouped into six periods. These six periods and their
historical development are summarised in Table 1.1.
Table 1.1: Historical Development of Leadership Theories
Period Predominant “School” or Paradigm
Predominant Constructs Key References
1920’s
Trait Theory
Leadership can be understood
by identifying the distinguishing
characteristics of great leaders
• Weber (1947)
1950’s Style Theory Leadership effectiveness may
be explained and developed by
identifying appropriate styles
and behaviours
• TannenBaum &
Schmidt (1958)
1960’s
Contingency Theory
Leadership occurs in a context.
Leadership style must be
exercised depending on each
situation
• Fiedler (1967)
• Hersey &
Blanchard (1969)
1970’s
Charismatic Theory
Servant leadership
(Greenleaf)
Leadership was concerned with
the charismatic behaviours of
leaders and their ability to
transform organisations
• House (1976)
• Burns (1978)
• Conger &
Kanungo (1988)
• Bryman (1992)
1980’s
New Leadership/Neo-
Charismatic School
Leadership and management
were different. Leaders require
a transformational focus which
encompassed a range of
characteristics and behaviours in
• Bass (1985, 1997)
• Conger &
Kanungo (1988)
• Shamir (1992)
• Bennis (1989)

4
Period Predominant “School” or Paradigm
Predominant Constructs Key References
addition to charisma • Avolio, Gardner,
Walumbwa,
Luthans & May
(2004)
Late
1990’s
Transcendental
Emerging
Approaches
a) Strategic
Leadership
b) Change
Leadership
c) Emotional
leadership
d) Spiritual
leadership
e) Authentic
leadership
(heavily influenced by
positive psychology)
a) Leadership was
understood by
examination of strategic
decision-making by
executives
b) Leadership was
inexorably linked to the
management of change.
Leader behaviours were
understood in the context
of the work of delivering
change
c) A leader needed to make
sure that not only was he
optimistic, authentic, high
energy mood, but also
that, through his chosen
action, his followers felt
and acted that way, too.
a)Finkelstein &
Hambrick (1996)
b)
• Kotter (1994)
• Higgs & Rowland
(2001b)
• Conner (1999)
C) Goleman, Boyatzis
& McKee (2002)
e) Avolio, et al. (2004)
(Adapted and updated from Higgs and Rowland, 2001a)
The summary provided in Table 1.1 suggests that one “school” gains dominance over
another as understanding develops. In reality this is not the case. For example, the trait
approach continues today, albeit in a refined manner. Goffee and Jones (2000)
acknowledged that their approach to identifying the core aspects of leadership was rooted in
trait theory thinking. However, they have replaced personality elements with an examination

5
and categorizations of leader behaviours and thus changed the initial paradigm. Scholars
like Collins (2001) in his book, Good to Great offers new traits (i.e. humility and personal will)
as the ‘right’ traits for effective leadership.
The long history of leadership research has, according to Kets de Vries (1993), failed to
provide any clear or consistent insight into, or understanding of, the nature of leadership and
the requirements of an effective leader. However, he pointed out that this was perhaps
unsurprising, given that the practical experiences of working with leaders showed that
effective results can be achieved in many different ways.
“The explosion of studies on leadership had made answering the question of which styles
were preferable to others a remarkably difficult business. The more leaders I encountered
the more difficult I found it to describe a typically effective leadership style” (Kets de Vries,
1993; pxi). Other prominent scholars like Yukl (2004) concurred with Kets de Vries’s
observation.
This study does not focus on leadership styles although its linkage is appreciated. The focus
instead is upon Schein’s hypothesis that the leader plays a critical role in the formation of
culture in their organisations. Thus, the interest is not in leadership style but the role of
leadership in the creation of organisational culture. What is relevant from leadership theory is
Goleman’s assertion that effective leaders must possess emotional intelligence (EQ).
Goleman (1998b) clearly emphasised the synonymous relationship of leadership and EQ.
1.2.2 Leadership and EQ
Goleman (1998b) considered leadership and emotional intelligence (EQ) to be imperative for
effective leadership: IQ and technical skills do matter, but mainly as threshold capabilities.
Recent research showed that emotional intelligence was the sin qua non of leadership
(Goleman, 1998b). Without it, a person could have had the best training in the world, an
incisive, analytical mind, and an endless supply of smart ideas, but still would not make a
good leader (Goleman, 1998a: 92).

6
A person with high emotional intelligence has the ability to understand themselves and
others and adapt behaviours to a given context. Individuals with high EQ and thus
demonstrable personal and social competence may be oriented towards a transformational
leadership style with emphasis on motivating and influencing others (Barling, Slater &
Kelloway, 2000; Gardner & Stough, 2002). Research shows that an organisation that was
characterised by EQ had increased cooperation, motivation, and productivity and increased
profits, an association also reflected in transformational leadership literature (Bass, 1990).
1.2.3 Background to the development of emotional intelligence
The roots of the development of the concept of emotional intelligence appear to lie in the
apparent inability of traditional measures of “rational thinking” (e.g. IQ tests, SAT scores,
grades, etc.) to predict success in life. Research indicated that IQ at best contributed about
20% of the factors that determined success in life (Goleman, 1995).
The search for characteristics other than IQ which adequately explained variations in
success is by no means new. Thorndike (1920), in reviewing the predictive power of IQ,
developed, the concept of social intelligence as a means of explaining variations in outcome
measures not accounted for by IQ. The interest in a broader view of the totality of intelligence
was resurrected by researchers such as Gardner and Hatch (1989) who developed and
explored the concept of multiple intelligences and found no significant relationships with IQ
measures. This led to the conclusion that the “other” intelligence proposed by Gardner
(1993) was distinctly a different construct from IQ. Salovey and Mayer (1990) first called this
“other” intelligence emotional intelligence (EQ). EQ represents two of the seven (“multiple”)
intelligences theorised by Gardner (1993), namely interpersonal and intrapersonal
intelligences. Goleman (1995) popularised the concept in his book, as EQ as well as the
notion that EQ might “matter more” than IQ (Tischler, Biberman & McKeage, 2002: 204).
Emotional intelligence (EQ) is described as old wine in new bottles. It was about self-
awareness and empathy, and those were skills that both employees and bosses needed in
building a successful organisation (McGarvey, 1997). In addition, emotional intelligence was
“good old street smarts” which included knowing when to share sensitive information with
colleagues, laugh at the boss’s jokes or speak up in a meeting. In more scientific terms,

7
emotional intelligence could be defined as an array of non-cognitive skills, capabilities and
competencies that influence a person’s ability to cope with environmental demands and
pressures (Martinez, 1997). Skill building in the area of emotional intelligence had lifelong
impact. The urgency among parents and educators to provide these skills was a response to
increased levels of interpersonal discord starting in the early grades, when low self esteem,
early drug and alcohol use, and depression in young children were addressed. In
organisations, its inclusion in training departments helped employees to cooperate better and
increased motivation.
Since Goleman’s (1995) popularisation of emotional intelligence, academics and
practitioners alike have promoted the importance of emotional intelligence to leader
effectiveness. Leadership in the 21st century requires new skills that included those
associated with emotional intelligence. Where past leaders were generally revered for
having hard strong personal qualities, Hawley (1996) suggested that future leaders
demonstrated a greater empathy and concern for people issues and did not rely on position
or rank for their status. Leadership, culture and organisational development were part of the
organisational growth, and issues associated with emotional intelligence cut across the entire
enterprise. Goleman (2000) presented convincing evidence that the most effective leaders
had a repertoire of skills that included those associated with emotional intelligence.
Additionally, Goleman, et al., (2002) illustrated the impact of emotions on organisational
climate and organisational performance. To understand the influence of emotions at work
was to recognise the power of emotional energy to mobilize conflict or determine a sense of
organisational belonging (Collins, 2001). Kets de Vries and Miller (1984) also suggested that
organisational success and failure could be determined by the emotional tone set by the
executive or presumed leader of an enterprise. Therefore emotional intelligence could be
conceptualised as collateral for developing social capital within organisations.
Bennis (1989) wrote that he had discovered EQ was much more powerful than IQ in
determining who emerged as a leader. Gill (2002) stated that planning, organising and
controlling skills were needed by managers while emotional intelligence and behaviour skills
were needed by leaders. Melville-Ross (1999) wrote in the IoD News that there was a
growing recognition of the need for a new type of leadership in order for British business to
be more competitive in the global market. However, there is no general agreement about

8
what this should be, or how it should be developed. He suggests that leadership
development, as distinct from management training, should focus on the emotional
intelligence of the individual. UK industrialist, Sir John Egan (2002) stated that really
inspirational leaders who stood out in a crisis showed that emotional intelligence played a big
role in hard times. Goleman (2001: 23) emphasised that “emotional intelligence was twice as
important as IQ and technical skills….The higher up the organisation you go, the more
important emotional intelligence becomes”.
Organisational culture appeared to be an important dimension which merits attention. The
fact that, in a number of currently successful organisations, the top leadership did not appear
to possess, or demonstrate many aspects of EQ, have been a result of the impact of the
culture of the organisation. There is much evidence that the leadership of an organisation
had a great influence on its culture (Williams, 2002; Finkelstein & Hambrick, 1996).
Diggins (2004) stated that there was a growing evidence of a link between managing ones
own emotions and managing those of other people in her investigation of why EQ was a key
to effective performance. Self-awareness, according to her, was the most fundamental
element in developing emotional intelligence. It is critical to understanding how and why
people react emotionally to different stimuli in the workplace. By building self-awareness,
people could cope better with change.
Leaders must be able to connect with other people in the organisation, not only on an
intellectual platform but also on an emotional basis. Strong emotional reactions to business
decisions and processes could hinder organisational performance. Effective leaders were
expected to modify these reactions, to coach employees to a better level of self-awareness
and hence, organisational performance.
The impact of organisational culture on individual behaviour had long been acknowledged.
However, EQ research is only now helping to explain the link between changing cultural
norms and how people feel about what is required of them in their jobs. This is expressed
through the “psychological contract”, which involves the way people adapt to organisational

9
change. An emotionally intelligent leader is able to address many of the strong feelings that
people expressed during periods of major organisational change in a timely and appropriate
manner.
It is important for organisations to encourage constructive self expression in order to
enhance communication between staff and management, within teams and between teams.
Organisations that discouraged self expression not only restrict communication but also
limited the potential for receiving innovative ideas and creative ways of approaching
challenges from all levels of management and staff. Emotionally intelligent leaders could
help ensure that their employees have effective self expression (Diggins, 2004: 34).
Flexibility was another important prerequisite of high performing individuals, teams and
organisations. It also played an important role in managerial competencies such as decision
making, conflict resolution and negotiation. Emotionally intelligent leaders showed great
flexibility themselves, and encouraged it in others (Diggins, 2004: 34).
Emotionally intelligent leaders are therefore believed to be essential in creating a strong organisational culture for successful organisational performance. The statement of the research problem will be discussed next.
1.3 Statement of the research problem
1.3.1 Major research question
What is the relationship among leader emotional intelligence, organisational culture
and organisational performance?
1.3.2 Secondary research questions
What emotional intelligence (EQ) dimensions distinguish effective leaders from
ineffective leaders?

10
What are the perceptions of the leaders and their staff regarding the strength of the
organisational culture as measured by the Organisational Culture Profile (OCP) in
their organisations?
What competencies of emotional intelligence contribute to organisational
performance?
Is emotional intelligence of the leader a predictor of organisational performance?
What is the relationship between organisation culture and organisation performance?
What is the relationship between leader emotional intelligence and organisational
culture?
What is the impact of age; gender; race; qualifications; tenure of the leader in the
organisation; tenure of the leader in a leadership position in the organisation - on
emotional intelligence (EQ), organisational culture (OC) and organisational
performance?
What is the impact of the number of employees in the organisation (size) and number
of years the organisation existed for - on emotional intelligence (EQ), organisational
culture (OC) and organisational performance?
1.4 Aim of the research
In view of the question formulated above, the general aim of this research project is:
To examine the dynamic effects of leader EQ and organisational culture strength (measured
as values and norms) on the organisational performance.
In order to achieve the general aim of this project the following serve as main hypotheses:
H0: There is no relationship between the dimensions of the leader EQ and the
dimensions of organisational culture on organisational performance.
H1: There is a relationship between at least one dimension of EQ and at least one
dimension of organisational culture on organisational performance.
The sub hypotheses can be stated as:

11
H0a: There is no relationship between the dimensions of EQ and organisational
performance.
H1a: There is a relationship between the dimensions of EQ and organisational
performance.
H0b: There is no relationship between the dimensions of organisational culture and
organisational performance.
H1b: There is a relationship between the dimensions of organisational culture and
organisational performance.
H0c: There is no relationship between any linear combination of the leader EQ dimensions
and any linear combination of the organisational culture dimensions.
H1c: There is a relationship between at least one linear combination of the leader EQ
dimensions and at least one linear combination of organisational culture dimensions.
In view of the preceding problems and aims statements, the methods envisaged to be used
to conduct an empirical test of the hypothesized relationships are presented in the next
section.
1.5 Research design and methods
A research design is a plan or blueprint of how the researcher intends conducting the
research. The research design focuses on the end product: What kind of study is being
planned and what kind of result is aimed at? Research methodology focuses on the
research process and the kind of tools and procedures to be used (Mouton, 2003: 55-56).
In order to achieve the aims of this research, a thorough literature study was done which
formed the basis of the empirical study. This study uses a quantitative research design to
empirically measure the relationships proposed. The first challenge was identifying an
appropriate sample to test the complex relationships hypothesized. Given Schein’s (1984,
1985) theory that organisation culture was created by the leader in the start-up/early growth
phase of its organisational lifecycle, it was imperative to identify a setting where a leader had
been part of a new organisation which was no more than 10 years old and no less than 3
years old. Initially, an effort was made to locate Small Medium Micro Enterprises (SMMEs) in

12
the Gauteng area to be part of the study. This proved impractical for several reasons. There
were too many variables to control and secondly the organisation performance data which
were measured on a standardised basis was not easily obtainable. The final sample for the
study was 118 units known as Technical Service Centres (TSCs) in a large industrial
organisation spread throughout South Africa. These units are geographically dispersed and
each unit is headed by a leader with the title, Technical Service Officer (TSO).
Given the complex nature of the data collection required, the study also necessitated
substantial access and cooperation. EQ was measured by the Emotional Competence
Inventory version 2.0 (hereafter referred to as ECI 2.0). This part of the investigation
highlights the emotional competence of the leaders studied and was compared to the
guideline norms of the HayGroup (HayGroup, 2005a). Secondly organisational culture was
measured by the Organisational Culture Profile (hereafter referred to as OCP). In this study
the OCP, originally developed by O’ Reilly, Chatman and Cadwell (1991) and modified by
Sarros, Gray and Densten (2002), was used to measure the dimensions of organisational
culture. Organisation performance was measured by a performance appraisal system used
by the organisation to rate leaders and a balanced scorecard system that used quantitative
KPIs.
Scientific research is like undertaking a journey. In unpacking this metaphor, one begins to
identify the basic elements of all journeys (Mouton, 1996: 24). A journey has a point of
departure and a destination and the area traversed between these two is called the route. A
journey, and also a scientific inquiry, has at least four facets or dimensions: a traveller, a
destination, a route and a mode of travel.
No one can decide on a particular route or on the appropriate means of transportation
without any knowledge of the destination. The kind of journey is also determined by existing
knowledge about the destination and, by the route. The more you know about where you are
heading and how to get there, the more planning you can put into the journey. The less you
know, the more you have to allow for the unexpected and the less rigid and fixed your
itinerary or journey planner can be (Mouton, 1996: 25). The destination of this journey in this
particular thesis is to improve organisational performance. The researcher (traveller) is
conducting this research with the objective (destination) of achieving improved organisational
performance. The route is to determine the relationship between EQ and organisational

13
culture on organisational performance. The methodology (mode of travel) was through a
quantitative method of investigation.
1.6 Methodological assumptions
The literature on emotional intelligence suggests it is a universal construction and not much
research has been done to examine the effects of demographic variables on EQ (e.g. race,
gender, age). The present study does not take this assumption for granted but has included
these as moderator variables.
1.7 Demarcation of the research
In this thesis, the study was undertaken at the Technical Services Centre (TSC) level in a
single industrial company, geographically dispersed across South Africa. The reason for
choosing a single company is that when testing theory there is a need to limit or control the
number of variables (Mitchell & Jolley, 2007: 439). The choice of a single company kept
vision, strategy, structure, systems, processes, HR practices, finance and marketing
constant. This allowed the researcher to test the empirical relationships between EQ,
organisational culture and organisational performance in this single company but within
multiple sites of relatively newly established entities. Each TSC has a leader who has the
opportunity to influence the organisation culture. The results also indicate differences in the
cultures of the various TSCs. Secondly, studies undertaken by other researchers evaluating
organisational culture (Kotter & Heskett, 1992; Gordon & DiTomaso, 1992; Burt, et al., 1994)
and organisational performance linkages have acknowledged Schein’s assertions regarding
the organisational life cycle, however, they have been loose in applying it. Schein (1985)
says that the strength of the culture is largely created in the early start-up phase of the
organisation. To test this assertion, the study was undertaken in a section of this single
company where the section’s existence was under ten years. Hence the study uses TSCs
as a proxy sample and all the TSCs utilised were in a similar life cycle phase.
The sample population of TSCs within the company is 205. Of this population, a total of 118
TSCs comprising 776 questionnaires were finally analysed. A total of 7 questionnaires was

14
attempted to be completed per TSC. The object of this study is the leader (TSO), hence one
questionnaire was completed by the leader (TSO) – (Appendix A). The second
questionnaire was completed by the leader’s manager (Appendix B), the third questionnaire
was completed by the leader’s peer (Appendix B) and four questionnaires were filled in by a
representation of a cross section of the staff (Appendix C). This satisfied the requirements
of the ECI 2.0 Technical Manual (HayGroup, 2005a) which requires a 360 degree study.
1.8 Concept clarification
1.8.1 Emotional intelligence
What is emotional intelligence?
Goleman (1997) provided a definition of the construct of emotional intelligence, which was
about:
Knowing what you are feeling and being able to handle those feelings without having
them swamp you;
being able to motivate yourself to get jobs done, be creative and perform at your
peak; and
sensing what others are feeling, and handling relationships effectively.
A more concise definition (Martinez, 1997: 72) referred to emotional intelligence as being “an
array of non-cognitive skills, capabilities and competencies that influenced a person’s ability
to cope with environmental demands and pressures”. Emotional intelligence will be
represented as (EQ) throughout this study.
1.8.2 Organisational culture
Culture has been defined in many ways by various authors and researchers. However,
many agree that culture can be referred to as a set of values, beliefs and behaviour patterns
that form the core identity of organisations and help in shaping the employees behaviour
(Deal & Kennedy, 1982; Jones, 1983; Schein, 1992; Kotter & Heskett, 1992; Pheysey, 1993;
Van de Post et al., 1998; Deshpande & Farley, 1999). Organisational culture also acts as a

15
cognitive map that influences the way in which the context is defined, for it provides the
selection mechanisms or norms and values which people enact events (Jones, 1983). It is
also a pattern of beliefs, symbols, rituals, myths, and practices that evolved over time in an
organisation (Pheysey, 1993). Culture is the dominant values espoused by an organisation
or a set of values and assumptions that underlie the statement, “this is how we do things
around here” (Deal & Kennedy, 1982; Quinn, 1988).
According to Van de Post et al. (1998), culture is, to the organisation, what personality is to
the individual. It is a hidden but unifying force that provides meaning and direction. It is also
a system of shared meanings, or systems of beliefs and values that ultimately shapes
employee behaviour.
Schein (1985, 1992) defined organisational culture as a pattern of basic assumptions
invented, discovered or developed by a given group as it learns to cope with its problem of
external adaptation and internal integration. These values are then taught to new members
in the organisation as the correct way to think and feel in relation to those problems. For
Schein (1999), culture is the sum of all the shared, taken for granted assumptions that a
group has learnt throughout its history. Also, culture is determined to be the residue of
success. Culture is also the structure and control system to generate behavioural standards.
A more formal definition of culture that the researcher identifies with is that “organisational
culture is a pattern of basic assumptions that a given group has invented, discovered, or
developed in learning to cope with its problems of external adaptation and internal
integration, and that have worked well enough to be taught to new members as the correct
way to perceive, think and feel in relation to those problems” (Schein, 2004:17).
Organisational culture and organisational climate were often used interchangeably, when in
fact they are different constructs. According to Denison (1996:624), organisational culture
was “the deep structure of organisations, which was rooted in the values, beliefs and
assumptions held by organisational members”. Organisational culture refers to the meanings
inherent in the actions and procedures of organisational commerce and discourse. In
comparison, “climate was often considered as relatively temporary, subject to direct control,
and largely limited to those aspects of the social environment that are consciously perceived
by organisational members”. Climate was a more transient representation of what business

16
is enacted and how it impacted on everyday relationships and transactions. Organisational
culture evolved and is “sufficiently complex to not be manipulated easily”, while climate was
“temporal” and often subjected to manipulation by people with power and influence (Denison,
1996:644). Linking these arguments to the early life cycle, the climate created by the founder
leaders precedes the existence of the group culture. Later, climate would be a reflection and
manifestation of the cultural assumptions, but early in the life of a group climate reflected
only the assumptions of the leaders (Schein, 1985).
1.9 Defining organisational performance
There are three schools of thought that define organisational performance (Armstrong &
Baron, 1998). The results (outputs) school argues that organisational performance is the
outcome of work accomplished of ‘left behind’ and is best connected to strategic objectives
(Bernadin, Kane, Ross, Spina & Johnson, 1995; Kane, 1996). In contrast, Campbell (1990)
asserts that behaviours (inputs) are organisational performance and should be separated
from outputs to avoid being ‘contaminated by system factors’. Hartle (1995) favours a mixed
view of results and behaviours (Armstrong, 2000; Armstrong and Baron, 1998; Williams;
1998) all support Brumback’s (1988: 387) mixed definition:
Performance means both behaviour and results. Behaviour emanates from the performer and transforms performance from abstraction to action. Not just the instrument of results, behaviours are also outcomes in their own right-the product of mental and physical effort applied to tasks-and can be judged apart from results.
Within performance there are three measurement perspectives (Hawkins, 2005; Brett, 2000).
The survival and economic returns perspectives deal with differing forms of purely financial
measures (Drucker, 1989; McConville, 1994) with the excellence approach focusing on
sustainable long term value creation around core competencies that are customer centric
(Peters & Waterman, 1982; Treacy & Wiersma, 1993; Caruana, Pitt & Morris, 1995).
Hawkins (2005) argues that it is the excellence perspectives that is most linked to new age
leadership philosophy.

17
1.9.1 Measuring organisational performance
The literature implies that gains in organisational performance are achieved by innate traits
or by developing EQ and new age leadership competencies (Bass, 1985, 1999; Higgs &
Rowland, 2000; Alimo-Metcalfe & Alban-Metcalfe, 2001; Goleman et al., 2002; Dulewicz &
Higgs, 2003). In the last two decades there has been an academic and practitioner emphasis
encouraging organisations to become performance management (hereafter referred to as
PM) oriented and better equipped to respond to powerful global forces causing
transformational change (Schuler, 1995). PM is deep, wide multidisciplinary and
multifunctional subject the entirety of which is outside the scope of this review; instead the
focus will be on measuring performance, an important part of PM (Armstrong & Baron, 1998;
Williams, 1998; Armstrong; 2000).
1.9.2 Organisational performance measures
The excellence perspectives had given rise to the measurement of financial and non financial
elements and Armstrong (2000) claimed literature consensus focussed around two
measurement systems. The European Foundation for quality management (EFQM) had nine
elements model that was designed for very large organisations and therefore outside the
scope of this review, while more appropriate and widespread is the Balanced-Score-Card
(BSC) developed by Kaplan and Norton (1992, 2004). The BSC system is made up of four
perspectives and is at its optimum use when the customer, internal, innovation and learning
and financial dimensions are relevantly cascaded through each layer of the organisation
down to individual people. The BSC creates an impetus for employees’ behaviour to align
with the objectives at each layer and generate the necessary resources, skills, actions,
learning and feedback to successfully perform, ensuring that such a cumulative effort
delivers organisational strategy. In the organisation studied in this thesis, BSC was used as
a method of measuring organisational performance. It is intended that the balance scorecard
Key Performance Indicators (KPIs) are cascaded through all levels of the organisation,
aligning strategy.
In this study two measures of organisational performance were evaluated namely the TSC
competition scores and the TSO performance appraisal scores. Finally, only the TSO

18
performance appraisal scores gave reasonable correlation values and were used in the final
analysis.
1.10 Approach to data analysis
The analysis of the data was done using SPSS (14) and SAS 9.3 package to answer the
empirical research questions below:
• Empirical question 1: What are the basic statistical features of the data?
• Empirical question 2: What is the reliability and construct validity of the dimensions
of the ECI and OCP instruments?
• Empirical question 3: What are the descriptors of ECI, OCP and organisational
performance as variables for this sample?
• Empirical question 4: What is the impact of the moderator variables on the
independent and dependent variables?
• Empirical question 5: What predictive value can be derived from the independent
variables on the dependent variables?
The main statistical test performed in the study will be discussed next.
1.10.1 Canonical correlation
With canonical analysis the objective is to correlate simultaneously several metric dependent
variables and several metric independent variables. The underlying principle is to develop a
linear combination of each set of variables (both dependent and independent) to maximise
the correlation between the two sets (Hair, Anderson,Taham & Black, 1998).
1.10.2 Multiple regression
Multiple regression is the appropriate method of analysis when the research problem
involves a single metric dependent variable presumed to be related to two or more
independent variables. The objective of multiple regression analysis is to predict the changes

19
in the dependent variable in response to changes in the independent variable. This objective
is most often achieved through the statistical rule of least squares (Hair et al., 1998).
1.11 Significance of the study
The major contribution of this study is that it is the first empirical test of the relationships
among EQ, organisation culture and organisational performance. While these have been
measured in two-way relationships, there is no research that has attempted to establish
these linkages, especially in the context of Schein’s (1983) seminal theory that organisational
culture strength is critical for organisational performance in the early years of an
organisation’s life cycle. The results of this research reveal a number of complex linkages.
On a practical level, the implications of the findings of this study suggest the development of
a leader’s EQ is important in establishing strong organisational cultures which according to
Schein is essential in the early stages of an organisation.
1.12 Outline of the research
The thesis is structured as follows:
Chapter 1 is based on the introduction, which focuses on the importance of the research,
statement of the problems, aims and objectives of the research and research methodology.
It also outlines certain assumptions involved and clarifies the concepts of the research.
In chapter 2 the focus is on the literature study regarding the theoretical aspects pertinent to
organisational culture, emotional intelligence and the link to successful organisational
performance. The extant links among leadership, emotional intelligence and organisational
culture are thoroughly examined.
Chapter 3 provides a detailed description of the methodology used namely, the research
design, sample, research measures and analysis methods.

20
Chapter 4 focuses on the five empirical questions as laid out in section 1.10. Reliability and
validity of the ECI and OCP instruments was also explained in detail.
Finally, chapter 5 focuses on the discussions, conclusions and the recommendations which
link EQ, organisational culture and organisational performance. The recommendations and
the conclusions of the research are drawn and topics for further research projects are
identified.

21
2 CHAPTER 2: LITERATURE STUDY
2.1 Introduction
An examination of the literature in the field of organisational culture, emotional intelligence
and leadership found that the two areas had been independently linked to organisational
performance. Researchers had examined the link between emotional intelligence (EQ) and
organisational performance (Goleman, 2001; Johnson & Indvik, 1999, Higgs, 2004) and also
between organisational culture and organisational performance (Deal & Kennedy, 1982;
Denison, 1990; Ouchi, 1981; Peters & Waterman, 1982; Kotter & Heskett, 1992; Ogbonna &
Harris, 2000; Ogaard, Larsen & Harris, 2005). Numerous aspects of the organisational
culture literature alluded to the role of leaders in ‘creating’ and ‘maintaining’ particular types
of culture (Schein, 2004; Siehl, 1985). Equally, the literature pertaining to leadership
suggested that the ability to understand and work within a culture is essential for leadership
effectiveness (Hennessey, 1998).
Sarros, Gray and Densten (2002) revealed strong and positive relationships between
leadership and organisational culture. Culture was shown to be more responsive to the
leadership dimensions than leader was to culture. This study uses the organisational culture
profile (OCP) which was revised and shortened by the authors and measures organisational
culture on the following dimensions namely competitiveness, social responsibility,
supportiveness, emphasis on rewards, innovation, performance orientation and stability.
According to Kristof (1996), leaders could emphasise particular values and goals in
communicating with followers. Where a strong and consistent culture was promoted, leaders
encouraged the attrition of those that do not fit well with the organisation.
However, despite the implicit and explicit linking of emotional intelligence and organisational
culture in many parts of organisational theory, little empirical research attention had been
devoted to understanding the relationship between the two concepts and the impact that
such an association might have had on organisational performance. The absence of the
empirical literature exploring the organisational performance implications of relationships
between organisational culture and emotional intelligence was unsurprising, given that the

22
concept of emotional intelligence has only attained empirical status. The aim of this study is
to provide empirical evidence of the links between leader emotional intelligence,
organisational culture and organisational performance. Thus this chapter provides a review
of the extant theory and research on these three constructs and the previous scholarly
attention to the linkage among the three.
2.2 Leadership and emotional intelligence
It had been asserted that whichever model of leadership is examined, it was underpinned by
the need of the leaders to possess emotional intelligence (Goleman, 1998b, 2000).
Emotional intelligence as a concept was first developed by Goleman (1995). Emotionally
intelligent leaders were thought to be happier and more committed to their organisation
(Abraham, 2000), achieved greater success (Miller, 1999), performed better in the work
place (Goleman, 1998a, 1998b; Watkin, 2000), took advantage of and used positive
emotions to envision major improvements in organisational functioning (George, 2000), used
emotions to improve their decision making and instilled a sense of enthusiasm, trust and co-
operation in other employees.
In looking more broadly at leadership, in particular the future nature of leadership, a number
of authors and researchers had identified the growing significance of emotional intelligence in
leadership (Capioppe, 1997; Sosik & Magerian, 1999; Chaudry, 2000). This shift from the
rational to emotional aspects of leadership represented the continuation of the trend
encountered more broadly on the thoughts of organisational behaviour and leadership
(Fineman, 1997; Goffee & Jones, 2000; Yukl, 2002).
In reviewing emotional intelligence research, Higgs and Dulewicz (1999) indicated that there
is a developing view that emotional intelligence may be strongly related to leadership. A
number of assertions to this effect had been made by both researchers in the field of
emotional intelligence and leading authors on the topic of leadership (Goleman, 1998a;
Bennis, 1989). Indeed Goleman (1998a) claimed that the evidence for competency research
showed that, whilst for all jobs emotional intelligence was twice as important for high
performance as IQ and technical competencies, for leadership roles it accounted for 85% of
the variance in high performing individuals. “Emotional competence made the crucial

23
difference between mediocre leaders and the best. The stars showed significantly greater
strengths in a range of emotional competencies, among them influence, team leadership,
political awareness, self confidence, and achievement drive. On average 90% of their
success in leadership was attributable to emotional intelligence” (Goleman, 1998a: 33).
Sjolund and Gustafsson (2001) conducted a study in Sweden and illustrated that emotionally
and socially intelligent behaviour could be enhanced in individuals. The researchers
compared the EQ-I scores of 29 managers at a construction company before and after they
participated in a workshop designed to increase managerial skills. As part of the workshop
curriculum, they were taught techniques to strengthen EQ competencies and skills thought to
be important for their work as managers. Not only did their total EQ score increase from a
mean of 97 to 107 (p-level <.001), but 9 out of the 15 EQ-I subscales increased the most.
Emotional self-awareness and empathy were considered to be the two most important
components of EQ (Bar-On, Maree & Elias, 2006).
At an EQ conference in 2003, Bharwaney (2003) presented preliminary findings from the
individual coaching she has been providing to corporate executives in the United Kingdom
since 1999. In the sample presented, she assessed 47 executives from the same company
with the EQ-I before she began coaching them and approximately two months after they
completed the intervention.
The five EQ-I subscale scores that revealed the most significant changes were as follows:
Self regard – 87 to 95
Self actualisation – 92 to 102
Stress tolerance – 97 to 102
Reality testing – 97 to 109
Happiness – 93 to 100.
It was therefore reasonable to assume that educating more emotionally intelligent leaders
successfully, would help build more effective, productive and humane organisations,
communities and societies (Bar-On et al., 2006).
Goleman (2001) described how his conception of EQ differed from the conceptions of
Reuven Bar-On, John Mayer and Peter Salovey, in that EQ was a theory of performance.

24
One of the most basic controversies involved the definition of the concept, EQ. The term
emotional quotient (EQ) was first coined by Bar-On (1988) as a counterpart to intelligence
quotient (IQ), that is, to cognitive ability. Bar-On thought of EQ as representing a set of
emotional abilities that helped individuals cope with the demands of daily life. Salovey and
Mayer (1990) had something different and more restricted in mind when they introduced the
term emotional intelligence several years later. For them, EQ concerned the way in which an
individual processed information about emotion and emotional responses. Finally Goleman
(2001) saw EQ as an idea or theme that emerged from a large set of research findings on
the role of the emotions in human life.
Goleman’s (2001) EQ model predicted personal effectiveness at work and in leadership and
is therefore the theory that the researcher proposes since the thesis is about effective
organisational performance in the workplace. The model sets out a framework of emotional
intelligence that reflects how an individual’s potential for mastering the skills of self
awareness, self management, social management and relationship management translates
into the on-the-job success.
2.3 Effective leaders have emotional intelligence
Goleman (1997) provides a useful definition of the construct of emotional intelligence, which
is about:
• Knowing what one is feeling and being able to handle those feelings without having
them swamp one;
• being able to motivate oneself to get the jobs done, be creative and perform at one’s
peak; and
• sensing what others are feeling, and handling relationships effectively.
“Effective leaders are alike in one crucial way: they all have a high degree of emotional
intelligence”, states Goleman (1998a: 94). In recent years the notion of ‘emotional
intelligence’ had been seen as critically important to effective leadership and ‘superior
organisational performance’. According to Goleman (1998b) and Goleman, et al. (2002), the
leading exponent of the concept, the higher an individual rises in an organisation the more
important emotional intelligence (EQ) becomes.

25
2.4 Development of the ECI instrument
Goleman (1998a) in the development of his first ECI 1.0 instrument claimed there are five
components of emotional intelligence at work. Table 2.1 defines each of the five
components of emotional intelligence and displayed hallmarks of each one.
Table 2.1: The Five Components of Emotional Intelligence at Work
DEFINITION HALLMARKS
SELF-AWARENESS The ability to recognize and understand
your moods, emotion and drives, as well as
their effect on others
Self-confidence
Realistic self-assessment
Self-deprecating sense of humour
SELF-REGULATION The ability to control or redirect disruptive
impulses and moods
The propensity to suspend judgement to
think before acting
Trustworthiness and integrity
Comfort with ambiguity
Openness to change
MOTIVATION A passion to work for reasons that go
beyond money and status
The propensity to pursue goals with energy
and persistence
Strong drive to achieve
Optimism, even in the face of failure
Organisational commitment
EMPATHY The ability to understand the emotional
makeup of other people
Skill in treating people according to their
emotional reactions
Expertise in building and retaining talent
Cross-cultural sensitivity
Service to clients and customers
SOCIAL SKILLS Proficiency in managing relationships and
building networks
An ability to find common ground and build
rapport
Effectiveness in leading change
Persuasiveness
Expertise in building and leading teams
(Adapted from Goleman, 1998a)

26
The first three domains relate to an individual’s emotions, while empathy and social skills
refer to other people’s emotions: the ability to recognise them and nurture relationships or
inspire others.
There were a number of psychometric properties of the ECI 1.0 that were not what was
desired:
• It was reliable, but the competency scales showed intercorrelations that were too
high.
• There was a desire to reduce the number of items (110 items was considered too
long).
• They wanted to increase the validity of the instrument, which was also threatened if
the scales were too highly intercorrelated.
• In wanting to make changes to the instrument, they also wanted to ensure that they
maintained the high scale reliabilities.
The sample of over 10000 ECIs taken provided ‘total other’ items scores on over 4000
managers and professional from various countries. This data was compiled and analysed
and lead to the revised ECI 2.0 instrument (HayGroup, 2005a).
Goleman et al. (2002) revised model of emotional intelligence (ECI 2.0) includes 18
competencies, in four clusters. The competency framework for emotional intelligence is
listed below:
Self-awareness concerns knowing one’s internal states, preferences, resources, and
intuitions. The self-awareness cluster contains three competencies:
• Emotional awareness: Recognising one’s emotions and their effects
• Accurate Self-assessment: Knowing one’s strengths and limits
• Self-confidence: A strong sense of one’s self worth and capabilities
Self-management refers to managing one’s internal states, impulses, and resources. The
self-management cluster contains six competencies:
• Emotional self-control: Keeping disruptive emotions and impulses in check
• Transparency: Maintaining integrity, acting congruently with one’s values
• Adaptability: Flexibility in handling change
• Achievement: Striving to improve or meeting a standard of excellence

27
• Initiative: Readiness to act on opportunities
• Optimism: Persistence in pursuing goals despite obstacles and setbacks
Social-awareness refers to how people handle relationships and awareness of others’
feelings, needs and concerns. The social-awareness cluster contains three competencies:
• Empathy: Sensing others’ feelings and perspectives, and taking interest in their concerns
• Organisational-awareness: Reading a group’s emotional currents and power
relationships
• Service orientation: Anticipating, recognising, and meeting customers’ needs
Relationship management concerns the skill or adeptness at inducing desirable responses
in others. The relationship management cluster contains six competencies:
• Developing others: Sensing others’ development needs and bolstering their abilities
• Inspirational leadership: Inspiring and guiding individuals and groups
• Change catalyst: Initiating or managing change
• Influence: Wielding effective tactics for persuasion
• Conflict management: Negotiating and resolving disagreements
• Teamwork and collaboration: Working with others towards shared goals. Creating
group synergy in pursuing collective goals
2.4.1 Approaches to the measurement of emotional intelligence (EQ)
Emotional intelligence, as originally conceptualised by Salovey and Mayer (1990: 189),
“involved the ability to perceive accurately, appraise, and express emotion; the ability to
access and/or generate feelings when they facilitate thought; the ability to understand
emotion and emotional knowledge; and the ability to regulate emotions to promote emotional
and intellectual growth”. Mayer and Salovey (1993) suggested that there are individual
differences in emotional intelligence relating to difference in our ability to appraise our own
emotions and those of others. They further suggested that individuals higher in emotional
intelligence might be more open to internal experience and better able to label and
communicate those experiences.

28
Since Salovey and Mayer’s (1990) original conceptualisation of emotional intelligence, three
alternative models of the construct had been proposed, ranging from the ability models
(Mayer & Salovey, 1997) to non-cognitive models (Bar-On, 1997) and the competency-based
models (Goleman, 2001).
Salovey and Mayer’s (1990) ability model defined emotional intelligence as “intelligence” in
the traditional sense that is as mental abilities to do with emotions and the processing of
emotional information that are part of, and contributed to, logical thought and intelligence in
general. These abilities were arranged hierarchically from basic psychological processes to
the more psychologically integrated and complex, and were thought to develop with age and
experience. Further, they were considered to be independent of traits and talents and
preferred ways of behaving (Mayer & Salovey, 1993).
Bar-On’s (1997: 14) non-cognitive model defined emotional intelligence as “an array of non-
cognitive capabilities, competencies and skills that influenced one’s ability to succeed in
coping with environmental demands and pressures”. While Bar-On (2000: 363) placed this
model under the banner of emotional intelligence, it was a somewhat broader construct to
which he more generically refers as “…emotional and social intelligence”. Bar-On had
operationalised this model according to 15 conceptual components that pertained to five
specific dimensions of emotional and social intelligence. These were intrapersonal emotional
intelligence – which represented abilities, capabilities, competencies and skills pertaining to
inner self; interpersonal emotional intelligence – which represented interpersonal skills and
functioning; adaptability emotional intelligence – which represented how successfully one
was able to cope with environmental demands by effectively sizing up and dealing with
problematic situations; stress management emotional intelligence – which concerned the
ability to manage and cope effectively with stress and general mood emotional intelligence –
which pertained to the ability to enjoy life and to maintain a positive disposition. The fifteen
components of the model are described as non-cognitive variables that “…resemble
personality factors” (Bar-On, 1997: 6). Bar-On proposed that the components of this model
developed over time, changed through training and development programmes, and that the
model related to the potential for performance rather than performance itself.
The competency-based model of emotional intelligence developed by Goleman (1998a) has
been designed specifically for workplace applications. It was described as an emotional

29
intelligence-based theory of performance that had been reduced to 18 competencies
(Goleman et al., 2002). This learned capability was based on emotional intelligence that
resulted in outstanding performance at work and distinguished individual differences in
workplace performance (Goleman, 1998b). These competencies underlined four general
abilities:
• Self awareness – the ability to understand feelings and accurate self-assessment.
• Self management – the ability to manage internal states, impulses and resources.
• Social awareness – the ability to read people and groups accurately.
• Relationship management – the ability to induce desirable responses in others.
Goleman (2001: 27) proposed that the underlying abilities of the model were “… necessary,
though not sufficient, to manifest competence in any one of the four EQ domains” and that
the emotional competencies could be learned. Within this context, Goleman (1998a) defined
emotional intelligence “as the ability to recognise and regulate emotions both within the self
and others”. Emotional competencies seemed to operate most powerfully in synergistic
groupings, with the evidence suggesting that mastery of a “critical mass” of competencies
was necessary for superior organisational performance (Boyatzis, Goleman, & Rhee, 1999).
The impact of some emotional competencies will now be discussed.
2.4.1.1 The impact of self-awareness
Research supports that self-awareness was a necessary underpinning of both
self-management and social awareness. The purpose of Tables 2.2a to 2.3a is to show the
large impact of self awareness on self management and social awareness.
2.4.1.2 The impact of self-awareness on self-management
With self-awareness, a person had a 50-50 chance of demonstrating self-management
(HayGroup, 2005b). This is demonstrated in Table 2.2a.

30
Table 2.2a: The impact of self - awareness on self - management
Self - Awareness
Self – management
Yes No
Yes 49% 51%
No 4% 96%
N = 427, p < 0.001 (Source: HayGroup, 2005b)
Without self-awareness, a person had virtually no chance of demonstrating self-
management. Table 2.2b demonstrates the impact of self-awareness on self-management
(HayGroup, 2005b).
Table 2.2b: The impact of self - awareness on self - management
Self – Awareness
Self Management
Yes No
Yes 49% 51%
No 4% 96%
N = 427, p < 0.001 (Source: HayGroup, 2005b)
2.4.1.3 The impact of self-awareness on social awareness
With self-awareness, a person had a 38% chance of having social-awareness. Table 2.3a
demonstrates the impact of self awareness on social-awareness (HayGroup, 2005b).
Table 2.3a: The impact of self - awareness on social - awareness
Self – Awareness
Social Awareness
Yes No
Yes 38% 62%
No 17% 17%
N = 427, p < 0.001 (Source: HayGroup, 2005b)
Without self-awareness, a person had an 83% chance of lacking social awareness. Table
2.3b demonstrates the impact of self-awareness on social-awareness (HayGroup, 2005b).

31
Table 2.3b: The impact of self - awareness on social - awareness
Self – Awareness
Social Awareness
Yes No
Yes 38% 62%
No 17% 83%
N = 427, p < 0.001 (Source: HayGroup, 2005b)
2.4.1.4 Self-awareness
The essence of self-awareness was seeing yourself as others see you. Research showed
that people with high Accurate Self-Assessment (ASA) have smaller gaps between self and
others’ views than people who score low on ASA* (HayGroup, 2005b). * N=214, t-values
range from 2,27 to 6,46. p<0.001. It was critical for 360° feedback to obtaining objective
insights into how one is seen by others.
The good news is that leaders can develop emotional intelligence (HayGroup, 2004). Figure
2.1 below shows how emotional intelligence may be developed. It shows how feelings
develop emotions, emotions control thoughts, thoughts control behaviour and how behaviour
determines performance.
Figure 2.1: How emotional intelligence is developed ? (Source: HayGroup, 2004, slide 76)
For the sake of organisational performance, the competencies of emotional intelligence are
ingredients that leaders “need to have”. It is fortunate that emotional intelligence can be
learned (Goleman, 1998a: 2; Diggins, 2004). It takes “time and commitment, but the benefits
that come from having a well developed emotional intelligence, for both the individual and for
the organisation, make it worth the effort” (Goleman, 1998a: 2). The following section
discusses the necessary ingredients of EQ that leaders require in order to lead successful
organisations.
Emotions
Thoughts
Behaviour
Performance

32
2.4.2 Emotional intelligence and organisational performance
As far as organisational performance is concerned Goleman (1998b) claimed that EQ is
twice as important as IQ or technical skills. He stated that three ‘motivational competences’
typified outstanding performance of individuals. These are:
• Achievement drive (striving to improve or meet a standard of excellence).
• Commitment (embracing the vision and goals).
• Initiative and optimism (mobilizing people to seize opportunities and allowing them to
take setbacks and obstacles in their stride).
“There are many leaders, not one. Leadership is distributed. It resides not solely in the
individual at the top, but in every person at every level who in one way or the other, acts as a
leader. Good leaders captivate, enthuse and inspire us” (Goleman et al., 2002: 14). “We all
know good leadership when we see it, like good schools or good teaching it is relatively easy
to identify and describe. Good leaders have integrity, charisma, strong values, emotional
intelligence and moral purpose. They have energy, drive and enthusiasm. They motivate us
and challenge us and remain optimistic even in the face of adversity. They exist at all levels
in any organisation and most importantly, they generate development, change and
improvement” (Harris & Lambert, 2003: 1).
Goleman (1998b) stated that the most effective leaders were alike in one crucial way: they all
had a high degree of what had come to be known as emotional intelligence. It’s not that IQ
and technical skills were irrelevant. They did matter, but mainly as “threshold competencies”;
that is, they are the entry level requirements for executive positions. Goleman’s analysis
showed that emotional intelligence played an increasingly important role at the highest levels
of the company, where differences in technical skills were of negligible importance. The
higher the rank of a person considered being a star performer, the more emotional
intelligence competencies showed up as the reason for his or her effectiveness. Goleman
(1998b) compared star performers with average ones in senior leadership positions; nearly
90% of the difference in their profiles was attributable to emotional intelligence factors rather
than cognitive abilities.

33
A growing body of support for emotional intelligence as a prerequisite to superior
organisational performance had appeared ever since its definition in Goleman’s (1989)
seminal work.
Cavallo and Brienza (2002) conducted a study with 358 managers across the Johnson &
Johnson Consumer and Personal Care Group to determine whether leadership
competencies distinguished high-from average performance and also high-from average
potential. Based on peer, subordinate, and supervisor ratings on ECI, results showed that
high-performance managers were rated significantly higher than average performing
managers in emotional intelligence (HayGroup, 2005a).
Sergio (2001) conducted research to explore the relationship between emotional intelligence
and mental ability as predictor of job performance among the first-line Filipino plant
supervisors in manufacturing organisations. One hundred and thirty four plant supervisors
from two multinational manufacturing firms were assessed on the ECI and a standard mental
ability test; supervisor performance appraisals were also obtained. It was found that both
mental ability (ּ28.57= 2ג, p<0.5) emotional intelligence (ּ34.27= 2ג, p<0.05) were associated
with job performance ratings. Emotional intelligence and mental ability were not significantly
correlated (r=0.18, p>0.05). It was concluded from the study that both cognitive and
emotional ability/intelligence were independent and important contributors to job performance
(HayGroup, 2005a).
In a study by Bresnik (2004), 88 employees of a public organisation were measured on
emotional intelligence using the ECI 2.0 and performance using the firm’s internal 360-
degree HR assessment. The author found no relation between emotional intelligence and
organisational performance; however, she concluded that the measures of organisational
performance were flawed. It did not actually measure what was valued in the organisation
and did not represent criteria actually used for promotion (HayGroup, 2005a).
Overall, the literature on emotional intelligence is rich and diverse. Much of the richness is
founded on the claim by many researchers that emotional intelligence is linked to
organisational performance. Evidence suggesting a link between EQ and organisational
culture is now discussed.

34
2.4.3 Emotional intelligence (EQ) and organisational culture
Much of the emphasis in examining EQ has focused on individual performance. Yet, it is
clear that individual success cannot be seen in isolation from the organisation in which they
work (Goffee & Jones, 1999; Dulewicz & Higgs, 1999). Further research by Higgs and
Mcguire (2001) explored the relationship between individuals’ EQ and organisational culture.
Using the emotional intelligence questionnaire: managerial (EIQ:M) developed by Dulewicz
and Higgs (1999) and piloting the emotional intelligence cultural audit (EI:CA) by the same
authors, eight organisations provided up to 20 managers to complete both tools. The
preliminary results were useful in indicating empirically for the first time, a link between
emotional intelligence of individuals and aspects of organisational culture.
The earlier review of the literature on the relationship between emotional intelligence and
organisational performance and between organisational culture and organisational
performance finds that many commentators note that the performance of an organisation is
dependent on the conscious alignment of employee values with the espoused values of the
company strategy. This clearly indicates that organisational culture and leadership are linked.
One way of uncovering and understanding the relationship between organisational culture
and a leader’s emotional intelligence is to examine how culture has been conceptualised in
organisational theory. Smircich (1983) identified two approaches to study of the cultural
phenomenon in organisations: culture as an organisational variable, then culture as
something which could be manipulated. Thus the nature, direction, and impact of such
manipulation were dependent on the skills and abilities of the leader. The majority of the
literature which extols the virtues of transformational leadership demonstrated widespread
support for this view (Nicholls, 1988; Quick, 1992; Simms, 1997). In contrast, if culture was
seen as an integral part of the organisation, then the thinking, feeling, and responses of the
leaders were moulded by organisational culture (Bass & Avolio, 1993; Schein, 1992).
Perhaps the most seminal work on the relationship between leaders and organisational
culture had been theorised by Schein (1983). Schein (1992, 2004) argued strongly that
organisational culture and leadership were intertwined (Schein, 1992, 2004). He illustrates
this inter-connection by looking at the relationship between leadership and culture in the
context of the organisational life cycle. Thus, during the process of organisational formation,

35
the founder created an organisation which reflected their beliefs and values. In this sense,
the founder created and shaped the cultural traits of their organisation. However, as the
organisation developed and time passed, the created culture of the organisation exerted an
influence on the leader and shaped the action and style of the leader. Through this dynamic
ongoing process, the leader created and is in turn shaped by organisational culture. Bass
and Avolio (1993) mirror the argument of Schein (1992; 2004) by suggesting that the
relationship between the two concepts represented an ongoing interplay in which the leader
shaped the culture and is in turn shaped by the resulting culture.
2.5 Criticism of emotional intelligence
Although EQ holds some promise as an area of study, it is not without its detractors (Murphy,
2006). In this study of the relationship between EQ test scores and job evaluation scores,
Rau (2001) found no correlation between the two variables. In their recent study, Rode,
Mooney, Arthaud-Day and Near (2007) investigated the direct and moderated effects of EQ
on individual performance and concluded that the effects of EQ on performance are more
indirect than direct in nature. There are just some of the recent studies on EQ and its
relationship with performance. Antonakis (2003) and Mathews, Zeidner and Roberts (2002)
are concerned about the exaggerated effects of emotional intelligence on leadership,
performance and followers.
2.6 Leadership and organisational culture
In the broadest sense, most scholars argued that the effectiveness of a leader had an effect
on the success or failure of an organisation. Research into leadership had gone through
periods of scepticism about the influence of leaders upon organisations. However, recent
interest had focused on the importance of the leadership role to the success of organisations.
Many organisations that could not sustain their success had leaders who personally
disciplined the organisation through sheer force. Good to great organisations (Collins, 2001)
had leaders who built an enduring organisational culture of discipline, powered by self
disciplined people who acted in the organisation’s best interest without strict dictums from
leadership. These disciplined organisations could and did thrive even after their leaders had
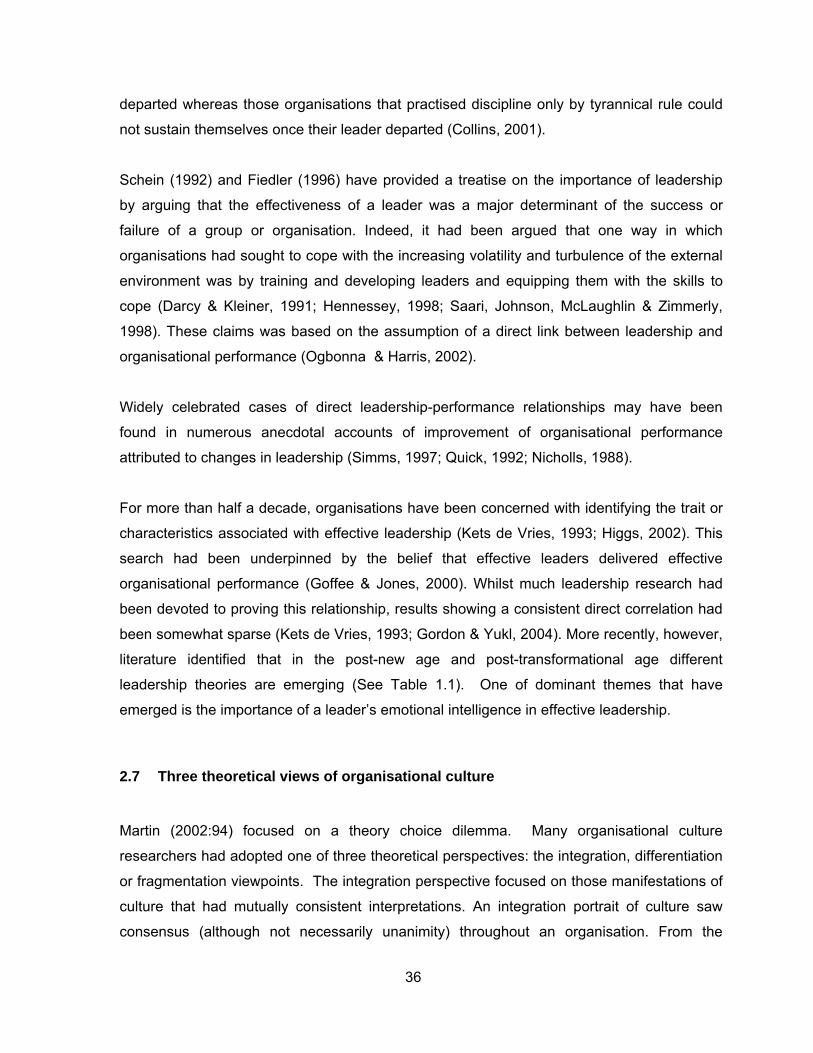
36
departed whereas those organisations that practised discipline only by tyrannical rule could
not sustain themselves once their leader departed (Collins, 2001).
Schein (1992) and Fiedler (1996) have provided a treatise on the importance of leadership
by arguing that the effectiveness of a leader was a major determinant of the success or
failure of a group or organisation. Indeed, it had been argued that one way in which
organisations had sought to cope with the increasing volatility and turbulence of the external
environment was by training and developing leaders and equipping them with the skills to
cope (Darcy & Kleiner, 1991; Hennessey, 1998; Saari, Johnson, McLaughlin & Zimmerly,
1998). These claims was based on the assumption of a direct link between leadership and
organisational performance (Ogbonna & Harris, 2002).
Widely celebrated cases of direct leadership-performance relationships may have been
found in numerous anecdotal accounts of improvement of organisational performance
attributed to changes in leadership (Simms, 1997; Quick, 1992; Nicholls, 1988).
For more than half a decade, organisations have been concerned with identifying the trait or
characteristics associated with effective leadership (Kets de Vries, 1993; Higgs, 2002). This
search had been underpinned by the belief that effective leaders delivered effective
organisational performance (Goffee & Jones, 2000). Whilst much leadership research had
been devoted to proving this relationship, results showing a consistent direct correlation had
been somewhat sparse (Kets de Vries, 1993; Gordon & Yukl, 2004). More recently, however,
literature identified that in the post-new age and post-transformational age different
leadership theories are emerging (See Table 1.1). One of dominant themes that have
emerged is the importance of a leader’s emotional intelligence in effective leadership.
2.7 Three theoretical views of organisational culture
Martin (2002:94) focused on a theory choice dilemma. Many organisational culture
researchers had adopted one of three theoretical perspectives: the integration, differentiation
or fragmentation viewpoints. The integration perspective focused on those manifestations of
culture that had mutually consistent interpretations. An integration portrait of culture saw
consensus (although not necessarily unanimity) throughout an organisation. From the

37
integration perspective, organisational culture was that which was clear; ambiguity was
excluded. To summarise this in a metaphor, from the integration perspective, organisational
culture was like a solid monolith that is seen the same way by most people, no matter from
which angle they view it (Martin, 2002).
The differentiation perspective focused on cultural manifestations that had inconsistent
interpretations, such as when top executives announced policy and then behaved in a policy
inconsistent manner. From the differentiation perspective, consensus existed within an
organisation, but only at lower levels of analysis, labelled “subcultures”. Subcultures may
exist in harmony, independently, or in conflict with each other. Within a subculture, all was
clear; ambiguity was banished to the interstices between subcultures. To express the
differentiation perspective in a metaphor, subcultures were like islands of clarity in a sea of
ambiguity.
The fragmentation perspective conceptualised the relationship among organisational cultural
manifestations as neither clearly consistent nor clearly inconsistent. Instead, interpretations
of organisational cultural manifestations were ambiguously related to each other, placing
ambiguity, rather than clarity at the core of culture. In the fragmentation view, consensus was
transient and issue specific. To express the fragmentation perspective in a metaphor,
imagine that individuals in a culture were each assigned a light bulb. When an issue became
salient (perhaps because a new policy had been introduced or the environment of collectivity
had changed), some light bulbs would turn on, signalling who was actively involved (both
approving and disapproving) in this issue. At the same time other lights would remain off,
signalling that these individuals were indifferent to or unaware of this particular issue.
Another issue would turn on different sets of light bulbs. From the distance, patterns of light
would appear and disappear in a constant flux, with no pattern repeated twice (Martin, 2002).
Critics (See Table 2.4) of the integration view argued that if a study claimed to represent the
culture of an entire organisation, then all kinds of organisational employees should be
studied, whether as informants in an ethnographic study or in a stratified, random sample,
more likely in a quantitative study. Critics of the integration approach also observed that this
image of organisation-wide harmony and homogeneity is difficult to sustain, given the
salience of inconsistencies, disruptions, conflicts and ambiguities in contemporary
organisations. Some advocates of an integration view responded to this critique with depth

38
arguments. They acknowledged that deviations from integration did occur, such as
inconsistencies, clashing interpretations, conflicts, and ambiguities, but they did so at the
superficial levels (stories, rituals, and values) that do not represent the deeper essence of the
culture. “The organisational culture will manifest itself at the levels of observable artefacts
and shared espoused values, norms, rules of behaviour… [but] to understand culture, one
must attempt to get at its shared basic assumptions” (Schein, 1985: 27).
Tacit, deep assumptions are detected when a researcher “penetrates the front” of impression
management strategies, searches for a pattern of interpretation underlying cultural forms
such as stories and rituals, and gets down to the essence of what is really important. At this
deep level, tacit assumptions are supposedly shared on an organisational wide basis. Thus,
in integration studies, as Schein (1985: 18) argued, “basic assumptions in the sense in which
I want to define that concept, have become so taken for granted that one finds little variation
within the cultural unit”.
Schein (1991: 247-248) summarised the integration approach as follows:
What this ‘model’ does say, however, is that only what is shared is by definition, cultural. It does not make sense, therefore, to think about high or low consensus cultures, or cultures of ambiguity or conflict. If there is no consensus or if there is conflict or if things are ambiguous, then, by definition, that group does not have a culture with regard to those things.
Consensus does not imply 100% agreement. Some argued that the opinions of people in
leadership, management and professional positions should perhaps “count more”, in the
sense that they have more power to control the trajectory of a collectivity. People were found
to share some tacit assumptions about fundamental issues, such as time or human nature.
Furthermore, integration studies usually did not deny the existence of deviation from what is
ostensibly a shared culture. They described cultural consensus in careful language that did
not assume total unanimity.
When deviations from the ideal of consistency, consensus, and clarity were acknowledged in
an integration study, however, they were seen as regrettable shortfalls. Such a normative

39
orientation could be detected by analysing whether the deviation from integration is seen as
a problem that needs fixing.
In an integration study, deviation from consistency, organisation wide consensus, and clarity
were seen as problems, and sometimes remedies were proposed. Sathe (1985: 140) and
O’Reilly, Chatman and Caldwell (1991) encouraged job applicants to seek cultures that
mirrored their own values: “If fundamental and irreconcilable misfits between the individual
and the organisation was apparent, it may have been best for the individual to leave. Biting
the bullet may be less costly than an eventual withdrawal, for both parties”. In an integration
study, a pocket of sub-cultural resistance might be acknowledged, but such a subculture
would be seen as needing to be “brought on board,” perhaps by a combination of training
and performance appraisal; remedies for ambiguity might include defining it due to “poor
communication”, requiring a clarification of an organisation’s strategy or vision, a motivational
speech, or more careful supervision (Kotter & Heskett, 1992; Porras & Collins, 1994; Schein,
1999). When deviations from integration are seen as shortcomings, then we are in
integration territory.
A study is congruent with the integration perspective when there is a prevalence of
descriptive material consistent with the integration view (consistency, organisation-wide
consistency, and clarity), plus a normative position. Deviations from integration were
portrayed as regrettable shortfalls from an integrated ideal. When researchers reviewed the
cultural literature, they usually focused on work congruent with only one perspective, defined
cultures in a manner congruent with that perspective, and excluded most theory and
research written from other perspectives. For example, Ebers (1995), working from a
neopositivist position, classified an array of cultural studies “accurately” into a typology that
reflected the content of cultures studied (usually based on content themes in espoused
values). It is noteworthy that Ebers was tacitly claiming to review all organisational culture
literature, but cited integration studies almost exclusively (Martin, 2002). Other predominantly
integration-orientation reviews of the organisational culture literature include those by
Denison (1990), Kotter and Heskett (1992), Ouchi and Wilkins (1985), Schein (1999) and
Schultz and Hatch (1996). Table 2.4 summarises the empirical studies related to the three
perpectives.

40
Table 2.4: Empirical studies related to the 3 perspectives of organisational culture
Theoretical perspectives Studies (empirical examples)
Integration Altman & Baruch (1998)
Barley (1983)
Bryman, Gillingwater & McGuinness (1996)
Deal & Kennedy (1982)
Dellheim (1987)
Kotter & Heskett (1992)
Martin & Powers (1983)
McDonald (1991)
O’Reilly (1989)
O’Reilly, Chatman & Caldwell (1991)
Ouchi (1981)
Pettigrew (1979)
Porras & Collins (1994)
Sathe (1985)
Shein (1985, 1999)
Siehl & Martins (1984)
Differentiation Alvesson (1993a)
Barley (1986)
Bartunek & Moch (1991)
Bell (1990)
Brunsson (1995)
Christenson & Kreiner (1984)
Gregory (1983)
Jermier, Slocum, Fry & Gaines (1991)
Martin, Sitkin & Boehm (1985)
Meyer & Rowan (1977)
Mumby (1987, 1988)
Riley (1983)
Rousseau (1990)
Sunesson (1985)
Young (1991)

41
Theoretical perspectives Studies (empirical examples)
Fragmentation Alvesson (1993b)
Brown & Duguid (1991)
Brunsson (1985, 1989)
Daft & Weick (1984)
Feldman (1989, 1991)
Gherardi (1995)
Golden (1992)
Hatch (1999)
Knights & Wilmott (1987)
Koot, Sabelis & Ybema (1996)
Meyerson (1994)
Risberg (1999)
Sabelis (1996)
This study views organisational culture from an integrationist perspective. Schein is the
leading theorist in integrationist studies and it was for this reason that his work will be
elaborated on further. Also, he is the only culture researcher that has identified and linked
organisational culture to the organisational life-cycle.
2.8 Leader EQ, organisation culture and organisational life-cycle: A theoretical linkage
Schein (1986) had shown the linkage between the role of leadership and organisational
culture and also associated leadership and organisational culture to the different
organisational life cycle stages. He argued that young companies that were still under the
influence of the founders and founding families appeared to need a strong and clear
organisational culture as a way of finding themselves. Organisational culture became a
source of identity and strength in overcoming the threats and resistance that environments
and competitors posed.
Organisational culture matters because decisions made without awareness of the operative
forces may have unanticipated and undesirable consequences (Schein, 1999).

42
Organisational culture matters in different ways according to the stages of organisational
evolution. Schein (1985) believed that organisational culture began with founders
(leader/manager) who impose their own values and assumptions on a group, a view also
shared by Daymon (2000) and Martin et al., (1985). A young and growing organisation
attempts to stablise and proliferate the organisational culture that it views as the basis of its
success. Although success leads to broader acceptance of those beliefs and value across
the whole organisation, one must recognise that a challenge to any organisational culture
element is equivalent to questioning the founder or owners of the organisation. Those
cultural elements become the Holy Grail and are difficult to change. Organisational culture
change was therefore more a matter of evolving and reinforcing organisational cultural
elements. If that group was successful and the assumptions came to be taken for granted,
we had then an organisational culture that would define for later generations of members
what kind of leadership was acceptable.
As the group encountered adaptive difficulties, its environment changed to the point where
some of its assumptions were no longer valid and leadership comes into play. Leadership
now was the ability to step outside the culture that was created by the founder and to start
more adaptive evolutionary change processes. This was the ability to perceive the limitations
of one’s own culture and to develop the culture adaptively was the essence and ultimate
challenge of leadership. Schein (1984, 1986) had shown the linkage between the role of
leadership and organisational culture and also associated leadership and organisational
culture to the different organisational life stages (Figure 2.2). He argued that young
companies that were still under the influence of the founders and founding families appeared
to need a strong and clear organisational culture as a way of finding themselves. Their
organisational culture became a source of identity and strength in overcoming the threats
and resistance that environments and competitors pose. Schein (1985, 1992, 2004) argued
that culture embedding in a young organisation was essentially a socialisation process, but
one in which most of the socialization mechanisms were in the hands of the founder. In
growing organisations, founders externalised their own assumptions and embedded them
gradually and consistently in the mission, goals, structures, and working procedures of the
group. Whether they are called basic assumptions the guiding beliefs, the theories-in-use,
the mental models, the basic principles, or the guiding visions on which founders operate,
there was little question that they become major elements of the organisation’s emerging

43
culture (Argyris, 1976; Bennis, 1989; Davis, 1984; Donaldson & Lorsch, 1983; Dyer, 1986;
Kotter & Heskett, 1992; Pettigrew, 1979; Schein, 2004).
A “midlife” organisation could be thought of as having several generations of professional
managers appointed by outside boards whose members were usually beholden to diverse
stockholders. Most likely such an organisation evolved into multiple units based on functions,
products, markets, or geographies and those units was likely to develop subcultures of their
own. Thus the culture issue in the midlife organisation was threefold:
• How to maintain those elements of the culture that continue to be adaptive and relate
to the organisation’s success.
• How to integrate, blend, or at least align the various subcultures.
• How to identify and change those cultural elements that maybe increasingly
dysfunctional as external environmental conditions change.
There was at this stage much greater necessity for accurate culture skill to produce
‘managed change’ of some cultural elements while maintaining the core. Culture change
becomes transformational, because old cultural elements had to be unlearned (Schein, 1992,
2004).
As organisations age, if they do not evolve, adapt, and change elements of their culture, they
grow increasingly maladapted and the culture posed serious constraints on learning and
change. The organisation clung to whatever made it a success. The very culture that created
the success made it difficult for members of the organisation to perceive changes in the
environment that required new responses. Culture became a constraint on strategy. The
culture issue in the older company was how to engage in massive transformations, often
under great time pressure to avoid serious economic damage. The process of transformation
was basically the same as in healthy midlife companies, but the demands of time and the
amount of change needed often precipitated drastic measures (usually labelled
‘turnarounds’). Rapid unlearning and letting go of things that were valued was for many
employees too difficult; either they leave the organisation or they are let go because they
‘resisted change’ too strongly. If the attempt to manage the change failed, the organisation
could go bankrupt and have to start all over again, building a new culture with new
management, or be acquired and find a new culture imposed on it (Schein, 1992, 2004).
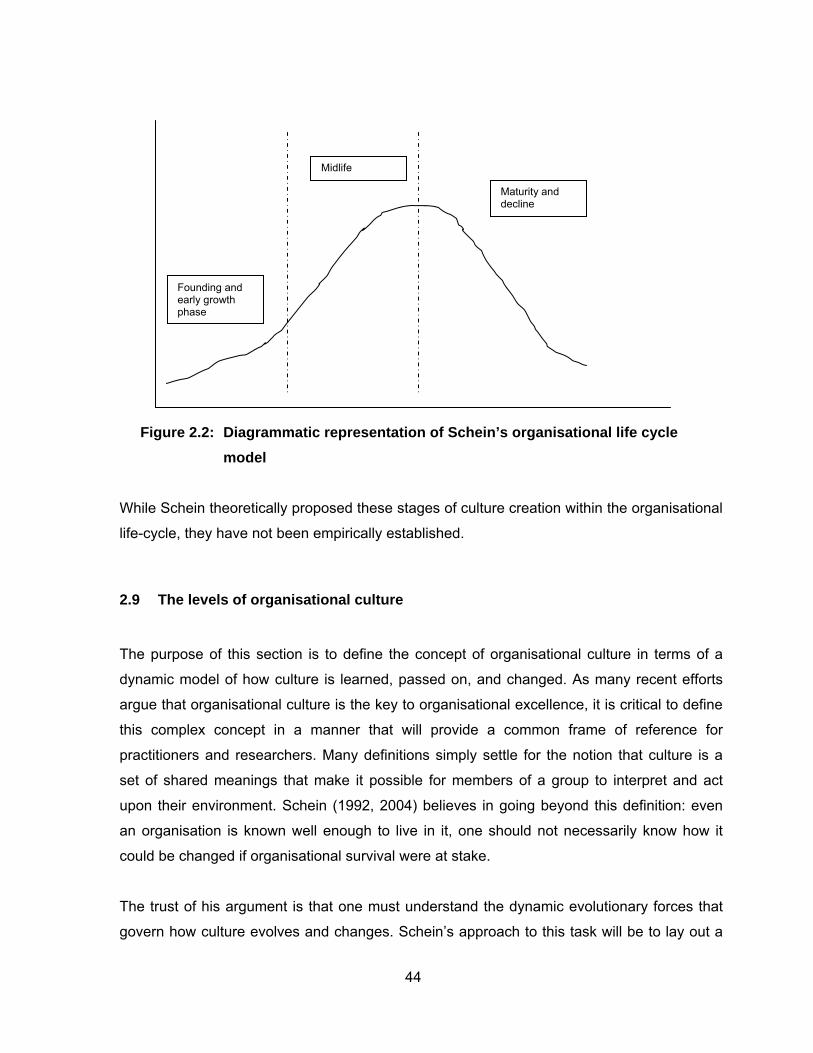
44
Figure 2.2: Diagrammatic representation of Schein’s organisational life cycle model
While Schein theoretically proposed these stages of culture creation within the organisational
life-cycle, they have not been empirically established.
2.9 The levels of organisational culture
The purpose of this section is to define the concept of organisational culture in terms of a
dynamic model of how culture is learned, passed on, and changed. As many recent efforts
argue that organisational culture is the key to organisational excellence, it is critical to define
this complex concept in a manner that will provide a common frame of reference for
practitioners and researchers. Many definitions simply settle for the notion that culture is a
set of shared meanings that make it possible for members of a group to interpret and act
upon their environment. Schein (1992, 2004) believes in going beyond this definition: even
an organisation is known well enough to live in it, one should not necessarily know how it
could be changed if organisational survival were at stake.
The trust of his argument is that one must understand the dynamic evolutionary forces that
govern how culture evolves and changes. Schein’s approach to this task will be to lay out a
Founding and early growth phase
Midlife
Maturity and decline

45
formal definition of what he believes organisational culture is, and to elaborate each element
of the definition to make it clear how it works (Schein, 1992, 2004).
Schein (1985) through his qualitative analysis provided a definition of organisational culture
as:
Organisational culture is a pattern of basic assumptions that a given group has
learned as it solved its problems of external adaptation and internal integration,
and that have worked well enough to be considered valid, and therefore, to be
taught to new members as the correct way to perceive, think, and feel in
relation to problems.
Figure 2.3 illustrates the levels of organisational culture as defined by Schein (1985).
Figure 2.3: Levels of Organisational Culture (Adapted from Schein, 1985)
Artefacts and Creations • Technology • Art • Visible and audible
behaviour
Values
Basic assumptions • Relationship to the
environment • Nature of reality, time
and space • Nature of human
nature • Nature of human
activity • Nature of human
relationships
Visible but often not decipherable
Greater level of awareness
• Taken for granted • Invisible • Preconscious

46
Organisational culture could be analysed at several different levels, starting with the visible
artefacts - the constructed environment of the organisation, its architecture, technology,
office layout, manner of dress, visible or audible behaviour patterns, and public documents
such as charters, employee orientation materials, stories (see Figure 2.3). This level
of analysis is tricky because the data are easy to obtain but hard to interpret. One could
describe ‘how’ a group constructs its environment and ‘what’ behaviour patterns are
discernible among the members, but one often cannot understand the underlying logic –
‘why’ a group behaves the way it does (Schein, 1992, 2004).
To analyse why members behaved the way they do, the values that govern behaviour, which
is the second level in Figure 2.3, is examined. Values are hard to observe directly, therefore
it is often necessary to infer them by interviewing key members of the organisation or to
content analyze artefacts such as documents and charters. However, in identifying such
values, one usually notes that they represented accurately only the manifested or espoused
values of a culture. Focus was on what people say the reason for their behaviour was, what
they ideally would have liked those reasons to have been, and what were
their rationalizations for their behaviour. Yet, the underlying reasons for their behaviour
remained concealed or unconscious (Schein, 1992, 2004).
To understand an organisational culture and to ascertain more completely the group's
values and overt behaviour, it was imperative to delve into the underlying assumptions,
which were typically unconscious but which actually determined how group members
perceived, thought and felt (Schein, 2004). Such assumptions were themselves learned
responses that originated as espoused values. But, as a value led to behaviour and as that
behaviour begun to solve the problem which prompted it in the first place, the value gradually
was transformed into an underlying assumption about how things are. Once the assumption
was taken for granted, it dropped out of awareness (Schein, 1992, 2004).
Taken-for-granted assumptions were so powerful because they are less debatable
and confrontable than espoused values. Assumptions were recognised when one encounters
in informants a refusal to discuss something, or when they considered informants ‘insane’ or
‘ignorant’ for bringing something up. In other words, the domain of values could be divided
into (1) ultimate, non-debatable, taken-for-granted values, for which the term ‘assumptions’
was more appropriate; and (2) debatable, overt, espoused values, for which the term

47
“values" was more applicable. Basic assumptions were unconscious, therefore Schein
argues that as certain motivational and cognitive processes were repeated and continued to
work, they became unconscious. They could be brought back to awareness only through a
kind of focused inquiry. What were needed were the efforts of both an insider who made the
unconscious assumptions and an outsider who helped to uncover the assumptions by asking
the right kinds of questions (Schein, 1992, 2004).
Schein (1985, 1992, 2004) defined the concept of organisational culture and shows its
relationship to leadership. He argues that organisational culture could be analysed as a
phenomenon that surrounds us at all times, being constantly enacted and created by our
interaction with others. When one brings culture to the level of the organisation and even
down to groups within the organisation, one can see more clearly how it is created,
embedded, developed, and ultimately manipulated, managed and changed. These dynamic
processes of organisational culture creation and management are the essence of leadership
and make one realise that leadership and organisational culture are two sides of the same
coin or that leadership and culture are conceptually intertwined.
Culture basically springs from three sources:
o The beliefs, values, and assumptions of the founder of organisations.
o The learning experiences of the group members as their organisation evolves.
o New beliefs, values and assumptions brought in by new members and leaders.
Though each of the above mechanisms perform a crucial role, the most important for
organisational cultural beginnings is the impact of the founder/leader. Founders/leaders not
only choose the basic mission and the environmental context in which the new group will
operate, but they choose the group members and bias the original response that the group
makes in its effort to succeed. Organisations do not form accidentally or spontaneously.
Instead they are goal oriented, have a specific purpose, and are created because one or
more individuals perceive that the coordinated and concerted action of a number of people
can accomplish something that individual action cannot. Firms are created by entrepreneurs
of people who have a vision of how the concerted effort of the right group of people can
create a new goods or service in the marketplace (Schein, 1992, 2004).

48
Founders/leaders have a major impact on how the group initially defines and solves its
external adaptation and internal integration problems. Since they had the original idea, they
would typically have their own notion, based on their own cultural history and personality, of
how to fulfil the idea. Founders/leaders not only have a high level of self confidence and
determination, but they typically have strong assumptions about nature of the world, the role
that organisations play in that world, the nature of human nature and relationship , how truth
is arrived at, and how to manage time and space (Schein, 1978, 1983). They would,
therefore, be quite comfortable in imposing those views on their partners and employees as
the fledgling organisation copes, thus clinging to them until such time as they become
unworkable or the group fails and breaks up (Donaldson & Lorsch, 1983).
To survive and grow, every organisation must develop viable assumptions about what to do
and how to do it. Schein (2004) stated and explained that these “basic assumptions” must
have worked well enough to be considered valid and therefore, to be taught to new members
as well as the correct way to perceive, think, and feel in relation to problems regarding
external adaptation and survival and internal integration.
Schein (2004: 88) distinguished between the external system and the internal system in
Table 2.5 and notes that the two were interdependent. Even though one could distinguish
between the external adaptation problems and the internal integration problems, both
systems were highly interrelated. The third section of Table 2.5, deeper dimensions around
which shared basic underlying assumptions form, clearly influenced how external adaptation
and internal integration issues were handled (Schein, 2004: 138). There cannot be a culture
unless there is a group that “owns” it. A “given group” is a set of people who have been
together long enough to have shared significant problems and who have opportunities to
solve those problems and to observe the effects of their solution.

49
Table 2.5: The steps of external adaptation and survival, internal integration issues and deeper dimensions around which basic underlying assumptions form (adapted from Schein (2004))
THE STEPS OF EXTERNAL ADAPTATION AND SURVIVAL
• Mission and strategy: Obtaining a shared understanding of the core mission,
primary task and latent functions.
• Goals: Developing consensus on goals, as derived from the core mission.
• Means: Developing consensus on the means to be used to attain the goals, such
as the organisational structure, division of labour, rewards systems and authority
systems.
• Measurement: Developing consensus on the criteria to be used in measuring how
well the group is doing in fulfilling its goals, such as the information and control
system. This step also involves the cycle of obtaining information getting that
information to the right place within the organisation, and digesting it so that
appropriate corrective action can take place within the organisation, and digesting it
so that appropriate corrective action can be taken.
• Correction: Developing consensus on the appropriate remedial or repair strategies
to be used if the goals are not being met.

50
INTERNAL INTERGRATION ISSUES
• Creating a common language and conceptual categories: If members cannot
communicate with and understand each other, a group is impossible by definition.
• Defining group boundaries and criteria for inclusion and exclusion: The group
must be able to define itself. Who is in and who is out, and by what criteria does
one determine membership?
• Distributing power and status: Every group must work out its pecking order, its
criteria and rules for how members get, maintain and lose power. Consensus in
this area is crucial to helping members manage feelings of anxiety and aggression.
• Developing norms of intimacy, friendship and love: Every group must work out
its rules of the game for peer relationships, for relationships between the sexes, and
for the manner in which openness and intimacy are to be handled in the context of
managing the organisation’s tasks. Consensus in this area is crucial to help
members manage feelings of affection and love.
• Defining and allocating rewards and punishments: Every group must know what
its heroic and sinful behaviours are and must achieve consensus on what is a
reward and what is a punishment.
• Explaining the unexplainable – ideology and religion: Every group faces
unexplainable events that must be given meaning so that members can respond to
them and avoid the anxiety of dealing with the unexplainable and uncontrollable.

51
DEEPER DIMENSIONS AROUND WHICH SHARED BASIC UNDERLYING ASSUMPTIONS FORM
• The nature of reality and truth: The shared assumptions that define what is real
and what is not, what is a fact in the physical realm and the social realm, how truth
is determined, and whether truth is revealed or discovered.
• The nature of time: The shared assumptions that define the basic concept of time
in the group, how time is defined and measured, how many kinds of time there are,
and the importance of time in the culture.
• The nature of space: The shared assumptions about space and its distribution,
how space is allocated, the symbolic meaning of space around the person, and the
role of space in defining aspects of relationships such as degree of intimacy or
definitions of privacy.
• The nature of human nature: The shared assumptions that define what it means
to be human and what human attributes are considered to be intrinsic or ultimate.
Is human nature good, evil, or neutral? Are human beings perfectible or not?
• The nature of human activity: The shared assumptions that define what is the
correct thing for human beings to do in relating to their environment on the basis of
the above assumptions about reality and the nature of human nature. In one’s basic
orientation to life, what is the appropriate level of activity and passivity? At the
organisational level, what is the relationship of the organisation to its environment?
• The nature of human relationships: The shared assumptions that define what is
ultimately the right way for people to relate to each other, to distribute power and
love. Is life cooperative or competitive; individualistic, group-collaborative, or
communal? What is the appropriate psychological contract between employers and
employees? Is authority ultimately based on traditional lineal authority, moral
consensus, law, or charisma? What are the basic assumptions about how conflict
should be resolved and how decisions should be made?
Schein (2004) argued that organisational culture could be analysed as a phenomenon that
surrounds us at all times, being constantly enacted and created by our interaction with
others. When one brings culture to the level of the organisation and even down to groups

52
within the organisation, one can see more clearly how it is created, embedded, developed
and ultimately manipulated, managed and changed. These dynamic processes of culture
creation and management were the essence of leadership and made one realise that
leadership and organisational culture are two sides of the same coin or that leadership and
organisational culture were conceptually intertwined (Schein, 2004:11).
2.9.1 How do leaders create organisational culture?
The six primary embedding mechanisms and the six secondary reinforcement mechanisms
as shown Table 2.6: (adapted from Schneider, 1990) create what would be called the
“climate” of the organisation. At this stage the climate created by the leaders precedes the
existence of the group culture. At a later stage climate will be a reflection and manifestation
of the cultural assumptions, but early in the life of a group it reflects only the assumptions of
the leader (Schein, 1992, 2004).
Table 2.6: Organisational culture embedding mechanisms
Primary embedding mechanisms Secondary articulation and reinforcement mechanisms
What leaders pay attention to, measure,
and control on a regular basis
Organisation design and structure
How leaders react to critical incidents and
organisational crisis
Organisational systems and procedures
Observed criteria by which leaders allocate
scarce resources
Organisational rites and rituals
Deliberate role modelling, teaching, and
coaching
Design of physical space, facades, and
buildings
Observed criteria by which leaders allocate
rewards and status
Stories, legends, and myths about people and
events
Observed criteria by which leaders recruit,
select, promote, retire, and
excommunicate organisational members
Formal statements of organisational
philosophy, values and creed.
53
2.9.2 Primary embedding mechanisms
2.9.2.1 What leaders pay attention to, measure, and control on a regular basis
One of the most powerful mechanisms that leaders have available for communicating what
they believe in or care about is what they systematically pay attention to. What they notice
and comment on to what they measure, control, reward and in other ways systematically
deal with, is noticed. Even casual remarks and questions that are consistently geared to
certain areas can be potent as formal control mechanisms and measurements.
If leaders were aware of this process, then being systematic in paying attention to certain
things becomes a powerful way of communicating a message, especially if the leaders were
totally consistent in their own behaviour. On the other hand, if leaders were not aware of the
power of this process or they were inconsistent in what they pay attention to, subordinates
and colleagues will spend inordinate time and energy trying to decipher what a leader’s
behaviour really reflects and even project motives where none exist (Schein, 2004: 247).
Consistency in what questions leaders ask send clear signals about priorities, values, and
beliefs. It is the consistency that is important, not the intensity of the attention.
Some of the most important signals of what leaders care about are sent during meetings and
in other activities devoted to planning and budgeting, which is one reason why planning and
budgeting are such important managerial processes. In questioning subordinates
systematically on certain issues, leaders can transit their own view of how to look at
problems. The ultimate content of the plan may not be important as the learning that goes on
during the planning process (Schein, 2004: 248).
Attention is focused in part by the kinds of questions that leaders ask and how they set the
agendas for the meetings. An even more powerful signal, however, is their emotional
reactions, especially the emotional outbursts that occur when leaders feel that an important
assumption is being violated. Such outbursts are not necessarily very overt because many
managers believe that one should not allow one’s emotions to become too involved in the
decision process. On the other hand, some leaders allow themselves to get angry and upset

54
and use those feelings as messages. Even for those leaders who attempt to suppress their
emotions, subordinates generally know when they are upset.
Many subordinates find emotional outbursts on the part of their bosses painful and try to
avoid them. In the process they gradually come to adopt the assumptions of the leader.
Other powerful signals that subordinates interpreted for evidence of the leaders’ assumptions
are what leaders do not react to (Schein, 2004: 249). The combination of what leaders do
and do not pay attention to can create problems of deciphering because they reveal the
areas where unconscious conflict may exist.
Conclusively, what leaders consistently pay attention to, communicates most clearly what
their own priorities, goals, and assumptions are. If they pay attention to many things or if their
pattern of attention is inconsistent, subordinates will use other signals of their own
experience to decide what is really important, leading to a much more diverse set of
assumptions and many subcultures (Schein, 2004).
2.9.2.2 How leaders react to critical incidents and organisational crisis
When an organisation faces a crisis, the manner in which the leader deals with it creates new
norms, values, and working procedures and reveals important underlying assumptions.
Crises are significant especially in organisational culture creation and transmission because
the heightened emotional involvement during such periods increases the intensity of
learning. Crisis heightens anxiety, and anxiety reduction is a powerful motivator of new
learning. If people share intense emotional experiences and collectively learn how to reduce
anxiety, they are more likely to remember what they have learned (Schein, 2004: 254).
What is defined as a crisis is of course, partly a matter of perception. There may or may not
be actual dangers in the external environment, and what is considered to be dangerous is
itself often a reflection of the organisational culture. For the purpose of this analysis, a crisis
is what is perceived to be a crisis and what is defined as a crisis by the leader. Crises that
arise around the major external survival issues are the most potent in revealing the deep
assumptions of the leaders and therefore the most likely to be the occasions when those
assumptions become the basis of shared learning and thus become embedded. How

55
leaders deal with such a crisis reveals some of the assumptions about the importance of
people and their view of human nature (Schein, 2004: 254).
Crises around issues of internal integration can also reveal and embed leader assumptions.
Schein (2004: 256) has found that a good time to observe an organisation very closely is
when acts of insubordination take place. So much of an organisation’s culture is tied up with
hierarchy, authority, power and influence that the mechanisms of conflict resolution have to
be constantly worked out and consensually validated. No better opportunity exists for leaders
to send signals about their own assumptions about human nature and relationship than when
they themselves are challenged.
2.9.2.3 Observed criteria by which leaders allocate scarce resources
How budgets are created in an organisation is another process that reveals leader
assumptions and beliefs. Donaldson and Lorsch (1983) show in their study of top
management decision making, leader beliefs about the distinctive competence of their
organisation, acceptable levels of financial risks, and the degree to which the organisation
must be financially self sufficient strongly influence their choice of goals, the means to
accomplish them, and the management processes to be used. Such beliefs not only function
as criteria by which decisions are made but are constraints on decision making in that they
limit the perception of alternatives.
2.9.2.4 Deliberate role modelling, teaching, and coaching
Emotionally intelligent leaders generally seem to know that their own visible behaviour has a
great value for communicating assumptions and values to other members, especially
newcomers.
Some leaders have made videotapes that outline their explicit philosophy, and these are
shown to new members of the organisation as part of their initial training. However, there is a
difference between the message delivered from stage settings, such as when a leader gives
a welcoming speech to newcomers, and the message received when that leader is observed

56
informally. The informal messages are the more powerful teaching and coaching mechanism
(Schein, 2004: 258).
2.9.2.5 Observed criteria for allocation of rewards and status
Members of any organisation learn from their own experience with promotions, performance
appraisals, and discussions with the leader about what the organisation values and what the
organisation punishes. Both the nature of the behaviour rewarded and punished and the
nature of the rewards and punishment themselves carry a message. Leaders could quickly
get across their own priorities, values, and assumptions by consistently linking rewards and
punishments to the behaviour they are connected with. What Schein (2004: 259) referred to
here were actual practices, what really happened, not what is espoused, published, or
preached.
To reiterate the basic point, if leaders were trying to ensure that their values and
assumptions will be learned, they should create a reward, promotion, and status system that
is consistent with those assumptions. Whereas the message initially gets across in the daily
behaviour of the leader, it is judged in the long run by whether the important rewards are
allocated consistently with that daily behaviour. If these levels of message transmission are
inconsistent, one will find a highly conflicted organisation without a clear organisational
culture or any organisational culture at all at a total organisational level.
2.9.2.6 Observed criteria for recruitment, selection, promotion, retirement and excommunication
One of the most subtle yet most potent ways through which cultural assumptions
get embedded and perpetuated is the process of selecting new staff. If a leader assumes
that the best way to build an organisation is to hire very tough, independent people and then
leave them alone and he is successful in continuing to hire tough and independent people,
he will create the kind of organisational culture that he assumes will work best. He may never
realize that the success of the organisational culture lies in the success of the recruitment

57
effort and that his beliefs about how to organise might become disconfirmed if he could no
longer hire the right kinds of people to fit his assumptions (Schein, 2004: 261).
This cultural embedding mechanism is subtle because it operates unconsciously in most
organisations. Leaders tend to be attracted to those candidates who resemble present
members in style, assumptions, values, and beliefs. They are perceived to be the best
people to hire and are assigned characteristics that will justify their being hired. Unless
someone outside the organisation is explicitly involved in the hiring, there is no way of
knowing how much the current implicit assumptions are dominating recruiters' perceptions of
the candidates. It is clear that initial selection decisions for new members, followed by the
criteria applied in the promotion system, are powerful mechanisms for embedding and
perpetuating the organisational culture, especially when combined with socialization
tactics designed to teach cultural assumptions (Schein, 2004: 261).
Basic assumptions are further reinforced through criteria of who does or does not get
promoted, who is retired early, and who is in effect excommunicated by being actually fired
or given a job that is clearly perceived to be less important, even if at a higher level.
The foregoing mechanisms all interact and tend to reinforce each other if the leader's own
beliefs, values, and assumptions are consistent. By separating these categories Schein
(2004) is trying to show in how many different ways leaders can and do communicate their
assumptions. Most newcomers to an organisation have a wealth of data available to them to
decipher what the leader's assumptions really are. Much of the socialization process is
therefore, embedded in the organisation's normal working routines. It is not necessary for
newcomers to attend special training or indoctrination sessions to learn important cultural
assumptions. They become quite evident through the behaviour of leaders.
2.9.3 Secondary articulation and reinforcement mechanisms
Design, structure, architecture, rituals, and formal statements are organisational culture
reinforcers, not organisational culture creators. These mechanisms come to be primary
organisational culture-creating mechanisms that will constrain future leaders. Schein (2004:
262) has labelled these mechanisms secondary because they work only if they
58
are consistent with the primary mechanisms discussed above. When they are consistent,
they begin to build organisational ideologies and thus to formalise much of what is informally
learned at the outset. If they are inconsistent, they either will be ignored or will be a source of
internal conflict.
All the items in this list can be thought of at this stage as cultural artefacts that are highly
visible but may be difficult to interpret without insider knowledge obtained from observing
leaders' actual behaviours. When an organisation is in its developmental phase, the driving
and controlling assumptions will always be manifested first and most clearly in what the
leaders demonstrate in their own behaviour, not in what is written down or inferred from
visible designs, procedures, rituals, stories, and published philosophies (Schein, 2004: 263).
2.9.3.1 Organisation design and structure
The requirements of the primary task - how to organise in order to survive in the external
environment - seem to get mixed up with powerful assumptions about internal relationships
and with theories of how to get things done that derive more from the leader's background
than from current analysis. The organisations design is often built around the talents of
organisational management team rather than the external task requirements (Schein, 2004).
Leaders often have strong theories about how to organise for maximum effectiveness. Some
assume that only they can ultimately determine what is correct; therefore, they build a
tight hierarchy and highly centralised controls. Others assume that the strengths of their
organisation is in their people and therefore build a highly decentralized organisation that
pushes authority down as low as possible. Some leaders believe in minimising
interdependence in order to free each unit of the organisation; others believe in creating
checks and balances so that no one unit can ever function autonomously (Schein, 2004:
264).
Beliefs also vary about the stability of a given structure, with some leaders seeking a solution
and sticking with it, while others, are perpetually redesigning their organisation in a search for
solutions that better fit the perceived problems of the ever-changing external conditions. The
initial design of the organisation and the periodic reorganisations that organisations go

59
through thus provide ample opportunities for the leaders to embed their deeply held
assumptions about the task, the means to accomplish it, the nature of people and the right
kinds of relationships to foster among people. Some leaders are able to articulate why they
have designed their organisation the way they have; others appear to be rationalizing and
are not really consciously aware of the assumptions they are making, even though such
assumptions can sometimes be inferred from the results (Schein, 2004: 264).
2.9.3.2 Organisational systems and procedures
The most visible parts of life in any organisation are the daily, monthly, quarterly, and annual
cycles of routines, procedures, reports, forms, retention and progression schedules and other
recurrent tasks that have to be performed. The origin of such routines is often not known to
participants or sometimes even to senior management, but their existence Iends structure
and predictability to an otherwise vague and ambiguous organisational world. The
systems and procedures thus serve a function quite similar to the formal structure in that they
make life predictable and thereby reduce ambiguity and anxiety. Though employees often
complain of stifling bureaucracy, they need some recurrent processes to avoid the anxiety of
an uncertain and unpredictable world, says Schein (2004: 265). Staff, seeks this kind of
stability and anxiety reduction, and leaders have the opportunity to reinforce their
assumptions by building systems and routines around them.
Systems and procedures could formalize the process of “paying attention” and thus reinforce
the message that the leader really cares about certain things. Formal budgeting or planning
routines are often adhered to less to produce plans and budgets and more to provide a
vehicle to remind subordinates of what the leader considers to be important matters to pay
attention to (Schein, 2004: 265).
If leaders did not design systems and procedures as reinforcement mechanisms, they would
open the door to historically evolved inconsistencies in the organisational culture or weaken
their own message from the outset. Thus, a strong leader who believed managers should be
in full control of their own operations should ensure that the organisation’s financial control
procedures were consistent with that belief.

60
2.9.3.3 Rites and rituals of the organisation
Rites and rituals are viewed as central to the deciphering as well as to the communicating of
cultural assumptions (Deal & Kennedy, 1982; Trice & Beyer, 1993). From the point of view of
the leader, if one can ritualise certain behaviours that one considers important, that becomes
a powerful reinforcer.
2.9.3.4 Design of physical space, facades, and buildings
The physical design category is intended to encompass all the visible features that the
organisation would encounter. The messages that can be inferred from the physical
environment, as in the case of structure and procedures, potentially reinforce the leader’s
message, but only if they are managed to do so (Steele, 1973). If they are not explicitly
managed, they may reflect the assumptions of the leader in the organisation.
Leaders who have a clear philosophy and style often choose to embody that style in the
visible manifestations of their organisation. They reflect the basic assumptions of how work
gets done, how relationships should be managed, how one arrives at the truth.
2.9.3.5 Stories about important events and people
As a group develops and accumulates a history, some of this history becomes embodied in
stories about events and leadership behaviour (Martins & Powers, 1983; Wilkins, 1983).
Stories whether in the form of a parable, legend, or even a myth reinforce assumptions and
teaches assumptions to newcomers. Leaders cannot always control what will be said about
them in stories, though they can certainly reinforce stories that they feel good about and
perhaps can even launch stories that carry desired messages. Leaders can make
themselves highly visible to increase the likelihood that stories will be told about them, but
sometimes attempts to manage the message in this manner backfire; that is, the story may
focus more on the inconsistencies and conflicts that observers detect in the leader (Schein,
2004: 269).

61
2.9.3.6 Formal statements of organisational philosophy, creeds, and charters
The final mechanism of articulation and reinforcement to be mentioned is the formal
statement, the attempt by the leader to state explicitly what their values or assumptions are.
These statements typically highlight only a small portion that operates in the group and, most
likely, highlight only those aspects of the leader's philosophy or ideology that lend
themselves to public articulation. Such public statements may have a value for the leader as
a way of emphasising special things to be attended to in the organisation, as values around
which to rally the troops, and as reminders of fundamental assumptions not to be forgotten.
However, formal statements cannot be viewed as a way of defining the organisation's
culture. At best they cover a small, publicly relevant segment of the organisational culture,
those aspects that leaders find useful to publish as an ideology or focus for the organisation.
An understanding of the primary embedding mechanisms and secondary reinforcing
mechanisms clarify how leaders “embed the assumptions that they hold and thereby create
the conditions for organisational culture formation” (Schein, 2004: 270). The strength of the
organisational culture and its effects on organisational performance will now be discussed.
2.10 Measuring organisational culture: Organisational Culture Profile (OCP)
Schein developed his theory through qualitative methods. However, this study attempts to
investigate Schein’s qualitative assertions quantitatively. Interest in the concept of
organisational culture has exploded in the past two decades. Researchers have approached
the topic with a wide array of theoretical interest, methodological tools and definitions of the
concept itself. Debate over fundamental issues of theory and epistemology is intense (Martin,
1992; Trice and Beyer, 1993). While some see attempts to measure organisational cultures
and their effects on organisations as problematic (Schein, 1985; Siehl and Martin, 1990;
Martin, 1992; Alvesson, 1993a), a large body of research starts from the assumption that
organisational culture is a measurable characteristic of organisations (O’Reilly and Chatman,
1996, Rousseau, 1990). These studies do not seek to interpret the meaning of the different
organisational cultures or cultural forms per se but, rather, focus on their consequences for
organisational behaviour and processes. Studies of the effects of strong organisational
cultures for organisations performance fall within this tradition. O’Reilly and Chatman’s
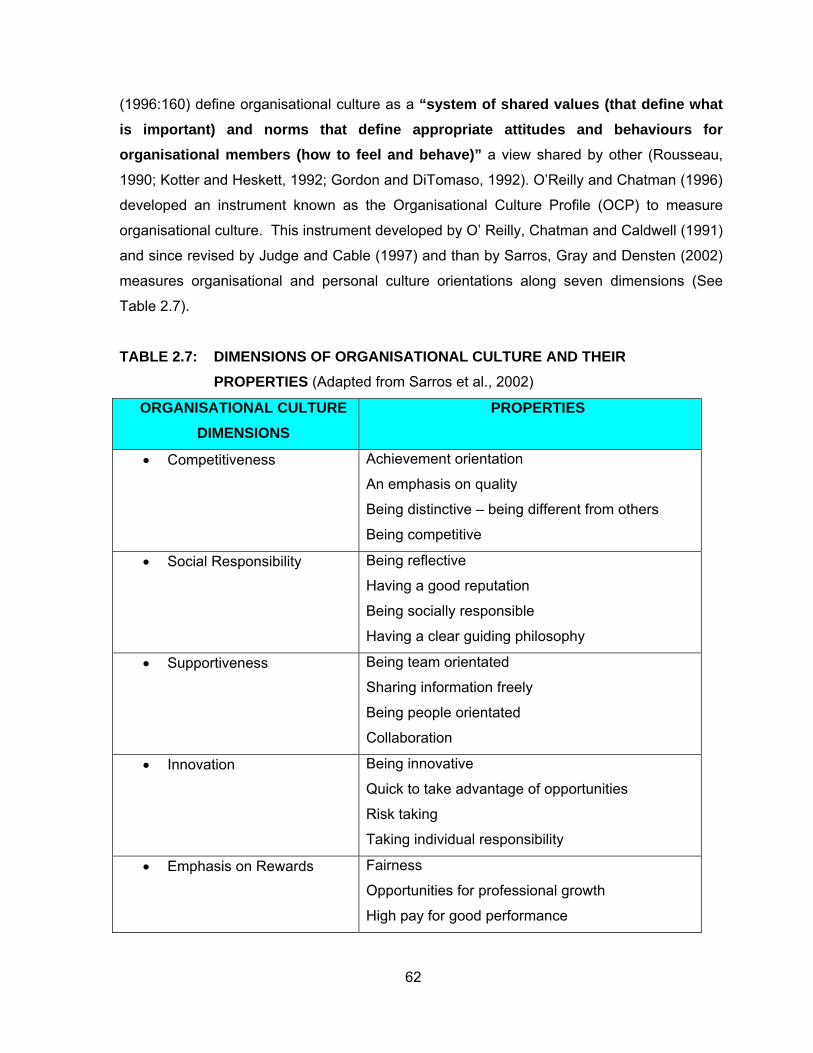
62
(1996:160) define organisational culture as a “system of shared values (that define what is important) and norms that define appropriate attitudes and behaviours for organisational members (how to feel and behave)” a view shared by other (Rousseau,
1990; Kotter and Heskett, 1992; Gordon and DiTomaso, 1992). O’Reilly and Chatman (1996)
developed an instrument known as the Organisational Culture Profile (OCP) to measure
organisational culture. This instrument developed by O’ Reilly, Chatman and Caldwell (1991)
and since revised by Judge and Cable (1997) and than by Sarros, Gray and Densten (2002)
measures organisational and personal culture orientations along seven dimensions (See
Table 2.7).
TABLE 2.7: DIMENSIONS OF ORGANISATIONAL CULTURE AND THEIR PROPERTIES (Adapted from Sarros et al., 2002)
ORGANISATIONAL CULTURE DIMENSIONS
PROPERTIES
• Competitiveness
Achievement orientation
An emphasis on quality
Being distinctive – being different from others
Being competitive
• Social Responsibility Being reflective
Having a good reputation
Being socially responsible
Having a clear guiding philosophy
• Supportiveness Being team orientated
Sharing information freely
Being people orientated
Collaboration
• Innovation Being innovative
Quick to take advantage of opportunities
Risk taking
Taking individual responsibility
• Emphasis on Rewards Fairness
Opportunities for professional growth
High pay for good performance
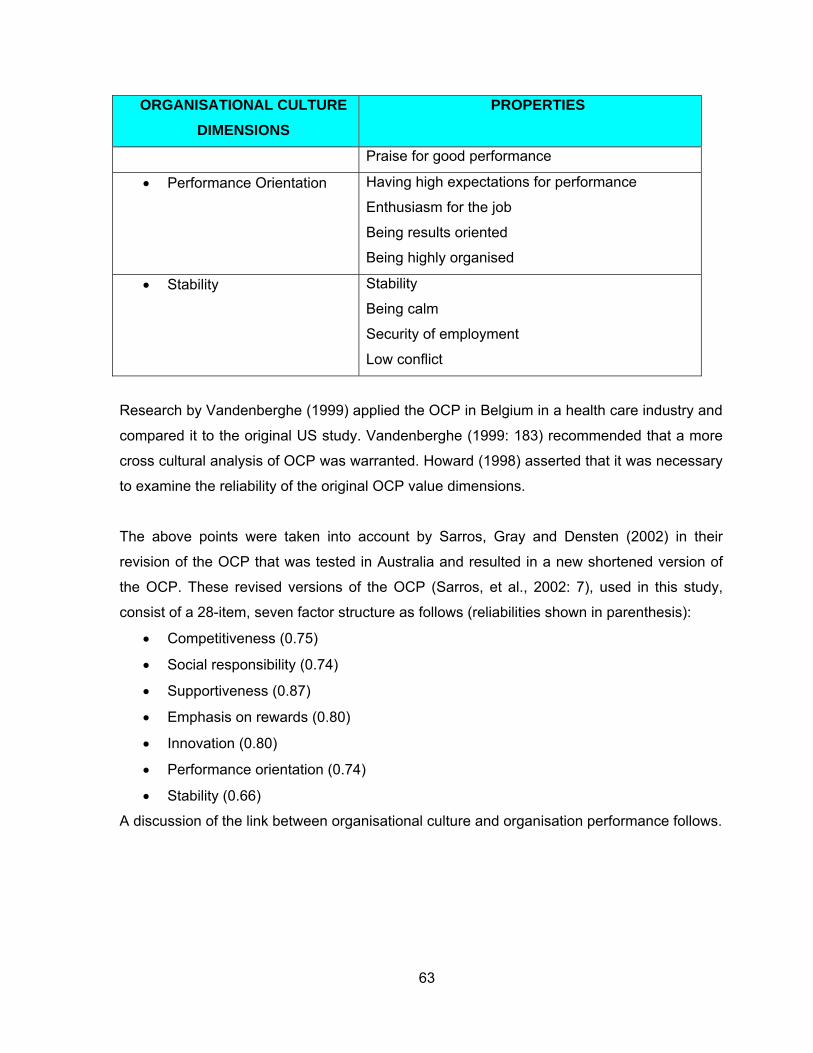
63
ORGANISATIONAL CULTURE DIMENSIONS
PROPERTIES
Praise for good performance
• Performance Orientation Having high expectations for performance
Enthusiasm for the job
Being results oriented
Being highly organised
• Stability Stability
Being calm
Security of employment
Low conflict
Research by Vandenberghe (1999) applied the OCP in Belgium in a health care industry and
compared it to the original US study. Vandenberghe (1999: 183) recommended that a more
cross cultural analysis of OCP was warranted. Howard (1998) asserted that it was necessary
to examine the reliability of the original OCP value dimensions.
The above points were taken into account by Sarros, Gray and Densten (2002) in their
revision of the OCP that was tested in Australia and resulted in a new shortened version of
the OCP. These revised versions of the OCP (Sarros, et al., 2002: 7), used in this study,
consist of a 28-item, seven factor structure as follows (reliabilities shown in parenthesis):
• Competitiveness (0.75)
• Social responsibility (0.74)
• Supportiveness (0.87)
• Emphasis on rewards (0.80)
• Innovation (0.80)
• Performance orientation (0.74)
• Stability (0.66)
A discussion of the link between organisational culture and organisation performance follows.
64
2.11 The relationship between organisation culture and organisational performance
Early studies reported mixed evidence of a positive relationship between organisational
culture strength and organisational performance (Siehl & Martin, 1990) but generally defined
organisational culture strength in terms of the content of the organisational values and
norms. More recent studies, which defined organisational culture strength in terms of the
degree of agreement and commitment to organisational values and norms, found evidence in
favour of the linkage. For example, Kotter and Heskett (1992: 19) related mean
organisational performance over a ten year period to measures of the strength of
organisational culture and found that, across twenty two different industries and 207 firms,
organisations perceived to have strong organisational cultures generally had greater average
levels of return on investment, net income growth and change in share prices. Gordon and
DiTomaso (1992) found that organisational performance of insurance companies increased
to the extent that there was consensus surrounding cultural values. Denison (1990), using
both qualitative and quantitative evidence, also suggested that consensus surrounding
organisational values increases organisational effectiveness. Burt et al., (1994) re-analysed
Kotter and Heskett’s data and found that the effect of organisational culture strength was
contingent on market context, with organisational performance benefits of strong
organisational cultures being enhanced in highly competitive markets.
Schein (1986) however, argued that: ‘many have advocated ‘strong’ organisational cultures
as a prescription for organisational success. Apart from its obvious fallacy (strong
organisational cultures have undeniably led to the demise of companies and even whole
industries)’. He further agues that this line of arguments ignores a more important issue:
Organisational culture played a different role at different stages of the life cycle. What Schein
(1986) is arguing is that strong organisational cultures are appropriate during the early start-
up and growth phase of an organisation and that strong organisational culture may not
always be suitable in later stages of the organisation’s life cycle.
Moreover, an organisational culture can be considered strong if those norms and values are
widely shared and intensely held throughout the organisation (O’Reilly & Chatman, 1996;
O’Reilly, 1989; Gordon & DiTomaso, 1992; Kotter & Heskett, 1992). This definition of
organisational culture strength, in contrast to some others, entails no assumptions about
which values and norms might enhance organisational performance (Ouchi, 1981; Deal &
65
Kennedy, 1982; Denison, 1990). The focus of this study is in establishing the relationship
between the leaders EQ, organisational culture and organisational performance.
One of the key consequences of a strong organisational culture is that it increases
behavioural consistency across individuals in a firm. Organisational culture defines a
normative order that serves as a source of consistent behaviour within the organisation. The
impact of consistency on execution is important, since organisations with excellent strategies
(high potential return) may perform poorly if they fail to execute well, and organisations that
execute their routines extremely well may compensate for suboptimal strategies.
Theorists have put forward three interrelated explanations for the organisational performance
benefits of strong organisational cultures (Kotter & Heskett, 1992). First, widespread
consensus and endorsement of organisational values and norms facilitates social control
within the firm. When there is broad agreement that certain behavioural norms may be
detected and corrected faster. Corrective actions are more likely to come from employees,
regardless of their place in the formal hierarchy. Informal social control is therefore likely to
be more effective and cost less than formal control structures (O’Reilly & Chatman, 1996).
Second, strong organisational cultures enhance goal alignment. With clarity about corporate
goals and practices, employees face less uncertainty about the proper course of action when
faced with unexpected situations and can react appropriately. Goal alignment also facilitates
coordination, as there is less room for debate between different parties about the firm’s best
interests (Kreps, 1990; Cremer, 1993; Hermalin, 2001). Finally, strong organisational cultures
could enhance employees’ motivation and organisational performance because they
perceive that their actions are freely chosen (O’Reilly, 1989; O’Reilly & Chatman, 1996).
Organisational cultures with the greatest amount of variance accounted for accentuated
fairness, opportunities for growth, were both collaborative and opportunistic, and encouraged
innovation and distinctiveness. Organisational cultures with less variance accounted for
tended to be reflective, were focused on developing a clear guiding principle under stable
and secure conditions of employment, but still retained high expectations for performance
and enthusiasm for the job. The results point to evolving organisational cultures that strive to
balance the tension between stable and secure employment conditions with the need to
constantly challenge and compete in an increasingly problematic market place.
66
Much popular and scholarly attention has been focused on the hypothesis that strong
organisational cultures defined as “a set of norms and values that are widely shared and
strongly held throughout the organisation” (O’Reilly & Chatman, 1996: 166), enhance
organisational performance. This hypothesis is based on the intuitively powerful idea that
organisations benefit from having highly motivated employees dedicated to common goals
(Peters & Waterman, 1982; Deal & Kennedy, 1982; Kotter & Heskett, 1992). In particular,
the organisational performance benefits of a strong organisational culture are thought to
derive from three consequences of having widely shared and strongly held norms and
values: enhanced co-ordination and control within the organisation, improved goal alignment
between the organisational and its members and increased employee effort. In support of
this argument, quantitative analyses have shown that firms with strong organisational
cultures outperform firms with weak organisational cultures (Kotter & Heskett, 1992; Gordon
& DiTomaso, 1992; Burt et al., 1994).
For an organisational culture to become more transformational, top management must
articulate the changes that are required. The behaviours of top level leaders become
symbols for the organisation’s new culture. It is imperative therefore that in order to
continually build upon and improve organisational leadership, that organisations begin
programmes of identifying leadership potential at an early career stage and implement
training and development regimes to nurture and promote the leadership in the company.
Bititci, Mendibil, Nadurupati, Turner and Garengo (2004) have had significant experience in
auditing and implementing performance measurement systems in industrial organisations as
part of action research programmes. During these implementations, the authors observed
that:
Organisation culture and management styles have had an impact on how
organisational performance measurement systems are implemented and used, thus
affecting its success or failure; and
organisational performance measurement systems can affect management styles
and, to a certain extent organisational culture.
Organisational culture has received much attention in the last two decades due to its effects
and potential impact on organisational success, state Rashid et al., (2002). The pioneering

67
work of Deal and Kennedy (1982) incited the interest of researchers and consultants to the
concept of organisational culture, and how these values and philosophy guide the
employees’ behaviour in the organisation towards greater success. Kotter and Heskett
(1992), for example, believe that organisational culture has a long term impact on the
performance of the organisation. Denison (1990) found that certain types of culture could
enhance organisational performance, while Van de Post, et al. (1998) found significant
relationships between organisational culture and organisational performance.
Research on organisational culture also showed that it has a relationship with financial
performance (Rashid et al., 2002:711). Kotter and Heskett (1992) found that organisational
culture has a significant impact on an organisation’s long term economic performance. They
found that organisations with organisational cultures that emphasized all the key managerial
constituencies (customers, stockholders and employees) and leadership from managers at
all levels, outperformed organisations that did not have those cultural traits by a long margin.
They also believed that organisational culture was becoming more important in determining
the success or failure of organisations in the next decade. According to Sadri and Lees
(2001), a positive organisational culture could provide immense benefits to the organisation,
and thereby a leading competitive edge over other firms in the industry. However, a negative
organisational culture could have a negative impact on the organisational performance as it
could deter organisations from adopting the required strategic or tactical changes. Such type
of organisational culture could inhabit future changes in an organisation.
Denison (1990) examined the relationship between organisational culture and organisational
performance. In the study, organisational culture was based on the perceptions of
organisational practices and conditions, to characterise the organisational culture. He found
that the organisation with participative organisational culture performed better than other
cultural types.
Organisational culture is also related to organisational strategy (Schwartz & Davis, 1981;
Scholz, 1987). Choe (1993) found a strong relationship between strategy and organisational
culture. He found that organisations pursuing the prospector strategy tends to have
developmental organisational culture, and those with defensive strategy tend to have
hierarchical organisational culture. Rashid and Anantharaman (1997) also found there was

68
an association between organisational strategy and organisational culture which is consistent
with findings by Choe (1993).
Pool (2000) examined the relationship between organisational culture and job stressors. He
found that executives working in a constructive organisational culture reduced the role
stressors. He found that executives working in a constructive organisational culture reduced
the role stressors in their working environment. There was also an inverse relationship
between role conflict ambiguity in a constructive organisational culture. However, the
passive organisational culture showed a positive relationship between role conflict, and role
ambiguity. He also believed that organisational culture (passive or constructive) could hinder
organisational performance.
Consequently, it is pertinent to note three main issues. Firstly, many researchers note that
treating organisational culture as a unitary concept reduces its value as an analytic tool
(Martin, 1992; Ogbonna & Harris, 1998; Pettigrew, 1979). Secondly, organisational culture
cannot be equated to power and politics or climate (Denison, 1996; Riley, 1983; Schein,
1986); and thirdly, there is disagreement on whether organisational culture can be easily
changed (Legge, 1994; Ogbonna, 1993).
One of the major reasons for the widespread popularity of and interest in organisational
culture stems from the argument (or assumption) that certain organisational cultures lead to
superior organisational financial performance. Many academics and practitioners argue that
the performance of an organisation is dependent on the degree to which the values of the
organisational culture are widely shared, that is, are ‘strong’ (Deal & Kennedy, 1982;
Denison, 1990; Kotter & Heskett, 1992; Ouchi, 1981; Pascale & Athos, 1981; Peters &
Waterman, 1982).
The claim that organisational culture is linked to organisational performance is founded on
the perceived role that organisational culture can play in generating competitive advantage
(Scholz, 1987). Krefting and Frost (1985) suggest that the way in which organisational
culture may create competitive advantage is by defining the boundaries of the organisation in
a manner which facilitates individual interaction and/or by limiting the scope of information
processing to appropriate levels. Similarly, it is argued that widely shared and strongly held
values enable management to predict employee reactions to certain strategic options thereby

69
minimising the scope for undesired consequences (Ogbonna, 1993). Theorists also argue
that sustainable competitive advantage arises from the creation of organisational
competencies which are both superior and imperfectly imitable by competitors (Reed &
DeFillippi, 1990). To this end, it is argued that the ‘uniqueness quality’ of organisational
culture makes it a potentially powerful source of generating advantage over competitors.
Indeed, many commentators have advised organisations and researchers to exploit the
multiple advantages which could be offered by organisational culture rather than focusing on
the more tangible side of the organisation (Johnson & Indvik, 1999; Prahalad & Bettis, 1986).
Early researchers who link organisational culture to organisational performance are
unequivocal in their claims. An illustration of this is derived from the work of the so-called
‘excellence writers’ who argue that successful organisations are distinguished by their ability
to promote cultural values which are consistent with their chosen strategies (Deal &
Kennedy, 1982; Ouchi, 1981; Pascale & Athos, 1981; Peters & Waterman, 1982). Although
this view met with initial popularity, the leader tenets of the argument have been subject to
extensive criticism (Legge, 1994; Ogbonna, 1993; Willmott, 1993).
Gordon and DiTomaso (1992) and Denison (1990) note that organisational culture will
remain linked with superior organisational performance only if organisational culture is able
to adapt to changes in environmental conditions. Furthermore, the organisational culture
must only be strong (widely shared), but it must also have unique qualities which cannot be
imitated. However, more recently, it has been suggested that the relation between
organisational culture and organisational performance is tenuous (Hopfl, Smith & Spencer,
1992; Lewis, 1994; Lim, 1995; Ray, 1986; Willmott, 1993). Indeed, the growing popularity of
the resource-based view of competitive advantage suggests that the degree to which an
organisational culture can be theorised to determine a sustainable advantage is dependent
upon the value, rarity, imitability, and sustainability of the organisational culture concerned
(Barney, 1991).
Overall, the literature on organisational culture is rich and diverse. Much of the richness is
founded on the claim by many researchers that organisational culture is linked to
organisational performance. Some researchers have argued the similarities between
organisational culture and climate and a discussion of this follows.
70
2.12 Organisational performance
2.12.1 Performance measurement
Performance measurement has received considerable criticisms in the 1980s and early
1990s for being restricted to financial measures and robust accounting methods in evaluating
the performance of organisations or more specifically their profitability. Mostly, it is argued,
that these measures ignore the softer less measurable performance indicators as well as the
relationship between different business units and their variable objectives (Kaplan & Norton,
1992; Neely, 1995). Many researchers have also referred to the number of problems that
arise from relying on such systems such as short-termism (Neely, 1995; Kaplan & Cooper,
1998). In response to these criticisms and dissatisfactions with the traditional systems new
performance measurements frameworks have developed, out of which, the most well-known
and commonly used is the balanced scorecard and a discussion of this follows.
2.12.2 The balanced scorecard
The balanced scorecard (BSC) is one of the most highly discussed management tools today
(Atkinson & Epstein, 2000) and fortune 500 companies are increasingly using it. A survey
found that approximately 50 percent of fortune 1000 companies in North America and 40
percent in Europe use a version of the BSC (Kaplan & Norton, 2001). BSC is now being
listed as a value methodology along with cost-benefit analysis and return on investment
(Field, 2000); it is being used to help change organisational culture (Simpson and Cacioppe,
2001); and several companies have reported improved operational efficiency and profitability
as a result of using BSC (Atkinson & Epstein, 2000; Gumbus, Bellhouse & Lyons, 2003).
Researchers have clearly stated that companies of all sizes are good at developing mission
statements and strategies but are poor at implementing operational strategies to achieve
them, and they are poor at measuring whether they are achieving their mission and strategy.
The BSC addresses this problem by linking the mission to strategy and then translates
strategy into operational objectives and measures.

71
Kaplan and Norton first introduced the BSC in 1990 through a one year study of 12
companies. The results were reported in the Harvard Business Review (HBR) (Kaplan &
Norton, 1992). These researchers concluded that financial measures alone were not
sufficient to measure performance. Other factors in the new economy such as competence
and knowledge, customer focus, operational efficiency and innovation were missing from
traditional financial reporting. They reported highly successful results of Rockwater and FMC
Corporation’s use of the BSC (Kaplan & Norton, 1993). In 1996, Kaplan and Norton
published ‘The balanced scorecard: Translating strategy into action’ to explain how to
develop and use the BSC (Kaplan & Norton, 1996a) and two more papers in HBR (Kaplan &
Norton, 1996b, 1996c).
Over the years, Kaplan and Norton and others have conducted research supporting their
claims that financial measures are not enough. The BSC has been successfully used to
increase performance in large organisations and reported in journal papers by the US-based
Pitney Bowes (Green, Garrity, Gumbus & Lyons, 2002), Coors Brewing company (Walker,
1996) and European-based ABB industrie A.G (Ahn, 2001) as examples of its
implementation.
The BSC has evolved from management reporting to a strategic tool used by executive
teams to set strategy, align operations, and communicate with internal and external
stakeholders (Gumbus & Lyons, 2002; Schatz, 2000). The framework of the four
perspectives of the BSC helps translate strategy into objectives and measures. The four
perspectives are financial, customer, internal process, and learning and growth (Kaplan &
Norton, 1996a). The critical success factors created in each of the four perspectives are
balanced between long term and short term, as well as internal and external factors that
contribute to the business strategy. The BSC not only translates the strategy to operational
terms but also aligns the organisation to the strategy by focusing employees on their role in
accomplishing the company mission (Frigo & Krumwiede, 2000).
The BSC provides a set of metrics that track a firms progress against goals and objectives to
meet company strategic initiatives. Motivating managers and employees and measuring their
performance are key challenges (Denton & White, 2000). The organisation as well as
individuals can monitor progress and use the card as a map to achieve business success.
Starting with strategic initiatives, a company cascades departmental and individual objectives

72
that correspond to the strategy. Reporting on these measures allows the firms to monitor
progress and easily course-correct if problems are identified. A successful BSC programme
should be a change process, not a ‘metric’ project (Kaplan & Norton, 2001).
In summary, the BSC helps an organisation in the following six ways:
• Promotes growth – due to focus on long-term strategic outcomes, not just short-term
operational results.
• Tracks performance – individual and collective results can be tracked against targets
in order to correct and improve.
• Provides focus – when measures are aligned to few critical strategies, the BSC
provides focus on what is important to the company
• Alignment to goals – when you measure what is truly important to success, the
measures become linked and support each other. Alignment occurs across the
organisation.
• Goal clarity – the BSC helps respond to the question, ‘How does what the leader
does daily contribute to the goals of the enterprise?’
• Accountability – individuals are assigned as owners of metrics in order to provide
clear accountability for results.
The organisation that is used in this study utilises the BSC approach to measure
organisational performance down to the business unit level and individual performance.
2.13 Conclusion
The link between emotional intelligence and organisational performance, the relationship
between organisational culture and organisational performance, and the interplay between
emotional intelligence and organisational culture have been studied separately. Interestingly,
few empirical studies have combined the simultaneous examination of organisational culture,
emotional intelligence, and organisational performance. Some writers suggest that:
• The emotional intelligence of a leader affects organisational performance
• Certain types of organisational culture are linked to superior organisational
performance, and

73
• Organisational culture, emotional intelligence and organisational performance are
related; the precise nature and form of interaction amongst these three concepts are
not fully understood.
As organisations wrestle with need to change and adapt to the challenges of the 21st century,
the requirement for effective leadership is seen to be paramount (Chaudhry, 2000). In
reviewing the research into leadership, it is evident that thinking has moved from a
personality or trait basis, through a behavioural and contextual stage and into the now classic
transformational/transactional models (Higgs, 2002). There is a strongly emerging view from
the different streams of work, that EQ is a critical factor in the effective leadership of the 21st
century organisations (Dulewicz & Higgs, 2003). The effective leadership of the 21st century
organisations also requires leaders to influence the organisational culture, which according to
Schein (1984) is the key to organisational excellence. Research on organisational culture
has also shown that it has a relationship with organisational financial performance (Rashid et
al., 2002:711). Kotter and Heskett (1992) found that organisational culture has a significant
impact on an organisations long term economic performance. They found that organisations
with organisational cultures that emphasized all the key managerial constituencies
(customers, stockholders and employees) and leadership from managers at all levels,
outperformed firms that did not have those cultural traits by a long margin. They also
believed that organisational culture was becoming more important in determining the
success or failure of firms in the next decade. According to Sadri and Lees (2001), a positive
organisational culture could provide immense benefits to the organisation, and thereby a
leading competitive edge over other firms in the industry. However, a negative
organisational culture could have a negative impact on the organisational performance as it
could deter firms from adopting the required strategic or tactical changes. Such type of
organisational culture could inhabit future changes in an organisation.
Clearly, further research is necessary to identify, explore, and elucidate the character and
pattern of the association amongst organisational culture, emotional intelligence, and
organisational performance. However, some literature-based conclusions can be drawn.
First, the purported relationship between emotional intelligence and organisational
performance is supported by some empirical evidence (Sala, 2001; Servinc, 2001; Cavallo &
Brienza, 2002; Sergio, 2001; Rapisarda, 2002; Bresnik, 2004), while the links between

74
organisational culture and organisational performance are supported by empirical studies
(Gordon & DiTomaso, 1992; Denison, 1990). On the basis of the studies which Higgs and
Dulewicz (1999) had done that links emotional intelligence to organisational culture, it is
possible to propose that:
There is a dynamic link between leader EQ and organisational culture with organisational performance.
75
3 CHAPTER 3: RESEARCH DESIGN AND METHODOLOGY
3.1 Introduction
In chapter 1, the context in which the study is undertaken was explored. The need for the
study was explored and the research problem and general hypothesis were formulated.
Different scientific paradigms within which research can be done were discussed, and the
choice of the quantitative approach was motivated.
In chapter 2, current theoretical and empirical knowledge about emotional competency and
emotional intelligence, organisational culture and organisational performance were reviewed.
The research design chosen and followed by the author is discussed in this chapter. The
chapter aims to give an outline of the scientific beliefs and paradigms informing the study.
The second purpose of this chapter is to propose the research approach, methodology and
describe the process to test the hypothesis developed in chapter 2. Thirdly, the methodology
selected to collect and analyse the data are described.
3.2 Research approach
Research can be conducted within mainly three paradigms. These are the quantitative,
qualitative and critical social science paradigms (Neuman, 2000; Bryman, 2004). The first
two paradigms are the most frequently used approaches in research. The critical social
science paradigm is rather a philosophy about the purpose of research than a methodology.
The philosophy of the critical social science paradigm is that any approach (e.g. qualitative or
quantitative) is acceptable as long as it contributes to the ideal of improving the quality of
society (Neuman, 2000; Bryman, 2004).
Qualitative and quantitative approaches to research are often positioned as opposing
approaches. Although there is no rule that only one approach may be used in research,
researchers usually embrace only one of the two. In the rest of this section the different

76
approaches to the research are described and the choice of a research approach for this
study is justified.
3.2.1 Scientific beliefs
Schurink (1998: 241) described the research paradigms driving quantitative and qualitative
research as follows:
• The quantitative paradigm is based on positivism, which takes scientific explanation
to be nomothetic (i.e. based on universal laws). Its main aims are to objectively
measure the social world, to test hypotheses and to predict and control human
behaviour.
• In contrast, the qualitative paradigm stems from the antipositivistic, interpretative
approach, is idiographic, thus holistic in nature, and the main is to understand social
life and the meaning that people attach to everyday life.
The differences in approach by quantitative and qualitative researchers with regard to
different research perspectives (ontology, epistemology and methodology) as described in
Table 3.1.

77
Table 3.1: Difference between the quantitative and qualitative research paradigms
Research perspective
Quantitative paradigm Qualitative paradigm
Ont
olog
y
The nature of reality
and human
behaviour.
• Believes in an objective
reality that can be
explained, controlled and
predicted by natural cause-
effect laws.
• Human behaviour can be
explained in causal,
deterministic ways.
• Discards the external
objective reality.
• Tries to understand
reality by discovering
meaning that people in
specific settings attach
to it.
• Behaviour is
intentional and
creative and it can be
explained, but not
predicted.
Epis
tem
olog
y
The relationship of
researchers to reality
and the road that
they will follow in the
search of truth.
• Researcher sees
him/herself as detached
from the object of the study.
• The researcher is therefore
objective.
• S/he does not influence the
object of the study and is
not influenced by it.
• The researcher is
subjective because
s/he interacts with the
subject.

78
Research perspective
Quantitative paradigm Qualitative paradigm M
etho
dolo
gy
Knowing how
scientific methods
and techniques
employed obtain
valid knowledge.
• Emulates natural science.
• Hypotheses are postulated
and tested in order to verify
them.
• Research is dialectical
and interpretative.
• Qualitative methods
are used to uncover
the world of the
subject.
Sources: Schurink (1998); Mouton & Marais(1996)
3.2.2 The qualitative and quantitative approaches
Qualitative research is language based and conceptualised through observations of social
reality. It describes people in their natural habitat. Quantitative research refers to
frequencies, concepts, variables and measurements of people’s perceptions and opinions.
Qualitative research normally starts with an ‘open’ agenda and is led by the evidence to a
conclusion. In contrast, quantitative research starts from definite hypotheses, postulates or
propositions that are either supported or not supported by empirical evidence during the
research. Schurink (1998: 241) describes the differences between the two approaches in
Table 3.2.
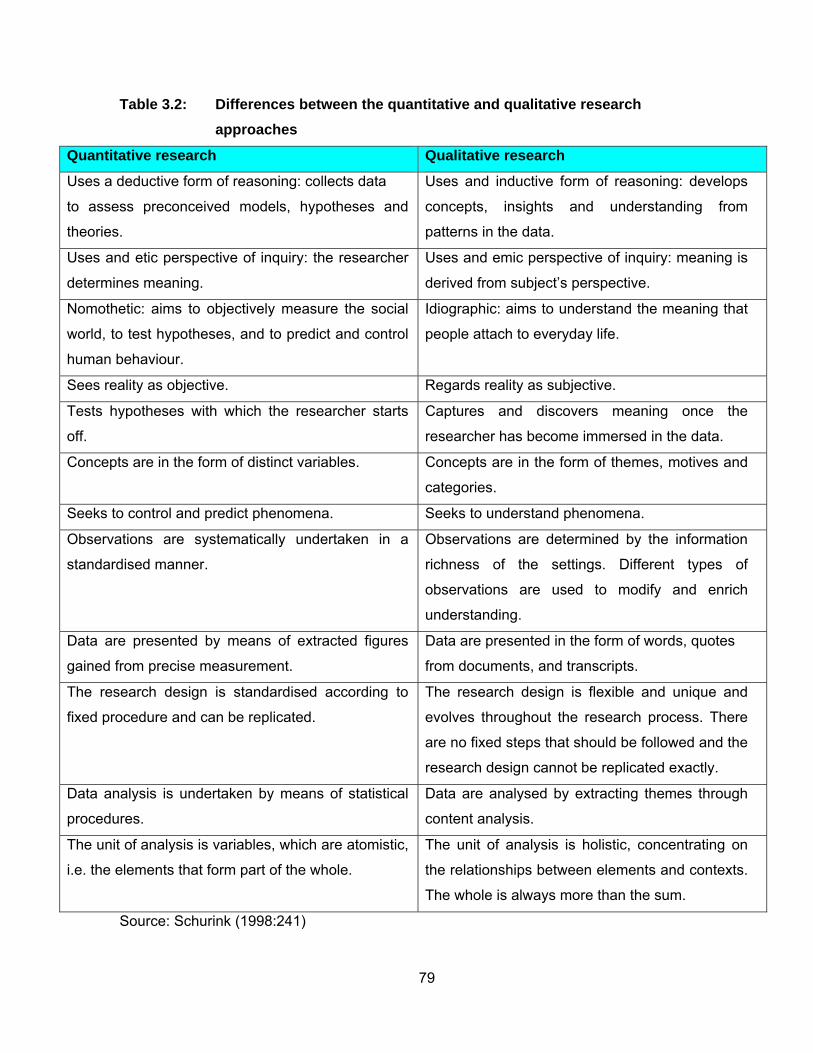
79
Table 3.2: Differences between the quantitative and qualitative research approaches
Quantitative research Qualitative research
Uses a deductive form of reasoning: collects data
to assess preconceived models, hypotheses and
theories.
Uses and inductive form of reasoning: develops
concepts, insights and understanding from
patterns in the data.
Uses and etic perspective of inquiry: the researcher
determines meaning.
Uses and emic perspective of inquiry: meaning is
derived from subject’s perspective.
Nomothetic: aims to objectively measure the social
world, to test hypotheses, and to predict and control
human behaviour.
Idiographic: aims to understand the meaning that
people attach to everyday life.
Sees reality as objective. Regards reality as subjective.
Tests hypotheses with which the researcher starts
off.
Captures and discovers meaning once the
researcher has become immersed in the data.
Concepts are in the form of distinct variables. Concepts are in the form of themes, motives and
categories.
Seeks to control and predict phenomena. Seeks to understand phenomena.
Observations are systematically undertaken in a
standardised manner.
Observations are determined by the information
richness of the settings. Different types of
observations are used to modify and enrich
understanding.
Data are presented by means of extracted figures
gained from precise measurement.
Data are presented in the form of words, quotes
from documents, and transcripts.
The research design is standardised according to
fixed procedure and can be replicated.
The research design is flexible and unique and
evolves throughout the research process. There
are no fixed steps that should be followed and the
research design cannot be replicated exactly.
Data analysis is undertaken by means of statistical
procedures.
Data are analysed by extracting themes through
content analysis.
The unit of analysis is variables, which are atomistic,
i.e. the elements that form part of the whole.
The unit of analysis is holistic, concentrating on
the relationships between elements and contexts.
The whole is always more than the sum.
Source: Schurink (1998:241)

80
To understand the different research processes, the methodologies of the quantitative and
qualitative approaches to research need to be understood. These differences, as
summarised by De Vos (1998: 40), are set out in Table 3.3.
Table 3.3: Differences between the quantitative and qualitative research processes
Steps Quantitative approach Qualitative approach
1 Choose a research
problem/topic/theme.
Choose a research
problem/topic/theme.
2 Identify the problem. Consider the underlying assumptions
in order to decide whether they will be
the researcher’s choice.
3 Review the relevant literature and
related research.
Select the specific qualitative design to
be used.
4 Formulate the problem formally. Plan qualitative sampling.
5 Write out a research proposal. Delineate the researcher’s role (e.g.
how entry to the research site will be
gained and consideration of ethical
issues).
6 Define each of the central concepts
theoretically and operationally.
Establish the protocol for recording
information.
7 Reformulate the research problem in
the form of testable hypotheses.
Write out a research proposal.
8 Select a research design. Collect the information through
observation, interviews, documents
and visual material. Record
immediately.
9 Select the data-collecting methods and
measuring instruments.
Process the data (preparing for
analysis), i.e. reduce the data to
themes and categories with the aid of
coding procedures.
10 Conduct a pilot study. Analyse and interpret, i.e. put it all
together and draw conclusions.

81
Steps Quantitative approach Qualitative approach
11 Draw the sample(s). Ensure internal validity e.g. by
assessment criteria.
12 Collect the data (i.e. execute the
selected research design).
Write the research report: plan the
narratives; compare with theories and
literature (literature control).
13 Process, analyse and interpret the
data.
---
14 Write the research report. ---
Source: De Vos (1998:40)
3.2.3 Research approach selected
The purpose of this research is to examine the dynamic effect of a leader EQ (measured
using the HayGroup ECI 2.0 instrument) and organisational culture strength (measured as
values and norms) on the performance of an organisation. It is argued that the extent to
which a leader is successful in building a strong culture will positively correlate with
organisational performance. However, extant theory suggests a leader’s EQ does influence
the leader’s success in building a strong culture. While a great deal of research has been
done on EQ, there is no systematic research that has examined the black box of the
hypothesized relationships suggested by the work of Schein (1992, 2004) and that of
Goleman et al. (2002).
Given the primary research question, this study is framed within the positivist research
paradigm (approach), that is it is quantitative in nature; the main purpose being to describe
and explain (Neuman, 2000: 22). The quantitative paradigm is considered appropriate for this
study as it involves the systematic collection of observable, measurable data, the statistical
analysis of the data and the development of a statistical model. The aim is to empirically
examine the relationship among variables that are measurable and that have accepted
validated measurement instruments. Additionally, the research attempts to quantitatively link
the relationship among a specified set of variables. All of the concepts of interest in the
present study have accepted measures and cannot be described as underdeveloped
phenomenon.

82
The research is conducted within the ideals of a scientific approach. A scientific approach
can be defined as “…the systematic, controlled, empirical, amoral, public and critical
investigation of natural phenomena. It is guided by theory and hypotheses about the
presumed relations amongst such phenomena” (Kerlinger & Lee, 2000:14).
The basic aim of science is to build theory. “A theory is a set of interrelated constructs,
definitions, and propositions that present a systematic view of phenomena by specifying
relations among variables, with the purpose of explaining and predicting the phenomena”
(Kerlinger & Lee, 2000, p. 11). Concepts are the building blocks of the theory (Neuman,
2000; Bryman, 2004). Theories are general and apply to many people and places. Theories
are tentative explanations for observable phenomena (Mouton & Marais, 1996). Social theory
is a system of interconnected abstractions or ideas that condenses and organises knowledge
about the social world.
Theories are regarded as the working truth until they are reviewed during empirical research.
Each theory is evaluated empirically to determine how well it predicts new findings. Theories
could be used to guide the research plan by generating testable hypotheses and organise
facts from testing these hypotheses.
The ultimate purpose of research is scientific explanation: to discover and document
universal laws of human behaviour (Neuman, 2000). According to Goodwin (2000), a theory
in psychology is a set of consistent statements about some behavioural phenomenon:
• that best summarises existing empirical knowledge of the phenomenon;
• organise this knowledge in the form of precise statements of relationships among
variables;
• provides tentative explanations of the phenomenon; and
• serves as the basis for making predictions about behaviour.
Theory exists on different levels. Micro-level theory deals with theories explaining behaviour
at a micro-level. Macro-level theory refers to theory of larger aggregates. Meso-level theory
attempts to link micro and macro level theories. This study is positioned at a meso-level
because it links EQ and organisational culture variables with organisational performance.
Research is systematic and controlled and therefore has the potential to have fewer errors
(Neuman, 2000). People have confidence in the outcomes of the scientific research because
83
it is empirical. Empirical refers to the way scientific information is collected through the
senses and specialised scientific techniques. In scientific research the personal beliefs of the
researcher are put outside the scientific investigation and the ideal of objectivity is pursued.
Scientific research is subjected to independent testing such as peer review. Science is a
social institution and a way of producing knowledge. This includes both the systems for
producing knowledge and the knowledge produced from the system. Knowledge in science is
organised in terms of theories. According to Neuman (2000), the norms of the scientific
community include the following:
• Universalism. Research conducted anywhere by any institution is judged on its
scientific merit.
• Organised scepticism. Scientist do not accept new ideas in a carefree or uncritical
way.
• Disinterestedness. Scientist must be neutral, impartial, receptive and open to
unexpected observations and new ideas.
• Communalism. Scientific knowledge must be shared with others.
• Honesty. Scientific research requires honesty. Dishonesty is a major taboo.
This study makes a contribution to the body of knowledge about the relationship among
leaders EQ, organisational culture and organisational performance. It follows the ideals of
the scientific approach and is subject to all the norms followed by the scientific community in
pursuing a quantitative approach.
3.3 Research objectives, problems, hypotheses, constructs, variables and empirical research questions
3.3.1 Problem statement and objectives of the study
The purpose of this research is to examine the dynamic effects of leader EQ and/or
organisational culture strength (measured as values and norms) on organisational
performance. Currently, in South Africa, 95% of the registered companies are in the start-up
early growth phase of their organisational life cycles (Naude and Krugell, 2003). It is also

84
recognised from literature that the growth of any economy is largely dependent on the
survival and success of the start-up early growth organisations. The extent to which a leader
is successful in building a strong culture may positively influence performance and the ability
of the organisation to progress and grow. The second purpose of this empirical study will be
to test these relationships. Its scholarly contribution will be to offer knowledge that should
shed light upon the critical linkage among EQ, organisational culture and organisational
performance.
3.3.2 Research hypotheses
Hypotheses are statements that describe the relationship or difference between two or more
variables related to the research problem or statement. Hypotheses are generated in two
ways. Firstly, they are deducted from existing theories and models within a discipline.
Secondly, they are inductively derived from observations, experience and visualisation. The
latter approach is used in unstructured research (Mouton & Marais, 1996; Kerlinger & Lee,
2000; Bryman, 2004). Hypotheses are normally formulated as relationships that need to be
tested. A hypothesis can also be described as conjectural statement of the relationship that
exists between two or more variables.
In quantitative research the concept of a null hypothesis refers to the relationship where it is
postulated that no relationship exists between the variables. The objective of the research
procedure is to “disprove” the null hypothesis or to prove that the relationship between
variables is not coincidental. Hypotheses are predictions of some specific event with a
probability greater than chance. The prediction is based on theory. The hypothesis guides
the study to prove its correctness. If enough evidence is found that the hypothesis is true, the
confidence that the theory is good increases (Goodwin, 2000).
In order to achieve the general aim of this research, the following serve as the main
hypotheses:

85
H0: There is no relationship between the dimensions of the leader EQ and the
dimensions of organisational culture on organisational performance.
H1: There is a relationship between at least one dimension of EQ and at least one
dimension of organisational culture on organisational performance.
The sub hypotheses can be stated as:
H0a: There is no relationship between the dimensions of EQ and organisational
performance.
H1a: There is a relationship between the dimensions of EQ and organisational
performance.
H0b: There is no relationship between the dimensions of organisational culture and
organisational performance.
H1b: There is a relationship between the dimensions of organisational culture and
organisational performance.
H0c: There is no relationship between any linear combination of the leader EQ dimensions
and any linear combination of the organisational culture dimensions.
H1c: There is a relationship between at least one linear combination of the leader EQ
dimensions and at least one linear combination of organisational culture dimensions.
3.3.3 Research concepts and constructs
Concepts are generalised terms/names used prior to the conceptualisation of constructs.
Concepts consist of two parts, a symbol (word or term) and a definition (Neuman, 2000;
Mouton & Marais, 1996). Concepts are the most elementary linguistic constructions with
which human beings describe and understand reality. Concepts consist of two basic
elements, connotation (or sense) of the concepts and reference. Connotation refer to the
meaning that people attach to concepts while reference refers to the collection of
happenings, characteristic, actions and processes that are included when a concept is used
(Mouton & Marais, 1996: 60-61).

86
During the conceptualisation phase of the research, the concepts (words/terms) applicable to
the theoretical study are refined and specified to clarify their meaning prior to their becoming
constructs. Constructs are then operationally defined. Constructs are formed through
generalisations about the detail items that form factors. Multiple items are needed to form
constructs. Where multiple items are used, techniques such as factor analysis can be used
to build construct reliability. Constructs are deliberately invented and developed for a specific
scientific meaning (Kerlinger & Lee, 2000; Mouton & Marais, 1996; De Vos, 1998). In this
study the key constructs are emotional intelligence, organisational culture and organisational
performance
In order to communicate in an unambiguous way, clarity about concepts is necessary. To
measure constructs, measurement instruments need to be developed that will allow the
researcher to collect valid information about the constructs that are studied.
3.3.4 Research variables
Variables are constructs (in other words, constructs formulated from multiple items identified
as empirical factors that meet minimum reliability criteria) used in the research process.
Variables could be dependent (presumed effect) or independent (the cause). For example, a
value can be attached to a construct that relates to the predictability of the influence that the
construct has on the outcome of organisational performance. This allows the researcher to
assign cause (independent variables) and effect (dependent variables) status to variables.
Other values can be assigned to variables. Variables include, among others, stimulus and
response (as described above) and attribute variables. Attribute variables are variables that
cannot be manipulated, for example, heraldic factors and psychological attributes (Kerlinger
& Lee, 2000).
In the research process the researcher uses the independent variables to ultimately predict
the relationship with the dependent variables. Emotional intelligence was measured using the
ECI instrument, organisational culture was measured using the OCP instrument and
organisational performance was measured using the leader performance appraisal score and

87
the organisational unit performance score.
Figure 3.1: The research variables
The three way relationship between the EQ and organisational culture, EQ and
organisational performance, organisational culture and organisational performance was
tested independently and then repeated with the moderator variables (see figure 3.1 above).
Independent variables are constructs formulated during factor analysis. They are empirically
identified and consist of more than four items to prevent pseudo variables. Multiple items
also enable factor analysis (Mouton & Marais, 1996). Independent variables influence the
dependent variable(s). There are 72 ECI items and 28 OCP items identified as part of
existing instruments that will be used during the empirical study.
Control variable: Single company with multiple sites Independent variable(s)
• ECI • OCP
Dependent variable(s) • OCP • Performance
Moderator variable(s) • Age of the leader • Gender of the leader • Race of the leader • Years in the leader
position • Years in
organisational employ • Leader qualifications • Number of employees • Number of years the
unit has existed for

88
The dependent variable(s) is the extent to which the variable organisational performance is
influenced by the leaders’ emotional competency inventory and/or organisational culture. The
organisational performance data, which is the leader’s key performance appraisal score, was
sourced from the human resources department. These scores are used to determine
individual performance and the individual slice of the performance bonus pool.
Moderator variables are variables that exist in the background. They are not deliberately
created, identified or introduced. Moderator variables are present, however, and they may
have an effect on the dependent or independent variables. During the research process the
relationship between the three categories of factors was investigated. Six moderator
variables were identified that may influence the dependent and independent variables: Age
of the leader; race of the leader; qualifications of the leader; number of years worked in the
leadership position; number of employees reporting to the leader and the number of years
the organisational unit has been in existence for. Gender of the leader and years in the
company employ are two variables which were collected but did not play any part in the
analysis. Of the eight moderator variables collected: age of the leader and race of the leader
was collected as part of standard demographic data. Gender and qualification data was
collected to verify the emotional intelligence assertions that woman make better leaders
(Mandell & Pherwani, 2003; Mayer, Caruso & Salovey, 1999) and Goleman’s assertions that
beyond a certain threshold level, technical qualifications contribute very little to emotional
competency (Goleman, 1998b; HayGroup, 2005b). The remaining moderator variable data
was collected to ensure that the culture measurement criteria for the organisational unit, as
derived from Schein’s (1992, 2004) work were fulfilled. For an organisational unit culture to
be evaluated, the organisational unit needed to have existed for more than 3 years, have
people who have worked together and shared experience of the organisational unit existence
and the leader (TSO) needed to be in the position since the creation of the unit/ organisation.

89
3.4 Research methods
3.4.1 The study sample
3.4.1.1 The study setting
The major contribution of this study is that it is the first empirical test of the relationships
among EQ, organisation culture and organisational performance. While these have been
measured in two-way relationships, there is no research that has attempted to establish
these linkages, especially in the context of Schein’s (1983) seminal theory that organisational
culture strength is critical for organisational performance in the early years of an
organisation’s life cycle.
The ability to replicate a scenario and dictate a particular outcome; the ability to exclude,
isolate, or manipulate the influence of a variable in a study; a critical factor in inference from
an experiment, implies that all factors, with the exception of the independent variable, must
be held constant and not confounded with another variable that is not part of the study
(Cooper & Schindler, 2001: 760; Mitchell & Jolley, 2007). In this study, one of the main
reasons for studying a single company with multiple units geographically dispersed was to
allow the researcher to keep certain variables constant. The choice of a single company
kept vision, strategy, structure, systems, processes, HR practices, finance and marketing
constant.
The study was conducted at a large South African, autonomous, multi-unit industrial
organisation. The group consisted of 6 decentralised autonomous regions. In all of the
regions there are at least 205 geographically dispersed business units, catering for the
technical needs to the greater South African community. Each of these business units has an
operating and capital budget in the region of R15 million to R30 million, a staff complement of
between 15 and 50, and a leader/manager appointed to ensure that the business unit objects
are achieved. The group has more than 15 000 employees and is a major player in its
targeted market. During the period of the research the group received several external
awards and accolades. The organisational operating model is shown in Table 3.4.

90
3.4.1.2 The organisational business model
Table 3.4: The organisation’s operating model
Wires Business (Engineering/Networks)
Customer Categories Retail Business (Customer Services)
Overall management of
network infrastructure in the
delivery of services to the
end user
• Residential
• Traction
• Agricultural
• Key Customers
• Commercial
• Redistributors
• Prepaid
• Mining and Industrial
Purchase services from the
wholesale market and sell to
the end user/ redistributors
(Municipalities)
Functional area:
• Construction of network
infrastructure
• Installation of meters
• Inspection, testing,
upgrade and
maintenance of
equipment
• Technical customer
connections and
disconnections
Functional Area:
• Sales and Marketing
• Energy Trading
• Customer Services
• Pricing and Tariff planning
• Call Centre
• Billing
The Group Business Model consists of two core business areas: Engineering (Wires
Business) and Customer Services (Retail Business). The Wires Business is responsible for
the creation and maintenance of infrastructure, whilst the Retail Business provides retail
services for customers with a pre-defined consumption limit per annum. The functions of the
core businesses are depicted below.
The Customer Service operations are managed in 24 Customer Service Areas covering the
whole of South Africa. Engineering operations are aligned to 205 Technical Services
Centres, organised internally into 32 Field Service Centres across South Africa. All the group
operational assets are managed at regional level to ensure the correct application of local
knowledge and to provide an adequate level of management flexibility to the business.

91
3.4.1.3 Field Services
Figure 3.2 below shows the regional wires business (engineering/networks) part of the
operating model. The study was undertaken in the field services part of the business and the
unit of analysis of the study was the Technical Services Officer (TSO) highlighted in red on
the organogram, who is the leader/ manager of Technical Services Centre (TSC). The
people highlighted in green on the organogram form part of the study sample. Two hundred
and five (205) Technical Services centres were targeted to be study participants.
Figure 3.2: Regional Field Services Organisational Chart
3.4.1.4 Background to the creation of Field Services Centres and Technical Services Centres
3.4.1.4.1 The history of the TSC
In 1997, the organisation embarked on a process of change to address the inefficiencies
created in the field services area. This restructuring of field services resources was to place
them in a position to respond timeously to customer and client needs in the most effective
manner. The basic building block specified the organisation, technology, process, people,
tools, equipment and infrastructure in proportions which were suitable for the specific jobs.
This restructuring gave rise to the Field Services Centres and the Technical Services
Engineering Manager x (6)
Network Services Manager
Service delivery Manager
Field Service Manager
Capital Projects Manager
Risk Manager Training Manager
Technical Specialist Manager
Field Services Centre Manager x (32)
Technical Support Manager
Field Services Engineer
Technical Services Officer x (205)
Senior Administration Officer
Works Coordinator
Senior Clerk Store Person Principal Technical Officer x (n)
Senior Technical Officer x (n)
Technical Officer x (n)

92
Centres. One of the key reasons for the restructuring was to destroy the depot mentality
which existed prior to the 1994 dispensation. The focus of the study here is on the TSC.
Thus, the use of the TSC as the unit of analysis allowed for an examination of Schein’s
model which argues that a leader in the early phases of a new organisation must engage in
behaviours to support the development of a strong culture. Given that these TSCs were only
established in 1997, Schein (1985, 1992, 2004) also stated that the early growth stage of the
organisation is the critical period in which the organisational culture is created.
3.4.1.4.2 Field services centres
Field service centres are strategically placed offices that manage all field services resources
and dynamic network operating for a region. It is a centre where the medium and long term
operational plans and budgeting takes place.
3.4.1.4.3 Technical services centre (TSC)
The description of a TSC is as follows:
• Technical services centres are geographically placed field execution resources pools that
reflect the network and customer demographics. Fieldwork execution is managed from
these institutions. All maintenance, repairing, building and other work are executed from
this institution and will be reflective of the customer and system base. Each TSC typically
has 10 to 50 staff.
• TSC staff members respond to service faults within +/- 60 minutes of the problem being
reported.
• The main functions of the TSC staff include maintenance, repairing and building
distribution networks.
• The TSC staff work within a defined geographical area and serve all the customers
therein.
• The distribution, reticulation and urban networks are combined in one (Field Service
Centre) FSC.
• The TSO (Technical service officer) manages a fleet of 10/15 vehicles.

93
• The TSO manages external operational contracts.
• The TSO optimises the resources under his management.
• The TSO manages standby and overtime work.
• A staffing model is used as base for staffing numbers.
• All TSC staff report to Technical Services Officer (TSO).
3.4.1.4.4 Technical services officer (TSO)
The TSO or leader/manager must ensure that for a designated geographical area, the
customer’s technical needs and business objectives are satisfied by managing all allocated
resources in accordance with the group standards, procedures, directives, work practices,
guidelines, policies and service agreements.
3.4.1.4.5 TSO key performance areas
The key performance areas according to the researched organisation’s BSC is as follows: • Human Resources
• Work Execution
• Statutory and Regulatory Compliance
• Network Asset Management
• Finance and Commercial
• Network Operations
• Contractor Management
• Customer Services
As will be noted later, two dimensions of organisational performance were evaluated. The
TSC competition scores measures the success of the TSC in managing the above key
performance indicators. The second measure of organisational performance is the TSO
performance appraisal score. This is an individual measure and evaluates how well he/she
managed the TSC.
94
3.4.1.4.6 Sample selection criteria
In the first stage, the founding and early growth of a new organisation, the main cultural
thrust comes from the founders and their assumptions (Schein, 1985). In choosing the
sample to undertake the study it is important to make sure that the founders/ original leaders
were still in place at the TSCs. The TSCs were created in early 1997 in response to the
changes in the way the organisation delivered its field services and also to address the key
growth and equity issues highlighted by the new South African government. Most of the
TSOs (approx 80%) initially chosen to create the new TSC structure were still in their current
position.
• There cannot be an organisational culture unless there is a group that ‘owns’ it.
Culture is embedded in groups; hence the creating group must always be clearly
identified. A given group is a set of people:
o Who have been together long enough to have shared significant problems;
o who have had opportunities to solve these problems and to observe the effect
of their solutions; and
o who have taken in new members.
A group’s culture cannot be determined unless there is such a definable set of people with a
shared history (Schein, 1984). The age of the organisation is important in choosing the
sample as it addresses the point that Schein makes about an organisation having had a
shared history. For the purposes of this study it was important to choose an organisation that
had to survive and in that process developed a culture. According to the organisational life
cycle, empirical studies done by Hanks, Watson, Jansen and Chandler (1993) and Lester,
Parnell and Carraher (2003) highlight that organisations in the start-up/early growth phase
are considered to be organisations that are:
• Less than 10 years old but more than 3 years old.
• Have the founder as leader of the organisation.
• Have simple structures and systems.
At the time of data collection, the TSCs were 8 years old.

95
3.4.1.4.7 The questionnaire
The questionnaire consists of the ECI instrument, the OCP instrument and the moderator
variables was distributed to 130 of the 205 business units (Appendix A-D). From each
business unit 7 questionnaires where completed by the following:
• The business unit area manager (FSAM).
• Colleague of the business unit manager (FSE).
• The business unit leader/manager and (TSO).
• Four questionnaires from a cross section of the business unit were filled in,
representing the different levels of staff within the business unit and reporting to the
(TSO), hereafter referred as the ‘staff’ comprised the following:
o Principle technical officer (PTO)
o Senior technical officer (STO)
o Technical officer (TO)
o Works coordinator (WC).
3.4.2 Data collection procedures
Data collection is the process of obtaining data. In this study, data were obtained for the
independent variables and moderator variables through an administered questionnaire. The
TSO performance appraisal data were sourced separately by the company HR department
as part of its annual business unit and individual performance appraisal. This eliminated the
problem of common method variance (Mouton, 1996).
3.4.2.1 Data sources for all variables
3.4.2.1.1 Emotional intelligence
Emotional intelligence was measured by the Emotional competency inventory (ECI). The ECI
is a 360-degree tool designed to assess the emotional competencies of individuals and
organisations. It is based on emotional competencies identified by Goleman (1998a) in
Working with Emotional Intelligence, and on competencies from Hay/McBer’s (1996) Generic
Competency Dictionary as well as Boyatzis’s Self Assessment Questionnaire (SAQ)

96
(HayGroup, 2005a). Access to the instrument for research purposes is managed by the
Hay/McBer partnership.
The researcher wrote to the HayGroup and requested access to the instrument for research
purposes. The response from the HayGroup was that the researcher had to attend an
accreditation course to be able to administer the instrument and a detailed research proposal
had to be submitted to the HayGroup research committee and approved by this committee
before access to the instrument would be given. The researcher attended the Haygroup
accreditation course held in February 2005 (see Appendix K for accreditation) and then
submitted the research proposal to HayGroup research committee requesting permission to
use the ECI version 2.0 instrument for research purposes. Unanimous approval was granted
in March 2005 (see Appendix I for email correspondence). The panel noted that “the
proposal is a fantastic one. It would provide data on the organisational level of validation
against both organisational climate/culture and organisational performance”.
3.4.2.1.1.1 The emotional competency framework
The Emotional Competency Inventory 2.0 (ECI) is a 72 item questionnaire which measures
18 competencies organised into four clusters: self-awareness, self-management, social-
awareness, and relationship management.
Self-awareness concerns knowing one’s internal states, preferences, resources, and
intuitions. The self-awareness cluster contains three competencies:
• Emotional awareness: Recognising one’s emotions and their effects
• Accurate self-assessment: Knowing one’s strengths and limits
• Self-confidence: A strong sense of one’s self worth and capabilities
Self-management refers to managing one’s internal states, impulses, and resources. The
self-management cluster contains six competencies:
• Emotional self-control: Keeping disruptive emotions and impulses in check
• Transparency: Maintaining integrity, acting congruently with one’s values
• Adaptability: Flexibility in handling change
• Achievement: Striving to improve or meeting a standard of excellence

97
• Initiative: Readiness to act on opportunities
• Optimism: Persistence in pursuing goals despite obstacles and setbacks
Social-awareness refers to how people handle relationships and awareness of others’
feelings, needs and concerns. The social-awareness cluster contains three competencies:
• Empathy: Sensing others’ feelings and perspectives, and taking interest in their concerns
• Organisational-awareness: Reading a group’s emotional currents and power
relationships
• Service orientation: Anticipating, recognising, and meeting customers’ needs
Relationship management concerns the skill or adeptness at inducing desirable responses
in others. The relationship management cluster contains six competencies:
• Developing others: Sensing others’ development needs and bolstering their abilities
• Inspirational leadership: Inspiring and guiding individuals and groups
• Change catalyst: Initiating or managing change
• Influence: Wielding effective tactics for persuasion
• Conflict management: Negotiating and resolving disagreements
• Teamwork and collaboration: Working with others towards shared goals. Creating
group synergy in pursuing collective goals
3.4.2.1.1.2 Clustering of competencies
The ECI represents a set of competencies related to emotional intelligence. As with any
competency model, the reader should not assume that a person must be rated high on all
competencies to be effective. Boyatzis et al. (1999) argue that ECI competencies can be
organised into clusters. Within any cluster the competency has one of four relationships:
• They may be parts of a whole and complement each other in functional behaviour (e.g.
adaptability and conscientiousness).
• They may alternate manifestations. The specific competency used would vary by setting
or stimulus.
• The competencies within the cluster may be compensatory, that is, using one
competency makes up for using less of another (e.g. achievement orientation and
initiative).

98
• The competencies within the cluster may be antagonistic. Frequent use of one “crowds”
out the ease or possible use of another (e.g. self-control vs. initiative). If someone
demonstrates a great deal of self-control and inhibits their impulses and actions, they
would have an increasingly difficult time demonstrating initiative and starting things
before anyone asks.
The implication of competency clustering is that it does not make sense, on theoretical basis,
to obtain an overall ECI score by simply averaging the scores for all competencies in all
clusters. A researcher must not assume that one set of competencies fits all situations. There
are many ways to be equally effective. Defining the possible configurations that lead to
effectiveness results in what is called an algorithm.
For practitioners using the feedback report produced by the HayGroup (2005a), they outline
a generic algorithm that has been shown to be effective for managers in many situations and
is appropriate for assessment and development purposes. This algorithm is as follows:
• The three competencies in the self-awareness cluster are mandatory and must all be
present.
• In the self-management cluster, emotional self control is mandatory. Transparency and
adaptability are somewhat antagonistic. Transparency is about stability and reliability and
adaptability is about flexibility and openness to change (Jacobs, 2001). A person must
show one of theses competencies. Finally, a person must show either achievement or
initiative or optimism.
• In the social awareness cluster, empathy is mandatory. Organisational awareness and
service orientation are alternate manifestations of each other, thus a person must have
one or the other. Organisational awareness tends to be used in higher level management
or executive positions where understanding and navigating the organisation is critical for
success. Service orientation tends to be important in positions relating directly to
customers (external or internal) (Jacobs, 2001).
• In the relationship management cluster, influence is mandatory. In addition to this
competency, an individual should have one competency from the group of developing
others, inspirational leadership, and change catalyst. They must also have either conflict
management or teamwork and collaboration.

99
The nature of the competency model is such that although the competencies in each cluster
are conceptually similar, a statistical factor analysis may not show that the items in a cluster
hold together. The reason for this is that competencies in a cluster are not always
complementary suggesting that they are not necessarily expected to be found together and
they may be alternate manifestations, compensatory, or antagonistic. Nevertheless, a
confirmatory factor analysis conducted by Manuel, Serlavos & Boyatzis (2005) found that the
model was a reasonable fit (Chi-squared=856, df=55, p=0.0, RMSEA=0.047, NFI=0.998,
FRI=0.993).
3.4.2.1.1.3 The ECI measurement scales
The survey questions describe critical aspects of each skill that indicate the presence of this
skill in the behaviour of the individual being assessed. The frequency with which the person
being assessed demonstrates the behaviours related to the skill are the best measure for
that skill. Therefore, the questions in the emotional competency inventory are structured
using a 6-point frequency interval scale. The six behavioural anchors are:
1= Never
2= Rarely
3= Sometimes
4= Often
5= Consistently
6= Don’t know
3.4.2.1.1.4 Competency levels
Each emotional intelligence competency can be exhibited at one of four levels. Any particular
question in the ECI represents one level of one competency, thus there are 72 questions (18
competencies times 4 levels). Keep in mind that a match between competency level and job
may be more important to effectiveness than higher average scores. There is an optimal
level of each competency for a given job. In some situations demonstrating too much of a
competency can be just as problematic as having too little (Spencer & Spencer, 1993). The
implication of this is that it is not always appropriate to assume that higher scores will

100
translate into better performance. A person, who is at the optimal score for each
competency, as determined by the specific job, may perform better than someone with
higher scores.
The optimal level for the following competencies is level 4:
• Self confidence
• Adaptability
• Initiative
• Empathy
• Service orientation
• Conflict management
The optimum level for all other competencies is level 3.
3.4.2.1.2 Organisational culture
The original organisational culture profile instrument developed by O’Reilly & Chatman
(1991) has gone through several modifications (Judge & Cable, 1997). Sarros, Gray and
Densten (2002) last modified and simplified the instrument. The researcher wrote to
Professor Sarros, who is based a Monash University and gained permission to use their
modified version of the OCP instrument (see Appendix J).
3.4.2.1.2.1 The organisational culture profile (OCP)
There are some fundamental areas of agreement in the definition of culture, but less
agreement exists about its measurement. Rousseau (1990) stated that the quantitative
assessment of culture is controversial. She discusses how advocates of qualitative methods
for studying culture have argued that much of what constitutes a culture may be a unique
social construction of reality, perhaps unconscious on the part of the culture members
(Schein, 1999; Smircich, 1983). Schein (1983) in explaining the levels model points out that
the artefacts level is easy to observe but difficult to decipher and therefore not measurable.
Similarly he argues that the third level which is the basic assumptions is tacit and taken for
granted and therefore not measurable. However, the values he argues can be inferred by

101
interviewing the staff. Acknowledging that some aspects of organisational culture may not be
easily accessible, Rousseau (1990) also asserts that certain dimensions of culture may be
appropriately studied using quantitative methods, indeed suggesting that quantitative
assessments offer an opportunity to understand the systematic effects of culture and
individual behaviours.
One way to assess culture quantitatively is to focus on the central values that may be
important to an individual’s self concept or identity as well as relevant to an organisation’s
central value system. Weiner (1988) suggested this perspective, noting that a number of key
pivotal values concerning organisation-related behaviours and state-of affairs were shared
across units and levels-by members of an organisation resulting in a central value system.
To characterise an organisation’s culture in terms of its central values requires first that the
range of relevant values be identified and then that an assessment be made of how much
intensity and consensus there are among organisational members (Enz, 1988; Saffold,
1988). O’Reilly (1989), drawing on earlier research on measuring norms, noted two important
characteristics of strong cultures. One is intensity on the part of organisational members
displaying approval or disapproval to those who act in certain ways and the second is the
presence of crystallisation, or widespread agreement on values among members. If there is
no substantial agreement that a limited set of values is important in a social unit, a strong
culture cannot exist. If there is strong and widespread agreement about the salience and
importance of specific values, a central value system or culture may exist.
3.4.2.1.2.2 The OCP measurement scales
The original organisational culture profile (OCP) developed by O’Reilly et al. (1991), revised
by Judge and Cable (1997) and since further revised by Sarros, Gray and Densten (2002)
was used to measure organisational culture orientations. This new shortened version of the
original OCP instrument now consists of 28 items (Sarros et al., 2002) constituting seven
factors as follows: competitiveness, social responsibility, supportiveness, emphasis on
rewards, innovation, performance orientation, and stability. The survey questions describe
critical value items that indicate the presence of this factor in the Technical Service Centre
(TSC) being assessed. The frequency with which the TSC being assessed demonstrates this
cultural factor is the best measure for that value. Therefore, the questions in the

102
Organisational Culture Profile (OCP) are structured using a 5-point frequency interval scale.
The five value anchors are:
1= Not at all
2= Small
3= Moderately
4= Large
5= Very large
The OCP questionnaire was completed by the seven participants identified per TSC
consisting of the field services manager, the field services engineer, the technical services
officer and 4 staff members reporting to the TSO. The average of the seven questionnaires
provides an indication of the strength of the culture dimension, based on the seven
dimensions measured. Table 3.5 shows the seven culture dimensions and their properties
per dimension. The strength of the organisational culture will be measured using the
following guideline below. Cmean represents the mean scores for each of the OCP
dimensions:
0<1 is indicative of a very weak culture
1< Cmean<2 is indicative of weak culture
2<Cmean<3 is indicative of substantial culture
3<Cmean<4 is indicative of strong culture
4<Cmean<5 is indicative of very strong culture

103
Table 3.5: Dimensions of organisational culture and their properties
Organisational Culture dimensions
Properties
Competitiveness • Achievement Orientation
• An emphasis on quality
• Being distinctive-being different from others
• Being competitive
Social Responsibility • Being Reflective
• Having a good reputation
• Being socially responsible
• Having a clear guiding philosophy
Supportiveness • Being team oriented
• Sharing information freely
• Being people oriented
• Collaboration
Innovation • Being innovative
• Quick to take advantage of opportunities
• Risk taking
• Taking individual responsibility
Emphasis on Rewards • Fairness
• Opportunities for professional growth
• High pay for high performance
• Praise for good performance
Performance Orientation • Having high expectations for performance
• Enthusiasm for the job
• Being results oriented
• Being highly organised
Stability • Stability
• Being calm
• Security of employment
• Low conflict
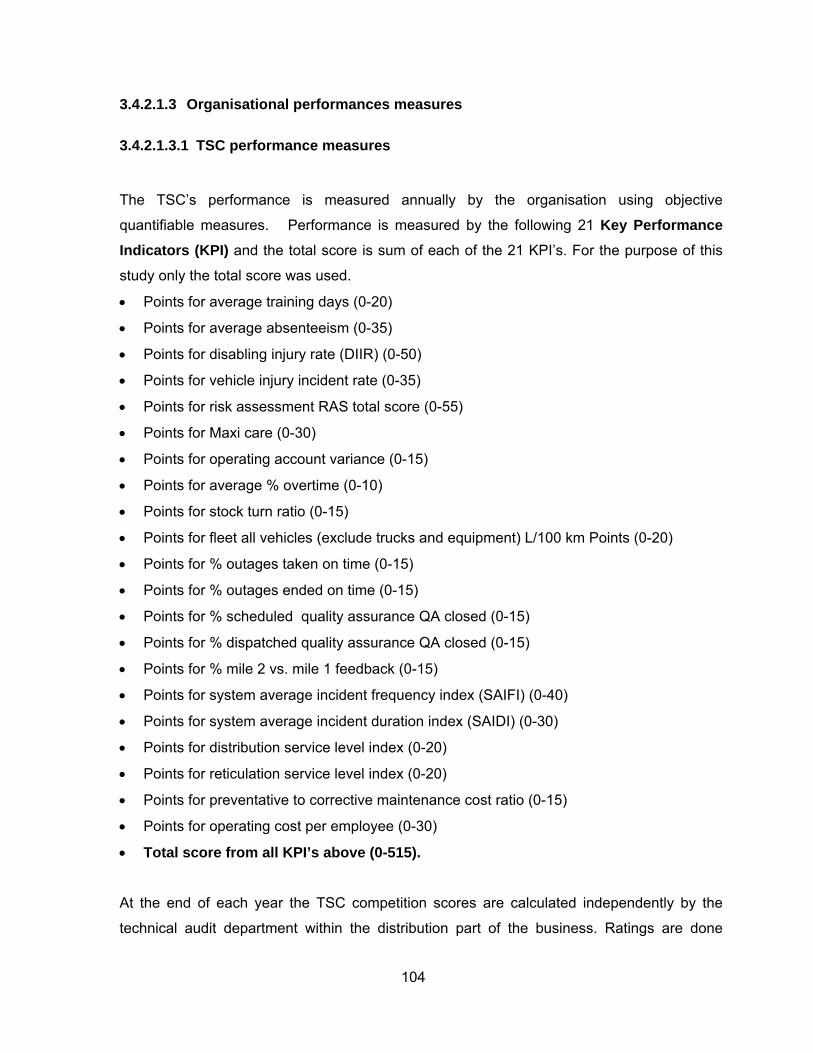
104
3.4.2.1.3 Organisational performances measures
3.4.2.1.3.1 TSC performance measures
The TSC’s performance is measured annually by the organisation using objective
quantifiable measures. Performance is measured by the following 21 Key Performance Indicators (KPI) and the total score is sum of each of the 21 KPI’s. For the purpose of this
study only the total score was used.
• Points for average training days (0-20)
• Points for average absenteeism (0-35)
• Points for disabling injury rate (DIIR) (0-50)
• Points for vehicle injury incident rate (0-35)
• Points for risk assessment RAS total score (0-55)
• Points for Maxi care (0-30)
• Points for operating account variance (0-15)
• Points for average % overtime (0-10)
• Points for stock turn ratio (0-15)
• Points for fleet all vehicles (exclude trucks and equipment) L/100 km Points (0-20)
• Points for % outages taken on time (0-15)
• Points for % outages ended on time (0-15)
• Points for % scheduled quality assurance QA closed (0-15)
• Points for % dispatched quality assurance QA closed (0-15)
• Points for % mile 2 vs. mile 1 feedback (0-15)
• Points for system average incident frequency index (SAIFI) (0-40)
• Points for system average incident duration index (SAIDI) (0-30)
• Points for distribution service level index (0-20)
• Points for reticulation service level index (0-20)
• Points for preventative to corrective maintenance cost ratio (0-15)
• Points for operating cost per employee (0-30)
• Total score from all KPI’s above (0-515).
At the end of each year the TSC competition scores are calculated independently by the
technical audit department within the distribution part of the business. Ratings are done
105
objectively based on actual measured data. Each of the 21 KPI’s listed above has a range
(see range in brackets) and the aggregated sum of the 21 KPI’s provides a total score for the
TSC. The TSC scores are than ranked and in this way the winners of the TSC annual
competition are determined. For the purpose of this study the following criteria was used to
determine performance
o TSC performance score in the range 515 to 412 was considered excellent
o TSC performance score in the range 411 to 306 was considered good
o TSC performance score in the range 305 to 206 was considered satisfactory
o TSC performance score in the range 205 and less was considered poor
3.4.2.1.3.2 TSO performance appraisal measures
A second measure of performance was used in this study. Each (TSO) is individually
evaluated tri-annually through the performance appraisal (PA) system. The PA is based on
balanced scorecard principles (Kaplan & Norton, 1992, 2004) and consists of the following
key perspectives:
• Financial perspective
• Customer perspective
• Operational perspective
• People perspective
• Corporate citizen perspective
At the beginning of each year the TSO meets with his FSAM and decides the weighting for
each of the balanced score card perspectives based on what is decided as the organisational
priorities at head office for that particular year. These weightings are than standardised for
each of the TSO’s performance appraisals. Performance is evaluated bi-annually, mid-year
and end of the year, and the average is used to determine performance bonus payouts. The
performance bonus payouts can range from 0 to 50% of an individual’s annual salary. The
ratings are done objectively based on actual measured data. A PA score based on a 1 to 5
scale is then produced. The PA ratings describe critical values that indicate the presence of
the value in the TSO being assessed. The frequency with which the TSO being assessed
demonstrates this value is the best measure for that value. Therefore, the PA scores are
structured using a 5 point frequency ratio scale. The five value anchors are:
106
PA score <1 = Floor (indicates bad performance)
1<PA score <2 = Kick-in (indicates poor performance)
2<PA score <3 = Norm (indicates acceptable performance)
3< PA score < 4 = Stretch (indicates good performance)
4<PA score < 5 = Ceiling (excellent performance)
The PA scores are collected annually by the group human resources department. Permission
to use these scores in the study was obtained from the group provided confidentiality was
maintained.
Both measures of performance, above, were used in this study given its intent to examine
the earlier relationships identified. This allows for an exploration of which measure of
performance (TSC competition or the individual TSO PA score) were more correlated with
the ECI and the OCP instruments.
3.4.2.2 Moderator variables
In addition to the questionnaire measuring the independent and dependent variables, a
number of moderator variables were built into the questionnaire and the data was collected.
The data collected was:
o TSO age
o TSO race
o TSO gender
o Qualifications of the TSO
o TSO tenure
o Size (number of employees)
o Number of years employed within the organisation
o Number of years the TSC has been in existence for
The first 4 moderator variables are standard demographic data. TSO tenure was collected to
check how long the TSO has been in the position of TSO. This information was collected to
test Schein (1992, 2004) assertion that the founder/initial leader creates the culture within the
TSC. The number of employees was collected to verify that there is a group. According to
107
Schein (1985, 1992, 2004) for a group to exist it has to have people. Without a group having
share the same experiences culture cannot exist (Schein, 2004). The number of years
employed within the organisation was collected to test how long the leader has worked for
the organisation. The number of years the TSC has been in existence for was collected to
assess if the business unit was less than 10 years old but more than 3 years old. For an
organisation to be in the start-up/early growth phase the organisation needs to be under 10
years old (Lester et al., 2003).
3.5 Data analysis
The analysis of the data was done using SPSS (14) and SAS 9.3 package to answer the
empirical research questions:
Empirical question 1: What are the basic statistical features of the data? Descriptive
statistics allow an understanding of the basic make-up and features of the data.
Empirical question 2: What is the reliability and construct validity of the dimensions of the
ECI and OCP instruments? Confirm that the ECI and the OCP instrument measures one
underlining construct.
Empirical question 3: What are the descriptors of ECI, OCP and organisational
performance as variables for this sample? A comparison of the ECI data collected in this
study with the results to the HayGroup international norm. A comparison of the OCP data
collected in this study with the Australian norm. Identify the ECI characteristics that would
lead to better leaders. Test Schein’s assertion with regard to the strength of culture in the
start-up/early growth phase of the organisational life cycle. Review the performance data as
measured by the organisation.
Empirical question 4: What is the impact of the moderator variables on the independent
and dependent variables? Through t-Tests the relationship between the moderator variables
and the study variables was tested in order to determine the influence of the moderator
variables on the study variables namely the 18 ECI dimensions, the 7 OCP dimensions and
performance.

108
Empirical question 5: What predictive value can be derived from the independent variables
on the dependent variables? Canonical correlations and stepwise multiple regressions were
used to determine the predictive value of the independent variables on the dependent
variable(s).
3.5.1 Empirical research question 1: What are the basic statistical features of the data?
Descriptive statistics applied in the study describes the basic features of the data and allows
comparisons across different data sets. The purpose of the descriptive statistics is to develop
an understanding of the data and allows the researcher to determine if the data could be
used for further analysis. Descriptive statistical techniques include the description of the
distribution, central tendency and dispersion of the variables in the data. Data is also
analysed to mitigate the impact of missing data and outliers that could distort relationships.
The data related to the independent variables as well as the dependent variables was
analysed to determine whether it can be used for further analysis.
3.5.2 Empirical research question 2: What is the reliability and construct validity of the dimensions of the ECI and OCP instruments?
According to Hair et al. (1998) factor analysis is a generic name given to a class of
multivariate statistical methods whose primary purpose is to determine the underlying
structure in a data matrix. Items are clustered on the basis of the association of the different
items with a factor. Factor analysis seeks the least number of factors to account for the
largest amount of common variance of a set of variables.
Reliable scales will be used as independent predictors for the independent variables to
predict the dependent variables or outcomes in linear regression models. Scales are only
accepted if they are reliable. Reliability is the extent to which the measurement is free of
variable errors (i.e. internally the items are consistent). Cronbach’s alpha was used to
measure the reliability and is reported per factor in this research. Where the Cronbach’s
alpha is <0.7, the factor will be rejected. Since the researcher is using existing instruments
(ECI and OCP) a confirmatory factor analysis will be done to confirm that only one construct

109
is being measured. Techniques such as the Kaiser-Meyer-Olkin measure of sample
adequacy (>0.6) and the Bartlett test of sphericity (p-value<0.0005) were used to determine if
the data can be used for factor analysis.
3.5.3 Empirical research question 3: What are the descriptors of ECI, OCP and organisational performance as variables for this sample?
3.5.3.1 Assessment of the ECI results
A summary of the mean scores for each of the category of respondents (FSAM, FSE, TSO,
TSC Staff) was calculated for the 18 dimensions of the ECI instrument. The mean scores of
the TSOs for each of the dimensions was compared to the average of the (FSAM, FSE and
TSC Staff) referred as the ‘total other’ score. The HayGroup (2005a) provides a
competency cluster review. This review was applied to the ‘total other’ scores and
compared to the HayGroup norm.
3.5.3.2 Assessment of the OCP results
A summary of the mean scores for each of the category of respondents (FSAM, FSE, TSO
and TSC staff) was calculated for the 7 dimensions of the OCP instrument. The ‘total score’
which was the average of each of the respondent groups (FSAM, FSE, TSO and TSC staff)
is calculated and used to assess the strength of the organisational culture for each of the 7
OCP dimensions.
3.5.3.3 Assessment of the performance data
The TSO’s performance appraisal scores sourced independently from the organisation’s HR
department was used to calculate the mean performance score for the TSOs. This mean
score was compared to the organisations performance appraisal evaluation criteria to assess
the mean performance of the TSO’s. Similary, the TSC competition score was sourced
independently from the organisations technical audit department and was used to calculate
the mean performance score for the TSC’s. This mean score was compared to the TSC

110
performance evaluation criteria, as described in section 3.4.2.1.3.1, to assess the mean
performance of the TSC’s.
3.5.4 Empirical research question 4: What is the impact of the moderator variables on the independent and dependent variables?
The relationship between the moderator variables and the independent variables was
determined by using multivariate statistical techniques. Multivariate techniques are
dependent on certain assumptions being met. The assumptions include multivariate
normality of the variables, homescedasticity of the dependable variable and linear correlation
relationships between continuous variables. The following uni- and multivariate analysis
techniques were used:
• ANOVAs (analysis of variances) and t-Tests
Assumptions pertaining to each test were made prior to performing the analysis.
3.5.5 Empirical research question 5: What predictive value can be derived from the independent variables on the dependent variables?
3.5.5.1 Canonical correlation study
With canonical analysis the objective is to correlate simultaneously several metric dependent
variables and several metric independent variables. The underlying principle is to develop a
linear combination of each set of variables (both dependent and independent) to maximise
the correlation between the two sets. In the canonical correlation study, organisational
culture (OCP) and its dimensions was the dependent variable and ECI dimensions were the
independent variables (Hair et al., 1998).

111
3.5.5.2 Stepwise multiple regression analysis
Multiple regression is the appropriate method of analysis when the research problem
involves a single metric dependent variable presumed to be related to two or more
independent variables. The objective of multiple regression analysis is to predict the changes
in the dependent variable in response to changes in the independent variable. This objective
is most often achieved through the statistical rule of least squares (Hair et al., 1998).
Organisation performance was the dependent variable, measured by the TSO performance
appraisal scores. Organisational culture and/or emotional competency inventory and its
dimensions were the independent variable.
3.6 Sample design and sampling methods
3.6.1 Sample population
The sample for the research comprised the 205 Technical Service Centres (TSC) which are
geographical dispersed across South Africa. The reason for choosing this sample was the
difficulty of gaining permission to collect a complex set of data. Additionally, the research
design required access to performance data at the unit level and individual level. Finding an
organisation to agree to the requirements of the data collection proved to be a daunting
challenge. The researcher was able to get full permission to collect the data required within
the sample organisation. It should be noted that the sample was taken in another part of the
business and the researcher did not have a direct working relationship with the study
participants. The research proposal was presented to the relevant research steering
committees of the organisation and was unanimously approved. This gave the researcher
access to the 205 TSOs/TSCs. The final sample size was 118 TSOs (leaders) with a total of
776 questionnaires being completed.
112
3.6.2 Sampling techniques
Simple random sampling is often impractical (Cooper and Schindler, 2001). However
Campbell and Stanley (1966) in their seminal work on research design indicates researchers
must randomise whenever possible. The central region, which has 29 TSCs, did not
participate in the annual TSC competition and was excluded from the population of 205
because the TSC performance data was not available. An attempt was made to collect the
data from all of the remaining (176) TSCs.
3.6.3 Sample size
The issues of the impact of size (both small and large) and the necessity for a sufficient
number of observations per variable are frequently encountered with canonical correlations.
A sample size that is too small will not represent the correlations well, thus obscuring any
meaningful relationship. A very large sample will have the tendency to indicate statistical
significance in all instances, even where practical significance is not indicated. This study
follows the rule of thumb of at least 10 observations per variable to avoid ‘overfitting’ the data
(Hair et al., 1998). A total of 11 variables (self-awareness; self-management; social-
awareness; relationship-management; competitiveness; social responsibility; supportiveness;
innovation; emphasis on rewards; performance orientation and stability) are measured,
therefore requiring a minimum of 110 service units (TSCs) to be taken if the rule of thumb is
to be satisfied. The total sample size for employee respondents was larger because each
TSC had on average 10-50 employees. Hence the sample size for employee respondents
was 776.
3.7 Ethical considerations
Ethics in research is involved with what is right and what is not right to do when conducting
research (Neuman, 2000: 90) and forms an integral part of any research study. The issue of
ethics in research is particular important when human beings are the research subjects
(Freed-Taylor, 1994), as is the case in this study.

113
Ethics in research spans the entire research process: from the nature of the problem being
investigated, the reporting of the theoretical framework thereof, the context within which the
research is conducted, the data collection instruments utilised, the data collection methods
utilised, the research subjects, the procedures utilised to analyse the data and the way in
which the data is reported (Cohen, Manion & Morrison, 2000: 50; Neuman, 2000: 90-91). In
particular, the research should be conducted ethically, therefore the research question
should be framed objectively within the theoretical framework in order to ensure confidence
in the research process; the rights and privacy of research subjects should be respected and
protected; the researcher(s) should be sensitive to cultural and social differences of the
research subjects; and all research findings should be reported objectively with full disclosure
of the research methodology and the limitations of the research process (Freed-Taylor, 1994;
Neuman, 2000: 283-285).
Respondents in the present study were promised anonymity; facilitators fully explained the
purpose of the research and additionally the purpose and procedures of the research were
reviewed by the company’s research committee before approval was given to conduct the
study. None of the individual scores will be provided to the organisation participating in the
study, just overall results pertaining to the company and region. Specific ethical
considerations pertaining to each phase of this research study are addressed in subsequent
sections.
Ethical considerations pertaining to the developmental phase of this study involves, in
particular, not posing questions that may strip respondents of their dignity (Neuman, 2000:
283) or be perceived to be discriminatory. In this regard, the Haygroup and the Sarros paid
particular attention in the development of the questionnaires. The facilitators assisting with
data collection were requested by the researcher to pay specific attention to the formulation
of the items in the background questionnaire and ensure that the sensitivities of the different
target groups (FSAM, FSE, TSO, PTO, STO, TO WC, gender, race and religious groups)
were not compromised (Freed-Taylor, 1994).
As far as the research methodology is concerned and particularly in terms of studies
involving human beings, the issue of ethics pertains in particular to the research subjects, i.e.
the people the study targeted. Although a researcher has the right to search for new
knowledge, this cannot be done at the expense of those being studied (Neuman, 2000: 92).

114
In terms of the current research study, it implied that the rights of the research subjects
should be respected at all times. In particular (Cohen et al. 2000: 245-246; Freed-Taylor,
1994; Neuman, 2000: 92):
• The aims of the research should be communicated to research subjects.
• Participation in the research study should be voluntary.
• Research subjects should provide written (informed) consent.
• Information provided by participants should be treated as confidential at all times (i.e.
no information regarding any particular subject should be released).
Ethical integrity of this study was maintained by conducting the study in the Field Services
Section of the group. The seven questionnaires filled in per TSC (FSAM, FSE, TSO, PTO,
STO, TO, WC) were not inconvenienced. The FSAM and the FSE were sent the
questionnaires via email and were asked to fill in the questionnaires at leisure. They were
given two weeks to complete the questionnaires. For the TSC staff (TSO, PTO, STO, TO,
WC), appointments were setup telephonically for early in the mornings or late in the
afternoons, so as not to inconvenience the respondents from their daily activities. The
research facilitators visited each TSC at the convenience of the TSC staff. Information
collected from each of the TSC is filed as part of the research process and is auditable.
Information regarding the TSO performance appraisals has also been obtained by the
researcher from the group HR department and is treated as confidential.
3.8 Chapter summary and conclusions
In this chapter, the research process was described. Different research paradigms were
discussed and a positivistic/quantitative approach to the study was motivated. The use of the
critical social science approach as a vantage point to improve society was stated. The
research process followed by the researcher was described. This started with the problem to
be investigated (chapter 1), followed by the study of theoretical concepts and theories
(chapter 2) and the formulation of the hypotheses to be tested during the study. The
instruments and the data sources were identified for the dependent and independent
variables.
The data collection instruments identified during the theoretical research (independent
variables) was described as well as the data collection process and the sample design. The

115
instruments used to collect the performance variables (dependent variable), including the
data collecting process, was also described. The analysis of the results will be reported in
chapter 4.
116
4 CHAPTER 4: RESULTS
4.1 Introduction
In this chapter the empirical findings using statistical techniques to provide answers to
empirical research questions formulated in chapter 3 are reported. The framework used in
chapter 3 to identify the different relationships between respective variables was used to
report the results. A detailed analysis using the statistical techniques discussed in chapter 3
was undertaken to test the hypothesis and to systematically provide answers to the following
questions.
Empirical question 1: What are the basic statistical features of the data? Descriptive
statistics allow an understanding of the basic make-up and features of the data.
Empirical question 2: What is the reliability and construct validity of the dimensions of the
ECI and OCP instruments? Confirm that the ECI and the OCP instrument measures one
underlining construct.
Empirical question 3: What are the descriptors of ECI, OCP and performance as variables
for this sample? A comparison of the ECI data collected in this study with the results of the
HayGroup norm. A comparison of the OCP data collected in this study with the Australian
norm. Identify the ECI characteristics that would lead to better leaders. Test Schein’s
assertion with regard to the strength of culture in the start-up/early growth phase of the
organisational life cycle. Review the performance data as measured by the organisation.
Empirical question 4: What is the impact of the moderator variables on the dependent and
independent variables? Through t-Tests the relationship between the moderator variables
and the study variables was tested in order to determine the influence of the moderator
variables on the study variables namely the 18 ECI dimensions, the 7 OCP dimensions and
performance.
Empirical question 5: What predictive value can be derived from the independent variables
on the dependent variables? Canonical correlations and stepwise multiple regressions were

117
used to determine the predictive value of the independent variables on the dependent
variable(s).
4.2 Sampling the independent variables
Of the total of 205 Technical Service Centre (TSCs) (see Appendix D, Table D1) that could
have voluntarily participated in the study, 29 from the Gauteng region were automatically
excluded as they did not participate in the TSC competition thus leaving the TSC population
at 176. Of the 176 TSCs that could have participated, some of the TSCs opted not to
respond to the request, some TSOs were newly appointed and did not meet the criteria to be
included in the study. In some TSCs the Field Services Engineer (FSE) and a field service
area manager did not respond, and were automatically excluded from the study. Finally, only
118 TSCs were entered into the analysis model which resulted in a response rate of 67%.
(Note that during the analysis of the 118 TSCs, only completed responses are taken into
account thus explaining the differences in the values of N)
Figure 4.1: Study sample
Field Services Centre Manager (113)
Field Services Engineer (107)
Technical Services Officer (118)
Works Coordinator (109)
Principal Technical Officer (113)
Senior Technical Officer (111)
Technical Officer (105)
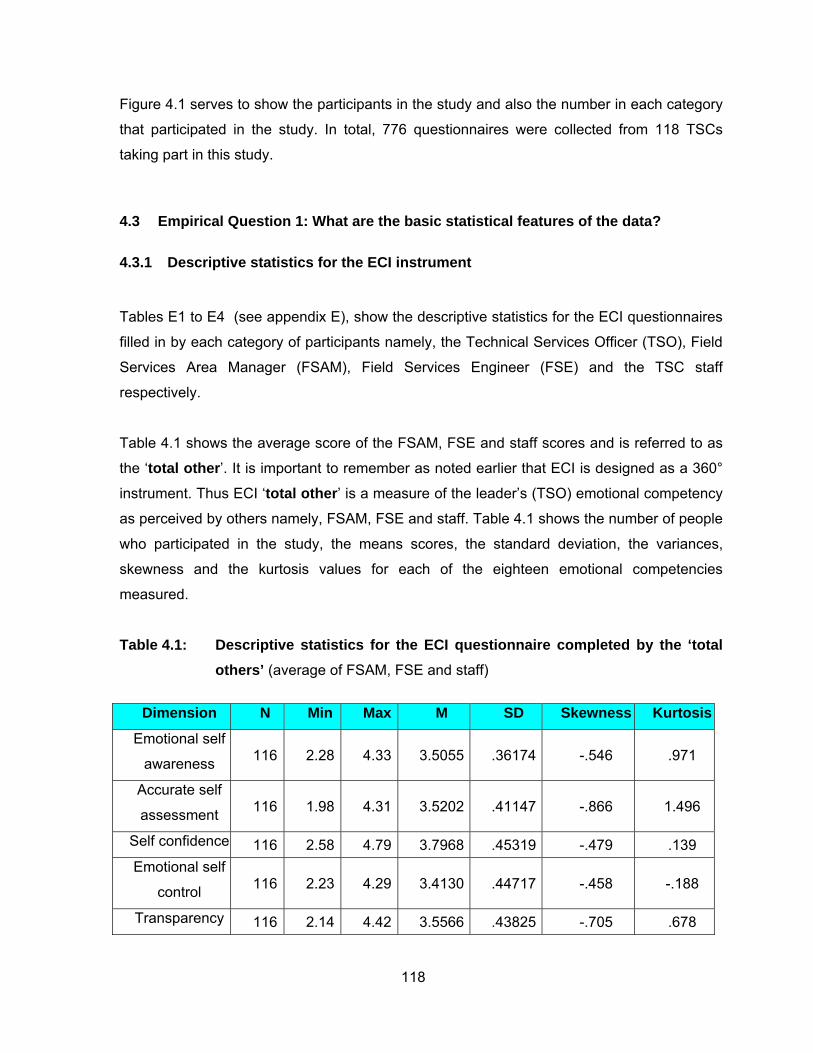
118
Figure 4.1 serves to show the participants in the study and also the number in each category
that participated in the study. In total, 776 questionnaires were collected from 118 TSCs
taking part in this study.
4.3 Empirical Question 1: What are the basic statistical features of the data?
4.3.1 Descriptive statistics for the ECI instrument
Tables E1 to E4 (see appendix E), show the descriptive statistics for the ECI questionnaires
filled in by each category of participants namely, the Technical Services Officer (TSO), Field
Services Area Manager (FSAM), Field Services Engineer (FSE) and the TSC staff
respectively.
Table 4.1 shows the average score of the FSAM, FSE and staff scores and is referred to as
the ‘total other’. It is important to remember as noted earlier that ECI is designed as a 360°
instrument. Thus ECI ‘total other’ is a measure of the leader’s (TSO) emotional competency
as perceived by others namely, FSAM, FSE and staff. Table 4.1 shows the number of people
who participated in the study, the means scores, the standard deviation, the variances,
skewness and the kurtosis values for each of the eighteen emotional competencies
measured.
Table 4.1: Descriptive statistics for the ECI questionnaire completed by the ‘total others’ (average of FSAM, FSE and staff)
Dimension N Min Max M SD Skewness Kurtosis
Emotional self
awareness 116 2.28 4.33 3.5055 .36174 -.546 .971
Accurate self
assessment 116 1.98 4.31 3.5202 .41147 -.866 1.496
Self confidence 116 2.58 4.79 3.7968 .45319 -.479 .139 Emotional self
control 116 2.23 4.29 3.4130 .44717 -.458 -.188
Transparency 116 2.14 4.42 3.5566 .43825 -.705 .678

119
Dimension N Min Max M SD Skewness Kurtosis
Adaptability 116 2.38 4.35 3.5545 .40521 -.405 .449 Achievement
orientation 116 2.35 4.52 3.6301 .47130 -.509 .094
Initiative 116 2.14 4.31 3.2271 .39853 -.347 .497 Optimism 116 2.35 4.44 3.6298 .46119 -.485 -.170 Empathy 116 2.22 4.48 3.6314 .44902 -.619 .442
Organisational
awareness 116 2.31 4.38 3.5596 .40403 -.482 .240
Service
orientation 116 2.50 4.81 3.9459 .48806 -.410 -.079
Developing other 116 1.98 4.73 3.6775 .51144 -.512 .495 Inspirational
leadership 116 1.69 4.58 3.5629 .50803 -.542 .755
Change catalyst 116 2.09 4.27 3.3186 .43766 -.480 .093 Influence 116 2.14 4.44 3.5289 .42229 -.655 1.097 Conflict
management 116 2.03 3.98 3.2358 .35637 -.394 .676
Team work and
collaboration 116 1.90 4.75 3.6658 .44512 -.743 1.409
4.3.2 Descriptive statistics for the OCP instrument
Tables E6 to E9 (see Appendix E), shows the descriptive statistics for the OCP
questionnaires filled in by the Technical Services Officer (TSO), Field Services Area
Manager (FSAM), Field Services Engineer (FSE) and the TSC staff respectively.
Table 4.2 shows the average score of the FSAM, FSE, TSO and staff scores and is referred
to as the ‘total score’. The table shows the number of people who participated in the study,
the means scores, the standard deviation, variances, skewness and kurtosis for each of the
seven dimensions of organisational culture measured.

120
Table 4.2: Descriptive statistics for the OCP questionnaire completed by the ‘total score’ (FSAM, FSE, TSO and staff)
Dimension N Min Max M SD Skewness Kurtosis
Performance
orientation 116 2.38 4.80 3.5796 .49757 -.108 -.383
Social responsibility 116 2.27 4.44 3.4442 .47278 -.150 -.476 Supportiveness 116 2.31 4.39 3.4755 .43792 -.331 -.308
Emphasis on rewards 116 2.28 4.33 3.3219 .43629 -.107 -.339 Stability 116 2.20 4.19 3.3748 .43540 -.432 .016
Competitiveness 116 2.25 4.59 3.5015 .49620 .051 -.498 Innovation 116 1.85 4.02 3.1828 .42537 -.312 -.185
4.3.3 Descriptive statistics for performance
Table 4.3a shows the TSO performance appraisal scores that were collected independently
and used in the study. The data were sourced independently from the human resources
department of the organisation in which the study was undertaken. The TSO performance
appraisal scores reflected performance for the period April 2005 to March 2006. Performance
appraisal scores were obtained for 117 TSOs. The mean performance appraisal score for the
117 TSC’s is M=3.6828 with a minimum score of 2.75 and a maximum score of 4.47.
Table 4.3a: Descriptive statistics for TSO performance appraisal
Dimension N Min Max M SD Skewness Kurtosis
TSO performance appraisal
score for 2005 117 2.75 4.47 3.6828 .34369 -.125 .078
Table 4.3b shows the TSC performance scores that were collected as part of the TSC
competition and used in the study. The data was sourced independently from the relevant
department responsible for the TSC competition. The TSC performance scores reflected
performance for the period April 2005 to March 2006. TSC performance scores were

121
obtained for 118 TSCs. The mean TSC performance score for the 118 TSCs is M=252.72
with a minimum score of 117.65 and a maximum score of 354.79.
Table 4.3b: Descriptive statistics for TSC performance
Dimension N Min Max M SD Skewness Kurtosis
TSC
Performance
score 2005
18 17.65 354.79 252.7201 49.42053 -.175 -.225
4.3.4 Initial data screening
Multivariate statistical analysis requires that the assumptions underlying the statistical
techniques be tested. In particular, the assessment of normality of the continuous (interval)
variables needs to hold. Review of the skewness and kurtosis data (Appendix E, Table E1 to
E5) shows that there are minor deviations from normality. However, for the purposes of this
study with samples size considered as sufficiently large, normality is assumed. Discussions
in each multivariate section address the methods used to assess the assumptions underlying
the variate for each multivariate technique.
Thus, the answer to the first empirical question is that the data collected for the
variables ECI, OCP and performance are suited for statistical analysis.
4.4 Empirical question 2: What are the reliability and construct validity of the dimensions of the ECI and OCP instruments
According to Jaeger (1995: 373) reliability is considered a measurement concept that
represents the consistency with which an instrument measures a given performance or
behaviour. A measurement instrument that is reliable will provide consistent results when a
given individual is measured repeatedly under near-identical conditions.
Cronbach’s alpha is the most commonly used indicator of internal consistency. This
procedure estimates reliability estimates from the consistency of items responses from a

122
single assessment. The generally agreed upon lower limit for Cronbach’s alpha is 0.70 (Hair
et al., 1998).
4.4.1 Reliability of the ECI and OCP
4.4.1.1 Reliability of the ECI instrument
As explained in section 3.4.2.1.1.1 in chapter 3, the ECI instrument consists of 72 items,
measuring 18 competency dimensions and each competency is measured by 4 items. Table
4.4 presents the Cronbach’s alpha internal consistency coefficient for the ECI 2.0
(HayGroup, 2005a) competencies taken at the dimension level. The tables (Tables 4.4 and
4.5) also show the result for this study taken at the dimension level. The Cronbach’s alpha
for this study exceeded 0.9 thus satisfying the internal consistency requirements.
Table 4.4: Cronbach’s alpha coefficient for total others ECI 2.0 ratings and scores taken for this study (Scores based on average item scores)
ECI Clusters ECI dimensions Total other rating
(N=20557)* Cronbach's
alpha for this study (N=118)
Self awareness
(Tot) Emotional Self awareness 0.87 .976
(Tot) Accurate self assessment 0.77 .976
(Tot) Self confidence .0.79 .975
Self management
(Tot) Emotional self control .0.83 .977
(Tot) Transparency 0.68 .976
(Tot) Adaptability 0.73 .975
(Tot) Achievement orientation 0.77 .975
(Tot) Initiative 0.70 .976
(Tot) Optimism 0.75 .976
Social awareness
(Tot) Empathy 0.80 .976 (Tot) An organisational
awareness .0.80 .976
(Tot) Service orientation 0.86 .976
Relationship management
(Tot) Developing others 0.85 .975
(Tot) Inspirational leadership 0.86 .975

123
ECI Clusters ECI dimensions Total other rating
(N=20557)* Cronbach's
alpha for this study (N=118)
(Tot) Change catalyst 0.82 .976
(Tot) Influence 0.76 .975
(Tot) Conflict management 0.73 .977
(Tot) Teamwork and collaboration 0.75 .975 * (HayGroup, 2005a)
4.4.1.2 Reliability of the OCP instrument
As explained in section 3.4.2.1.2.2 in chapter 3 the OCP instrument consists of 28 items,
measuring 7 culture dimensions and each culture dimension is measured by 4 items. Table
4.5 presents the Cronbach’s alpha internal consistency coefficient for the OCP as measured
by Sarros, et al., (2002) in an Australian study. These tables also show the result for this
study. The Cronbach’s alpha for this study exceeded 0.9 thus satisfying the internal
consistency requirements.
Table 4.5: Cronbach’s alpha coefficient for the OCP ratings and scores taken for this study (Scores based on average item scores)
Culture Dimensions Australian Study** Cronbach's Alpha for
this study
(Tot) Performance orientation 0.74 .976
(Tot) Social responsibility 0.74 .976
(Tot) Supportiveness 0.87 .976
(Tot) Emphasis on rewards 0.80 .976
(Tot) Stability 0.66 .976
(Tot) Competitiveness 0.75 .976
(Tot) Innovation 0.80 .976
** (Sarros, Gray & Densten, 2002)

124
Given the fact that reliabilities are satisfactory a single score was calculated for each
respective dimension of the ECI and OCP by calculating the mean of all items. This result, in
18 ECI dimensions and 7 OCP dimensions, each measured on a continuous or interval
scale. Mean, standard deviation, skewness and kurtosis are shown tables 4.1 and 4.2 above.
4.4.2 Construct validation using exploratory factor analysis
According to the ECI technical manual (HayGroup, 2005b), the 18 dimensions of the ECI
instrument measures one underlying construct, emotional competency. Similarly, according
Sarros et.al. (2002), the 7 dimensions of organisational culture measures one underlying
construct namely organisational culture. In order to verify this, an exploratory factor analysis
was performed on the ECI and OCP instruments using the ‘total other’ score for the ECI and
the ‘total scores’ for the OCP which is the mean score (FSAM, FSE and staff) for the ECI
instrument and (FSAM, FSE, TSO and staff) for the OCP instrument.
Since both the ECI and the OCP have been used in this context in South African before, an
exploratory factor analysis was performed to validate scales. The following criteria were
applied:
• Bartlett test of sphericity, a statistical test for the presence of correlations among
variables. It provides the statistical probability that the correlation matrix has
significant correlations among at least some of the variables (Hair et al., 1998;
Eiselen, 2006).
• Measures of sampling adequacy (MSA). Measures calculate both entire correlation
matrix and each individual variable evaluating the appropriateness of applying factor
analysis. Values above 0.5 for the entire matrix or an individual variable indicate
appropriateness. This index ranges from 0 to 1, reaching 1 when each variable is
perfectly predicted without error by the variables. Measures of 0.8 are considered to
be meritorious (Hair et al., 1998; Eiselen, 2006).
• Communalities are estimates of the shared, or common, variance among the
variables. Factors resulting from common factor analysis are based only on common

125
variance. If communality values exceed 1, problems with the solution are indicated.
Very low communalities on the other hand, indicate that variables with them are
unrelated to other variables in the set. Values above 0.6 are considered acceptable
(Hair et al., 1998; Tabachnick & Fidell, 2007; Eiselen, 2006).
• Percentage of variance criterion The percentage of variance criterion is an approach based on achieving a specified
cumulative percentage of total variance extracted by successive factors. The purpose
is to ensure practical significance for the derived factors by ensuring that they explain
at least a specified amount of variance. No absolute threshold has been adopted for
all applications. However, in social science, where information is often less precise, it
is not uncommon to consider a solution that accounts for 60% of the total variance as
satisfactory (Hair et al., 1998; Eiselen, 2006).
Tables 4.6 and 4.7 show the measure of sampling adequacy (MSA) and the Bartlett test for
the ECI and the OCP. For the MSA both instruments have values exceeding 0.9 and are
significant on the Bartlett Sphericity Test. For the communalities (Tables 4.8 and 4.9) the
both instruments have values exceeding 0.6. Tables 4.10 and 4.11 show the total variance
extracted by successive factors for the ECI and the OCP respectively. For the ECI instrument
two factors have been extracted, however since the first factor accounts for 70% of the
variance and the second factor accounts for only 7%, the second factor is ignored. The OCP
has only one factor and it accounts for 85% of the variance extracted.
Table 4.6: Measure of sampling adequacy and Bartlett's Test for emotional competency inventory
Kaiser-Meyer-Olkin Measure of Sampling Adequacy .961
Bartlett's Test of Sphericity
Approx. Chi-Square 2312.305
df 153
Sig. .000

126
Table 4.7: Measure of sampling adequacy and Bartlett's Test for the organisational culture profile
Kaiser-Meyer-Olkin Measure of Sampling Adequacy .928
Bartlett's Test of Sphericity Approx. Chi-Square 1142.664
df 21
Sig. .000
Table 4.8: Communalities for the ECI Extraction (Tot) Emotional self awareness .637
(Tot) Accurate self assessment .775
(Tot) Self confidence .823
(Tot) Emotional self control .740
(Tot) Transparency .716
(Tot) Adaptability .823
(Tot) Achievement orientation .819
(Tot) Initiative .779
(Tot) Optimism .787
(Tot) Empathy .854
(Tot) An organisational awareness .632
(Tot) Service orientation .754
(Tot) Developing others .833
(Tot) Inspirational leadership .866
(Tot) Change catalyst .722
(Tot) Influence .819
(Tot) Conflict management .665
(Tot) Teamwork and collaboration .825 Extraction Method: Principal Component Analysis.

127
Table 4.9: Communalities for the OCP
Extraction
(Tot) Performance orientation .904
(Tot) Social responsibility .936
(Tot) Supportiveness .879
(Tot) Emphasis on rewards .796
(Tot) Stability .778
(Tot) Competitiveness .863
(Tot) Innovation .788
Extraction Method: Principal Component Analysis.
Table 4.10: Total variance explained for the ECI
Extraction Method: Principal Component Analysis. Table 4.11: Total variance explained for the OCP
Component
Initial Eigenvalues Extraction Sums of Squared
Loadings
Total % of
Variance Cumulative % Total
% of Variance
Cumulative %
1 5.944 84.913 84.913 5.944 84.913 84.913
Extraction Method: Principal Component Analysis.
From this point onwards, the 18 subscales of ECI and 7 subscales of the OCP are examined.
Based on the above analysis, it can be concluded that there is 1 underlying construct for both
the ECI and the OCP instruments.
Component
Initial Eigenvalues Extraction Sums of Squared
Loadings
Total % of
Variance Cumulative % Total
% of Variance
Cumulative %
1 12.534 69.631 69.631 12.534 69.631 69.631
2 1.334 7.412 77.043 1.334 7.412 77.043

128
The answer to empirical question 2: Based on the above exploratory factor analysis it
can be concluded that there is one underlying construct for both ECI and the OCP
instruments and the instruments are determined to be internally consistent and
therefore reliable.
4.5 Empirical question 3: What are the descriptors of ECI, OCP and organisational performance as variables for this sample?
4.5.1 Assessment of the ECI and comparison of the ECI results obtained in this study, to the Haygroup norm
Tables 4.12 to 4.15 show the ECI summary of mean scores for all the questionnaires
completed. The tables also show the ‘total other’ average mean score and the Haygroup
Norm for each of the 18 competencies (see Norm column in Table 4.12 to 4.15). The ‘total other’ column is the average of the FSAM, FSE and staff scores. It can be seen from the
Table 4.12 that the TSO’s has rated his/her emotional competencies higher when compared
to how the ‘total other’ have rated him. The tendency of leaders to overrate their emotional
intelligence is collaborated by (Sala, 2001) and it is for this reason that the 360° rating
system is used.
Applying the HayGroup’s clustering of competencies principles discussed in section
3.4.2.1.1.2 to the ‘total other’ column, they outline a generic algorithm (NORM) that has been
shown to be effective for managers in many situations and are appropriate for assessment
and development purposes. Thus comparing the ‘total other’ column to the Norm column in
Tables 4.12 to 4.15, the clustering algorithm will be applied to the discussion below.
4.5.1.1 The self-awareness cluster
Self-awareness concerns knowing one’s internal states, preferences, resources, and
intuitions. The self-awareness cluster (Table 4.12) contains three competencies (HayGroup,
2005a):
• Emotional awareness: Recognising one’s emotions and their effects

129
• Accurate self-assessment: Knowing one’s strengths and limits
• Self-confidence: A strong sense of one’s self worth and capabilities
The three competencies in the self-awareness cluster are mandatory and must all be
present (HayGroup, 2005a: 4). Self-confidence (M=3.7968) which is a sense of one’s self
worth and capabilities, rates lower than the Norm (M=4). This is significant in that the people
rating the TSOs perceive them to lack self confidence, whereas the TSOs rating themselves
see themselves as oozing with self confidence. The TSOs are perceived to possess the
other two competencies namely: emotional self awareness and accurate self assessment.
Table 4.12: Summary of the mean scores for the self-awareness cluster of the ECI questionnaire
Clusters ECI Dimensions TSO FSAM FSE STAFF
TOTAL OTHER
Norm
Self awareness
Emotional Self
awareness 4.0784 3.5221 3.4743 3.6014 3.5055 3
Accurate self
assessment 4.1356 3.5199 3.4393 3.6787 3.5202 3
Self confidence 4.3263 3.8872 3.6565 3.9327 3.7968 4
4.5.1.2 The self-management cluster
Self-management refers to managing one’s internal states, preferences, resources, and
intuition. The self-management cluster (Table 4.13) contains six competencies (HayGroup,
2005a):
• Emotional self-control: Keeping disruptive emotions and impulses in check
• Transparency: Maintaining integrity and acting congruently with one’s values
• Adaptability: Flexibility in handling change

130
• Achievement: Striving to improve or meeting a standard of excellence
• Initiative: Readiness to act on opportunities
• Optimism: Persistence in pursuing goals despite obstacles and setbacks
In the self-management cluster, emotional self control is mandatory. The total other mean
score (M=3.413) exceeds the Norm (M=3) and therefore satisfies the requirements for
emotional self control. This implies that the TSO is perceived by the others to possess the
competency of emotional self control.
Transparency and adaptability are somewhat antagonistic. Transparency is about stability
and reliability and adaptability is about flexibility and openness to change (Jacobs, 2001). A
person must show one of these competencies. Table 4.13 shows that ‘total other’ perceives
the TSOs as having the transparency competency and not the adaptability competency.
Finally, a person must show either achievement or initiative or optimism.
Table 4.13: Summary of the mean scores for the self-management cluster of the ECI questionnaire
Clusters ECI
Dimensions TSO FSAM FSE STAFF
TOTAL OTHER
Nor
m
Self
management
Emotional
self control 3.7860 3.4358 3.3388 3.5534 3.4130 3
Transparency 4.0890 3.6128 3.4790 3.6542 3.5566 3
Adaptability 4.0720 3.5310 3.3645 3.8273 3.5545 4
Achievement
orientation 4.2669 3.6438 3.4533 3.8597 3.6301 3
Initiative 3.5191 3.3356 3.1051 3.3096 3.2271 4
Optimism 4.2458 3.5885 3.4766 3.8873 3.6298 3
131
4.5.1.3 Social-awareness cluster
Social-awareness refers to how people handle relationships and awareness of others’
feelings, needs and concerns. The social-awareness cluster (Table 4.14) contains three
competencies (HayGroup, 2005a):
• Empathy: Sensing others’ feelings and perspectives, and taking interest in their concerns
• Organisational-awareness: Reading a group’s emotional currents and power
relationships
• Service orientation: Anticipating, recognising, and meeting customers’ needs
In the social awareness cluster, empathy is mandatory. The ‘total other’ mean score for
empathy (M=3.6314) is less than the norm (M=4). The TSOs are perceived to lack empathy.
Organisational awareness and service orientation are alternate manifestations of each other,
thus a person must have one or the other. Organisational awareness tends to be used in
higher level management or executive positions where understanding and navigating the
organisation is critical for success. Service orientation tends to be important in positions
relating directly to customers external or internal (Jacobs, 2001). The study sample is taken
from a service sector and therefore making the service orientation competency more
important. The ‘total other’ mean score for service orientation (M=3.940) is less than the
norm (M=4). There is a small difference between the norm and the ‘total other’ score and the
difference maybe insignificant, however the researcher has chosen to highlight the
difference. The TSOs are perceived as not anticipating, nor recognising or meeting
customers’ needs.

132
Table 4.14: Summary of the mean scores for the social-awareness cluster of the ECI questionnaire
Clusters ECI Dimensions TSO FSAM FSE STAFF
TOTAL OTHER
Norm
Social
awareness
Empathy 4.2288 3.6549 3.5070 3.8023 3.6314 4
An organisational
awareness 3.8602 3.5973 3.2734 3.8577 3.5596 3
Service orientation 4.4068 4.0420 3.8178 4.0549 3.9459 4
4.5.1.4 Relationship management cluster
Relationship management concerns the skill or adeptness at inducing desirable responses
in others. The relationship management cluster (Table 4.15) contains six competencies
(HayGroup, 2005a):
• Developing others: Sensing others’ development needs and bolstering their abilities
• Inspirational leadership: Inspiring and guiding individuals and groups
• Change catalyst: Initiating or managing change
• Influence: Wielding effective tactics for persuasion
• Conflict management: Negotiating and resolving disagreements
• Teamwork and collaboration: Working with others towards shared goals. Creating
group synergy in pursuing collective goals
In the relationship management cluster, influence is mandatory. In addition to this
competency, an individual should have one competency from the group of developing others,
inspirational leadership, and change catalyst. They must also have either conflict
management or teamwork and collaboration. TSOs are perceived to meet all the
requirements of the relationship management cluster.

133
Table 4.15: Summary of the mean scores for the relationship management cluster of the ECI questionnaire
Clusters ECI Dimensions TSO FSAM FSE STAFF
TOTAL OTHER
Norm
Relationship
management
Developing others 4.4153 3.6925 3.4813 3.9151 3.6775 3
Inspirational
leadership 4.1992 3.5929 3.3832 3.7687 3.5629 3
Change catalyst 3.9068 3.2522 3.2453 3.5165 3.3186 3
Influence 3.9195 3.5310 3.3458 3.7687 3.5289 3
Conflict
management 3.5720 3.2765 3.2290 3.2866 3.2358 4
Teamwork and
collaboration 4.4047 3.5819 3.5888 3.9103 3.6658 3
4.5.2 Assessment of the OCP and comparison of the OCP sample results to the Australian Norm
Table 4.16 shows the OCP summary of mean scores for all the questionnaires filled in. The
table also shows the average mean ‘total score’ and Australian Norm for each of the seven
culture dimensions measured. The ‘total score’ column is the average of the TSO, FSAM,
FSE and staff scores. Rearranging the ‘total score’ column from highest to lowest:
• Performance orientation (M=3.585)
• Competitiveness (M=3.5074)
• Supportiveness (M=3.4825)
• Social responsibility (M=3.4507)
• Stability (M=3.3801)
• Emphasis on rewards (M=3.3288)
• Innovation (M=3.1887)

134
The OCP as described in the methodology chapter measures the strength of an
organisational culture. The means score suggest the strongest dimensions of organisational
culture perceived by the respondents are performance orientation and competitiveness.
These two dimensions had the highest means scores. Innovation is touted as a key value
within this organisation however, respondents did not perceive this as the case. The strength
of the organisational culture was measured using the following guideline:
0<1 is indicative of a very weak culture
1< Cmean<2 is indicative of weak culture
2<Cmean<3 is indicative of substantial culture
3<Cmean<4 is indicative of strong culture
4<Cmean<5 is indicative of very strong culture
Table 4.16: Summary of OCP questionnaire mean scores of all questionnaires filled in
TSO FSAM FSE STAFF
TOTALSCORE
Norm*
(Tot) Performance orientation 3.8623 3.5177 3.3715 3.7123 3.5850 4.02
(Tot) Social responsibility 3.7013 3.3982 3.2640 3.5725 3.4507 3.93
(Tot) Supportiveness 3.8284 3.4137 3.2897 3.5344 3.4825 3.7
(Tot) Emphasis on rewards 3.5869 3.3341 3.2780 3.2633 3.3288 3.61
(Tot) Stability 3.6780 3.3938 3.2126 3.3686 3.3801 3.46
(Tot) Competitiveness 3.8284 3.4248 3.3318 3.5684 3.5074 3.37
(Tot) Innovation 3.3962 3.1814 3.0304 3.2424 3.1887 3.37
*Norm based on an Australian Study

135
4.5.3 Assessment of performance
4.5.3.1 Assessment of the TSO performance appraisal scores
The use of the TSO performance appraisal as the organisational performance variables was
discussed in detail in section 3.4.2.1.3.1. Table 4.3a shows the descriptive statistics for the
TSO performance appraisal scores. The performance appraisal ratings of the leaders ranged
from a low of 2.75 to a high of 4.47 with a mean of 3.68. There was good variation among the
leader’s (TSO’s) performance appraisal scores that allows testing the relationship among
ECI, OCP and organisational performance. Applying the performance evaluation criteria as
set out in section 3.4.2.1.3.1, the mean score of 3.68 was indicative of good performance.
4.5.3.2 Assessment of the TSC performance scores
The use of the TSC performance scores as the performance variables was discussed in
detail in section 3.4.2.1.3.2. Table 4.3b shows the descriptive statistics for the TSC
performance scores. The performance ratings of the TSCs ranged from a low of 117.65 to a
high of 354.79 with a mean of 252.7. There was good variation among the TSC performance
scores that allows testing the relationship among ECI, OCP and organisational performance.
Applying the performance evaluation criteria as set out in section 3.4.2.1.3.2, the mean score
of 252.7 was indicative of satisfactory performance. The use of the TSC competition scores
as an organisational performance measure proved to be difficult as the data quality was
seriously in question. Therefore, further analysis was not possible. During the data
collection phase it was revealed that the central region did not participate because of the
data quality problems.

136
4.6 Empirical question 4: What are the effects of the moderator variables on the dependent and independent variables? (ECI, OCP and organisational performance)
4.6.1 Moderator variables
As part of the study, data for 8 moderator variables were collected. These are discussed in
section 3.4.2.2. The moderator variables descriptors are discussed in detail in Appendix F.
For the data collected for the 8 moderator variables, 2 variables namely:
• Gender
• Number of years the TSC existed for
have uneven distributions and had to be excluded from any further analysis. The following six
remaining variables namely:
• TSO age
• TSO race
• Qualifications of the TSO
• TSO tenure
• Size (number of employees)
• Number of years of employment within the organisation
have approximately equal distributions and are assumed as equal, were recategorised
(Appendix F) and applied to the study variables (ECI, OCP and organisational performance)
using a t-Test. t-Test effects are discussed in the next section.
4.6.2 Moderator variables on ECI
Figure 4.2: Moderator variables applied to ECI using t-Test
Moderator Variables
ECI

137
The detailed analysis of the 6 moderator variables on ECI dimensions using the t-Test
(Figure 4.2) is shown in Appendix G, section 1.1. The main results will be discussed further
in this section.
There was a statistically significant mean difference between 3 of the six moderator variables
(Figure 4.3 below) namely:
• Race of the TSO
• Years in the TSO
• Age of the TSO
Figure 4.3: Result of moderator variables applied to the ECI dimensions using t-Test
When racial differences (white and black) were tested using a t-Test, it was found that of the
18 ECI dimensions, there was a statistically significant mean difference between the scores
of black and white managers with the white managers scoring higher on 14 of the ECI
dimensions listed in Figure 4.3 above. In other words, the white managers are perceived as
scoring higher on 14 of the ECI dimensions than their black counterparts.
ECI
Race of TSO
•Emotional self awareness
•Self confidence
•Accurate self assessment
•Transparency
•Adaptability
•Achievement orientation
•Initiative
•Organisational awareness
•Service orientation
•Developing others
•Inspirational leadership
•Influence
•Conflict management
•Teamwork and collaboration
Age of the TSO
•Optimism
•Change catalyst
Years in TSO Position
•Initiative
Ho: M1=M2 • Statistically significant mean difference

138
When age of the TSO was applied using the t-Test, it was found that of the 18 ECI
dimensions, there was a statistical mean difference between the age of the TSO < 41 years
and age of the TSO ≥ 41 years, with age group <41 years scoring higher on 2 of the 18 ECI
dimensions namely optimism and change catalyst. Similarly, when applying the number of
years that a TSO has served in the TSO position (< 6 years or ≥6 years), there was a
statistical mean difference between the two groups with the group with ≥ 6 years work
experience in the position scoring high on the initiative dimension of the ECI.
4.6.3 Moderator variables on OCP
Figure 4.4: Moderator variable applied to OCP using t-Test
The detailed analysis of the 6 moderator variables on OCP dimensions using the t-Test
(Figure 4.4 above) is shown in Appendix G, section 1.2. The main results are discussed
further in this section.
There was a statistically significant mean difference between three of the six moderator
variables (Figure 4.5 below) namely:
• Race of the TSO
• Years in the TSO position
• No of employees reporting to the TSO
Moderator Variables
OCP

139
Figure 4.5: Result of applying the moderator variables on the OCP using t-Test When racial differences (white and black) were tested using a t-Test, it was found that of the
7 OCP dimensions, there was a statistically significant mean difference between the TSC led
by black and white managers with the white managers scoring higher on 5 of the OCP
dimensions listed in Figure 4.5.
Applying the number of years that a leader (TSO) has served in the leadership (TSO
position, < 6 years or ≥6 years), there was a statistically significant mean difference between
the two groups with the group with ≥ 6 years work experience in the leadership position
scoring high on the competitiveness dimension of the OCP.
Similarly, applying the number of employees reporting to the TSO (<25 people, ≥25 people),
there was a statistically significant mean difference between the two groups with the group <
25 people scoring high on the dimensions of stability and social responsibility of the OCP.
4.6.4 Moderator variables on organisational performance
Figure 4.6: Moderator variables applied to the TSO performance appraisal scores using t-Test
OCP
Race of the TSO
•Performance orientation
•Social responsibility
•Supportiveness
•Competitiveness
•Innovation
Years in TSO position
•Competitiveness
Number of employees reporting to the TSO
• Stability • Social responsibility
Moderator variables
P

140
The detailed analysis of the six moderator variables on performance using the t-Test (Figure
4.6) is shown in the Appendix G, section 1.3. The main results will be discussed further in
this section.
There was a statistically significant mean difference between three of the six moderator
variables (Figure 4.7) namely
• Race of the TSO
• Years in the TSO position
• Age of the TSO
Figure 4.7: Result of applying the moderator variables to the TSO performance appraisal scores using t-Test
When racial differences (white and black) were tested using a t-Test on organisational
performance (TSO PA score), there was a statistically significant mean difference in
performance between the black and white managers. The white managers had higher
performance scores than their black counterparts listed in Figure 4.5 above.
When age of the TSO was tested, there was a statistically significant mean difference
between the age of the TSO < 41 years and age of the TSO≥ 41 years, with age group >41
years scoring higher on organisational performance.
Organisational P
Age of the TSO
Race of the TSO
Years in TSO Position
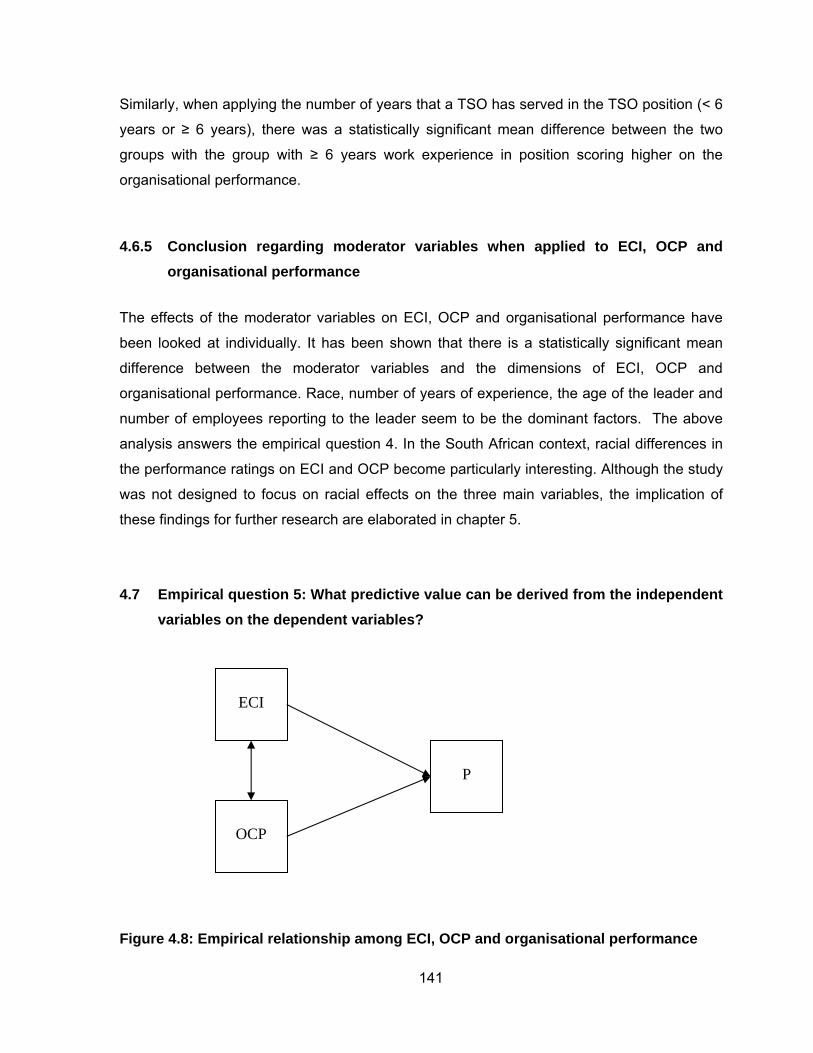
141
Similarly, when applying the number of years that a TSO has served in the TSO position (< 6
years or ≥ 6 years), there was a statistically significant mean difference between the two
groups with the group with ≥ 6 years work experience in position scoring higher on the
organisational performance.
4.6.5 Conclusion regarding moderator variables when applied to ECI, OCP and organisational performance
The effects of the moderator variables on ECI, OCP and organisational performance have
been looked at individually. It has been shown that there is a statistically significant mean
difference between the moderator variables and the dimensions of ECI, OCP and
organisational performance. Race, number of years of experience, the age of the leader and
number of employees reporting to the leader seem to be the dominant factors. The above
analysis answers the empirical question 4. In the South African context, racial differences in
the performance ratings on ECI and OCP become particularly interesting. Although the study
was not designed to focus on racial effects on the three main variables, the implication of
these findings for further research are elaborated in chapter 5.
4.7 Empirical question 5: What predictive value can be derived from the independent variables on the dependent variables?
Figure 4.8: Empirical relationship among ECI, OCP and organisational performance
ECI
OCP
P

142
In this section, the relationship (Figure 4.8) between ECI and organisational performance,
between OCP and organisational performance, between ECI and OCP on organisational
performance is examined. In the next section, the relationship between ECI and OCP using
canonical correlations is illustrated and discussed.
4.7.1 Canonical correlations
Figure 4.9: Relationship between ECI and OCP
4.7.1.1 Objectives of canonical correlation analysis
The objective of this part of the study is to examine the dynamic effects of leader ECI on
organisational culture. The hypothesised relationships are stated in H0c , H1c and depicted by
Figure 4.9.
H0c: There is no correlation between any linear combination of the leader EQ dimensions
and any linear combination of the organisational culture dimensions.
H1c: There is a relationship between at least one linear combination of the leader EQ
dimensions and at least one linear combination of organisational culture
dimensions.
The 18 ECI variables were used as independent variables and the 7 OCP variables were
designated as the dependent variables. The statistical problem involved identifying any latent
relationships (relationship between composites of variables rather than the individual
variables themselves) between the ‘total other’ perception of the leader’s emotional
competency and their perception of the organisational culture ‘total score’. Since one of the
major objectives of the study was to examine the multiple relationships between the predictor
and criterion variables, the statistical technique of canonical correlations was appropriate.
ECI OCP

143
4.7.1.2 Deriving the canonical functions and assessing overall fit
Canonical correlations analysis is a multivariate statistical model that facilitates the study of
interrelationships among sets of multiple dependent variables and multiple independent
variables (Hair et al., 1998: 444).
Essentially, canonical analysis established two sets of weighting coefficients (a set for the
criterion variables and a set for the predictor variables) such that if linear variates (or
canonical factors) were formed for each set of variables, these variates would be more highly
correlated than any other pair of linear compounds that could be formed. This technique is
similar to factor analysis in that a large number of relationships is reduced to a smaller
number of factors. However, where the factor model establishes orthogonal factors, each of
which accounts for a maximum amount of variance among variables in one domain, the
canonical model establishes orthogonal factor pairs, each of which accounts for a maximum
amount of covariance between the respective sets of variables in two different domains
(Cooley & Lohnes, 1971).
Table 4.17 below displays the canonical correlation, adjusted canonical correlation,
approximate standard error, and squared canonical correlation for each pair of canonical
variables. The first canonical correlation (the correlation between the first pair of canonical
variables) is 0.8320 with a corresponding squared canonical correlation of 0.6922. The
canonical correlation of 0.8320 represents the highest possible correlation between any
linear combination of emotional competency variables and any linear combination of
organisational culture variables.

144
Table 4.17: Canonical correlation and eigenvalues
Canonical
Correlation
Adjusted Canonical
Correlation
ApproximateStandard
Error
Squared Canonical
Correlation
Eigenvalues of Inv(E)*H = CanRsq/(1-CanRsq)
Eigenvalue Difference Proportion Cumulative
1 0.832010 0.789281 0.028699 0.692241 2.2493 0.8262 0.4999 0.4999
2 0.766363 0.723404 0.038483 0.587312 1.4231 1.1010 0.3163 0.8162
3 0.493587 0.330955 0.070532 0.243628 0.3221 0.1152 0.0716 0.8878
4 0.414033 0.234570 0.077265 0.171423 0.2069 0.0532 0.0460 0.9338
5 0.365030 . 0.080825 0.133247 0.1537 0.0767 0.0342 0.9680
6 0.267500 . 0.086578 0.071556 0.0771 0.0100 0.0171 0.9851
7 0.250744 . 0.087388 0.062872 0.0671 0.0149 1.0000
Table 4.18 lists the likelihood ratio and associated statistics for testing the hypothesis that the
canonical correlations in the current row and all that follow are zero. The first and second
approximate F value of 2.58 and 1.73 respectively corresponds to the test that all other
canonical correlations are zero. Since the p-values are small (< 0.0001), the null hypothesis
would be rejected at the 0.01 level for both these variables. The third variate with an
approximate F value of 0.95 corresponds to the test that the remaining canonical correlations
variables are zero. Since the p-values are large, this hypothesis would not be rejected and
conclude that only the first and second canonical correlations are significant.

145
Table 4.18: Likelihood tests
Test of H0: The canonical correlations in the current row and all that follow are zero
Likelihood Ratio
Approximate F Value Num DF Den DF Pr > F
1 0.06002738 2.58 126 607.87 <.0001
2 0.19504690 1.73 102 531.49 <.0001
3 0.47262600 0.95 80 452.02 0.5971
4 0.62485951 0.79 60 369.16 0.8705
5 0.75413600 0.67 42 282.58 0.9406
6 0.87007007 0.53 26 192 0.9705
7 0.93712751 0.54 12 97 0.8818
Table 4.19 lists several multivariate statistics and F test approximations for the null
hypothesis that all canonical correlations are zero. The small p-values for these tests
(<0.0001), suggest rejecting the null hypothesis that all canonical correlations are zero in the
population confirming the results of the likelihood ratio test in Table 4.15. With all of the tests
resulting in a p-value smaller than (<0.0001), one can assume that the first two canonical
correlations are significant. The next step is to interpret or identify the canonical variables
corresponding to this significant correlation. Even though canonical variables are ‘artificial’, they can often be ‘identified’ in terms of the original variables (Hair et al., 1998). This is done
primarily by inspecting the standardised coefficients of the canonical variables and the
correlations between the canonical variables and their original variables. Since only the first
two canonical correlations are significant, only the first two pairs of canonical variables need
to be identified.

146
Table 4.19: Multivariate Statistics and approximate F tests
Multivariate Statistics and F Approximations
S=7 M=5 N=44.5
Statistic Value F Value Num DF Den DF Pr > F
Wilks' Lambda 0.06002738 2.58 126 607.87 <.0001
Pillai's Trace 1.96228106 2.10 126 679 <.0001
Hotelling-Lawley Trace 4.49932248 3.19 126 414.42 <.0001
Roy's Greatest Root 2.24929890 12.12 18 97 <.0001
NOTE: F Statistic for Roy's Greatest Root is an upper bound.
4.7.1.3 Statistical and practical significance
The first statistical significance test is for the canonical correlations of each of the two
canonical functions. In this study, the first two canonical correlations are statistically
significant (see Table 4.18). In addition to tests of each canonical function separately,
multivariate tests of both functions simultaneously were also performed. The test statistics
employed are Wilks’ Lambda, Pillai’s Trace, Hotelling-Lawley Trace, and Roy’s Greatest
Root. Table 4.19 also details the multivariate test statistics, which all indicate that the
canonical functions, taken collectively, are statistically significant at the .01 level.
In addition to statistical significance, the canonical correlations were both of sufficient size to
be deemed practically significant. The final step was to perform redundancy analyses on
both canonical functions.

147
4.7.1.4 Redundancy measure of shared variance
Table 4.20:Standardised Variance of the emotional competency variables
(independent variables)
Canonical Variable Number
Their Own Canonical Variables
CanonicalR-Square
The Opposite Canonical Variables
ProportionCumulativeProportion Proportion
CumulativeProportion
1 0.4059 0.4059 0.6922 0.2810 0.2810
2 0.1891 0.5950 0.5873 0.1111 0.3920
3 0.0184 0.6134 0.2436 0.0045 0.3965
4 0.0207 0.6340 0.1714 0.0035 0.4001
5 0.0159 0.6500 0.1332 0.0021 0.4022
6 0.0198 0.6698 0.0716 0.0014 0.4036
7 0.0145 0.6843 0.0629 0.0009 0.4045
Table 4.21: Standardised Variance of the organisational culture variables (dependent variables)
Canonical Variable Number
Their Own Canonical Variables
CanonicalR-Square
The Opposite Canonical Variables
ProportionCumulativeProportion Proportion
CumulativeProportion
1 0.6308 0.6308 0.6922 0.4366 0.4366
2 0.2377 0.8685 0.5873 0.1396 0.5763
3 0.0323 0.9008 0.2436 0.0079 0.5841
4 0.0408 0.9416 0.1714 0.0070 0.5911
5 0.0151 0.9567 0.1332 0.0020 0.5931
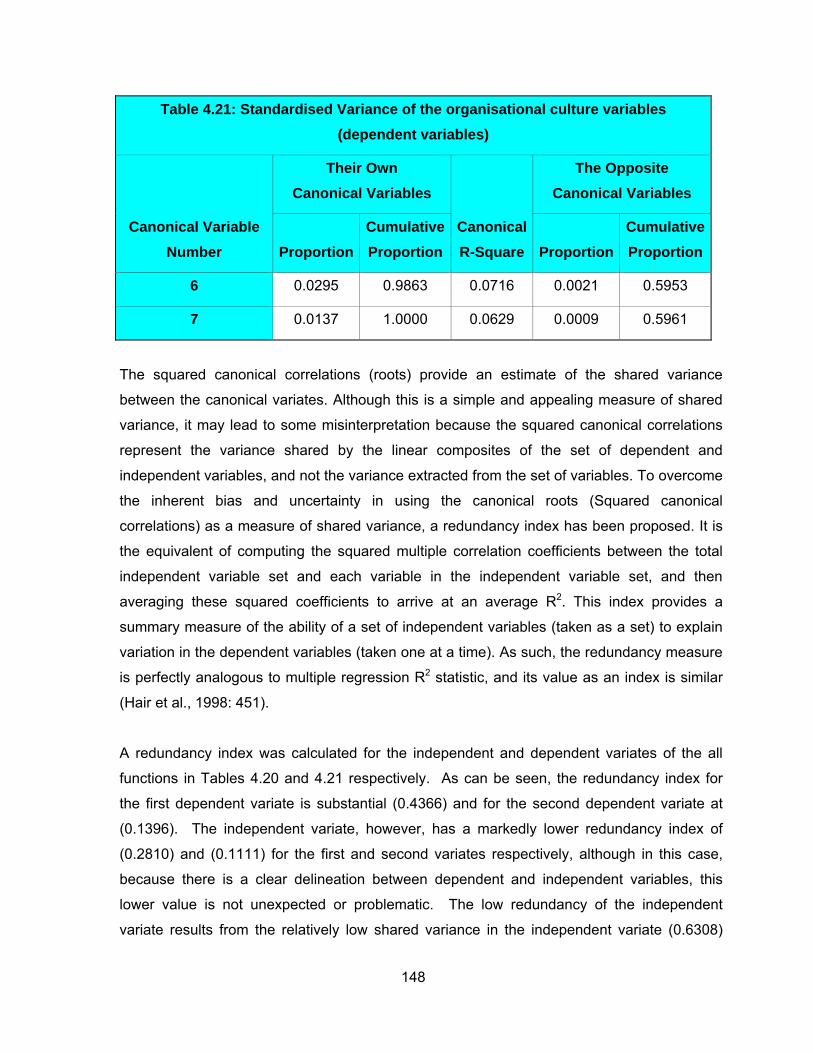
148
Table 4.21: Standardised Variance of the organisational culture variables (dependent variables)
Canonical Variable Number
Their Own Canonical Variables
CanonicalR-Square
The Opposite Canonical Variables
ProportionCumulativeProportion Proportion
CumulativeProportion
6 0.0295 0.9863 0.0716 0.0021 0.5953
7 0.0137 1.0000 0.0629 0.0009 0.5961
The squared canonical correlations (roots) provide an estimate of the shared variance
between the canonical variates. Although this is a simple and appealing measure of shared
variance, it may lead to some misinterpretation because the squared canonical correlations
represent the variance shared by the linear composites of the set of dependent and
independent variables, and not the variance extracted from the set of variables. To overcome
the inherent bias and uncertainty in using the canonical roots (Squared canonical
correlations) as a measure of shared variance, a redundancy index has been proposed. It is
the equivalent of computing the squared multiple correlation coefficients between the total
independent variable set and each variable in the independent variable set, and then
averaging these squared coefficients to arrive at an average R2. This index provides a
summary measure of the ability of a set of independent variables (taken as a set) to explain
variation in the dependent variables (taken one at a time). As such, the redundancy measure
is perfectly analogous to multiple regression R2 statistic, and its value as an index is similar
(Hair et al., 1998: 451).
A redundancy index was calculated for the independent and dependent variates of the all
functions in Tables 4.20 and 4.21 respectively. As can be seen, the redundancy index for
the first dependent variate is substantial (0.4366) and for the second dependent variate at
(0.1396). The independent variate, however, has a markedly lower redundancy index of
(0.2810) and (0.1111) for the first and second variates respectively, although in this case,
because there is a clear delineation between dependent and independent variables, this
lower value is not unexpected or problematic. The low redundancy of the independent
variate results from the relatively low shared variance in the independent variate (0.6308)

149
and (0.2377) for the first and second variate, and not from the canonical R2. From the
redundancy analysis and the statistical significance tests, the first and second functions
should be accepted as they are seen as been statistically and practically significant (Hair et
al., 1998: 453).
4.7.1.5 Canonical loadings
Canonical loadings have been increasingly used as a basis for interpretation because of the
deficiencies inherent in canonical weights. Canonical loadings, also called canonical
structure correlations, measure the simple linear correlation between an original observed
variable in the dependent or independent set and the set’s canonical variate. The canonical
loading reflects the variance that the observed variable shares with the canonical variate and
can be interpreted like factor loadings in assessing the relative contributions of each variable
to each canonical function. The methodology considers each independent canonical function
separately and computes the within-set variable-to-variable correlation. The larger the
coefficient the more important it is in deriving the canonical variate (Hair et al., 1998: 453).
Tables 4.22 and 4.23 show the canonical loadings for the dependent and independent
variates for first and second canonical functions respectively. The objective of maximizing
the variates for the correlation between them results in variates “optimized” not for
interpretation, but instead for prediction. This makes identification of relationships more
difficult. In the dependent variate, variables have loadings ranging from 0.599 to 0.9523 for
the first variate and ranging from 0.3588 to 0.9069 for the second variate, resulting in the
shared variance of (0.6305) for the first variate and (0.2307) for the second variate. This
indicates a degree of intercorrelation among the variables and suggests that measures are
representative of the effects of the leader’s (TSO’s) efforts. The 5 variates with highest
loadings (canonical loadings >0.5 are read, see Table H1 in Appendix H for explanations) on
the dependent variate 1 are C1( performance orientation), C6 (competitiveness), C2
(social responsibility), C7 (innovation) and C3 (supportiveness). Similarly, the second
variate with highest loadings on the dependent variate 2 are C5 (stability) and C4
(emphasis on rewards).
The first independent variate has a quite different pattern, with loadings ranging from .2052
to .8533. The 12 variables with the highest loadings on the independent variate are EQ7
150
(achievement orientation), EQ3 (self-confidence), EQ13 (developing others), EQ8
(initiative), EQ14 (inspirational leadership), EQ12 (service orientation), EQ6
(adaptability), EQ16 (influence), EQ17 (conflict management), EQ5 (transparency), EQ1
(emotional self-awareness) and EQ15 (change catalyst). The second independent variate
has a quite different pattern, with loadings ranging from 0.0124 to 0.7562. The 4 variables
with the highest loadings on the independent variate are EQ10 (empathy), EQ4 (emotional self control), EQ9 (optimism), and EQ18 (teamwork and collaboration).
Thus, the first dependent/independent variate set (shown in Figure 4.10) shows that the
emotional intelligence competencies of achievement orientation, self-confidence, developing
others, initiative, inspirational leadership, service orientation, adaptability, influence, conflict
management transparency, emotional self-awareness and change management correlate
with an organisation culture that has the following dimensions: performance orientation,
social responsibility, supportiveness, competitiveness and innovation.
The properties associated with the first variate set are shown in Table 4.24. This result
suggests that when a leader displays the following emotional competencies (independent
variate set 1) - striving to improve or meeting a standard of excellence; a strong sense of
one’s self worth and capabilities; sensing others’ development needs and bolstering their
abilities; readiness to act on opportunities; inspiring and guiding individuals and groups;
anticipating, recognising, and meeting customer needs; flexibility in handling change;
wielding effective tactics for persuasion; negotiating and resolving disagreements;
maintaining integrity, acting congruently with one’s values; recognising one’s emotions and
their effects; and initiating and managing change – then the correlating culture associated
with independent variate set one are - Performance orientation (having high expectation
for performance; enthusiasm for the job; being results oriented; being highly organised),
Competitiveness (achievement orientation, an emphasis on quality, being distinctive, being
competitive), Social responsibility (being reflective, having a good reputation, being socially
responsible, having a clear guiding philosophy), Innovation (being innovative, quick to take
advantage of opportunities, risk taking, taking individual responsibility) and Supportiveness (being team orientated, sharing information freely, being people oriented, collaboration).
The second, dependent/independent variate set (shown in Figure 4.11) shows that a leader’s
emotional intelligence competencies of empathy, emotional self-control, optimism, teamwork

151
and collaboration correlate with an organisation culture with the following dimensions:
emphasis on rewards and stability.
The properties associated with the second variate set are shown in Table 4.25. This result
suggests that when a leader displays the following emotional competencies (independent
variate set two) -The second variate set result suggests when a leader displays the following
emotional competencies sensing others’ feelings and perspectives and taking an active
interest in their concerns; keeping disruptive emotions and impulses in check; persistence in
pursuing goals despite obstacles and setbacks; and working with others toward shared
goals. Creating group synergy in pursuing collective goals then the correlating culture
associated with independent variate set one are - Emphasis on rewards (fairness,
opportunities for professional growth, high pay for good performance, praise for good
performance) and Stability (stability, being calm, security of employment, low conflict).
When interpreting canonical correlation results using canonical loadings it is often the
practice to give the variate sets labels. The first and second variate set is shown in rank
order in Figure 4.10 and Figure 4.11 respectively and Tables 4.24 and 4.25 highlight the
properties associated with each variate set respectively in rank order. An attempt was made
to label each variate set however, this proved to be difficult. The key thoughts that come to
mind when reviewing the first variate set (leader EQ competencies and organisation culture)
is a leader who is entrepreneurial and transformational epitomising Richard Branson as
leader of Virgin as the organisation that is thinking outside the box and rewriting the market
rules. In other words, a leader with the EQ competencies of ECI variate set 1 correlate with
the cultural dimensions of OCP variate set 1(see Figure 4.10).
The second variate set epitomises your typical parastatal type leader who is concerned with
maintaining stability and not upsetting the status quo (see Figure 4.11).

152
Table 4.22: Correlations between the organisational culture variables and their canonical variables (Canonical loadings for the dependent variate)
W1 W2
TOT_C1 Performance orientation 0.9523 0.2598
TOT_C2 Social responsibility 0.8497 0.4771
TOT_C3 Supportiveness 0.7070 0.6596
TOT_C4 Emphasis on rewards 0.6118 0.6037
TOT_C5 Stability 0.5990 0.7102
TOT_C6 Competitiveness 0.9235 0.1742
TOT_C7 Innovation 0.8370 0.1861
Table 4.23: Correlations between the emotional competency variables and their canonical variables (Canonical loadings for the independent variate)
V1 V2
TOT_EQ1 Emotional self-awareness 0.5054 0.3597
TOT_EQ2 Accurate self-assessment 0.4768 0.5526
TOT_EQ3 Self-confidence 0.8514 0.1757
TOT_EQ4 Emotional self-control 0.2052 0.6391
TOT_EQ5 Transparency 0.6112 0.3216
TOT_EQ6 Adaptability 0.7173 0.2969
TOT_EQ7 Achievement orientation 0.8533 0.2108
TOT_EQ8 Initiative 0.7705 0.0124
TOT_EQ9 Optimism 0.4973 0.6336
TOT_EQ10 Empathy 0.4663 0.7562
TOT_EQ11 Organisational awareness 0.4220 0.4251
TOT_EQ12 Service orientation 0.7683 0.1481

153
V1 V2
TOT_EQ13 Developing others 0.7730 0.4092
TOT_EQ14 Inspirational leadership 0.7693 0.4872
TOT_EQ15 Change catalyst 0.5051 0.4240
TOT_EQ16 Influence 0.6752 0.3192
TOT_EQ17 Conflict management 0.6133 0.0478
TOT_EQ18 Team work and collaboration 0.5799 0.6553
Factor loadings>0.5 are considered (Hair et al., 1998: 111)
Figure 4.10: First dependent/independent variate set
ECI variates 1 Achievement orientation
Self confidence Developing others
Initiative Inspirational leadership
Service orientation Adaptability
Influence Conflict management
Transparency Emotional self awareness
Change catalyst
OCP variates 1 Performance orientation
Competitiveness Social responsibility
Innovation Supportiveness
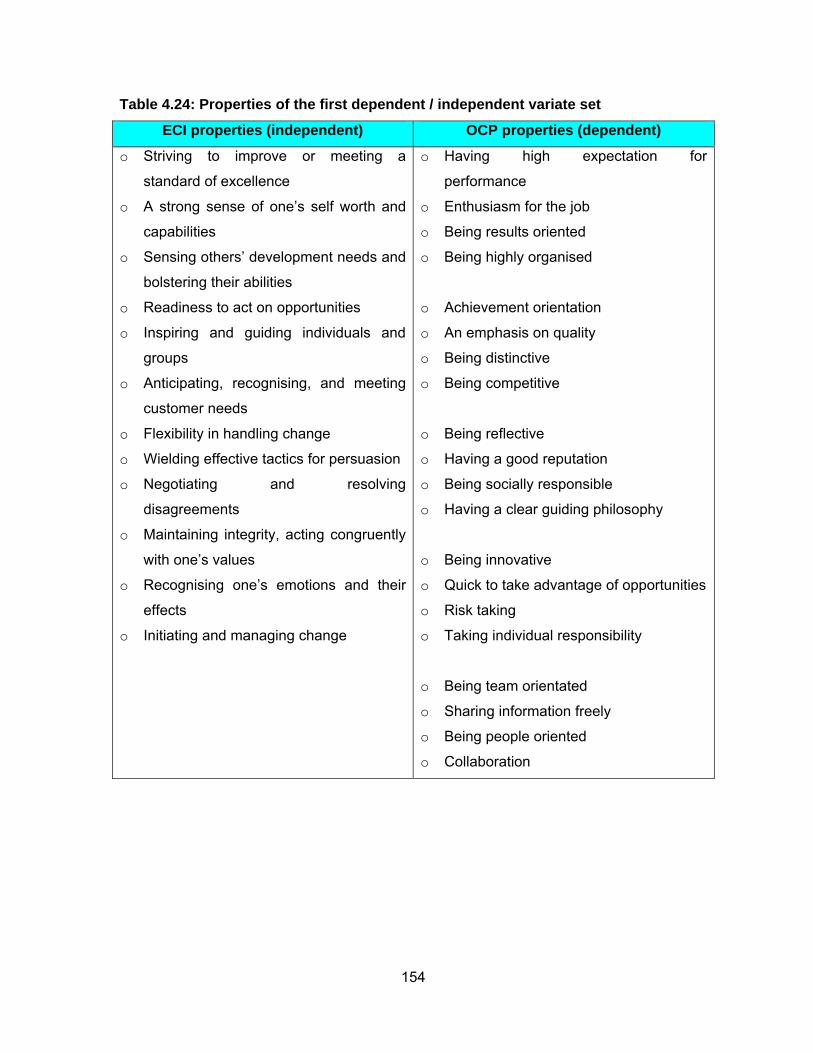
154
Table 4.24: Properties of the first dependent / independent variate set
ECI properties (independent) OCP properties (dependent)
o Striving to improve or meeting a
standard of excellence
o A strong sense of one’s self worth and
capabilities
o Sensing others’ development needs and
bolstering their abilities
o Readiness to act on opportunities
o Inspiring and guiding individuals and
groups
o Anticipating, recognising, and meeting
customer needs
o Flexibility in handling change
o Wielding effective tactics for persuasion
o Negotiating and resolving
disagreements
o Maintaining integrity, acting congruently
with one’s values
o Recognising one’s emotions and their
effects
o Initiating and managing change
o Having high expectation for
performance
o Enthusiasm for the job
o Being results oriented
o Being highly organised
o Achievement orientation
o An emphasis on quality
o Being distinctive
o Being competitive
o Being reflective
o Having a good reputation
o Being socially responsible
o Having a clear guiding philosophy
o Being innovative
o Quick to take advantage of opportunities
o Risk taking
o Taking individual responsibility
o Being team orientated
o Sharing information freely
o Being people oriented
o Collaboration

155
Figure 4.11: Second independent/dependent variate set Table 4.25: Properties of the second independent/dependent variate set
ECI properties OCP properties
o Sensing others’ feelings and
perspectives, and taking an active
interest in their concerns
o Keeping disruptive emotions and
impulses in check
o Persistence in pursuing goals despite
obstacles and setbacks
o Working with others toward shared
goals. Creating group synergy in
pursuing collective goals
o Fairness
o Opportunities for professional growth
o High pay for good performance
o Praise for good performance
o Stability
o Being calm
o Security of employment
o Low conflict
4.7.1.6 Canonical correlation conclusions
The canonical correlation analysis addresses two primary objectives: (1) the identification of
dimensions among the dependent and independent variables that (2) maximize the
relationship between the dimensions. This provides the researcher with some insight into the
structure of the different variable sets as they relate to a dependence relationship. In
examining this relationship, it is noticed firstly that the seven dependent variables
(organisational culture variables measured by the OCP) are quite closely related and create
a well defined dimension for representing the outcomes of the leader’s emotional
ECI variates 2 Empathy
Emotional self control Optimism
Teamwork and collaboration
OCP variates 2 Emphasis on rewards
Stability

156
competency. Second, this outcome dimension is fairly well predicted by the set of
independent variables (18 ECI variables) when acting as a set. The redundancy value of
0.4366 would be a quite acceptable R2 for a comparable multiple regression. When
interpreting the independent variate 1, it is noticed that 12 variables listed in rank order
(achievement orientation, self confidence, developing others, initiative, inspirational
leadership, service orientation, adaptability, influence, conflict management transparency,
emotional self awareness and change catalyst) provide substantive contributions (factor
loadings >0.5) and thus are the key predictors of the first outcome dimension. When
interpreting the independent variate 2, it is noticed that 5 variables (empathy, teamwork and
collaboration, emotional self control, optimism and accurate self assessment) provide
substantive contributions and thus are the key predictors of the second outcome dimension.
These should be the focal points in the development of any strategy directed toward
impacting the outcomes of organisational culture. From the above analysis we can reject the
null hypothesis and accept the main hypothesis that there is a relationship between at least
one linear combination of the leader ECI dimensions and at least one linear combination of
organisational culture dimensions.
4.7.2 Multiple stepwise regression
Multiple regression analysis is a statistical technique that can be used to analyse the
relationship between a single dependent (criterion) variable and several independent
(predictor) variables. The objective of multiple regression analysis is to use the independent
variables whose values are known to predict the single dependent value selected.
4.7.2.1 Objectives of multiple regression
The researcher was interested in predicting the level of organisational performance from the
perception of the leader’s emotional competency and the perception of the organisational
culture. The main hypothesis is stated in H0 below. Before the main hypothesis H0 is solved,
the sub hypothesis H0a and H0b will be analysed first.

157
H0: There is no relationship between the dimensions of the leader EQ and the
dimensions of organisational culture on organisational performance.
H1: There is a relationship between at least one dimension of EQ and at least one
dimension of organisational culture on organisational performance.
The sub hypotheses can be stated as:
H0a: There is no relationship between the dimensions of EQ and organisational
performance.
H1a: There is a relationship between the dimensions of EQ and organisational
performance.
H0b: There is no relationship between the dimensions of organisational culture and
organisational performance.
H1b: There is a relationship between the dimensions of organisational culture and
organisational performance.
To apply the regression procedure, the researcher selected the TSO performance as the
dependent variable (Y) to be predicted by the 18 ECI independent variables or the 7 OCP
variables.
4.7.2.2 Research design of a multiple regression
The sample comprised 118 leaders (TSOs). The first question to be answered concerning
sample size is the level of relationship (R2) that can be detected reliably with the proposed
regression analysis. Table H1 in Appendix H, indicates that the sample of 118, with 18
independent variables, is able to detect relationships with R2 values of approximately 16
percent at a power of 0.80 with the significance level set at 0.05. The proposed regression
was deemed sufficient to identify not only statistically significant relationships but also
relationships that had managerial significance (Hair et al., 1998: 165). This is the minimum
R2 that is required to be considered significantly different from zero.
158
The sample of 118 observations also meets the proposed minimum guidelines for the ratio of
observations to independent variables with a ratio of 6 to 1 when looking at the 18 ECI
competencies as independent variables, a ratio of 16 to 1 when looking at the 7 OCP
dimensions as independent variables and approximately 5 to 1 when looking at ECI and
OCP combined.
4.7.2.3 Assumptions in multiple regression
Meeting the assumptions of regression analysis is essential to ensure that the results
obtained were truly representative of the sample and that the best results were obtained. Any
serious violations of the assumptions must be detected and corrected if at all possible. The
analysis to ensure that the research is meeting the basic assumptions of regression analysis
involves two steps:
• Testing the individual dependent and independent variables, and
• testing the overall relationship after model estimation.
This assessment of individual variables has been done in section 4.4, and the overall
relationship was examined after the model had been estimated.
4.7.2.4 Estimating the regression model
With the regression analysis specified in terms of the dependent and independent variables,
the sample deemed adequate for the objectives of the study, and the assumptions assessed
for the individual variables, the model-building process now proceeds to estimation of the
regression model and assessing the overall model fit. The stepwise procedure was employed
to select variables for inclusion in the regression variate. After the regression model was
estimated, the variate was assessed for meeting the assumptions of regression analysis.
Finally, the observations were examined to determine whether any observations should be
deemed influential.

159
4.7.2.5 Interpreting the regression variate
4.7.2.5.1 Variable information
Tables 4.26a and 4.26b list all the independent variables used in the study.
Table 4.26a: Description of ECI variables Variable Label
Tot_EQ1 (Tot) Emotional self-awareness. Recognizing how our emotions affect our
performance.
Tot_EQ2 (Tot) Accurate self-assessment. Knowing one's inner resources, abilities, and
limits.
Tot_EQ3 (Tot) Self-confidence. A strong sense of one's self-worth and capabilities.
Tot_EQ4 (Tot) Emotional self-control. Keeping disruptive emotions and impulses in check.
Tot_EQ5 (Tot) Transparency. Maintaining integrity, acting congruently with one's values.
Tot_EQ6 (Tot) Adaptability. Flexibility in handling change.
Tot_EQ7 (Tot) Achievement orientation achievement orientation. Striving to improve or
meeting a standard of excellence.
Tot_EQ8 (Tot) Initiative. Readiness to act on opportunities.
Tot_EQ9 (Tot) Optimism. Persistence in pursuing goals despite obstacles and setbacks.
Tot_EQ10 (Tot) Empathy. Sensing others' feelings and perspectives, and taking an active
interest in their concerns.
Tot_EQ11 (Tot) An organisational awareness. Reading a group's emotional currents and
power relationships.
Tot_EQ12 (Tot) Service orientation. Anticipating, recognizing, and meeting customers' or
clients' needs.
Tot_EQ13 (Tot) Developing others. Sensing others' development needs and bolstering their
abilities.
Tot_EQ14 (Tot) Inspirational leadership. Inspiring and guiding individuals and groups.
Tot_EQ15 (Tot) Change catalyst. Initiating or managing change.
Tot_EQ16 (Tot) Influence. Having impact on others.
Tot_EQ17 (Tot) Conflict management. Negotiating and resolving disagreements.
Tot_EQ18 (Tot) Teamwork and collaboration. Working with others towards a shared goal.
Creating group synergy in pursuing collective goals.

160
Table 4.26b: Description of OCP variables Variable Label
Tot_C1 (Tot) Performance orientation
Tot_C2 (Tot) Social responsibility
Tot_C3 (Tot) Supportiveness
Tot_C4 (Tot) Emphasis on rewards
Tot_C5 (Tot) Stability
Tot_C6 (Tot) Competitiveness
Tot_C7 (Tot) Innovation
4.7.2.5.2 Computing bivariate correlations
In most studies in which data is analysed using multiple regression, it is appropriate to begin
the analysis by computing all possible correlations between the study’s variables. Reviewing
these correlations will help the reader understand the big picture concerning the simple
relationships between the dependent (criterion) variables and the independent (predictor)
variables (Hatcher & Stepanski, 2001). Table 4.27 and 4.28 below shows the Pearson
correlation (r=correlation coefficient) between the 18 ECI variables, the 7 OCP variables with
TSO performance and TSC performance. The statistically significant variables are indicated
by * as listed below:
• ** Correlation is significant at the 0.01 level (2-tailed).
• * Correlation is significant at the 0.05 level (2-tailed).
The Pearson correlations indicated in Table 4.27 indicates the following ECI dimensions are
statistically significant with the TSO performance appraisal variable:
• self-confidence
• adaptability
• achievement orientation
• initiative
• service orientation
• developing others
• inspirational leadership

161
• influence
• conflict management
Similarly, the Pearson correlations indicated in Table 4.27 indicates the following ECI
dimensions are statistically significant with the TSC performance variable:
• Emotional self awareness
• Transparency
• Inspirational leadership
• Influence
While there are correlation values for both the performance variables that are statistically
significant, the correlation values for the TSO performance appraisal scores are reasonably
high to further analyse. It is for this reason that only the TSO performance appraisal scores
was future analysed and the TSC performance scores ignored (very low correlation
coefficients). Using the Burns (2000: 235) guideline to determine the degree of relationship
between the 18 ECI and TSO performance appraisal (0.2 - 0.4 low correlation and a weak
relationship) it can be said that for the above variables that are considered significant the
relationship with TSO performance is considerably weak.
The Pearson correlations indicated in Table 4.28 indicates that all of the OCP variables are
statistically significant (p<0.05) with the TSO performance appraisal variable and the TSC
performance variable. However, the TSC performance scores are ignored due to the reasons
given above. Using the Burns (2000: 235) guideline to determine the degree of relationship
between the OCP variables and TSO performance (0.2 - 0.4 low correlation and a weak
relationship) it can be said that for the above variables that are considered significant, the
relationship with TSO performance, is weak.

162
Table 4.27: Pearson Correlation between ECI and organisational performance
ECI Dimensions TSO performance appraisal for 2005
TSC Performance score 2005
Emotional self-awareness .106 .241(**)
Accurate self-assessment. .135 1
Self-confidence .319(**) .107
Emotional self-control -.096 .106
Transparency .156 .205(*)
Adaptability .237(*) .058
Achievement orientation .312(**) .044
Initiative .241(**) .175
Optimism .115 .152
Empathy .107 .057
Organisational awareness .163 .081
Service orientation .272(**) .066
Developing others .289(**) .071
Inspirational leadership .262(**) .192(*)
Change catalyst. .081 .094
Influence .218(*) .188(*)
Conflict management .193(*) -.030
Teamwork and collaboration .157 .058
Table 4.28: Pearson Correlation between OCP and organisational performance
OCP Dimensions TSO performance appraisal for 2005
TSC Performance score 2005
(Tot) Performance orientation .380(**) .272(**)
(Tot) Social responsibility .364(**) .294(**)
(Tot) Supportiveness .278(**) .212(*)
(Tot) Emphasis on rewards .191(*) .313(**)
(Tot) Stability .218(*) .313(**)
(Tot) Competitiveness .406(**) .290(**)

163
OCP Dimensions TSO performance appraisal for 2005
TSC Performance score 2005
(Tot) Innovation .391(**) .198(*)
4.7.2.6 Interpreting the multiple stepwise regressions between ECI and TSO performance
Figure 4.12: The relationship between ECI and organisational performance The step-wise multiple regression procedure selects 2 independent variables (Table 4.29) as
significantly contributing towards the prediction of performance. These variables are, in order
in which they entered the model, self-confidence (Tot_EQ3) and emotional self-control (Tot_EQ4). The dependent variable is the TSO’s performance appraisal score for 2005 used
as a measured of organisational performance.
Table 4.29: The relationship between ECI and organisational performance: Variables Entered/Removed (a)
Model Variables Entered
Variables Removed Method
1 Tot_EQ3 . Stepwise (Criteria: Probability-of-F-to-enter <=
.050, Probability-of-F-to-remove ≥ .100).
2 Tot_EQ4 . Stepwise (Criteria: Probability-of-F-to-enter <=
.050, Probability-of-F-to-remove ≥ .100).
a Dependent Variable: TSO_PA_2005
Table 4.30 shows the model summary for the R (correlation coefficient), R2 (coefficient of
determination), Adjusted R2 and Standard error of the Estimate. The R2 value indicates the
ECI P

164
percent of variance in the criterion (dependent) variable that is accounted for by the linear
combination of predictor (independent) variable. Model 1 has an R2 = 0.102 and model 2
has an R2 = 0.181. This indicates that the linear combination of self confidence (Tot_EQ3)
and emotional self control (Tot_EQ4) accounts for 18.1% of the variance, for model 2, in
TSO performance.
The R2 value is adjusted for the degrees of freedom and thus referred to as the adjusted R2.
This is provided because the actual value of R2 obtained with a given sample often
overestimates the population value for R2. The adjusted R2, however, has been adjusted
downwards to closely approximate the population value. For this reason the value to
adjusted R2 is normally smaller than the value of R2 (Hatcher & Stepanski, 2001).
Table 4.30: The relationship between ECI and organisational performance: Model summary
Model R R Square Adjusted R Square Std. Error of the Estimate
1 .319(a) .102 .094 .32757
2 .426(b) .181 .167 .31410
a Predictors: (Constant), self-confidence(Tot_EQ3)
b Predictors: (Constant), self-confidence(Tot_EQ3), emotional self-control(Tot_EQ4)
There is a significance test associated with the R2 which tests the hypothesis that R2 =0 in the
population. To test this null hypothesis, (Analysis of Variance column in Table 4.31 below,
section under the “F value”) is viewed. In both cases, there is an F value of 12.892 for model
1 and 12.505 for model 2. Under the heading “Sig” is the p-value associated with this F
value. The p-value gives the probability of obtaining an F value which is large or larger if the
null hypothesis were true. In both cases, the p-value is very small (0.000), so the null
hypothesis is rejected for both cases and it can be concluded that the obtained value for R2 is
statistically significant. In other words, the R2 obtained is probably greater than zero in the
population (Hatcher & Stepanski, 2001).
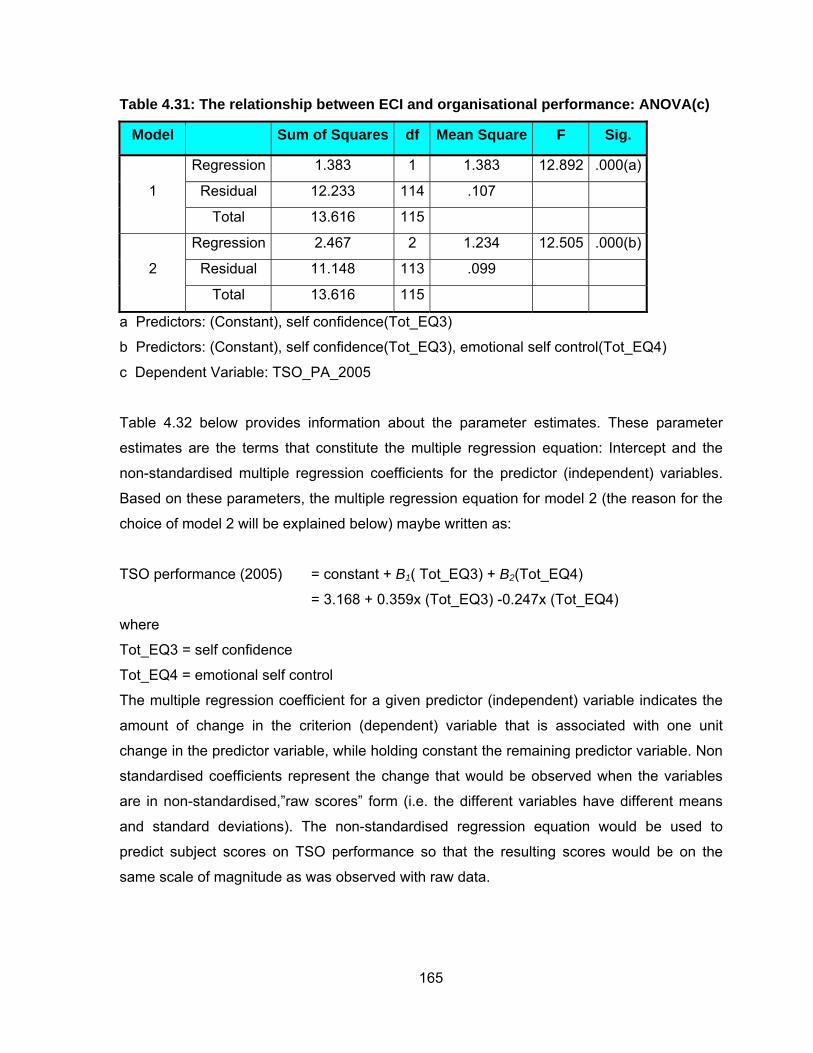
165
Table 4.31: The relationship between ECI and organisational performance: ANOVA(c)
Model Sum of Squares df Mean Square F Sig.
1
Regression 1.383 1 1.383 12.892 .000(a)
Residual 12.233 114 .107
Total 13.616 115
2
Regression 2.467 2 1.234 12.505 .000(b)
Residual 11.148 113 .099
Total 13.616 115
a Predictors: (Constant), self confidence(Tot_EQ3)
b Predictors: (Constant), self confidence(Tot_EQ3), emotional self control(Tot_EQ4)
c Dependent Variable: TSO_PA_2005
Table 4.32 below provides information about the parameter estimates. These parameter
estimates are the terms that constitute the multiple regression equation: Intercept and the
non-standardised multiple regression coefficients for the predictor (independent) variables.
Based on these parameters, the multiple regression equation for model 2 (the reason for the
choice of model 2 will be explained below) maybe written as:
TSO performance (2005) = constant + B1( Tot_EQ3) + B2(Tot_EQ4)
= 3.168 + 0.359x (Tot_EQ3) -0.247x (Tot_EQ4)
where
Tot_EQ3 = self confidence
Tot_EQ4 = emotional self control
The multiple regression coefficient for a given predictor (independent) variable indicates the
amount of change in the criterion (dependent) variable that is associated with one unit
change in the predictor variable, while holding constant the remaining predictor variable. Non
standardised coefficients represent the change that would be observed when the variables
are in non-standardised,”raw scores” form (i.e. the different variables have different means
and standard deviations). The non-standardised regression equation would be used to
predict subject scores on TSO performance so that the resulting scores would be on the
same scale of magnitude as was observed with raw data.

166
Researchers are often interested in determining whether regression coefficients for the
various predictor variables are significantly different from zero. When given coefficients are
statistically significant, this may be seen as evidence that the corresponding predictor
variable is a relatively important predictor of the criterion variable.
For the predictor variable, the output provides a t-Test that tests the null hypothesis that, in
the population, the regression coefficient is equal to zero. The obtained t-value may be found
in the “t” column in Table 4.32, “T for HO: Parameter=0”. The p-value corresponding to this
value of “t” may be found in the next column, headed “sig” (Hatcher & Stepanski, 2001).
Table 4.32: The relationship between ECI and organisational performance: Coefficients(a)
Model
Unstandardised Coefficients
Standardised Coefficients
t Sig.
Collinearity Statistics
B Std.
Error Beta Tolerance VIF
1 (Constant) 2.766 .258 10.735 .000
Tot_EQ3 .242 .067 .319 3.590 .000 1.000 1.000
2 (Constant) 3.168 .275 11.512 .000
Tot_EQ3 .359 .074 .472 4.873 .000 .772 1.296
Tot_EQ4 -.247 .075 -.321 -3.315 .001 .772 1.296
a Dependent Variable: TSO_PA_2005
In any interpretation of the regression variate, the researcher must be aware of the impact of
multicollinearity. Highly, collinear variables can distort the results substantially or make them
quite unstable and thus not generalisable. Two measures are available for testing the impact
of collinearity:
• Calculating the tolerance and variance inflation factor (VIF) values, and
• using the condition indices and decomposing the regression coefficient variance.
The tolerance value is one minus the proportion of the variables variance explained by the
other independent variables. Thus a high tolerance value indicates little collinearity, and
tolerance values approaching zero indicate that the variable is almost totally accounted for by
the other variables. The VIF is the reciprocal of the tolerance value, thus we look for small
VIF values as indicative of low intercorrelation among variables. In this case the tolerance
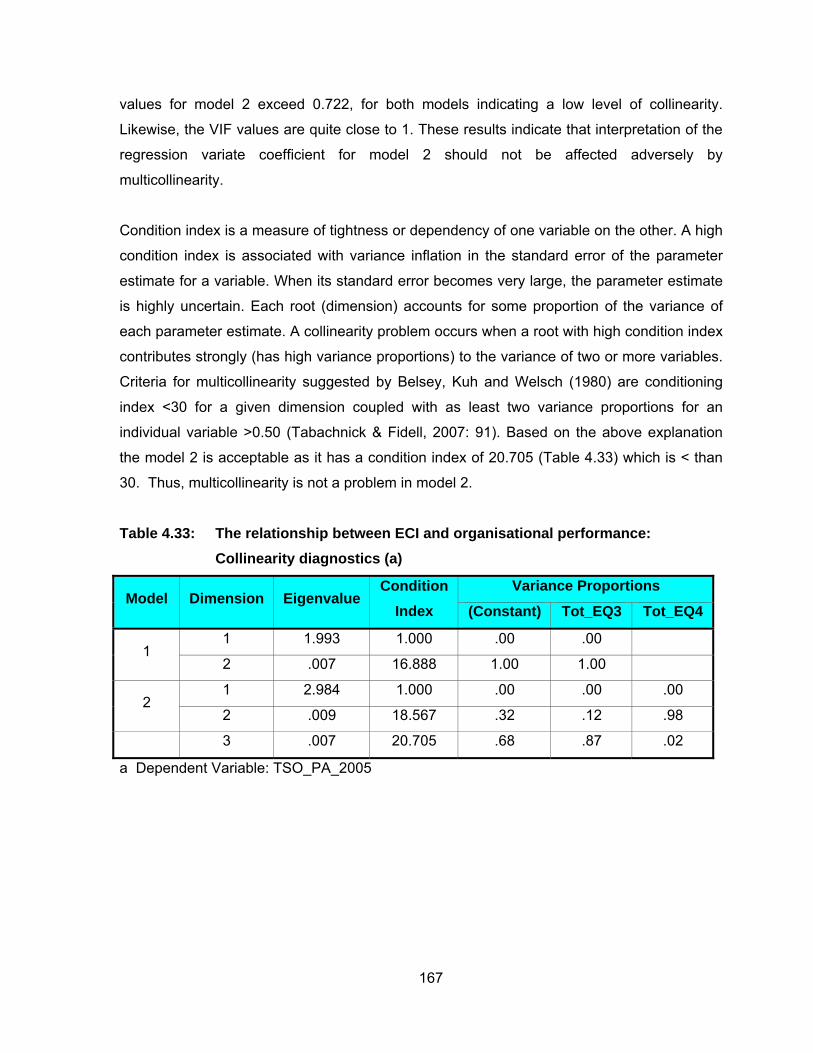
167
values for model 2 exceed 0.722, for both models indicating a low level of collinearity.
Likewise, the VIF values are quite close to 1. These results indicate that interpretation of the
regression variate coefficient for model 2 should not be affected adversely by
multicollinearity.
Condition index is a measure of tightness or dependency of one variable on the other. A high
condition index is associated with variance inflation in the standard error of the parameter
estimate for a variable. When its standard error becomes very large, the parameter estimate
is highly uncertain. Each root (dimension) accounts for some proportion of the variance of
each parameter estimate. A collinearity problem occurs when a root with high condition index
contributes strongly (has high variance proportions) to the variance of two or more variables.
Criteria for multicollinearity suggested by Belsey, Kuh and Welsch (1980) are conditioning
index <30 for a given dimension coupled with as least two variance proportions for an
individual variable >0.50 (Tabachnick & Fidell, 2007: 91). Based on the above explanation
the model 2 is acceptable as it has a condition index of 20.705 (Table 4.33) which is < than
30. Thus, multicollinearity is not a problem in model 2.
Table 4.33: The relationship between ECI and organisational performance: Collinearity diagnostics (a)
Model Dimension Eigenvalue Condition
Index
Variance Proportions
(Constant) Tot_EQ3 Tot_EQ4
1 1 1.993 1.000 .00 .00
2 .007 16.888 1.00 1.00
2 1 2.984 1.000 .00 .00 .00
2 .009 18.567 .32 .12 .98
3 .007 20.705 .68 .87 .02
a Dependent Variable: TSO_PA_2005

168
4.7.2.7 Interpreting the multiple regression between organisational culture and TSO performance
Figure 4.13: The relationship between organisational culture and organisational performance
Table 4.34 below shows the two independent OCP variables entered into the model namely,
competitiveness (Tot_C6) and emphasis on rewards (Tot_C4). The dependent variable is
the TSO’s performance appraisal score for 2005 used as a measured of organisational
performance.
Table 4.34: The relationship between OCP and organisational performance: Variables Entered/Removed(a)
Model Variables Entered
Variables Removed
Method
1 Tot_C6 . Stepwise (Criteria: Probability-of-F-to-enter <=
.050, Probability-of-F-to-remove ≥ .100).
2 Tot_C4 . Stepwise (Criteria: Probability-of-F-to-enter <=
.050, Probability-of-F-to-remove ≥ .100).
a Dependent Variable: TSO_PA_2005
Table 4.35 shows the model summary for the R , R2, adjusted R2 and Standard error of the
Estimate. The R2 value indicates the percent of variance in the criterion (dependent) variable
that is accounted for by the linear combination of predictor (independent) variable. Model 1
has an R2 = 0.165 and model 2 has an R2 = 0.194. This indicates that emphasis on rewards (Tot_C4) accounts for 16.5% of the variance, for model 1, in TSO performance.
OCP P

169
Table 4.35: The relationship between OCP and organisational performance: Model Summary
Model R R Square Adjusted R Square Std. Error of the Estimate
1 .406(a) .165 .157 .31586
2 .440(b) .194 .179 .31171
a Predictors: (Constant), competitiveness(Tot_C6)
b Predictors: (Constant), competitiveness(Tot_C6), emphasis on rewards(Tot_C4)
There is a significance test associated with the R2 which tests the hypothesis that R2 =0 in the
population. To test this null hypothesis, the (Analysis of Variance Table 4.36 below, section
under the “F value”) is viewed. In both cases, there is an F value of 22.472 for model 1 and
13.567 for model 2. Under the heading “Sig” is the p-value associated with this F value. The
p-value gives the probability of obtaining an F value which is large or larger if the null
hypothesis were true. In both cases, the p-value is very small (0.000), so the null hypothesis
is rejected and the obtained value for R2 is statistically significant. In other words, the R2
obtained is probably greater than zero in the population (Hatcher & Stepanski, 2001).
Table 4.36: The relationship between OCP and organisational performance: ANOVA(c)
Model Sum of Squares df Mean Square F Sig.
1
Regression 2.242 1 2.242 22.472 .000(a)
Residual 11.374 114 .100
Total 13.616 115
2
Regression 2.636 2 1.318 13.567 .000(b)
Residual 10.979 113 .097
Total 13.616 115
a Predictors: (Constant), competitiveness(Tot_C6)
b Predictors: (Constant), competitiveness(Tot_C6), emphasis on rewards(Tot_C4)
c Dependent Variable: TSO_PA_2005
The Table 4.37 provides information about the parameter estimates. These parameter
estimates are the terms that constitute the multiple regression equation: Intercept and the
non-standardised multiple regression coefficients for the predictor (independent) variables.

170
Based on these parameters, you may write the multiple regression equation for model 1 (the
reason for the choice of model 1 will be explained below) as:
TSO Performance (2005) = constant + B1( Tot_C6)
= 2.700 + 0.414x (Tot_C6)
where
Tot_C6 = competitiveness
For the predictor variable, the output provides a t-Test that tests the null hypothesis that, in
the population, the regression coefficient is equal to zero. The obtained t-value may be found
in the “t” column in Table 4.37, “T for HO: Parameter=0”. The p-value corresponding to this
value of “t” may be found in the next column, headed “sig”. Model 1 satisfies all the above
criteria and is therefore used as the acceptable model (Hatcher & Stepanski, 2001).
Table 4.37: The relationship between OCP and organisational performance: Coefficients(a)
Model
Unstandardized Coefficients
Standardized Coefficients
T Sig.
Collinearity Statistics
B Std.
Error Beta Tolerance VIF
1 (Constant) 2.700 .210 12.863 .000
Tot_C6 .281 .059 .406 4.740 .000 1.000 1.000
2 (Constant) 2.906 .231 12.579 .000
Tot_C6 .414 .088 .598 4.695 .000 .440 2.271
Tot_C4 -.202 .100 -.256 -2.015 .046 .440 2.271
a Dependent Variable: TSO_PA_2005
In any interpretation of the regression variate, the researcher must be aware of the impact of
multicollinearity. Highly, collinear variables can distort the results substantially or make them
quite unstable and thus not generaliseable. Two measures are available for testing the
impact of collinearity:
• Calculating the tolerance and VIF values, and
• using the condition indices and decomposing the regression coefficient variance

171
Similar to the detailed explanations given in section 4.7.2.6 above, model 2 has low tolerance
values with a VIF=2.271 on this basis we can ignore model 2 and conservatively choose
model 1. These results indicate that the interpretation of the regression variate coefficient for
model 1 should not be affected by multicollinearity.
Similarly to discussion in section 4.7.2.6 the first model is acceptable as it has a condition
index of 14.245 (Table 4.38) which is < than 30. Thus, multicollinearity is not a problem in
this model.
Table 4.38: The relationship between OCP and organisational performance: Collinearity diagnostics(a)
Model Dimension Eigenvalue Condition
Index
Variance Proportions
(Constant) Tot_C6 Tot_C4
1 1 1.990 1.000 .00 .00
2 .010 14.245 1.00 1.00
2 1 2.985 1.000 .00 .00 .00
2 .011 16.679 .96 .20 .07
3 .005 25.716 .04 .80 .93
a Dependent Variable: TSO_PA_2005
4.7.2.8 Interpreting the multiple stepwise regression between emotional competency and organisational culture on organisational performance
Figure 4.14: The relationship between emotional competency and organisational culture on organisational performance In this part of the analysis, ECI (18) and OCP (7) are entered stepwise into the analysis as
independent variables. Table 4.39 below shows the independent variables entered into the
ECI
P OCP

172
model namely, competitiveness (Tot_C6), emotional self-control (Tot_EQ4) and self-confidence (Tot_EQ3). The dependent variable is TSO performance appraisal score for
2005. The dependent variable is the TSO’s performance appraisal score for 2005 used as a
measured of organisational performance
Table 4.39: The relationship between ECI and OCP on organisational performance: Variables Entered/Removed(a)
Model Variables Entered
Variables Removed
Method
1 Tot_C6 . Stepwise (Criteria: Probability-of-F-to-enter <=
.050, Probability-of-F-to-remove ≥ .100).
2 Tot_EQ4 . Stepwise (Criteria: Probability-of-F-to-enter <=
.050, Probability-of-F-to-remove ≥ .100).
3 Tot_EQ3 . Stepwise (Criteria: Probability-of-F-to-enter <=
.050, Probability-of-F-to-remove ≥ .100).
a Dependent Variable: TSO_PA_2005
Table 4.40 shows the model summary for the R , R2, Adjusted R2 and Standard error of the
Estimate. The R2 value indicates the percent of variance in the criterion (dependent) variable
that is accounted for by the linear combination of predictor (independent) variable. Model 1
has an R2 = 0.165, model 2 has an R2 = 0.201 and model 3 has an R2 = 0.229. This
indicates that the linear combination of competitiveness (Tot_C6), emotional self-awareness (Tot_EQ4) accounts for 20.1 % of the variance, for model 2, in TSO
performance.

173
Table 4.40: The relationship between ECI and OCP on organisational performance: Model summary
Model R R Square Adjusted R Square Std. Error of the Estimate
1 .406(a) .165 .157 .31586
2 .449(b) .201 .187 .31021
3 .478(c) .229 .208 .30617
a Predictors: (Constant), competitiveness(Tot_C6)
b Predictors: (Constant), competitiveness(Tot_C6), emotional self control(Tot_EQ4)
c Predictors: (Constant), competitiveness(Tot_C6), emotional self control(Tot_EQ4), self-
confidence(Tot_EQ3)
There is a significance test associated with the R2 which tests the hypothesis that R2 = 0 in
the population. To test this null hypothesis, the (Analysis of Variance Table 4.41 below,
section under the “F value”) is viewed. In the three cases, you see an F value of 22.472 for
model 1, 14.249 for model 2 and 11.083 for model 3. Under the heading “Sig” is the p-value
associated with this F value. The p-value gives us the probability that you would obtain an F
value which is large or larger if the null hypothesis were true. In both cases, the p-value is
very small (0.000), so you reject the null hypothesis for all cases, and conclude that the
obtained value for R2 is statistically significant. In other words, it can be concluded that R2 is
probably greater than zero in the population (Hatcher & Stepanski, 2001).

174
Table 4.41: The relationship between ECI and OCP on organisational performance: ANOVA(d)
Model Sum of Squares df Mean Square F Sig.
1
Regression 2.242 1 2.242 22.472 .000(a)
Residual 11.374 114 .100
Total 13.616 115
2
Regression 2.742 2 1.371 14.249 .000(b)
Residual 10.874 113 .096
Total 13.616 115
3
Regression 3.117 3 1.039 11.083 .000(c)
Residual 10.499 112 .094
Total 13.616 115
a Predictors: (Constant), competitiveness (Tot_C6)
b Predictors: (Constant), competitiveness(Tot_C6), emotional self control(Tot_EQ4)
c Predictors: (Constant), competitiveness(Tot_C6), emotional self control(Tot_EQ4), self
confidence(Tot_EQ3)
d Dependent Variable: TSO_PA_2005
Table 4.42 provides information about the parameter estimates. These parameter estimates
are the terms that constitute the multiple regression equation: Intercept and the non-
standardised multiple regression coefficients for the predictor (independent) variables. Based
on these parameters, you may write the multiple regression equation for model 2 (the reason
for the choice of model 2 will be explained below) as:
TSO performance (2005) = constant + B1( Tot_C6) + B2(Tot_EQ4)
= 2.978 + 0.312(Tot_C6)-0.151(Tot_EQ4)
where
Tot_C6 = competitiveness
Tot_EQ4 = emotional self control
For the predictor variable, the output provides a t-test that test the null hypothesis that, in the
population, the regression coefficient is equal to zero. The obtained t-value may be found in
the t column in Table 4.42, “T for HO: Parameter=0”. The p-value corresponding to this value

175
of t may be found in the next column, headed “sig”. Model 2 satisfies all the above criteria
and is therefore used as the acceptable model (Hatcher & Stepanski, 2001).
Table 4.42: The relationship between ECI and OCP on organisational performance: Coefficients (a)
Model
Unstandardized Coefficients
Standardized Coefficients T Sig.
Collinearity Statistics
B Std. Error Beta Tolerance VIF
1 (Constant) 2.700 .210 12.863 .000
Tot_C6 .281 .059 .406 4.740 .000 1.000 1.000
2
(Constant) 3.109 .273 11.375 .000
Tot_C6 .312 .060 .450 5.216 .000 .950 1.053
Tot_EQ4 -.151 .066 -.197 -2.280 .024 .950 1.053
3
(Constant) 2.976 .278 10.706 .000
Tot_C6 .208 .079 .299 2.632 .010 .532 1.878
Tot_EQ4 -.218 .074 -.283 -2.965 .004 .754 1.326
Tot_EQ3 .191 .096 .252 1.999 .048 .433 2.311
a Dependent Variable: TSO_PA_2005
In any interpretation of the regression variate, the researcher must be aware of the impact of
multicollinearity. Highly, collinear variables can distort the results substantially or make them
quite unstable and thus not generalisable. Two measures are available for testing the impact
of collinearity:
• Calculating the tolerance and VIF values, and
• using the condition indices and decomposing the regression coefficient variance.
In this case the tolerance values for model 2 exceed 0.950, indicating a very low level of
collinearity. Likewise, the VIF values are quite close to 1. These results indicate that
interpretation of the regression variate coefficient for model 2 should not be affected
adversely by multicollinearity.
Based on the above explanation the second model is acceptable as it has a condition index
of 22.726 (Table 4.43) which is < than 30. Model 3 cannot be used as it exceeds the
collinearity limit of <30.
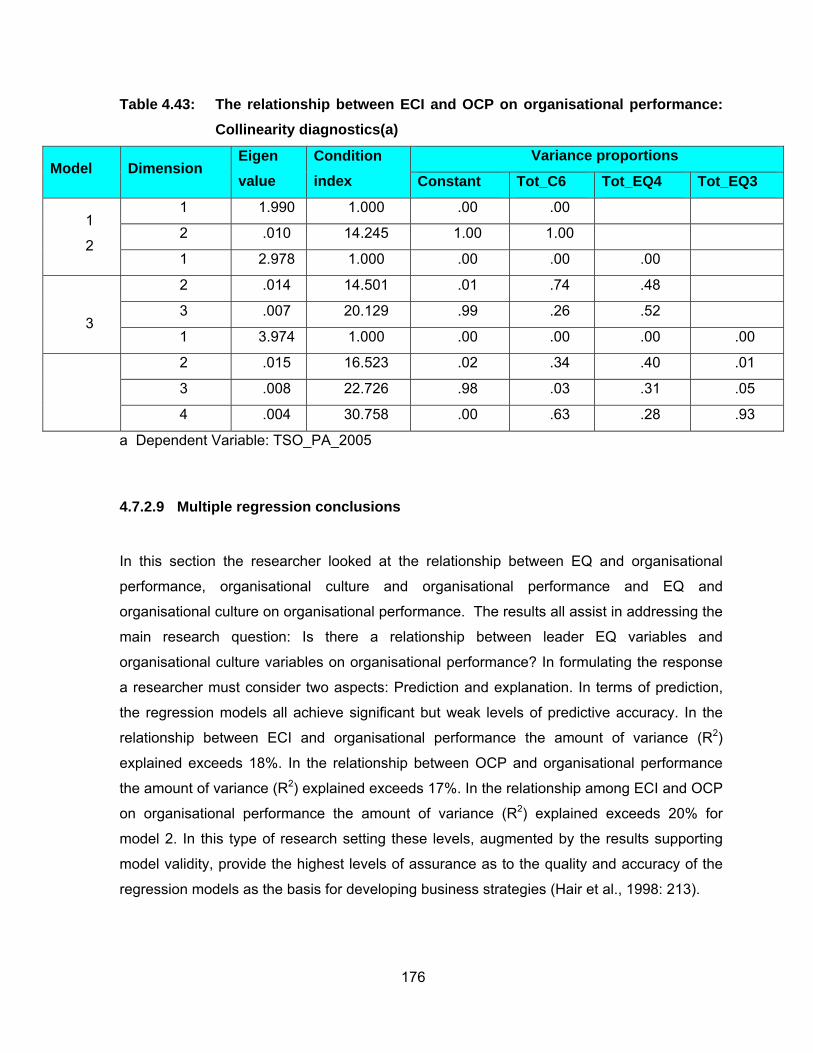
176
Table 4.43: The relationship between ECI and OCP on organisational performance: Collinearity diagnostics(a)
Model Dimension Eigen value
Condition index
Variance proportions
Constant Tot_C6 Tot_EQ4 Tot_EQ3
1
2
1 1.990 1.000 .00 .00
2 .010 14.245 1.00 1.00
1 2.978 1.000 .00 .00 .00
3
2 .014 14.501 .01 .74 .48
3 .007 20.129 .99 .26 .52
1 3.974 1.000 .00 .00 .00 .00
2 .015 16.523 .02 .34 .40 .01
3 .008 22.726 .98 .03 .31 .05
4 .004 30.758 .00 .63 .28 .93
a Dependent Variable: TSO_PA_2005
4.7.2.9 Multiple regression conclusions
In this section the researcher looked at the relationship between EQ and organisational
performance, organisational culture and organisational performance and EQ and
organisational culture on organisational performance. The results all assist in addressing the
main research question: Is there a relationship between leader EQ variables and
organisational culture variables on organisational performance? In formulating the response
a researcher must consider two aspects: Prediction and explanation. In terms of prediction,
the regression models all achieve significant but weak levels of predictive accuracy. In the
relationship between ECI and organisational performance the amount of variance (R2)
explained exceeds 18%. In the relationship between OCP and organisational performance
the amount of variance (R2) explained exceeds 17%. In the relationship among ECI and OCP
on organisational performance the amount of variance (R2) explained exceeds 20% for
model 2. In this type of research setting these levels, augmented by the results supporting
model validity, provide the highest levels of assurance as to the quality and accuracy of the
regression models as the basis for developing business strategies (Hair et al., 1998: 213).

177
In terms of explanation, the final model chosen conservatively, shows that it is perceived that
TSO performance is linked to TSC competitiveness and the lack of emotional control (not
keeping disruptive emotions and impulses in check) by the TSO. In other words, the TSC
that is seen as competitive and has a TSO who speaks his mind on issues relating to TSC
performance will improve TSC performance. With regard to the hypothesis, the null
hypothesis can be rejected and the main hypothesis that there is a relationship between at
least one linear combination of leader emotional competency and one linear combination of
organisational culture dimensions on organisational performance can be accepted.
4.8 Summary of analysis
In chapter 4 the researcher performs the necessary analysis to answer the 5 empirical
questions. The findings in respect to the above follows.
• Empirical question 1: The data could be used for analysis purposes.
• Empirical question 2: Factor analysis was possible and one construct was
extracted for each of the instruments (ECI and OCP).
• Empirical question 3: For the ECI instrument, it was found that of the six
mandatory competencies required for a person in a
leadership position, the leaders in this sample fell
short in two critical areas namely: self confidence and
empathy when compared to the HayGroup
international norm. For the OCP instrument it was
found that the culture in the TSCs were strong, proving
Schein’s (1985, 1992, 2004) assertions that leaders in
the start-up/early growth phase of the organisational
life cycle created strong cultures. Finally, regarding the
performance data analysis, it was found that TSOs
on average displayed good performance.
• Empirical question 4: Of the six moderator variables which were finally used
to test group differences, four namely, race of the leader,
age of the leader, years of experience of the leader and
number of employees reporting to the leader had a

178
statistically significant mean difference on some of the ECI
dimensions, OCP dimensions and on organisational
performance.
• Empirical question 5: A significant but weak relationship was reported
between EQ and organisational performance and between
organisational culture and organisational performance. A
moderate/substantial relationship was shown between EQ
and organisational culture.
In the next chapter the results obtained will be used to answer the research questions and
discuss the theoretical and practical implications of the study.

179
5 CHAPTER 5: DISCUSSIONS, CONCLUSIONS AND RECOMMENDATIONS
5.1 Introduction
The purpose of this research was to examine the dynamic relationships among a leader’s
emotional intelligence, organisation culture and organisational performance. While there
have been empirical examinations of a leader’s emotional intelligence and organisational
culture or with organisational performance, this is the first study to examine the linkages
among all three constructs. These linkages were conceptualized by drawing upon the
seminal work of Schein (1983) in which he argued that leaders have to create a strong
organisational culture in the early stages of an organisation in order for it to be successful
(perform well). Schein identified primary and secondary mechanisms through which a leader
creates the organisation culture. Building from this argument and the literature on emotional
intelligence which suggests that a leader’s emotional intelligence has a powerful effect on
followers, it was hypothesized that a leader’s emotional intelligence contributes to the
creation of a strong culture. Thus, a conceptual model was built and examined
systematically through a variety of empirical and analytical methods. The interest was in
illuminating the dynamic relationships among these three important organisational constructs
and hence a variety of statistical techniques were employed to provide a detailed
understanding of the relationships. One of the challenges was finding an appropriate sample
to test the relationships. The model was tested in 118 units of a large company. These
units were used as proxies of organisations in the early stages of their life cycle since all had
only been existence since 1997 and the majority had retained the same leader since
inception.

180
5.2 Empirical findings
5.2.1 Emotional intelligence
5.2.1.1 Self-awareness cluster
There were interesting differences within the research sample compared to normative results
reported by the Haygroup. The three competencies in the self-awareness cluster (emotional awareness, accurate self assessment, self-confidence) are mandatory and must all be
present (HayGroup, 2005a: 4). Clearly, self-confidence (M=3.768) which is a sense of one’s
self worth and capabilities, rates lower than the norm (M=4) in this study. This was significant
in that the people rating the TSOs perceive them to lack self confidence, whereas the TSOs
rating themselves see themselves as oozing with self-confidence. TSOs rated themselves
higher on all dimensions of the ECI than the ‘total other’ (which is the average of the FSAM,
FSE and staff) and higher on 16 of the 18 ECI norm scores. Reviewing Table G3 in
Appendix G and the discussion on the effects of the moderator variable on the ECI below,
highlights that there was also a statistically significant mean difference between the black
and white race groups on the self-confidence dimension, with the white race group scoring
higher than their black counterparts on this dimension. On further analysis, the white group
actually meets the norm requirements for this competency and it is only the black group that
are below this norm.
According to HayGroup (2005a) the positive impact of the self-confidence competence on
organisational performance has been shown in a variety of studies. Among supervisors,
managers and executives, a high degree of self confidence distinguishes the best from the
average performers (Boyatzis, 1982). Among 112 entry-level accountants, those with the
highest sense of self-efficacy, a form of self confidence, were rated by their supervisors ten
years later as having superior performance. The level of self-confidence was in fact a
stronger predictor of organisational performance than the level of skill or previous training
(Saks, 1995). This maybe relevant to the findings that black TSOs in the study had lower
performance appraisal scores than their white counterparts. However, further research is
needed to examine these results. There is a large body of research that shows persistent
race effects in job performance evaluations (Roth, Huffcutt & Bobko, 2003; Roberson &
Block, 2001; Greenhaus, Parasuramen & Wormly, 1990). Although racial group differences

181
in job performance ratings might reflect racial prejudice, they might also be accurate,
reflecting actual racial group differences in average performance. It must also be kept in
mind that racial group differences in performance may be due to differential organisational
experiences of blacks in South African organisations and the legacy of apartheid. Studies of
black managers in South Africa suggest they face a number of obstacles and challenges
(Luhabe, 2002).
5.2.1.2 Self-management cluster
Self-management refers to managing one’s internal states, preferences, resources, and
intuition (HayGroup, 2005a). Leaders seem to satisfy the requirements for the self-
management cluster when compared to the norm. TSOs on average are perceived to
manage their internal states, preferences, resources and intuition.
5.2.1.3 Social awareness cluster
The social awareness cluster is made up of 3 competencies (empathy, organisational awareness and service orientation). In this cluster, empathy is mandatory. The ‘total other’ mean score for empathy (M=3.6314) is less than the norm (M=4). The TSOs are
perceived to lack empathy. Empathy competence gives people an astute awareness of
others’ emotions, concerns and needs. The empathic individual can read emotional currents,
picking up on nonverbal cues such as tone of voice or facial expressions. Empathy requires
self awareness; our understanding of others’ feelings and concerns flows from awareness of
our own feeling. This sensitivity to others is critical for superior job performance whenever
the focus is on interactions with people (Goleman, 2001). For instance, physicians who are
better at recognising emotions in patients are more successful than their less sensitive
colleagues at treating them (Friedman & DiMatteo, 1982). Organisational awareness and
service orientation are alternate manifestations of each other, thus a person must have one
or the other. Organisational awareness tends to be used in higher level management or
executive positions where understanding and navigating the organisation is critical for
success. Service orientation tends to be important in positions relating directly to customers
external or internal (Jacobs, 2001). The study sample is taken from a service sector and

182
therefore making the service orientation competency more important. The ‘total other’ mean
score for service orientation (M=3.940) is only slightly less than the norm (M=4).
5.2.1.4 Relationship management cluster
Relationship management concerns the skill or adeptness at inducing desirable responses in
others (HayGroup, 2005a). Leaders seem to satisfy the requirements of this cluster when
compared to the norm. TSOs on average are perceived to have the necessary skills and
adeptness at inducing desirable responses in their staff.
5.2.2 Moderator variables applied to ECI using t-Test
There was a statistically significant mean difference between 3 of the six moderator variables
(Figure 4.3) namely
• Race of the TSO
• Years in the TSO position
• Age of the TSO
When racial differences (white and black) were tested using a t-Test, it was found that of the
18 ECI dimensions, there was a statistically significant mean difference between the black
and white managers scores with the white managers scoring higher on 14 of the ECI
dimensions. In other words, the white managers are perceived as scoring higher on 14 of the
ECI dimensions than their black counterparts. The literature on demographic differences in
EQ is scant. It is important for the reader to understand that the South African dispensation is
new and only 12 years old. In an attempt to address the equity gaps between black and
white race groups created by apartheid, affirmative action has been strategised and
accepted as necessary to address the inequities of the past dispensation which systematic
set out to deprive black people. However, in affirming the black people to the position of
TSO, it has been assumed that there are no mean differences between the two race groups
and this is clearly not the case.
When age of the TSO was applied using the t-Test, it was found that of the 18 ECI
dimensions, there was a statistical significant mean difference between the age of the TSO <

183
41 years and age of the TSO ≥ 41 years, with age group <41 years scoring higher on 2 of the
18 ECI dimensions namely optimism and Change catalyst. When looking at the age of the
TSOs, TSOs that are younger than 41 years of age are perceived to be more optimistic
(persistence in pursuing goals despite obstacles and setbacks) and change catalysts
(initiating or managing change). Also, TSOs with ≥6 years of experience are perceived as
taking initiative (readiness to act on opportunities). The researcher independently met with
the senior managers within the organisation, considered to be experts in the organisation
and verified that these findings are very likely to be true.
Similarly, when applying the number of years that a TSO has served in the TSO position (< 6
years or ≥6 years), there was a statistically significant mean difference between the two
groups with the group with ≥ 6 years work experience in the position of TSO scoring high on
the initiative dimension of the ECI. The number of employees reporting to the TSO’s;
qualification of the TSO and the number of years the TSO works for the organisation have no
group mean differences with the 18 dimensions of the ECI. On the dimension of
qualifications this result has been support by the research of HayGroup (2005b) that beyond
a certain threshold level (IQ) is less important than EQ.
5.2.3 What EQ dimensions distinguish effective leaders?
This section answers the secondary research question, ‘What emotional intelligence dimensions distinguish effective leaders?’ The combination of literature and the analysis
done in the ECI section above helps answer this question. There are six mandatory
competencies necessary for effective leadership (HayGroup, 2005a) namely emotional self-
awareness, accurate self-assessment, self-confidence, emotional self-control, empathy and
influence. Of the six mandatory competencies the TSOs scored significantly lower than the
norm on self-confidence and empathy.

184
5.3 Organisational culture
The OCP instrument is used to measure seven culture dimensions and is also used to
measure the strength of the organisation culture. The criteria for the measurement of culture
strength has been defined in chapter 3 and will be repeated here. Cmean represents the
mean scores of the seven dimensions of the OCP instrument.
0<1 is indicative of a very weak culture,
1< Cmean<2 is indicative of weak culture,
2<Cmean<3 is indicative of substantial culture,
3<Cmean<4 is indicative of strong culture,
4<Cmean<5 is indicative of very strong culture.
Rearranging the results of Table 4.10 in rank order shows the following:
• Performance orientation (M=3.585)
• Competitiveness (M=3.5074)
• Supportiveness (M=3.4825)
• Social responsibility (M=3.4507)
• Stability (M=3.3801)
• Emphasis on rewards (M=3.3288)
• Innovation (M=3.1887)
Applying the criteria for the measurement of culture strength shows that the TSC units have
a strong culture for all the dimensions of the OCP (3<Cmean<4). The organisational culture
means for each of the dimensions ranges from 3.1887 to 3.585.
This section answers the secondary research question, ‘What are the perceptions of the leaders and their staff regarding the strength of the organisational culture as measured by the organisational culture profile (OCP) in their organisation?’ To answer
the first question, the leaders are perceived to create on average a strong culture. This is
seen in the mean values of each OCP dimension being in the range of (3<Cmean<4). This
also confirms Schein’s (1985, 1992, 2004) assertion that leaders in the start-up early growth
phase of their organisational life cycle, create strong cultures. While the mean is reported, it

185
should be noted that there was variation in the cultures among the units. In other words, it
was not a case of corporate culture dictating culture at the lower levels.
5.3.1 Moderator variables applied to organisational culture using t-Test
There was a statistically significant mean difference between two of the six moderator
variables (Figure 4.5 below) namely:
• Race of the TSO
• Years in the TSO position
When racial differences (white and black) were tested using a t-Test, it was found that of the
seven OCP dimensions, there was a statistically significant mean difference between the
TSC led by black and white managers with the white led managers scoring higher on 5 of the
OCP dimensions listed in Figure 4.4. Applying the number of years that a leader (TSO) has
served in the leadership (TSO position, < 6 years or ≥6 years), there was a statistically
significant mean difference between the two groups with the group with ≥ 6 years work
experience in the leadership position scoring high on the competitiveness dimension of the
OCP. Similarly, applying the number of employees reporting to the TSO (<25 people, ≥25
people), there was a statistically significant mean difference between the two groups with the
group < 25 people scoring high on the dimensions of stability and social responsibility of the
OCP.
While it is perceived that TSC led by white managers are seen to be more performance
oriented, socially responsible, supportive, competitive and innovative than the TSC led by
their black counterparts. Also, TSC that are led by TSOs who have worked for more than 6
years in the position as TSOs are seen to be competitive. Similarly, TSCs with less than and
equal to 25 staff are perceived to be more socially responsible and stable.
Age of the TSO, qualifications of the TSO and the number of years the TSO has been
employed by the organisation have no group mean difference scores with the seven
dimensions of OCP.

186
5.4 Organisational performance
Table E11, in Appendix E, reflects the descriptive statistics for the organisational
performance variable. The TSO performance appraisal scores provided the best correlation
scores to the 18 dimensions of ECI and the 7 dimensions of the OCP. The TSC competition
scores were statistically significant but practically insignificant because the magnitude of the
scores was negligible and was therefore ignored. The organisation in which the study was
undertaken defined performance with the following criteria:
PA score <1 = Floor (indicates bad performance)
1<PA score <2 = Kick-in (indicates poor performance)
2<PA score <3 = Norm (indicates acceptable performance)
3< PA score < 4 = Stretch (indicates good performance)
4<PA score < 5 = Ceiling (excellent performance)
Applying the above criteria to the TSO performance appraisal mean score (M=3.6828),
indicates that the average performance of 117 TSOs is perceived to be good.
5.4.1 Moderator variables on organisational performance
There was a statistically significant mean difference between three of the six moderator
variables (Figure 4.7) namely
• Race of the TSO
• Years in the TSO position
• Age of the TSO
When racial differences (white and black) were tested using a t-Test on performance (TSO
PA score), there was a statistically significant mean difference between the black and white
managers. The white managers had higher performance scores than their black
counterparts.
When age of the TSO was tested, there was a statistically significant mean difference
between the age of the TSO < 41 years and age of the TSO≥ 41 years, with age group >41
years scoring higher on organisational performance.

187
Similarly, when applying the number of years that a TSO has served in the TSO position (< 6
years or ≥6 years), there was a statistically significant mean difference between the two
groups with the group with ≥ 6 years work experience in position scoring higher on the
organisational performance.
White TSOs receive higher performance ratings than black TSOs; TSOs who are older than
41 years of age and those TSOs that have worked longer than 6 years in the position of TSO
had higher performance scores. The researcher presents the results with serious
reservations about the performance data used in the study. Two sets of performance data
namely, the TSC competition scores, which measures 21 KPIs, and the TSO performance
appraisal scores, which uses the same set of 21 KPIs to assess the TSO’s performance.
Correlation studies between the two performances KPIs were meant to provide a strong
correlation between the two scores. The results showed that there was a correlation between
the two performance scores, however it was practically insignificant (magnitude of the
correlation values are small). This raises concerns that the 21 KPIs are not measuring the
actual performance of the organisation and that the performance appraisal scores were
inflated and do not measure performance as was intended by the balance score card
principles. The researcher met with the senior organisational representatives and questioned
the results. It was confirmed that management had been concerned with the TSC
competition data and accepted that TSO performance scores could be inflated. There
seemed to be a misalignment between the organisational goals, organisational KPIs and the
measurement of individual performance scores. This has been a recognized fact by
management within the organisation studied, and during the course of the study they initiated
and project that was going to correct this misalignment.
5.5 EQ and organisational performance
The relationship between EQ and organisational performance was analysed using stepwise
multiple regression (see section 4.7.2.6 for detailed analysis). An adjusted R2 of
approximately 17% was therefore obtained, in other words 17% of the variation in the TSO’s
performance appraisal scores could be explained by the independent variables selected by
the step-wise procedure. This was considered a weak relationship. The independent ECI
variables entered into the model were self-confidence (Tot_EQ3) and emotional self-

188
control (Tot_EQ4). The puzzling result is that the beta coefficient for emotional self-control
was negative. What these results mean is that leaders who are self-confident, who are
honest about their feelings and who make their feeling known are likely to improve the
performance of the TSC and therefore their own performance appraisal ratings. The
researcher met with senior managers considered to be most knowledgeable experts in the
area and discussed the results. These senior managers believed that the TSC environment
is largely a task environment that requires instructions to be given. They also believed that
self-confidence in this environment comes from the leader (TSO) having had sufficient
experience in the environment to be able to give instructions to subordinates, knowing
exactly what needs to be done and how it should be done and a leader who is able to ‘walk
his talk’ by demonstrating what needs to be done. They also believed that these
competencies were obtained with time and on the job training.
This section answers the secondary research questions, ‘What competencies of emotional intelligence contribute to organisational performance?’, and, ‘Is emotional intelligence of the leader a predictor or organisational performance?’ To answer the first question,
the two competences namely self confidence and the emotional self-confidence are seen to
contribute to organisational performance. The answer to the second question is that there is
a significant but weak relationship between EQ and organisational performance. It has been
argued above that this weak relationship may be due to the poor quality of the organisational
performance data used in the study. Future studies will need to identify robust measures of
organisational performance. The challenge of finding valid and reliable organisational
performance measures in organisation studies research has been noted by other scholars,
especially studies in leadership (Yukl, 2002).
5.6 Organisational culture and organisational performance
The relationship between organisational culture and organisational performance was
analysed using stepwise multiple regression (see section 4.7.2.7 for detailed analysis). An
adjusted R2 of approximately 16% was therefore obtained, in other words 16% of the
variation in the TSOs performance appraisal scores could be explained by the independent
variables selected by the step-wise procedure. This was considered a weak relationship. The

189
independent OCP variable entering the model was competitiveness (Tot_C6). The
competitiveness dimension of the OCP was made up of the following properties:
• Achievement orientation
• An emphasis on quality
• Being distinctive – being different from others
• Being competitive
In other words, a culture of achievement orientation, an emphasis on quality, being distinctive
and high on competitiveness would lead to improvement of TSC performance.
This section answers the secondary research question, ‘What is the relationship between organisational culture and organisational performance?’ There is a significant but weak
relationship between organisational culture and organisational performance and the
organisational culture dimension, competitiveness is seen to contribute to organisational
performance. Again, the researcher argues that this weak relationship could be the result of
the quality of the organisational performance data used in the analysis.
5.7 EQ and organisational culture
The results of the canonical analysis can be reviewed in section 4.7.1.1. Only the first two
canonical correlations were significant; therefore, no attempt was made to interpret the
meaning of the others variates. The first and second variate canonical correlations are
0.832010 and 0.766363 (Table 4.18). This indicates that approximately 69% and 59% of the
variation in the criterion factors was explained by the predictor factors – significant at the
0.01 level respectively. This represents the optimal relationship between linear combinations
of the two sets of variables.
The redundancy (Tables 4.21 and 4.22) measures between the two sets of variables gave a
less inflated picture of the overall relationships between the variables, themselves. The
redundancy of the criterion set, given the predictor set for the for the first and second
canonical variates were 0.4366 and 0.1396 respectively; the redundancy of the predictor set,
given the criterion set for the first and second canonical variates are 0.2310 and 0.1111
respectively. These redundancies show that a fair proportion of the variance in each set of
the individual variables was explained by the other set’s canonical variates.

190
The factor loadings suggested that the criterion factor was a function of (performance
orientation, social responsibility, supportiveness, competitiveness and innovation) for the first
canonical variate and a function of (emphasis on rewards and stability) for the second
canonical variate.
The predictor factor loadings suggested that organisational culture was strongly related to
(achievement orientation, self confidence, developing others, initiative, inspirational
leadership, service orientation, adaptability, influence, conflict management, transparency
emotional self awareness and change catalyst) for the first predictor canonical variate and a
function of (empathy, teamwork and collaboration, emotional self control, optimism, accurate
self assessment) for the second predictor canonical variate. An attempt was made to label
the two variate sets, however this proved to be difficult. The first variate set characterises the
emotional competencies of a leader like Richard Branson (entrepreneurial, transformational
and charismatic) and his organisation Virgin. The second variate set characterise the
emotional competencies of your typical parastatal type leader who is concerned with
maintaining stability and not upsetting the status quo.
This section answers the secondary research question, ‘What is the relationship between emotional intelligence and organisational culture?’ There is a significant but substantial
relationship between the ECI dimensions and the OCP dimensions.
5.8 EQ and organisational culture on organisational performance
The relationship between EQ and organisational culture on organisational performance was
analysed using stepwise multiple regression (see section 4.7.2.8 for detailed analysis). An
adjusted R2 of approximately 19% was therefore obtained, in other words 19% of the
variation in the TSO’s performance appraisal scores could be explained by the independent
variables selected by the step-wise procedure. The independent OCP variable entering the
model was competitiveness (Tot_C6) and the independent ECI variable entering the model
was the lack of emotional self-control (Tot_EQ4). The competitiveness dimension of the
OCP was made up of the following properties:
• Achievement orientation
• An emphasis on quality

191
• Being distinctive – being different from others
• Being competitive
In other words, in terms of Schein’s (1992, 2004) work, these results suggested that a leader
who embeds culture through emphasis on achievement, quality, being distinctive and
competitiveness created a culture of competitiveness.
Emotional self-control competence manifested largely as the absence of distress and
disruptive feelings. Signs of this competence include being unfazed in stressful situations or
dealing with a hostile person without lashing out in return. Among small business owners and
employees, those with a stronger sense of control over not only themselves but the events in
their lives were less likely to become angry or depressed when faced with job stresses or to
quit (Rahim & Psenicka, 1996).
This section answers the major research question; ‘What is the relationship among leader emotional intelligence, organisational culture and organisational performance?’ The
study has shown that there is a significant, but weak relationship among the three constructs.
5.9 Study contributions
The major contribution of this study is that it is the first empirical test of the relationships
among EQ, organisational culture and organisational performance. While these relationships
have been measured in a two-way relationship, there is no research that has attempted to
establish these linkages especially in the context with Schein’s (1983) seminal theory that
organisational culture strength is relevant in the start-up/early growth phase of an
organisation and this culture creation process is largely in the hands of the leader. While
some work on the linkage between EQ and organisational performance was undertaken by
Higgs and McGuire (2001), in an exploratory study, this study contributed to this body of
knowledge. Race effects on the ECI instrument have been looked at by the HayGroup
(2005a), however, it was done on college students and not in the work environment, where
the instrument was intended to be used. On a practical level, the implications of the findings
of this study suggest the development of a leader’s EQ is important in establishing a strong
organisational culture and therefore improved organisational performance which according to
Schein (1985, 1992, 2004) is essential in the early start-up growth phase of its organisational

192
life cycle. Currently, in South Africa, 95% of the registered companies are in the start-up
early growth phase of their organisational life cycles (Naude & Krugell, 2003). It is also
recognised from literature that the growth of any economy is largely dependent on the
survival and success of the start-up early growth companies. The extent to which a leader is
successful in building a strong culture will positively influence organisational performance
and the ability of the organisation to progress and grow.
5.10 Study limitations
The organisation used in the study made use of the balanced scored card (BSC) developed
by Kaplan and Norton (1992, 2004). The BSC system is made up of four perspectives and it
is optimally used use when the customer, internal, innovation and learning and financial
dimensions are relevantly cascaded through each layer of the organisation. The BSC creates
an impetus for the employees’ behaviour to align with the objectives at each layer and
generate the necessary resources, skills actions, learning and feedback to successfully
perform, ensuring that such a cumulative effort delivers organisational strategy. The
relationship between EQ and organisational performance and between culture and
organisational performance has been shown to be weak a relationship. The initial correlation
between the TSC performance scores and the TSO performance showed a significant but
very weak relationship. This was a clear indication that there was a misalignment between
strategy and the measurement of performance within this organisation used in this study.
The second critical limitation of the study is the sample size. In this study only the minimum
sample size was used to test the relationships. Future research needs to increase the
sample size in order to make the results more generalisable. However, in support of the
contribution of the present study the difference of finding an appropriate sample to meet the
required data collection needs must be recognised. A test of Schein’s (1992, 2004) theory
requires that early start-up organisations have access to a leader and others who can
complete a 360 degree instrument as well as performance data. The sample used in this
study met this requirement.
The third limitation of the study was the use of a single company. The reason for choosing a
single company was that when testing theory there was a need to limit the number of control

193
variables (Dermer & Hoch, 1999; Mitchell & Jolley, 2007). The choice of a single company
kept vision, strategy, structure, systems, processes, HR practices, and performance
constant. This allowed the researcher to test the empirical relationship between EQ,
organisational culture and organisational performance. Hence, the research design strived
for internal validity which did limit external validity. Future studies need to look more broadly
across multiple industries before the results can be made more generalisable and the
requirements of external validity can be met.
5.11 Recommendations for further research
It shall be understood that the following further research topics arise from the empirical
findings of this research undertaken. The topics are:
o Selection criteria for leaders.
Ideally any future study in this area should be strict in the choice of leader to be studied.
The leaders chosen should be the founder/entrepreneur.
o Replication of this study in multiple industries.
This study needs to be done in multiple industries and also with a cross sectional sample
from multiple industries before the results can be generalised.
o Review of organisational performance measurement.
In this study the performance data used in the analysis was sourced independently from
the organisations human resources department. During the analysis it was realised that
the quality of the performance data was questionable. It is therefore recommended that
the performance data be collect as part of the study.
o Racial differences in EQ.
Racial studies in different countries and in different socio-economic backgrounds need to
be undertaken.
o EQ and national culture.
Further studies on the effects of national culture on EQ need to be undertaken.

194
The researcher has highlighted topics for further research.
5.12 Conclusions
The study met the research objectives and addressed the problem statement. In chapter
one, the investigations as well as the actuality of the study were discussed. The aim and
method of the study came under investigation. The study argued the need for the empirical
relationship of all three variables EQ, organisational culture and organisational performance
to be investigated. This chapter highlights the components necessary to rejuvenate the
performance of organisations in the early growth /start-up phases of the organisational life
cycle. In South Africa, 95% of the companies are in the in the early start-up/growth phase of
their organisational life cycle (Naude and Krugell, 2003). Therefore, the results of this study
could be used to improve the performance and the ultimate survival of these organisations.
This study suggests there is a relationship between EQ, organisational culture and
organisational performance. Leaders must have a high EQ in order to improve performance
in the workplace. Leaders play a critical role in creation of a strong organisational culture
which results improved organisational performance. However, this is a complex relationship
that needs further validation.

195
6 BIBLIOGRAPHY
Abraham, R. 2000. ‘The role of job control as a moderator or emotional dissonance and
emotional intelligence-outcome relationships’, The Journal of Psychology, 134: 169-
84.
Ahn, H. 2001. ‘Applying the balanced scorecard concept: An experience report,’ Long range
planning, 34(4): 441-458.
Alimo-Metcalfe, B. & Alban-Metcalfe, R. 2001. ‘The development of a new transformational
leadership questionnaire’, Journal of Occupational Psychology, 74(1): 1-24.
Altman, Y. & Baruch, Y. 1998. ‘Cultural theory and organisations: Analytical methods and
cases’, Organisation Studies, 19: 769-785.
Alvesson, M. 1993a. Culture perspectives on organisations. New York: Cambridge University
Press.
Alvesson, M. 1993b. ‘Organisations are rhetoric: Knowledge-intensive firms and struggle with
ambiguity’, Journal of Management Studies, 30: 997-1015.
Antonakis, J. 2003. ‘Why “emotional intelligence” does not predict leadership effectiveness: A
comment on Prati, Douglas, Ferris, Ammeter and Buckley’, The international journal
of organisational analysis, 11(4): 355-361.
Argyris, C. 1976. Increasing Leadership Effectiveness. In: Schein, E.H. (ed). Organisational
culture and Leadership. San Francisco: Jossey-Bass.
Armstrong, M & Baron, A. 1998. Performance management. The new realities. London:
Institute of Personnel and Development.
Armstrong, M. 2000. Performance Management: Key strategies and practical guidelines.
London: Kogan Page.
196
Atkinson, A. and Epstein, M. 2000. ‘Measure for measure’, CMA management, 74
(September): 22-28.
Avolio, B.J., Gardner, W.L., Waubay, F.O., Luthans, F. & May, D.R. 2004. ‘Unlocking the
mask: A look at the process by which authentic leaders’ impact follower attributes
and behaviours’, The Leadership Quarterly, 15: 801-823.
Barley, S. 1983. ‘Semiotics and the study of occupational and organisational cultures’,
Administrative Science Quarterly, 28: 393-414.
Barley, S. 1986. ‘Technology as an occasion for structuring: Evidence from observations of
CT scanners and the social order of radiology departments’, Administrative Science
Quarterly, 31: 78-108.
Barling, J., Slater, F. & Kelloway, E. K. 2000. ‘Transformational leadership and emotional
intelligence: an exploratory study’, Leadership and Organisational Development
Journal, 21(3): 157-61.
Barney, J.B. 1991. ‘Firm resources and sustained competitive advantage’, Journal of
Management, 17(March): 99-120.
Bar-On, R. 1988. The development of a concept of psychological well being. Unpublished
Doctoral dissertation, South Africa, Rhodes University.
Bar-On, R. 1997. Bar-On Emotional Quotient Inventory: User’s manual. New York: Multi-
Health Systems.
Bar-On, R. 2000. ‘Emotional and social intelligence’. In: Bar-On, R. & Parker, J. D. A. (eds).
The Handbook of emotional intelligence. San Francisco: Jossey-Bass.
Bar-On, R., Maree, K. & Elias, M. 2006. Educating people to be emotionally intelligent.
Sandton, South Africa: Heinemann.

197
Bartunek, J. & Moch, M. 1991. ‘Multiple constituencies and the quality of working life
intervention at FoodCom’. In: Martins, J. (eds). Organisational Culture: Mapping the
Terrain. London: Sage Publications.
Bass, B. M. 1985. Leadership and performance beyond expectation. New York: Free Press.
Bass, B. M. 1990. Handbook of leadership: A survey of theory and research. New York:
Free Press.
Bass, B. M. & Avolio, B. J. 1993. ‘Transformational leadership and organisational culture’,
Public Administration Quarterly, 17(1): 112-117.
Bass, B. M. 1997. ‘Does the transactional-transformational leadership paradigm transcend
organisational and national boundaries?’ American Psychologist, 52: 130-139.
Bass, B. M. 1999. ‘Two decades of research and development in transformational
leadership’, European Journal of Work and Organisational Psychology, 8(1).
Bell, E. 1990. ‘The bio cultural life experience of career-oriented Black woman’, Journal of
Organisational Behaviour, 11: 459-478.
Belsey, D. A., Kuh, E. & Welsch, R. E. 1980. In: Tabachnick, B.G. and Fidell, L.S. (eds).
Using multivariate statics. Boston: Pearson Allyn and Bacon.
Bennis, W. 1989. ‘On becoming a leader’. In: Schein, E.H. (ed). Organisational culture and
Leadership (3rd edition), San Francisco: Jossey-Bass.
Bernadin, H. K., Kane, J. S., Ross, S., Spina, J. D. & Johnson, D. L. 1995. ‘Performance
appraisal design, development and implementation’. In: Ferris, G. R. , Rosen, S. D.
& Barnum, D. J. (eds). Handbook of human resources management. Cambridge:
Mass Blackwell.
Bharwaney, G. 2003. Emotional intelligence. In: Bar-On, R., Maree, K. & Elias, M. (eds).
Educating people to be emotionally intelligent. Sandton, South Africa: Heinemann.

198
Bititci, U. S., Mendibil, K., Nudurupati, S., Turner, T. & Garengo, P. 2004. ‘The interplay
between performance measurement, organisational culture and management styles’,
Measuring Business Excellence, 8(2): 28-41.
Boyatzis, R. E. 1982. The competent manager: A model of effective performance. New York:
Wiley.
Boyatzis, R. E., Goleman, D. & Rhee, K. 1999. ‘Clustering competence in emotional
intelligence: Insights from the emotional competence inventory (ECI)’. In: Bar-On, R.
& Parker, J.D.A. (eds). Handbook of Emotional intelligence. San Francisco: Jossey-
Bass.
Bresnik, P. A. 2004. ‘Promoting leadership and profitable growth: Would the measurement
and development of emotional intelligence represent value to public accountancy
Firm X’. In: HayGroup: 2005. Emotional Competence Inventory (ECI) technical
manual. Johannesburg: HayGroup.
Brett, P. O. 2000. The management systems approach: Content characteristics of an
emerging model for managing organisations towards performance excellence.
Unpublished DBA. Greenlands, Henley on Thames: Henley Management College.
Brown, J. & Duguid, P. 1991. ‘Organisational learning and communities-of-practice: Toward
a unified view of working, learning, and innovation’, Organisational Science, 2: 40-57.
Brumback, G. B. 1988. ‘Some ideas, issues and predictions about performance
management’, Public Personnel Management, Winter: 387-402.
Brunsson, N. 1985. The irrational organisation. New York: John Wiley.
Brunsson, N. 1989. The organisation of hypocrisy: Talk, decisions and actions in
organisations. New York: John Wiley.
Brunsson, N. 1995. ‘Ideas and actions: Justification and hypocrisy as alternatives to control’,
Research in the Sociology of Organisations, 13: 211-235.

199
Bryman, A. 1992. Charisma and leadership in organisations. Santa Monica, CA: Sage.
Bryman, A., Gillingwater, D. & McGuinness, I. 1996. ‘Industry culture and strategic
response: The case of the British bus industry’, Studies in Culture, Organisations and
Societies, 2: 191-208.
Bryman, A. 2004. Social research methods. Oxford: Oxford University Press.
Burns, J.M. 1978. Leadership. New York: Harper & Row.
Burns, R. B. 2000. Introduction to research methods. London: Sage Publications.
Burt, R. S., Gabbay, S. M., Holts, G. & Moran, P. 1994. ‘Contingent organisation as a
network theory: The culture performance contingency function’, ACTA Sociologica,
37: 345-370.
Campbell, J. P. 1990. ‘Modelling the performance prediction problem in industrial and
organisational psychology’. In: Dunnette, M.P. & Hughs, L.M. (eds). Handbook of
industrial and organisational psychology. Cambridge: Mass Blackwell.
Campbell, D.T. & Stanley, J.C. 1966. Experimental and quasi designs for research. Skokie,
IL: Rand McNally.
Capioppe, R. 1997. ‘Leadership Moment by Moment’, Leadership and organisational
Development Journal, 18(7): 335-346.
Caruana, A., Pitt, F. P. & Morris, M. H. 1995. ‘Are there excellent service firms, and do they
perform well?’, The Service Industrial Journal, 15(3): 243.
Cavallo, K. & Brienza, D. 2002. ‘Emotional competence and leadership excellence at
Johnson & Johnson: The emotional intelligence and leadership study’. In: HayGroup.
2005. Emotional Competence Inventory (ECI) technical manual. Johannesburg:
HayGroup.

200
Chaudry, S. 2000. Management 21C. London : Pearson Education.
Cherniss, C. & Goleman, D. 2001. The emotionally intelligent workplace. San Francisco:
Jossey-Bass.
Choe, M. K. 1993. ‘An empirical study of corporate strategy and culture in Korea’, Quarterly
Review of Economics and Business, 21(2): 73-92.
Christenson, S. & Kreiner, K. 1984. ‘On the origin of organisational culture’. In:
Organisational symbolism and corporate culture: Proceeding of the International
conference on Symbolism and Corporate Culture, Sweden. 1984.
Cohen, L., Manion, L. & Morrison, K. 2000. Research methods in education. London:
Routledge Falmer.
Collins, J. 2001. Good to Great: New York: HarperBusiness.
Conger, J. A. & Kanungo, R. N. 1988. The charismatic leadership: the elusive factor in
organisational effectiveness. San Francisco, CA: Jossey-Bass.
Conner, D. 1999. Leading at the Edge of Chaos. New York: John Wiley.
Cooley, W. W. & Lohnes, P. R. 1971. Multivariate Procedures for behavioural sciences,
New York: Wiley.
Cooper, D.R. and Schindler, P.S. 2001. Business Research Methods. San Francisco:
McGraw-Hill.
Cremer, J. 1993. ‘Corporate culture and shared knowledge’, Industrial and Corporate
Change, 2: 351-386.
Daft, R. & Weick, K. 1984. ‘Toward a model of organisations as interpretation systems’,
Academy of Management Review, 9: 284-295.

201
Darcy, T. & Kleiner, B. H. 1991. ‘Leadership for change in turbulent environment’,
Leadership and Organisation Development Journal, 12(5): 12-16.
Davis, S.M. 1984. Managing Corporate Culture. In: Schein, E.H. (ed). Organisational culture
and Leadership. San Francisco: Jossey-Bass.
Daymon, C. 2000. ‘Culture formation in a new television station: A multi-perspective
analysis’, British Journal of management, 11(2): 121-135.
De Vos, A. S. 1998. Research at grass roots: A primer for the caring profession. Pretoria:
J.L. van Schaik.
Deal, T. & Kennedy, A. 1982. Corporate cultures. Reading, MA: Addison-Wesley.
Dellheim, C. 1987. ‘The creation of a company culture: Cadburys 1861-1931’, American
Historical Reviews, 92: 13-44.
Denison, D. 1990. Corporate Culture and Organisational Effectiveness. New York: John
Wiley.
Denison, D. R. 1996. ‘What is the difference between organisational culture and
organisational climate? A Natives point of view on a decade of Paradigm wars’,
Academy of Management Journal, 21(3): 619-654.
Denton, G. A. and White, B. 2000. ‘Implementing a balanced scorecard approach to
managing hotel operations,’ Cornell hotel and restaurant administration Quarterly,
41(1): 94.
Dermer, M. L. & Hoch, T. A. 1999. ’Improving descriptions of single-subject experiments in
research written for undergraduate’, The Psychological Record, 49: 49-66.
Deshpande, R. & Farley, J. 1999. ‘Executive insights: corporate culture and market
orientation: comparing Indian and Japanese firms’, Journal of International Marketing,
7(4): 111-127.
202
Diggins, C. 2004. ‘Emotional intelligence: the key to effective performance’, Human
Resources Management International Digest, 12(1): 33-35.
Donaldson, G. & Lorsch, J. W. 1983. ‘Decisions making at the Top’. In: Schein, E.H. (ed).
Organisational culture and Leadership. San Francisco: Jossey-Bass.
Drucker, P. F. 1989. The new realities: In government and politics, in economics and
business, in society and world view. New York: HarperBusiness.
Dulewicz, V. and Higgs, M. J. 1999. ‘Can emotional intelligence be measured and
developed?’, Working Paper Series. Henley Management College: Greenlands,
Henley on Thames.
Dulewicz, V. & Higgs, H. J. 2003. ‘Leadership at the top: The need for emotional
intelligence’, The International Journal of Organisational Analysis, 11(3): 193-210.
Dyer, W. G. 1986. Culture Change in Family Firms. In: Schein, E.H. (ed). Organisational
culture and Leadership. San Francisco: Jossey-Bass.
Ebers, M. 1995. The framing of organisational cultures. In: Martins, J. (ed). Organisational
Culture: Mapping the Terrain. London: Sage Publications.
Egan, J. 2002. Is Britain being led astray? In: Simms, J. (ed). The Director, January.
Eiselen, R. J. 2006. Predicting achievement in mathematics at tertiary level. Doctoral Thesis,
Johannesburg: University of Johannesburg.
Enz, C. 1988. ‘The role of value congruity in organisational power’, Administrative Science
Quarterly, 33: 284-304.
Feldman, M. 1989. Order without design: Information processing and policy making. Palo
Alto, CA: Stanford University Press.
Feldman, M. 1991. The meaning of ambiguity: Learning from stories and metaphors. In:

203
Martins, J. Organisational Culture: Mapping the Terrain. London: Sage Publications.
Field, T. 2000. ‘Full measure,’ CIO, 13(14): 140-145.
Fiedler, F.E. 1967. Theory of leadership effectiveness. New York: McGraw-Hill.
Fiedler, F.E. 1996. ‘Research on leadership selection and training: One view of the future’,
Administrative Science Quarterly, 41: 241-50.
Fineman, S. 1997. ‘Emotion and Management Learning’, Management Learning, 28(1):13-
25.
Finkelstein, S. & Hambrick, D. 1996. Strategic Leadership-Top Executives and their
influence on organisations. St. Paul-Min: West Publishing Company.
Freed-Taylor, S. 1994. ‘Ethical considerations in European cross-national research’,
International Social Science Journal, 142: 523-532.
Friedman, H. & DiMatteo, R. 1982. In: Cherniss, C. & Goleman, D. (eds). The emotionally
intelligent work place. San Francisco, Jossey-Bass.
Frigo, M. L. & Krumweide, K. R. 2000. ‘The balanced scorecard,’ Strategic Finance,
81(January): 54.
Gardner, L. & Stough, C. 2002. ‘Examining the relationship between leadership and
emotional intelligence in senior level managers’, Leadership and Organisational
Development Journal, 23(2): 68-78.
Gardner, H. 1993. Multiple Intelligence: The Theory in Practice. New York: Basic Books.
Gardner, H. and Hatch, T. 1989, ‘Multiple intelligences go to school’, Educational
Researcher, 18(8): 8-14.

204
George, J. M. 2000. ‘Emotions and leadership: the role of emotional intelligence’, Human
Relations, 53: 1027-41.
Gherardi, S. 1995. ‘When will he say “Today the plates are soft?”: The management of
ambiguity and situated decision making’. Studies in Culture, Organisations and
Societies, 1: 9-27.
Gill, R. W. 2002. ‘Is Britain being led astray?’ In: Simm, J. (ed). The Director, January.
Goffee, R. & Jones, G. 1999. Organisational culture and international HRM. In: Higgs, M.J.
and Mcguire, M. (eds). ‘Emotional intelligence and culture: An exploration of the
relationship between individual emotional intelligence and organisational culture’,
Working Paper Series. Greenlands, Henley on Thames: Henley Management
College.
Goffee. R, & Jones. G. 2000. ‘Why should anybody be led by you?’, Harvard Business
Review, Sep-Oct : 63-70.
Golden, K. 1992. ‘The individual and organisational culture: Strategies for action in highly-
ordered contexts’, Journal of Management Studies, 29: 1-21.
Goleman, D. 1989. Working with emotional intelligence. New York: Bantam Books.
Goleman, D. 1995. Emotional intelligence: Why it can matter more than IQ. London:
Bloomsbury Publishing.
Goleman, D. 1997. ‘Beyond IQ: developing the leadership competence of emotional
intelligence’, paper presented at the 2nd international competency conference,
London, October.
Goleman, D. 1998a. Working with emotional intelligence. New York: Bantam Books.
Goleman, D. 1998b. ‘What makes a leader?’, Harvard Business Review, Nov-Dec: 93-102.
205
Goleman, D. 2000. ‘Leadership that gets results’, Harvard Business Review, March-April: 78-
91.
Goleman, D. 2001. ‘An EI-based theory of performance’, In: Cherniss, C & Goleman, D.
(eds). The emotionally intelligent work place. San Francisco: Jossey-Bass.
Goleman, D., Boyatzis, R. & McKee, A. 2002. Primal Leadership: Realising the Power of
Emotional Intelligence. Boston, MA: Harvard Business School Press.
Goodwin, C. J. 2000. Research in psychology: methods and design. New York: John Wiley.
Gordon, G.G. & DiTomaso, N. 1992. ‘Predicting corporate performance from
organisational culture’, Journal of Management Studies, 29: 783-799.
Gordon, A. & Yukl, G. 2004. ‘The future of leadership research: Challenges and
opportunities’, German Journal of Human Resources Research, 18(3): 359-65.
Green, M., Garrity, J. , Gumbus, J. and Lyons, B. 2002. ‘Pitney Bowes calls for new metrics:
The company used a balanced scorecard to manage performance and increase the
bottom line,’ Strategic finance, 83 (11): 30-36.
Greenhaus, J., Parasuramen, S. & Wormley, W. 1990. ‘Effects of race on organisational
experiences, job performance evaluations, and career outcome’, Academy of
Management Journal, 33: 64-86.
Gregory, K. 1983. ‘Native-view paradigms: Multiple cultures and culture conflicts in
organisations’, Administrative Science Quarterly, 28: 359-376.
Gumbus, A. and Lyons, B. 2002. ‘The balanced scorecard at Phillips Electronics,’ Strategic
Finance, 84(5): 45-49.
Gumbus, A., Bellhouse, D. and Lyons, B. 2003. ‘A three year journey to organisational and
financial health using the balanced scorecard: A case study at Yale New Haven
health systems hospital,’ Journal of business and economic studies, 9(2): 54-65.

206
Hair, J. F., Anderson, R. E., Taham, R. L. & Black, W. C. 1998. Multivariate Data Analysis.
London: Prentice Hall.
Hanks, S. H., Watson, C. J., Jansen, E. & Chandler, G. N. 1993. ‘Tightening the life cycle
construct: A taxonomic study of growth stage configurations in high-technology
organisations’, Baylor University, Winter: 5-29.
Hartle, F. 1995. Transforming the performance management process. London: Kogan Page.
Harris, A & Lambert, L. 2003. Building leadership capacity for school improvement.
Philadelphia: Open University Press.
Hatch, M. 1999. ‘Exploring the empty spaces of organising: How improvisational jazz helps
re-describe organisational structure’, Organisational Studies, 20: 75-100.
Hatcher, L. & Stepanski, E. J. 2001. A Step by step approach to using the SAS system for
univariate and multivariate statistics. Cary,NC: SAS Publishing.
Hawkins, J. 2005. The relationship between leadership style, emotional intelligence and
performance. DBA working paper. Greenlands, Henley on Thames: Henley
Management College.
Hawley, R. 1996. ‘Leadership challenges in an engineering environment’, Engineering
Management Journal, October: 217-31.
Hay/McBer. 1996. Generic Competency Dictionary. Boston: Hay/McBer.
HayGroup, 2004. ECI accreditation training: Driving personal and professional development.
Slide Presentation. London: HayGroup.
HayGroup. 2005a. Emotional Competence Inventory (ECI): Technical Manual. HayGroup,
McClelland Centre of Research and Innovation. November.

207
HayGroup. 2005b. ECI accreditation training: Driving personal and professional
development. Slide Presentation. Johannesburg: HayGroup.
Hennessey, J. T. 1998. ‘ “Reinventing” Government: Does leadership make the difference?’,
Public Administration Review, 58(6): 522-32.
Hermalin, B. E. 2001. ‘Economics and corporate culture’, In: Cartwright, S. Cooper, C. L.
& Early, P.C. (eds). Handbook of organisational culture and climate. New York:
Wiley.
Hersey, P. & Blanchard, K. H. 1969. ‘Life cycle theory of leadership’, Training and
Development Journal, 23(5): 26-34.
Higgs, M.J. & Rowland, D. 2000. ‘Building change leadership capability: The quest for
change competence’, Journal of Change Management, 1(2): 116-131.
Higgs, M.J. & Rowland, D. 2001a. ‘Developing Change leadership Capability. The Impact of
a development intervention’, Henley working paper series. Greenlands, Henley on
Thames: Henley Management College.
Higgs, M.J. & Rowland, D. 2001b. ‘Does it take emotional intelligence to lead change?’
Journal of General Management. 27(3): 62-76.
Higgs, M.J. & McGuire, M. 2001, ‘Emotional intelligence and culture: An exploration of the
relationship between individual emotional intelligence and organisational culture’,
Working Paper Series. Greenlands, Henley on Thames: Henley Management
College.
Higgs, M. J. 2002. ‘Leadership: the long line: a View on how we can make sense of
leadership in the 21st century’, Henley Working Paper Series, Greenlands, Henley on
Thames: Henley Management College.
Higgs, M. J. & Dulewicz, V. 1999. Making sense of emotional intelligence. Windsor: NFER-
Nelson.
208
Higgs, M.J. 2004. ‘A study of the relationship between emotional intelligence and
performance in UK Call Centres’, Henley Management College, February: 442-454.
Hopfl, H., Smith, S. & Spencer, S. 1992. ‘Values and valuations: Corporate culture and job
cuts’, Personnel Review, 21(1): 24-38.
House, R. J. 1976. A Theory of Charismatic Leadership. In: Hunt, J. G. and Larsons, L. L.
(eds). Leadership: The cutting edge. Carbondale, IL: Southern Illinois University
Press. 189-207.
Howard, L. W. 1998. ‘Validating the competing values model as a representation of
organisational cultures’, International journal of organisational analysis, 6 (3): 231-
250.
Jacobs, R. 2001. The emotionally intelligent workplace: How to select for, measure, and
improve emotional intelligent in individuals, groups, and organisations. In: Cherniss,
C. & Goleman, D. (eds). Using human resource functions to enhance emotional
intelligence. San Francisco, Jossey-Bass, 159-181.
Jaeger, R. M. 1995. Statistics: A spectator sport. New York: Sage.
Jermier, J., Slocum, J., Fry, L. & Gaines, J. 1991. ‘Organisational subcultures in soft
bureaucracy: Resistance behind the myth and façade of an official culture’,
Organisational Science, 2: 170-194.
Johnson, P. R. & Indvik, J. 1999. ‘Organisational benefits of having emotionally intelligent
managers and employees’, Journal of Workplace Learning, 11(3): 84-88.
Jones, G. 1983. ‘Transaction costs, property rights, and organisational culture. An exchange
perspective’, Administrative Science Quarterly, 28: 454-467.
Judge, T. A. & Cable, D. M. 1997. ‘Applicant personality, organisational culture, and
organisational attraction’, Personnel Psychology, 50: 359-393.

209
Kane, J. S. 1996. ‘The conceptualisation and representation of total performance
effectiveness’, Human Resource Management Review, Summer: 123-145.
Kaplan, R. S. & Cooper, R. 1998. Cost and effect: Using integrated cost systems to drive
profitability and performance. Boston, MA: Harvard business school press.
Kaplan, R. S. & Norton, D. P. 1992. ‘The Balanced scorecard-Measures that drive
performance’, Harvard Business Review, Summer: 123-145.
Kaplan, R. S. & Norton, D. P. 1993. ‘Putting the balanced scorecard to work,’ Harvard
business reviews, 71(5): 134-148.
Kaplan, R. S. & Norton, D. P. 2001. ‘On balance’, CFO, February: 73-78.
Kaplan, R. S. & Norton, D. P. 1996a. The balanced scorecard: Translating strategy into
action. Boston: Harvard business school press.
Kaplan, R. S. & Norton, D. P. 1996b. ‘The balanced scorecard is more than a new
measurement system,’ Harvard business review, 74(3): 4-7.
Kaplan, R. S. & Norton, D. P. 1996c. ‘Using the balanced scorecard as a strategic
management system,’ Harvard business review, 74(1): 75-86.
Kaplan, R. S. & Norton, D. P. 2004. Strategy Maps: Converting intangible assets into
tangible outcomes. Boston: Harvard Business School Publishing.
Kerlinger, F. N. & Lee, H.B. 2000. Foundations of behavioural research. Orlando: Harcourt
College Publishers.
Kets de Vries, M. F. R. & Miller, D. 1984. The Neurotic Organisation: Diagnosing and
Changing Counterproductive Styles of Management. San Francisco, CA: Jossey-
Bass.
Kets de Vries, M. F. R. 1993. Leaders, Fools, Impostor. San Francisco, CA: Jossey-Bass.

210
Knights, D. & Wilmott, H. 1987. ‘Organisational culture as management strategy’,
International Studies of Management and Organisation, 17: 40-63.
Koot, W. Sabelis, I. & Ybema, S. 1996. Contradictions in context. Amsterdam: University
Press.
Kotter, J. P. 1994. ‘Leading change: Why transformation efforts fail’, Harvard Business
Review, May-June: 11-16.
Kotter, J.P. & Heskett, J.L. 1992. Corporate culture and performance. New York: The Free
Press.
Krefting, L. A. & Frost, P. J. 1985. ‘Untangling webs, surfing waves, and wildcatting: A
multiple-metaphor perspectives on managing culture’. In: Frost et al. (eds).
Organisation Culture. Beverly Hills, CA: Sage.
Kreps, D. M. 1990. ‘Corporate culture and economic theory’, In: Alt, J. E. & Shepsle K.
A. (eds). Perspectives on Positive Political Economy. Cambridge: Cambridge
University Press.
Kristof, A.L. 1996. ‘Person-organisation fit: An integrative review of its conceptualisations,
measurements and implications’, Personnel Psychology, 49(1): 1-36.
Legge, K. 1994. ‘Managing culture: Fact or Fiction’. In: Sisson, K. (ed). Personnel
Management: A Comprehensive guide to theory and practice in Britain. Oxford:
Blackwell, pp. 397-433.
Lester, D. L., Parnell, J. A. & Carraher, S. 2003. ‘Organisational life cycle: a five stage
empirical scale’, The International Journal of Organisational Analysis, 11(4): 339-354.
Lewis, D. S. 1994. ‘Organisational change: Relationship between reactions behaviour and
organisational performance’, Journal of Organisational Change Management, 75(5):
41-55.

211
Lim, B. 1995. ‘Examining the links between organisational culture and organisational
performance’, Leadership and Organisational Development Journal, 16(5):16-21.
Luhabe, W. 2002. Defining moments: Experiences of South Africa’s workplace.
Pietermaritzburg: University of Natal Press.
Manuel, J., Serlavos, R. & Boyatzis, R. E. 2005. Technical Note: ECI Confirmatory Factor
Analysis. In: HayGroup. 2005. Emotional Competence Inventory (ECI) technical
manual. Johannesburg: HayGroup.
Martins, J. & Powers, M. 1983. ‘Truth or corporate propaganda: The value of a good war
story’. In: Martins, J. (ed). Organisational Culture: Mapping the Terrain. London:
Sage Publications.
Martin, J., Sitkin, S.B. & Boehm, M. 1985. ‘Founders and the elusiveness of a cultural
legacy’. In: Martins, J. (ed). Organisational Culture: Mapping the Terrain. London:
Sage Publications..
Martin, J. 1992. Cultures in organisations: Three perspectives. New York: Oxford University
Press.
Martin, J. 2002. Organisational Culture: Mapping the Terrain. London: Sage Publications.
Martinez, M.N. 1997. ‘The smarts that count’, HR Magazine, 42(11): 72-78.
Mathews, G., Zeidner, M. & Roberts, R. D. 2002. Emotional intelligence: Science and myth.
Cambridge. MA: MIT Press
Mayer, J. D. & Salovey, P. 1993. ‘The intelligence of emotional intelligence’, Intelligence,
17: 433-442.
Mayer, J. D. and Salovey, P. 1997. ‘What is emotional intelligence?’. In: Salovey, P. &
Sluyter, D. J. (eds). Emotional Development and emotional intelligence, New York:
Basic Books.

212
Mayer, J.D., Caruso, D. R. & Salovey, P. 1999. The multifactor emotional intelligence scale
(MEIS). Simsbury, CT: www.EmotionalIQ.com
McGarvey, R. 1997. ‘Final Score: get more from employees by upping your EQ’,
Entrepreneur, 25(7): 78-81.
McConville, D. J. 1994. ‘All about EVA’, Industry Week, April: 55-58.
McDonald, P. 1991. ‘The Los Angeles Olympic Organising committee: Developing
organisational culture in the short run’. In: Martins, J. (ed). Organisational Culture:
Mapping the Terrain. London: Sage Publications.
Mandell, B. & Pherwani, S. 2003. ‘Relationship between emotional intelligence and
transformational leadership style: A gender comparison’, Journal of Business and
Psychology, 17(3): 387-404.
Melville-Ross, T. 1999. Institute of Directors’ News. London: Institute of Directors.
Meyer, J. & Rowan, B. 1977. ‘Institutionalised organisations: Formal structures as a myth
and ceremony’, American Journal of Sociology, 83: 340-363.
Meyerson, D. 1994. ‘Interpretations of stress in institutions: The cultural production of
ambiguity and burnout’, Administrative Science Quarterly, 39: 628-653.
Miller, M. 1999. ‘Emotional intelligence helps managers succeed’, Credit Union Magazine,
65: 25-6.
Mitchell, M. L. & Jolley, J.M. 2007. Research design explained, USA:Thomson Wadsworth.
Mouton, J. 1996. Understanding social research. Pretoria: J. L. van Schaik Publishers.
Mouton, J. 2003. How to succeed in your masters and doctoral studies. A South African
Guide and resources book. Pretoria: J. L. van Schaik Publishers.
Mouton, J. and Marais, H. C. 1996. Basic concepts in the methodology of social science.

213
Pretoria: HSRC Publishers.
Mumby, D. 1987. ‘The political function of narrative in organisations’, Communication
Monographs, 54: 113-127.
Mumby, D. 1988. Communication and power in organisations: Discourse, ideology and
domination. Norwood, NJ: Ablex.
Murphy, K. R. 2006. A critique of emotional intelligence: what are the problems and how they
can be fixed?Mahwa, NJ: Lawrence Elbaum Associates.
Naude, W. A and Krugell, W. F. 2003. ‘The small business monitor’, Nstika Enterprise
Promotions agency, 1:64-69
Neely, A. 1995. ‘Performance measurement system design: A literature review and research
agenda’, International journal of operations and production management, 15(4): 80-
116.
Neuman, W. L. 2000. Social research methods: Qualitative and quantitative approached.
Boston: Allyn & Bacon.
Nicholls, J. 1988. ‘The transforming autocrat’, Management Today, March: 114-18.
O’Reilly, C. A.1989. ‘Corporate, culture and commitment. Motivation and social control in
organisations’, California Management Review, 31(4): 9 -25.
O’Reilly, C. A., Chatman, J. & Caldwell, D. F. 1991. ‘People and organisational culture: A
profile comparison approach to assessing person-organisation fit’, Academy of
Management Journal, 34(3): 487-516.
O’Reilly, C.A. & Chatman, J. A. 1996. ‘Culture as social control: Corporations, culture and
commitment’. In: Straw B. M. & Cummings, L. L. (eds). Research in
Organisational Behaviour, 18:157-200.

214
Ogbonna, E. 1993. ‘Managing organisational culture: Fantasy or reality?’, Human Resources
Management Journal, 3(2):42-54.
Ogbonna, E. & Harris, L. C. 1998. ‘Organisational culture: It’s not what you think…’, Journal
of General Management, 23(3): 35-48.
Ogbonna, E & Harris, L. 2000. ‘Leadership style, Organisational culture and performance:
Empirical evidence from UK companies’, Human Resources Management, 11(4):
766-788.
Ogbonna, E. & Harris, L. C 2002. ‘The performance implications of management fads and
fashions: an empirical study’, Journal of Strategic Marketing, 10: 47-68.
Ogaard, T., Larsen, S. & Marnburg, E. 2005. ‘Organisational culture and performance
evidence from the fast food restaurant industry’, Fast food technology, 5(1): 23.
Ouchi, W. 1981, Theory Z. Reading, MA: Addison-Wesley.
Ouchi, W. & Wilkins, A. 1985. ‘Organisational culture’. In: Martins, J. (eds). Organisational
Culture: Mapping the Terrain. London: Sage Publications.
Pascale, R. & Athos, A. 1981. The art of Japanese management: Applications for American
executives. New York: Simon & Schuster.
Peters, T. & Waterman, R. 1982. In search of excellence. New York : Harper and Row.
Pettigrew, A.M. 1979. ‘On Studying Organisational Culture’, Administrative Science
Quarterly, 24: 570-581.
Pheysey, D.C. 1993. Organisational cultures. Types and transformation. London: Routedge.
Pool, S.W. 2000. ‘Organisational culture and its relationship between job tension in
measuring outcomes among business executives’, Journal of Management
Development, 19(1): 32-49.

215
Porras, J. & Collins, J. 1994. Built to last. New York: HarperBusiness.
Prahalad, C. K. & Bettis, R. A. 1986. ‘The dominant logic: A new linkage between diversity
and performance’, Strategic Management Journal, 7: 485-501.
Quick, J. C. 1992. ‘Crafting an organisational culture: Herbs hand at Southwest airlines’,
Organisational Dynamics, 21(2): 45-56.
Quinn, R. E. 1988. Beyond rational management. San Francisco: Jossey-Bass.
Rahim, M.A. & Psenicka, C. 1996. ‘A structural equations model of stress, locus of control,
social support, psychiatric symptoms, and propensity to leave job’, Journal of Social
Psychology, 136: 69-84.
Rapisarda, B. A. 2002. ‘The impact of emotional intelligence on work team cohesiveness and
performance’. In: HayGroup. 2005. Emotional Competence Inventory (ECI) technical
manual. Johannesburg: HayGroup.
Rashid, Z. A. & Anantharaman, R. A. 1997. ‘A study of corporate culture and strategy and
culture’, Malaysian Management Review, 32 (September): 25-9.
Rashid, Z.A., Sambasivan, M. & Johari, J. 2002. ‘The influence of corporate culture and
organisational commitment on performance’, Journal of Management Development,
22(8): 708-728.
Rau, W. A. 2001. ‘The relationship of emotional intelligence test scores to job performance
valuation scores in the management group of health care organisation.’ Unpublished
doctoral thesis. Medical University of South Carolina-College of Health professions.
Ray, C. A. 1986. ‘Corporate culture: The last frontier of control’, Journal of Management
Studies, 23(3): 251-97.
Reed, R. & DeFillippi, R. J. 1990. ‘Causal ambiguity, barriers to imitation, and sustainable
competitive advantage’, Academy of Management Review, 15: 88-102.

216
Riley, P. 1983. ‘A structurationist account of political cultures’, Administrative Science
Quarterly, 28: 414-437.
Risberg, A. 1999. Ambiguities thereafter. Lund, Sweden: Lund University Press.
Roberson, L. & Block, C. J. 2001. ‘Racioethnicity and job performance: A review and
critique of theoretical perspectives on causes of group differences’, Research in
Organisational Behavior, 23: 247-325.
Rode, J. C., Mooney, C. H., Arthaud-Day, M. L. & Near, J.P. 2007. ‘Emotional intelligence
and individual performance of direct and moderated effects’, Journal of
Organisational Behaviour, 28 (4): 399.
Roth, P. L., Huffcutt, A. I. & Bobko, P. 2003. ‘Ethnic group differences in measures of job
performance: A new meta-analysis’, Journal of Applied Psychology, 88: 694-706.
Rousseau, D. 1990. ‘Normative beliefs in high and low fund raising organisations’, Group and
Organisation Studies, 15: 448-460.
Sadri, G. & Lees, B. 2001. ‘Developing corporate culture as a competitive advantage’,
Journal of Management Development, 20(10): 853-9.
Saari, L., Johnson, T.R., McLaughlin, S.D. & Zimmerly, D.M. 1998. ‘Survey of
management education practices in the US companies’, Personnel Psychology, 41:
731-43.
Sabelis, I. 1996. Temporal paradoxes: Working with cultural diversity in organisations. In:
Martins, J. (ed). Organisational Culture: Mapping the Terrain. London: Sage
Publications.
Saffold, G. 1988. ‘Culture traits, strength, and organisational performance. Moving beyond
“strong” culture’, Academy of Management Review, 13: 546-558.

217
Saks, A.M. 1995. ‘Longitudinal field investigation of the moderating and mediating effects of
self-efficacy on the relationship between training and newcomer adjustment’, Journal
of Applied Psychology, 80: 211-225.
Sala, F. 2001. ‘Do programs designed to increase emotional intelligence at work-Work?’. In:
HayGroup. 2005. Emotional Competence Inventory (ECI) technical manual.
Johannesburg: HayGroup.
Salovey, P. & Mayer, J.D. 1990. ‘Emotional Intelligence’, Imagination, Cognition and
Personality, 9: 185-211.
Sarros, J. C., Gray, J. & Densten, I. L. 2002. ‘Leadership and its impact on organisational
culture’, International Journal of Business Studies, 10(2): 1-26.
Sathe, V. 1985. Culture and related corporate realities: Text, cases and readings on
organisational entry, establishment, and change. Homewood, IL: Irwin.
Schatz, W. 2000. ‘The balancing act,’ AFP Exchange, Summer: 40.
Schein, E.H. 1978. Career dynamics: matching Individual and Organisational Needs, MA:
Addison-Wesley.
Schein, E.H. 1983. ‘The Role of the Founder in Creating Organisational Culture’,
Organisational Dynamics, Summer: 13-28.
Schein, E. H. 1984. ‘Coming to a new awareness of organisational culture’. Sloan
Management Review, Winter.
Schein, E.H. 1985. Organisational culture and leadership. San Francisco: Jossey-
Bass.
Schein, E.H. 1986. ‘What you need to know about organisational culture’, Training and
development Journal, January: 30-33.

218
Schein, E. H. 1991. ‘What is culture?’. In Frost, P., Moore, L., Louis, M., Lunberg, C. &
Martins, J. (eds). Reframing organisational culture. Newbury Park, CA: Sage
Publications.
Schein, E.H. 1992. Organisational culture and Leadership. San Francisco: Jossey-Bass.
Schein, E.H. 1999. The corporate culture survival guide. San Francisco : Jossey-Bass.
Schein, E.H. 2004. Organisational culture and Leadership. San Francisco: Jossey-Bass.
Schneider, B. 1990. Organisational climate and culture. San Francisco: Jossey-Bass.
Scholz, C. 1987. ‘Corporate culture and strategy: The problem of strategic fit’, Long Range
Planning, 20(4): 78-87.
Schuler, R. S. 1995. Managing human resources. New York, West.
Schultz, M. & Hatch, M. 1996. ‘Living with multiple paradigms: The case of paradigm
interplay in organisational culture studies’. In: Martins, J. (ed). Organisational
Culture: Mapping the Terrain. London: Sage Publications.
Schurink, E. M. 1998. Deciding to use a quantitative research approach. In: De Vos, A. S.
(ed). Research at grass roots: A primer for the caring profession. Pretoria: J. L. van
Schaik. 239-251.
Schwartz, H. & Davis, S. M. 1981. ‘Matching corporate culture and business strategy’,
Organisational Dynamics, Winter: 30-48.
Sergio, R. P. 2001. Emotional intelligence and mental ability as determinants of job
performance among plat supervisors in selected manufacturing firms. In: HayGroup.
2005. Emotional Competence Inventory (ECI) technical manual. Johannesburg:
HayGroup.

219
Servinc, L. 2001. ‘The effect of emotional intelligence on career success: Research on 1990
graduates of business administration faculty of Istanbul University’. In: HayGroup:
2005. Emotional Competence Inventory (ECI) technical manual. Johannesburg:
HayGroup.
Shamir, B. 1992. ‘Attribution of influence and charisma to the leaders’, Journal of Applied
Social Psychology, 22 (5): 367-391.
Siehl, C. 1985. ‘After the founder: An opportunity to manage culture’. In: Frost, P. J. et al.
(eds). Organisational Culture, Beverly Hills, CA: Sage, pp. 125-40.
Siehl, C. & Martin, J. 1990. ‘Organisational culture: A key to financial performance?’ In:
Schnieder, B. (ed). Organisational climate and culture. San Francisco: Jossey-Bass .
79-104
Siehl, C., & Martins, J. 1984. ‘The role of symbolic management: How can managers
effectively transmit organisational culture?’ In: Martins, J. (ed). Organisational
Culture: Mapping the Terrain. London: Sage Publications.
Simms, J. 1997. ‘Beauty Queen’, Marketing Business, March: 48-51.
Simpson, S. & Cacioppe, R. 2001. ‘Unwritten ground rules: Transforming organisational
culture to achieve key business objectives and outstanding customer service,’
Leadership and organisational development journal, July-August: 394-402.
Sjolund, M. & Gustafsson, H. 2001. ‘Outcome study of leadership development assessment
and training program based on emotional intelligence’. In: Bar-On, R., Maree, K. &
Elias, M. (eds). Educating people to be emotionally intelligent. Sandton, South
Africa: Heinemann.
Smircich, L. 1983. ‘Concepts of culture and organisational analysis’, Administrative Science
Quarterly, 28:339-359.

220
Sosik, J. J. & Magerian, L. E. 1999. ‘Understanding leader emotional intelligence and
performance’, Group and Organisational Management, 24(3): 367-391.
Spencer, L. M. & Spencer, S.M. 1993. Competence at work: Models for superior
performance. New York: John Wiley and Sons.
Steele, F. I. 1973. Physical settings and organisation development. Reading, MA: Addison-
Wesley.
Sunesson, S. 1985. ‘Outside the goal paradigm: Power and structured patterns of non-
rationality’, Organisational Studies, 6: 229-246.
Tabachnick, B. G. & Fidell, L. S. 2007. Using multivariate Statistics. Boston: Pearson
Education
TannenBaum, R. & Schmidt, W. H. 1958. The Transformational leader. New York: John
Wiley.
Thorndike, E. L. 1920 ‘A constant error in psychological ratings’, Journal of Applied
Psychology, 4: 25-9.
Tischler, L., Biberman, J. & McKeage, R. 2002. ‘Linking emotional intelligence, spirituality
and workplace performance’, Journal of Managerial Psychology, 17(3): 203-218.
Treacy, M & Wiersma, F. 1993. ‘Customer intimacy and other paths to leadership’, Harvard
Business Review, Jan-Feb: 84-93.
Trice, H. M. & Beyer, J. M. 1993. The cultures of work organisations. Englewood Cliffs, NJ:
Prentice Hall.
Vandenberghe, C. 1999. ‘Organisational culture, person-culture fit and turnover: A replication
in the health care industry’, Journal of Organisational behaviour, 20: 175-184.

221
Van de Post, W. Z., De Coning, T. J. & Smit, E. V. 1998. ‘The relationship between
organisational culture and financial performance: some South African evidence’,
South African Journal of Business Management, 29(1): 30-41.
Walker, K. B. 1996. ‘Corporate performance reporting revisited – The balanced scorecard
and dynamic management reporting,’ Industrial management and data systems,
96(3): 24-31.
Watkin, C. 2000. ’Developing emotional intelligence’, International Journal for selection and
Assessment, 8: 89-92.
Weber, M. 1947. The theory of social and economic organisations. New York: Free Press.
Weiner, Y. 1988. ‘Forms of value systems. A focus on organisational effectiveness and
cultural change and maintenance’, Academy of Management Review, 13: 534-545.
Wilkins, A. L. 1983. Organisational stories as symbols which control the organisation. In:
Schein, E. H. (ed). Organisational culture and leadership. San Francisco, CA:
Jossey-Bass.
Williams, R. S. 1998. Performance Management: Perspectives on Employee Performance.
London: International Thomson Business Press.
Williams, M. 2002. The war for talent. London: CIPD.
Willmott, H. 1993. ‘Strength is ignorance: Slavery is freedom: Managing culture in modern
organisations’, Journal of Management Studies, 30(4): 515-51.
Young, E. 1991. On the naming of the rose: Interest and multiple meanings as elements of
organisational culture. In: Martins, J. (ed). Organisational Culture: Mapping the
Terrain. London: Sage Publications.
Yukl, G. 2002. Leadership in organisations. USA: Prentice Hall.

222
Yukl, G. 2004. ‘The future of leadership research: Challenges and Opportunities’, German
Journal of Human Resource Research, 18(3): 359-365.
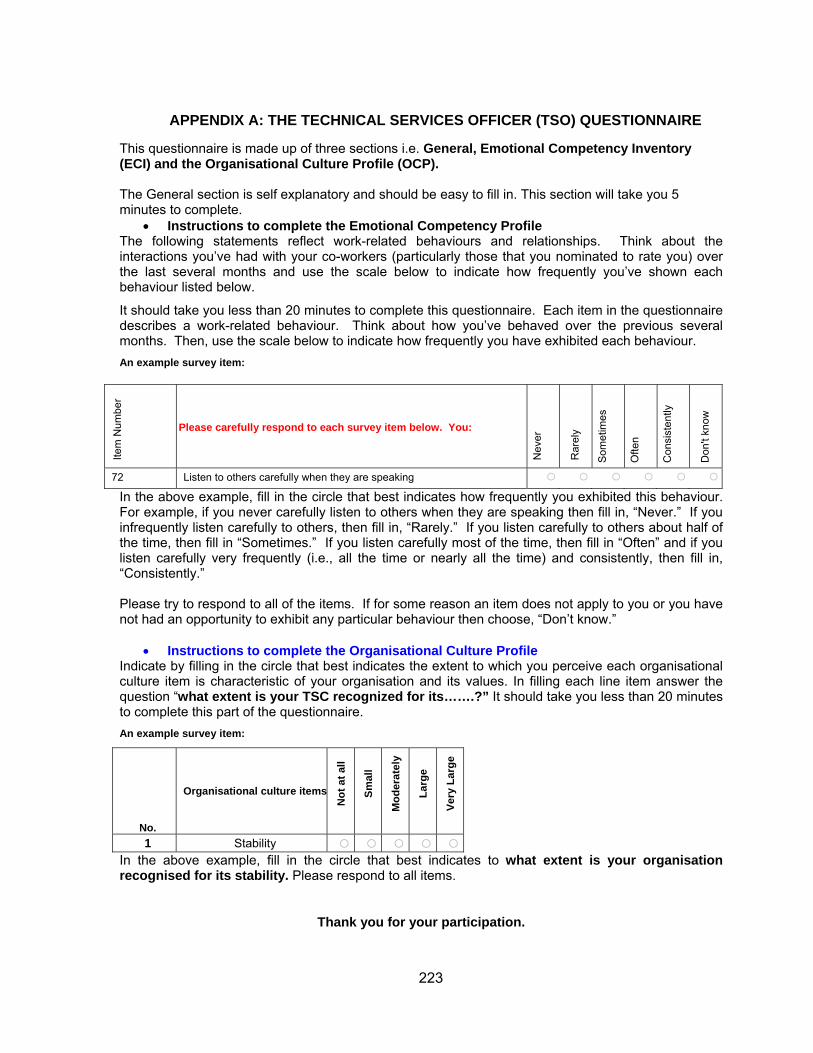
223
7 APPENDIX A: THE TECHNICAL SERVICES OFFICER (TSO) QUESTIONNAIRE
This questionnaire is made up of three sections i.e. General, Emotional Competency Inventory (ECI) and the Organisational Culture Profile (OCP). The General section is self explanatory and should be easy to fill in. This section will take you 5 minutes to complete.
• Instructions to complete the Emotional Competency Profile The following statements reflect work-related behaviours and relationships. Think about the interactions you’ve had with your co-workers (particularly those that you nominated to rate you) over the last several months and use the scale below to indicate how frequently you’ve shown each behaviour listed below.
It should take you less than 20 minutes to complete this questionnaire. Each item in the questionnaire describes a work-related behaviour. Think about how you’ve behaved over the previous several months. Then, use the scale below to indicate how frequently you have exhibited each behaviour. An example survey item:
In the above example, fill in the circle that best indicates how frequently you exhibited this behaviour. For example, if you never carefully listen to others when they are speaking then fill in, “Never.” If you infrequently listen carefully to others, then fill in, “Rarely.” If you listen carefully to others about half of the time, then fill in “Sometimes.” If you listen carefully most of the time, then fill in “Often” and if you listen carefully very frequently (i.e., all the time or nearly all the time) and consistently, then fill in, “Consistently.” Please try to respond to all of the items. If for some reason an item does not apply to you or you have not had an opportunity to exhibit any particular behaviour then choose, “Don’t know.”
• Instructions to complete the Organisational Culture Profile Indicate by filling in the circle that best indicates the extent to which you perceive each organisational culture item is characteristic of your organisation and its values. In filling each line item answer the question “what extent is your TSC recognized for its…….?” It should take you less than 20 minutes to complete this part of the questionnaire. An example survey item:
No.
Organisational culture items
Not
at a
ll
Smal
l
Mod
erat
ely
Larg
e
Very
Lar
ge
1 Stability In the above example, fill in the circle that best indicates to what extent is your organisation recognised for its stability. Please respond to all items.
Thank you for your participation.
Item
Num
ber
Please carefully respond to each survey item below. You:
Nev
er
Rar
ely
Som
etim
es
Ofte
n
Con
sist
ently
Don
't kn
ow
72 Listen to others carefully when they are speaking

224
General section Name of (TSO)?
Name of (TSC)?
Age of TSO
<25
26 to 30 yrs
31 to 35 yrs
36 to 40 yrs
41 to 45 yrs
46 to 50 yrs
51 to 55 yrs
56 to 60 yrs
>60 yrs
Male
Female
Race
Black
White
Coloured
Asian
Other
Educational qualifications of (TSO)?
Number of years in (TSO) position?
Less than 1 yr
1 to 2 yrs
2 to 3 yrs
3 to 4yrs
4 to 5 yrs
Greater than 6 yrs
Number of years employed by the organisation?
Less than 1 yr
1 to 2 yrs
2 to 3 yrs
3 to 4yrs
4 to 5 yrs
Greater than 6 yrs
Number of employees in your TSC reporting to you?
Less than 10 people
11 to 15 people
16 to 20 people
21 to 25 people
26 to 30 people
>30 people
How long has your TSC being in existence (years) for?
Less than 1 yr
1 to 2 yrs
2 to 3 yrs
3 to 4yrs
4 to 5 yrs
Greater than 6 yrs

225
Emotional competency inventory (ECI) Ite
m N
umbe
r
Please carefully respond to each survey item below. You:
Nev
er
Rar
ely
Som
etim
es
Ofte
n
Con
sist
ently
Don
't kn
ow
1 Recognizes the situations that arouse strong emotions in yourself 2 Has mainly positive expectations 3 Initiates actions to create possibilities 4 Anticipates obstacles to a goal 5 Is reluctant to change or make changes 6 Has sense of humour about oneself 7 In a group, encourages others' participation 8 Gives constructive feedback 9 Adapts ideas based on new information 10 Sets measurable and challenging goals 11 Solicits others' input 12 Takes calculated risks to reach a goal 13 Believes the future will be better than the past 14 Gives directions or demonstrations to develop someone 15 Looks for feedback, even if hard to hear 16 Reflects on underlying reasons for feelings 17 Makes self available to customers or clients 18 Publicly states everyone's position to those involved in a conflict 19 Relates well to people of diverse backgrounds 20 Makes work exciting 21 Is defensive when receiving feedback 22 Brings up ethical concerns 23 Listens attentively 24 Stays composed and positive, even in trying moments 25 Leads by example 26 Acts on own values even when there is a personal cost 27 Knows how their feelings effect their actions 28 Airs disagreements or conflicts 29 Inspires people 30 Applies standard procedures flexibly 31 Has “presence” 32 Monitors customer or client satisfaction 33 In a conflict, finds a position everyone can endorse 34 Engages an audience when presenting 35 States need for change

226
Item
Num
ber
Please carefully respond to each survey item below. You:
Nev
er
Rar
ely
Som
etim
es
Ofte
n
Con
sist
ently
Don
't kn
ow
36 Advocates change despite opposition 37 Gets impatient or shows frustration 38 Recognizes specific strengths of others 39 Understands informal structure in the organisation 40 Behaves calmly in stressful situations 41 Personally leads change initiatives 42 Gets support from key people 43 Understands the organisation's unspoken rules 44 Keeps their promises 45 Understands historical reasons for organisational issues 46 Takes personal responsibility for meeting customer needs 47 Acknowledges mistakes 48 Presents self in an assured manner 49 Handles unexpected demands well 50 Articulates a compelling vision 51 Is not politically savvy at work 52 Seeks ways to improve performance 53 Acknowledges own strengths and weaknesses 54 Can see things from someone else’s perspective 55 Believes oneself to be capable for a job 56 Cuts through red tape or bends rules when necessary 57 Stays positive despite setbacks 58 Develops behind-the-scenes support 59 Persuades by appealing to peoples' self interest 60 Acts impulsively 61 Does not cooperate with others 62 Doubts their own ability 63 Avoids conflicts 64 Matches customer or client needs to services or products 65 Establishes and maintains close relationships at work 66 Hesitates to act on opportunities 67 Provides on-going mentoring or coaching 68 Aware of own feelings 69 Changes overall strategy, goals, or projects to fit the situation 70 Seeks information in unusual ways 71 Is attentive to peoples' moods or nonverbal cues 72 Learns from setbacks

227
Organisational Culture Profile (OCP) Indicate by filling in the circle that best indicates the extent to which you perceive
each organisational culture item is characteristic of your TSC and its values.
No.
Organisational culture items
Not
at a
ll
Smal
l
Mod
erat
ely
Larg
e
Very
Lar
ge
To what extent is your TSC recognised for its…………………..…….?.
1 Stability 2 Being people oriented 3 Being innovative 4 Fairness 5 Being calm 6 Being reflective 7 Achievement orientation 8 Quick to take advantage of opportunities 9 Having high expectations for performance
10 High pay for good performance 11 Security of employment 12 Enthusiasm for the job
13 An emphasis on quality 14 Risk taking 15 Being distinctive-different from others 16 Having a good reputation
17 Being team oriented 18 Being results oriented 19 Having a clear guiding philosophy 20 Being competitive
21 Sharing information freely 22 Being highly organized 23 Being socially responsible 24 Low conflict
25 Opportunities for professional growth 26 Collaboration 27 Praise for good performance 28 Taking individual responsibility

228
8 APPENDIX B: THE FSAM AND FSE QUESTIONNAIRE
This questionnaire is made up of three sections i.e. General, Emotional Competency Inventory (ECI) and the Organisational Culture Profile (OCP). The General section is self explanatory and should be easy to fill in. This section will take you 5 minutes to complete.
• Instructions to complete the Emotional Competency Profile The following statements reflect behaviours that you may or may not have observed in the Technical Service Officer (TSO) you are rating. You will be asked to report on your experiences with this person. Please respond to all items by filling in the circle that is closest to your observation and experience with this person.
It should take you less than 20 minutes to complete this questionnaire. Each item in the questionnaire describes a work-related behavior. Think about your experiences with this individual over the previous 12 months. Then, use the scale below to indicate how frequently you have observed each behaviour. An example survey item:
In the above example, fill in the circle that best indicates how frequently you have observed this behaviour in the individual you are rating. For example, if the person you are rating never carefully listens to you when you are speaking then fill in, “Never.” If he or she infrequently listens carefully to you, then fill in, “Rarely.” If this person listens carefully to you about half of the time, then fill in “Sometimes.” If you observe this most of the time, then fill in “Often” and if the person listens carefully very frequently (i.e., all the time or nearly all the time) and consistently, then fill in, “Consistently.” Please try to respond to all of the items. If for some reason an item does not apply to this individual or you have not had an opportunity to observe any particular behaviour then choose, “Don’t know.”
• Instructions to complete the Organisational culture Profile Indicate by filling in the circle that best indicates the extent to which you perceive each organisational culture item is characteristic of the TSC you are rating and its values. In filling each line item answer the question “what extent is the TSC you are rating recognized for its…….?” It should take you less than 20 minutes to complete this part of the questionnaire.
An example survey item:
No.
Organisational culture items
Not
at a
ll
Smal
l
Mod
erat
ely
Larg
e
Very
Lar
ge
1 Stability In the above example, fill in the circle that best indicates to what extent is your organisation recognised for its stability. Please respond to all items.
Thank you for your participation.
Item
Num
ber
Please carefully respond to each survey item below. You:
Nev
er
Rar
ely
Som
etim
es
Ofte
n
Con
sist
ently
Don
't kn
ow
72 Listen to others carefully when they are speaking

229
General (FSAM and FSE) Name of Survey Participant? (optional)
Name of TSO you are rating?
Name of TSC you are rating?
What is your current designation/position with the
TSC?
FSE
FSAM
For how long have you worked in your current
designation/position (years)?
Less
than 1 yr
1 to 2
yrs
2 to 3
yrs
3 to 4yrs
4 to 5
yrs
Greater than 6
yrs
How long have you work for the
organisation (years)?
Less
than 1 yr
1 to 2
yrs
2 to 3
yrs
3 to 4yrs
4 to 5
yrs
Greater than 6
yrs
How long have you been working with the current TSO
(years)?
Less
than 1 yr
1 to 2
yrs
2 to 3
yrs
3 to 4yrs
4 to 5
yrs
Greater than 6
yrs

230
Emotional competency inventory (ECI) Ite
m N
umbe
r
Please carefully respond to each survey item below. Your TSO (he/she):
Nev
er
Rar
ely
Som
etim
es
Ofte
n
Con
sist
ently
Don
't kn
ow
1 Recognizes the situations that arouse strong emotions in him/her 2 Has mainly positive expectations 3 Initiates actions to create possibilities 4 Anticipates obstacles to a goal 5 Is reluctant to change or make changes 6 Has sense of humour about oneself 7 In a group, encourages others' participation 8 Gives constructive feedback 9 Adapts ideas based on new information 10 Sets measurable and challenging goals 11 Solicits others' input 12 Takes calculated risks to reach a goal 13 Believes the future will be better than the past 14 Gives directions or demonstrations to develop someone 15 Looks for feedback, even if hard to hear 16 Reflects on underlying reasons for feelings 17 Makes self available to customers or clients 18 Publicly states everyone's position to those involved in a conflict 19 Relates well to people of diverse backgrounds 20 Makes work exciting 21 Is defensive when receiving feedback 22 Brings up ethical concerns 23 Listens attentively 24 Stays composed and positive, even in trying moments 25 Leads by example 26 Acts on own values even when there is a personal cost 27 Knows how their feelings effect their actions 28 Airs disagreements or conflicts 29 Inspires people 30 Applies standard procedures flexibly 31 Has “presence” 32 Monitors customer or client satisfaction 33 In a conflict, finds a position everyone can endorse 34 Engages an audience when presenting 35 States need for change

231
Item
Num
ber
Please carefully respond to each survey item below. Your TSO (he/she):
Nev
er
Rar
ely
Som
etim
es
Ofte
n
Con
sist
ently
Don
't kn
ow
36 Advocates change despite opposition 37 Gets impatient or shows frustration 38 Recognizes specific strengths of others 39 Understands informal structure in the organisation 40 Behaves calmly in stressful situations 41 Personally leads change initiatives 42 Gets support from key people 43 Understands the organisation's unspoken rules 44 Keeps their promises 45 Understands historical reasons for organisational issues 46 Takes personal responsibility for meeting customer needs 47 Acknowledges mistakes 48 Presents self in an assured manner 49 Handles unexpected demands well 50 Articulates a compelling vision 51 Is not politically savvy at work 52 Seeks ways to improve performance 53 Acknowledges own strengths and weaknesses 54 Can see things from someone else’s perspective 55 Believes oneself to be capable for a job 56 Cuts through red tape or bends rules when necessary 57 Stays positive despite setbacks 58 Develops behind-the-scenes support 59 Persuades by appealing to peoples' self interest 60 Acts impulsively 61 Does not cooperate with others 62 Doubts their own ability 63 Avoids conflicts 64 Matches customer or client needs to services or products 65 Establishes and maintains close relationships at work 66 Hesitates to act on opportunities 67 Provides on-going mentoring or coaching 68 Aware of own feelings 69 Changes overall strategy, goals, or projects to fit the situation 70 Seeks information in unusual ways 71 Is attentive to peoples' moods or nonverbal cues 72 Learns from setbacks

232
Organisational Culture Profile (OCP) Indicate by filling in the circle that best indicates the extent to which you perceive
each organisational culture item is characteristic of your TSC and its values.
No.
Organisational culture items
Not
at a
ll
Smal
l
Mod
erat
ely
Larg
e
Very
Lar
ge
To what extent is your TSC recognised for its………………………….?.
1 Stability 2 Being people oriented 3 Being innovative 4 Fairness 5 Being calm 6 Being reflective 7 Achievement orientation 8 Quick to take advantage of opportunities 9 Having high expectations for performance
10 High pay for good performance 11 Security of employment 12 Enthusiasm for the job
13 An emphasis on quality 14 Risk taking 15 Being distinctive-different from others 16 Having a good reputation
17 Being team oriented 18 Being results oriented 19 Having a clear guiding philosophy 20 Being competitive
21 Sharing information freely 22 Being highly organized 23 Being socially responsible 24 Low conflict
25 Opportunities for professional growth 26 Collaboration 27 Praise for good performance 28 Taking individual responsibility

233
9 APPENDIX C: THE TSC STAFF QUESTIONNAIRE
This questionnaire is made up of three sections i.e. General, Emotional Competency Inventory (ECI) and the Organisational Culture Profile (OCP). The General section is self explanatory and should be easy to fill in. This section will take you 5 minutes to complete.
• Instructions to complete the Emotional Competency Profile The following statements reflect behaviours that you may or may not have observed in your Technical Services Officer (TSO) you are rating. You will be asked to report on your experiences with this person. Please respond to all items by filling in the circle that is closest to your observation and experience with this person.
It should take you less than 20 minutes to complete this questionnaire. Each item in the questionnaire describes a work-related behaviour. Think about your experiences with this individual over the previous 12 months. Then, use the scale below to indicate how frequently you have observed each behaviour. An example survey item:
In the above example, fill in the circle that best indicates how frequently you have observed this behaviour in the individual you are rating. For example, if the person you are rating never carefully listens to you when you are speaking then fill in, “Never.” If he or she infrequently listens carefully to you, then fill in, “Rarely.” If this person listens carefully to you about half of the time, then fill in “Sometimes.” If you observe this most of the time, then fill in “Often” and if the person listens carefully very frequently (i.e., all the time or nearly all the time) and consistently, then fill in, “Consistently.” Please try to respond to all of the items. If for some reason an item does not apply to this individual or you have not had an opportunity to observe any particular behaviour then choose, “Don’t know.”
• Instructions to complete the Organisational Culture Profile Indicate by filling in the circle that best indicates the extent to which you perceive each organisational culture item is characteristic of your Technical Service Center (TSC) and its values. In filling each line item answer the question “what extent is your TSC recognised for its…….?” It should take you less than 20 minutes to complete this part of the questionnaire. An example survey item:
No.
Organisational culture items
Not
at a
ll
Smal
l
Mod
erat
ely
Larg
e
Very
Lar
ge
1 Stability In the above example, fill in the circle that best indicates to what extent is your organisation recognised for its stability. Please respond to all items.
Thank you for your participation.
Item
Num
ber
Please carefully respond to each survey item below. You:
Nev
er
Rar
ely
Som
etim
es
Ofte
n
Con
sist
ently
Don
't kn
ow
72 Listen to others carefully when they are speaking

234
General (TSC staff) Name of Survey Participant? (optional)
Name of TSC?
What is your current
designation/position in the TSC?
TO
STO
PTO
WC
For how long have you worked in your current
designation/position (years)?
Less than 1 yr
1 to 2 yrs
2 to 3 yrs
3 to 4yrs
4 to 5 yrs
Greater than 6 yrs
How long have you work for the
organisation (years)?
Less than 1 yr
1 to 2 yrs
2 to 3 yrs
3 to 4yrs
4 to 5 yrs
Greater than 6 yrs
How long have you been reporting to your current (TSO)
(years)?
Less than 1 yr
1 to 2 yrs
2 to 3 yrs
3 to 4yrs
4 to 5 yrs
Greater than 6 yrs

235
Emotional competency inventory (ECI)
Item
Num
ber
Please carefully respond to each survey item below. Your TSO (he/she): N
ever
Rar
ely
Som
etim
es
Ofte
n
Con
sist
ently
Don
't kn
ow
1 Recognizes the situations that arouse strong emotions in him/her 2 Has mainly positive expectations 3 Initiates actions to create possibilities 4 Anticipates obstacles to a goal 5 Is reluctant to change or make changes 6 Has sense of humour about oneself 7 In a group, encourages others' participation 8 Gives constructive feedback 9 Adapts ideas based on new information 10 Sets measurable and challenging goals 11 Solicits others' input 12 Takes calculated risks to reach a goal 13 Believes the future will be better than the past 14 Gives directions or demonstrations to develop someone 15 Looks for feedback, even if hard to hear 16 Reflects on underlying reasons for feelings 17 Makes self available to customers or clients 18 Publicly states everyone's position to those involved in a conflict 19 Relates well to people of diverse backgrounds 20 Makes work exciting 21 Is defensive when receiving feedback 22 Brings up ethical concerns 23 Listens attentively 24 Stays composed and positive, even in trying moments 25 Leads by example 26 Acts on own values even when there is a personal cost 27 Knows how their feelings effect their actions 28 Airs disagreements or conflicts 29 Inspires people 30 Applies standard procedures flexibly 31 Has “presence” 32 Monitors customer or client satisfaction 33 In a conflict, finds a position everyone can endorse 34 Engages an audience when presenting 35 States need for change

236
Item
Num
ber
Please carefully respond to each survey item below. Your TSO (he/she): N
ever
Rar
ely
Som
etim
es
Ofte
n
C
onsi
sten
tl y
Don
't kn
ow
36 Advocates change despite opposition 37 Gets impatient or shows frustration 38 Recognizes specific strengths of others 39 Understands informal structure in the organisation 40 Behaves calmly in stressful situations 41 Personally leads change initiatives 42 Gets support from key people 43 Understands the organisation's unspoken rules 44 Keeps their promises 45 Understands historical reasons for organisational issues 46 Takes personal responsibility for meeting customer needs 47 Acknowledges mistakes 48 Presents self in an assured manner 49 Handles unexpected demands well 50 Articulates a compelling vision 51 Is not politically savvy at work 52 Seeks ways to improve performance 53 Acknowledges own strengths and weaknesses 54 Can see things from someone else’s perspective 55 Believes oneself to be capable for a job 56 Cuts through red tape or bends rules when necessary 57 Stays positive despite setbacks 58 Develops behind-the-scenes support 59 Persuades by appealing to peoples' self interest 60 Acts impulsively 61 Does not cooperate with others 62 Doubts their own ability 63 Avoids conflicts 64 Matches customer or client needs to services or products 65 Establishes and maintains close relationships at work 66 Hesitates to act on opportunities 67 Provides on-going mentoring or coaching 68 Aware of own feelings 69 Changes overall strategy, goals, or projects to fit the situation 70 Seeks information in unusual ways 71 Is attentive to peoples' moods or nonverbal cues 72 Learns from setbacks

237
Organisational Culture Profile (OCP) Indicate by filling in the circle that best indicates the extent to which you perceive each organisational culture item is characteristic of the TSC you are rating and its
values.
No.
Organisational culture items
Not
at a
ll
Smal
l
Mod
erat
ely
Larg
e
Very
Lar
ge
To what extent is the TSC you are rating recognised for its…………..?.
1 Stability 2 Being people oriented 3 Being innovative 4 Fairness 5 Being calm 6 Being reflective 7 Achievement orientation 8 Quick to take advantage of opportunities 9 Having high expectations for performance
10 High pay for good performance 11 Security of employment 12 Enthusiasm for the job
13 An emphasis on quality 14 Risk taking 15 Being distinctive-different from others 16 Having a good reputation
17 Being team oriented 18 Being results oriented 19 Having a clear guiding philosophy 20 Being competitive
21 Sharing information freely 22 Being highly organized 23 Being socially responsible 24 Low conflict
25 Opportunities for professional growth 26 Collaboration 27 Praise for good performance 28 Taking individual responsibility

238
10 APPENDIX D: LIST OF TECHNICAL SERVICES CENTRES
Table D1: Total List of TSC’s in the sample population Te
chni
cal
Serv
ice
Cen
tre
Reg
ion
FSAM FSE TSO TO STO PTO WC
1 E 1 1 1 1 0 1 1
2 E 1 1 1 1 1 1 1
3 E 1 1 1 1 1 1 1
4 E 0 0 0 0 0 0 0
5 E 1 0 1 1 1 1 1
6 E 0 1 0 0 0 0 0
7 E 1 1 1 1 1 1 1
8 E 1 1 1 1 1 1 1
9 E 1 1 1 1 1 1 1
10 E 1 1 1 1 1 1 1
11 E 1 1 1 1 1 1 1
12 E 1 1 1 1 1 1 1
13 E 1 1 1 1 1 1 1
14 E 0 0 0 0 0 0 0
15 E 1 1 1 1 1 1 1
16 E 1 1 1 1 1 1 1
17 E 1 0 1 0 1 1 0
18 E 1 0 1 1 1 1 1
19 E 1 0 1 1 1 1 1
20 E 1 1 1 1 1 1 1
21 E 1 1 1 1 1 1 1
22 E 0 0 0 0 0 0 0
23 E 0 0 0 0 0 0 0
24 E 1 1 1 1 1 1 1
25 E 1 1 1 1 1 1 1
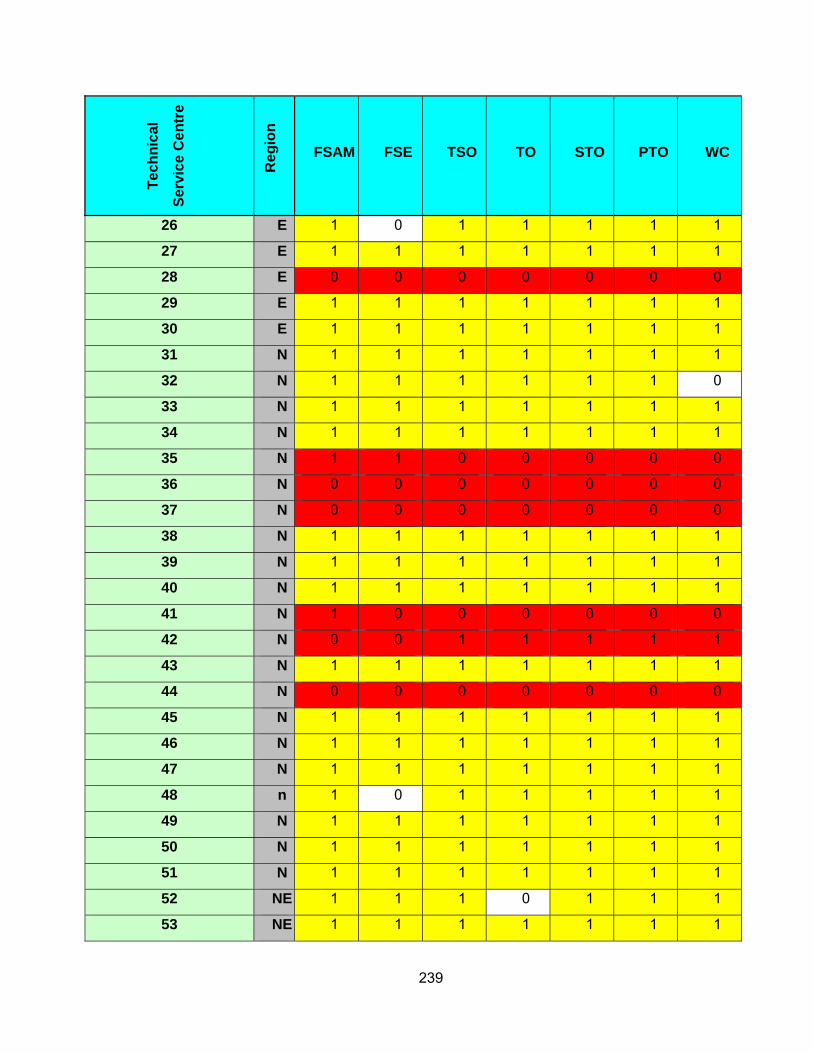
239
Tech
nica
l
Serv
ice
Cen
tre
Reg
ion
FSAM FSE TSO TO STO PTO WC
26 E 1 0 1 1 1 1 1
27 E 1 1 1 1 1 1 1
28 E 0 0 0 0 0 0 0
29 E 1 1 1 1 1 1 1
30 E 1 1 1 1 1 1 1
31 N 1 1 1 1 1 1 1
32 N 1 1 1 1 1 1 0
33 N 1 1 1 1 1 1 1
34 N 1 1 1 1 1 1 1
35 N 1 1 0 0 0 0 0
36 N 0 0 0 0 0 0 0
37 N 0 0 0 0 0 0 0
38 N 1 1 1 1 1 1 1
39 N 1 1 1 1 1 1 1
40 N 1 1 1 1 1 1 1
41 N 1 0 0 0 0 0 0
42 N 0 0 1 1 1 1 1
43 N 1 1 1 1 1 1 1
44 N 0 0 0 0 0 0 0
45 N 1 1 1 1 1 1 1
46 N 1 1 1 1 1 1 1
47 N 1 1 1 1 1 1 1
48 n 1 0 1 1 1 1 1
49 N 1 1 1 1 1 1 1
50 N 1 1 1 1 1 1 1
51 N 1 1 1 1 1 1 1
52 NE 1 1 1 0 1 1 1
53 NE 1 1 1 1 1 1 1
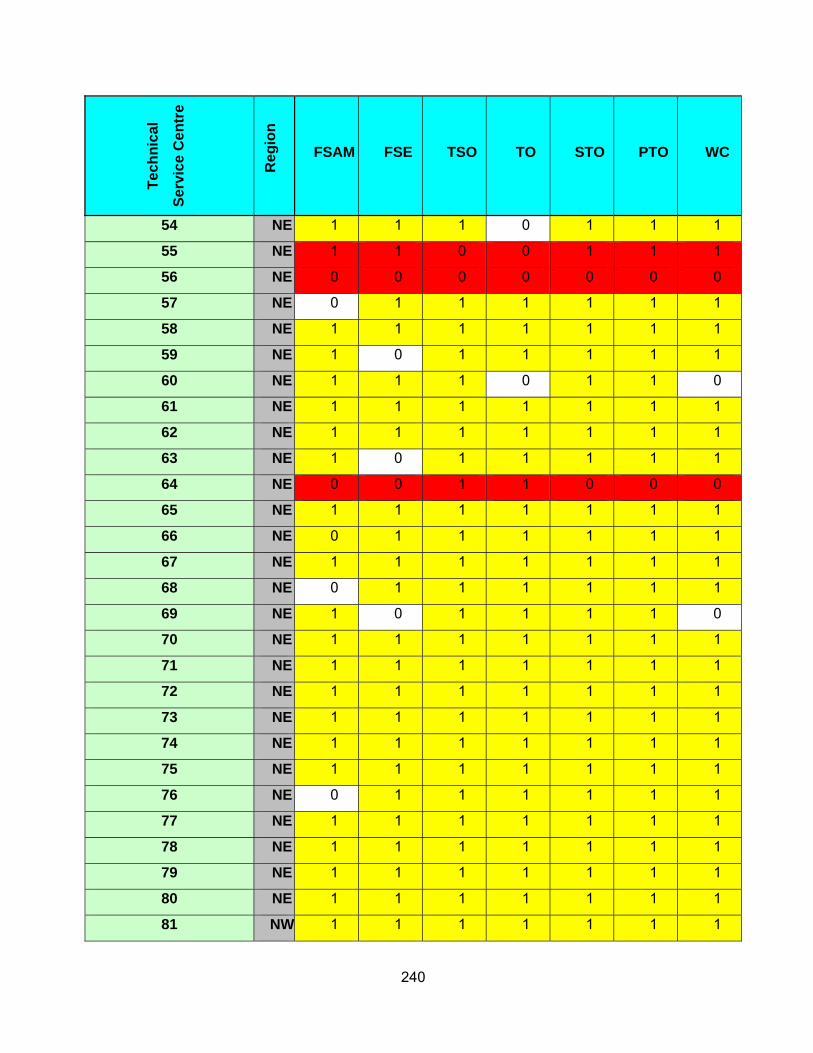
240
Tech
nica
l
Serv
ice
Cen
tre
Reg
ion
FSAM FSE TSO TO STO PTO WC
54 NE 1 1 1 0 1 1 1
55 NE 1 1 0 0 1 1 1
56 NE 0 0 0 0 0 0 0
57 NE 0 1 1 1 1 1 1
58 NE 1 1 1 1 1 1 1
59 NE 1 0 1 1 1 1 1
60 NE 1 1 1 0 1 1 0
61 NE 1 1 1 1 1 1 1
62 NE 1 1 1 1 1 1 1
63 NE 1 0 1 1 1 1 1
64 NE 0 0 1 1 0 0 0
65 NE 1 1 1 1 1 1 1
66 NE 0 1 1 1 1 1 1
67 NE 1 1 1 1 1 1 1
68 NE 0 1 1 1 1 1 1
69 NE 1 0 1 1 1 1 0
70 NE 1 1 1 1 1 1 1
71 NE 1 1 1 1 1 1 1
72 NE 1 1 1 1 1 1 1
73 NE 1 1 1 1 1 1 1
74 NE 1 1 1 1 1 1 1
75 NE 1 1 1 1 1 1 1
76 NE 0 1 1 1 1 1 1
77 NE 1 1 1 1 1 1 1
78 NE 1 1 1 1 1 1 1
79 NE 1 1 1 1 1 1 1
80 NE 1 1 1 1 1 1 1
81 NW 1 1 1 1 1 1 1

241
Tech
nica
l
Serv
ice
Cen
tre
Reg
ion
FSAM FSE TSO TO STO PTO WC
82 NW 1 1 1 1 1 1 1
83 NW 1 1 1 1 1 1 1
84 NW 1 1 0 0 0 0 0
85 NW 0 0 1 1 1 1 1
86 NW 1 0 1 1 1 1 1
87 NW 1 1 1 1 1 1 1
88 NW 1 1 1 1 1 1 1
89 NW 0 0 0 0 0 0 0
90 NW 1 1 1 1 1 1 1
91 NW 1 1 1 1 1 1 1
92 NW 1 1 1 1 1 1 1
93 NW 1 1 1 1 1 1 1
94 NW 1 1 1 1 1 1 1
95 NW 1 1 1 1 1 1 1
96 NW 1 1 1 1 1 1 1
97 NW 1 1 1 0 1 1 1
98 NW 1 1 1 1 1 1 1
99 NW 1 1 1 1 1 1 1
100 NW 1 1 1 1 1 1 1
101 NW 1 1 1 1 1 1 1
102 NW 1 1 1 1 1 1 1
103 NW 1 1 1 1 1 1 1
104 NW 1 1 1 1 1 1 1
104 NW 1 1 1 1 1 1 1
105 NW 1 1 1 1 1 1 1
106 NW 1 1 1 1 0 1 1
107 NW 1 1 1 1 1 1 1
108 S 1 1 1 1 1 1 1

242
Tech
nica
l
Serv
ice
Cen
tre
Reg
ion
FSAM FSE TSO TO STO PTO WC
109 S 1 1 1 1 1 1 1
110 S 1 1 1 1 1 1 1
111 S 0 0 0 0 0 0 0
112 S 0 0 1 1 1 1 1
113 S 1 1 0 1 1 1 1
114 S 0 0 0 0 0 0 0
115 S 0 0 0 0 0 0 0
116 S 0 0 0 0 0 0 0
117 S 1 1 1 1 1 1 1
118 S 1 1 1 0 1 1 1
119 S 0 0 0 0 0 0 0
120 S 1 1 1 1 1 1 1
121 S 0 0 0 0 0 0 0
122 S 0 0 0 0 0 0 0
123 S 1 1 1 1 1 1 1
124 W 0 0 1 1 1 1 1
125 W 0 0 0 0 0 0 0
126 W 0 0 0 0 0 0 0
127 W 1 1 1 1 1 1 1
128 W 1 1 1 1 1 1 1
129 W 1 1 0 0 1 1 1
130 W 0 0 0 0 0 0 0
131 W 1 0 0 0 1 1 1
132 W 1 0 1 1 1 1 1
133 W 1 1 1 1 1 1 1
134 W 1 1 1 1 1 1 1
135 W 1 1 1 1 1 1 1
136 W 0 0 0 0 0 0 0

243
Tech
nica
l
Serv
ice
Cen
tre
Reg
ion
FSAM FSE TSO TO STO PTO WC
137 W 1 1 0 1 1 1 1
138 W 1 0 1 1 1 1 1
139 W 1 1 1 0 1 1 1
140 W 1 1 1 1 1 1 1
141 W 1 0 1 1 1 1 1
142 W 0 0 0 0 0 0 0
143 W 1 1 1 1 1 1 1
144 W 0 0 0 0 0 0 0
145 W 1 1 1 1 1 1 1
146 W 0 0 0 0 0 0 0
147 W 1 1 1 1 1 1 1
Total questionnaires filled in per category 114 104 115 110 117 119 115
- excluded from the sample
- included in the sample

244
11 APPENDIX E: DESCRIPTIVE STATISTICS FOR THE ECI, OCP AND ORGANISATIONAL PERFORMANCE
Table E1: Descriptive Statistics for ECI Questionnaires filled in by the Technical Services Officer
N Mean Std.
Deviation Variance Skewness Kurtosis
Statistic Statistic Std.
Error Statistic Statistic Statistic Std.
Error StatisticStd.
Error(TSO)
Emotional self
awareness 118 4.0784 .04717 .51235 .262 -.167 .223 -.111 .442
(TSO)
Accurate self
assessment 118 4.1389 .04099 .44340 .197 -.018 .224 -.522 .444
(TSO) Self
confidence 118 4.3263 .04427 .48095 .231 -.781 .223 .924 .442
(TSO)
Emotional Self
Control 118 3.7860 .04928 .53537 .287 -.111 .223 -.407 .442
(TSO)
Transparency 118 4.0890 .04782 .51942 .270 -.441 .223 .138 .442
(TSO)
Adaptability 118 4.0720 .04454 .48382 .234 -.273 .223 .038 .442
(TSO)
Achievement
orientation 118 4.2669 .04274 .46424 .216 -.435 .223 -.019 .442
(TSO)
Initiative 118 3.5191 .05169 .56155 .315 .207 .223 -.692 .442
(TSO)
Optimism 118 4.2458 .04613 .50105 .251 -.618 .223 .059 .442

245
N Mean Std.
Deviation Variance Skewness Kurtosis
Statistic Statistic Std.
Error Statistic Statistic Statistic Std.
Error StatisticStd.
Error
(TSO)
Empathy 118 4.2288 .04186 .45477 .207 -.409 .223 .145 .442
(TSO)
Organisational
awareness 118 3.8602 .06200 .67348 .454 -.243 .223 -.350 .442
(TSO) Service
orientation 118 4.4068 .04650 .50510 .255 -.679 .223 -.294 .442
(TSO)
Developing
others 118 4.4153 .04006 .43513 .189 -.533 .223 .235 .442
(TSO)
Inspirational
leadership 118 4.1992 .04913 .53365 .285 -.245 .223 -.701 .442
(TSO)
Change
catalyst 118 3.9068 .05547 .60252 .363 -.222 .223 -.147 .442
(TSO)
Influence.
Having impact
on others
118 3.9195 .05314 .57724 .333 -.149 .223 -.299 .442
(TSO) Conflict
Management 118 3.5720 .05920 .64309 .414 -.341 .223 .142 .442
(TSO) Team
work and
collaboration 118 4.4047 .04360 .47357 .224 -.663 .223 .140 .442

246
Table E2: Descriptive Statistics for the ECI Questionnaire filled in by the Field Services Area Manager
N Mean Std.
DeviationVariance Skewness Kurtosis
Statistic Statistic Std.
Error Statistic Statistic Statistic
Std. Error
StatisticStd.
Error
(FSAM)
Emotional self
assessment
113 3.5221 .04985 .52986 .281 -.038 .227 -.386 .451
(FSAM)
Accurate self
assessment
113 3.5199 .05864 .62334 .389 -.624 .227 .601 .451
(FSAM) Self
confidence 113 3.8872 .06301 .66981 .449 -.395 .227 -.228 .451
(FSAM)
Emotional self
control
113 3.4358 .06717 .71400 .510 -.799 .227 .519 .451
(FSAM)
Emotional self
control
113 3.6128 .06600 .70155 .492 -.433 .227 .677 .451
(FSAM)
Adaptability 113 3.5310 .05675 .60331 .364 -.202 .227 -.088 .451
(FSAM)
Achievement
orientation
113 3.6438 .07158 .76094 .579 -.109 .227 -.858 .451
(FSAM)
Initiative 113 3.3356 .05176 .55025 .303 -.147 .227 -.113 .451
(FSAM)
Optimism 113 3.5885 .06674 .70941 .503 -.696 .227 .859 .451
(FSAM)
Empathy 113 3.6549 .06296 .66925 .448 -.672 .227 .451 .451

247
N Mean Std.
DeviationVariance Skewness Kurtosis
Statistic Statistic Std.
Error Statistic Statistic Statistic
Std. Error
StatisticStd.
Error
(FSAM)
Organisational
awareness
113 3.5973 .06146 .65332 .427 -.143 .227 -.616 .451
(FSAM)
Service
orientation
113 4.0420 .07180 .76320 .582 -.712 .227 -.249 .451
(FSAM)
Developing
Others
113 3.6925 .07317 .77777 .605 -.461 .227 -.292 .451
(FSAM)
Inspirational
leadership
113 3.5929 .07008 .74492 .555 -.480 .227 -.047 .451
(FSAM)
Change
catalyst
113 3.2522 .07327 .77883 .607 -.423 .227 .836 .451
(FSAM)
Influence 113 3.5310 .05614 .59680 .356 -.229 .227 -.066 .451
(FSAM)
Conflict
management
113 3.2765 .05891 .62622 .392 -.119 .227 -.041 .451
(FSAM)
Teamwork
and
collaboration
113 3.5819 .05900 .62718 .393 -.421 .227 .011 .451

248
Table E 3: Descriptive Statistics for ECI Questionnaire filled in by the Field Services Engineer
N Mean Std. Deviation Variance Skewness Kurtosis
Statistic Statistic Std. Error Statistic Statistic Statistic Std.
Error Statistic Std. Error
(FSE) Emotional self
awareness 107 3.4743 .05393 .55789 .311 .334 .234 -.355 .463
(FSE) Accurate self assessment
107 3.4393 .06120 .63305 .401 -.314 .234 .867 .463
(FSE) Self confidence 107 3.6565 .06527 .67513 .456 -.135 .234 -.402 .463
(FSE) Emotional self
control 107 3.3388 .05577 .57693 .333 -.092 .234 .037 .463
(FSE) Transparency 107 3.4790 .05995 .62014 .385 .034 .234 -.180 .463
(FSE) Adaptability 107 3.3645 .06741 .69727 .486 -.073 .234 .045 .463
(FSE) Achievement
orientation 107 3.4533 .06641 .68692 .472 -.477 .234 .020 .463
(FSE) Initiative 107 3.1051 .06067 .62762 .394 .105 .234 .613 .463
(FSE) Optimism 107 3.4766 .06364 .65834 .433 .119 .234 -.610 .463
(FSE) Empathy 107 3.5070 .05980 .61856 .383 .066 .234 -.361 .463
(FSE) Organisational
awareness 107 3.2734 .05610 .58027 .337 .046 .234 -.865 .463
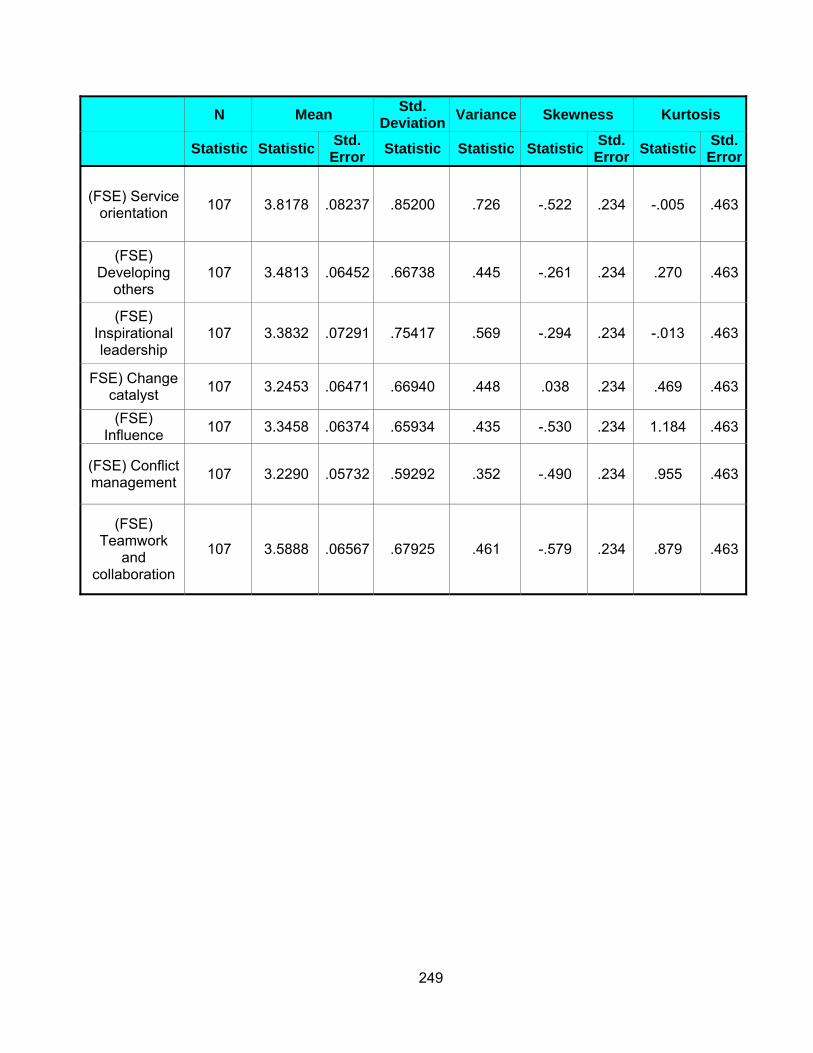
249
N Mean Std. Deviation Variance Skewness Kurtosis
Statistic Statistic Std. Error Statistic Statistic Statistic Std.
Error Statistic Std. Error
(FSE) Service orientation 107 3.8178 .08237 .85200 .726 -.522 .234 -.005 .463
(FSE) Developing
others 107 3.4813 .06452 .66738 .445 -.261 .234 .270 .463
(FSE) Inspirational leadership
107 3.3832 .07291 .75417 .569 -.294 .234 -.013 .463
FSE) Change catalyst 107 3.2453 .06471 .66940 .448 .038 .234 .469 .463
(FSE) Influence 107 3.3458 .06374 .65934 .435 -.530 .234 1.184 .463
(FSE) Conflict management 107 3.2290 .05732 .59292 .352 -.490 .234 .955 .463
(FSE) Teamwork
and collaboration
107 3.5888 .06567 .67925 .461 -.579 .234 .879 .463
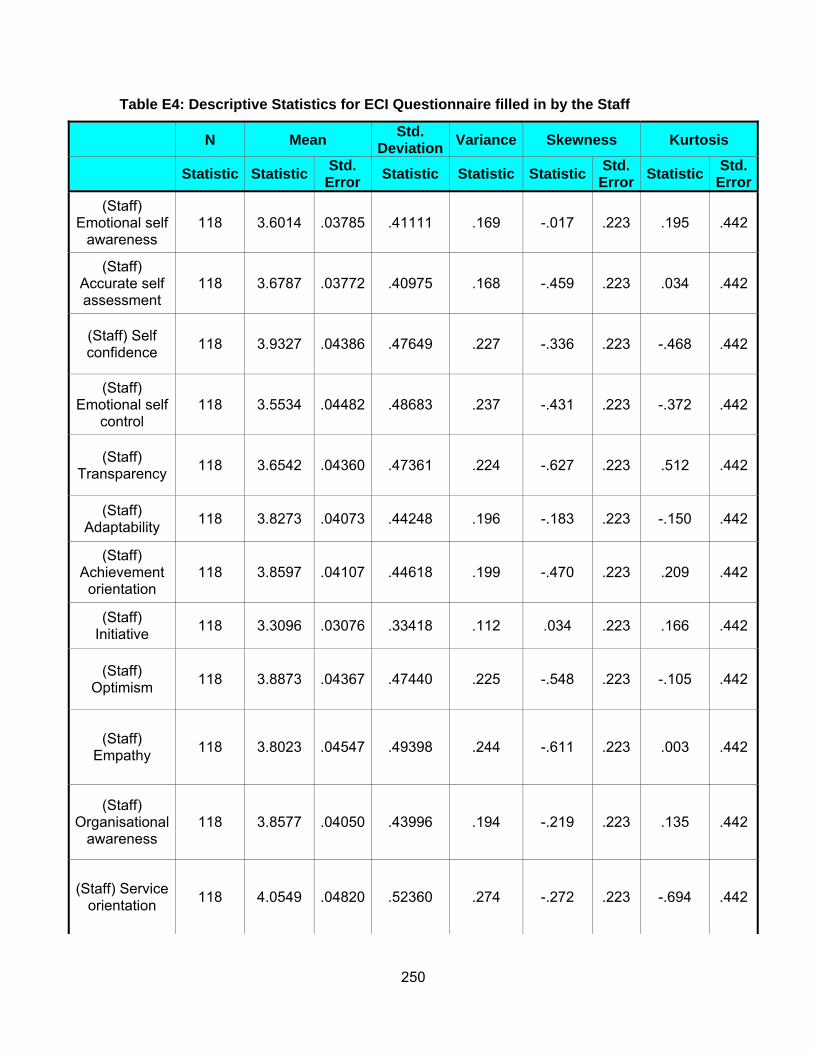
250
Table E4: Descriptive Statistics for ECI Questionnaire filled in by the Staff
N Mean Std. Deviation Variance Skewness Kurtosis
Statistic Statistic Std. Error Statistic Statistic Statistic Std.
Error Statistic Std. Error
(Staff) Emotional self
awareness 118 3.6014 .03785 .41111 .169 -.017 .223 .195 .442
(Staff) Accurate self assessment
118 3.6787 .03772 .40975 .168 -.459 .223 .034 .442
(Staff) Self confidence 118 3.9327 .04386 .47649 .227 -.336 .223 -.468 .442
(Staff) Emotional self
control 118 3.5534 .04482 .48683 .237 -.431 .223 -.372 .442
(Staff) Transparency 118 3.6542 .04360 .47361 .224 -.627 .223 .512 .442
(Staff) Adaptability 118 3.8273 .04073 .44248 .196 -.183 .223 -.150 .442
(Staff) Achievement
orientation 118 3.8597 .04107 .44618 .199 -.470 .223 .209 .442
(Staff) Initiative 118 3.3096 .03076 .33418 .112 .034 .223 .166 .442
(Staff) Optimism 118 3.8873 .04367 .47440 .225 -.548 .223 -.105 .442
(Staff) Empathy 118 3.8023 .04547 .49398 .244 -.611 .223 .003 .442
(Staff) Organisational
awareness 118 3.8577 .04050 .43996 .194 -.219 .223 .135 .442
(Staff) Service orientation 118 4.0549 .04820 .52360 .274 -.272 .223 -.694 .442

251
N Mean Std. Deviation Variance Skewness Kurtosis
Statistic Statistic Std. Error Statistic Statistic Statistic Std.
Error Statistic Std. Error
(Staff) Developing
others 118 3.9151 .05145 .55888 .312 -.828 .223 .166 .442
(Staff) Inspirational leadership
118 3.7687 .05235 .56866 .323 -.719 .223 .022 .442
(Staff) Change catalyst
118 3.5165 .03682 .39994 .160 -.286 .223 .185 .442
(Staff) Influence 118 3.7687 .04192 .45534 .207 -.202 .223 -.365 .442
(Staff) Conflict management 118 3.2866 .03699 .40185 .161 -.489 .223 1.754 .442
(Staff) Teamwork
and collaboration
118 3.9103 .04316 .46880 .220 -.415 .223 -.183 .442

252
Table E5: Descriptive Statistics for ECI Questionnaire filled in by the “Total Other” (average of FSAM, FSE, Staff)
N Mean Std.
DeviationVariance Skewness Kurtosis
Statistic Statistic Std.
Error Statistic Statistic Statistic
Std. Error
StatisticStd.
Error
(Tot)
Emotional
Self
awareness
116 3.5055 .03359 .36174 .131 -.546 .225 .971 .446
(Tot)
Accurate self
assessment
116 3.5202 .03820 .41147 .169 -.866 .225 1.496 .446
(Tot) Self
confidence 116 3.7968 .04208 .45319 .205 -.479 .225 .139 .446
(Tot)
Emotional
Self control
116 3.4130 .04152 .44717 .200 -.458 .225 -.188 .446
(Tot)
Transparency 116 3.5566 .04069 .43825 .192 -.705 .225 .678 .446
(Tot)
Adaptability 116 3.5545 .03762 .40521 .164 -.405 .225 .449 .446
(Tot)
Achievement
orientation
116 3.6301 .04376 .47130 .222 -.509 .225 .094 .446
(Tot) Initiative 116 3.2271 .03700 .39853 .159 -.347 .225 .497 .446
(Tot)
Optimism 116 3.6298 .04282 .46119 .213 -.485 .225 -.170 .446
(Tot)
Empathy 116 3.6314 .04169 .44902 .202 -.619 .225 .442 .446

253
N Mean Std.
DeviationVariance Skewness Kurtosis
Statistic Statistic Std.
Error Statistic Statistic Statistic
Std. Error
StatisticStd.
Error
(Tot) An
organisational
awareness
116 3.5596 .03751 .40403 .163 -.482 .225 .240 .446
(Tot) Service
orientation 116 3.9459 .04532 .48806 .238 -.410 .225 -.079 .446
(Tot)
Developing
others
116 3.6775 .04749 .51144 .262 -.512 .225 .495 .446
(Tot)
Inspirational
leadership
116 3.5629 .04717 .50803 .258 -.542 .225 .755 .446
(Tot) Change
catalyst 116 3.3186 .04064 .43766 .192 -.480 .225 .093 .446
(Tot)
Influence 116 3.5289 .03921 .42229 .178 -.655 .225 1.097 .446
(Tot) Conflict
management 116 3.2358 .03309 .35637 .127 -.394 .225 .676 .446
(Tot)
Teamwork
and
collaboration
116 3.6658 .04133 .44512 .198 -.743 .225 1.409 .446

254
Table E6: Descriptive Statistics for OCP Questionnaires filled in by the Technical Service Officer
N Mean Std.
DeviationVariance Skewness Kurtosis
Statistic Statistic Std.
Error Statistic Statistic Statistic
Std. Error
StatisticStd.
Error
(TSO)
Performance
orientation
118 3.8623 .06060 .65828 .433 -.352 .223 -.357 .442
(TSO) Social
responsibility 118 3.7013 .06035 .65556 .430 -.357 .223 .169 .442
(TSO)
Supportiveness 118 3.8284 .05793 .62932 .396 -.215 .223 -.523 .442
(TSO) Emphasis
on rewards 118 3.5869 .06250 .67888 .461 -.013 .223 -.130 .442
(TSO) Stability 118 3.6780 .05492 .59656 .356 -.527 .223 .616 .442
(TSO)
Competitiveness 118 3.8284 .06409 .69622 .485 -.550 .223 .184 .442
(TSO)
Innovation 118 3.3962 .06050 .65725 .432 -.005 .223 .512 .442

255
Table E7: Descriptive Statistics for OCP Questionnaire filled in by the Field Services Area Manager
N Mean Std.
DeviationVariance Skewness Kurtosis
Statistic Statistic Std.
Error Statistic Statistic Statistic
Std. Error
StatisticStd.
Error
(FSAM)
Performance
orientation
113 3.5177 .07534 .80089 .641 -.261 .227 .238 .451
(FSAM) Social
responsibility 113 3.3982 .06368 .67698 .458 .063 .227 .219 .451
(FSAM)
Supportiveness 113 3.4137 .06197 .65871 .434 -.353 .227 .151 .451
(FSAM)
Emphasis on
rewards
113 3.3341 .05809 .61746 .381 .238 .227 1.189 .451
(FSAM) Stability 113 3.3938 .06553 .69662 .485 -.254 .227 .336 .451
(FSAM)
Competitiveness 113 3.4248 .07282 .77408 .599 -.130 .227 -.162 .451
(FSAM)
Innovation 113 3.1814 .06389 .67913 .461 -.115 .227 -.466 .451
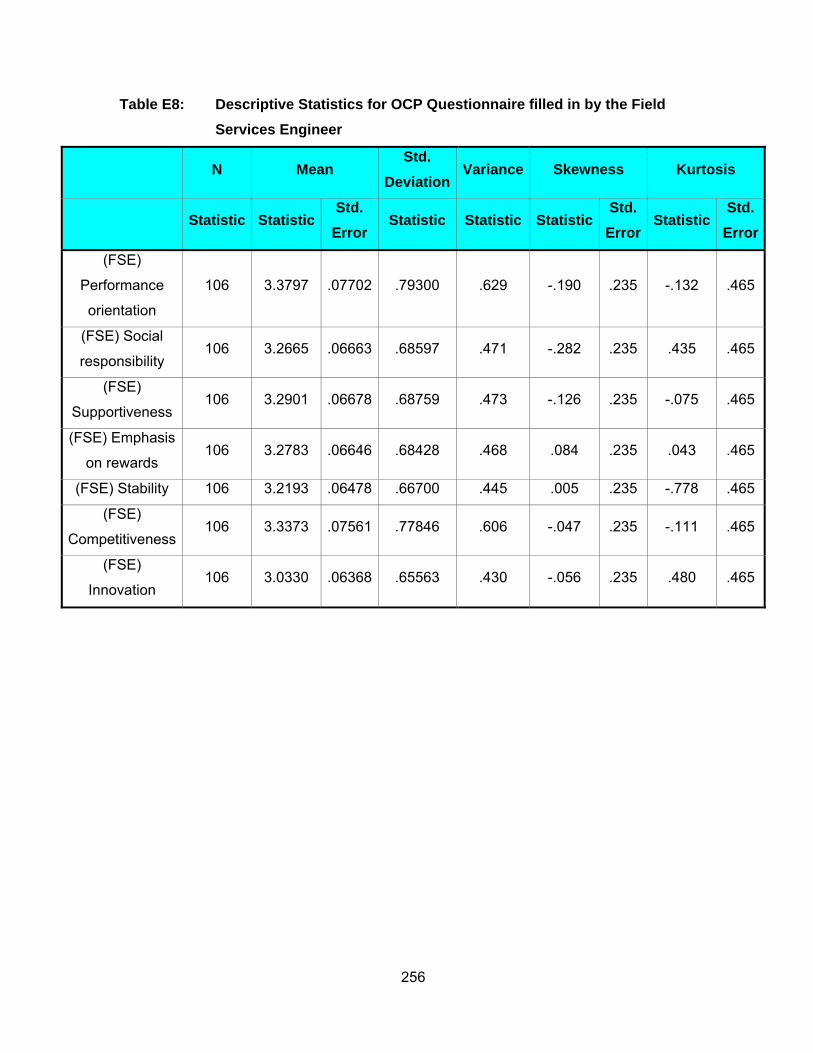
256
Table E8: Descriptive Statistics for OCP Questionnaire filled in by the Field Services Engineer
N Mean Std.
DeviationVariance Skewness Kurtosis
Statistic Statistic Std.
Error Statistic Statistic Statistic
Std. Error
StatisticStd.
Error
(FSE)
Performance
orientation
106 3.3797 .07702 .79300 .629 -.190 .235 -.132 .465
(FSE) Social
responsibility 106 3.2665 .06663 .68597 .471 -.282 .235 .435 .465
(FSE)
Supportiveness 106 3.2901 .06678 .68759 .473 -.126 .235 -.075 .465
(FSE) Emphasis
on rewards 106 3.2783 .06646 .68428 .468 .084 .235 .043 .465
(FSE) Stability 106 3.2193 .06478 .66700 .445 .005 .235 -.778 .465
(FSE)
Competitiveness 106 3.3373 .07561 .77846 .606 -.047 .235 -.111 .465
(FSE)
Innovation 106 3.0330 .06368 .65563 .430 -.056 .235 .480 .465

257
Table E9: Descriptive Statistics for OCP Questionnaire filled in by the Staff
N Mean Std.
Deviation Variance Skewness Kurtosis
Statistic Statistic Std.
Error Statistic Statistic Statistic Std.
Error StatisticStd.
Error
(Staff)
Performance
orientation
118 3.7123 .05314 .57726 .333 -.679 .223 .937 .442
(Staff) Social
responsibility 118 3.5725 .05067 .55042 .303 -.355 .223 -.058 .442
(Staff)
Supportiveness 118 3.5344 .05289 .57457 .330 -.357 .223 -.095 .442
(Staff) Emphasis
on rewards 118 3.2633 .05111 .55515 .308 -.183 .223 -.576 .442
(Staff) Stability 118 3.3686 .04716 .51228 .262 -.340 .223 -.041 .442
(Staff)
Competitiveness 118 3.5684 .04717 .51239 .263 -.103 .223 -.421 .442
(Staff)
Innovation 118 3.2424 .04321 .46935 .220 -.070 .223 -.247 .442

258
Table E10: Descriptive Statistics for OCP Questionnaire filled in by Total (FSAM, FSE, TSO, Staff)
N Mean Std.
DeviationVariance Skewness Kurtosis
Statistic Statistic Std.
Error Statistic Statistic Statistic
Std. Error
StatisticStd.
Error
(Tot)
Performance
orientation
116 3.5796 .04620 .49757 .248 -.108 .225 -.383 .446
(Tot) Social
responsibility 116 3.4442 .04390 .47278 .224 -.150 .225 -.476 .446
(Tot)
Supportiveness 116 3.4755 .04066 .43792 .192 -.331 .225 -.308 .446
(Tot) Emphasis
on rewards 116 3.3219 .04051 .43629 .190 -.107 .225 -.339 .446
(Tot) Stability 116 3.3748 .04043 .43540 .190 -.432 .225 .016 .446
(Tot)
Competitiveness 116 3.5015 .04607 .49620 .246 .051 .225 -.498 .446
(Tot) Innovation 116 3.1828 .03949 .42537 .181 -.312 .225 -.185 .446
Table E11: Descriptive Statistics for TSO’s Performance appraisal
N Mean Std.
Deviation Variance Skewness Kurtosis
Statistic Statistic Std.
Error Statistic Statistic Statistic Std.
Error StatisticStd.
Error
TSO’s
performance
evaluation
for 2005
117 3.6828 .03177 .34369 .118 -.125 .224 .078 .444

259
12 APPENDIX F: DETAILS REGARDING MODERATOR VARIABLES
Section F1: Descriptive statistics for the moderator variables
After reviewing the Technical Service Centre data list, it was found that the sample
population was reduced to 148 TSCs as the Central region did not participate in the TSC
competition and therefore had to be excluded from the study sample. Of the 148 TSCs, 125
TSCs were visited and 118 TSCs had provided adequate data to be included in the analysis.
Table F1 shows the age profile of the TSOs sampled, the frequency per age category, and
the percentage contribution per age category and the cumulative percentages per age
category. Of the 118 TSOs, 105 or 87.29% of the TSOs fall in the age categories 31 to 50
years old. This is an indication that the TSOs are fairly mature.
Table F1: Age of TSO
Frequency Percent Valid Percent Cumulative Percent
Valid
26 to 30 yrs 4 3.4 3.4 3.4
31 to 35 yrs 15 12.7 12.7 16.1
36 to 40 yrs 29 24.6 24.6 40.7
41 to 45 yrs 34 28.8 28.8 69.5
46 to 50 yrs 25 21.2 21.2 90.7
51 to 55 yrs 10 8.5 8.5 99.2
56 to 60 yrs 1 .8 .8 100.0
Total 118 100.0 100.0
Table F2 below shows the gender profile of the TSOs. Of the 118 TSOs employed 116 are
male and only 2 females are employed.
Table F2: TSO Gender
Frequency Percent Valid Percent Cumulative Percent
Valid
Male 116 98.3 98.3 98.3
Female 2 1.7 1.7 100.0
Total 118 100.0 100.0

260
Table F3 below shows the racial breakdown of the TSOs. Of the 118 TSOs employed, 47 or
39.8% are Black and 56 or 47.5% are White, 10 or 8.5% are Coloured, 4 or 3.4% are Asian
while 1 or 0.8% represent other.
Table F3: TSO race
Frequency Percent Valid Percent Cumulative Percent
Valid
Black 47 39.8 39.8 39.8
White 56 47.5 47.5 87.3
Coloured 10 8.5 8.5 95.8
Asian 4 3.4 3.4 99.2
Other 1 .8 .8 100.0
Total 118 100.0 100.0
Table F4 below elucidates the technical qualifications of the TSOs. Of the 118 TSOs
sampled 114 or 96.4% have an N3 or higher qualification.
Table F4: TSO Qualifications
Frequency Percent Valid Percent Cumulative Percent
Valid
N2 4 3.4 3.4 3.4
N3 55 46.6 46.6 50.0
N4 26 22.0 22.0 72.0
N5 18 15.3 15.3 87.3
N6 7 5.9 5.9 93.2
BTECH 6 5.1 5.1 98.3
Other 2 1.7 1.7 100.0
Total 118 100.0 100.0
Table F5 elucidates the number of years the TSO have been appointed in the position as
TSO. More than 75% of the total sample has been in the TSO position for more than 3 years
and more the 54.2% have been in the position for more than 6 years.

261
Table F5: Years in TSO position
Frequency Percent Valid
Percent Cumulative
Percent
Valid
Less than 1 yr 5 4.2 4.2 4.2
1 to 2 yrs 10 8.5 8.5 12.7
2 to 3 yrs 12 10.2 10.2 22.9
3 to 4 yrs 13 11.0 11.0 33.9
4 to 5 yrs 14 11.9 11.9 45.8
Greater than 6 yrs 64 54.2 54.2 100.0
Total 118 100.0 100.0
Table F6 elucidates the number of years the TSOs have worked for the organisation. It is
clear that 105 or 89% of the TSOs have been working in the organisation for more than 6
years and it can be assumed that they have been socialised in the organisational way.
Table F6: Number of years employed by the organisation
Frequency PercentValid
Percent Cumulative
Percent
Valid
Less than 1 yr 1 .8 .8 .8
3 to 4 yrs 1 .8 .8 1.7
4 to 5 yrs 4 3.4 3.4 5.1
5 to 6 yrs 7 5.9 5.9 11.0
Greater than 6 yrs 105 89.0 89.0 100.0
Total 118 100.0 100.0
Table F7 and Figure F7 show the numbers of employees that report to the TSO directly. Of
the 118 TSCs sampled more than 90% of them have more than 16 employees reporting to
them.

262
Table F7: Number of employees
Frequency Percent Valid Percent Cumulative Percent
Valid
11 to 15 people 10 8.5 8.5 8.5
16 to 20 people 26 22.0 22.0 30.5
21 to 25 people 25 21.2 21.2 51.7
26 to 30 people 22 18.6 18.6 70.3
Greater than 30
people 35 29.7 29.7 100.0
Total 118 100.0 100.0
Table F8 shows the number of year the TSCs have been in existence for. Of the 118 TSCs,
115 have existed for more than 6 years.
Table F8: Number of year that the TSC has been in existence
Frequency Percent Valid
Percent Cumulative
Percent
Valid
3 to 4 yrs 1 .8 .8 .8
4 to 5 yrs 2 1.7 1.7 2.5
Greater
than 6 yrs 115 97.5 97.5 100.0
Total 118 100.0 100.0

263
Section F2: Excluded moderator variables
Table F9, TSO gender and Table F10, number of years the TSO has been employed by the
organisation have both being excluded from the analysis due to the uneven distribution of
male and female respondents. TSOs have work for the organisation for more than 6 years.
Table F9: TSO Gender
Frequency Percent Valid Percent
Valid
Male 114 96.6 98.3
Female 2 1.7 1.7
Total 116 98.3 100.0
Missing
0 1 .8
5 1 .8
Total 2 1.7
Total 118 100.0
Table F10: Number of years employed by the organisation
Frequency Percent Valid Percent Cumulative Percent
Valid
Less than
1 yr 1 .8 .9 .9
3 to 4 yrs 1 .8 .9 1.7
4 to 5 yrs 4 3.4 3.4 5.1
5 to 6 yrs 6 5.1 5.1 10.3
Greater
than 6 yrs 105 89.0 89.7 100.0
Total 117 99.2 100.0
Missing .00 1 .8
Total 118 100.0

264
Section F3: Moderator variables Recategorised
One common situation faced by researchers is the presence of nonmetric independent
variables. There are two forms of dummy variable coding, the most common being indicator
coding, in which the category is represented by either 0 or 1. The regression coefficient for
the dummy variable represent differences between means for each group of respondents
formed by a dummy variable from the reference category on the dependent variable.
The moderator variables presented above have been recategorised into dummy variables (0
and 1) so that they can be used in the t-Test and in the linear regression that follow below.
Table F11 which represents the age of the TSOs is recoded into two groups with assumed
equal variance i.e.
0 = TSO less than 41 years
1 = TSO greater than and equal to 41 years
Table F11: (R) Age of TSO
Frequency Percent Valid Percent
Valid
Less
than 41
yrs
48 40.7 41.0
41 yrs or
greater 69 58.5 59.0
Total 117 99.2 100.0
Missing 0 1 .8
Total 118 100.0
TSO race had to be recoded into only two groups i.e.
0 = Black
1 = White
Note the other race groups (Asian=4, Coloured=10 and other=1) as in Table F12 have been
removed from the analysis as there too few to be considered in the analysis.

265
Table F12: (R) TSO race
TSO qualifications have been recoded into two groups (Table F13)
0 = TSO with an N3 and less
1 = TSO with an N4 or greater
Table F13: (R) TSO qualifications
Frequency Percent Valid Percent
Valid
N3 or less 58 49.2 50.4
N4 or more 57 48.3 49.6
Total 115 97.5 100.0
Missing
0 1 .8
Other 2 1.7
Total 3 2.5
Total 118 100.0
The number of years that the TSO has worked in this position is also recoded into a
dichotomous variable with (Table F14)
0 = TSO in the position for less than 5 years
1 = TSO in the position greater than and equal to 5 years
Frequency Percent Valid Percent
Valid
Black 45 38.1 44.6
White 56 47.5 55.4
Total 101 85.6 100.0
Missing
0 2 1.7
Coloured 10 8.5
Asian 4 3.4
Other 1 .8
Total 17 14.4
Total 118 100.0

266
Table F14: (R) Years in TSO position
Frequency Percent Valid Percent
Valid
1 to 5 years 53 44.9 45.3
Greater than 6 yrs 64 54.2 54.7
Total 117 99.2 100.0
Missing 0 1 0.8
Total 118 100.0
Table F15 shows the recoded dichotomous groups for the number of employees reporting to
the TSO.
0 = less than 25 employees
1 = greater than and equal to 25 employees
Table F15: (R) Nunber of employees
Frequency Percent Valid Percent
Valid
25 people or less 61 51.7 52.1
Greater than 25 people 56 47.5 47.9
Total 117 99.2 100.0
Missing 0 1 0.8
Total 118 100.0

267
13 APPENDIX G: MODERATOR VARIABLES APPLIED TO ECI, OCP AND ORGANISATIONAL PERFORMANCE USING T-TEST
1.1 Testing (t-Test): Moderator variable on ECI
Figure G1: Moderator variable effects on ECI
A t-Test is appropriate when your analysis involves a single predictor variable that is
measured on a nominal scale and assumes only two values, and a single criterion variable
that is measured on an interval or ratio scale. This is usually viewed as a test of group
differences.
1.1.1 (R) – Age of the TSO
You can state the null hypothesis in this section of the study as follows: “In this population,
there is no difference between the TSO age group less than 41 years and the TSO age
group greater than and equal to 41 years with respect to their mean scores on the ECI
variables”. Symbolically, the null hypothesis can be represented in this way:
H0: M1=M2
M1 = mean ECI score for the population of TSO’s on the less than 41 year age group
M2 = mean ECI score for the population of TSO’s on the greater than and equal to 41 year
age group
1.1.1.1 Group statistics
Table G1 summarises the descriptive statistics for the two age groups of the TSO with the 18
ECI dependent variables. For example, the mean emotional self awareness score for the
TSO age group less than 41 years is 3.5425 with a standard deviation of 0.4104. The mean
Moderator Variables
ECI
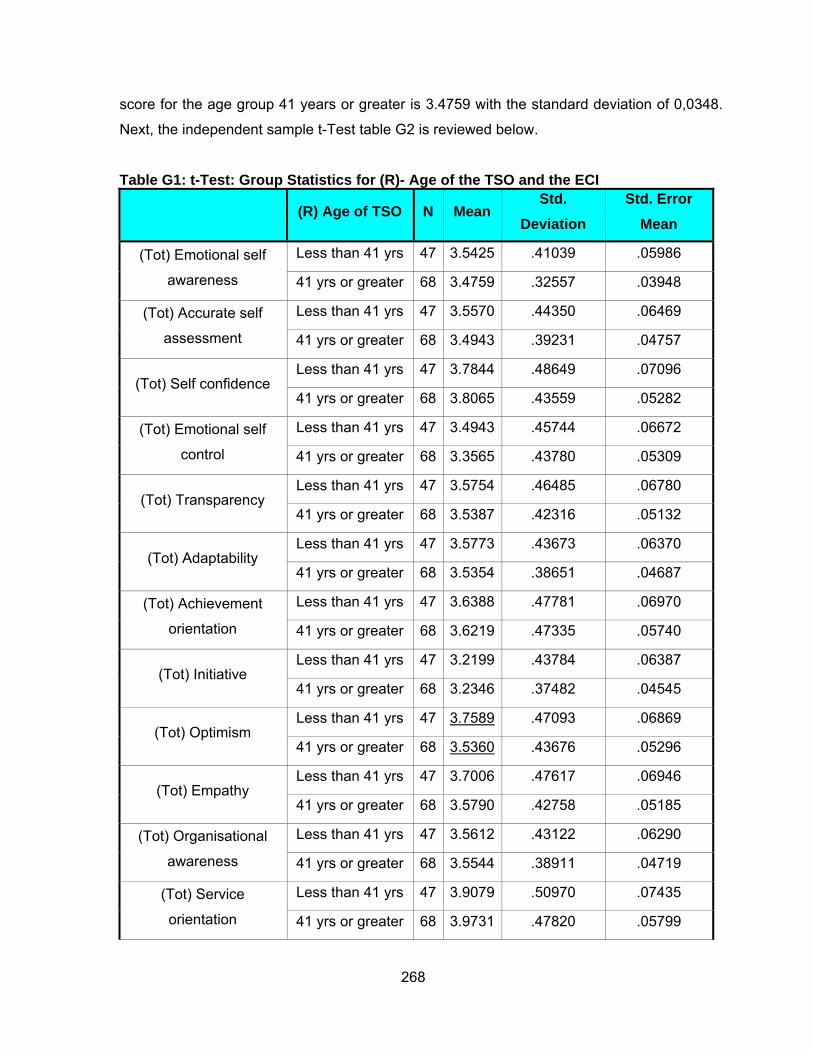
268
score for the age group 41 years or greater is 3.4759 with the standard deviation of 0,0348.
Next, the independent sample t-Test table G2 is reviewed below.
Table G1: t-Test: Group Statistics for (R)- Age of the TSO and the ECI
(R) Age of TSO N Mean Std.
Deviation Std. Error
Mean
(Tot) Emotional self
awareness
Less than 41 yrs 47 3.5425 .41039 .05986
41 yrs or greater 68 3.4759 .32557 .03948
(Tot) Accurate self
assessment
Less than 41 yrs 47 3.5570 .44350 .06469
41 yrs or greater 68 3.4943 .39231 .04757
(Tot) Self confidence Less than 41 yrs 47 3.7844 .48649 .07096
41 yrs or greater 68 3.8065 .43559 .05282
(Tot) Emotional self
control
Less than 41 yrs 47 3.4943 .45744 .06672
41 yrs or greater 68 3.3565 .43780 .05309
(Tot) Transparency Less than 41 yrs 47 3.5754 .46485 .06780
41 yrs or greater 68 3.5387 .42316 .05132
(Tot) Adaptability Less than 41 yrs 47 3.5773 .43673 .06370
41 yrs or greater 68 3.5354 .38651 .04687
(Tot) Achievement
orientation
Less than 41 yrs 47 3.6388 .47781 .06970
41 yrs or greater 68 3.6219 .47335 .05740
(Tot) Initiative Less than 41 yrs 47 3.2199 .43784 .06387
41 yrs or greater 68 3.2346 .37482 .04545
(Tot) Optimism Less than 41 yrs 47 3.7589 .47093 .06869
41 yrs or greater 68 3.5360 .43676 .05296
(Tot) Empathy Less than 41 yrs 47 3.7006 .47617 .06946
41 yrs or greater 68 3.5790 .42758 .05185
(Tot) Organisational
awareness
Less than 41 yrs 47 3.5612 .43122 .06290
41 yrs or greater 68 3.5544 .38911 .04719
(Tot) Service
orientation
Less than 41 yrs 47 3.9079 .50970 .07435
41 yrs or greater 68 3.9731 .47820 .05799

269
(R) Age of TSO N Mean Std.
Deviation Std. Error
Mean
(Tot) Developing others Less than 41 yrs 47 3.7079 .53552 .07811
41 yrs or greater 68 3.6526 .49975 .06060
(Tot) Inspirational
leadership
Less than 41 yrs 47 3.6107 .55965 .08163
41 yrs or greater 68 3.5287 .47442 .05753
(Tot) Change catalyst Less than 41 yrs 47 3.4344 .43360 .06325
41 yrs or greater 68 3.2322 .42419 .05144
(Tot) Influence Less than 41 yrs 47 3.5483 .45669 .06661
41 yrs or greater 68 3.5085 .39862 .04834
(Tot) Conflict
management
Less than 41 yrs 47 3.2210 .40780 .05948
41 yrs or greater 68 3.2422 .32027 .03884
(Tot) Teamwork and
collaboration
Less than 41 yrs 47 3.7066 .44727 .06524
41 yrs or greater 68 3.6318 .44504 .05397
1.1.1.2 Independent Samples Test (Equal variance assumed)
The output for the independent group t-Test in SPSS is somewhat confusing because there
are two versions of the independent samples t-Test. The one you should use depends on
whether the estimated variance for the two groups of scores are significantly different or not.
Reading the columns under the heading “Levene’s test of equality of variance” in Table G2 ,
if the probability value is statistically significant (p<0.05), then your variances are unequal.
Otherwise they are equal. Levene’s test of equality of variance in this case tells us that the
variances between the two TSO age group are not all equal (p>0.05). Reviewing the 2-tailed
significance for the TSO optimism (p=0.010) and change catalyst (p=0.014) you are able to
reject the null hypothesis of no population difference for the above two dimensions of ECI.
For the remaining ECI dimensions we accept the null hypothesis of equal variance.

270
Table G2: Independent Samples Test for Age of the TSO and ECI
Levene's Test for
Equality of Variances t-test for Equality of Means
F Sig. t df
Sig. (2-
tailed) Mean
Difference Std. Error Difference
95% Confidence
Interval of the Difference
Lower Upper
(Tot)
Emotional self
awareness.
1.654 .201 .969 113 .335 .06664 .06876 -
.06960 .20287
(Tot) Accurate
self
assessment.
.942 .334 .799 113 .426 .06270 .07852 -
.09285 .21826
(Tot) Self
confidence. .388 .535 -.255 113 .799 -.02211 .08669
-
.19385 .14963
(Tot)
Emotional self
control.
.019 .890 1.629 113 .106 .13782 .08458 -
.02975 .30539
(Tot)
Transparency. .763 .384 .439 113 .662 .03668 .08358
-
.12891 .20226
(Tot)
Adaptability. .449 .504 .541 113 .589 .04186 .07734
-
.11135 .19508
(Tot)
Achievement
orientation
.618 .433 .187 113 .852 .01685 .09014 -
.16173 .19542
(Tot) Initiative. .411 .523 -.192 113 .848 -.01463 .07619
-
.16558 .13632
(Tot)
Optimism. .473 .493 2.605 113 .010 .22287 .08555 .05339 .39235
(Tot) .322 .572 1.432 113 .155 .12165 .08498 - .29001

271
Levene's Test for
Equality of Variances t-test for Equality of Means
F Sig. t df
Sig. (2-
tailed) Mean
Difference Std. Error Difference
95% Confidence
Interval of the Difference
Lower Upper
Empathy. .04671
(Tot)
Organisational
awareness.
.009 .923 .089 113 .930 .00683 .07716 -
.14604 .15970
(Tot) Service
orientation. 1.167 .282 -.700 113 .485 -.06523 .09319
-
.24986 .11939
(Tot)
Developing
others.
.067 .796 .566 113 .572 .05528 .09762 -
.13812 .24868
(Tot)
Inspirational
leadership.
2.152 .145 .846 113 .399 .08202 .09690 -
.10996 .27399
(Tot) Change
Catalyst. .003 .954 2.490 113 .014 .20219 .08120 .04133 .36306
(Tot)
Influence. .671 .414 .496 113 .621 .03980 .08028
-
.11925 .19885
(Tot) Conflict
management. 2.142 .146 -.312 113 .755 -.02123 .06800
-
.15596 .11349
(Tot)
Teamwork
and
collaboration.
.241 .625 .885 113 .378 .07488 .08459 -
.09271 .24248
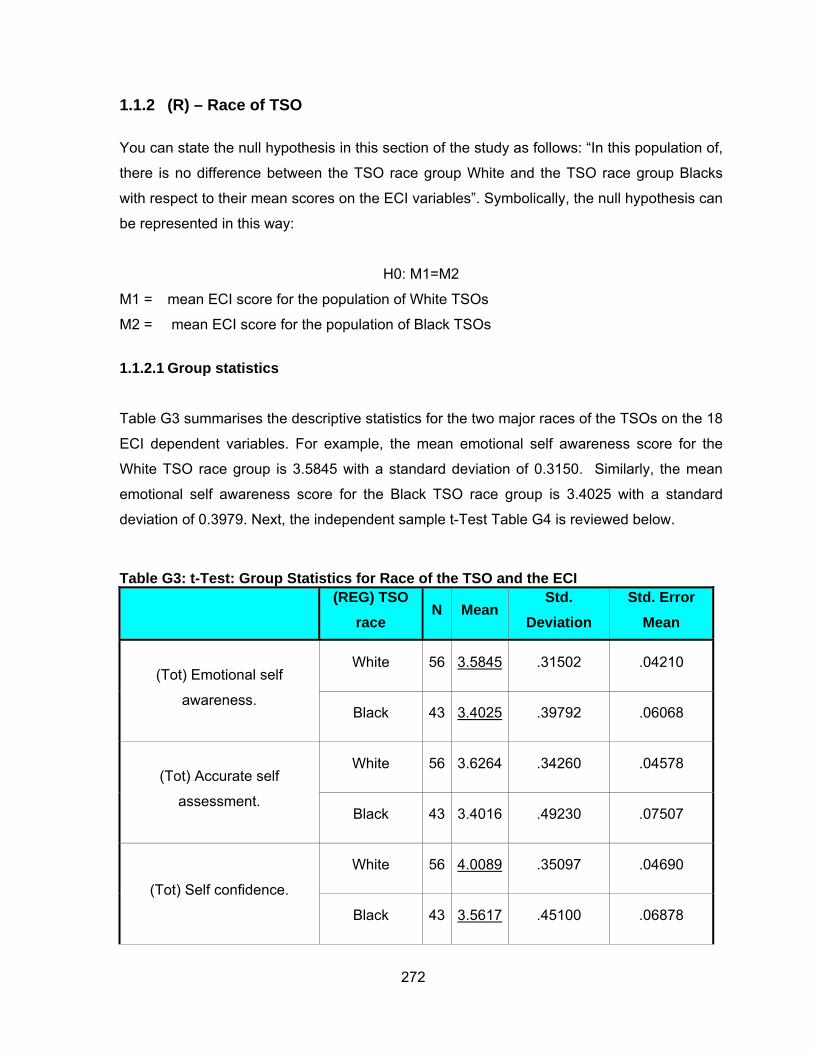
272
1.1.2 (R) – Race of TSO
You can state the null hypothesis in this section of the study as follows: “In this population of,
there is no difference between the TSO race group White and the TSO race group Blacks
with respect to their mean scores on the ECI variables”. Symbolically, the null hypothesis can
be represented in this way:
H0: M1=M2
M1 = mean ECI score for the population of White TSOs
M2 = mean ECI score for the population of Black TSOs
1.1.2.1 Group statistics
Table G3 summarises the descriptive statistics for the two major races of the TSOs on the 18
ECI dependent variables. For example, the mean emotional self awareness score for the
White TSO race group is 3.5845 with a standard deviation of 0.3150. Similarly, the mean
emotional self awareness score for the Black TSO race group is 3.4025 with a standard
deviation of 0.3979. Next, the independent sample t-Test Table G4 is reviewed below.
Table G3: t-Test: Group Statistics for Race of the TSO and the ECI
(REG) TSO
race N Mean
Std. Deviation
Std. Error Mean
(Tot) Emotional self
awareness.
White 56 3.5845 .31502 .04210
Black 43 3.4025 .39792 .06068
(Tot) Accurate self
assessment.
White 56 3.6264 .34260 .04578
Black 43 3.4016 .49230 .07507
(Tot) Self confidence.
White 56 4.0089 .35097 .04690
Black 43 3.5617 .45100 .06878

273
(REG) TSO
race N Mean
Std. Deviation
Std. Error Mean
(Tot) Emotional self control.
White 56 3.4591 .42839 .05725
Black 43 3.3761 .49389 .07532
(Tot) Transparency.
White 56 3.7336 .29913 .03997
Black 43 3.3582 .48955 .07466
(Tot) Adaptability.
White 56 3.6923 .33029 .04414
Black 43 3.3961 .42004 .06406
(Tot) Achievement
orientation.
White 56 3.8211 .35609 .04758
Black 43 3.3766 .47243 .07205
(Tot) Initiative.
White 56 3.3711 .31562 .04218
Black 43 3.0471 .38435 .05861
(Tot) Optimism.
White 56 3.6818 .44526 .05950
Black 43 3.5462 .48862 .07451
(Tot) Empathy.
White 56 3.6829 .41419 .05535
Black 43 3.5302 .49495 .07548
(Tot) Organisational White 56 3.6538 .35425 .04734

274
(REG) TSO
race N Mean
Std. Deviation
Std. Error Mean
awareness. Black 43 3.4418 .44194 .06740
(Tot) Service orientation.
White 56 4.1725 .37355 .04992
Black 43 3.6809 .50944 .07769
(Tot) Developing others.
White 56 3.8391 .44735 .05978
Black 43 3.4577 .51839 .07905
(Tot) Inspirational
leadership.
White 56 3.7279 .41629 .05563
Black 43 3.3626 .54030 .08239
(Tot) Change Catalyst.
White 56 3.3479 .43081 .05757
Black 43 3.2420 .45592 .06953
(Tot) Influence.
White 56 3.6584 .33348 .04456
Black 43 3.3482 .45822 .06988
(Tot) Conflict management.
White 56 3.3263 .30147 .04029
Black 43 3.0920 .38818 .05920
(Tot) Teamwork and
collaboration.
White 56 3.7914 .35614 .04759
Black 43 3.5147 .52012 .07932

275
1.1.2.2 Independent Samples Test
Reading the columns under the heading “Levene’s test of equality of variance” in Table G4, if
the probability value is statistically significant (p<0.05), then your variances are unequal.
Otherwise they are equal. Levene’s test of equality of variance in this case tells us that the
variances between the two race groups are not all equal (p>0.05). Of the 18 ECI dimensions
measured, on fourteen dimensions which are Emotional self-awareness (p=0.013), Accurate
self-assessment (p=0.009), Self-confidence (p=0.000), Transparency (p=0.000); Adaptability
(p=0.000), Achievement orientation (p=0.000), Initiative (p=0.000), Organisational awareness
(p=0.009), Service orientation (p=0.000), Developing others (p=0.000), Inspirational
Leadership (p=0.000), Influence (p=0.000), Conflict management (p=0.001) and Teamwork
and collaboration (p=0.002) have p-values for the 2-tailed significance that are highly
significant and therefore the variances are unequal. Remember, that, anytime you obtain a p-
value less than 0.05, one rejects the null hypothesis, because ones obtained p-value is so
small, one is able to reject the null hypothesis of no population difference in the above ECI
dimensions (Hatcher & Stepanski, 2001). You may therefore conclude that there is a
difference in ECI scores between the Black and White race groups for the dimensions
mentioned above.
Table G4: Independent Samples Test for Race of the TSO and ECI
Levene's Test for Equality of Variances t-Test for Equality of Means
F Sig. T df
Sig. (2-
tailed)
Mean Difference
Std. Error Difference
95% Confidence Interval of the
Difference
Lower Upper
(Tot) Emotional self
awareness.
Equal variances assumed
1.739 .190 2.540 97 .013 .18194 .07164 .03976 .32413
Equal variances
not 2.464 78.303 .016 .18194 .07385 .03492 .32897

276
Levene's Test for Equality of Variances t-Test for Equality of Means
F Sig. T df
Sig. (2-
tailed)
Mean Difference
Std. Error Difference
95% Confidence Interval of the
Difference
Lower Upper
assumed
(Tot) Accurate self
assessment.
Equal variances assumed
4.328 .040 2.678 97 .009 .22486 .08397 .05821 .39151
Equal variances
not assumed
2.557 71.496 .013 .22486 .08793 .04955 .40017
(Tot) Self confidence.
Equal variances assumed
1.238 .269 5.550 97 .000 .44718 .08057 .28727 .60710
Equal variances
not assumed
5.372 77.367 .000 .44718 .08325 .28143 .61294
(Tot) Emotional self
control.
Equal variances assumed
.853 .358 .894 97 .373 .08302 .09285 -.10125 .26729
Equal variances
not assumed
.878 83.311 .383 .08302 .09460 -.10513 .27117
(Tot) Transparency.
Equal variances assumed
11.507
.001 4.710 97 .000 .37539 .07970 .21721 .53358

277
Levene's Test for Equality of Variances t-Test for Equality of Means
F Sig. T df
Sig. (2-
tailed)
Mean Difference
Std. Error Difference
95% Confidence Interval of the
Difference
Lower Upper
Equal variances
not assumed
4.433 65.427 .000 .37539 .08468 .20629 .54450
(Tot) Adaptability.
Equal variances assumed
1.844 .178 3.929 97 .000 .29620 .07539 .14657 .44583
Equal variances
not assumed
3.808 77.934 .000 .29620 .07779 .14133 .45107
(Tot) Achievement Orientation.
Equal variances assumed
2.659 .106 5.340 97 .000 .44452 .08324 .27931 .60973
Equal variances
not assumed
5.148 75.643 .000 .44452 .08634 .27254 .61650
(Tot) Initiative. Equal variances assumed
.181 .671 4.603 97 .000 .32394 .07037 .18427 .46360
Equal variances
not assumed
4.486 80.312 .000 .32394 .07221 .18024 .46763

278
Levene's Test for Equality of Variances t-Test for Equality of Means
F Sig. T df
Sig. (2-
tailed)
Mean Difference
Std. Error Difference
95% Confidence Interval of the
Difference
Lower Upper
(Tot) Optimism.
Equal variances assumed
.451 .504 1.439 97 .153 .13555 .09419 -.05140 .32249
Equal variances
not assumed
1.421 85.951 .159 .13555 .09536 -.05402 .32511
(Tot) Empathy.
Equal variances assumed
1.046 .309 1.669 97 .098 .15264 .09143 -.02883 .33411
Equal variances
not assumed
1.631 81.351 .107 .15264 .09360 -.03357 .33886
(Tot) Organisational awareness
Equal variances assumed
.735 .393 2.649 97 .009 .21193 .08001 .05312 .37073
Equal variances
not assumed
2.573 78.985 .012 .21193 .08236 .04800 .37586
(Tot) Service orientation.
Equal variances assumed
4.924 .029 5.540 97 .000 .49159 .08873 .31549 .66769
Equal variances
5.323 74.182 .000 .49159 .09234 .30760 .67558

279
Levene's Test for Equality of Variances t-Test for Equality of Means
F Sig. T df
Sig. (2-
tailed)
Mean Difference
Std. Error Difference
95% Confidence Interval of the
Difference
Lower Upper
not assumed
(Tot) Developing
others.
Equal variances assumed
.254 .615 3.923 97 .000 .38137 .09721 .18845 .57430
Equal variances
not assumed
3.848 83.034 .000 .38137 .09911 .18425 .57850
(Tot) Inspirational leadership.
Equal variances assumed
2.029 .158 3.800 97 .000 .36524 .09611 .17450 .55598
Equal variances
not assumed
3.674 76.826 .000 .36524 .09942 .16727 .56321
(Tot) Change Catalyst.
Equal variances assumed
1.286 .260 1.181 97 .240 .10584 .08959 -.07197 .28366
Equal variances
not assumed
1.173 87.812 .244 .10584 .09027 -.07355 .28523
(Tot) Influence.
Equal variances assumed
3.270 .074 3.899 97 .000 .31021 .07956 .15230 .46812
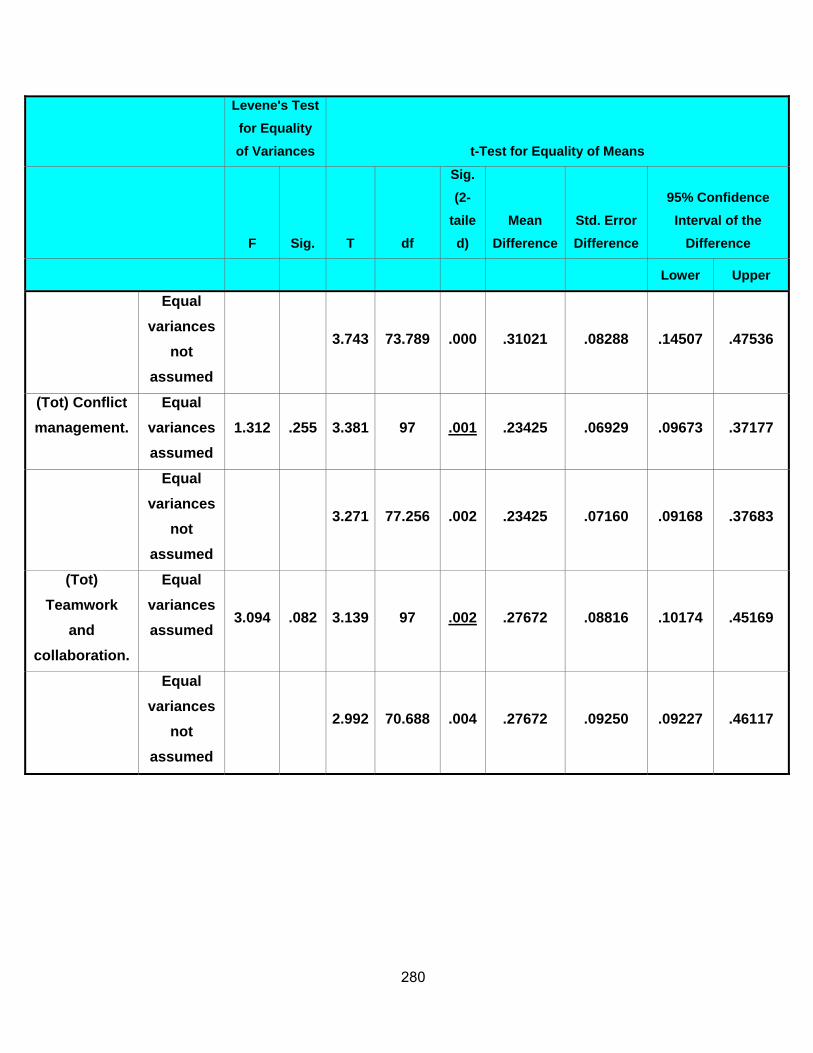
280
Levene's Test for Equality of Variances t-Test for Equality of Means
F Sig. T df
Sig. (2-
tailed)
Mean Difference
Std. Error Difference
95% Confidence Interval of the
Difference
Lower Upper
Equal variances
not assumed
3.743 73.789 .000 .31021 .08288 .14507 .47536
(Tot) Conflict management.
Equal variances assumed
1.312 .255 3.381 97 .001 .23425 .06929 .09673 .37177
Equal variances
not assumed
3.271 77.256 .002 .23425 .07160 .09168 .37683
(Tot) Teamwork
and collaboration.
Equal variances assumed
3.094 .082 3.139 97 .002 .27672 .08816 .10174 .45169
Equal variances
not assumed
2.992 70.688 .004 .27672 .09250 .09227 .46117

281
1.1.3 (R) TSO Qualifications
You can state the null hypothesis in this section of the study as follows: “In this population of,
there is no difference between the TSO educational qualification group with less than N3 and
the TSO qualification with greater than and equal to an N3 with respect to their mean scores
on the ECI variables”. Symbolically, the null hypothesis can be represented in this way:
H0: M1=M2
M1 = mean ECI score for the population of TSOs with educational qualifications less than
and N3
M2 = mean ECI score for the population of TSOs with educational qualifications greater
than and equal to N3
1.1.3.1 Group statistics
Table G5 summarises the descriptive statistics for the two major TSO educational
qualification groups on the 18 ECI dependent variables. For example, the mean emotional
self awareness score for the TSO educational group less than an N3 is 3.4619 with a
standard deviation of 0.04971. Similarly, the mean emotional self awareness score for the
TSO educational group greater than and equal to N3 is 3.5407 with a standard deviation of
0.34834. Next, we review the independent sample t-Test Table G6 below.
Table G5: t-Test: Group Statistics for Qualification of the TSO and the ECI
(R) TSO
qualifications N Mean
Std. Deviation
Std. Error Mean
(Tot) Emotional self
awareness.
N3 or less 58 3.4619 .37858 .04971
N4 or more 55 3.5407 .34834 .04697
(Tot) Accurate self
assessment.
N3 or less 58 3.5279 .42887 .05631
N4 or more 55 3.5010 .40256 .05428

282
(R) TSO
qualifications N Mean
Std. Deviation
Std. Error Mean
(Tot) Self confidence.
N3 or less 58 3.7636 .45212 .05937
N4 or more 55 3.8212 .46278 .06240
(Tot) Emotional self
control.
N3 or less 58 3.4097 .42933 .05637
N4 or more 55 3.3960 .46818 .06313
(Tot) Transparency.
N3 or less 58 3.5593 .40968 .05379
N4 or more 55 3.5375 .47554 .06412
(Tot) Adaptability.
N3 or less 58 3.5360 .42659 .05601
N4 or more 55 3.5628 .38828 .05236
(Tot) Achievement
orientation.
N3 or less 58 3.6045 .45770 .06010
N4 or more 55 3.6497 .49799 .06715
(Tot) Initiative.
N3 or less 58 3.2100 .40342 .05297
N4 or more 55 3.2550 .40197 .05420
(Tot) Optimism.
N3 or less 58 3.6409 .46545 .06112
N4 or more 55 3.6109 .46460 .06265
(Tot) Empathy. N3 or less 58 3.6036 .44755 .05877

283
(R) TSO
qualifications N Mean
Std. Deviation
Std. Error Mean
N4 or more 55 3.6445 .45118 .06084
(Tot) An organisational
awareness.
N3 or less 58 3.5414 .39698 .05213
N4 or more 55 3.5540 .40983 .05526
(Tot) Service orientation.
N3 or less 58 3.9328 .47697 .06263
N4 or more 55 3.9505 .51358 .06925
(Tot) Developing others.
N3 or less 58 3.6590 .54177 .07114
N4 or more 55 3.6775 .48924 .06597
(Tot) Inspirational
leadership.
N3 or less 58 3.5409 .53133 .06977
N4 or more 55 3.5755 .49771 .06711
(Tot) Change catalyst.
N3 or less 58 3.3347 .43567 .05721
N4 or more 55 3.2890 .44701 .06027
(Tot) Influence.
N3 or less 58 3.4753 .42023 .05518
N4 or more 55 3.5575 .41497 .05595
(Tot) Conflict
management.
N3 or less 58 3.1950 .33639 .04417
N4 or more 55 3.2712 .38135 .05142

284
(R) TSO
qualifications N Mean
Std. Deviation
Std. Error Mean
(Tot) Teamwork and
collaboration.
N3 or less 58 3.6529 .47928 .06293
N4 or more 55 3.6559 .40952 .05522
1.1.3.2. Independent Samples Test
Reading the columns under the heading “Levene’s test of equality of variance” in Table G6
below, if the probability value is statistically significant (p<0.05), then your variances are
unequal. Otherwise they are equal. Levene’s test of equality of variance in this case tells us
that the variances between the two TSO educational qualifications group are all equal
(p>0.05). We accept the null hypothesis of equal variance.
Table G6: Independent Samples Test for Qualification of the TSO and ECI
Levene's Test for Equality of Variances t-test for Equality of Means
F Sig. T df
Sig. (2-tailed)
Mean Difference
Std. Error Difference
95% Confidence Interval of the Difference
Lower Upper
(Tot) Emotional
self awareness. .855 .357 -1.150 111 .253 -.07880 .06854 -.21462 .05702
(Tot) Accurate
self assessment. .000 .990 .343 111 .732 .02689 .07835 -.12837 .18214
(Tot) Self
confidence. .265 .608 -.669 111 .505 -.05756 .08608 -.22813 .11300
(Tot) Emotional
self control. 1.211 .274 .161 111 .872 .01362 .08444 -.15370 .18095

285
Levene's Test for Equality of Variances t-test for Equality of Means
F Sig. T df
Sig. (2-tailed)
Mean Difference
Std. Error Difference
95% Confidence Interval of the Difference
Lower Upper
(Tot)
Transparency. 1.757 .188 .262 111 .794 .02183 .08337 -.14337 .18702
(Tot) Adaptability. .361 .549 -.348 111 .728 -.02675 .07687 -.17907 .12556
(Tot)
Achievement
orientation.
.725 .396 -.503 111 .616 -.04518 .08991 -.22335 .13298
(Tot) Initiative. .548 .461 -.594 111 .554 -.04503 .07579 -.19522 .10516
(Tot) Optimism. .674 .413 .343 111 .733 .02998 .08752 -.14345 .20342
(Tot) Empathy. .000 .994 -.484 111 .630 -.04091 .08457 -.20848 .12667
(Tot)
Organisational
awareness.
.133 .716 -.166 111 .869 -.01259 .07590 -.16299 .13781
(Tot) Service
orientation. .493 .484 -.191 111 .849 -.01777 .09319 -.20243 .16688
(Tot) Developing
others. .680 .411 -.191 111 .849 -.01853 .09728 -.21131 .17424
(Tot) Inspirational
leadership. .146 .703 -.357 111 .722 -.03464 .09698 -.22680 .15753
(Tot) Change
catalyst. .181 .671 .549 111 .584 .04562 .08304 -.11893 .21018
(Tot) Influence. .005 .946 -1.045 111 .298 -.08214 .07861 -.23791 .07363
(Tot) Conflict
management. .033 .855 -1.128 111 .262 -.07620 .06756 -.21007 .05768
(Tot) Teamwork
and collaboration. .490 .485 -.035 111 .972 -.00293 .08408 -.16953 .16367

286
1.1.4 (R) – Years in TSO position
You can state the null hypothesis in this section of the study as follows: “In this population of
TSOs, there is no difference between the years in the TSO position group less than 5 years
and the years in the TSO position group greater than and equal to an 5 years with respect to
their mean scores on the ECI variables”. Symbolically, the null hypothesis can be
represented in this way:
H0: M1=M2
M1 = mean ECI score for the population of years in the TSO position group less than 5
years
M2 = mean ECI score for the population of years in the TSO position greater than and
equal to 5 years
1.1.4.1 Group Statistics
Table G7 summarises the descriptive statistics for the years in the TSO position on the 18
ECI dependent variables. For example, the mean emotional self awareness score for less
than 5 years group is 3.4331 with a standard deviation of 0.5415. Similarly, the mean
emotional self awareness score for the greater than and equal to 5 year group is 3.5609 with
a standard deviation of 0.04151. Next, we review the independent sample t-Test Table G7
below.
Table G7: t-Test: Group Statistics for Years in TSO position and the ECI
(R) Yrs in TSO
position N Mean
Std. Deviation
Std. Error Mean
(Tot) Emotional self
awareness.
1 to 5 years 52 3.4331 .39045 .05415
Greater than 6 yrs 63 3.5609 .32951 .04151
(Tot) Accurate self
assessment.
1 to 5 years 52 3.4869 .47013 .06520
Greater than 6 yrs 63 3.5471 .36130 .04552

287
(R) Yrs in TSO
position N Mean
Std. Deviation
Std. Error Mean
(Tot) Self confidence.
1 to 5 years 52 3.7167 .48532 .06730
Greater than 6 yrs 63 3.8640 .42087 .05302
(Tot) Emotional self
control.
1 to 5 years 52 3.4175 .47066 .06527
Greater than 6 yrs 63 3.4089 .43433 .05472
(Tot) Transparency.
1 to 5 years 52 3.5023 .43597 .06046
Greater than 6 yrs 63 3.5961 .44050 .05550
(Tot) Adaptability.
1 to 5 yrs 52 3.4831 .45881 .06363
Greater than 6 yrs 63 3.6099 .35098 .04422
(Tot) Achievement
orientation.
1 to 5 yrs 52 3.5667 .50836 .07050
Greater than 6 yrs 63 3.6800 .43950 .05537
(Tot) Initiative.
1 to 5 yrs 52 3.1402 .41914 .05812
Greater than 6 yrs 63 3.3015 .37105 .04675
(Tot) Optimism.
1 to 5 yrs 52 3.6427 .47671 .06611
Greater than 6 yrs 63 3.6143 .45348 .05713
(Tot) Empathy. 1 to 5 yrs 52 3.6063 .47471 .06583

288
(R) Yrs in TSO
position N Mean
Std. Deviation
Std. Error Mean
Greater than 6 yrs 63 3.6471 .43162 .05438
(Tot) Organisational
awareness.
1 to 5 yrs 52 3.4883 .39972 .05543
Greater than 6 yrs 63 3.6141 .40360 .05085
(Tot) Service
orientation.
1 to 5 yrs 52 3.8675 .51377 .07125
Greater than 6 yrs 63 4.0116 .46380 .05843
(Tot) Developing
others.
1 to 5 yrs 52 3.5896 .57121 .07921
Greater than 6 yrs 63 3.7459 .45214 .05696
(Tot) Inspirational
leadership.
1 to 5 yrs 52 3.4756 .55837 .07743
Greater than 6 yrs 63 3.6337 .45899 .05783
(Tot) Change catalyst.
1 to 5 yrs 52 3.3273 .45021 .06243
Greater than 6 yrs 63 3.3046 .43047 .05423
(Tot) Influence.
1 to 5 yrs 52 3.4558 .46427 .06438
Greater than 6 yrs 63 3.5818 .37757 .04757
(Tot) Conflict
management.
1 to 5 yrs 52 3.1713 .38295 .05311
Greater than 6 yrs 63 3.2849 .32845 .04138
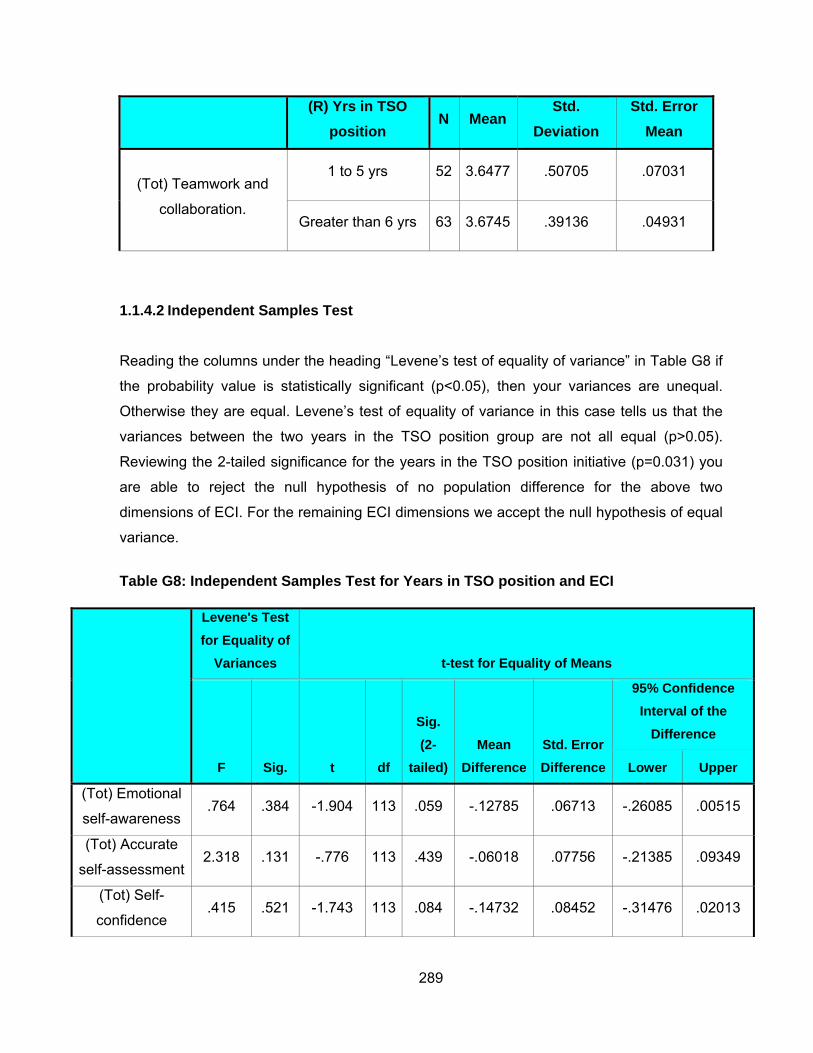
289
(R) Yrs in TSO
position N Mean
Std. Deviation
Std. Error Mean
(Tot) Teamwork and
collaboration.
1 to 5 yrs 52 3.6477 .50705 .07031
Greater than 6 yrs 63 3.6745 .39136 .04931
1.1.4.2 Independent Samples Test
Reading the columns under the heading “Levene’s test of equality of variance” in Table G8 if
the probability value is statistically significant (p<0.05), then your variances are unequal.
Otherwise they are equal. Levene’s test of equality of variance in this case tells us that the
variances between the two years in the TSO position group are not all equal (p>0.05).
Reviewing the 2-tailed significance for the years in the TSO position initiative (p=0.031) you
are able to reject the null hypothesis of no population difference for the above two
dimensions of ECI. For the remaining ECI dimensions we accept the null hypothesis of equal
variance.
Table G8: Independent Samples Test for Years in TSO position and ECI
Levene's Test for Equality of
Variances t-test for Equality of Means
F Sig. t df
Sig. (2-
tailed)Mean
DifferenceStd. Error Difference
95% Confidence Interval of the
Difference
Lower Upper
(Tot) Emotional
self-awareness .764 .384 -1.904 113 .059 -.12785 .06713 -.26085 .00515
(Tot) Accurate
self-assessment 2.318 .131 -.776 113 .439 -.06018 .07756 -.21385 .09349
(Tot) Self-
confidence .415 .521 -1.743 113 .084 -.14732 .08452 -.31476 .02013

290
Levene's Test for Equality of
Variances t-test for Equality of Means
F Sig. t df
Sig. (2-
tailed)Mean
DifferenceStd. Error Difference
95% Confidence Interval of the
Difference
Lower Upper
(Tot) Emotional
self-control .374 .542 .102 113 .919 .00858 .08452 -.15886 .17603
(Tot)
Transparency .236 .628 -1.141 113 .256 -.09375 .08215 -.25651 .06900
(Tot)
Adaptability 3.924 .050 -1.679 113 .096 -.12682 .07555 -.27649 .02286
(Tot)
Achievement
orientation
.547 .461 -1.282 113 .203 -.11330 .08840 -.28844 .06184
(Tot) Initiative .567 .453 -2.188 113 .031 -.16134 .07372 -.30740 -.01528
(Tot) Optimism .003 .955 .327 113 .744 .02843 .08695 -.14384 .20071
(Tot) Empathy .028 .866 -.482 113 .631 -.04078 .08461 -.20841 .12684
(Tot)
Organisational
awareness
.832 .364 -1.671 113 .097 -.12583 .07529 -.27500 .02333
(Tot) Service
orientation .548 .461 -1.579 113 .117 -.14407 .09124 -.32484 .03669
(Tot)
Developing
others
1.744 .189 -1.638 113 .104 -.15630 .09543 -.34536 .03276
(Tot)
Inspirational
leadership
1.464 .229 -1.667 113 .098 -.15811 .09485 -.34604 .02981
(Tot) Change
catalyst .044 .833 .276 113 .783 .02276 .08234 -.14038 .18589
(Tot) Influence 1.361 .246 -1.605 113 .111 -.12600 .07849 -.28151 .02950

291
Levene's Test for Equality of
Variances t-test for Equality of Means
F Sig. t df
Sig. (2-
tailed)Mean
DifferenceStd. Error Difference
95% Confidence Interval of the
Difference
Lower Upper
(Tot) Conflict
management 1.236 .269 -1.711 113 .090 -.11351 .06634 -.24494 .01793
(Tot) Teamwork
and
collaboration
3.156 .078 -.320 113 .750 -.02679 .08380 -.19282 .13924
1.1.5 (R) – Number of employees reporting to the TSO
You can state the null hypothesis in this section of the study as follows: “In this population,
there is no difference between the number of employees reporting to the TSO group less
than 25 and number employees of reporting to the TSO group greater than and equal to 25
with respect to their mean scores on the ECI variables”. Symbolically, the null hypothesis can
be represented in this way:
H0: M1=M2
M1 = mean ECI score for the population of the number of people reporting to the TSO
group less than 25
M2 = mean ECI score for the population of the number of people reporting to the TSO
group greater than and equal to 25
1.1.5.1 Group Statistics
Table G9 summarises the descriptive statistics for the years in the TSO position on the 18
ECI dependent variables. For example, the mean emotional self awareness score for less
than 25 employee group is 3.5451 with a standard deviation of 0.33592. Similarly, the mean
emotional self awareness score for the greater than and equal to 5 year group is 3.4589 with
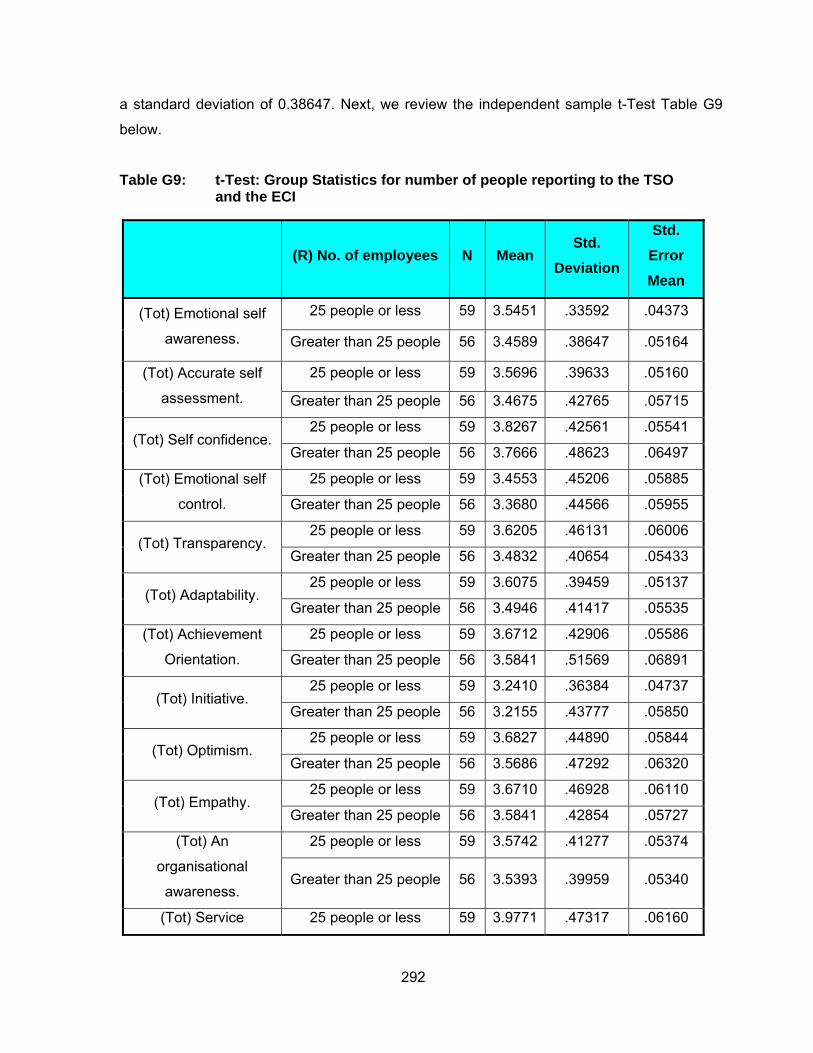
292
a standard deviation of 0.38647. Next, we review the independent sample t-Test Table G9
below.
Table G9: t-Test: Group Statistics for number of people reporting to the TSO and the ECI
(R) No. of employees N Mean Std.
Deviation
Std. Error Mean
(Tot) Emotional self
awareness.
25 people or less 59 3.5451 .33592 .04373
Greater than 25 people 56 3.4589 .38647 .05164
(Tot) Accurate self
assessment.
25 people or less 59 3.5696 .39633 .05160
Greater than 25 people 56 3.4675 .42765 .05715
(Tot) Self confidence. 25 people or less 59 3.8267 .42561 .05541
Greater than 25 people 56 3.7666 .48623 .06497
(Tot) Emotional self
control.
25 people or less 59 3.4553 .45206 .05885
Greater than 25 people 56 3.3680 .44566 .05955
(Tot) Transparency. 25 people or less 59 3.6205 .46131 .06006
Greater than 25 people 56 3.4832 .40654 .05433
(Tot) Adaptability. 25 people or less 59 3.6075 .39459 .05137
Greater than 25 people 56 3.4946 .41417 .05535
(Tot) Achievement
Orientation.
25 people or less 59 3.6712 .42906 .05586
Greater than 25 people 56 3.5841 .51569 .06891
(Tot) Initiative. 25 people or less 59 3.2410 .36384 .04737
Greater than 25 people 56 3.2155 .43777 .05850
(Tot) Optimism. 25 people or less 59 3.6827 .44890 .05844
Greater than 25 people 56 3.5686 .47292 .06320
(Tot) Empathy. 25 people or less 59 3.6710 .46928 .06110
Greater than 25 people 56 3.5841 .42854 .05727
(Tot) An
organisational
awareness.
25 people or less 59 3.5742 .41277 .05374
Greater than 25 people 56 3.5393 .39959 .05340
(Tot) Service 25 people or less 59 3.9771 .47317 .06160
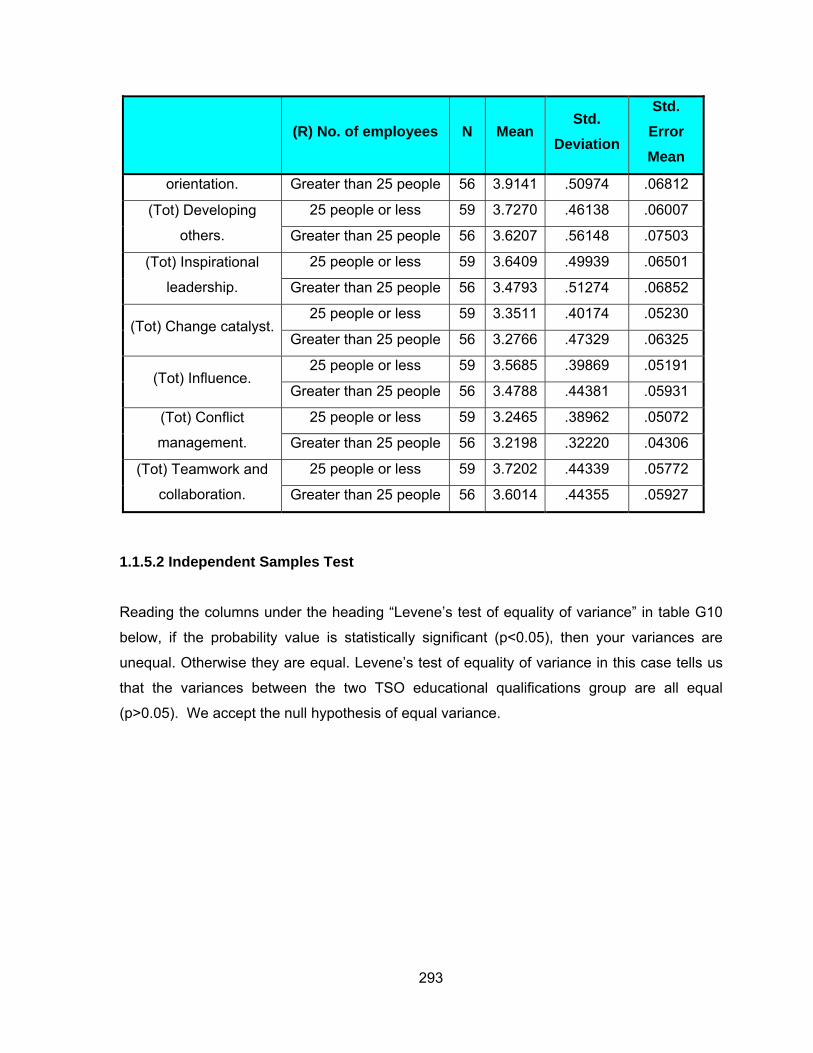
293
(R) No. of employees N Mean Std.
Deviation
Std. Error Mean
orientation. Greater than 25 people 56 3.9141 .50974 .06812
(Tot) Developing
others.
25 people or less 59 3.7270 .46138 .06007
Greater than 25 people 56 3.6207 .56148 .07503
(Tot) Inspirational
leadership.
25 people or less 59 3.6409 .49939 .06501
Greater than 25 people 56 3.4793 .51274 .06852
(Tot) Change catalyst. 25 people or less 59 3.3511 .40174 .05230
Greater than 25 people 56 3.2766 .47329 .06325
(Tot) Influence. 25 people or less 59 3.5685 .39869 .05191
Greater than 25 people 56 3.4788 .44381 .05931
(Tot) Conflict
management.
25 people or less 59 3.2465 .38962 .05072
Greater than 25 people 56 3.2198 .32220 .04306
(Tot) Teamwork and
collaboration.
25 people or less 59 3.7202 .44339 .05772
Greater than 25 people 56 3.6014 .44355 .05927
1.1.5.2 Independent Samples Test
Reading the columns under the heading “Levene’s test of equality of variance” in table G10
below, if the probability value is statistically significant (p<0.05), then your variances are
unequal. Otherwise they are equal. Levene’s test of equality of variance in this case tells us
that the variances between the two TSO educational qualifications group are all equal
(p>0.05). We accept the null hypothesis of equal variance.

294
Table G10: Independent Samples Test for number of employees reporting to the TSO and ECI
Levene's Test for Equality of Variances
t-test for Equality of Means
F Sig. t df
Sig. (2-
tailed)
Mean Differe
nce
Std. Error
Difference
95% Confidence Interval of the
Difference
Lower Upper
(Tot)
Emotional
self
awareness
.
Equal
variances
assumed
3.814 .053 1.277 113 .204 .08613 .06743 -.04745 .21971
Equal
variances
not
assumed
1.273 109.007 .206 .08613 .06767 -.04800 .22025
(Tot)
Accurate
self
assessme
nt.
Equal
variances
assumed
.041 .841 1.329 113 .187 .10212 .07684 -.05012 .25435
Equal
variances
not
assumed
1.326 111.168 .187 .10212 .07699 -.05045 .25469
(Tot) Self
confidence
.
Equal
variances
assumed
1.014 .316 .706 113 .482 .06009 .08510 -.10850 .22868
Equal
variances
not
.704 109.279 .483 .06009 .08539 -.10915 .22933

295
Levene's Test for Equality of Variances
t-test for Equality of Means
F Sig. t df
Sig. (2-
tailed)
Mean Differe
nce
Std. Error
Difference
95% Confidence Interval of the
Difference
Lower Upper
assumed
(Tot)
Emotional
self
control.
Equal
variances
assumed
.025 .876 1.042 113 .300 .08725 .08376 -.07870 .25319
Equal
variances
not
assumed
1.042 112.834 .300 .08725 .08373 -.07864 .25313
(Tot)
Transpare
ncy.
Equal
variances
assumed
.244 .623 1.690 113 .094 .13732 .08125 -.02365 .29830
Equal
variances
not
assumed
1.696 112.394 .093 .13732 .08098 -.02313 .29777
(Tot)
Adaptabilit
y.
Equal
variances
assumed
.015 .902 1.497 113 .137 .11287 .07542 -.03654 .26229
Equal
variances
not
assumed
1.495 111.859 .138 .11287 .07551 -.03675 .26249
(Tot)
Achievem
Equal
variances 1.946 .166 .987 113 .326 .08711 .08828 -.08780 .26201

296
Levene's Test for Equality of Variances
t-test for Equality of Means
F Sig. t df
Sig. (2-
tailed)
Mean Differe
nce
Std. Error
Difference
95% Confidence Interval of the
Difference
Lower Upper
ent
Orientatio
n.
assumed
Equal
variances
not
assumed
.982 107.153 .328 .08711 .08871 -.08874 .26296
(Tot)
Initiative.
Equal
variances
assumed
2.270 .135 .339 113 .735 .02542 .07491 -.12299 .17384
Equal
variances
not
assumed
.338 107.105 .736 .02542 .07527 -.12379 .17464
(Tot)
Optimism.
Equal
variances
assumed
.402 .527 1.328 113 .187 .11411 .08596 -.05619 .28441
Equal
variances
not
assumed
1.326 111.776 .188 .11411 .08608 -.05644 .28467
(Tot)
Empathy.
Equal
variances
assumed
.092 .762 1.035 113 .303 .08690 .08394 -.07940 .25319
Equal
variances 1.038 112.836 .302 .08690 .08374 -.07901 .25280
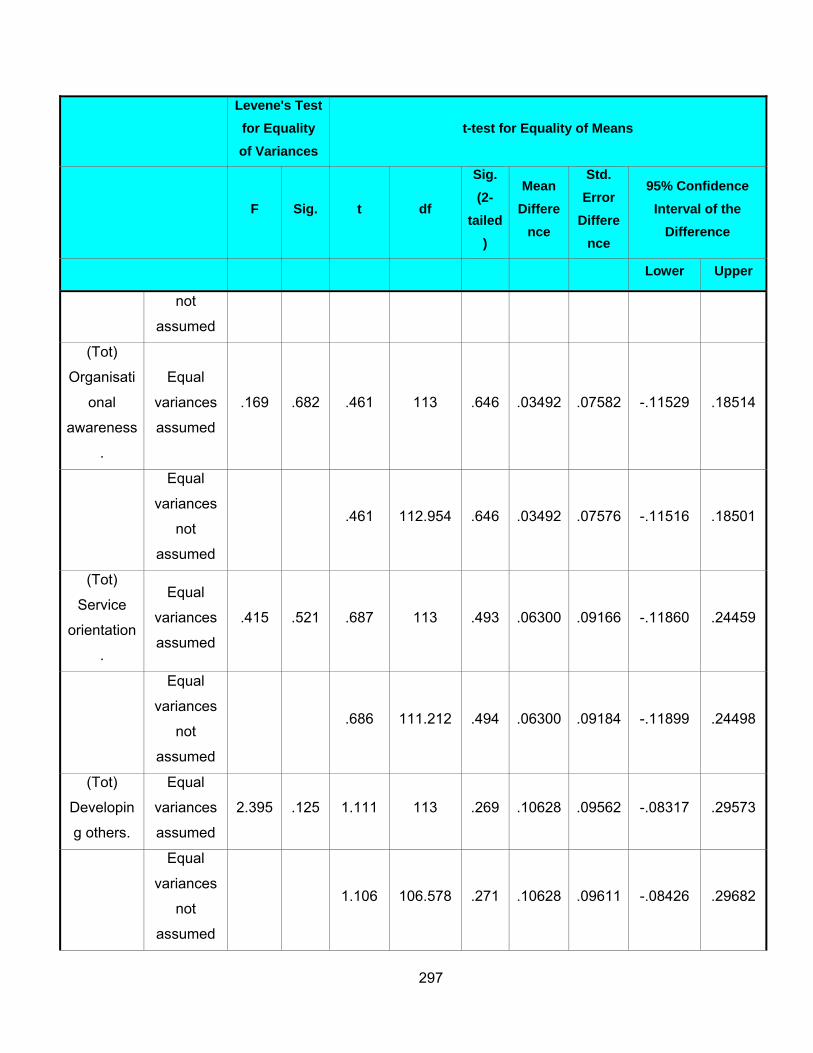
297
Levene's Test for Equality of Variances
t-test for Equality of Means
F Sig. t df
Sig. (2-
tailed)
Mean Differe
nce
Std. Error
Difference
95% Confidence Interval of the
Difference
Lower Upper
not
assumed
(Tot)
Organisati
onal
awareness
.
Equal
variances
assumed
.169 .682 .461 113 .646 .03492 .07582 -.11529 .18514
Equal
variances
not
assumed
.461 112.954 .646 .03492 .07576 -.11516 .18501
(Tot)
Service
orientation
.
Equal
variances
assumed
.415 .521 .687 113 .493 .06300 .09166 -.11860 .24459
Equal
variances
not
assumed
.686 111.212 .494 .06300 .09184 -.11899 .24498
(Tot)
Developin
g others.
Equal
variances
assumed
2.395 .125 1.111 113 .269 .10628 .09562 -.08317 .29573
Equal
variances
not
assumed
1.106 106.578 .271 .10628 .09611 -.08426 .29682
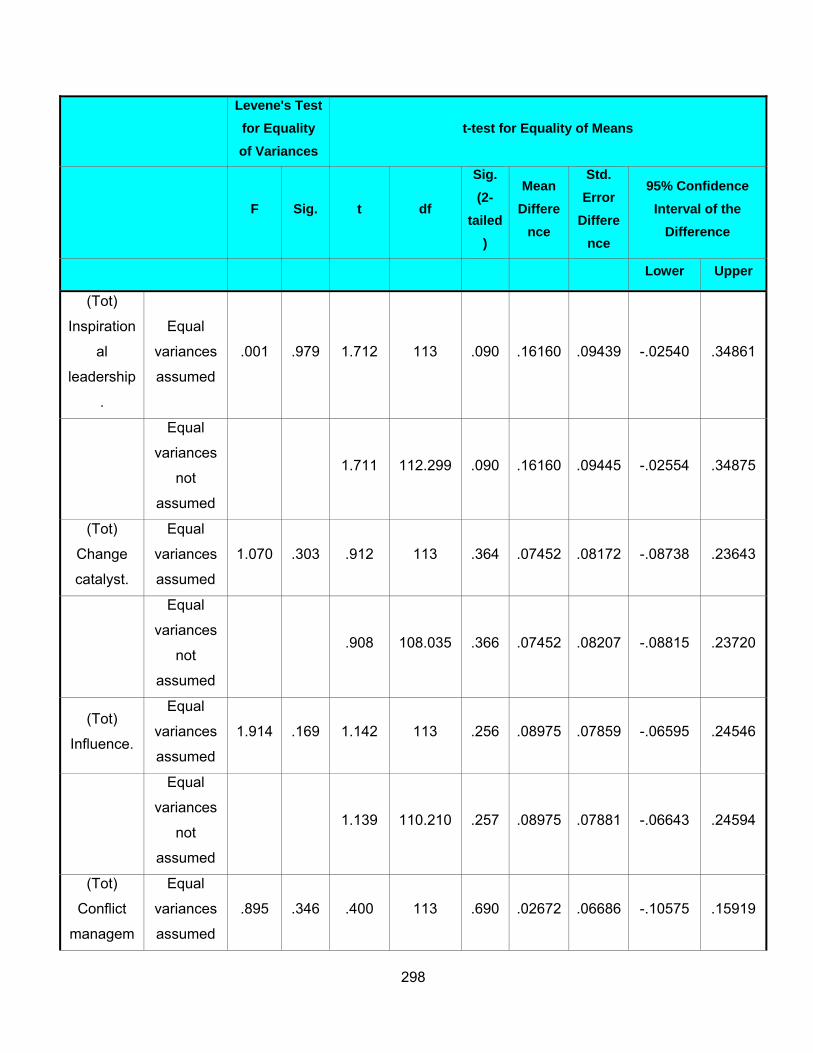
298
Levene's Test for Equality of Variances
t-test for Equality of Means
F Sig. t df
Sig. (2-
tailed)
Mean Differe
nce
Std. Error
Difference
95% Confidence Interval of the
Difference
Lower Upper
(Tot)
Inspiration
al
leadership
.
Equal
variances
assumed
.001 .979 1.712 113 .090 .16160 .09439 -.02540 .34861
Equal
variances
not
assumed
1.711 112.299 .090 .16160 .09445 -.02554 .34875
(Tot)
Change
catalyst.
Equal
variances
assumed
1.070 .303 .912 113 .364 .07452 .08172 -.08738 .23643
Equal
variances
not
assumed
.908 108.035 .366 .07452 .08207 -.08815 .23720
(Tot)
Influence.
Equal
variances
assumed
1.914 .169 1.142 113 .256 .08975 .07859 -.06595 .24546
Equal
variances
not
assumed
1.139 110.210 .257 .08975 .07881 -.06643 .24594
(Tot)
Conflict
managem
Equal
variances
assumed
.895 .346 .400 113 .690 .02672 .06686 -.10575 .15919
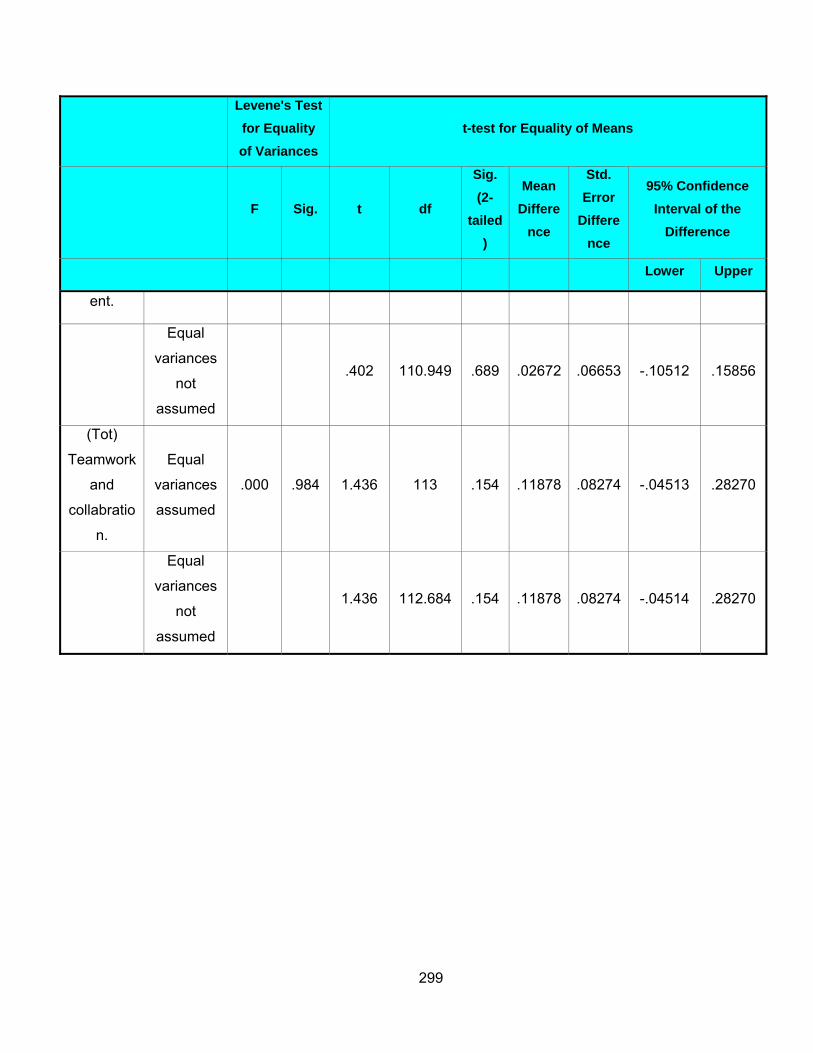
299
Levene's Test for Equality of Variances
t-test for Equality of Means
F Sig. t df
Sig. (2-
tailed)
Mean Differe
nce
Std. Error
Difference
95% Confidence Interval of the
Difference
Lower Upper
ent.
Equal
variances
not
assumed
.402 110.949 .689 .02672 .06653 -.10512 .15856
(Tot)
Teamwork
and
collabratio
n.
Equal
variances
assumed
.000 .984 1.436 113 .154 .11878 .08274 -.04513 .28270
Equal
variances
not
assumed
1.436 112.684 .154 .11878 .08274 -.04514 .28270

300
1.2 Testing (t-Test) Control Variables and Organisational Culture 1.2.1 (R) – Age of TSO You can state the null hypothesis in this section of the study as follows: “In this population,
there is no difference between the TSO age group less than 41 years and the TSO age
group greater than and equal to 41 years with respect to their mean scores on the OCP
variables”. Symbolically, the null hypothesis can be represented in this way:
H0: M1=M2
M1 = mean OCP score for the population of TSO’s on the less than 41 year age group
M2 = mean OCP score for the population of TSO’s on the greater than and equal to 41
year age group
1.2.1.1 Group Statistics
Table G11 summarises the descriptive statistics for the two age groups of the TSO with the 7
OCP dependent variables. For example, the mean performance orientation score for the
TSO age group less than 41 years is 3.5837 with a standard deviation of 0.50644 the mean
score for the age group 41 years or greater is 3,5765 with the standard deviation of 0,49882.
Next, we review the independent sample t-Test Table G11.
Table G11: t-Test: Group Statistics for Age of the TSO and OCP
(R) Age of TSO N Mean Std.
Deviation Std. Error
Mean
(Tot) Performance
orientation
Less than 41 yrs 47 3.5837 .50644 .07387
41 yrs or greater 68 3.5765 .49882 .06049
(Tot) Social
responsibility
Less than 41 yrs 47 3.4612 .50719 .07398
41 yrs or greater 68 3.4307 .45437 .05510
(Tot) Supportiveness Less than 41 yrs 47 3.5123 .46832 .06831
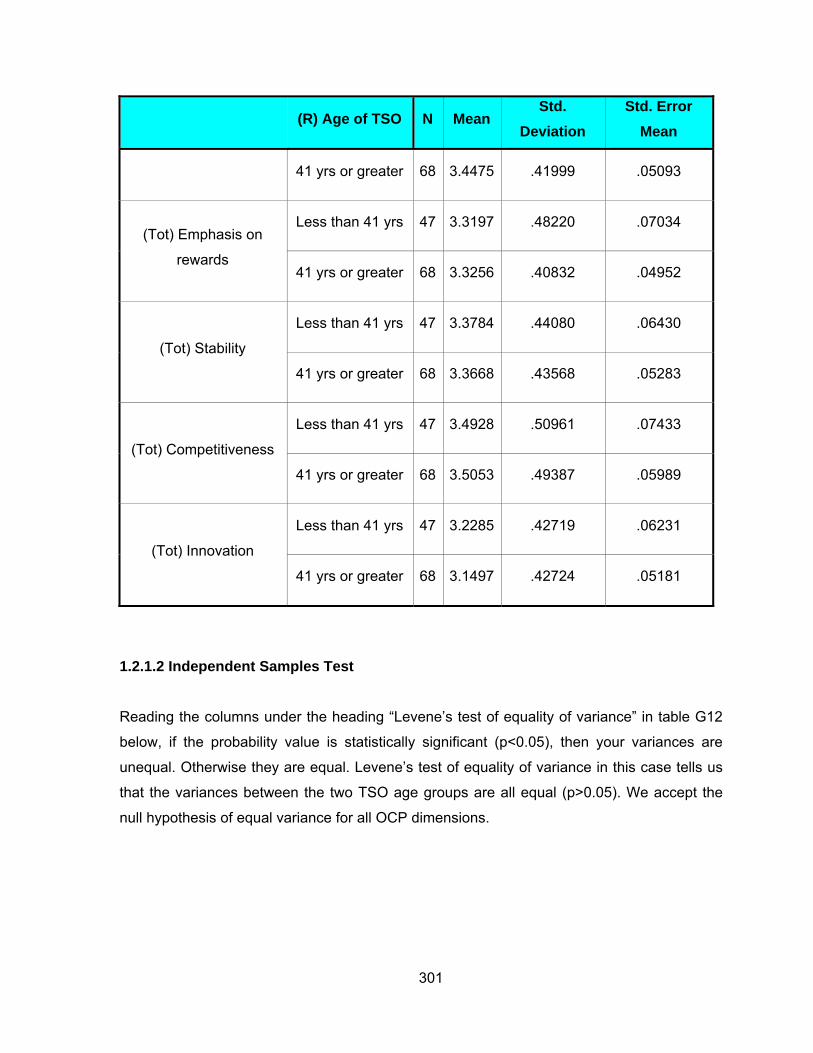
301
(R) Age of TSO N Mean Std.
Deviation Std. Error
Mean
41 yrs or greater 68 3.4475 .41999 .05093
(Tot) Emphasis on
rewards
Less than 41 yrs 47 3.3197 .48220 .07034
41 yrs or greater 68 3.3256 .40832 .04952
(Tot) Stability
Less than 41 yrs 47 3.3784 .44080 .06430
41 yrs or greater 68 3.3668 .43568 .05283
(Tot) Competitiveness
Less than 41 yrs 47 3.4928 .50961 .07433
41 yrs or greater 68 3.5053 .49387 .05989
(Tot) Innovation
Less than 41 yrs 47 3.2285 .42719 .06231
41 yrs or greater 68 3.1497 .42724 .05181
1.2.1.2 Independent Samples Test
Reading the columns under the heading “Levene’s test of equality of variance” in table G12
below, if the probability value is statistically significant (p<0.05), then your variances are
unequal. Otherwise they are equal. Levene’s test of equality of variance in this case tells us
that the variances between the two TSO age groups are all equal (p>0.05). We accept the
null hypothesis of equal variance for all OCP dimensions.

302
Table G12: Independent Samples Test for Age of TSO and OCP
Levene's Test for Equality of
Variances t-test for Equality of Means
F Sig. t df Sig. (2-
tailed)
Mean Difference
Std. Error Difference
95% Confidence Interval of the
Difference
Lower Upper
(Tot) Performance
orientation .551 .460 .076 113 .940 .00720 .09521 -.18143 .19583
(Tot) Social
responsibility 2.294 .133 .337 113 .737 .03049 .09040 -.14861 .20959
(Tot)
Supportiveness .942 .334 .776 113 .440 .06477 .08352 -.10070 .23025
(Tot) Emphasis on
rewards 2.132 .147 -.070 113 .944 -.00588 .08344 -.17120 .15944
(Tot) Stability .309 .579 .140 113 .889 .01167 .08304 -.15285 .17618
(Tot)
Competitiveness .468 .495 -.132 113 .895 -.01251 .09491 -.20055 .17552
(Tot) Innovation .012 .914 .972 113 .333 .07875 .08104 -.08180 .23930

303
1.2.2 (R) – Race of TSO
You can state the null hypothesis in this section of the study as follows: “In this population,
there is no difference between the White TSO race group White and the TSO race group
Blacks with respect to their mean scores on the OCP variables”. Symbolically, the null
hypothesis can be represented in this way:
H0: M1=M2
M1 = mean OCP score for the population of White TSOs
M2 = mean OCP score for the population of Black TSOs
1.2.2.1 Group Statistics
Table G13 summarises the descriptive statistics for the two race groups of the TSO with the
7 OCP dependent variables. For example, the mean performance orientation score for the
TSO White group is 3,7705 with a standard deviation of 0,41374 the mean score for the
Black TSO group is 3,3682 with the standard deviation of 0,48026. Next, we review the
independent sample t-Test Table G13.
Table G13: t-Test: Group Statistics for Race of the TSO and OCP
(REG) TSO
race N Mean
Std. Deviation
Std. Error Mean
(Tot) Performance
orientation
White 56 3.7705 .41374 .05529
Black 43 3.3682 .48026 .07324
(Tot) Social responsibility
White 56 3.5596 .40986 .05477
Black 43 3.2946 .48045 .07327
(Tot) Supportiveness White 56 3.5525 .41789 .05584
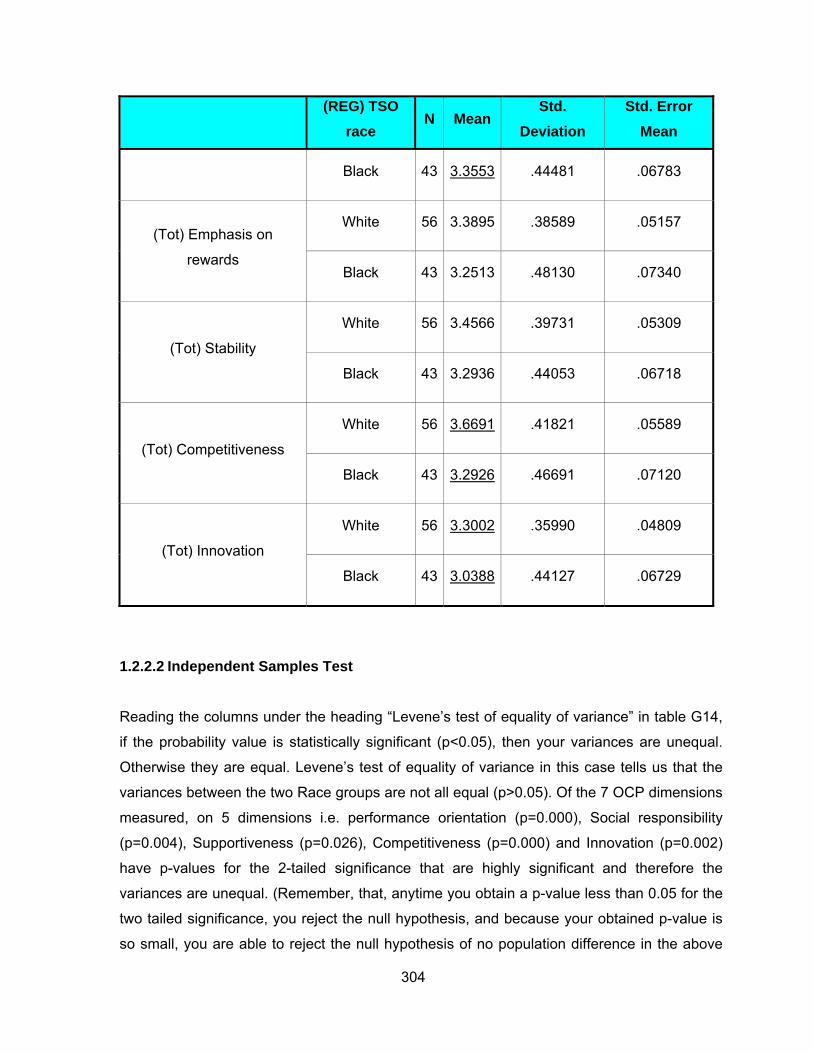
304
(REG) TSO
race N Mean
Std. Deviation
Std. Error Mean
Black 43 3.3553 .44481 .06783
(Tot) Emphasis on
rewards
White 56 3.3895 .38589 .05157
Black 43 3.2513 .48130 .07340
(Tot) Stability
White 56 3.4566 .39731 .05309
Black 43 3.2936 .44053 .06718
(Tot) Competitiveness
White 56 3.6691 .41821 .05589
Black 43 3.2926 .46691 .07120
(Tot) Innovation
White 56 3.3002 .35990 .04809
Black 43 3.0388 .44127 .06729
1.2.2.2 Independent Samples Test
Reading the columns under the heading “Levene’s test of equality of variance” in table G14,
if the probability value is statistically significant (p<0.05), then your variances are unequal.
Otherwise they are equal. Levene’s test of equality of variance in this case tells us that the
variances between the two Race groups are not all equal (p>0.05). Of the 7 OCP dimensions
measured, on 5 dimensions i.e. performance orientation (p=0.000), Social responsibility
(p=0.004), Supportiveness (p=0.026), Competitiveness (p=0.000) and Innovation (p=0.002)
have p-values for the 2-tailed significance that are highly significant and therefore the
variances are unequal. (Remember, that, anytime you obtain a p-value less than 0.05 for the
two tailed significance, you reject the null hypothesis, and because your obtained p-value is
so small, you are able to reject the null hypothesis of no population difference in the above

305
OCP dimensions). You may therefore conclude that there is a difference in OCP scores
between the Black and White race groups for the dimensions mentioned above.
Table G14: Independent Samples Test for Race of TSO and OCP
Levene's Test for
Equality of Variances
t-Test for Equality of Means
F Sig. t df Sig. (2-
tailed)
Mean Difference
Std. Error
Difference
95% Confidence Interval of the
Difference
Lower Upper
(Tot)
Performance
orientation
Equal
variances
assumed
2.800 .097 4.471 97 .000 .40234 .08998 .22375 .58092
Equal
variances
not
assumed
4.384 82.941 .000 .40234 .09176 .21982 .58486
(Tot) Social
responsibility
Equal
variances
assumed
1.926 .168 2.959 97 .004 .26505 .08958 .08725 .44285
Equal
variances
not
assumed
2.897 82.405 .005 .26505 .09148 .08309 .44701
(Tot)
Supportiveness
Equal
variances
assumed
1.928 .168 2.263 97 .026 .19722 .08714 .02428 .37017
Equal
variances
not
assumed
2.245 87.522 .027 .19722 .08786 .02260 .37184

306
Levene's Test for
Equality of Variances
t-Test for Equality of Means
F Sig. t df Sig. (2-
tailed)
Mean Difference
Std. Error
Difference
95% Confidence Interval of the
Difference
Lower Upper
(Tot) Emphasis
on rewards
Equal
variances
assumed
3.135 .080 1.585 97 .116 .13816 .08715 -.03481 .31112
Equal
variances
not
assumed
1.540 78.998 .128 .13816 .08970 -.04039 .31670
(Tot) Stability
Equal
variances
assumed
1.454 .231 1.929 97 .057 .16297 .08447 -.00467 .33061
Equal
variances
not
assumed
1.903 85.406 .060 .16297 .08563 -.00726 .33321
(Tot)
Competitiveness
Equal
variances
assumed
.692 .408 4.221 97 .000 .37653 .08921 .19948 .55358
Equal
variances
not
assumed
4.160 85.041 .000 .37653 .09051 .19657 .55650
(Tot) Innovation
Equal
variances
assumed
.943 .334 3.246 97 .002 .26140 .08053 .10156 .42124
Equal
variances 3.160 79.938 .002 .26140 .08271 .09680 .42600

307
Levene's Test for
Equality of Variances
t-Test for Equality of Means
F Sig. t df Sig. (2-
tailed)
Mean Difference
Std. Error
Difference
95% Confidence Interval of the
Difference
Lower Upper
not
assumed
1.2.3 (R) – TSO qualifications
You can state the null hypothesis in this section of the study as follows: “In this population of,
there is no difference between the TSO educational qualification group with less than N3 and
the TSO qualification with greater than and equal to an N3 with respect to their mean scores
on the OCP variables”. Symbolically, the null hypothesis can be represented in this way:
H0: M1=M2
M1 = mean OCP score for the population of TSOs with educational qualifications less than
and N3
M2 = mean OCP score for the population of TSOs with educational qualifications greater
than and equal to N3
1.2.3.1 Group Statistics
Table G15 summarises the descriptive statistics for the two major TSO educational
qualification groups on the 7 OCP dependent variables. For example, the mean performance
orientation score for the TSO educational group less than an N3 is 3.5574 with a standard
deviation of 0.51326. Similarly, the mean performance orientation score for the TSO
educational group greater than and equal to N3 is 3.6000 with a standard deviation of
0.49262. Next, we review the independent sample t-Test Table G15 below.

308
Table G15: t-Test: Group Statistics for Qualification of the TSO and OCP
(R) TSO
qualifications N Mean
Std. Deviation
Std. Error Mean
(Tot) Performance
orientation
N3 or less 58 3.5574 .51326 .06739
N4 or more 55 3.6000 .49262 .06643
(Tot) Social
responsibility
N3 or less 58 3.4274 .47903 .06290
N4 or more 55 3.4503 .47816 .06447
(Tot) Supportiveness
N3 or less 58 3.4200 .43968 .05773
N4 or more 55 3.5219 .44246 .05966
(Tot) Emphasis on
rewards
N3 or less 58 3.3047 .43346 .05692
N4 or more 55 3.3348 .44130 .05950
(Tot) Stability
N3 or less 58 3.3514 .42678 .05604
N4 or more 55 3.3823 .45101 .06081
(Tot) Competitiveness
N3 or less 58 3.4812 .49993 .06564
N4 or more 55 3.5153 .50599 .06823
(Tot) Innovation
N3 or less 58 3.1650 .43207 .05673
N4 or more 55 3.1996 .42689 .05756

309
1.2.3.2 Independent Samples Test
Reading the columns under the heading “Levene’s test of equality of variance” in table G16
below, if the probability value is statistically significant (p<0.05), then your variances are
unequal. Otherwise they are equal. Levene’s test of equality of variance in this case tells us
that the variances between the two TSO educational qualifications group are all equal
(p>0.05). We accept the null hypothesis of equal variance.
Table G16: Independent Samples Test for Qualification of TSO and OCP
Levene's Test for
Equality of Variances
t-Test for Equality of Means
F Sig. t df Sig. (2-
tailed)
Mean Difference
Std. Error Difference
95% Confidence Interval of the
Difference
Lower Upper
(Tot) Performance
orientation .005 .944 -.450 111 .654 -.04263 .09473 -.23035 .14508
(Tot) Social
responsibility .140 .709 -.254 111 .800 -.02290 .09008 -.20140 .15559
(Tot)
Supportiveness .113 .737 -1.228 111 .222 -.10194 .08301 -.26643 .06254

310
Levene's Test for
Equality of Variances
t-Test for Equality of Means
F Sig. t df Sig. (2-
tailed)
Mean Difference
Std. Error Difference
95% Confidence Interval of the
Difference
Lower Upper
(Tot) Emphasis on
rewards .004 .951 -.367 111 .714 -.03019 .08230 -.19327 .13290
(Tot) Stability .537 .465 -.374 111 .709 -.03092 .08257 -.19454 .13271
(Tot)
Competitiveness .015 .903 -.360 111 .720 -.03408 .09465 -.22163 .15347
(Tot) Innovation .237 .627 -.428 111 .670 -.03459 .08085 -.19479 .12561
1.2.4 (R) – Years in TSO position
You can state the null hypothesis in this section of the study as follows: “In this population,
there is no difference between the years in the TSO position group less than 5 years and the
years in the TSO position group greater than and equal to an 5 years with respect to their
mean scores on the OCP variables”. Symbolically, the null hypothesis can be represented in
this way:

311
H0: M1=M2
M1 = mean OCP score for the population of years in the TSO position group less than 5
years
M2 = mean OCP score for the population of years in the TSO position greater than and
equal to 5 years
1.2.4.1 Group Statistics
Table G17 summarises the descriptive statistics for the years in the TSO position on the 7
OCP dependent variables. For example, the mean performance orientation score for less
than 5 years group is 3.4969 with a standard deviation of 0.48475. Similarly, the mean
performance orientation score for the greater than and equal to 5 year group is 3.6475 with a
standard deviation of 0.50547. Next, we review the independent sample t-Test Table G17.
Table G17: t-Test: Group Statistics for Years in TSO position and OCP
(R) Yrs in TSO
position N Mean
Std. Deviation
Std. Error Mean
(Tot) Performance
orientation
1 to 5 yrs 52 3.4969 .48475 .06722
Greater than 6 yrs 63 3.6475 .50547 .06368
(Tot) Social
responsibility
1 to 5 yrs 52 3.3990 .46273 .06417
Greater than 6 yrs 63 3.4796 .48504 .06111
(Tot) Supportiveness
1 to 5 yrs 52 3.4515 .43066 .05972
Greater than 6 yrs 63 3.4925 .44932 .05661
(Tot) Emphasis on 1 to 5 yrs 52 3.2594 .45340 .06288

312
(R) Yrs in TSO
position N Mean
Std. Deviation
Std. Error Mean
rewards Greater than 6 yrs 63 3.3758 .42116 .05306
(Tot) Stability
1 to 5 yrs 52 3.3285 .44865 .06222
Greater than 6 yrs 63 3.4071 .42535 .05359
(Tot) Competitiveness
1 to 5 yrs 52 3.3998 .47688 .06613
Greater than 6 yrs 63 3.5830 .50382 .06348
(Tot) Innovation
1 to 5 yrs 52 3.1348 .43321 .06008
Greater than 6 yrs 63 3.2208 .42150 .05310
1.2.4.2 Independent Samples Test
Reading the columns under the heading “Levene’s test of equality of variance” in table G18
below, if the probability value is statistically significant (p<0.05), then your variances are
unequal. Otherwise they are equal. Levene’s test of equality of variance in this case tells us
that the variances between the two years in the TSO position group are not all equal
(p>0.05). Reviewing the 2-tailed significance for the years in the TSO position
competitiveness (p=0.049) you are able to reject the null hypothesis of no population
difference for the above two dimensions of OCP. For the remaining OCP dimensions we
accept the null hypothesis of equal variance.

313
Table G18: Independent Samples Test for Years in TSO position and OCP
Levene's Test for
Equality of Variances
t-test for Equality of Means
F Sig. t df Sig. (2-
tailed)
Mean Difference
Std. Error Difference
95% Confidence Interval of the
Difference
Lower Upper
(Tot) Performance
orientation .001 .977 -1.620 113 .108 -.15058 .09297 -.33477 .03362
(Tot) Social
responsibility .003 .955 -.906 113 .367 -.08060 .08901 -.25696 .09575
(Tot)
Supportiveness .005 .943 -.496 113 .621 -.04095 .08263 -.20465 .12274
(Tot) Emphasis
on rewards .145 .704 -1.425 113 .157 -.11639 .08169 -.27823 .04545
(Tot) Stability .382 .538 -.962 113 .338 -.07862 .08169 -.24047 .08323
(Tot)
Competitiveness .076 .784 -1.988 113 .049 -.18322 .09215 -.36579 -.00065
(Tot) Innovation .058 .811 -1.075 113 .285 -.08595 .07997 -.24438 .07249
314
1.2.5 (R) Number of employees reporting to the TSO
You can state the null hypothesis in this section of the study as follows: “In this population,
there is no difference between the number of employees reporting to the TSO group less
than 25 and number employees reporting to the TSO group greater than and equal to 25 with
respect to their mean scores on the OCP variables”. Symbolically, the null hypothesis can be
represented in this way:
H0: M1=M2
M1 = mean OCP score for the population of the number of people reporting to the TSO
group less than 25
M2 = mean OCP score for the population of the number of people reporting to the TSO
group greater than and equal to 25
1.2.5.1 Group Statistics
Table G19 summarises the descriptive statistics for the number of employees reporting to the
TSO on the 7 OCP dependent variables. For example, the mean performance orientation
score for the less than 25 employee group is 3.6575 with a standard deviation of 0.43787.
Similarly, the mean performance orientation score for the greater than and equal to 25
employee group is 3.4971 with a standard deviation of 0.54957. Next, we review the
independent sample t-Test Table G19.
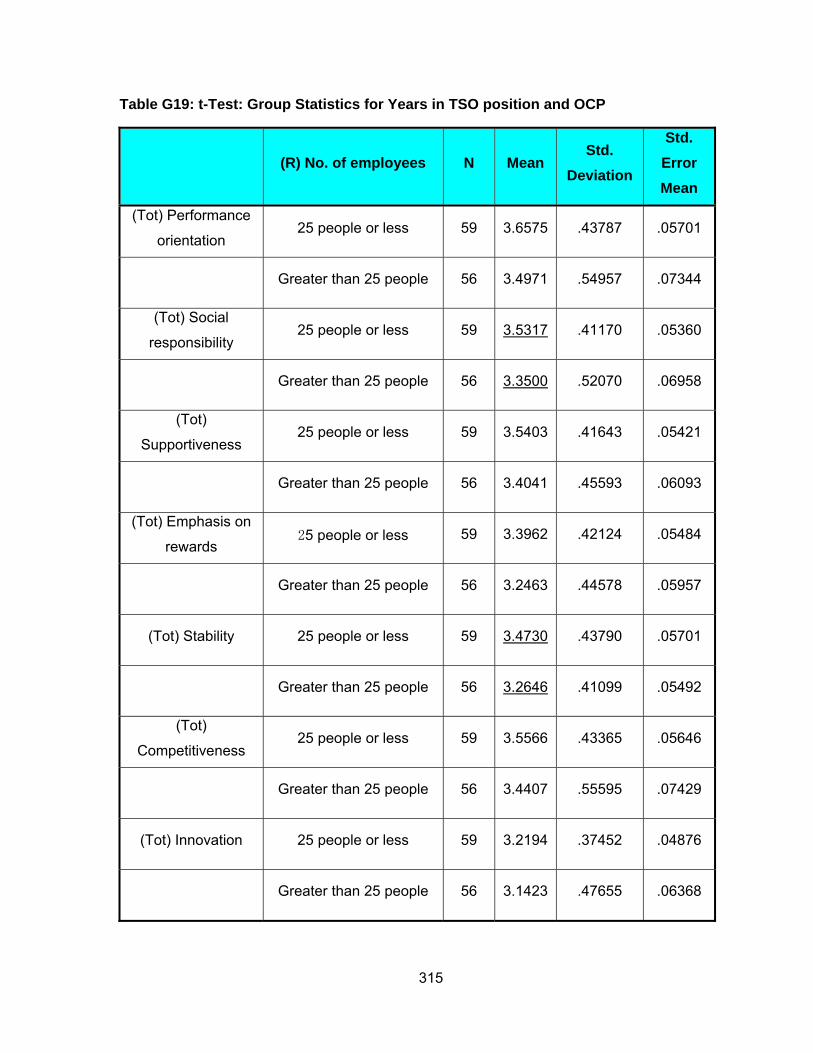
315
Table G19: t-Test: Group Statistics for Years in TSO position and OCP
(R) No. of employees N Mean Std.
Deviation
Std. Error Mean
(Tot) Performance
orientation 25 people or less 59 3.6575 .43787 .05701
Greater than 25 people 56 3.4971 .54957 .07344
(Tot) Social
responsibility 25 people or less 59 3.5317 .41170 .05360
Greater than 25 people 56 3.3500 .52070 .06958
(Tot)
Supportiveness 25 people or less 59 3.5403 .41643 .05421
Greater than 25 people 56 3.4041 .45593 .06093
(Tot) Emphasis on
rewards 25 people or less 59 3.3962 .42124 .05484
Greater than 25 people 56 3.2463 .44578 .05957
(Tot) Stability 25 people or less 59 3.4730 .43790 .05701
Greater than 25 people 56 3.2646 .41099 .05492
(Tot)
Competitiveness 25 people or less 59 3.5566 .43365 .05646
Greater than 25 people 56 3.4407 .55595 .07429
(Tot) Innovation 25 people or less 59 3.2194 .37452 .04876
Greater than 25 people 56 3.1423 .47655 .06368

316
1.2.5.2 Independent Samples Test
Reading the columns under the heading “Levene’s test of equality of variance” in Table G20
below, if the probability value is statistically significant (p<0.05), then your variances are
unequal. Otherwise they are equal. Levene’s test of equality of variance in this case tells us
that the variances between the two years in the TSO position group are not all equal
(p>0.05). Reviewing the 2-tailed significance for the number of employees reporting to the
TSO, social responsibility (p=0.040) and stability (p=0.010) you are able to reject the null
hypothesis of no population difference for the above two dimensions of OCP. For the
remaining OCP dimensions we accept the null hypothesis of equal variance.
Table G20: Independent Samples Test for number of employees reporting to the TSO and OCP
Levene's Test for
Equality of Variances t-Test for Equality of Means
F Sig. t df
Sig. (2-
tailed)
Mean Differe
nce
Std. Error
Difference
95% Confidence Interval of the
Difference
Lower Upper (Tot) Performance orientation
Equal variances assumed 4.363 .039 1.735 113 .085 .16036 .09242 -.02275 .34346
Equal variances not assumed
1.725 105.074 .087 .16036 .09297 -.02398 .34469
(Tot) Social responsibility
Equal variances assumed
3.625 .059 2.081 113 .040 .18165 .08730 .00869 .35461
Equal variances not assumed
2.068 104.684 .041 .18165 .08783 .00749 .35581
(Tot) Supportiveness
Equal variances assumed
1.029 .313 1.674 113 .097 .13618 .08136 -.02501 .29737
Equal variances 1.670 110.742 .098 .13618 .08156 -.02543 .29779
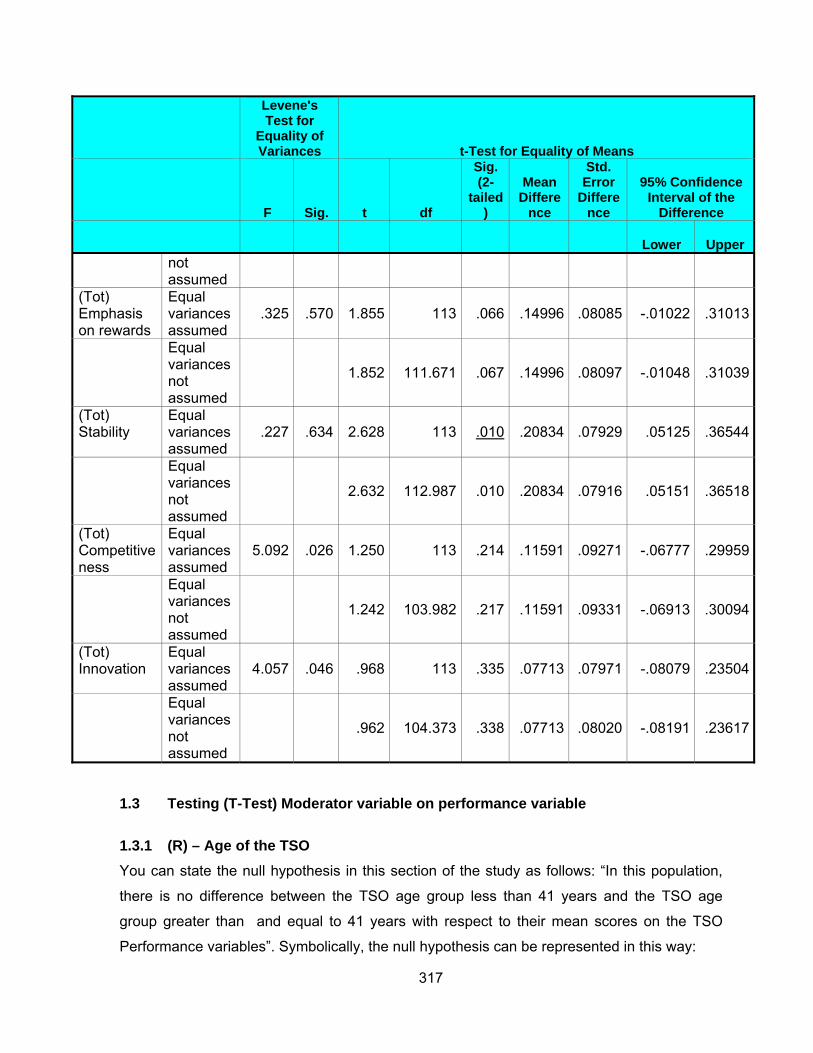
317
Levene's Test for
Equality of Variances t-Test for Equality of Means
F Sig. t df
Sig. (2-
tailed)
Mean Differe
nce
Std. Error
Difference
95% Confidence Interval of the
Difference
Lower Upper not assumed
(Tot) Emphasis on rewards
Equal variances assumed
.325 .570 1.855 113 .066 .14996 .08085 -.01022 .31013
Equal variances not assumed
1.852 111.671 .067 .14996 .08097 -.01048 .31039
(Tot) Stability
Equal variances assumed
.227 .634 2.628 113 .010 .20834 .07929 .05125 .36544
Equal variances not assumed
2.632 112.987 .010 .20834 .07916 .05151 .36518
(Tot) Competitiveness
Equal variances assumed
5.092 .026 1.250 113 .214 .11591 .09271 -.06777 .29959
Equal variances not assumed
1.242 103.982 .217 .11591 .09331 -.06913 .30094
(Tot) Innovation
Equal variances assumed
4.057 .046 .968 113 .335 .07713 .07971 -.08079 .23504
Equal variances not assumed
.962 104.373 .338 .07713 .08020 -.08191 .23617
1.3 Testing (T-Test) Moderator variable on performance variable 1.3.1 (R) – Age of the TSO You can state the null hypothesis in this section of the study as follows: “In this population,
there is no difference between the TSO age group less than 41 years and the TSO age
group greater than and equal to 41 years with respect to their mean scores on the TSO
Performance variables”. Symbolically, the null hypothesis can be represented in this way:
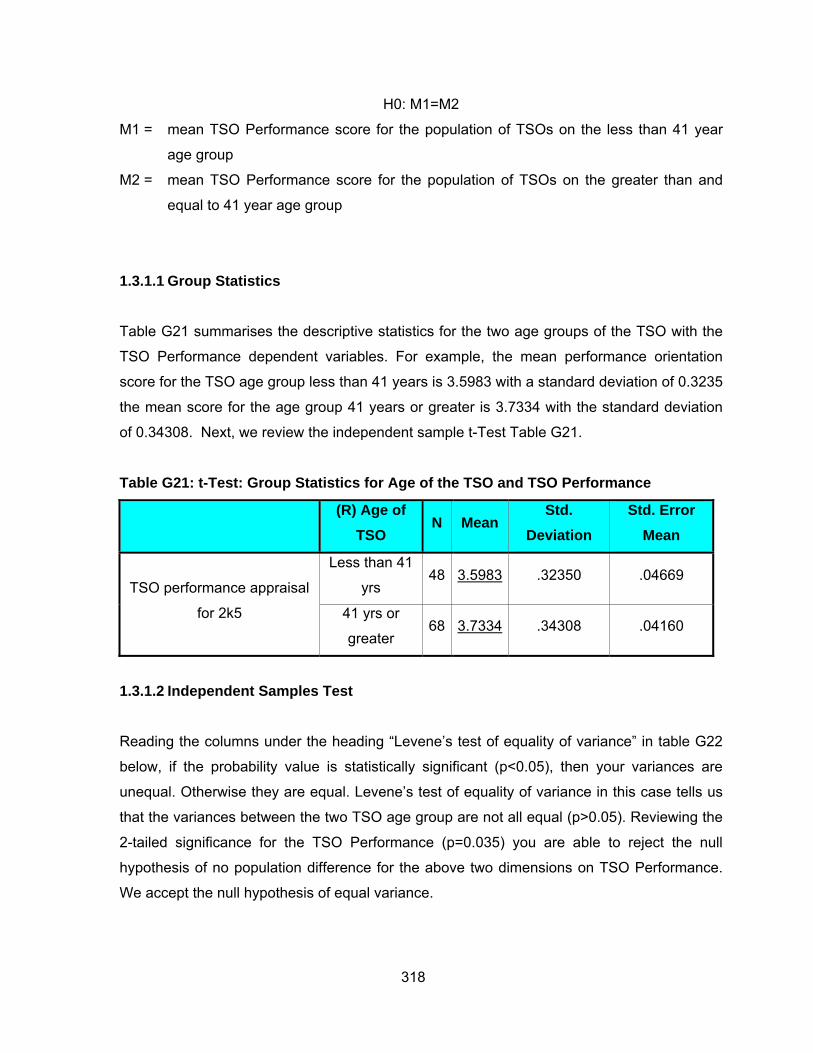
318
H0: M1=M2
M1 = mean TSO Performance score for the population of TSOs on the less than 41 year
age group
M2 = mean TSO Performance score for the population of TSOs on the greater than and
equal to 41 year age group
1.3.1.1 Group Statistics
Table G21 summarises the descriptive statistics for the two age groups of the TSO with the
TSO Performance dependent variables. For example, the mean performance orientation
score for the TSO age group less than 41 years is 3.5983 with a standard deviation of 0.3235
the mean score for the age group 41 years or greater is 3.7334 with the standard deviation
of 0.34308. Next, we review the independent sample t-Test Table G21.
Table G21: t-Test: Group Statistics for Age of the TSO and TSO Performance
(R) Age of
TSO N Mean
Std. Deviation
Std. Error Mean
TSO performance appraisal
for 2k5
Less than 41
yrs 48 3.5983 .32350 .04669
41 yrs or
greater 68 3.7334 .34308 .04160
1.3.1.2 Independent Samples Test
Reading the columns under the heading “Levene’s test of equality of variance” in table G22
below, if the probability value is statistically significant (p<0.05), then your variances are
unequal. Otherwise they are equal. Levene’s test of equality of variance in this case tells us
that the variances between the two TSO age group are not all equal (p>0.05). Reviewing the
2-tailed significance for the TSO Performance (p=0.035) you are able to reject the null
hypothesis of no population difference for the above two dimensions on TSO Performance.
We accept the null hypothesis of equal variance.

319
Table G22: Independent Samples Test Age of the TSO and TSO Performance
Levene's Test for
Equality of Variances t-test for Equality of Means
F Sig. t df
Sig. (2-
tailed)
Mean Differen
ce Std. Error Difference
95% Confidence Interval of the
Difference
Lower Upper
TSO
performance
appraisal for
2k5
.310 .579 -2.137 114 .035 -.13505 .06318 -.26021 -.00989
1.3.2 (R) – TSO Race
You can state the null hypothesis in this section of the study as follows: “In this population,
there is no difference between the White TSO race group White and the TSO race group
Blacks with respect to their mean scores on the TSO Performance variable”. Symbolically,
the null hypothesis can be represented in this way:
H0: M1=M2
M1 = mean TSO Performance score for the population of White TSOs
M2 = mean TSO Performance score for the population of Black TSOs
1.3.2.1 Group Statistics
Table G23 summarises the descriptive statistics for the two race groups of the TSO with the
TSO Performance dependent variable. For example, the mean performance orientation
score for the TSO White group is 3.5389 with a standard deviation of 0.30152 the mean
score for the Black group is 3.7713 with the standard deviation of 0.33392. Next, we review
the independent sample t-Test Table G23 below.
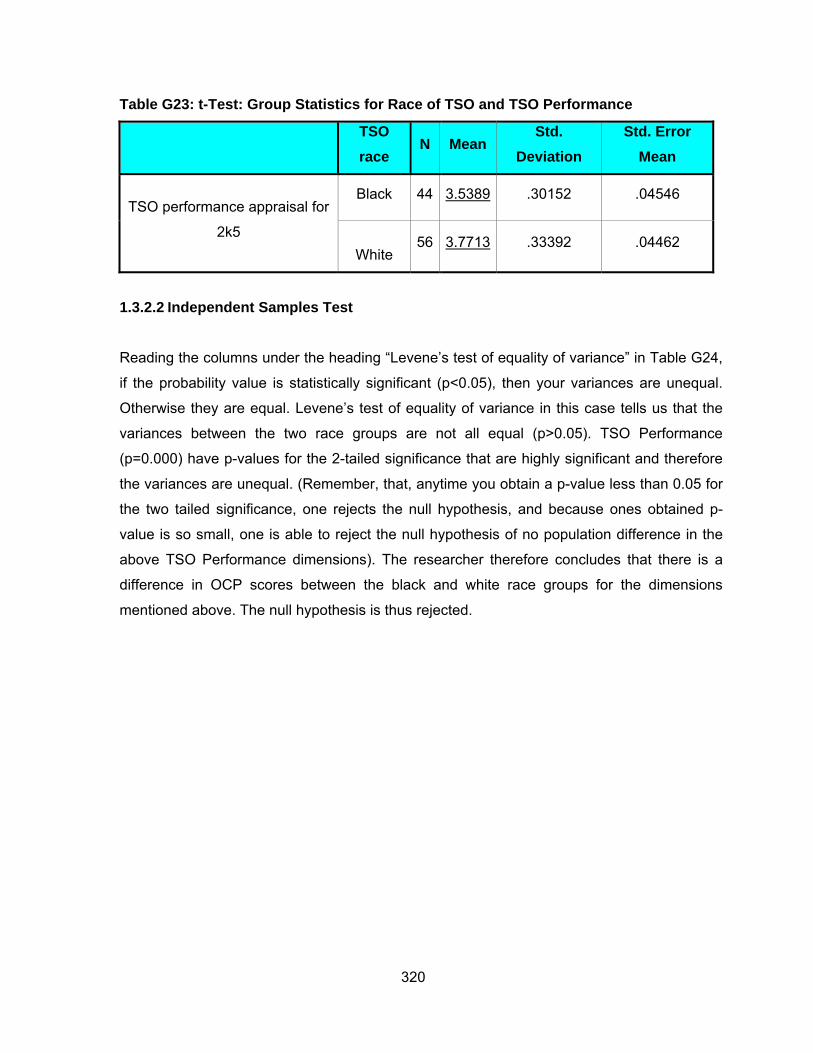
320
Table G23: t-Test: Group Statistics for Race of TSO and TSO Performance
TSO race
N Mean Std.
Deviation Std. Error
Mean
TSO performance appraisal for
2k5
Black 44 3.5389 .30152 .04546
White 56 3.7713 .33392 .04462
1.3.2.2 Independent Samples Test
Reading the columns under the heading “Levene’s test of equality of variance” in Table G24,
if the probability value is statistically significant (p<0.05), then your variances are unequal.
Otherwise they are equal. Levene’s test of equality of variance in this case tells us that the
variances between the two race groups are not all equal (p>0.05). TSO Performance
(p=0.000) have p-values for the 2-tailed significance that are highly significant and therefore
the variances are unequal. (Remember, that, anytime you obtain a p-value less than 0.05 for
the two tailed significance, one rejects the null hypothesis, and because ones obtained p-
value is so small, one is able to reject the null hypothesis of no population difference in the
above TSO Performance dimensions). The researcher therefore concludes that there is a
difference in OCP scores between the black and white race groups for the dimensions
mentioned above. The null hypothesis is thus rejected.

321
Table G24: Independent Samples Test for Race of the TSO and Performance
Levene's Test for
Equality of Variances t-Test for Equality of Means
F Sig. t df
Sig. (2-
tailed)Mean
DifferenceStd. Error Difference
95% Confidence Interval of the
Difference
Lower Upper
TSO
performance
appraisal for
2005
1.450 .232 -3.604 98 .000 -.23239 .06449 -.36036 -.10441
1.3.3 (R) – TSO Qualifications
You can state the null hypothesis in this section of the study as follows: “In this population of,
there is no difference between the TSO educational qualification group with less than N3 and
the TSO qualification with greater than and equal to an N3 with respect to their mean scores
on the TSO Performance variable”. Symbolically, the null hypothesis can be represented in
this way:
H0: M1=M2
M1 = mean TSO Performance score for the population of TSOs with educational
qualifications less than and N3
M2 = mean TSO Performance score for the population of TSOs with educational
qualifications greater than and equal to N3
1.3.3.1 Group Statistics
Table G25 summarises the descriptive statistics for the two major TSO educational
qualification groups on the TSO Performance dependent variable. For example, the mean
performance orientation score for the TSO educational group less than an N3 is 3.6600 with
a standard deviation of 0.31721. Similarly, the mean performance orientation score for the

322
TSO educational group greater than and equal to N3 is 3.7000 with a standard deviation of
0.36597. Next, we review the independent sample t-Test Table G25.
Table G25: Group Statistics
(R) TSO
qualifications N Mean
Std. Deviation
Std. Error Mean
TSO performance
appraisal for 2k5
N3 or less 58 3.6600 .31721 .04165
N4 or more 56 3.7000 .36597 .04890
1.3.3.2 Independent Samples Test
Reading the columns under the heading “Levene’s test of equality of variance” in table G26
below, if the probability value is statistically significant (p<0.05), then your variances are
unequal. Otherwise they are equal. Levene’s test of equality of variance in this case tells us
that the variances between the two TSO educational qualifications group are all equal
(p>0.05). We accept the null hypothesis of equal variance.
Table G26: Independent Samples Test (Equal variances assumed)
Levene's Test for Equality of
Variances t-test for Equality of Means
F Sig. t df Sig. (2-tailed)
Mean Differenc
e Std. Error Difference
95% Confidence Interval of the
Difference
Lower Upper
TSO
performance
appraisal for
2k5
1.248 .266 -.624 112 .534 -.04000 .06408 -.16696 .08696

323
1.3.4 (R) – Years in TSO Position You can state the null hypothesis in this section of the study as follows: “In this population,
there is no difference between the years in the TSO position group less than 5 years and the
years in the TSO position group greater than and equal to 5 years with respect to their mean
scores on the TSO Performance variable”. Symbolically, the null hypothesis can be
represented in this way:
H0: M1=M2
M1 = mean TSO Performance score for the population of years in the TSO position
group less than 5 years
M2 = mean TSO Performance score for the population of years in the TSO position greater
than and equal to 5 years
1.3.4.1 Group Statistics
Table G27 summarises the descriptive statistics for the years in the TSO position on the TSO
Performance dependent variable. For example, the mean TSO performance score for less
than 5 years group is 3.6087 with a standard deviation of 0.33805. Similarly, the mean TSO
Performance score for the greater than and equal to 5 year group is 3.7334 with a standard
deviation of 0.33436. Next, we review the independent sample t-Test Table G27.
Table G27: Group Statistics
(R) Yrs in TSO
position N Mean Std.
Deviation Std. Error
Mean
TSO performance
appraisal for 2k5
1 to 5 years 52 3.6087 .33805 .04688
Greater than 6 yrs 64 3.7334 .33436 .04180
1.3.4.2 Independent Sample Test
Reading the columns under the heading “Levene’s test of equality of variance” in Table G28
below, if the probability value is statistically significant (p<0.05), then your variances are
unequal. Otherwise they are equal. Levene’s test of equality of variance in this case tells us
that the variances between the two years in the TSO position group are not all equal
(p>0.05). Reviewing the 2-tailed significance for the years in the TSO position TSO

324
Performance (p=0.049) you are able to reject the null hypothesis of no population difference
for the above two dimensions of TSO Performance. We reject the null hypothesis
Table G28: Independent Samples Test (Equal variances assumed)
Levene's Test for Equality of
Variances t-Test for Equality of Means
F Sig. t df
Sig. (2-
tailed)Mean
DifferenceStd. Error Difference
95% Confidence Interval of the
Difference
Lower Upper
TSO
performance
appraisal for
2005
.171 .680 -1.989 114 .049 -.12478 .06273 -.24906 -.00051
1.3.5 (R) – Number of employees
You can state the null hypothesis in this section of the study as follows: “In this population,
there is no difference between the number of employees reporting to the TSO group less
than 25 and number employees reporting to the TSO group greater than and equal to an 25
with respect to their mean scores on the TSO Performance variable”. Symbolically, the null
hypothesis can be represented in this way:
H0: M1=M2
M1 = mean TSO performance score for the population of the number of people reporting to
the TSO group less than 25
M2 = mean TSO Performance score for the population of the number of people reporting
to the TSO group greater than and equal to 25

325
1.3.5.1 Group Statistics
Table G29 summarises the descriptive statistics for the years in the TSO position on the TSO
Performance dependent variable. For example, the mean TSO performance score for less
than 5 years group is 3.6557 with a standard deviation of 0.29368. Similarly, the mean TSO
performance score for the greater than and equal to 5 year group is 3.7009 with a standard
deviation of 0.38543. Next, we review the independent sample t-Test Table G29.
Table G29: Group Statistics
(R) No. of employees N Mean Std.
Deviation
Std. Error
Mean
TSO performance
appraisal for 2005
25 people or less 60 3.6557 .29368 .03791
Greater than 25 people 56 3.7009 .38543 .05150
1.3.5.2 Independent Samples Test
Reading the columns under the heading “Levene’s test of equality of variance” in Table G30
below, if the probability value is statistically significant (p<0.05), then your variances are
unequal. Otherwise they are equal. Levene’s test of equality of variance in this case tells us
that the variances between the two years in the number of employees reporting to the TSO
group are not all equal (p>0.05). Reviewing the 2-tailed significance for the TSO performance
(p=0.477) you are able to accept the null hypothesis of no population difference for the above
two dimensions of TSO performance.

326
Table G30: Independent Samples Test (Equal variances assumed)
Levene's Test for Equality of
Variances t-Test for Equality of Means
F Sig. t df
Sig. (2-
tailed)Mean
DifferenceStd. Error Difference
95% Confidence Interval of the
Difference
Lower Upper
TSO
performance
appraisal for
2005
3.579 .061 -.714 114 .477 -.04523 .06337 -.17076 .08030

327
14 APPENDIX H: CRITERIA FOR THE SIGNIFICANCE OF FACTOR LOADINGS
Ensuring practical significance Factor loadings greater than +/0.3 are considered to meet the minimal level; loadings of +/-
0.4 are considered more important; and if loadings are +/- 0.5 or greater, they are considered
practically significant. Thus the larger the absolute size of the factor loadings, the more
important the loadings in interpreting the factor matrix. Because loadings are the correlation
of the variable and the factor, the squared loadings is the amount of the variable’s total
variance accounted for by the factor. Thus, a 0.3 loading translates to approximately 10%
explanation, and 0.5 loading denotes that 25% of the variance is accounted for by the factor.
The loadings must exceed 0.7 for the factor to account for 50 % of the variance. These
guidelines are applicable when the sample size is 100 or larger (Hair et al., 1998).
Assessing Statistical significance Table H1: Guidelines for identifying significant factor loadings based on sample size
Factor loadings Sample size needed for significance 0.3 350
0.35 250 0.4 200
0.45 150 0.50 120 0.55 100 0.6 85
0.65 70 0.7 60
0.75 50
A factor loading represents the correlation between an original variable and its factors. With
the stated objective of obtaining a power level of 80 %, the use of a 0.5% significance level,
and the proposed inflation of the standard errors of factor loadings, table H1 contains the
sample sizes necessary for each factor loading value to be considered significant. For
example, in a sample of 100 respondents, factor loadings of 0.55 and above are significant.
However, in a sample of 50, a factor of 0.75 is required for significance. In comparison with
the prior rule of thumb, which denoted all loadings of 0.3 as having practical significance, this
approach would consider loadings of loadings of 0.3 significant only for a sample size of 350
or greater (Hair et al., 1998).

328
15 APPENDIX I : APPROVALS FROM THE HAYGROUP FOR THE USE OF THE ECI 2.0
From: <[email protected]> To: <[email protected]> Date: Thu, Mar 17, 2005 9:30 PM Subject: Re: Minnesh Bipath Application to Use The ECI instrument for Research Purposes Dear Minnesh, Congratulations! You have been approved to do research using the Emotional Competence Inventory (ECI). Attached you will find four documents: 1. ECI 2.0 360 Version.doc - This is a copy of the ECI 360 rating booklet. You may print or copy this document as needed for your research. 2. ECI 2.0 Self Version.doc - This is a copy of the ECI Self rating booklet. You may print or copy this document as needed for your research. 3. ECI 2.0 Scoring Instructions.doc - This document contains the instructions necessary for you to calculate the ECI 2.0 scores. The scoring instructions document is a bit outdated, but conceptually the scoring is the same. 4. ECI 2.0 Scoring Key.doc - This contains the scoring key (list of items for each competency and cluster) for the ECI. Use this document to create variables in your statistical program for each ECI competency and cluster scores. We look forward to hearing about your results. Please mail us a copy of your research paper or publication when completed to the following address: Ginny Flynn Hay Group 116 Huntington Ave. Boston MA 02116 Sincerely, Ginny

329
>>> <[email protected]> 03/17/05 4:26 PM >>> Hi Minnesh, The review committee has provided the following response regarding your research proposal. Please respond to the concerns listed, and I will forward to the committee. Regards, Ginny Flynn Director, Sales & Service Hay Resources Direct The Bipath proposal is a fantastic one. It would provide data on the organisational level of validation against both organisational climate/culture and performance. I was not clear on two issues: 1) The ECI-2 would be used as a 360 with the leader/founder; 2) How many organisations would be in the sample? If the first was "yes," and the second was sufficient to run multivariate statistical analyses, then it is approved. But I would like to get confirmation of these two answers before approving it. ----- Forwarded by Ginny Flynn/BOSTON/US/HAYGROUP on 03/17/2005 09:20 AM Erin McGrath

330
16 APPENDIX J: APPROVALS FROM PROF. SARROS FOR THE USE OF HIS MODIFIED OCP INSTRUMENT
From: James Sarros <[email protected]> To: Minnesh Bipath <[email protected]> Date: Tue, Jun 22, 2004 1:54 AM Subject: Re: paper on leadership and its impact on organisational culture Hello Minnesh You will be able to find a description of the instrument in the following article: Sarros, James C., Judy Gray and Iain L. Densten. (2002). Leadership and its impact on organisational culture. International Journal of Business Studies, 10(2), 1-26. We also have an article in review presently which outlines in detail how the revised version of the OCP was developed as follows: Sarros, James C., Judy Gray and Iain L. Densten. (2004). The organisational culture profile revisited and revised: an Australian perspective. Australian Journal of Management (in review). In the meantime, attached is the revised OCP and all the scoring information you require. Please cite the source as listed above. James

331
17 APPENDIX K: ECI 2.0 ACCREDITATION