Embed Size (px)
Citation preview

Journal of Econometrics 28 (1985) 5-28. North-Holland
THE DURATION OF CONTRACT STRIKES IN U.S. MANUFACTURING
John KENNAN *
The Universi(y of Iowa, Iowa Cif.y, IA 52242, USA
This paper develops new evidence on the hazard function for strike duration, and on cyclical changes in this function, using data on contract strikes in U.S. manufacturing industries. A flexible duration model is estimated, and it is found that the hazard rate is generally a U-shaped function of strike age. The level of industrial production is found to have a significant positive effect on the hazard rate: strike duration is countercyclical. A convenient parametric model of heterogeneity and duration dependence is introduced, in which the logit of the hazard rate is a polynomial function of strike age, up to a random individual effect drawn from a beta distribution. Estimates of this ‘beta-logit’ model indicate that it is difficult to detect the influence of unobserved heterogeneity on the aggregate hazard function for strike duration.
1. Introduction
This paper develops new evidence on the hazard function for strike duration, and on cyclical changes in this function, using data on contract strikes in U.S. manufacturing industries. A convenient parametric model of heterogeneity and duration dependence is introduced, in which the hazard rate is a flexible function of strike age, up to a random individual effect drawn from a beta distribution. Estimates of this model indicate that it is difficult to detect the influence of unobserved heterogeneity on the aggregate hazard function for strike duration.
Empirical studies of cyclical fluctuations in strike activity have a long history, and the conclusion that strikes are procyclical is widely accepted among labor economists. The basic evidence is given by Rees (1952) who applied the Mitchell-Bums-NBER business-cycle tools to monthly data on strikes occurring during the interwar period. Rees showed that although the relationship between strikes and economic activity appears irregular for indi- vidual business cycles, when the data are averaged across business cycles, the evidence of conformity is persuasive.
This empirical finding has had a substantial effect on the development of economic theories of strikes. Indeed, were it not for this finding, theorists
might be inclined to agree with Hicks (1946) that strikes are due to irrational
*I thank Bill Even, Alan Harrison. Joel Horowitz, Tony Lancaster and Forrest Nelson for useful comments.
0304-4076/85/$3.30~1985, Elsevier Science Publishers B.V. (North-Holland)

6 J. Kennun, Contruct strikes in U.S. manufucturrng
behavior or mistaken beliefs, and let it go at that. As Ashenfelter and Johnson (1969) remark, however, it is rather unsatisfactory to have a theory in which mistakes or irrationality fluctuate with the business cycle. On the other hand, it is difficult to construct a satisfactory theory of mistakes. For example, if the theory predicts the duration of strikes, and the eventual terms of settlement, the parties can generally reach an agreement which does not involve a strike, and which leaves both sides better off. Thus the theory ceases to hold as soon as the parties become aware of it.
The ‘total cost’ theory of strikes, developed by Reder and Neumann (1980) and by Kennan (1980a), views fluctuations in strike activity as being due to fluctuations in the total cost of such activity (i.e., the sum of costs over both
workers and firms). The total cost model predicts that strikes will fluctuate countercyclically: when production is near its peak, the opportunity cost of a strike is relatively high, so the number of strikes should be reduced. This prediction is evidently at odds with the data. On the other hand, the results presented below show that, even though there may be procyclical fluctuations in the number of strikes occurring, there are countercyclical fluctuations in strike duration. Specifically, the duration of contract strikes is negatively related to the level of industrial production. This finding supports the total cost
theory. Since there is no widely accepted economic theory of strike duration, the
statistical model used in this paper is not conditioned on any particular theory. Rather, the paper concentrates on summarizing the facts which must be explained by any successful theory of strikes.
2. Statistical models of strike duration
There is a small but informative statistical literature on strike duration, which was apparently started by Horvath (1968). The object here is to characterize the probability distribution from which strike durations are drawn, and, in particular, to investigate the hazard function associated with this distribution. Horvath (1968) showed that the Weibull distribution, with a downward-sloping (loglinear) hazard function, gives a good fit to data on all U.S. strikes ending in 1961. Horvath’s estimated distribution fits very well for the period 195331974 also, but it conceals large differences between the distributions for contract and non-contract strikes [Kennan (1980a)l. Recently, Tracy (1984) has estimated a Weibull duration model for U.S. contract strikes. Lancaster (1972) found that the inverse Gaussian distribution gave a good fit for data on British strikes beginning in 1965, but Newby and Winterton (1983) have shown that this too conceals large differences between the distributions for ‘official’ and ‘unofficial’ strikes. Typically, both U.S. contract strikes and British official strikes last about a month, while non-contract or unofficial
strikes last less than a week.

J. Kennan, Contract strikes in U.S. mnnufactur~ng 7
A serious limitation of these duration models is that they impose arbitrary (and probably false) restrictions on the shape of the hazard function. The Weibull distribution has a monotonic hazard function, and the hazard rate for both the lognormal and inverse Gaussian distributions rises initially, reaches a peak, and then falls toward some asymptotic value [Lancaster (1972), Kalbfleish and Prentice (1980)]. According to the estimates presented in this paper, the most likely hazard function for strike duration is basically U-shaped. This
could perhaps be generated by some mixture of upward-sloping hazard func- tions, but this imposes heterogeneity, rather than allowing the data to speak for
themselves. Moreover, the gamma mixture of Weibulls used by Morrison and Schmittlein (1980) cannot generate a U-shaped aggregate hazard function.
Let s denote the age of a strike, X a vector of observed characteristics and u a scalar summarizing unobserved characteristics. The conditional probability that a strike will continue for at least one more day, given the characteristics X, u and given that it has already lasted more than s days, is written as p(sl X, u). The hazard function, defined as the conditional probability that the strike will end after the beginning of day s, but before the beginning of day s + 1, is then 1 - p(sJX, u). The survival function for an individual strike, defined as the probability P(slX, u) that a strike will last more than s days, is
P(slX, u) = *fI,PW~ u>. The likelihood of a strike which lasts exactly D days, given the characteristics
X and u, is
L(DJX,u)=P(D-lIX,u)-P(DIX,u).
Since u is not observed, it must be integrated out of the likelihood function. Let F( u[ X) be the conditional distribution of u, given X. Then the likelihood can be written as
L(DIX) = Q(D - 11X) - Q(Dlx)>
where Q(s I X) is the aggregate survival function, defined as
The likelihood function can be written as
L(DlX) = Q(D - W)[l- dDIX)l D-1
= [l-&V)] n dslX)> s=o
where q( s[ X) is the aggregate continuation probability for strikes which have

8 J. Kennan, Contract strikes in U.S. manujacrurrng
lasted s days, which is defined as
4(4x) = Q(M) Qb - 11X) .
The aggregate hazard function is 1 - q( $1 X), where the ‘hazard’ refers to settlement of the strike.
Note that q( s I X) is not the average continuation probability for all strikes, but the weighted average of p(slX, o), where the weights are the survival probabilities P(s - 11X, u). In particular, if p(slX, u) is independent of s (but not independent of u) q(slX) will be an increasing function of S, because the set of strikes which survive s days will be increasingly dominated by strikes which started out with high values of p(slX, u).
Identi$cation
There is a well-known identification problem in models of this kind, since the functions P and F affect the likelihood only through the aggregate survival function Q. For example, if u is distributed over V discrete points, and if strike durations are observed over T days, the relationship between P, F and Q can be regarded as a system of T equations relating T estimated values of Q to TV unknown individual continuation probabilities, and V - 1 unknown mixing
probabilities. If the functional form of P(slX, u) is known, the parameters of this function can be identified without making restrictive assumptions about the distribution F. In the case of strikes, however, economic theory provides little guidance about the form of the hazard function, so it seems appropriate to adopt a very flexible specification for this function. This means, unfor- tunately, that heterogeneity will be difficult to detect, since if P(slX, u) is completely unrestricted, the observed survival function Q( sl X) can be equated with P(slX, u) by specifying a degenerate distribution for u.
Despite the identification problem, the estimated aggregate hazard function for strikes reported in section 4 below provides some useful information regarding the hazard function for individual strikes. Heckman and Singer (1982) show that if the aggregate hazard function is upward sloping at s days, then the individual hazard function must also be upward sloping at s days, for at least some values of u.l As can be seen from the empirical hazard function
‘This does not mean that the aggregate hazard function is always biased in favor of negative duration dependence, when compared with the individual hazard function evaluated at the mean of the I, distribution. For example, suppose that tr is drawn from a beta distribution with mean i, with p(s, o) = u for s I S and p(s, U) = 1 - o for s > S. Then some strikes have increasing hazard functions, while others have decreasing hazard functions, and the ‘representative’ strike has a constant hazard p(s, 5) = f The aggregate hazard function is generally decreasing, but it increases at S. and the extent to which it increases is positively related to the extent of the heterogeneity in c (measured by the variance of the beta distribution).

J. Kennun. Con~ruc~ strikes in U.S. munujucturing 9
shown in fig. 2, one can infer that the chances of settling a strike tend to
improve after about three months. For younger strikes, the decline in the aggregate hazard function might be due either to declining individual hazard functions, or to heterogeneity bias.
3. A beta-logit model of heterogeneity and duration dependence
To obtain an estimable model, it is necessary to specify the continuation probability p(sJX, IJ) in more detail. As a first step, I assume that heterogene-
ity enters multiplicatively:
P(SlX, 0) = V,(SlX), OS/Ill, 0 <p,(slX) Il.
Then the survival function for an individual strike is
P(s(X, u) = u”+‘P,(s(x), where
The aggregate survival function is
where MS denotes the s th moment of the distribution of u,
M,(X)+“dF(vJX).
Finally, the aggregate continuation probability is
4(4X) = 4(X)P,(4X),
where
4(X)-K+,(X)/K(X).
As Heckman and Willis (1977) observe, the family of beta distributions allows a flexible specification of unobserved heterogeneity, since the beta density can assume a variety of shapes over the unit interval. In particular, the beta specification does not rule out a bimodal distribution for U; in addition, the beta distribution gives a simple form for 6,(X). Thus, suppose the density of 0 is

10 J. Kennun. Contract strikes in U.S. munufucturtng
where r( .) denotes the gamma function. Then the moments of u are given by
In particular, since r(z) = (L - l)T(z - 1) for any z, the mean of the beta distribution is
7r(X)=M1(X)= P(X) PLX)-tV(X).
The variance of o is
var( u[X) = &4X)(1-r(X)),
where
1
(y= /A(x)+Y(x)’
I assume that (Y is a positive constant which does not depend on X. This means that p(X) and v(X) are defined as
Pw=$w and u(X)=i(l -r(X)).
Note that when (Y is zero the variance of u is zero, so there is no heterogeneity. The effect of heterogeneity on the aggregate hazard function depends on
S,(X), which is a ratio of adjacent moments of the distribution for u. In the case of the beta distribution, this ratio is given by
The effect of heterogeneity can be seen by comparing the aggregate continua-

J. Kennun. Contrucr strikes in U.S. manufacruring 11
tion probability with the individual continuation probability for a representa- tive individual strike. Since r(X) I S,(X), this gives
Thus the aggregate hazard function lies below the hazard function for the average strike, as defined by the mean of the distribution of u. Also, since 6,(X) is an increasing function of s, the gap between these two functions widens as strike age increases.
To complete the empirical model it is necessary to parameterize r(X) and pI( SI X). First, a logit specification is adopted for the ‘representative’ continua- tion function:
J+IX,~(X))== l 1 + ewsM ’
where the vector X(s) denotes the values of the explanatory variables after s days. Next, the distribution of individual continuation functions around this representative function is determined by the distribution of initial continuation rates, given the assumption of multiplicative heterogeneity. Accordingly, let u be identified with p(OlX, u); this has a beta distribution with mean r(X), so
77(x)= 1
1 + ewO’B ’
which implies
The aggregate continuation probability is then given by
1 + ~(1 + eXCojB) q(slx) = (1 + (ys)(l + ,WsM)
This completes the specification of the beta-logit model. The interpretation of q(slX) as a beta-mixture of individual logit hazard functions requires that the variance parameter (Y be non-negative. In addition, since p( s/ X, 1) = p,(slX), it is necessary that X(s)/3 be no less than X(O)p, so that pt(slX)

12 J. Kennan, Coniract strikes in U.S. manufacturing
does not exceed unity. From a theoretical point of view, this restriction is unfortunate, since it means that the continuation probability for an individual strike, p(slX, u), is bounded above by the initial continuation probability p(OlX, u). In practice, however, the restriction will not be important when continuation probabilities are small, as in the present application, since the upper tail of the u-distribution will have negligible weight. Moreover, even if the restrictions implied by the beta-logit model are not satisfied, the expression for q(slX) may be interpreted as the individual hazard function in a homoge- neous model, in which case the only requirement is that q(slX) lies between zero and one. Accordingly, no restrictions were imposed in estimating the
beta-logit model. The beta-logit model is attractive for several reasons. First, it gives a simple
closed-form expression for the likelihood function. Second, when there is no unobserved heterogeneity (a = 0) the model reduces to a familiar logit form, which provides a convenient point of reference. In addition, when powers of s are included among the explanatory variables X, a very flexible specification of the individual hazard function is obtained. * In particular, the individual hazard need not be a monotonic function of duration (as in the Weibull model), and the shape and location of the hazard function may be influenced
by the explanatory variables.3
4. Empirical results
4.1. Data
This section describes estimates of the hazard function for strike duration, using data for U.S. manufacturing industries for the period 1968 through 1976. The strike data were taken from the BLS Historical File, and included all strikes involving thousand workers or more, occurring at the expiration or re-opening of a contract, with major issue classified as ‘General Wage Changes’ by BLS4
In order to measure cyclical fluctuations in strike duration, the influence of industrial production on the hazard function was analyzed. Given the short duration of most strikes, it seems reasonable to associate a fixed value of industrial production with each strike. First, seasonal and trend components were removed from monthly data on industrial production in manufacturing (measured in logs), by taking the residual from a regression on time, time
‘This is a generalization of the ‘beta-logistic’ model used by Heckman and Willis (1977). which assumes constant individual hazard rates.
3 In an earlier paper [Kennan (198Ob)] a special case of the homogeneous logit model was used to estimate the effect of unemployment insurance payments to strikers on the hazard function.
‘A summary of the strikes data for each year can be found in the BLS Bulletin series [e.g. U.S. Department of Labor (1978)]. gee Kennan (1980a) for a general description of these data, and a discussion of the relevance of the contract status and major issue classifications.
J. Kennun. Conrruct srrikes in U.S. manu/ucturing 13
squared and monthly dummies. Then each strike was assigned the residual value of industrial production for the month in which the strike began. The industrial production residuals and strike durations are listed in table 1.
Since BLS did not record strikes lasting less than one day, the data are censored from the left at one day. Given that the model deals only with conditional probabilities for the continuation or settlement of a strike, this censoring does not cause any trouble. It is convenient to measure strike age relative to the censoring point. Thus let s’ be actual strike age, let s0 be the censoring point, and define s as s’ - sO. The vector of explanatory variables for a strike labeled i after s days can be written as
where Z, denotes the value of industrial production in the month when strike i began.
4.2. Maximum likelihood estimates
In the beta-logit model, the contribution of the ith strike to the loglikelihood function is
D, - 1
logh= c logq,(s)+log[l-q,(D;)l, s = 0
where D, is the duration of the strike, and the continuation probability q,(s) is
4its) = 1+~~[1+exp(P~+P~Z,)l
(1 +as)[l +exp(&+&s+ ... +P,,S”+PZZ,)I .
Table 2 shows the results of fitting both the homogeneous logit model and the beta-logit model to the data listed in table 1. A flexible hazard function was compared with simple constant or linear specifications. The data rejected simple hazard functions in favor of a hazard generated by a sixth-order polynomial (m = 6). For example, the likelihood ratio statistic for testing a sixth-order against a ninth-order polynomial is 4.2, with a critical level’ of 24%. so the sixth-order polynomial is apparently flexible enough to fit the data. A fifth-order polynomial is rejected at 1.9% on the other hand. a quadratic is rejected at 2.0%, and a linear specification is rejected at l.l%, when tested against the sixth-order model.
The parameter estimates for the case of a sixth-order polynomial are shown in table 3, and the shape of the estimated hazard function over the first 150
‘The critical level of a test statistic, as defined by Lehmann (1959). is the smallest significance level at which the null hypothesis would be rejected.

_
Tab
le 1
Dat
a u
sed
in h
azar
d fu
nct
ion
est
imat
ion
.
Dat
e N
Z
6801
5
0.01
517
6802
4
0.00
997
6803
6
0.01
170
6804
16
0.
0047
3 68
05
5 0.
0127
7 68
06
8 0.
0113
8 68
07
8 0.
0042
4 68
08
9 ~
0.0
0687
68
09
10
- 0.
0002
3 68
10
10
0.00
791
6811
7
0.02
538
6812
1
0.02
939
6901
6
0.03
927
6902
5
0.03
710
6903
6
0.04
186
6904
5
0.03
156
6905
13
0.
0218
0 69
06
6 0.
0229
9 69
01
10
0.02
057
6908
13
0.
0219
1 69
09
4 0.
0209
4 69
10
8 0.
0217
1 69
11
5 0.
0129
8 70
01
2 ~
0.0
0268
70
02
2 -
0.00
987
7003
2
~ 0
.014
91
7004
8
- 0.
0236
1 70
05
4 -
0.03
252
7006
11
-
0.03
957
7007
4
- 0.
0416
3 70
08
8 -
0.05
107
7009
9
-0.0
6215
5 23
34
12
28
60
1
2 8
3 4
13
9 9
11
I 9
13
3 3
8 4
5 7
1 2
7 1
4 4
5 8
14
3 4 4
9 17
34
46
5
18
44
7 14
31
1
2 I
9 37
41
2
13
25
3 4
5 2
11
16
2 2
4 6
7 32
32
71
7
27
14
26
4 4
43
3 13
30
3
17
19
15
21
52
3 5
9
52
52
165
10
22
44
14
28
28
31
35
43
49
14
26
29
52
130
10
24
53
91
205
11
18
22
48
53
16
17
44
57
64
7 12
30
46
53
30
32
44
49
13
33
98
65
82
44
59
60
32
77
10
18
23
25
36
49
52
119
31
31
35
44
45
6 7
9 14
23
14
7 6 16
18
31
42
44
70
60
62
64
68
82
154
28
72
99
104
114
109
26
52
61
148
168
Du
rati
ons
37
45
48
49
50
60
102
103
56
70
175
61
208
42
46
47
50
77
53
111
26
37
46
47
77
152
153
216
2 11
19
26
30
36
47
50
87

7010
9
7011
4
7101
9
7102
8
7103
5
7104
5
710s
10
71
06
3 71
07
S
7108
4
7109
6
7110
6
7111
5
7112
1
7201
2
7202
2
7203
2
7204
2
7205
4
7206
3
7207
2
7208
3
7209
1
7210
2
7212
1
7301
1
7302
1
7303
1
7304
5
7305
7
7306
2
7307
9
7308
3
7309
6
7310
9
7311
3
7312
3
- 0.
0862
6 -
0.09
308
- 0.
0477
7 -
0.05
161
- 0.
0547
3 -
0.05
417
- 0.
0519
6 -
0.05
467
- 0.
0616
9 -
0.06
945
- 0.
0582
4 -
0.04
592
9 15
20
24
84
11
7 -
0.04
610
1 23
25
59
63
-
0.03
983
- 0.
0135
3 -
0.00
784
- 0.
0035
4 0.
0130
3 0.
0051
3 0.
0053
5 -
0.00
426
0.01
355
0.02
125
0.03
531
0.05
650
0.06
344
0.07
687
0.07
902
0.07
602
0.07
744
0.07
427
0.07
816
0.07
036
0.07
217
0.07
773
0.08
554
0.07
418
3 5
7 17
23
30
10
4 10
8 19
2 18
40
47
57
1
S
10
15
19
28
42
64
148
4 6
12
12
28
105
112
163
11
12
29
50
235
10
19
41
52
100
3 4
10
12
34
88
101
102
104
124
15
61
98
22
24
38
64
84
5 6
70
70
1 11
18
19
50
90
179 92
153
17
226
13
23
2 38
3
3 6
139
2 25
85
13
12
5 4
54
91
38 2
6 61
18
64
12
2 11
16
31
39
41
2 4
5 7
9 13
38
3
10
4 5
22
27
28
36
39
85
191
5 44
56
6
21
33
109
125
127
8 9
13
14
IS
28
SO
60
13
5 5
7 16
21
37
41

Dat
e N
Z
D
ura
tion
s z
____
74
01
7402
74
03
7404
74
05
7406
74
07
7408
74
09
7410
74
11
7501
75
02
7503
75
04
7505
75
06
7507
75
08
7510
75
11
7512
76
01
7602
76
03
7604
76
05
7606
76
07
7608
76
09
7610
76
11
7612
- 0.
0705
3 2
2 20
24
57
5 9 10
9 15
18
13
10 9 7 7 3 3 4 2 1 2 2 3 5 5 1 1 1 1 8 5 9 6 3 4 6 2 3
0.06
554
0.06
753
0.06
072
0.06
508
0.06
450
0.06
319
0.05
579
0.05
197
0.03
458
- 0.
0022
5 -
0.09
771
-0.1
2124
-
0.13
996
- 0.
1259
0 -
0.12
224
- 0.
1044
3 -
0.08
656
- 0.
0627
9 -
0.05
790
- 0.
0491
9 -
0.04
494
- 0.
0270
0 -
0.00
601
- 0.
0069
3 -
0.00
528
- 0.
0015
5 -
0.00
700
- 0.
0015
7 0.
0013
4 -
0.01
281
- 0.
0153
8 -
0.00
703
- o.
m3
8 16
24
59
11
5 12
3 14
1 14
6 14
6 3
15
15
18
20
26
34
84
122
174
4 14
15
17
22
24
39
53
10
7 5
9 10
16
22
24
31
31
34
38
42
65
74
10
1 13
0 1
2 2
3 3
4 8
11
22
23
27
32
33
35
43
43
44
100
2 19
20
20
20
23
24
33
33
63
67
94
11
6 5
1 8
15
15
22
23
26
27
55
160
5 8
13
20
42
53
59
83
101
2 8
11
15
22
58
60
108
i?
31
42
45
50
61
106
142
.a
36
52
99
2 38
47
62
38
51
98
13
3 s 2
9 86
C
I
141
9
5 49
F
8
13
s 2
6 37
s
28
36
48
136
139
cl,
2 14
15
33
14
3 3 B
42
Q
8
R
122
P
2.
56
D
14
14
106
127
131
140
141
163
22
23
29
99
118
2 12
12
21
21
27
38
42
11
7 2
12
19
22
75
126
8 36
10
7 5
5 29
15
1 9
16
29
35
65
136
50
55
1 12
27
J. Kennun, Conrruc~ strikes in U.S. n~unufuc~urrng 17
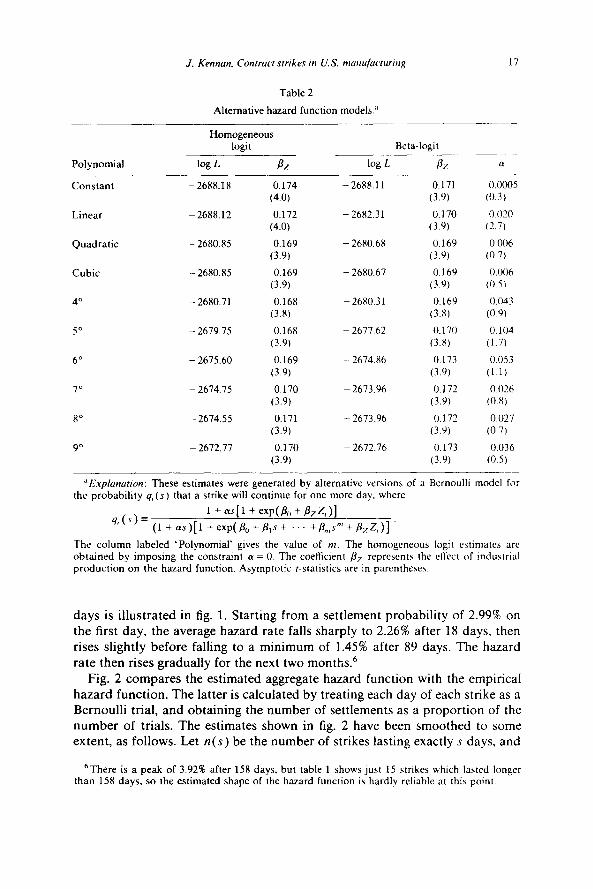
Table 2
Alternative hazard function models.”
Polynomial
Constant
Linear
Quadratic
Cubic
4”
5”
6”
7”
8O
9”
Homogeneous logit
log L P/
-268X.18 0.174
(4.0)
- 2688.12 0.172
(4.0)
- 2680.85 0.169
(3.9)
- 2680.85 0.169
(3.9)
- 2680.71 0.168
(3.8)
- 2679.75 0.168
(3.9)
- 2675.60 0.169
(3.9)
- 2674.75 0.170
(3.9)
- 2674.55 0.171
(3.9)
- 2612.77 0.170
(3.9)
Beta-logit
log 1. P7 a
- 2688.11 0.171 0.0005
(3.9) (0.3)
- 2682.31 0.170 0 020
(3.9) (2.7)
- 2680.68 0.169 0.006
(3.9) (0 7)
- 2680.67 0.169 0.006
(3.9) (0.5)
- 2680.31 0.16Y 0.043
(3.8) (0.9)
- 2677 62 0.170 0.104
(3.8) (1.7)
-2674.X6 0.173 0.053
(3.9) (1.1)
- 2673.96 0.172 0.026
(3.9) (0.X)
- 2673.96 0.172 0.027
(3.Y) (0.7)
- 2672.16 0.173 0.036 (3.9) (0.5)
-‘E.q&~~tron: These estimates were generated by alternative versions of a Bernoulli model for the probability q,(s) that a strike will continue for one more day. where
4,(s) = (1
1 +as[l +exp(&+&T)l + CXS)[ 1 + exp( Pa + &s + +&s”’ + &z,)]
The column labeled ‘Polynomial’ gives the value of nt. The homogeneous logit estimates arc obtained by imposing the constraint a = 0. The coefficient /Ir represents the effect of industrial production on the hazard function. Asymptotic r-statistics are in parentheses.
days is illustrated in fig. 1. Starting from a settlement probability of 2.99% on the first day, the average hazard rate falls sharply to 2.26% after 18 days, then rises slightly before falling to a minimum of 1.45% after 89 days. The hazard rate then rises gradually for the next two months.6
Fig. 2 compares the estimated aggregate hazard function with the empirical hazard function. The latter is calculated by treating each day of each strike as a Bernoulli trial, and obtaining the number of settlements as a proportion of the number of trials. The estimates shown in fig. 2 have been smoothed to some extent, as follows. Let n(s) be the number of strikes lasting exactly s days, and
‘There is a peak of 3.92% after 158 days. but table 1 shows just 15 strikes which lasted longer than 158 days, so the estimated shape of the hazard function is hardly reliable at this point.

18 J. Kennun. Contruct strikes in U.S. munufucturing
Table 3
Maximum likelihood parameter estimates: 6-th order polynomial (asymptotic t-statistics in parentheses).”
Homogeneous
logit
Beta-logit
Z included Z excluded
Constant - 3.509 (26.X)
, - 1.583
(1.7) 1
,- 3.617
(1.9)
\’ - 3.611
(2.2)
,4 1.592
(2.5) i ., - 0.310
(2.7)
,(’ 0.022
(2.X)
Z 0.169
(3.9)
a 0
Lo&k&hood - 2675.60
- 3.480 (24.5)
0.397
(0.5)
0.762
(0.5)
- 1.346 (1.1)
0.702
(1.6)
- 0.148
(1.9)
0.011
(2.2)
0.173
(3.9)
0.053
(1.1)
.2674.86
- 3.444 (24.1)
0.465
(0.6)
0.560
(0.4)
- 1.186
(1.0)
0.638
(1.5)
-0.136
(1.X)
0.010
(2.1)
0
0.055
(1.1)
26X2.53
JE.~~/~~~utro~~: These estimates were generated by a Bernoulli model for the probability q,(s) that a strike will continue for one more day, where
4,(s) - (1
1 + a~[1 + exp(t% + &Z,)l +as)[l+exp(li,+&s+ ... +&s”‘+P,Z,)]
The value of nr is 6. In order to improve the scaling of the p coefficients. the duration variable s was normalized so that the mean duration of strikes :n the sample was unity.
let N(s) be the number lasting at least s days. Then the empirical hazard rate at s days may be calculated as h(s) = n(s)/N(s). For moderately large S, however, the number of trials N(s) is small, so the estimate h(s) will have a large sampling variance. If the true hazard rate 1 - q(s) is a smooth function of s, good estimates can be obtained by treating the hazard rate as constant over some interval [s - r, s + r]. Then the empirical hazard rate can be estimated by
hr(.s)= jj n(s+i) i N(s+i). ,= --r I ,= -r
Here r was chosen so that the numerator in this expression was at least 1000,

J. Kennan. Contract strikes rn U.S. munujucturrng 19

20 J. Kennan. Contruct strikes in U.S. munufacturing
1”“1’“‘1”“1’“‘1”“1”“1”“~‘“‘~ t
” 0 * 0 n 0 n 0 n
. . n n * n c 0

J. Kennan, Contract strikes in U.S. manufacturing 21
for each s, which implies that the standard error of the estimate h,(s) is
approximately 0.5 % .
4.3. Cyclical fluctuations
Surprisingly, it was found that a substantially better fit could be obtained by using a dummy variable to indicate whether industrial production was above or below trend, instead of using the numerical value of the industrial produc- tion residual. Accordingly, the results presented below refer to this dummy variable.7
The effect of industrial production on the hazard function is firmly estab- lished in table 2: there is a statistically significant countercyclical variation in
the duration of strikes. This effect (represented by the coefficient /?z in the table) is very stable as the order of the polynomial in s is varied, and it is not affected by whether the homogeneous model or the beta model is used.
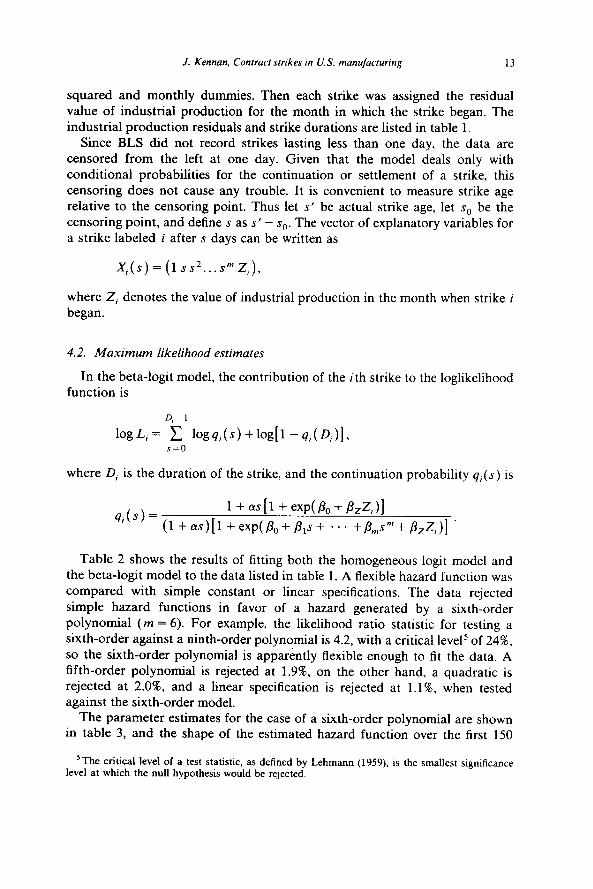
Fig. 3 shows the estimated hazard functions for the two disjoint subsamples obtained by classifying strikes according to whether industrial production was above or below its mean (in the month when the strike began). The shape of the estimated hazard function is stable across the two samples: for example, the finding that the hazard rate reaches a minimum after about three months seems robust.* The countercyclical variation in hazard rates is substantial, particularly in the first two months or so. For example, the mean duration of strikes when industrial production was high was 37.2 days, as compared with a mean duration of 52.3 days when industrial production was low. On the other hand, the number of high-2 strikes was 325, as compared with only 241 low-Z strikes. This is consistent with the conventional view that the frequency of strikes varies procyclically.
A potentially serious limitation of the results is that the model ignores serial correlation in industrial production and strike durations. It is possible that the apparent significance of the relationship between industrial production and strike duration is overstated, for reasons similar to those discussed by Granger and Newbold (1974).
4.4. Heterogeneity
Unobserved heterogeneity, as described by the beta distribution, is not very helpful in explaining these data. The typical result in table 2 is that, given the
‘This increases the t-statistic associated with the industrial production variable from about 2.9 to about 3.9. and has a negligible effect on the other parameters and their standard errors.
‘The maximized loglikelihood values were - 1486.35 for the high-Z subsample and - 1182.65 for the low-Z sample, giving a total loglikelihood of - 2669.0. This can be compared with the loglikelihood value of - 2674.86 shown in table 2 for the full data set, which restricts seven coefficients across the two subsamples. On the null hypothesis that these two samples were drawn from the same distribution, X = 2( - 2669.0 + 2674.86) = 11.72 is drawn (asymptotically) from a chi-squared distribution with seven degrees of freedom, so the critical level for rejection of the null is 11.0%.

I A 2 A
R
D
II A T L
1.0
D
10
20
SO
40
so
00
70
10
90
100
110
120
1 so
14
0 15
0
AD
E
OF
ST
RIK
E
IN
DA
Y2
Fig.
3.
H
igh
(-
) an
d lo
w
(---
----
-)
indu
stri
al
prod
uctio
n an
d ag
greg
ate
beta
-log
it (*
*
* *)
ha
zard
fu
nctio
ns

J. Kennon, Conrract strikes in U.S. manufucturing 23
order of the polynomial in s, there is no significant difference between the likelihood of the homogeneous model and of the corresponding beta model, and the estimate of the variance parameter CY in the beta model is small and
not significantly different from zero. 9 In the case where a linear logit model is used, however, the introduction of heterogeneity makes a significant contribu- tion to the likelihood. This case is illustrated in fig. 4, where the individual and aggregate hazard functions estimated for the linear specification are compared with the hazard function generated by a sixth-order polynomial. Given the linearity restriction on the individual hazard function, the beta model proves very helpful in explaining the U-shaped hazard function found in the data. Table 2 shows, however, that an even better explanation of the data can be obtained by specifying a quadratic polynomial for the individual hazard, without any heterogeneity.”
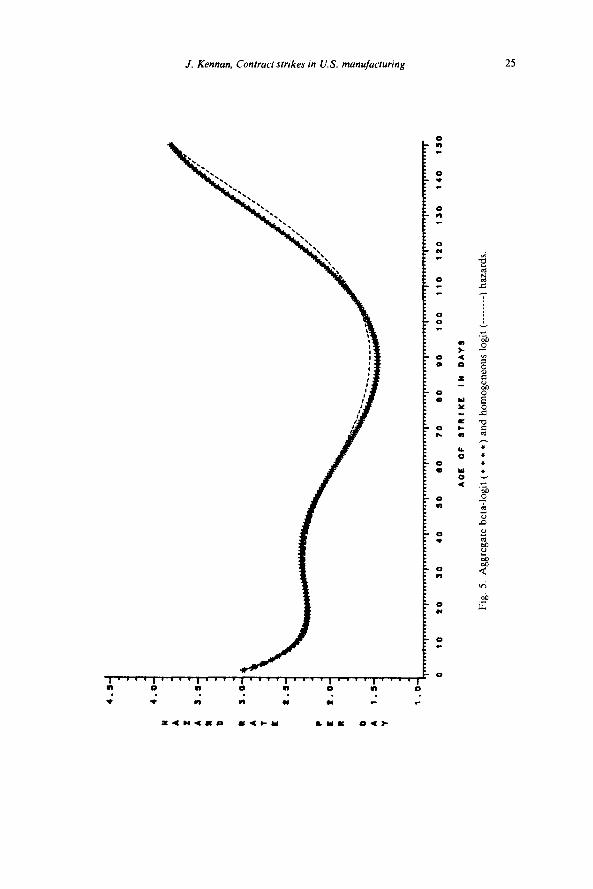
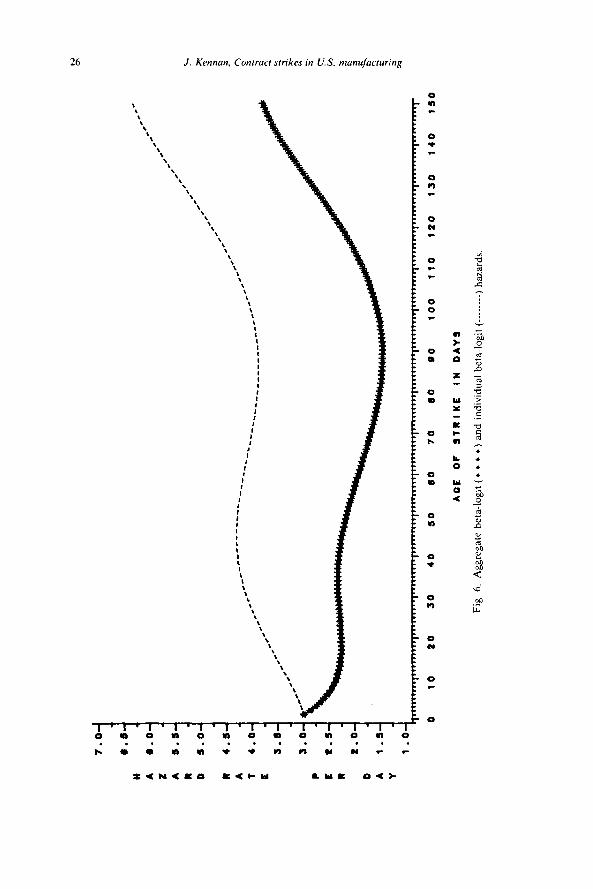
The estimated effects of unobserved heterogeneity in the preferred sixth-order model are illustrated in figs. 5 and 6. Fig. 5 compares the aggregate hazard function estimated for the beta-logit model with the hazard function for the homogeneous logit model: the estimates are very close. Fig. 6 compares the individual and aggregate hazard functions estimated for the beta model, the individual function being evaluated at the mean of the beta distribution. Although the estimated variance of the beta distribution is not significantly different from zero, the estimated individual and aggregate hazard functions are quite far apart. This reflects the weakness of the identifying restrictions which separate heterogeneity from duration dependence.
Despite the identification problem, useful inferences can be drawn about the shape of the individual hazard function p( S] X, u). In particular, p(s) X, u) must be increasing for at least some values of u wherever q(slX) is increasing, so the results indicate that the individual hazard function tends to slope upward at least over the period from 90 to 150 days. In fact, under the assumption of multiplicative heterogeneity used here, the individual hazard functions all have the same shape, so an upward-sloping aggregate hazard implies an upward-sloping individual hazard.
It seems clear from fig. 6 that the data would not reject the hypothesis that the individual hazard function is upward-sloping everywhere. This could be interpreted [as in Kennan (1980a)] as the result of an increasing marginal strike cost function (where the strike cost includes the costs to both parties). Then the finding that the aggregate hazard function is U-shaped would be due to the interaction of heterogeneity and increasing marginal costs.
‘Even (1984) has applied the beta-logit model to data on female labor force re-entry decisions following childbirth. He also obtains insignificant estimates of 01.
‘“Since the loglikelihood for the beta-logit model is not globally concave, it is possible that some of the results for this model in table 2 do not represent true likelihood maxima. Despite extensive experimentation with alternative starting values, however, no local maxima were found, and the beta model always gave a higher likelihood value than the logit model, which does have a concave loglikelihood function,

II A
2 A
R
0 R
A
t E P
E
I D
A
Y
0 10
20
so
40
so
00
70
R
O
90
100
110
120
1 so
14
0 12
0
AO
L
OF
S
TR
IKE
IN
D
AY
S
Fig.
4.
L
inea
r ag
uega
te
(-
), l
inea
r in
divi
dual
(-
----
---)
an
d si
xth-
orde
r po
lyno
mia
l be
ta-l
ogit
aggr
egat
e (*
*
* *)
ha
zard
fu
nctio
ns.
J. Kennan, Contruct strikes in U.S. munujucturing 25
w
A
t A
I 0 R
A
T
E
P
E
I b A
Y
7.
0.
0.
8.
s.
4.
4.
s.
1.
t. P.
1.
1.
o-
b-
.- .-
o-
.'
/- .--
I-
/-
.- Id'
O-
.-
,--'
5-
-I'
-_-L---m____
,' --
c- -----
----h__
_--- --- c-
o-
c-
---b__
.-
--________C--
s-
o-
0
10
20
30
40
so
50
70
50
90
100
110
120
130
140
150
AO
E
OF
S
TR
IKE
IN
D
AY
S
Fig.
6.
A
ggre
gate
be
ta-l
ogit
(*
* *
*)
and
indi
vidu
al
beta
-log
it (-
----
---)
ha
zard
s.

J. Kennan, Contract strikes in U.S. manufacturing 27
Given that industrial production has a significant effect on the hazard rate,
and that strikes are heterogeneous with respect to this variable, one might expect that if industrial production is omitted, the beta model should detect significant unobserved heterogeneity. Surprisingly, table 3 refutes this conjec- ture. When industrial production is omitted from the sixth-order model, the variance parameter (Y remains insignificant. Evidently, it does not do much good to know that some strikes have higher settlement probabilities than others, unless one knows which strikes are which.
5. Conclusion
The main substantive conclusions of the paper are that the hazard function for the duration of contract strikes in manufacturing is basically U-shaped, and that strike duration varies countercyclically. A convenient parametric model was found which permits a very flexible specification of the shape of the hazard function, and which allows for heterogeneity. Estimates of this model provide a concrete empirical example of the identification problem which generally frustrates attempts to distinguish heterogeneity from duration depen- dence, unless strong a priori information is available.
The results of this paper may be compared with Kiefer and Neumann’s (1981) analysis of the hazard function for unemployment duration, and with Heckman and Singer’s (1982, 1984) discussion of the Kiefer-Neumann results. Search theory predicts that the hazard function for unemployment should be upward-sloping, as the optimal reservation wage tends to decline if unemploy- ment is prolonged. The aggregate hazard function for unemployment is found to be downward-sloping, however, so the question arises as to whether this is a rejection of the theory, or whether it can be explained as being due to heterogeneity bias. Heckman and Singer show that the answer is sensitive to the choice of a mixing distribution, where the aggregate hazard function is modeled as a mixture of Weibull hazard functions for individuals.
An analogous question which arises naturally in regard to strikes is whether increases in the incremental cost of a strike, as duration increases, cause the hazard function for individual strikes to slope upward [Kennan (1980a)l. This question might be addressed by specifying a linear logit model for the individual hazard, with an arbitrary mixing distribution. For the case of a beta mixing distribution, the answer would then be (as is shown in table 2 and fig. 6) that there is significant heterogeneity, and that the individual hazard is upward-sloping. This answer may be misleading, however, since it rests on a strong prior assumption as to the functional form of the individual hazard. Similarly, if the Kiefer-Neumann results are sensitive to the assumed mixing distribution this may be because the estimated mixing distribution is correcting for an overly restrictive (i.e., Weibull) specification of the individual hazard function.

28 J. Kennan, Contract strikes in U.S. manufacturing
Many interesting questions remain. A richer description of cyclical fluctua- tions in strike duration could be obtained by considering a number of additional explanatory variables, such as inventories, unemployment rates, wage rates and interest rates. It would also be very useful to disaggregate the results by industry, and to examine comparable data for other countries. Finally, the incidence and duration of strikes apparently move in opposite directions over the business cycle. This is an intriguing result, which presents a challenging problem for analysis.
References
Ashenfelter, Orley and George E. Johnson, 1969, Bargaining theory, trade unions and industrial strike activity, American Economic Review 59, 35-49.
Even, William E., 1984, The relationship between married women’s labor supply and fertility decisions, Ph.D. thesis (University of Iowa, Iowa City, IA).
Granger, C.W.J. and P. Newbold, 1974, Spurious regressions in economics, Journal of Economet- rics 2,111-120.
Heckman, J. and B. Singer, 1982, The identification problem in econometric models for duration data, in: W. Hildenbrand, ed., Advances in econometrics (Cambridge University Press, Cambridge) 39-77.
Heckman, J. and B. Singer, 1984, A method for minimizing the impact of distributional assump- tions in econometric models for duration data, Econometrica 52, 271-320.
Heckman, James J. and Robert J. Willis, 1977, A beta-logistic model for the analysis of sequential labor force participation by married women, Journal of Political Economy 85.27-58.
Horvath, W.J., 1968, A statistical model for the duration of wars and strikes, Behavioral Science 13,18-28.
Kalbfleish, J.D. and R.L. Prentice, 1980, The statistical analysis of failure time data (Wiley, New York).
Kennan. John, 1980a, Pareto optimality and the economics of strike duration, Journal of Labor Research 1, 77-94.
Kennan, John, 198Ob, The effect of unemployment insurance payments on strike duration, in: Unemployment compensation: Studies and research, Vol. 2 (National Commission on Unem- ployment Compensation, Washington, DC).
Kiefer, Nicholas M. and George R. Neumann, 1981, Individual effects in a nonlinear model: Explicit treatment of heterogeneity in the empirical job-search model, Econometrica 49, 965-979.
Lancaster, Tony, 1972, A stochastic model for the duration of a strike, Journal of the Royal Statistical Society A 135, 257-271.
Lehmann, Erich L.. 1959, Testing statistical hypotheses (Wiley, New York). Morrison, D.G. and D.C. Schmittlein, 1980, Jobs, strikes and wars: Probability models for
duration, Organizational Behavior and Human Performance 25, 224-251. Newby, Martin and Jonathan Winterton. 1983, The duration of industrial stoppages, Journal of
the Royal Statistical Society A 146. 62-70. Reder, Melvin W. and George R. Neumann, 1980, Conflict and contract: The case of strikes,
Journal of Political Economy 88, 867-886. Rees, Albert, 1952, Industrial conflict and business fluctuations, Journal of Political Economy 60.
371-382. Tracy, Joseph S., 1984, Contract negotiations and strikes, Centre for Labour Economics seminar
paper, June. U.S. Department of Labor, Bureau of Labor Statistics, 1978, Analysis of work stoppages 1976,
Bulletin 1996 (Government Printing Office, Washington, DC).