Embed Size (px)
Citation preview
- Drought tolerance of Fagus sylvatica forest at the ecotone with Quercus pubescens forest - 757Journal of Vegetation Science 19: 757-768, 2008doi: 10.3170/2008-8-18442, published online 21 April 2008© IAVS; Opulus Press Uppsala.
The drought tolerance limit of Fagus sylvatica forest on limestone in southwestern Germany
Gärtner, Stefanie1*; Reif, Albert1; Xystrakis, Fotios1; Sayer, Uwe1; Bendagha, Nawal1 & Matzarakis, Andreas2
1University of Freiburg, Faculty of Forest and Environmental Sciences, Institute of Silviculture, Tennenbacher Str. 4, DE-79085 Freiburg, Germany; E-mails [email protected]; [email protected];
[email protected]; [email protected]; 2University of Freiburg, Faculty of Forest and Environmental Sciences, Mete-orological Institute, Werderring 10, DE-79085 Freiburg; E-mail [email protected];
*Corresponding author; E-mail [email protected]
AbstractQuestion: What components of drought influence the drought limit of Fagus sylvatica forests? This study contributes to the ongoing discussion regarding the future of Fagus as a major component of central European forests.Location: The drought limit of F. sylvatica at its ecotone with forest dominated by Quercus pubescens, Q. petraea and their hybrids in two limestone regions (Klettgau, Schwäbische Alb) in southwestern Germany was compared.Methods: Vegetation relevés were classified and a gradient analysis was performed. The vegetation pattern was analysed with several drought relevant variables. Classification trees were used to determine the drought limits of the Fagus forest.Results: The Fagus, Quercus and the ecotone forests were floristically characterized. The lower humidity in the submon-tane Klettgau, compared to the montane Schwäbische Alb, was compensated for by greater soil moisture (ASWSC). Therefore, Fagus forest in the Schwäbische Alb grew on sites with ASWSC values similar to those of ecotone forest in Klettgau.Conclusions: The interaction between climatic and edaphic drought related factors demonstrates that drought is a complex edaphic-climatic factor. Both components contribute to limiting the distribution of Fagus. For the two regions in southwestern Germany, and under the existing climatic conditions, it could be shown that Fagus is able to dominate forests on soils with very low ASWSC (≥ 68 l.m–²).
Keywords: Available water storage capacity; European beech; Local species distribution pattern; Quercus pubescens.
Nomenclature: Oberdorfer (1994).
Abbreviations: ASWSC = Available soil water storage capac-ity; DWD = Hechingen meteorological station; HI = Humidity index; MJ = Megajoule; P = Precipitation; PE = Potential evaporation; PET = Potential evapotranspiration; THI = Tran-seau’s humidity index.
Introduction
Fagus sylvatica L. (European beech, hereafter Fagus) would naturally dominate central European temperate forests because of its high physiological tolerance and competitiveness (Ellenberg 1996; Ellenberg et al. 1992). In the southern part of its range, and at lower elevations, the competitiveness of Fagus is limited by increasing water stress, until finally it is replaced by submeri dional forests composed of more drought-tolerant species (Ozenda 1966, 1981; Ozenda et al. 1988; Peters 1997), mainly Pinus and Quercus (Horvat et al. 1974; Ellenberg 1996). The focus of this paper is on the ecotone between Quercus pubescens Willd. forest and Fagus forest.
Over the last two decades many conifer plantations in central Europe have been converted to ‘close to nature’ forests with large proportions of Fagus. The drought limit and competitiveness of Fagus under a warmer and drier climate, expected as a result of climatic change (Anon. 2007), is currently being controversially debated (Am-mer et al. 2005). Fagus is able to tolerate annual mean temperatures up to 14 ºC, if sufficient water is available (Peters 1997; Kölling et al. 2007). Dittmar et al. (2003) studied the growth of mature Fagus using dendroeco-logical methods. They concluded that Fagus is more water-stress tolerant than is often assumed. Simulations by Pretzsch & Ďurský (2002) have also indicated that increased growth of Fagus can be expected in a warmer climate. In Bavaria, Fagus achieves greatest height growth in dry-warm areas (Felbermeier 1993).
A number of ecophysiological studies involving young Fagus trees in laboratory and experimental set-tings simulated a changing climate (Rennenberg et al. 2004; Geßler et al. 2007). In these studies, an increasing frequency of drought reduced the growth and the com-petitiveness of Fagus (Geßler et al. 2007).
Despite these contradicting conclusions it is widely
758 Gärtner, S. et al.
agreed that, on sites where water is the growth-limiting factor, severe water deficits reduce increment growth. However, no long-term decrease in the competitiveness of Fagus has yet been observed (Ammer et al. 2005). Nevertheless, the competitiveness of Fagus will decrease if the length and frequency of dry periods increases (Bonn 2000; Leuschner et al. 2001; Ammer et al. 2005). As substantial information regarding the extent to which drought affects other plant species associated with Fagus is also lacking (Ammer et al. 2005; Geßler et al. 2007), the drought limit of Fagus forest in southwestern Germany was studied from a community ecology perspective.
Models have been designed to describe and predict the distribution of (syn)taxa along environmental gradients (Parmesan et al. 2005). The model outputs greatly de-pend on how unavailable data were estimated (Segurado & Araújo 2004; Araújo & Guisan 2006; Maggini et al. 2006). Therefore, knowing the abiotic thresholds of the range of a species with respect to site is an important input variable for distribution models. Knowledge of thresh-olds may reduce the overestimation of ‘suitable habitats’ for indicator species (Zaniewski et al. 2002; Araújo & Guisan 2006), and false positive errors whereby an absent species is predicted to be present in the model (Segurado & Araújo 2004; Allouche et al. 2006). Threshold values can be derived by studying the underlying factors that control the distribution of species and plant communities (Anderson et al. 2003; Parmesan et al. 2005).
Most studies correlating drought-related variables with (syn)taxa distribution along drought gradients, and the analysis of threshold values, have focused on a continental to regional spatial scale. Variables describ-ing the humidity are generally preferred (Mather & Yoshioka 1968; Woodward & Williams 1987; Arundel 2005). Distribution thresholds at such large scales are important as most of the stress-inducing changes that result in vegetation pattern shifts or even species extinc-tion have a regional to global extent (Cornwell & Grubb 2003). On a local scale, small-scale heterogeneity of environmental factors is crucial for the analysis of (syn)taxa occurrence (Palmer & Dixon 1990; Sankaran et al. 2005). An example of a practical application might be the selection of alternative tree species in forestry, chosen to regenerate stands in accordance with altered climate conditions.
The objective of this study was to characterise the drought limits of Fagus, by combining vegetation, soils and topographies for five locations in two regions in southwestern Germany. The aims were to:
1. Ascertain which climate and soil variables deter-mine the floristic gradient at the ecotone between Fagus and Q. pubescens forest;
2. Define the drought threshold responsible for the transition from Fagus to Q. pubescens forest.
Material and Methods
Study area and sampling design
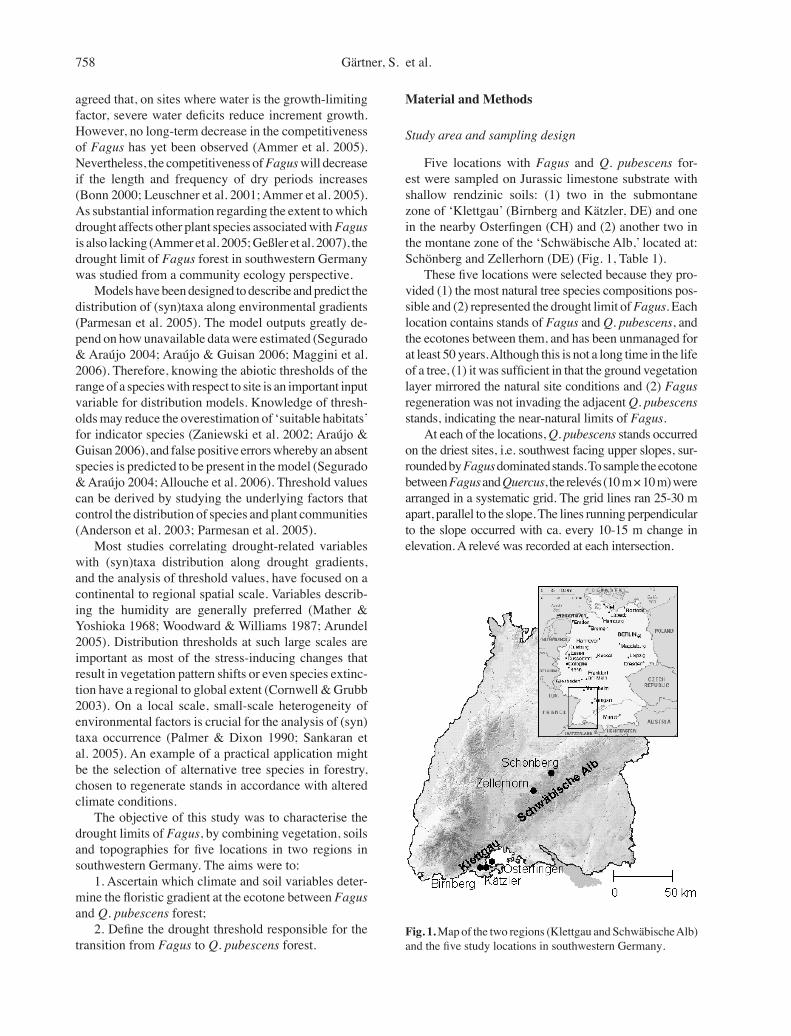
Five locations with Fagus and Q. pubescens for-est were sampled on Jurassic limestone substrate with shallow rendzinic soils: (1) two in the submontane zone of ‘Klettgau’ (Birnberg and Kätzler, DE) and one in the nearby Osterfingen (CH) and (2) another two in the montane zone of the ‘Schwäbische Alb,’ located at: Schönberg and Zellerhorn (DE) (Fig. 1, Table 1).
These five locations were selected because they pro-vided (1) the most natural tree species compositions pos-sible and (2) represented the drought limit of Fagus. Each location contains stands of Fagus and Q. pubescens, and the ecotones between them, and has been unmanaged for at least 50 years. Although this is not a long time in the life of a tree, (1) it was sufficient in that the ground vegetation layer mirrored the natural site conditions and (2) Fagus regeneration was not invading the adjacent Q. pubescens stands, indicating the near-natural limits of Fagus.
At each of the locations, Q. pubescens stands occurred on the driest sites, i.e. southwest facing upper slopes, sur-rounded by Fagus dominated stands. To sample the ecotone between Fagus and Quercus, the relevés (10 m × 10 m) were arranged in a systematic grid. The grid lines ran 25-30 m apart, parallel to the slope. The lines running perpendicular to the slope occurred with ca. every 10-15 m change in elevation. A relevé was recorded at each intersection.
Fig. 1. Map of the two regions (Klettgau and Schwäbische Alb) and the five study locations in southwestern Germany.
- Drought tolerance of Fagus sylvatica forest at the ecotone with Quercus pubescens forest - 759
Data collection
Vegetation assessment in the fieldFor each 100-m² relevé, all vascular plant species
were recorded. The percent cover was estimated for each species in three layers (herb, shrub and tree). A modified cover abundance scale sensu Braun-Blanquet was used: r = cover < 1%, 1-2 ind.; + = 2-5 ind.;h = 5-50 ind.; m = > 50 ind.; cover > 1% - < 10%, in 1% steps; cover >10%: in 5% steps). The introgressive hybrids occurring between Quer-cus petraea Liebl. and Q. pubescens were identified morphologically (Aas 1998; Müller 1999). To determine the cover of the Quercus species and their hybrids, a crown map of each of the relevés was drawn. After the species samples were identified their proportions were calculated.
Assessment of soil and climate variables
Available soil water storage capacityThe available soil water storage capacity (ASWSC)
represents the edaphic water availability at each site (relevé). It was derived from soil profiles distributed sys-tematically at each location. For each profile, the rooting depth, soil skeleton content, soil texture and bulk density were estimated. Humus content was analysed using the WÖSTOFF method (Schlichting et al. 1995). ASWSC was calculated in liters per m2, after Arbeitsgemeinschaft Standortskartierung (Anon. 1996).
Air temperature and precipitation
Precipitation and air temperature data for each loca-tion were obtained from the meteorological stations at Hallau (MeteoSwiss) (27o 27'34'' E; 47o 41'54'' N) and Hechingen (DWD) (8o 57'54'' E; 48o 21'10'' N). Hallau is located 8.6 - 9.6 km from the three Klettgau sites. Given the proximity and similar elevation of the climate station, no corrections were necessary. There is an altitudinal difference of ca. 200 m between the Hechingen climate station (DWD) and the two Schwäbische Alb sites, Schönberg (13.7 km) and Zellerhorn (4.5 km). There-fore, annual precipitation data from ten climate stations located at the same elevation, and also on the windward side of Schwäbische Alb, were used to extrapolate the precipitation for the year and the vegetation period. The observation period (1961-2003) is considered sufficient to represent the climatic standard.
Potential evapotranspiration and irradiation intensityA commonly used variable for describing vegeta-
tion distribution across spatial scales is potential eva-potranspiration (PET), reflecting the demand for water consumption (Stephenson 1998). Neither evaporation data from nearby climate stations nor comparisons for the best-fitting PET formulas were available for the study locations.
PET was, therefore, calculated by averaging the re-sults of three different irradiation-temperature formulae after Caprio (1974); Jensen and Haise and Turc cited by Zimmermann & Roberts (2001). The choice of the PET formulas was based on the fact that irradiation-temperature formulae (a) perform better in the prediction
Table 1. Natural settings of the two study regions, including the five study sites.
Klettgau region (incl. Osterfingen/CH) Schwäbische Alb region
Name of the location and number of relevés Birnberg 47 (16F, 13ec, 18Q) Zellerhorn 42 (15F, 12ec, 15Q) Kaetzler 38 (29F, 9ec) Schoenberg 67 (10F, 45ec, 12Q) Osterfingen 56 (22F, 15ec, 19Q) Elevation of study sites (m a.s.l.) Birnberg 490 - 550 Zellerhorn 790 - 825 Kaetzler 495 - 555 Schoenberg 735 - 800 Osterfingen 535 - 620 Elevation zone submontane montaneMean annual air temperature 8.6 o C 5.5 o C(DWD and MeteoSwiss) data corrected after Schlenker & Müller (1973)Mean annual precipitation (DWD and MeteoSwiss) 1012 mm 900 mm data corrected after Schlenker & Mueller (1973)Length of climatic vegetation period, (DWD and MeteoSwiss) 23rd March - 5th November (226 days) 5th April - 25th October (204 days)Mean precipitation during climatic vegetation period (DWD and MeteoSwiss) 620 mm / 656 mm
(F = Fagus forest; ec = ecotone stand; Q = Quercus forest; climatic vegetation period = mean daily air temperature > 5 °C.
760 Gärtner, S. et al.
of PET than temperature-based formulas (Lu et al. 2005; Xu & Singh 1998); and because their use, when the ap-plication of physically based formulas is not possible, was supported by Kirnak et al. (2002) and (b) the effect of slope and aspect are included as they are embodied in the estimation of irradiation intensity.
Irradiation intensity is an indirect variable affecting the distribution of vegetation (Sternberg & Shoshany 2001). Increased irradiation intensity increases the evapotranspiration rates (Bendix 2004; Lauer & Bendix 2004) and is highly correlated with slope, aspect and elevation. Irradiation intensity was calculated for each relevé using RADICAL (Fischer 1994). This software calculates monthly irradiation intensity values in MJ·m–2 based on latitude, including the aspect and slope; eleva-tion and sky view factor (horizon limitation). These topographic variables were assessed additionally.
Although irradiation is integrated into the PET calculation, it has also been included separately for comparison purposes. All the calculations of PET and irradiation intensity used in this study refer to the climatic vegetation period.
Humidity index
Water supply (precipitation, P) and evaporative demand (potential evaporation, PE) are elements of the climatic water balance (Stephenson 1998). Both variables are combined in Transeau’s humidity index (THI = P/PE) (Tuhkanen (1980). Potential evaporation is highly correlated to PET and responds in a similar fashion to the climatic variables affecting PET (Allen et al. 1998). In this study, potential evaporation was replaced by PET in the humidity index (HI), which was calculated as HI = P/PET, being suitable for comparing climatic water balance between different sites and regions. The higher the index value, the more water is available at a site. The HI used was that for the climatic vegetation period for every relevé; therefore, the values were lower than annual values often found in the literature.
Data analysis
Classification of forest vegetationVegetation data were classified based on the floristic
composition and cover values of the species transformed to percent, and using the MULVA 5 programme (Wildi & Orlóci 1996) with the following analysis sequence (Wildi 1989):
1. Classification of relevés (transformations: extract-ing the sixth root and normalisation; resemblance meas-ure: covariance; cluster algorithm: minimum variance);
2. Extracting the main gradient (transformations: extracting the sixth root and double normalisation of the
contingency values; correspondence analysis);3. Classification of species (transformations: ex-
tracting the sixth root and normalisation; resemblance measure: chord distance; cluster algorithm: minimum variance);
4. Ordination of the relevé and species groups with a concentration analysis;
5. Reduction of the species using Jancey’s ranking.The methods and resulting forest types are described
in Sayer (2000).
Analysis of gradientsOrdination through a detrendend correspondence
analysis (DCA) of all relevés showed a standard devia-tion of 2.6 units with respect to the first axis and allowed the application of principal components analysis (PCA; Lepš & Šmilauer 2003) for the 257 relevés. Afterwards, the principal components were correlated (Pearson cor-relation) with the measured environmental variables. Indirect methods were applied so as to optimally project the samples in the floristic space, and then to explain the floristic axis of the PCA.
The PCA was carried out based on the correlation matrix of the sixth root transformations of the species cover values. The reason for this was to linearise the relationship between the species as a basic assumption of applying the ordination method, and to emphasise the ecological significance of the proportion between the species. Ordination diagrams were projected in Euclidian distance and performed using CANOCO for Windows 4.52 (ter Braak & Šmilauer 1997).
Analysis of the threshold between the forest types using classification trees
The following variables reflecting the drought intensity for each of the relevés were used to determine the thresh-olds between the forest types in the two regions: annual irradiation (ir_ann) in MJ·m–2; irradiation during the cli-matic vegetation period (ir_cl_p) in MJ·m–2; mean annual temperature (T_an) in oC; mean temperature during the climatic vegetation period (T_vp) in oC; precipitation dur-ing the climatic vegetation period (P_cl_p) in mm; average PET during the climatic vegetation period (PET_a_cl) in mm; humidity index sensu Transeau (HI) and the available soil water storage capacity (ASWSC) in l·m–2.
The dataset was subdivided recursively into subsets using classification tree methods. These were increasingly homogeneous with respect to the defined groups, providing a tree-like classification and an associated dicho tomous key to classify unknown samples into groups (Urban 2002). This nonparametric method is more robust than discrimi-nant analysis (Maindonald & Braun 2007) when dealing with ecological data. The calculations were performed using r-part, R version 2007-02-23 (Anon. 2006).
- Drought tolerance of Fagus sylvatica forest at the ecotone with Quercus pubescens forest - 761
Table 2. Predictive accuracy of the classification tree (cp = complexity parameter; rel error = relative error; xerror = cross validated error; xstd = cross validated error standard deviation).
CP n-split rel error x-error x-std
1 0.311475 0 1 1 0.0390832 0.174863 1 0.68852 0.68852 0.0435433 0.092896 2 0.51366 0.53552 0.0423944 0.071038 3 0.42077 0.51366 0.0420495 0.060109 4 0.34973 0.45902 0.0409736 0.038251 5 0.28962 0.34426 0.0376117 0.032787 6 0.25137 0.32787 0.0369928 0.010929 7 0.21858 0.27869 0.0348879 0.01 8 0.20765 0.26776 0.034364
Table 2 displays the predictive accuracy of the analy-sis. The cross-validated error rate was used to determine the number of splits of the classification tree. The cross validated error rate was 19.3% for seven splits and 20% for eight splits (calculated by: root node error × minimum of cross validated error). This small difference shows that eight splits are only marginally better than seven (Table 2). The root node error was 0.72047, calculated by dividing the 183 misclassified samples of the first split by the total 257 samples. The tree was therefore pruned after seven splits.
The HI and ASWSC for the different forest types and the two regions were compared using Kruskal-Wallis tests and Mann-Whitney U tests as post-hoc tests, the results of which were integrated in box-plots.
Results
Floristic differentiation between beech and oak forests in the two elevation zones
The results of the multivariate analysis of the flo-ristic data were used to define the forest types, com-pared with an existing phytosociological classification (Oberdorfer 1992) and summarised as ‘Fagus forest’, ‘Quercus forest’ and ‘ecotone forest’ (for detailed results see Sayer 2000). ‘Quercus forest’ was used to summarise relevés classified as Quercetum pubescenti-petraeae, which comprises submediterranean decidu-ous Quercus forest near its northern limit (Oberdorfer 1992). This association is rare in southern Germany and can only be found as isolated stands surrounded by the more frequent Carici-Fagetum (dry limestone Fagus forest) (Oberdorfer 1992), to which the majority of the ‘Fagus forest’ relevés belonged. At one location in Klettgau, a few relevés within the Fagus forest were on slightly moister sites and included species of the Galio odorati-Fagetum. The ecotone between Quercus and Fagus forest types is gradual, but narrow; the species composition of the ‘ecotone forest’ was clearly distinct from that of the Fagus forest. Ecotone plots could also be classified as Quercetum pubescenti-petraeae, the divergence from the Quercus forest mainly due to the tree species composition and cover (occurrence of some stunted Fagus trees with partial crown dieback). The species listed in Table 3 are those that differentiate the forest types in the two regions. A complete vegeta-tion table containing all species and 257 relevés was published by Sayer (2000) and can be obtained from the authors on request.
Forest types along the elevation and drought gradient
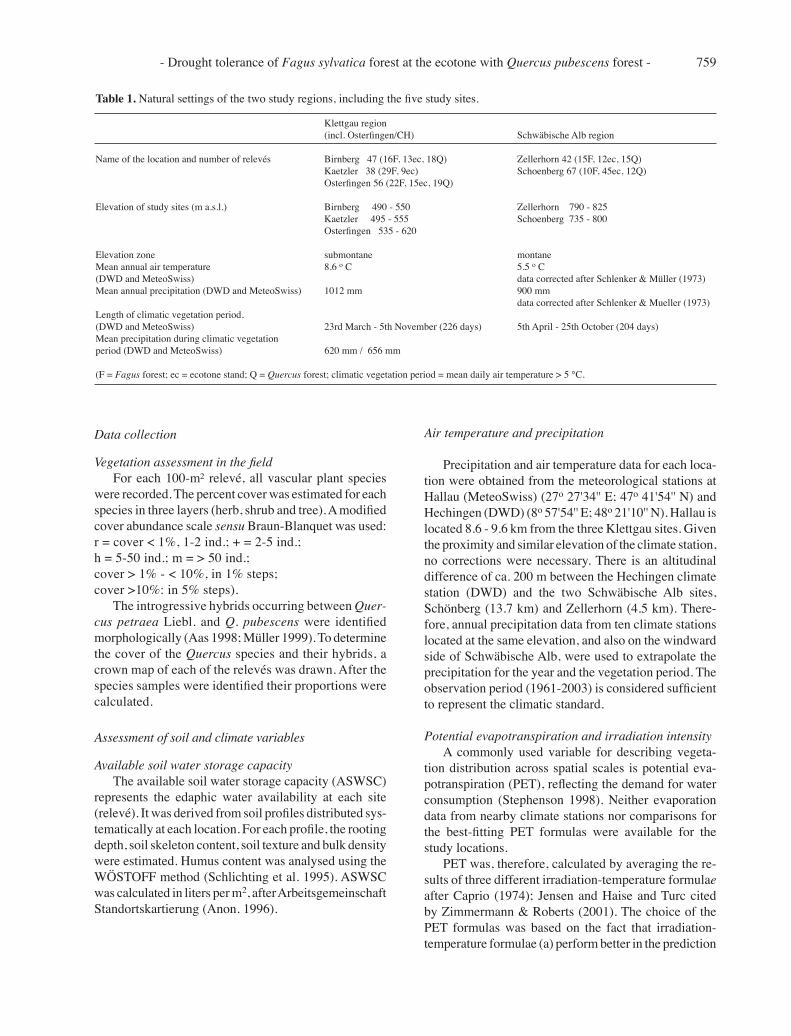
The vegetation of all 257 relevés was ordinated (Fig. 2). With the first four principal components 33.5% of the species variance was extracted (Eigen-values 1st axis: 0.12; 2nd axis 0.10; 3rd axis 0.07 and 4th axis 0.04). The species-environment correlations were 0.53 for the first and 0.79 for the second axis, 48% of the species-environment relationship was explained by the environmental variables included.
The main floristic gradient, depicted by the first axis, goes from Fagus to Quercus forest from left to right (Fig. 2). The differentiation between the forest types is an overlay of the classification results. Along axis 1, the vegetation changed from Fagus forest with tall
Fig. 2. Distribution of the forest types and regions along the principal components. The first (horizontal) axis separates the Fagus dominated relevés from the ecotone and Quercus dominated relevés. The second (vertical) axis separates the regions Klettgau (Kaetzler, Birnberg, Osterfingen) and the Schwäbische Alb (Zellerhorn, Schönberg).
762 Gärtner, S. et al.
trees, large crowns and a higher number of shade toler-ant taxa amongst the ground flora to Quercus forest comprised of smaller trees with many light-demanding taxa amongst the ground flora. The ASWSC showed the highest correlation with the first axis, indicat-ing soil with decreasing ASWSC from Fagus to the Quercus forest (Fig. 2 and Table 4).
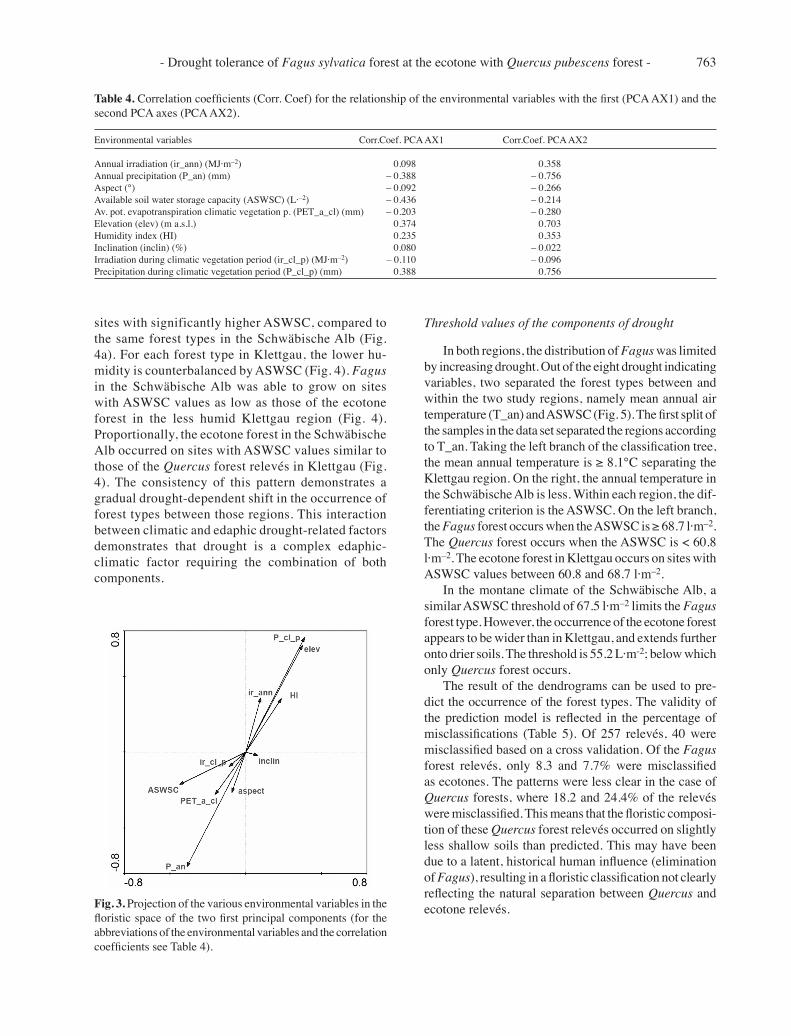
The second axis shows a differentiation between the two regions, from Klettgau below the first axis to the Schwäbische Alb in the upper part of the diagram (Fig. 2). This floristic gradient is directly reflected in the high correlation of the second axis with the elevation (‘elev’, Fig. 3 and Table 4) and precipita-tion. Precipitation during the climatic vegetation period increases with increasing elevation (‘P_cl_p’, Fig. 3 and Table 4), from the submontane Klettgau to
the montane Schwäbische Alb. However, the annual precipitation (‘P_an’, Fig. 3 and Table 4) decreases. The annual irradiation (‘ir_ann’, Fig. 3 and Table 4) is higher in the Schwäbische Alb than in the Klettgau region. Another indicator of the regional differentia-tion by climate is the humidity index (‘HI’; Fig. 3 and Table 4), which shows higher humidity in the Schwäbische Alb region during climatic vegetation period.
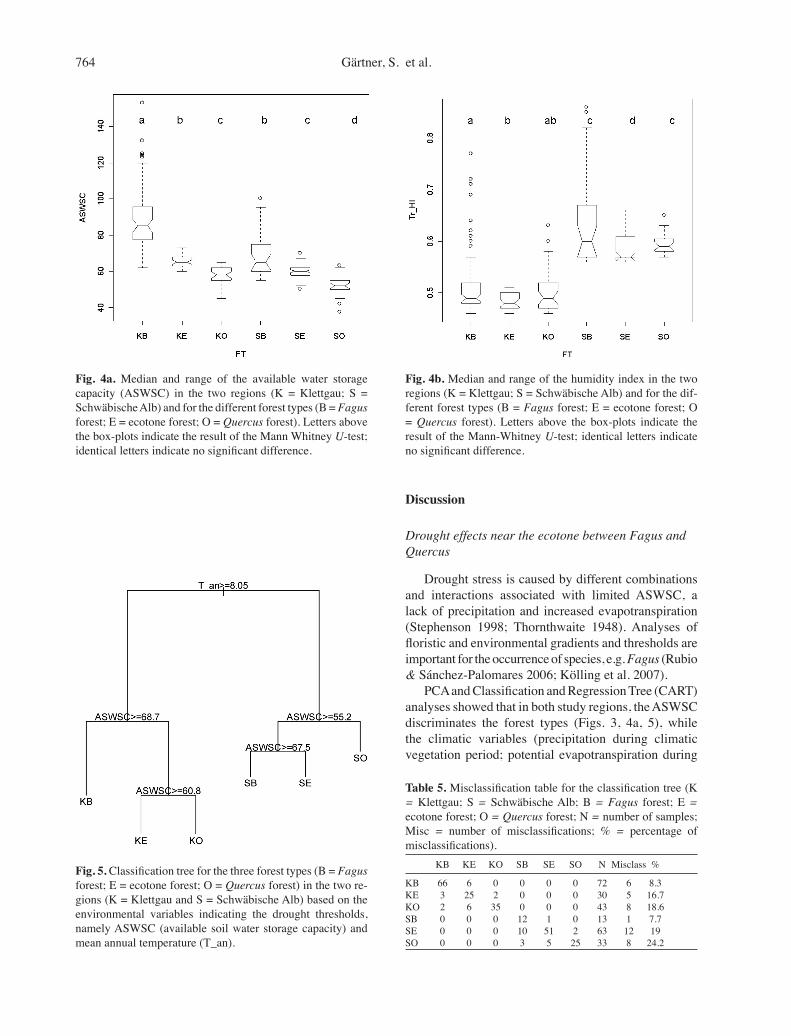
In both regions (Klettgau and Schwäbische Alb), the ASWSC is higher in the Fagus forest, followed by the ecotone and then the Quercus forest (Fig. 4a). When analysing the climatic factors of the different regions, HI during the climatic vegetation period is higher in the Schwäbische Alb than Klettgau (Fig. 4b). In the less humid Klettgau, all forest types occur on
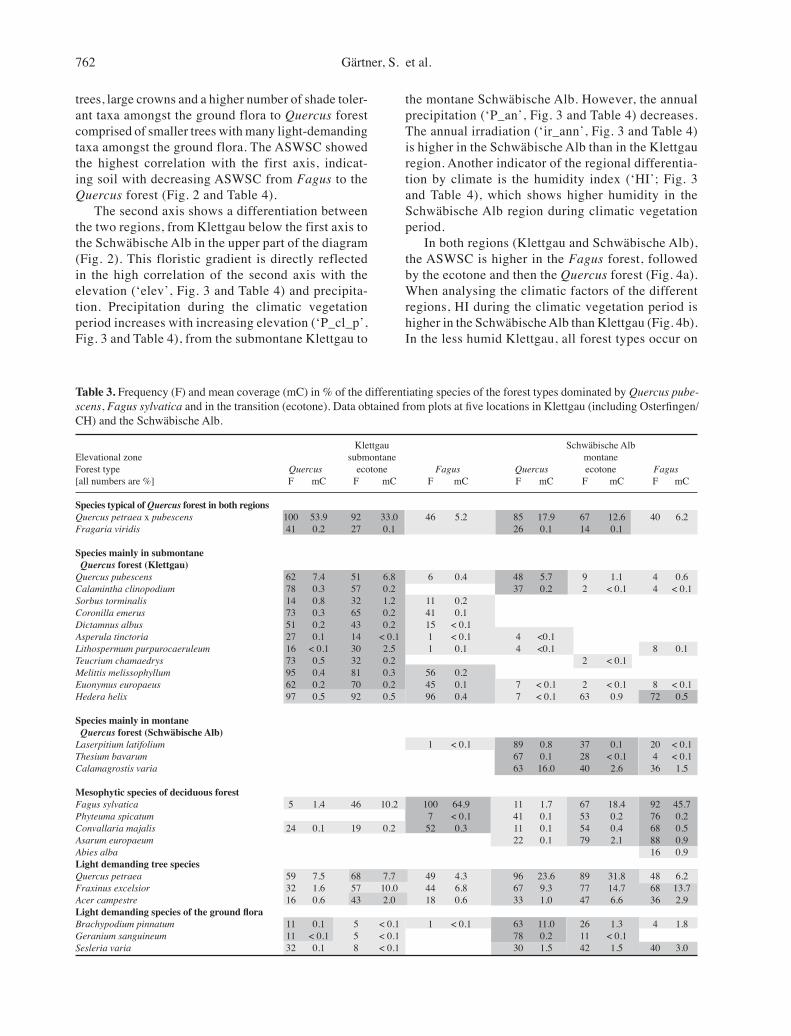
Table 3. Frequency (F) and mean coverage (mC) in % of the differentiating species of the forest types dominated by Quercus pube-scens, Fagus sylvatica and in the transition (ecotone). Data obtained from plots at five locations in Klettgau (including Osterfingen/CH) and the Schwäbische Alb.
Klettgau Schwäbische AlbElevational zone submontane montaneForest type Quercus ecotone Fagus Quercus ecotone Fagus[all numbers are %] F mC F mC F mC F mC F mC F mC
Species typical of Quercus forest in both regions Quercus petraea x pubescens 100 53.9 92 33.0 46 5.2 85 17.9 67 12.6 40 6.2Fragaria viridis 41 0.2 27 0.1 26 0.1 14 0.1
Species mainly in submontane Quercus forest (Klettgau) Quercus pubescens 62 7.4 51 6.8 6 0.4 48 5.7 9 1.1 4 0.6Calamintha clinopodium 78 0.3 57 0.2 37 0.2 2 < 0.1 4 < 0.1Sorbus torminalis 14 0.8 32 1.2 11 0.2 Coronilla emerus 73 0.3 65 0.2 41 0.1 Dictamnus albus 51 0.2 43 0.2 15 < 0.1 Asperula tinctoria 27 0.1 14 < 0.1 1 < 0.1 4 <0.1 Lithospermum purpurocaeruleum 16 < 0.1 30 2.5 1 0.1 4 <0.1 8 0.1Teucrium chamaedrys 73 0.5 32 0.2 2 < 0.1 Melittis melissophyllum 95 0.4 81 0.3 56 0.2 Euonymus europaeus 62 0.2 70 0.2 45 0.1 7 < 0.1 2 < 0.1 8 < 0.1Hedera helix 97 0.5 92 0.5 96 0.4 7 < 0.1 63 0.9 72 0.5
Species mainly in montane Quercus forest (Schwäbische Alb) Laserpitium latifolium 1 < 0.1 89 0.8 37 0.1 20 < 0.1Thesium bavarum 67 0.1 28 < 0.1 4 < 0.1Calamagrostis varia 63 16.0 40 2.6 36 1.5
Mesophytic species of deciduous forest Fagus sylvatica 5 1.4 46 10.2 100 64.9 11 1.7 67 18.4 92 45.7Phyteuma spicatum 7 < 0.1 41 0.1 53 0.2 76 0.2Convallaria majalis 24 0.1 19 0.2 52 0.3 11 0.1 54 0.4 68 0.5Asarum europaeum 22 0.1 79 2.1 88 0.9Abies alba 16 0.9Light demanding tree species Quercus petraea 59 7.5 68 7.7 49 4.3 96 23.6 89 31.8 48 6.2Fraxinus excelsior 32 1.6 57 10.0 44 6.8 67 9.3 77 14.7 68 13.7Acer campestre 16 0.6 43 2.0 18 0.6 33 1.0 47 6.6 36 2.9Light demanding species of the ground flora Brachypodium pinnatum 11 0.1 5 < 0.1 1 < 0.1 63 11.0 26 1.3 4 1.8Geranium sanguineum 11 < 0.1 5 < 0.1 78 0.2 11 < 0.1 Sesleria varia 32 0.1 8 < 0.1 30 1.5 42 1.5 40 3.0
- Drought tolerance of Fagus sylvatica forest at the ecotone with Quercus pubescens forest - 763
sites with significantly higher ASWSC, compared to the same forest types in the Schwäbische Alb (Fig. 4a). For each forest type in Klettgau, the lower hu-midity is counterbalanced by ASWSC (Fig. 4). Fagus in the Schwäbische Alb was able to grow on sites with ASWSC values as low as those of the ecotone forest in the less humid Klettgau region (Fig. 4). Proportionally, the ecotone forest in the Schwäbische Alb occurred on sites with ASWSC values similar to those of the Quercus forest relevés in Klettgau (Fig. 4). The consistency of this pattern demonstrates a gradual drought-dependent shift in the occurrence of forest types between those regions. This interaction between climatic and edaphic drought-related factors demonstrates that drought is a complex edaphic-climatic factor requiring the combination of both components.
Threshold values of the components of drought
In both regions, the distribution of Fagus was limited by increasing drought. Out of the eight drought indicating variables, two separated the forest types between and within the two study regions, namely mean annual air temperature (T_an) and ASWSC (Fig. 5). The first split of the samples in the data set separated the regions according to T_an. Taking the left branch of the classification tree, the mean annual temperature is ≥ 8.1°C separating the Klettgau region. On the right, the annual temperature in the Schwäbische Alb is less. Within each region, the dif-ferentiating criterion is the ASWSC. On the left branch, the Fagus forest occurs when the ASWSC is ≥ 68.7 l·m–2. The Quercus forest occurs when the ASWSC is < 60.8 l·m–2. The ecotone forest in Klettgau occurs on sites with ASWSC values between 60.8 and 68.7 l·m–2.
In the montane climate of the Schwäbische Alb, a similar ASWSC threshold of 67.5 l·m–2 limits the Fagus forest type. However, the occurrence of the ecotone forest appears to be wider than in Klettgau, and extends further onto drier soils. The threshold is 55.2 L·m-2; below which only Quercus forest occurs.
The result of the dendrograms can be used to pre-dict the occurrence of the forest types. The validity of the prediction model is reflected in the percentage of misclassifications (Table 5). Of 257 relevés, 40 were misclassified based on a cross validation. Of the Fagus forest relevés, only 8.3 and 7.7% were misclassified as ecotones. The patterns were less clear in the case of Quercus forests, where 18.2 and 24.4% of the relevés were misclassified. This means that the floristic composi-tion of these Quercus forest relevés occurred on slightly less shallow soils than predicted. This may have been due to a latent, historical human influence (elimination of Fagus), resulting in a floristic classification not clearly reflecting the natural separation between Quercus and ecotone relevés.
Table 4. Correlation coefficients (Corr. Coef) for the relationship of the environmental variables with the first (PCA AX1) and the second PCA axes (PCA AX2).
Environmental variables Corr.Coef. PCA AX1 Corr.Coef. PCA AX2
Annual irradiation (ir_ann) (MJ·m–2) 0.098 0.358Annual precipitation (P_an) (mm) – 0.388 – 0.756Aspect (°) – 0.092 – 0.266Available soil water storage capacity (ASWSC) (L·–2) – 0.436 – 0.214Av. pot. evapotranspiration climatic vegetation p. (PET_a_cl) (mm) – 0.203 – 0.280Elevation (elev) (m a.s.l.) 0.374 0.703 Humidity index (HI) 0.235 0.353Inclination (inclin) (%) 0.080 – 0.022Irradiation during climatic vegetation period (ir_cl_p) (MJ·m–2) – 0.110 – 0.096Precipitation during climatic vegetation period (P_cl_p) (mm) 0.388 0.756
Fig. 3. Projection of the various environmental variables in the floristic space of the two first principal components (for the abbreviations of the environmental variables and the correlation coefficients see Table 4).
764 Gärtner, S. et al.
Fig. 4a. Median and range of the available water storage capacity (ASWSC) in the two regions (K = Klettgau; S = Schwäbische Alb) and for the different forest types (B = Fagus forest; E = ecotone forest; O = Quercus forest). Letters above the box-plots indicate the result of the Mann Whitney U-test; identical letters indicate no significant difference.
Fig. 4b. Median and range of the humidity index in the two regions (K = Klettgau; S = Schwäbische Alb) and for the dif-ferent forest types (B = Fagus forest; E = ecotone forest; O = Quercus forest). Letters above the box-plots indicate the result of the Mann-Whitney U-test; identical letters indicate no significant difference.
Fig. 5. Classification tree for the three forest types (B = Fagus forest; E = ecotone forest; O = Quercus forest) in the two re-gions (K = Klettgau and S = Schwäbische Alb) based on the environmental variables indicating the drought thresholds, namely ASWSC (available soil water storage capacity) and mean annual temperature (T_an).
Table 5. Misclassification table for the classification tree (K = Klettgau; S = Schwäbische Alb; B = Fagus forest; E = ecotone forest; O = Quercus forest; N = number of samples; Misc = number of misclassifications; % = percentage of misclassifications). KB KE KO SB SE SO N Misclass %
KB 66 6 0 0 0 0 72 6 8.3KE 3 25 2 0 0 0 30 5 16.7KO 2 6 35 0 0 0 43 8 18.6SB 0 0 0 12 1 0 13 1 7.7SE 0 0 0 10 51 2 63 12 19SO 0 0 0 3 5 25 33 8 24.2
Discussion
Drought effects near the ecotone between Fagus and Quercus
Drought stress is caused by different combinations and interactions associated with limited ASWSC, a lack of precipitation and increased evapotranspiration (Stephenson 1998; Thornthwaite 1948). Analyses of floristic and environmental gradients and thresholds are important for the occurrence of species, e.g. Fagus (Rubio & Sánchez-Palomares 2006; Kölling et al. 2007).
PCA and Classification and Regression Tree (CART) analyses showed that in both study regions, the ASWSC discriminates the forest types (Figs. 3, 4a, 5), while the climatic variables (precipitation during climatic vegetation period; potential evapotranspiration during
- Drought tolerance of Fagus sylvatica forest at the ecotone with Quercus pubescens forest - 765
climatic vegetation period) follow in importance. This demonstrates the need to study soil properties when downscaling studies to the local stand level, at which forest management planning takes place. Similar results were obtained from studies dealing with the small-scale distribution of vegetation patterns, e.g. of more resource-demanding shrubs and trees compared to the more stress tolerant grasses in semi-arid ecosystems (Meinzer et al. 1983; Sankaran et al. 2005; Svoray et al. 2007).
Elevation is the most important factor for the dis-crimination of the two study regions (Fig. 3). Elevation is frequently used as an indirect variable for the descrip-tion of vegetation gradients (Austin 2002). Its explana-tory power is due to the integration of several climatic variables that are often highly correlated with elevation (Rouget et al. 2001; Austin 2002), e.g. elevation has been used instead of precipitation and air temperature gradients (Rouget et al. 2001).
Elevation must be treated carefully when it is used as an explanatory variable for vegetation patterns as (1) it does not have any direct ecological or physiological effects on species. For this reason, the use of variables with a direct physiological effect is recommended (Stephenson 1998; Pausas & Austin 2001) and (2) El-evation may be oppositely correlated with other climatic variables (e.g. precipitation amount) when different periods are considered. The results demonstrated that the annual precipitation is higher in Klettgau than in the Schwäbische Alb, but that precipitation during the climatic vegetation period is higher in the Schwäbische Alb (Table 1). Therefore, elevation is negatively cor-related with annual precipitation while positively cor-related with precipitation during vegetation period. This exhibits (1) the inclusion of seasonality when climatic parameters are applied (Ohmann & Spies 1998; Rouget et al. 2001) and (2) the need for consideration of the different macroclimatic conditions of the regions under study (Rubio & Sánchez-Palomares 2006).
Isolated interpretations of the simplistic variable ‘pre-cipitation’ may also generate misleading conclusions, e.g. in the characterisation of the gradient of the second PCA axis (Figs. 2, 3). To conclude on the basis of the higher annual precipitation that the Klettgau region has a more favourable water supply is shown to be incorrect when the higher annual evaporative demand (PET) is considered (Table 1). This supports the use of combined variables such as humidity/aridity indices to describe the climatic water balance, vegetation gradients and species thresholds (Tuhkanen 1980; Box 1981; Weber et al. 2007).
Therefore, the humidity index during the vegeta-tion period appears to be the most suitable variable to express the climatic water balance between the two regions, indicating a more favourable water supply for the Schwäbische Alb.
Fagus sylvatica – a tree species with a future in central Europe
Climatic change will affect the tree species composi-tion of central European forests (Anon. 2007). The future of Fagus in central Europe appears unclear, as reflected by the controversial debate taking place between ecolo-gists (Ammer et al. 2005) and physiologists (Rennenberg et al. 2004). It must be assumed that a changing climate will affect the vitality of Fagus (Geßler et al. 2007). Near its drought limit, Fagus will probably give way to tree species more tolerant of drought stress. The first effects will presumably be greater mortality of regenerating and understorey Fagus near its drought limit (Kohler et al. 2006).
Certainly there is more than one abiotic factor con-trolling species distribution and if competition, historical contingency, source-sink dynamics and dispersal limita-tions are considered (Pulliam 2000; Thuiller et al. 2004), then species reactions remain far too complicated to be comprehensively understood, described and quantified with accuracy. Distribution modelling is still in its ‘in-fancy,’ and further research into the abiotic environmental limitations of species distribution based on fundamental ecological and site classification research will provide valuable information for modellers studying niche-related aspects. The link between ecological theory and modelling tools has to be strengthened, and greater use made of existing data (Guisan et al. 2006). The quanti-fication of the leading limiting factor for the distribution of species, and the setting of a distinct threshold for its occurrence, may help in the development and evaluation of such models.
This study showed that distribution limitations are highly dependant on mesoscale factors. In drought as-sessments, in particular, it is necessary that each climatic region be treated independently due to the complexity of the drought factor. It could be shown for two regions in southwestern Germany that, under existing climatic conditions, Fagus is able to dominate forests on soils with very low ASWSC. Higher air temperature and lower humidity in the Klettgau forced the Fagus forest to retreat only slightly, and permitted Quercus to advance onto soils with an ASWSC ca. only 5 l.m–2 higher than that of the Schwäbische Alb. As the majority of central European forest soils have a much higher ASWSC than the threshold for Fagus, of ca. 65-70 l.m–2 (Landesamt für Geologie Rohstoffe und Bergbau - Regierungsprä-sidium Freiburg 2007), it must be assumed that Fagus will continue to dominate the potential natural vegetation of central Europe (Ammer et al. 2005). In most central European regions, the area of Fagus is likely to increase even, due to the ongoing decline of Picea abies (spruce) in managed forests as a result of storm and insect damage
766 Gärtner, S. et al.
(Kölling et al. 2007).Acknowledgements. We would like to thank the Deutsche Forschungsgemeinschaft for financial support (RE 579/1-3), and the German Weather Service (DWD) and MeteoSwiss for the climate data. We are grateful to Bernhard Thiel and David Butler-Manning for English corrections. We also wish to thank the co-ordinating editor Exequiel Ezcurra, the reviewer Piermaria Corona and another anonymous reviewer for their helpful comments.
References
Anon. 1996. Forstliche Standortsaufnahme. Arbeitsgemein-schaft Standortskartierung. IHW-Verlag, Eching, DE.
Anon. 2006. R2.4.1 - A language and environment. http://cran.r-project.org/.
Anon. 2007a. Climate change 2007: The physical science basis. Contribution of Working Group I to the Fourth Assessment Report of the Intergovernmental Panel on Climate Change. Cambridge University Press, Cambridge, UK.
Anon. 2007b. Wasser- und Bodenatlas Baden-Württemberg. Kapitel 4: Boden und Bodenwasser. Landesamt für Geolo-gie, für Geologie Rohstoffe und Bergbau - Regierungsprä-sidium Freiburg. Freiburg, DE.
Aas, G. 1998. Morphologische und ökologische Variation mit-teleuropäischer Quercus-Arten: Ein Beitrag zum Verständ-nis der Biodiversität. IHW-Verlag, Echingen, DE.
Allen, R., Pereira, L., Raes, D. & Smith, M. 1998. Crop eva-potranspiration – Guidelines for computing crop water requirements. FAO Irrigation and drainage paper No. 56. FAO, Rome, IT.
Allouche, O., Tsoar, A. & Kadmon, R. 2006. Assessing the accuracy of species distribution models: prevalence, kappa and the true skill statistic (TSS). Journal of Applied Ecology 43: 1223-1232.
Ammer, C., Albrecht, L., Borchert, H., Brosinger, F., Dittmar, C., Elling, W., Ewald, J., Felbermeier, B., Gilsa, H. & Huss, J. 2005. Future suitability of beech (Fagus sylvatica L.) in Central Europe: critical remarks concerning a paper of Rennenberg, et al. 2004. Allgemeine Forst- und Jagdzei-tung 176: 60-67.
Anderson, R.P., Lew, D. & Peterson, A.T. 2003. Evaluating predictive models of species’ distributions: criteria for selecting optimal models. Ecological Modelling 162: 211-232.
Araújo, M.B. & Guisan, A. 2006. Five (or so) challenges for species distribution modelling. Journal of Biogeography 33: 1677-1688.
Arundel, S.T. 2005. Using spatial models to establish climatic limiters of plant species’ distributions. Ecological Model-ling 182: 159–181.
Austin, M.P. 2002. Spatial prediction of species distribution: an interface between ecological theory and statistical model-ling. Ecological Modelling 157: 101-118.
Bendix, J. 2004. Geländeklimatologie. Borntraeger Verlags-buchhandlung, Berlin, Stuttgart, DE.
Bonn, S. 2000. Konkurrenzdynamik in Buchen/Eichen-Mischbeständen und zu erwartende Modifikationen durch
Klimaänderungen. Allgemeine Forst und Jagdzeitung 171: 81-88.
Box, E.O. 1981. Predicting physiognomic vegetation types with climate variables. Plant Ecology 45: 127-39.
Caprio, J. 1974. The solar thermal unit concept in problems re-lated to plant development ant potential evapotranspiration. In: Lieth, H. (ed.) Phenology and seasonality modeling, pp. 353-364. Springer-Verlag, New York, NY, US.
Cornwell, W.K. & Grubb, P.J. 2003. Regional and local pat-terns in plant species richness with respect to resource availability. Oikos 100: 417-428.
Dittmar, C., Zech, W. & Elling, W. 2003. Growth variations of common beech (Fagus sylvatica L.) under different climatic and environmental conditions in Europe – a dendroecological study. Forest Ecology and Management 173: 63-78.
Ellenberg, H. 1996. Vegetation Mitteleuropas mit den Alpen. Ulmer, Stuttgart, DE.
Ellenberg, H., Weber, H.E., Düll, R., Wirth, V. & Werner, W. 1992. Zeigerwerte von Pflanzen in Mitteleuropa. Goltze, Göttingen, DE.
Felbermeier, B. 1993. Der Einfluß von Klimaänderungen auf die Areale von Baumarten. Methodenstudie und regionale Abschätzung für die Rotbuche (Fagus sylvatica L.) in Bay-ern. Forstliche Forschungsberichte 134. München, DE.
Fischer, H.S. 1994. Simulation der räumlichen Verteilung von Pflanzengesellschaften auf der Basis von Standortskarten. Dargestellt am Beispiel des MaB-Testgebiets Davos. Ver-öffentlichungen des Geobotanischen Institutes der ETH, Stiftung Rübel, Zürich 122: 1-143.
Geßler, A., Keitel, C., Kreuzwieser, J., Matyssek, R., Seiler, W. & Rennenberg, H. 2007. Potential risks for European beech (Fagus sylvatica L.) in a changing climate. Trees - Structure and Function 21: 1-11.
Guisan, A., Lehmann, A., Ferrier, S., Austin, M., Overton, J. M., Aspinall, R. & Hastie, T. 2006 Making better biogeo-graphical predictions of species’ distributions. Journal of Applied Ecology 43: 386-392.
Horvat, I., Glavac, V. & Ellenberg, H. 1974. Vegetation Süd-osteuropas. Fischer, Stuttgart, DE.
Kirnak, H., Hansen, R., Keener, H. & Short, T. 2002. An eva-luation of physically based and empirically determined evapotranspiration models for nursery plants. Turkish Journal of Agriculture and Forestry 26: 355-362.
Kohler, M., Köckemann, B., Peichl, M., Schmitt, J. & Reif, A. 2006. Auswirkungen des Trockenjahres 2004 auf unter-ständige Buchen (Fagus sylvatica L.) am Ökoton zwischen Buchen- und Eichenwald im NSG Innerberg, Südbaden. Allgemeine Forst und Jagdzeitung 177: 86-91.
Kölling, C., Zimmermann, L. & Walentowski, H. 2007. Entscheidungshilfen für den klimagerechten Waldumbau in Bayern. Klimawandel: Was geschieht mit Buche und Fichte? AFZ/Der Wald 11: 584-588.
Lauer, W. & Bendix, J. 2004. Klimatologie. Westermann, Braunschweig, DE.
Lepš, J. & Šmilauer, P. 2003. Multivariate analysis of ecolo-gical data using CANOCO. Cambridge University Press, Cambridge, UK.
Leuschner, C., Backes, K., Hertel, D., Schipka, F., Schmitt, U.,
- Drought tolerance of Fagus sylvatica forest at the ecotone with Quercus pubescens forest - 767
Terborg, O. & Runge, M. 2001. Drought responses of leaf, stem and fine root levels of competitive Fagus sylvatica L. and Quercus petraea (Matt.) Liebl. trees in dry and wet years. Forest Ecology and Management 149: 33-49.
Lu, J., Sun, G., McNulty, S.G. & Amatya, D.M. 2005. A com-parison of six potential evapotranspiration methods for regional use in the southeastern United States. Journal of the American Water Resources Association 41: 621-633.
Maggini, R., Lehmann, A., Zimmermann, N. & Guisan, A. 2006. Improving generalized regression analysis for the spatial prediction of forest communities. Journal of Bio-geography 33: 1729-1749.
Maindonald, J.H. & Braun, W.J. 2007. Data analysis and graphics using R – An example-based approach. Cambridge University Press, Cambridge, UK.
Mather, J.R. & Yoshioka, G.A. 1968. The role of climate in the distribution of vegetation. Annals of the Association of American Geographers 58: 29-41.
Meinzer, F., Seymour, V. & Goldstein, G. 1983. Water balance in developing leaves of four tropical savanna woody species. Oecologia 60: 237-243.
Müller, B. 1999. Variation und Hybridisierung von Quercus pubescens. Dissertation, Eidgenössische Technische Hoch-schule Zürich, Zürich, CH.
Oberdorfer, E. 1992. Süddeutsche Pflanzengesellschaften Teil IV: Wälder und Gebüsche (Tabellenband). Fischer, Stuttgart, DE.
Oberdorfer, E. 1994. Pflanzensoziologische Exkursionsflora. Eugen Ulmer, Stuttgart, DE.
Ohmann, J.L. & Spies, T.A. 1998. Regional gradient analysis and spatial pattern of woody plant communities of Oregon forests. Ecological Monographs 68: 151-182.
Ozenda, P. 1966. Perspectives nouvelles pour l’étude phytogéo-graphique des Alpes du Sud. Puis Saint-Martin-d’Hères, Isère, Laboratoires de Biologie Végétale de Grenoble et du Lautaret, Grenoble, FR.
Ozenda, P. 1981. Végétation des Alpes sud-occidentales. CNRS, Paris, FR.
Ozenda, P., Mayer, H. & Zirnig, A. 1988. Die Vegetation der Alpen im europäischen Gebirgsraum. Fischer, Stuttgart, DE.
Palmer, M.W. & Dixon, P.M. 1990. Small-scale environmental heterogeneity and the analysis of species distributions along gradients. Journal of Vegetation Science 1: 57-65.
Parmesan, C., Gaines, S., Gonzalez, L., Kaufman, D.M., Kingsolver, J., Townsend Peterson, A. & Sagarin, R. 2005. Empirical perspectives on species borders: from traditional biogeography to global change. Oikos 108: 58-75.
Pausas, J.G. & Austin, M.P. 2001. Patterns of plant species richness in relation to different environments: an appraisal. Journal of Vegetation Science 12: 153-166.
Peters, R. 1997. Beech forests. Kluwer, Dordrecht, NL.Pretzsch, H. & Dursky, J. 2002. Growth reaction of Norway
spruce (Picea abies (L.) Karst.) and European beech (Fa-gus silvatica L.) to possible climatic changes in Germany. A sensitivity study. Forstwissenschaftliches Centralblatt 121: 145-154.
Pulliam, H. 2000. On the relationship between niche and distribution. Ecology Letters 3: 349-361.
Rennenberg, H., Seiler, W., Matyssek, R., Gessler, A. & Kreuzwieser, J. 2004. Die Buche (Fagus sylvatica L.) – ein Waldbaum ohne Zukunft im südlichen Mitteleuropa. Allgemeine Forst und Jagdzeitung 175: 210–223.
Rouget, M., Richardson, D.M., Lavorel, S., Vayreda, J., Gracia, C. & Milton, S.J. 2001. Determinants of distribution of six Pinus species in Catalonia, Spain. Journal of Vegetation Science 12: 491-502.
Rubio, A. & Sánchez-Palomares, O. 2006. Physiographic and climatic potential areas for Fagus sylvatica L. based on ha-bitat suitability indicator models. Forestry 79: 439-451.
Sankaran, M., Hanan, N.P., Scholes, R.J., Ratnam, J., Augustine D.J., Cade, B.S., Gignoux, J., Higgins, S. I., Le Roux, X. & Ludwig, F. 2005. Determinants of woody cover in African savannas. Nature 438: 846-849.
Sayer, U. 2000. Die Ökologie der Flaumeiche (Quercus pu-bescens Willd.) und ihrer Hybriden auf Kalkstandorten an ihrer nördlichen Arealgrenze (Untersuchungen zu Boden, Klima und Vegetation). Dissertationes Botanicae 340. Kramer, Stuttgart, DE.
Schlenker, G. & Müller, S. 1973. Erläuterungen zur Karte der Regionalen Gliederung von Baden-Württemberg I. Teil (Wuchsgebiete Neckarland und Schwäbische Alb), Mit-teilungen des Vereins für Forstliche Standortskunde und Forstpflanzenzüchtung 23: 3-66.
Schlichting, E., Blume, H.P. & Stahr, K. 1995. Bodenkundliches Praktikum – eine Einführung in pedologisches Arbeiten für Ökologen, insbesondere Land- und Forstwirte und für Geowissenschaftler. Blackwell Wissenschafts Verlag, Berlin, DE.
Segurado, P. & Araújo, M. 2004. An evaluation of methods for modelling species distributions. Journal of Biogeography 31: 1555-1568.
Stephenson, N.L. 1998. Actual evapotranspiration and deficit: biologically meaningful correlates of vegetation distribu-tion across spatial scales. Journal of Biogeography 25: 855-870.
Sternberg, M. & Shoshany, M. 2001. Influence of slope aspect on Mediterranean woody formations: Comparison of a semiarid and an arid site in Israel. Ecological Research 16: 335-345.
Svoray, T., Mazor, S. & Bar Kutiel, P. 2007. How is shrub cover related to soil moisture and patch geometry in the fragmented landscape of the northern Negev desert? Landscape Ecology 22: 105-116.
ter Braak, C.J.F. & Šmilauer, P. 1997. Canoco for Windows Version 4.52. Biometrics - Plant Research International, Wageningen, NL.
Thornthwaite, C.W. 1948. An approach toward a rational clas-sification of climate. Geographical Review 38: 55-94.
Thuiller, W., Araújo, M.B. & Lavorel, S. 2004. Do we need land-cover data to model species distributions in Europe? Journal of Biogeography 31: 353-361.
Tuhkanen, S. 1980. Climatic parameters and indices in plant geography. Acta Phytogeographica Suecica 67: 1-110.
Urban, D.L. 2002. Classification and regression trees. In: McCune, B. & Grace, J.B. (eds.) Analysis of ecological communities, pp. 222-232. MJM Software Design, Gle-neden Beach, OR, US.
768 Gärtner, S. et al.
Weber, P., Bugmann, H. & Rigling, A. 2007. Radial growth responses to drought of Pinus sylvestris and Quercus pube-scens in an inner-Alpine dry valley. Journal of Vegetation Science 18: 777-792.
Wildi, O. 1989. A new numerical solution to traditional phyto-sociological tabular classification. Vegetatio 81: 95-106.
Wildi, O. & Orlóci, L. 1996. Numerical exploration of com-munity patterns: a guide to the use of MULVA-5. SPB, The Hague, NL.
Woodward, F.I. & Williams, B.G. 1987. Climate and plant distribution at global and local scales. Plant Ecology 69: 189-197.
Xu, C.Y. & Singh, V.P. 1998. A review on monthly water balance models for water resources investigations. Water Resources Management 12: 20-50.
Zaniewski, A.E., Lehmann, A. & Overton, J.M. 2002. Pre-dicting species spatial distributions using presence-only data: a case study of native New Zealand ferns. Ecological Modelling 157: 261-280.
Zimmermann, N.E. & Roberts, D.W. 2001. Final report of the MLP climate and biophysical mapping project. Swiss Federal Research Institute WSL/Utah State University, Birmensdorf, CH/Logan, UT, US.
Received 3 September 2007;Accepted 22 November 2007;
Co-ordinating Editor: E. Ezcurra.


![Patterns of genetic diversity in Fagus sylvatica · [6] Weising K, Gardner RC (1999) A set of conserved PCR primers for the analysis of simple sequence repeat polymorphisms in chloroplast](https://img.pdfslide.us/doc/110x75/5e80236c3cfb524b971482c9/patterns-of-genetic-diversity-in-fagus-sylvatica-6-weising-k-gardner-rc-1999.jpg)