Embed Size (px)
Citation preview
Matus Sucha
The driver’s cognition, personality, behaviour, motivation, and emotions Traffic psychology 1 PCH/DP1
Presentation 2
Matus Sucha
Matus Sucha
Contents I. Driver behaviour – model II. Driver perception, senses, and cognition
Perception Selective attention and perceptual learning
III. Performance-related capabilities and willingness to take risks Driver skills and behaviour
IV. Emotions and attitudes V. Drivers’ individual differences and risky groups VI. Risky behaviour
Speeding Driving under the influence of alcohol and drugs Non-use of safety belt and child restraint Running red lights or stop signs Driver’s distraction and inattention Driver fatigue Aggressive driving Driver’s stress, anxiety, and anger Work-related road risk
VII. Eco-driving
Matus Sucha
I. Driver behaviour – model Humans as irrational beings – we cannot expect purely rational behaviour. GADGET model A four-level descriptive model in which driver behaviour is conceptualised
as a hierarchy, in which the goals and motives of the driver play an essential role.
An analysis of the driver’s task and accidents has shown that adequate
psychomotor skills and physiological functions are not sufficient for good and safe performance as a driver. This conclusion is in line with the notion that driving is a self-paced task (Näätänen & Summala, 1974).
Matus Sucha
I. Driver behaviour – model Rothengatter (1997) pointed out that research in traffic psychology shows not only the importance of performance factors, but also the
importance of motivational and attitudinal factors. Skill vs. Will dilemma
Matus Sucha
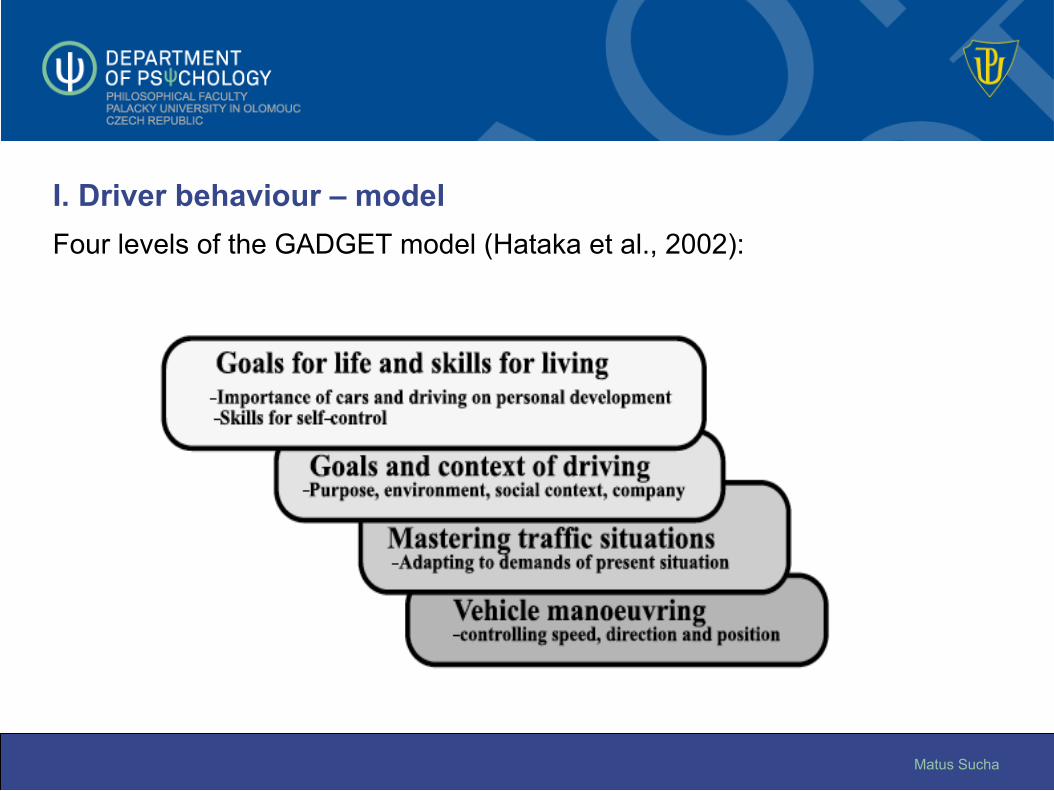
I. Driver behaviour – model Four levels of the GADGET model (Hataka et al., 2002):
Matus Sucha
I. Driver behaviour – model 5th level – Traffic as a culture (Good brakes, good horn, good luck!) This is how people drive, how people cross the street, how power relations
are made manifest in those interactions, what sort of patterns emerge from traffic.
It`s the reason why a horn in Rome does not mean the same thing as a horn
in Stockholm, why flashing one’s headlights at another driver is understood one way on a German autobahn and quite another way in Los Angeles.
Why do pedestrians jaywalk in New York City and not in Copenhagen? In
New York City it’s a way to distinguish yourself from the crowd, in Copenhagen an act against the law. In NYC pedestrians look at cars, not at lights.
Matus Sucha
I. Driver behaviour – model What explains traffic culture? 1) traffic laws 2) cultural norms 3) accepted behaviour in a place
Matus Sucha
I. Driver behaviour – model Hierarchical task level model (Summala, 1997). The various tasks involved in participation in traffic are divided into three
hierarchical levels: i. Strategic ii. Tactical iii. Operational
The strategic level involves route choice and the realisation of the selected route. The tactical level concerns manoeuvring, such as the decision to overtake. The operational level concerns vehicle control in terms of speed and course control. These levels are hierarchical, which implies that decisions on a higher level determine the constraints on the decisions on a lower level. Tasks on lower levels are more automated, while tasks on the higher levels demand the driver’s attention.
Matus Sucha
I. Driver behaviour – model Risk homeostasis theory – the risks of safety Risk homeostasis theory maintains that, in any activity, people accept a
certain level of subjectively estimated risk to their health, safety, and other things they value, in exchange for the benefits they hope to receive from that activity (transportation, eating, recreation, drug use etc.).
In an ongoing activity, people continuously check the amount of risk they are
exposed to. They compare this with the amount of risk they are willing to accept, and try to reduce the difference between the two to zero. Thus, if the level of subjectively experienced risk is lower than is acceptable, people tend to engage in actions that increase their exposure to risk. If, however, the level of subjectively experienced risk is higher than is acceptable, they make an attempt to exercise greater caution.
Matus Sucha
I. Driver behaviour – model Gerald J. S. Wilde gives the following argument: “A river empties into the sea through a delta. The delta has three channels,
all of equal size. Therefore, damming two of the channels will reduce the flow of water to the sea by two-thirds.”
In all likelihood, nobody would accept this argument. One cannot stop the
flow as long as there remain alternative routes to the destination. One cannot reduce mortality caused by accidents unless all opportunities for premature death were eliminated by law or made impossible through technological intervention.
Matus Sucha
I. Driver behaviour – model The theory of risk homeostasis predicts that people become accustomed to
some acceptable level of risk, and that when they are required to reduce a risk they are exposed to, they will increase other risks until they have re-established the level of risk they have become accustomed to.
If drivers are required to wear a seat belt, the evidence suggests that they
drive faster, pass other cars more dangerously, put on make-up while driving, and so on, so as to maintain the level of risk they are comfortable with (Wilde, 2000).
The question of subjective and objective safety.
Matus Sucha
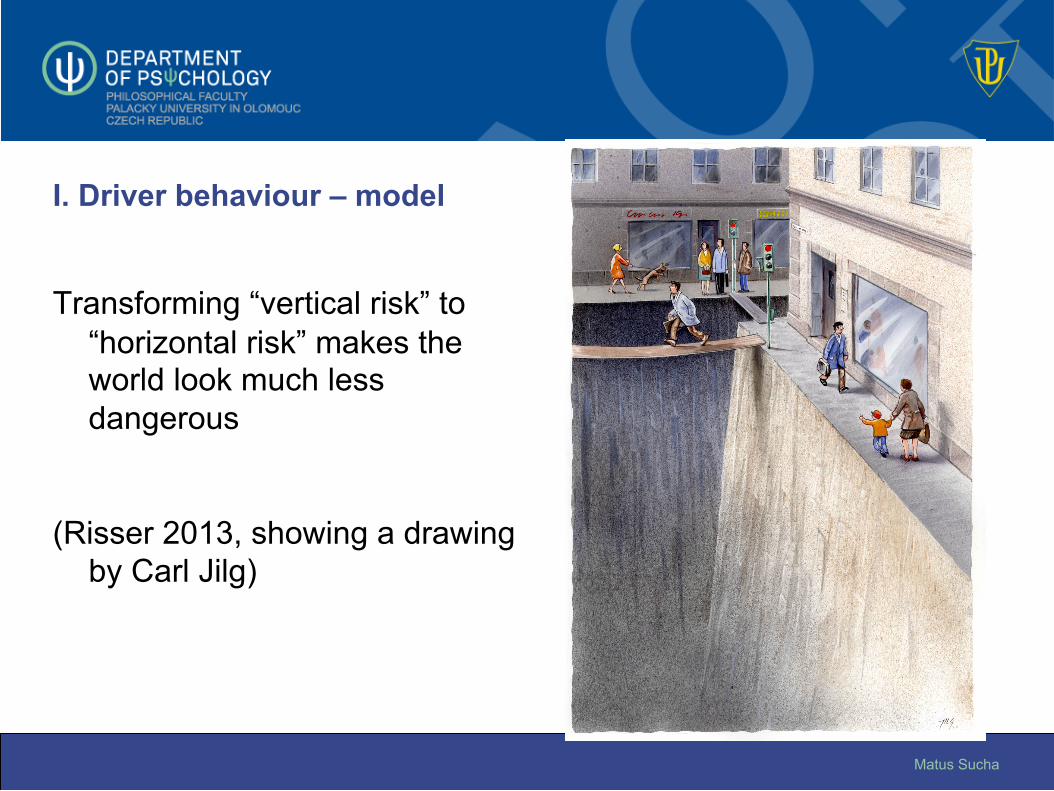
I. Driver behaviour – model
Transforming “vertical risk” to “horizontal risk” makes the world look much less dangerous
(Risser 2013, showing a drawing by Carl Jilg)
Matus Sucha
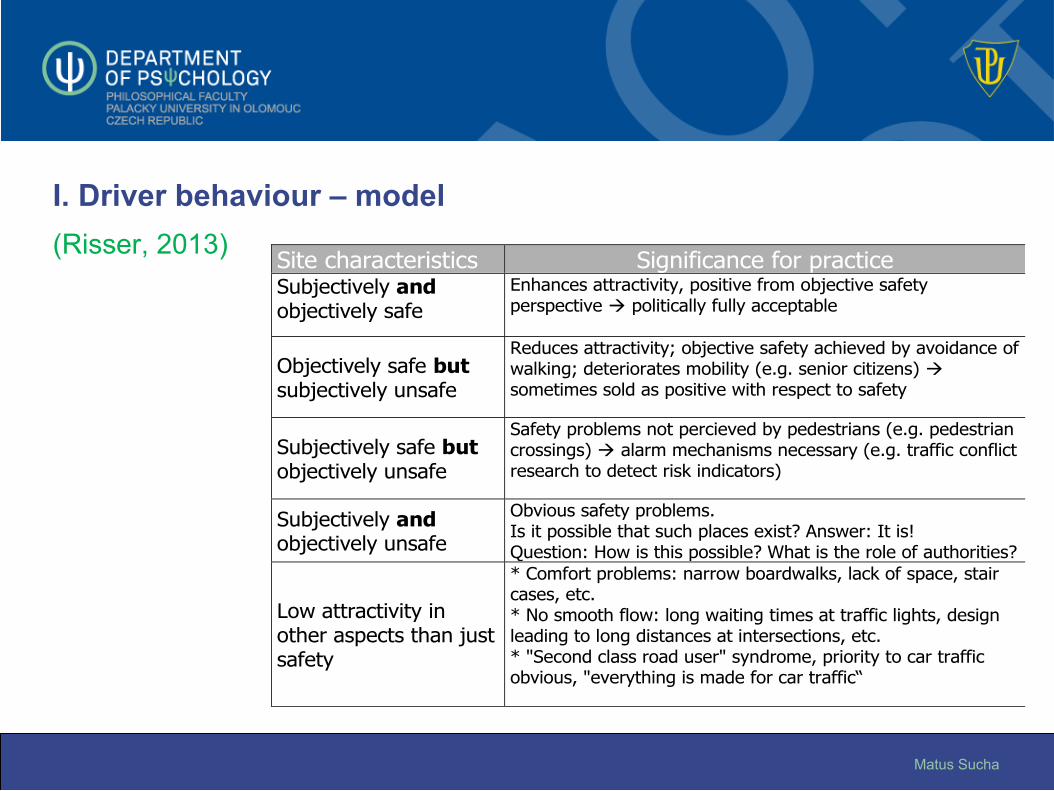
I. Driver behaviour – model (Risser, 2013)
Site characteristics Significance for practiceSubjectively andobjectively safe
Enhances attractivity, positive from objective safetyperspective à politically fully acceptable
Objectively safe butsubjectively unsafe
Reduces attractivity; objective safety achieved by avoidance ofwalking; deteriorates mobility (e.g. senior citizens) àsometimes sold as positive with respect to safety
Subjectively safe butobjectively unsafe
Safety problems not percieved by pedestrians (e.g. pedestriancrossings) à alarm mechanisms necessary (e.g. traffic conflictresearch to detect risk indicators)
Subjectively andobjectively unsafe
Obvious safety problems.Is it possible that such places exist? Answer: It is!Question: How is this possible? What is the role of authorities?
Low attractivity inother aspects than justsafety
* Comfort problems: narrow boardwalks, lack of space, staircases, etc.* No smooth flow: long waiting times at traffic lights, designleading to long distances at intersections, etc.* "Second class road user" syndrome, priority to car trafficobvious, "everything is made for car traffic“

Matus Sucha
I. Driver behaviour – model We can think of risk in two different ways: Risk analysis – reason, logic, and careful considerations about the
consequences of choices (Statistically, flying is much safer than driving) Risk as feelings – something like survival instinct We rely more on feelings when we have less time to make a decision. e.g. in collisions between a car and a deer, the greatest risk to the driver
comes in trying to avoid hitting the animal. (Don’t veer when you see a deer!)
Matus Sucha
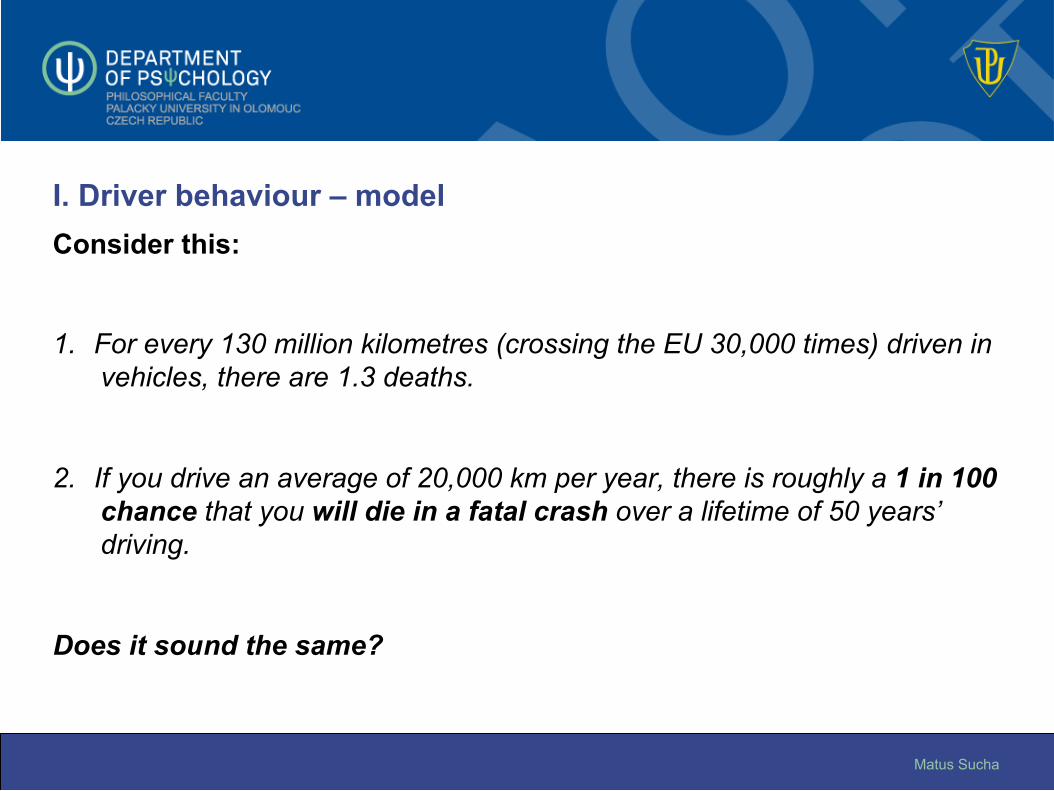
I. Driver behaviour – model Consider this: 1. For every 130 million kilometres (crossing the EU 30,000 times) driven in
vehicles, there are 1.3 deaths.
2. If you drive an average of 20,000 km per year, there is roughly a 1 in 100 chance that you will die in a fatal crash over a lifetime of 50 years’ driving.
Does it sound the same?
Matus Sucha
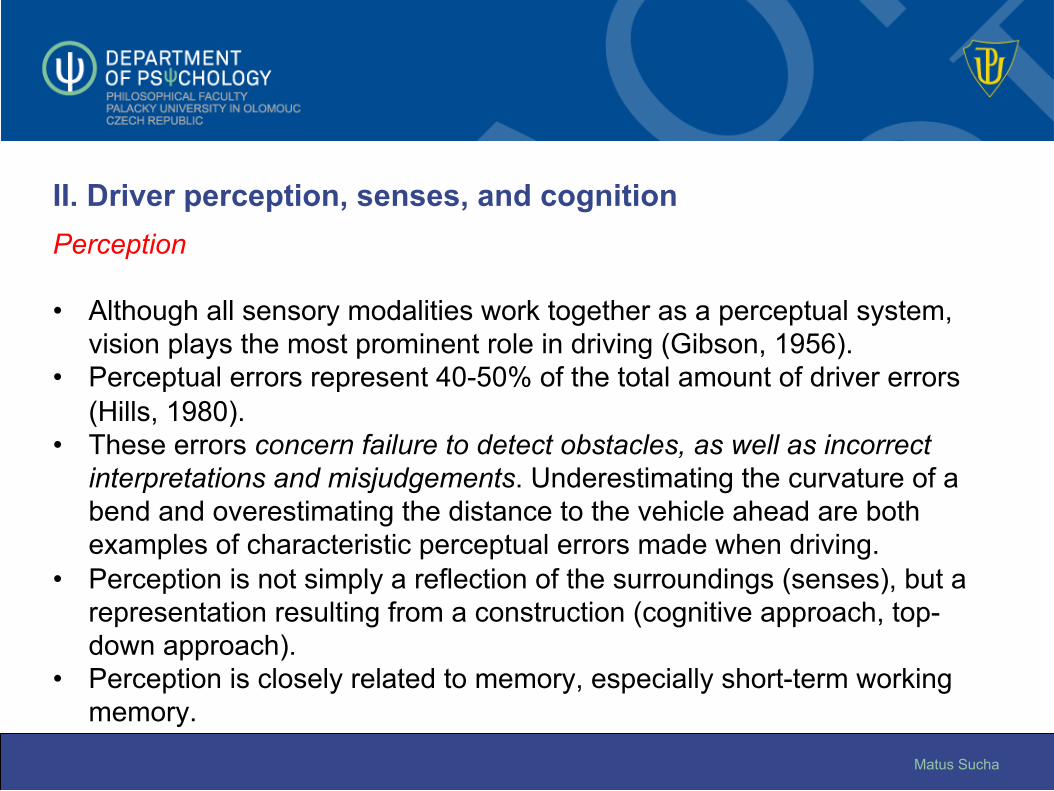
II. Driver perception, senses, and cognition Perception • Although all sensory modalities work together as a perceptual system,
vision plays the most prominent role in driving (Gibson, 1956). • Perceptual errors represent 40-50% of the total amount of driver errors
(Hills, 1980). • These errors concern failure to detect obstacles, as well as incorrect
interpretations and misjudgements. Underestimating the curvature of a bend and overestimating the distance to the vehicle ahead are both examples of characteristic perceptual errors made when driving.
• Perception is not simply a reflection of the surroundings (senses), but a representation resulting from a construction (cognitive approach, top-down approach).
• Perception is closely related to memory, especially short-term working memory.
Matus Sucha
II. Driver perception, senses, and cognition Perception Spatio-temporal perception 1. Perception of ego-speed – estimations from visual, auditory, and
vestibular sensors, peripheral visual field), adaptation effect.
2. Perception of distance – depth cues (e.g. fog), binocular vision
3. Perception of time-to-contact (systematic underestimation of 20-30%, probably a kind of “safety margin”), higher speed = higher estimates = overestimation of the time available. Safety margins are reduced in impoverished environments.
Matus Sucha
II. Driver perception, senses, and cognition Selective attention and perceptual learning 1. The recognition of only the most relevant objects from the excessively
high amount of information available is essential, as the driver has a relatively limited capacity of input and information processing. Distinguishing between redundancy and information and subsequently choosing the most important input at any given time is a somewhat difficult task which involves divided attention, as revealed in the way the driver’s eye behaves.
2. Eye movement behaviour (e.g. foveal field, peripheral capacity) 3. Traffic-relevant information in curves (control and guidance information) 4. Novice drivers are more occupied with control tasks, while experienced
drivers pay more attention to guidance information. This is called perceptual learning.

Matus Sucha
II. Driver perception, senses, and cognition (Strayer, 2011)
Matus Sucha
III. Performance-related capabilities and willingness to take risks Definition of a good driver
Follow the rules, stay awake, and try not
to hit anybody.
Matus Sucha
III. Performance-related capabilities and willingness to take risks Driver skills and behaviour • Although 95% of road traffic accidents are co-caused by the human factor, it
is still impossible to determine the correlations and significance of individual human attributes, behavioural patterns, and qualities which are responsible for the accidents, because of the immense number of relevant and intervening effects (Sommer, 2008; Risser, 1997).
• The relationship between the road traffic accident rate and the driver's personality has not been sufficiently explained and there are authors who put the majority of psychological qualities and road accident rate in doubt (e.g. Burns and Wilde, 1995).
• Research has emphasised personality factors as contributors to risky driving and accident causation. Despite the large body of studies, the findings have been either conflicting or of little importance (Ranney, 1994).
Matus Sucha
III. Performance-related capabilities and willingness to take risks Driver skills and behaviour The relationship between skills, behaviour, and accident involvement is complex,
and it is a challenge for psychology to provide a better understanding of how human factors and psychological mechanisms are related to this (Elander et al., 1993).
However, this does not imply a lack of capabilities of driver skills, personality,
and abilities to predict accidents. Conflicting results can arise from theoretical or methodological shortcomings (Lajunen & Summala, 1997).
Matus Sucha
III. Performance-related capabilities and willingness to take risks Driver skills and behaviour Personality variables such as impulsiveness, sensation seeking, and risk taking have been related to risk-related driving behaviours (Arnett et al., 1997, Donovan et al., 1985, Mayer & Treat, 1987, McMillen et al., 1992 and Underwood et al., 1999). Type A personality patterns and a macho personality have been related to differences in aggressive driving behaviours (Krahe & Fenske, 2002 and Miles & Johnson, 2003). Amongst the personality factors which have been found to be significantly associated with risky driving are locus of control, driver anger, sensation seeking, and normlessness (Burns & Wilde, 1995, Deffenbacher et al., 1994 and Montag & Comrey, 1987).
Matus Sucha
III. Performance-related capabilities and willingness to take risks Driver skills and behaviour • The results of a study showed Driving Internality (DI) to be negatively
related and Driving Externality (DE) to be positively related to involvement in fatal accidents (Montag & Comrey, 1987). Results indicate that high DE respondents not only tend to believe in external causation, but also exhibit low conformity, low emotional stability, lower energy levels, a lack of compulsion, and egocentrism (Montag, 1992). Respondents scoring high on DI tend to be emotionally stable, conformist, compulsive, active, and empathetic.
• Zuckerman's (1979) Sensation-Seeking Scale (SSS) is a personality trait of thrill-seeking behaviour. Drunk driving behaviour among adolescents has been related to sensation seeking as well as egocentrism (Arnett, 1989). This measure has been found to correlate with many types of risk-taking behaviour, such as driving speed and self-reported traffic violations (Jonah & Clement, 1984).
Matus Sucha
III. Performance-related capabilities and willingness to take risks Driver skills and behaviour • Another personality variable examined in relationship to risky driving is
normlessness. Human behaviour is largely constrained by rules that govern particular situations and social interaction. Some of these rules are laws developed by the authorities; others are social, informal rules implicit within the specific situation. However, people don't always adhere to rules, and this reduces the safety margins that rules provide and often increases the likelihood of accidents.
• Kohn and Schooler (1983) operationalised normlessness on a continuum ranging from the individual's belief that it is “acceptable to do whatever (one) can get away with” to “holding responsible moral standards”.
Matus Sucha
III. Performance-related capabilities and willingness to take risks Driver skills and behaviour Driver anger has been related to traffic violations and accidents
(Deffenbacher, Huff, Lynch, Oetting, & Salvatore, 2000). Anger while driving may interfere with attention, perception, information processing, and motor performance and may increase the likelihood of an accident directly or indirectly through the increased probability of other risk behaviours.
Costa and McCrae (1992) reported that anxiety was significantly related to
negative affect. The driver’s level of negative effect might influence his or her interpretation of the traffic environment and driving behaviour.
Chliaoutakis et al. (2002) reported that driver irritability was a factor that was
relevant to aggressive driving. Irritability was found to be a predictor of a driver’s involvement in car crashes.
Matus Sucha
III. Performance-related capabilities and willingness to take risks Driver skills and behaviour Garrity and Demick (2001) investigated the relationship between the five-
factor personality traits and driving behaviour. They found no significant correlations.
Each of the five traits, neuroticism, extroversion, openness to experience, agreeableness ,and conscientiousness, comprises six more specific traits, or facets. These facets make it possible to identify meaningful individual differences within each trait. Such effects can easily be overlooked if only the main traits are examined (Costa & McCrae, 1992).
Garrity and Demick (2001) reported a significant relationship between the mood state tension-anxiety, which is strongly related to neuroticism, and negative driving behaviour.
Matus Sucha
III. Performance-related capabilities and willingness to take risks Self-reported violations (in DBQ), defined as the deliberate infringement of
some regulated or socially accepted code of behaviour, have been shown to predict accident rates (Parker et al., 1995b and West et al., 1993).
Manstead, Parker, Stradling, Reason, & Baxter (1992) found that speeding
was perceived as the most prevalent of driving violations. Research reports associations between major deviations (both slower and faster) from the average traffic speed and an increase in the risk of a crash (Parker, Manstead, Stradling, Reason, & Baxter, 1992).
Considering these results, it is expected that drivers who have a high score
on self-reported risky driving will be involved in traffic accidents more frequently than other respondents.
Matus Sucha
III. Performance-related capabilities and willingness to take risks The importance of behaviour in the prevention of vehicular accidents has
been documented extensively (e.g. Elander et al., 1993 and Parker et al., 1995a) and has led to many attempts to encourage a variety of safe driving behaviours (e.g. Juhnke et al., 1995 and Martinez et al., 1996).
The emphasis has shifted from performance-related capabilities to
willingness to take risks. Evidence indicates risk-taking as a major factor underlying a high risk of
collision (Jonah, 1986). Unsafe drivers are not necessarily those with low skills. Skilled drivers
who engage in risky activities such as speeding might be even more dangerous.
Matus Sucha
III. Performance-related capabilities and willingness to take risks Why our eyes and minds betray us on the road • Human speed according to evolution – max 30 km/h – our senses are not
adjusted to speeds higher than 15-30 km/h • The gap between subjective safety and objective safety • Information overload leads to errors; a low workload leads to highway
hypnosis • Cars and the environment are constructed in a way which gives us a false
feeling of safety • Why we are not as good drivers as we think we are – most drivers think
they are better drivers than the average • Lack of feedback – drivers lack feedback. A lack of negative feedback
leads drivers to a false feeling that they don’t make mistakes.
Matus Sucha
IV. Emotions and attitudes The subjective experimental component of emotional reaction is strongly
related to the achievement of higher-order cognitive activities, such as memory and thinking (Cano-Videl, 1989).
Emotional experiences are classified according to 3 basic bipolar
dimensions: A. hedonic tone (pleasure-displeasure) B. perceived intensity (high-low) C. degree of control perceived (high-low) Emotional states that are located at the extremes of any of these dimensions will be dangerous for driving.
Matus Sucha
IV. Emotions and attitudes Extremes of these dimensions while driving can lead to loss (or partial loss)
of control over the cognitive system and behaviour. Specifically, these consequences include negative changes in risk
perception, attitudes towards traffic violations, risky decision making, and reckless driving which translate into behaviours such as not maintaining safe headway, competing with other road users, making quick and unjustified changes in speed, accelerating when another driver attempts to overtake, etc. (Banuls & Montoro, 2001).
Individual differences facilitate this process significantly. Key variables are: beliefs and values, attribution style, level of subjective risk, problem-solving skills, social skills, personality variables – for example expression of anger.
The driver’s previous state (organism, experience with the situation, predisposition, will, thoughts, training) can also greatly modulate the emotional reaction.
Matus Sucha
IV. Emotions and attitudes Emotions which are connected with risky driving to the greatest extent
(Banuls & Montoro, 2001): 1. Anxiety 2. Stress 3. Aggressive mood 4. Hostility Emotional reactions and the driver’s behaviour are closely related to the driver’s attitudes. Attitudes are defined as “tendencies to evaluate an entity (e.g. cyclists, other drivers, road environment..) with some degree of favor or disfavor, ordinarily expressed in cognitive, affective and behavioral responses” (Eagly & Chaiken, 1993). In traffic psychology the most important models dealing with attitudes are: the theory of reasoned action (Fishbein & Ajzen, 1975); the model of attitude-behaviour relations (Triandis, 1980); the health belief model (Janz & Becker, 1984);the theory of action (Huguenin, 1988), and the theory of planned behaviour (Ajzen, 1988).
Matus Sucha
V. Drivers’ individual differences and risky groups
It is well known that personal characteristics such as a driver’s experience and skill (Lim & Dewar, 1989), sex (Briem & Hedman, 1995), and personality (Evans, 1991) can affect driving performance, including driving safety.
In fact, young healthy people are more likely to be involved in accidents than others. Gender has consistently been reported to relate to risk behaviour, i.e. males are more willing to take risks than females. It has been argued that the evolutionary process has made it necessary for males to take risks and that this tendency is therefore an adaptation (Buss, 2004).
Matus Sucha
V. Drivers’ individual differences and risky groups Yagil (1998) reported that male drivers express a lower motivation to comply
with traffic rules, particularly the younger individuals. She also found that males perceived traffic violations as less dangerous than females did.
The profile of a high-risk driver established by TIRF (1997) reveals some
prominent characteristics: young, male, employed, low to moderate income, other safety-compromising behaviours, thrill-seeking, aggressive, and a record of previous traffic violations and crashes.
It appears there are three high-risk groups: 1. young drivers (< 25-year-olds) 2. hardcore drinking drivers 3. drivers with previous violations and crashes

Matus Sucha
V. Drivers’ individual differences and risky groups The 18-24-year-old group represents one in eight drivers but is involved in
one in every four casualty crashes. Their crash involvement risk is consistent with their traffic violation record: a similar proportion of 25% of the total.
The hardcore drinking driver group is formed of high BAC (.15) or repeat offenders who represent roughly 2/3 of fatal or serious crash-involved drivers who have been drinking. The main characteristic of the hardcore drinking driver is a common diagnosis of alcohol abuse or dependence.
Previous violations and/or crashes can be used to identify the high-risk driver. As the number of previous events (violations or collisions) increases, the likelihood of future involvement in a fatal crash also increases. Within a two-year period, one event is associated with a 1.5 risk factor and two events with a 2.5 risk factor, while three events represent a 4.5 risk factor of being involved in a fatal crash (Vézina, 2001).
Matus Sucha
V. Drivers’ individual differences and risky groups
Matus Sucha
VI. Risky behaviour A high-risk driving behaviour is any behaviour linked with a significantly higher likelihood of being involved in a crash. High-risk driving behaviours are numerous and often interrelated. However, it appears that four driving behaviours are universally depicted as major risks:
1. speeding 2. driving under the influence of alcohol and drugs 3. non-use of a safety belt and child restraint 4. running red lights or stop signs
Others which are frequently reported are: 1. the driver’s distraction and inattention 2. driver fatigue 3. aggressive driving 4. the driver’s stress, anxiety, and anger 5. work-related road risk
Matus Sucha
VI. Risky behaviour Overlap between high-risk driving behaviours • There is an increasing body of literature showing that there is a considerable overlap
between high-risk driving behaviours. • The "driving after drinking-non-use of seat belt" link is well established. For instance,
roadside surveys have shown that seat belt non-users were twice as likely to have been legally impaired. Indeed, the profile of fatally injured drivers who did not use their seat belt is – to a large extent – similar to that of those who died after drinking: weekend, nighttime, male, etc. Other overlaps have been observed between speeding and running red lights, running red lights and non-use of a seat belt, etc.
• The exact magnitude of high-risk behaviours overlapping is not known. It cannot be assumed that they are committed by the very same individuals, but overlapping appears to be clearly prevalent.
Matus Sucha
VI. Risky behaviour 1. Speeding – speed is a central issue in road safety
Related to road safety, speed affects (i) the risk of being involved in an accident, (ii) the severity of an accident.
In general: the higher the speed, the higher the risk of an accident and the more severe the consequences of the accident.
In fact, speed is involved in all accidents: no speed, no accidents. Speed has been found to be a major contributory factor in around 10% of all accidents and in around 30% of fatal accidents.
Both excess speed (exceeding the posted speed limit) and inappropriate speed (faster than the prevailing conditions allow) are important accident causation factors. In addition, speed generally has a negative effect on the environment, but a positive effect on travel time.
The negative effects are mainly a societal problem and are hardly noticed by individual drivers; individual drivers, on the other hand, particularly notice the positive effects.
Matus Sucha
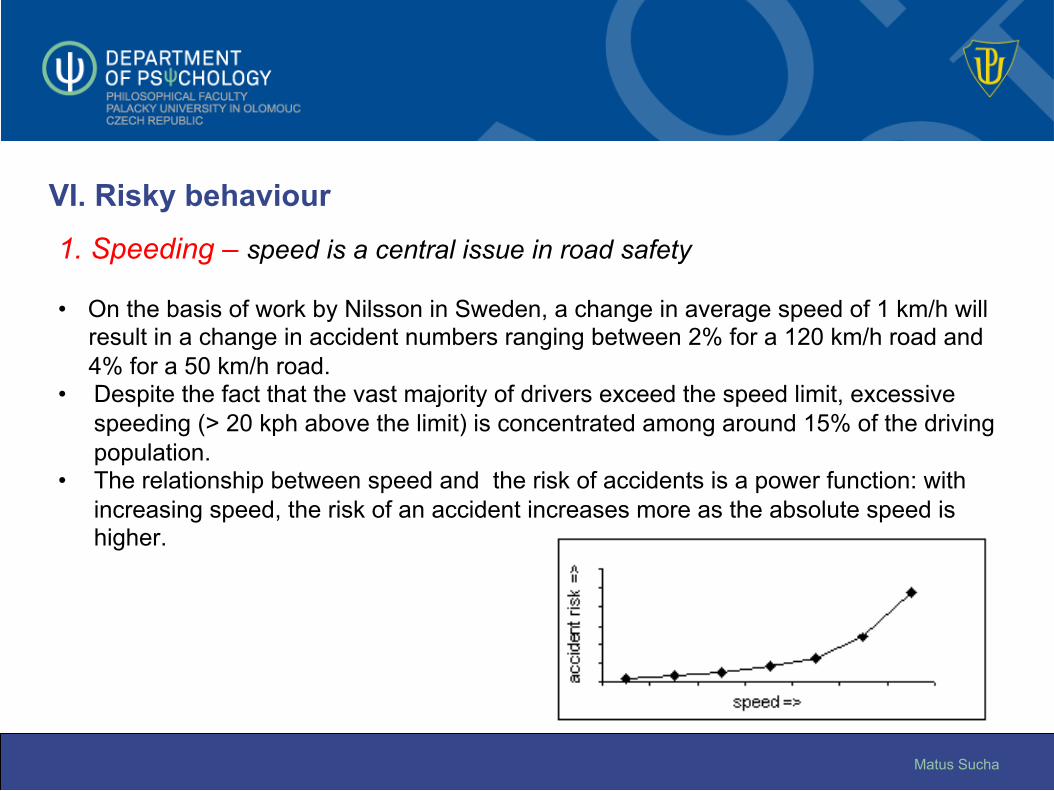
VI. Risky behaviour 1. Speeding – speed is a central issue in road safety • On the basis of work by Nilsson in Sweden, a change in average speed of 1 km/h will
result in a change in accident numbers ranging between 2% for a 120 km/h road and 4% for a 50 km/h road.
• Despite the fact that the vast majority of drivers exceed the speed limit, excessive speeding (> 20 kph above the limit) is concentrated among around 15% of the driving population.
• The relationship between speed and the risk of accidents is a power function: with increasing speed, the risk of an accident increases more as the absolute speed is higher.
Matus Sucha
VI. Risky behaviour 2. Driving under the influence of alcohol and drugs About 25% of all road fatalities in Europe are alcohol-related, whereas only about 1% of all the kilometres driven in Europe are driven by drivers with 0.5 g/l alcohol in their blood or more. As the Blood Alcohol Concentration (BAC) in the driver increases, the crash rate also rises. The increase in the crash rate that goes with increasing BAC is progressive. Compared to a sober driver, the crash rate of a driver with a BAC of 0.8 g/l (still the legal limit in 3 of 25 EU member states) is 2.7 times that of sober drivers. When a driver has a BAC of 1.5 g/l his crash rate is 22 times that of a sober driver. Not only does the crash rate grow rapidly with an increasing BAC, but the crash also becomes more severe. With a BAC of 1.5 g/l the crash rate for fatal crashes is about 200 times that of sober drivers.
Matus Sucha
VI. Risky behaviour 2. Driving under the influence of alcohol and drugs On any given night, it is estimated that one driver out of ten has been drinking and between 2% and 3% are over the legal limit. More recent research has drawn the attention of governmental bodies to higher BACs; roughly 2/3 of the drivers who have been drinking and are involved in a fatal or serious crash have a BAC of 160 mg% or more (.16). It is estimated that a driver who is caught driving under the influence of alcohol has engaged in drink-driving at least 200 times before.
Matus Sucha
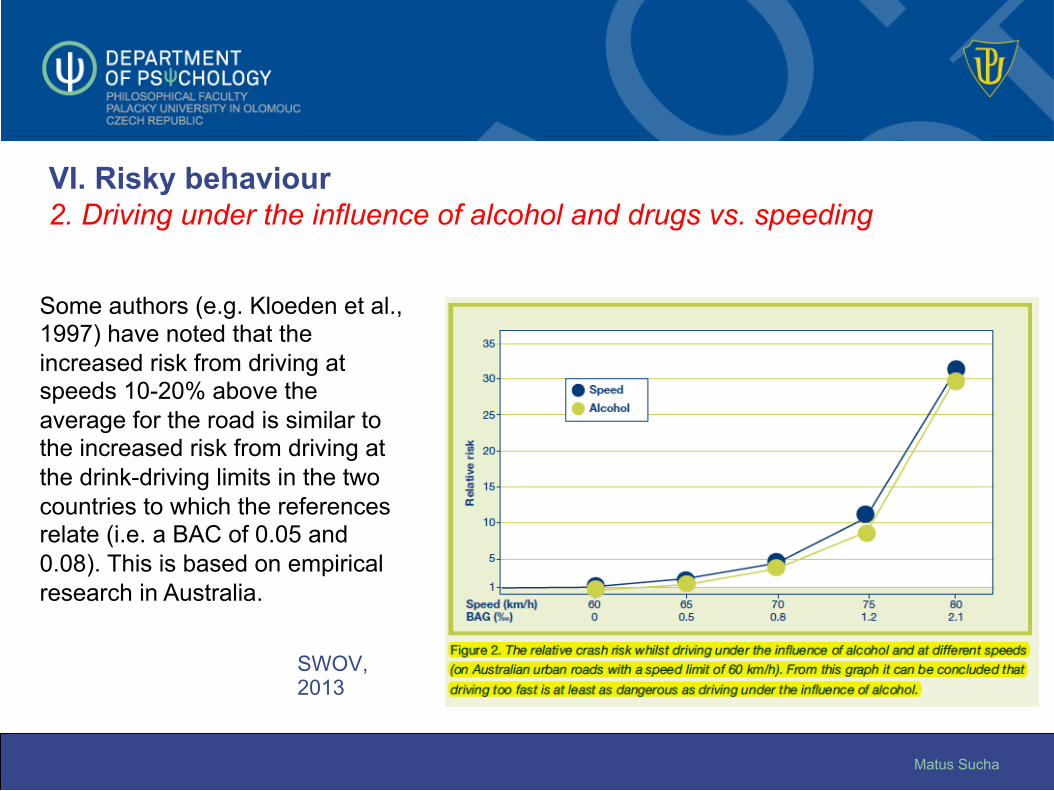
SWOV, 2013
Some authors (e.g. Kloeden et al., 1997) have noted that the increased risk from driving at speeds 10-20% above the average for the road is similar to the increased risk from driving at the drink-driving limits in the two countries to which the references relate (i.e. a BAC of 0.05 and 0.08). This is based on empirical research in Australia.
VI. Risky behaviour 2. Driving under the influence of alcohol and drugs vs. speeding
Matus Sucha
VI. Risky behaviour 2. Driving under the influence of alcohol and drugs • Alcohol is associated with 40% of fatalities and 20% of serious injuries that
occur on the road. Around 25% of drivers have admitted to driving after drinking, at least occasionally (TIRF, 1997).
• On any given night, it is estimated that one driver out of ten has been drinking and between 2% and 3% are over the legal limit. More recent research has drawn the attention of governmental bodies to a higher BAC; roughly 2/3 of drivers who have been drinking and are involved in a fatal or serious crash have a BAC of 160 mg% or more (.16).
Matus Sucha
VI. Risky behaviour 3. Non-use of safety belts and child restraint Approximately 90% of the driving population wears a seat belt. However, this 10% of non-use is associated with an astonishing 40% of fatalities (Gutoskie, 1999). Although non-use of seat belts does not increase the crash risk per se, there is abundant evidence that this behaviour is related to other risky behaviours. Combined with the effectiveness of seat belts in preventing fatalities in the event of a crash, this fact explains the substantial over-representation of non-users of seat belts among fatally injured drivers (Canadian Council of Motor Transport Administrators, 2001).
Matus Sucha
VI. Risky behaviour 4. Running red lights or stop signs According to a recent survey of jurisdictions, around 7% of fatalities and 8% of serious injuries take place at controlled intersections. Although it varies a lot by intersections, the prevalence of running red lights or stop signs is estimated to be around 1%, which – given the large volume of traffic – represents a substantial problem. Additionally, red light and stop sign violations represent approximately 18% of all traffic violations reported by the police (Canadian Council of Motor Transport Administrators, 2001).
Matus Sucha
VI. Risky behaviour 5. Driver’s distraction and inattention Driver Inattention means insufficient or no attention to activities that are critical for safe driving, and that Driver Diverted Attention (which is synonymous with “driver distraction”) is just one form of driver inattention. The other forms of driver inattention are labelled tentatively as Driver Restricted Attention, Driver Misprioritised Attention, Driver Neglected Attention, and Driver Cursory Attention (Regan et al., 2011). There is increasing evidence that driver distraction and driver inattention are major contributory factors in car and truck crashes and incidents (e.g. Klauer et al., 2006 and Olson et al., 2009), and it is likely that the problem will increase as more technologies find their way into vehicles. Evidence suggests that driver distraction and inattention are even more dangerous as contributing factors in crashes than drug and alcohol intoxication.
Matus Sucha
VI. Risky behaviour 6. Driver fatigue • Survey research worldwide suggests that over half of all private drivers drive while fatigued or
drowsy at least once a year. • Fatigue is a major factor in a large proportion of road crashes (range 10-20%). Several studies
suggest that fatigue is associated with an increased crash risk (ERSO, 2013). • A person who drives after being awake for 17 hours has a risk of crashing equivalent to being at
the 0.05 blood alcohol level (i.e. twice the normal risk) (ERSO, 2013). • Amongst young drivers, driving while fatigued is quite common because of lifestyle factors.
Adolescents need more sleep than adults; fatigue may affect youngsters more than adults. • Most professional drivers and shift workers have to cope with fatigued driving on a frequent basis
as a result of work-related factors. • About half of professional drivers take less than the normal sleep time before a long-distance trip. • The concepts of “fatigue”, “sleepiness”, and “drowsiness” are often used interchangeably. The
most general factors that cause fatigue are lack of sleep, bad-quality sleep, and sleep demands induced by the internal body clock.
• Besides these general factors, prolonged driving (time-on-task) can increase driver fatigue, especially when drivers do not take sufficient breaks.

Matus Sucha
VI. Risky behaviour 6. Driver fatigue (ERSO, 2013) • Survey research world-wide suggests that over half of all private drivers drive while being
fatigued or drowsy at least once a year. • Fatigue is a major factor in a large proportion of road crashes (range 10-20%). Several studies
suggest that fa(ERSO, 2013). • tigue is associated with increased crash risk. • A person who drives after being awake for 17 hours has a risk of crashing equivalent to being at
the 0.05 blood alcohol level (i.e. twice the normal risk). • Amongst young drivers, driving while fatigued is quite common due to lifestyle factors.
Adolescents need more sleep than adults; fatigue may affect youngsters more than adults. • Most professional drivers and shift workers have to cope with fatigued driving on a frequent basis
due to work-related factors. • About half of professional drivers take less than normal sleep time before a long-distance trip. • The concepts of “fatigue”, “sleepiness” and “drowsiness” are often used interchangeably. The
most general factors that cause fatigue are lack of sleep, bad quality sleep and sleep demands induced by the internal body clock.
• Besides these general factors, prolonged driving (time-on-task) can increase driver fatigue, especially when drivers do not take sufficient breaks.
Matus Sucha
VI. Risky behaviour 7. Aggressive driving The U.S. National Highway Traffic Safety Administration (NHTSA, 2013) defines aggressive driving as a progression of unlawful driving actions such as: 1. speeding – exceeding the posted limit or driving too fast for
conditions 2. excessive lane changing – changing lanes without reasonable cause 3. improper passing – failing to signal intent, using an emergency lane
to pass, passing on the shoulder, or cutting into another car's path 4. tailgating – driving near the back of another car at too close a range
Matus Sucha
VI. Risky behaviour 8. Driver’s stress, anxiety, and anger Whereas emotions such as anxiety, depression, and stress are widely acknowledged as having a detrimental effect on cognitive performance, the cognitive and behavioural effects of driving anger have received relatively little attention (Matthews & Desmond, 1995; Gulian et al., 1989). Deffenbacher et al. (1994) postulate that anger experienced while driving might affect safety in various ways. Referring to the large body of literature devoted to the emotion-cognitive performance relationship, Deffenbacher et al. postulate that anger: “might influence motivation to commit various risky driving behaviours that in turn may increase accident liability during the emotional episode”. For instance, anger experienced while driving might predispose an individual to engage in dangerous driving behaviours such as tailgating, speeding, or flashing their lights.
Matus Sucha
VI. Risky behaviour 9. Work-related road risk • Work-related motor vehicle road crashes occur in the workplace
and in driving associated with work (excluding commuting). Most work-related crashes involve company cars.
• In the United States, Australia, and the European Union, work-related crashes contribute about one quarter to over one third of all work-related deaths.
• Improving work-related road safety and fleet management would much improve road safety as a whole.
Matus Sucha
VII. Eco-driving Evidence to date indicates that eco-driving can reduce fuel consumption by 10%, on average and over time, thereby reducing CO2 emissions from driving by an equivalent percentage. The characteristics of eco-driving are generally well defined and easily characterised: • accelerating moderately • anticipating traffic flow and signals (thereby avoiding sudden starts and stops) and
maintaining an even driving pace (using cruise control on the highway where appropriate)
• driving at or safely below the speed limit • eliminating excessive idling • automobile maintenance measures (maintaining optimum tyre pressure, the regular
changing of air filters) The advantages of eco-driving, of course, go beyond CO2 reductions. They include reducing the cost to the individual of driving and producing tangible and well-known safety benefits (with fewer accidents and traffic fatalities).
Matus Sucha
VII. Eco driving Eco-driving should be distinguished from hypermiling. While they can share the same goal of reducing the operating costs of the vehicle, they differ in terms of tactics.
Hypermiling (Chapnick, 2007) often involves coasting down hills (turning the ignition off) and drafting by getting as close to the vehicle in front of you as possible. Clearly hypermiling trades off safety for fuel economy, while with eco-driving there is no tradeoff. Eco-driving is a win-win proposition for both individuals (through cost savings and greater personal safety) and society (through reduced CO2 emissions, reduced petroleum imports, reduced emissions of conventional pollutants, and fewer fatalities). Nevertheless, there are still cultural, technical, and educational barriers inhibiting its adoption. Cars are more than simply a means of transportation to many, and are sometimes prized for capabilities that run counter to prudent eco-driving principles. Horsepower and acceleration are key examples. Considerable advertising to consumers is still predicated on acceleration and horsepower.
Matus Sucha
VII. Eco-driving Changing behaviour and engaging the public is a key task for the upcoming years. For this purpose the following can be used:
1. public education policy (education and information campaigns)
2. feedback for users (immediate positive feedback – focused on fuel consumption, in-
vehicle devices, e.g. Toyota Prius)
3. regulatory steps (e.g. mandatory lessons in driving schools, prohibition of idling..)
4. economic policy and incentives (financial incentives to attend an eco-driving course,
to buy a hybrid car..)
5. social marketing (peers, community, social norms)

Matus Sucha
Thank you for listening!